Full Terms & Conditions of access and use can be found at https://www.tandfonline.com/action/journalInformation?journalCode=tjfe20 Journal of Freshwater Ecology ISSN: (Print) (Online) Journal homepage: https://www.tandfonline.com/loi/tjfe20 The use of fatty acids to identify food sources of secondary consumers in wetland mesocosms Ivor Growns, Darren Ryder, Paul McInerney, Nick Bond, Galen Holt, Rebecca Lester & Ross Thompson To cite this article: Ivor Growns, Darren Ryder, Paul McInerney, Nick Bond, Galen Holt, Rebecca Lester & Ross Thompson (2020) The use of fatty acids to identify food sources of secondary consumers in wetland mesocosms, Journal of Freshwater Ecology, 35:1, 173-189, DOI: 10.1080/02705060.2020.1761463 To link to this article: https://doi.org/10.1080/02705060.2020.1761463 © 2020 The Author(s). Published by Informa UK Limited, trading as Taylor & Francis Group. View supplementary material Published online: 21 May 2020. Submit your article to this journal Article views: 712 View related articles View Crossmark data Citing articles: 1 View citing articles

Welcome message from author
This document is posted to help you gain knowledge. Please leave a comment to let me know what you think about it! Share it to your friends and learn new things together.
Transcript
Full Terms & Conditions of access and use can be found athttps://www.tandfonline.com/action/journalInformation?journalCode=tjfe20
Journal of Freshwater Ecology
ISSN: (Print) (Online) Journal homepage: https://www.tandfonline.com/loi/tjfe20
The use of fatty acids to identify food sources ofsecondary consumers in wetland mesocosms
Ivor Growns, Darren Ryder, Paul McInerney, Nick Bond, Galen Holt, RebeccaLester & Ross Thompson
To cite this article: Ivor Growns, Darren Ryder, Paul McInerney, Nick Bond, Galen Holt,Rebecca Lester & Ross Thompson (2020) The use of fatty acids to identify food sources ofsecondary consumers in wetland mesocosms, Journal of Freshwater Ecology, 35:1, 173-189, DOI:10.1080/02705060.2020.1761463
To link to this article: https://doi.org/10.1080/02705060.2020.1761463
© 2020 The Author(s). Published by InformaUK Limited, trading as Taylor & FrancisGroup.
View supplementary material
Published online: 21 May 2020. Submit your article to this journal
Article views: 712 View related articles
View Crossmark data Citing articles: 1 View citing articles
The use of fatty acids to identify food sources ofsecondary consumers in wetland mesocosms
Ivor Grownsa, Darren Rydera, Paul McInerneyb, Nick Bondb, Galen Holtc,Rebecca Lesterc and Ross Thompsond
aSchool of Environmental and Rural Science, University of New England, Armidale, NSW, Australia;bCentre for Freshwater Ecosystems, La Trobe University, Wodonga, VIC, Australia; cCentre forRegional & Rural Futures, Deakin University, Geelong, VIC, Australia; dInstitute of Applied Ecology,University of Canberra, Canberra, ACT, Australia
ABSTRACTIncreasing demand for freshwater during the last century has soseverely degraded many wetland ecosystems that they are some ofthe most seriously impacted environments in the world.Environmental flows are used as a management tool to restore partsof the hydrological regime altered by human water use, to rehabili-tate these wetlands. Research and monitoring to date has focused onunderstanding ‘flow-ecology’ relationships, without investigating themechanisms underlying them. We sought to understand how differ-ent basal food sources are incorporated into fish tissue in temporarywetland systems. This study provides a necessary first step towardthe development of mechanistic research that investigates the effectsof variation in fatty acids (FA) within the food and prey base on toppredators. We added different sources of fatty acids to wetlandmeso-cosms by adding extra food sources including redgum leachate toincrease planktonic bacteria populations, cyanobacteria, green algaeand biofilm matrix to observe how they were incorporated into sec-ondary consumers. Wetland soil and water was added to replicatemesocosms, left for 28days to produce zooplankton and thenWestern carp gudgeons added. There was a clear shift in the inverte-brate assemblage structure following the introduction of the gudg-eons. There was also a clear difference in assemblage structure andnutritional value between benthic and planktonic invertebrates.However, the addition of extra food sources did not generate differ-ing FA profiles between treatments in the substratum fractions, inver-tebrates or fish after 14days. We suggest that food sources generatedwithin the mesocosms themselves may have outweighed any treat-ment effects. Using flooded wetland mesocosms potentially wouldhave provided more realistic knowledge of the food web mecha-nisms of wetland inundation rather than feeding zooplankton fedspecific primary food sources to fish. However, future experimentsattempting to identify the mechanisms of the transfer of basal foodsources in wetlands to secondary consumers may wish to directlyfeed fish primary consumers raised on specific basal food sources.
ARTICLE HISTORYReceived 13 November 2019Accepted 20 April 2020
KEYWORDSHypseleotris; fatty acid;food web; mesocosm;environmental water
CONTACT Ivor Growns [email protected] School of Environmental and Rural Science, University of NewEngland, Armidale, NSW 2350, Australia
Supplemental data for this article is available online at https://doi.org/10.1080/02705060.2020.1761463.
� 2020 The Author(s). Published by Informa UK Limited, trading as Taylor & Francis Group.This is an Open Access article distributed under the terms of the Creative Commons Attribution License (http://creativecommons.org/licenses/by/4.0/), which permits unrestricted use, distribution, and reproduction in any medium, provided the original work is properly cited.
JOURNAL OF FRESHWATER ECOLOGY2020, VOL. 35, NO. 1, 173–189https://doi.org/10.1080/02705060.2020.1761463
Introduction
Increasing demand for freshwater during the last century has severely affected wetlandecosystems to the point that they represent some of the most seriously degraded envi-ronments in the world (Lemly et al. 2000; Vorosmarty et al. 2010; Davidson et al. 2018).Most the world’s river systems are now subject to human impacts (Tonkin et al. 2019),requiring increasingly sophisticated approaches to river management (Thompson et al.2019). An important tool which has emerged has been the management of flows torestore, protect or enhance environmental outcomes both in-channel and in associatedfloodplains (Whipple and Viers 2019). While there has been considerable progress inthe science underpinning provision of flows for the environment (hereafter‘environmental flows’) there remain substantive gaps in our understanding (Poff andZimmerman 2010; Davies et al. 2014; Arthington et al. 2018). These include an under-standing of the processes which link flow variability to fluxes of energy to enhance con-dition, fitness and recruitment of higher consumers such as fish and birds (Rollset al. 2017).
Australia, the world’s driest inhabited continent, has experienced profound water stresswhich has had substantive environmental, social and economic impacts. In south-easternAustralia the Murray–Darling Basin (MDB), Australia’s largest food growing region, hasexperienced acute ecological impacts of water resource development (Kingsford 2000;Jenkins et al. 2005; Murray-Darling Basin Authority 2011a). In the MDB, the high level ofwater use has proven to be unsustainable, both in meeting the needs of irrigators for agri-culture and for the ecological health of rivers and wetlands (Kingsford 2000; Arthingtonand Pusey 2003; Murray-Darling Basin Authority 2011b; Docker and Robinson 2014).Increasing the share of environmental water and improving environmental water manage-ment are central elements of current water reform in the MDB (Murray-Darling BasinAuthority 2011b; Docker and Robinson 2014). A monitored program of delivering waterdedicated to the environment to instream channels and wetlands has now been in placefor seven years, providing the basis for internationally significant insights into ecologicalresponses to environmental flows (Horne et al. 2018).
Environmental flows are used as a management tool to restore parts of the hydro-logical regime altered by human water use to rehabilitate the environment(Arthington 2012). These flows aim to restore overall ecosystem health, but fre-quently express targets in terms of population level outcomes in higher-order con-sumers such as iconic fish and bird species (Gawne et al. 2014). Research andmonitoring to date has focused on understanding these ‘flow-ecology’ relationships,without investigating the mechanisms underlying them (Rolls et al. 2017). The pro-duction and transfer of trophic energy within a system is a process fundamental tothe success of higher-order consumers (Lowe et al. 2006). A better understanding ofthe interaction between hydrological flow regimes, trophic dynamics and higher-orderconsumers would allow a more thorough process-based evaluation of environmentalflows (Robson et al. 2017).
A key element of the transfer of energy through food webs is the quality of differentfood resources. Food quality affects the growth, development, and mortality of consumers(Rossi et al. 2006; Malzahn et al. 2007; Masclaux et al. 2012; Paulsen et al. 2014). For ver-tebrate consumers, fatty acids are especially important, as they are required for neural andvisual development (Kainz et al. 2004; Masclaux et al. 2012). The fatty acids 18:3n-3a-linolenic acid (ALA), and 18:2n-6 linoleic acid (LA), cannot be directly produced byheterotrophic organisms and must come from food (Arts et al. 2009). The
174 I. GROWNS ET AL.
polyunsaturated fatty acids (PUFA) 20:5n-3 eicosapentaenoic acid (EPA), 22:6n-3 docosa-hexaenoic acid (DHA), and 20:4n-6 arachidonic acid (ARA) are required by all organismsand play a role in health and cell function (Dalsgaard et al. 2003). Fatty acids are chem-ically varied, are often incorporated unaltered into higher-order consumers, and differentorganisms can have distinct profiles (Arts et al. 2009). Fatty acids may therefore act asboth dietary tracers in the food web and indicators of overall food quality (Iverson et al.2004; Ravinet et al. 2010; Goncalves et al. 2012; Magnone et al. 2015; Guo et al. 2017;Kohlbach et al. 2017).
Feeding trials in which invertebrates and fish were provided with various food sourcesof differing fatty acid composition generally indicate that quality ranges from bacteria(lowest) through cyanobacteria (moderate) to green algae (most nutritious) (Peltomaaet al. 2017). However there have been, to date, no studies of how environmental flowsmay influence resource availability and thus consumer growth and condition. We soughtto understand how different food sources are incorporated into fish tissue in temporarywetland systems. We added different sources of fatty acids to artificial wetland mesocosmsreflecting the inputs likely to occur due to environmental flows. These included; redgum(Eucalyptus camaldulensis) leaf leachate, cyanobacteria, green algae and biofilm matrix(comprising algae, bacteria and fungi). These were used to represent basal resources whichare known to alter during provision of environmental flows (Wolfenden et al. 2018). Redgum is the dominant floodplain tree in the MDB, and leachate additions reflected scen-arios where environmental water inundated leaf litter on in-stream benches or on thefloodplain. Red gum leachate was intended to also increase planktonic bacteria throughthe provision of dissolved organic carbon (DOC). Cyanobacteria (e.g. Williamson et al.2018), phytoplankton, green algae and biofilm availability can be altered both directly,and indirectly via nutrient inputs, during environmental flows (e.g. Sheldon and Walker1997; Ryder et al. 2006).
This study provides a necessary first step toward the development of mechanisticresearch that investigates the effects of variation in FA within the food and prey base ontop predators. Invertebrates and fish were placed in mesocosms treated with the differentbasal resource types. We hypothesised that 1. invertebrates and fish that were fed differentfood sources would attain differing FA profiles and 2. differences in the FAs availablefrom those different food sources would result in differences in somatic growth of inver-tebrates and fish, ultimately resulting in differences in fish sizes and invertebrate commu-nity composition.
Methods
Mesocosm design
Mesocosm experiments were established at the University of New England (UNE) campusat Armidale, NSW. Soil was collected from a dry wetland (to a depth of approximately10mm) on the Gingham watercourse, New South Wales, Australia (29�160S 149�210E) inOctober 2017. Vegetation on the site is classified as water couch marsh grassland (Bowenand Simpson 2010; Southwell et al. 2015). Soil was transported to the UNE campus thenpassed through a 10-mm mechanical sieve for homogenization and to remove roots andvegetation. Fifteen 500-L vats with a basal surface area of 0.78m2 were placed in an open-ended structure covered with white polyethylene which allowed enough ambient light foralgae and vegetation growth. Vats were filled to a depth of 300mm with potable water,allowed to stand for three days to dechlorinate and maintained at that depth for the
JOURNAL OF FRESHWATER ECOLOGY 175

remainder of the experiment. Ten kilograms of wetland soil was added at the end of thethree days resulting in a soil depth of approximately 10mm. The vats were gently aeratedwith diffusers. The vats were allowed to stand for 28 days prior to the introduction of fishin order to produce enough invertebrate biomass from sediments to sustain juvenile fish.Individual shield shrimp (Triops australiensis) were removed from the vats whenobserved, since a pilot study and (Boulton and Lloyd 1992) had shown that either theiractivity within the soils or their feeding behaviour reduced the populations of other inver-tebrates of suitable prey size for small fish.
Young Western carp gudgeons (Hypseleotris spp.) were collected in February 2018from Tarban Creek (28�5802100S; 151�540100E), using bait traps (360� 240� 240mm, 5mmmesh) set overnight. Fish were transported to the mesocosms, where eight individualswere randomly selected and added to each vat.
One of three potential food sources was added daily to each of three replicate vats; 1/cyanobacteria as commercially available dried Aphanizomenon flos-aquae powder, 2/green algae as commercially available dried Chlorella powder and 3/dried biofilm pow-der. In addition, three vats were dosed with dissolved organic carbon (DOC) every fourto five days and three vats with no added food sources acted as a control treatment.Dissolved organic carbon (DOC) was sourced from river redgum (Eucalyptus camaldu-lensis) leaf leachate following the methods of O’Connell et al. (2000). The leachate wasproduced by submerging 800 g of dry leaves in 45 L of chlorinated potable water for72 hrs at 3 �C, to reduce the consumption by bacteria until added to the vats. The bio-film was collected from wooden redgum tiles that were incubated within the photiczone of a 1ML dam for six weeks, dried at 40 �C to constant weight and ground to afine powder. Seventy micrograms of powder was added to the cyanobacteria treatments,30 mg of powder to the green algae treatments and 70 mg of powder to the biofilm treat-ments. The amount of cyanobacteria and green algal powder added to each vat was cal-culated to increase the chlorophyll a (Chla) concentration by 4 mg/L, effectivelydoubling the average concentration identified in a previous mesocosm experiment(Growns, unpublished data).
Sampling of the mesocosms
Prior to the introduction of the gudgeons planktonic and benthic invertebrates weresampled to estimate abundance and assemblage structure. Zooplankton were sampled byhaphazardly taking five separate 200ml aliquots of mesocosm water from each tank, com-bined, preserved in ethanol and stained with rose Bengal. Benthic invertebrates weresampled following King (2004) by taking one core (50mm diameter x 120mm long with250mL volume) for each tank, put through a 250mm sieve, preserved in ethanol andstained with rose Bengal. Fourteen days after the introduction of fish planktonic and ben-thic invertebrates were again sampled from each vat using the same methods. Additionalplankton and benthos were collected using a 400 mm net to provide enough material forfatty acid profiling from each vat prior to them being drained to remove the remaininggudgeons. Following the draining of the vats organic components of the sediments werecollected by elutriation with water and passed through a series of sieves to obtain coarseparticulate organic matter (CPOM; 400 mm to 250mm) , fine particulate organic matter(FPOM; 250 mm to 125mm) and very fine particulate organic matter (VFPOM; 125 mmto 63 mm).
Gudgeons were anesthetised, measured for standard length, weighed and their entirealimentary canal removed and preserved in ethanol for gut content analysis. Invertebrates
176 I. GROWNS ET AL.
were identified to Genus for clam shrimp, shield shrimp and snails (Spinicaudata,Notostraca and Gastropoda, respectively), Family for true flies (Diptera) and water-fleas(Cladocera), Order for copepods (Copepoda), Class for seed shrimp (Ostracoda) andPhylum for roundworms (Nematoda) and rotifers (Rotifera).
Gut content analysis
The contents of the alimentary canal of each fish captured at the end of the experimentwere spread out on a small petri dish and examined under a binocular microscope. Alltaxa were counted and identified to the taxonomic level outlined in the previous section,with the exception of Macrothricidae and Daphnidae, which were pooled as most of themcould not be distinguished due to partial digestion of their exoskeletons.
Fatty acid analyses
Profiling of FA followed the methods used by Conlan et al. (2017). Briefly, lipid wasextracted from dry samples soaked dichloromethane: methanol (CH2Cl2:CH3OH) andquantified gravimetrically on a 4-digit balance. FA were extracted following lipid classanalysis determined using an Iatroscan MK 6 s thin layer chromatography-flame ionisa-tion detector. Following extraction, FA were esterified into methyl esters using the acidcatalysed methylation method (Christie 2003). Gas chromatography was then used toidentify the FA methyl esters relative to known external standards. FA profiling wasundertaken on benthic and pelagic invertebrates, gudgeons taken from the start and finishof the experiment, the three substratum size fractions from each of the three replicatemesocosms and the algal and biofilm powders.
To determine the primary food source in gudgeons at the end of the experiment weused the following individual FA as biomarkers, myristic acid (14:0) for cyanobacteria(Carpenter et al. 1997; Kelly and Scheibling 2012), pentadecylic acid (15:0) and margaricacid (17:0) for bacteria (Dalsgaard et al. 2003; Alfaro et al. 2006), oleic acid (18:1n-9) forfungi (Vestal and White 1989; Willers et al. 2015), alpha-linolenic acid (18:3n-3) for greenalgae (D’Souza and Loneragan 1999; Kelly and Scheibling 2012) and eicosapentaenoic acid(20:5n-3) for diatoms (Volkman et al. 1989). The nutritional value of various food sourceswas defined as the sum of n-3 and n-6 PUFA.
Fish dietary preference
We used the Manly-Chesson index a (Manly 1974; Chesson 1978, 1983) to assess preyselection. The equation for the Manly-Chesson index is as follows:
ai ¼ ri=piPmi¼1 ri=pi
where ri is the relative abundance of prey taxon ‘i’ found in the larval diet, pi is the rela-tive abundance of the same prey item found in the environment and m is the number offood items. A value less than 1/m indicates a prey group that was consumed dispropor-tionately less than its relative abundance in the environment. Values near 1/m indicatethat a prey taxon was consumed in direct proportion to its abundance, and values greaterthan 1/m indicate a prey group was consumed disproportionately more than its relativeabundance in the resource base, with values near 1.0 indicating a strong selection of a
JOURNAL OF FRESHWATER ECOLOGY 177
prey item or ‘preference’. Separate calculations were performed for the planktonic andbenthic invertebrates in each treatment.
Statistical analyses
All statistical analyses were conducted using PERMANOVAþ for PRIMER software(Anderson et al. 2008). Permutational analysis of variance (PERMANOVA) (Anderson2001) was used to identify significant sources of variation among factors (Supplementarymaterial Table S1) using 9999 randomisations. Bray–Curtis dissimilarity was used todefine distances among samples for multivariate data (e.g. FA profiles or invertebrateassemblages) and Euclidean distance for the univariate data. Invertebrate abundance datawas converted to ranks within each habitat type and Kendall rank correlation coefficientswere used to form the similarity matrix for PERMANOVA analysis. The homogeneity ofvariance, that is equal dispersion, among groups of the main factors was tested usingPERMDISP (Anderson 2001). Patterns of differences in invertebrate assemblages and fattyacid profiles identified by PERMANOVA were presented graphically using bootstrap aver-aging ordination with 100 randomized starts (Clarke et al. 2014). The variables respon-sible for the separation of significantly different groups in multivariate data were testedusing similarity percentages (SIMPER) in the PRIMER software (Clarke 1993). The con-sistency ratio (the ratio of the average to standard deviation of the dissimilarities betweengroups) was calculated for each species that had a greater than 3% contribution to theaverage dissimilarity.
Results
Fatty acid profiles
A total of 47 individual fatty acids were identified from the food sources, substratum frac-tions and animal groups (Supplementary material Table S2). Palmitic acid (16:0) was pre-sent in greater than 20% of all samples and oleic acid (18:1n-9) greater than 10% in allthe substratum factions, green algae and biofilm (Supplementary material Table S2). Atcommencement of our mesocosm experiment gudgeon tissue contained palmitic acid andoleic acid in similar proportions to the substratum fractions, however the proportion ofoleic acid among total lipids increased in gudgeon tissue to more than 15% by the end ofthe experiment. Palmitic acid accounted for more than 30% of total lipids among all ben-thic invertebrate samples, while stearic acid (18:0) occurred in proportions above 15%,with no other single fatty acid accounting for more than 10% of total lipids. Planktonictaxa also had palmitic acid and oleic acid in proportions exceeding 10% of total lipids aswell as two additional fatty acids alpha linolenic acid (ALA, 18:3n-3) and palmitoleic acid(16:1n-7). The cyanobacteria food source differed from the other two food sources byhaving the greatest percentage of palmitic acid, myristic acid (14:0) and tetracosapentae-noic acid 24:5n-3. Biofilm had the greatest percentage of stearic acid and oleic acid(18:1n-9). In contrast, green algae had the highest concentration of alpha-linolenic acid(18:3n-3).
The fatty acid profiles of the different groups (substratum fractions and animal groups)and between treatments were significantly different with no interaction between those fac-tors (Table 1). Pairwise tests demonstrated fatty acid profiles of each group differed sig-nificantly from one another (Figure 1). In addition, the variation within groups differedsignificantly between the different groups, with fish demonstrating little variation
178 I. GROWNS ET AL.
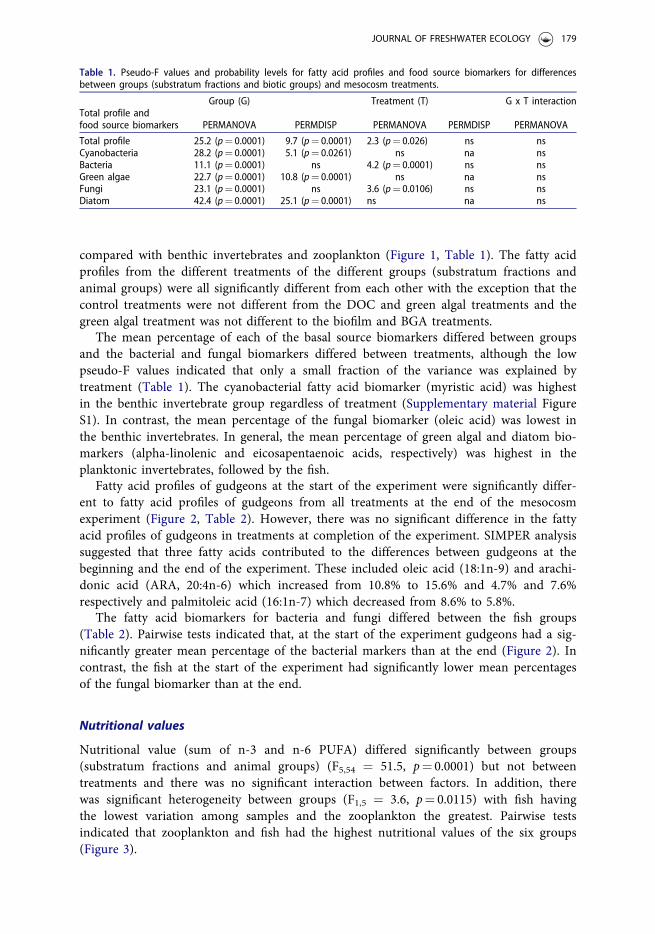
compared with benthic invertebrates and zooplankton (Figure 1, Table 1). The fatty acidprofiles from the different treatments of the different groups (substratum fractions andanimal groups) were all significantly different from each other with the exception that thecontrol treatments were not different from the DOC and green algal treatments and thegreen algal treatment was not different to the biofilm and BGA treatments.
The mean percentage of each of the basal source biomarkers differed between groupsand the bacterial and fungal biomarkers differed between treatments, although the lowpseudo-F values indicated that only a small fraction of the variance was explained bytreatment (Table 1). The cyanobacterial fatty acid biomarker (myristic acid) was highestin the benthic invertebrate group regardless of treatment (Supplementary material FigureS1). In contrast, the mean percentage of the fungal biomarker (oleic acid) was lowest inthe benthic invertebrates. In general, the mean percentage of green algal and diatom bio-markers (alpha-linolenic and eicosapentaenoic acids, respectively) was highest in theplanktonic invertebrates, followed by the fish.
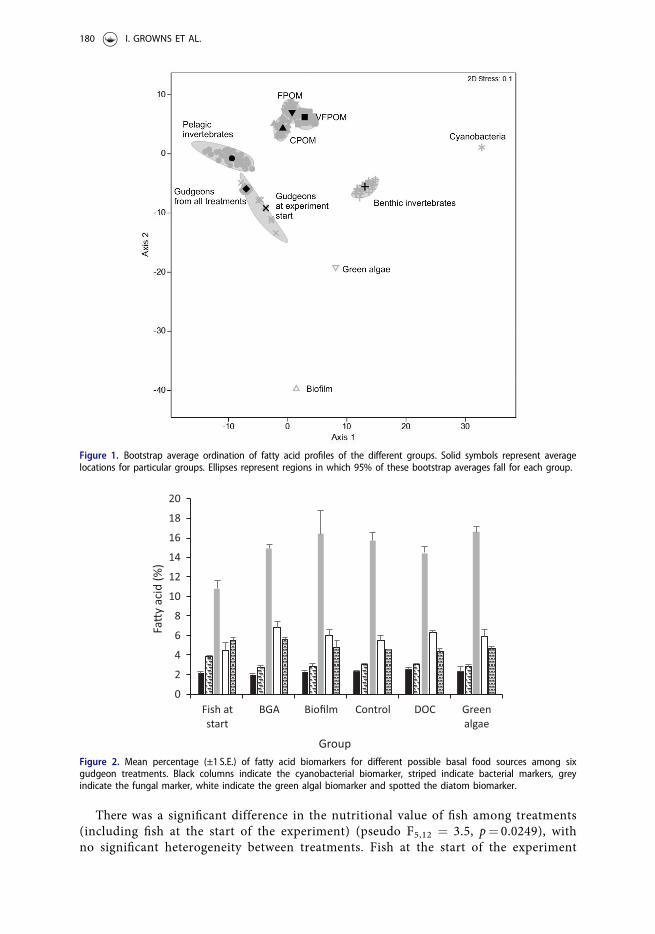
Fatty acid profiles of gudgeons at the start of the experiment were significantly differ-ent to fatty acid profiles of gudgeons from all treatments at the end of the mesocosmexperiment (Figure 2, Table 2). However, there was no significant difference in the fattyacid profiles of gudgeons in treatments at completion of the experiment. SIMPER analysissuggested that three fatty acids contributed to the differences between gudgeons at thebeginning and the end of the experiment. These included oleic acid (18:1n-9) and arachi-donic acid (ARA, 20:4n-6) which increased from 10.8% to 15.6% and 4.7% and 7.6%respectively and palmitoleic acid (16:1n-7) which decreased from 8.6% to 5.8%.
The fatty acid biomarkers for bacteria and fungi differed between the fish groups(Table 2). Pairwise tests indicated that, at the start of the experiment gudgeons had a sig-nificantly greater mean percentage of the bacterial markers than at the end (Figure 2). Incontrast, the fish at the start of the experiment had significantly lower mean percentagesof the fungal biomarker than at the end.
Nutritional values
Nutritional value (sum of n-3 and n-6 PUFA) differed significantly between groups(substratum fractions and animal groups) (F5,54 ¼ 51.5, p¼ 0.0001) but not betweentreatments and there was no significant interaction between factors. In addition, therewas significant heterogeneity between groups (F1,5 ¼ 3.6, p¼ 0.0115) with fish havingthe lowest variation among samples and the zooplankton the greatest. Pairwise testsindicated that zooplankton and fish had the highest nutritional values of the six groups(Figure 3).
Table 1. Pseudo-F values and probability levels for fatty acid profiles and food source biomarkers for differencesbetween groups (substratum fractions and biotic groups) and mesocosm treatments.
Group (G) Treatment (T) G x T interactionTotal profile andfood source biomarkers PERMANOVA PERMDISP PERMANOVA PERMDISP PERMANOVA
Total profile 25.2 (p¼ 0.0001) 9.7 (p¼ 0.0001) 2.3 (p¼ 0.026) ns nsCyanobacteria 28.2 (p¼ 0.0001) 5.1 (p¼ 0.0261) ns na nsBacteria 11.1 (p¼ 0.0001) ns 4.2 (p¼ 0.0001) ns nsGreen algae 22.7 (p¼ 0.0001) 10.8 (p¼ 0.0001) ns na nsFungi 23.1 (p¼ 0.0001) ns 3.6 (p¼ 0.0106) ns nsDiatom 42.4 (p¼ 0.0001) 25.1 (p¼ 0.0001) ns na ns
JOURNAL OF FRESHWATER ECOLOGY 179
There was a significant difference in the nutritional value of fish among treatments(including fish at the start of the experiment) (pseudo F5,12 ¼ 3.5, p¼ 0.0249), withno significant heterogeneity between treatments. Fish at the start of the experiment
Figure 1. Bootstrap average ordination of fatty acid profiles of the different groups. Solid symbols represent averagelocations for particular groups. Ellipses represent regions in which 95% of these bootstrap averages fall for each group.
Figure 2. Mean percentage (±1 S.E.) of fatty acid biomarkers for different possible basal food sources among sixgudgeon treatments. Black columns indicate the cyanobacterial biomarker, striped indicate bacterial markers, greyindicate the fungal marker, white indicate the green algal biomarker and spotted the diatom biomarker.
180 I. GROWNS ET AL.

had a significantly higher nutritional value than fish in the remaining treatments(Figure 3).
Invertebrate assemblage structure
A total of 4264 invertebrates from seven taxa were collected from benthic and planktonichabitats during the course of the experiment. Approximately half of the animals wereDaphniidae (49%), and were followed in abundance by Macrothricidae (29%), Ostracoda(12%) and Chironomidae (9%). Chydoridae, Harpacticoida and Nematoda comprised lessthan one percent of the total abundance.
Time and habitat were the main sources of variation in the invertebrate assemblagestructure, explaining 32% and 35%, respectively (Table 3). The only other significantsource of variation was the habitat by treatment interaction. Post-hoc pairwise tests indi-cated that the assemblage structure in the DOC and biofilm treatments differed signifi-cantly (p< 0.05) from the green algae treatment in the benthic habitat but all the othercomparisons between treatments in the benthic and planktonic habitats were not signifi-cantly different.
Both benthic and planktonic invertebrate communities showed clear shifts in compos-ition from prior to introduction of gudgeons to the mesocosms to those at the end(Figure 4). Taxa contributing most to dissimilarity between benthic and planktonicassemblages included Chironomidae, Macrothricidae, Ostracoda and Daphniidae (Table4). The ranked abundance of all taxa with the exception of Daphniidae was greater in the
Table 2. Pseudo-F values and probability levels for fatty acid profiles and basal source biomarkers for differencesbetween fish groups.
Total profiles and food source biomarkers PERMANOVA PERMDISP
Total profile 2.3 (p¼ 0.0095) nsCyanobacteria ns naBacteria 4.8 (p¼ 0.0195) nsGreen algae ns naFungi 3.3 (p¼ 0.040) nsDiatom ns na
Figure 3. Mean nutrition value (±1 S.E.) of substratum factions and animal groups. Black columns the BGA treatment,striped columns biofilm, light grey control mesocosms, dotted columns DOC and white columns green algae treat-ments. Dark grey column represents fish at the start of the experiment.
JOURNAL OF FRESHWATER ECOLOGY 181
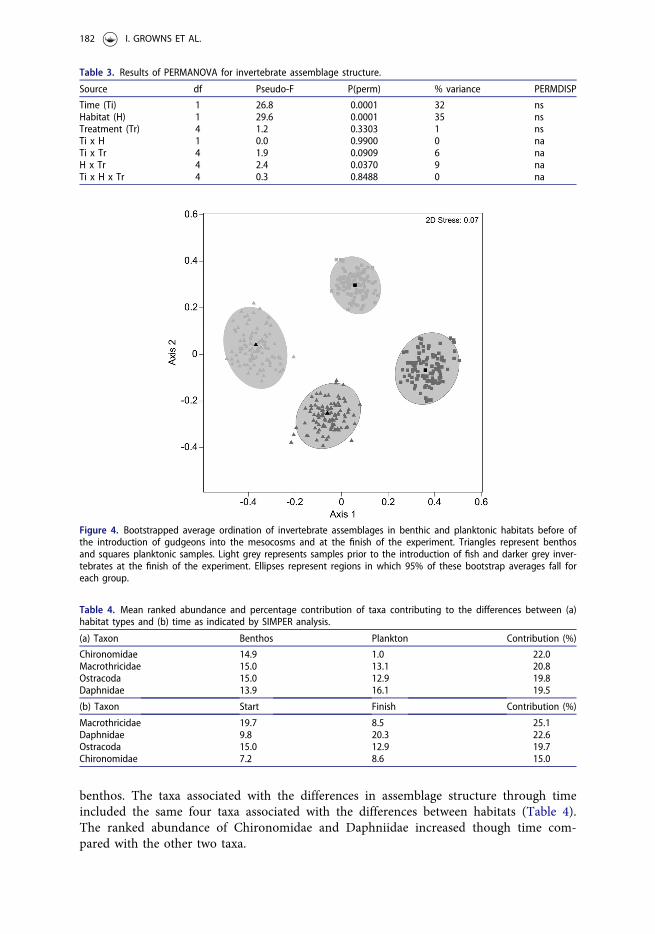
benthos. The taxa associated with the differences in assemblage structure through timeincluded the same four taxa associated with the differences between habitats (Table 4).The ranked abundance of Chironomidae and Daphniidae increased though time com-pared with the other two taxa.
Table 3. Results of PERMANOVA for invertebrate assemblage structure.
Source df Pseudo-F P(perm) % variance PERMDISP
Time (Ti) 1 26.8 0.0001 32 nsHabitat (H) 1 29.6 0.0001 35 nsTreatment (Tr) 4 1.2 0.3303 1 nsTi x H 1 0.0 0.9900 0 naTi x Tr 4 1.9 0.0909 6 naH x Tr 4 2.4 0.0370 9 naTi x H x Tr 4 0.3 0.8488 0 na
Figure 4. Bootstrapped average ordination of invertebrate assemblages in benthic and planktonic habitats before ofthe introduction of gudgeons into the mesocosms and at the finish of the experiment. Triangles represent benthosand squares planktonic samples. Light grey represents samples prior to the introduction of fish and darker grey inver-tebrates at the finish of the experiment. Ellipses represent regions in which 95% of these bootstrap averages fall foreach group.
Table 4. Mean ranked abundance and percentage contribution of taxa contributing to the differences between (a)habitat types and (b) time as indicated by SIMPER analysis.
(a) Taxon Benthos Plankton Contribution (%)
Chironomidae 14.9 1.0 22.0Macrothricidae 15.0 13.1 20.8Ostracoda 15.0 12.9 19.8Daphnidae 13.9 16.1 19.5
(b) Taxon Start Finish Contribution (%)
Macrothricidae 19.7 8.5 25.1Daphnidae 9.8 20.3 22.6Ostracoda 15.0 12.9 19.7Chironomidae 7.2 8.6 15.0
182 I. GROWNS ET AL.
Western carp gudgeons and gut content analysis
Eighty six fish (72%) were recovered from the mesocosms. There was no significant differ-ence in either survival or weight of fish between treatments (pseudo F4,10 ¼ 0.8 and 1.2,respectively, p> 0.05).
A total of 1212 invertebrates from five taxa were identified from the gut contents ofthe fish. The majority of the invertebrates were Chironomidae (44%) followed byDaphniidae (43%), Chydoridae (11%) and Ostracoda (2%). There were no significant dif-ferences in the proportion of dietary items between treatments (pseudo F4,10 ¼1.5, p¼ 0.21).
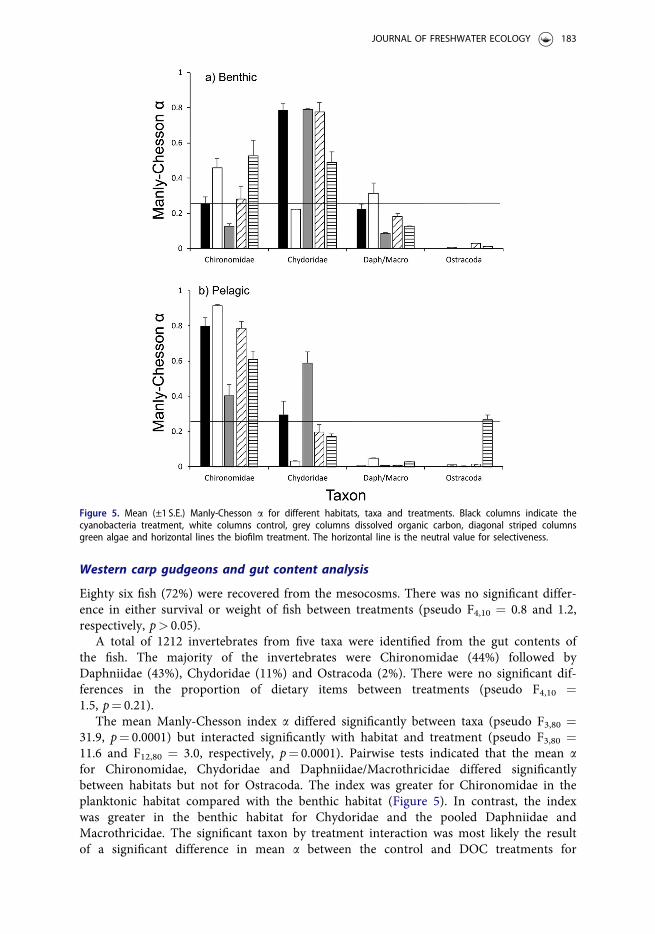
The mean Manly-Chesson index a differed significantly between taxa (pseudo F3,80 ¼31.9, p¼ 0.0001) but interacted significantly with habitat and treatment (pseudo F3,80 ¼11.6 and F12,80 ¼ 3.0, respectively, p¼ 0.0001). Pairwise tests indicated that the mean afor Chironomidae, Chydoridae and Daphniidae/Macrothricidae differed significantlybetween habitats but not for Ostracoda. The index was greater for Chironomidae in theplanktonic habitat compared with the benthic habitat (Figure 5). In contrast, the indexwas greater in the benthic habitat for Chydoridae and the pooled Daphniidae andMacrothricidae. The significant taxon by treatment interaction was most likely the resultof a significant difference in mean a between the control and DOC treatments for
Figure 5. Mean (±1 S.E.) Manly-Chesson a for different habitats, taxa and treatments. Black columns indicate thecyanobacteria treatment, white columns control, grey columns dissolved organic carbon, diagonal striped columnsgreen algae and horizontal lines the biofilm treatment. The horizontal line is the neutral value for selectiveness.
JOURNAL OF FRESHWATER ECOLOGY 183

Chironomidae and Chydoridae but not the other two taxa. Mean a was greater in thecontrol treatment compared with the DOC treatment for Chironomidae in both habitats(Figure 5). In contrast, the index was greater in the DOC treatment compared with thecontrol in both habitats for Chydoridae.
In general, the mean a was greater than the neutral value for selectiveness forChironomidae in the planktonic habitat and Chydoridae in the benthic habitat (Figure 5).This indicates that the gudgeons were selecting different taxa in different habitats. In con-trast, the mean a was less than the neutral value for selectiveness for both Daphniidae/Macrothricidae and Ostracoda in both habitats, suggesting that gudgeons are avoidingthose prey.
Discussion
There was a clear shift in the invertebrate assemblage structure following the introductionof the gudgeons. There was also a clear difference in assemblage structure and nutritionalvalue between habitat types. In addition, the gudgeons appeared to target different taxa inthe different habitat types, Chironomidae from the plankton and Chydoridae from thebenthos and avoided Ostracoda and Daphniidae/Macrothricidae in both habitat types.Western carp gudgeons are known to eat Daphnidae, Chironomidae and to a lesser extentostracods and chydorids (Meredith et al. 2003; Balcombe and Humphries 2006; Balcombeand Closs 2016). Through their dietary preferences gudgeons can alter the assemblagestructure of zooplankton (Ning et al. 2010) but it is unclear if this is the case for benthos.Young gudgeons are known to inhabit benthic and pelagic habitats (Stoffels andHumphries 2003) so it is possible that the change in benthic assemblage structure was theresult of gudgeon feeding preferences. It is unclear why the gudgeons were selectivelyfeeding in our mesocosms. It may be that the different taxa have different nutritional val-ues but overall the planktonic invertebrates were more nutritious in terms of total PUFA.Experiments which involve the addition of different food sources to wetland mesocosmsare rare. We are aware on only one other study, Williams et al. (2007) who added extraleaf material and algal cultures to pond mesocosms. However, similar to our results theyfound few differences in the invertebrates colonizing the different treatments. This maysuggest that food sources generated within the mesocosms themselves may have out-weighed any treatment effects.
The addition of extra food sources did not generate differing FA profiles between treat-ments in the substratum fractions, invertebrates or fish. This is despite the FA profiles ofthe food sources added differing and being indicative of their different biomarkers; 14:0for cyanobacteria, 18:3n-3 for green algae and 18:1n-9 for fungi in the biofilm. This sug-gests that food sources generated within the mesocosms themselves may have outweighedany treatment effects. The significant increase in the fungal FA biomarker in all treat-ments suggests that the main food source in the mesocosms is derived from fungi. Theuse of FA as biomarkers is commonplace in the food web literature (e.g. Johns et al.1979; Goedkoop et al. 2000; Falk-Petersen et al. 2002). However, there are some specificFA that have been attributed to different biotic groups by different authors. For example,the FA 16:0 has been used as a biomarker for green algae, cyanobacteria and fungi(Vestal and White 1989; Kelly and Scheibling 2012). Biomarkers for specific species ofalgae are easily overlapped, such as the 18:3n6 has been simultaneously used as a markerfor green algae (Meziane and Tsuchiya 2000; Xu et al. 2014) and cyanobacteria(Hayakawa et al. 2002; de Kluijver et al. 2012). In addition, the one biomarker for a par-ticular group may not be present for environmental reasons. The FA 20:5� 3 although an
184 I. GROWNS ET AL.
often consistent biomarker for diatoms is often not found in large quantities relative toother FA (Napolitano 1999) and may be found in lower light or nutrient concentrations(Ahlgren et al. 1992). Given biomarkers for individual species of plankton, aquatic andterrestrial materials are not always specific enough to identify a single source and the factthat the internal biosynthetic capabilities of most organisms have not been elucidated,some authors caution their use in food web studies (Wakeham 1995; Dalsgaardet al. 2003).
An explanation for the lack of difference in Western carp gudgeon size or survival andFA profiles between treatments may be that the mesocosm experiment was run for insuf-ficient time for any changes to manifest themselves. However, three fatty acids contrib-uted to the differences between gudgeons at the beginning and the end of the experiment.These included increases in oleic acid and ARA and a decrease in palmitoleic acid sug-gesting that there was sufficient time for changes to occur. In addition, a previous meso-cosm experiment involving larval Murray cod demonstrated two weeks was sufficient timefor changes in FA profiles (Growns, unpublished data).
Food web and diet studies that attempt to identify the mechanisms for basal foodsource uptake and conversion generally only occur from the source itself to primary con-sumers (Taipale et al. 2012; Freese and Martin-Creuzburg 2013). In these studies the biotaare mainly cladoceran species fed specific food sources, i.e. animals cannot choosebetween food types. Linking FA profiles from basal food sources through primary con-sumers to secondary consumer are rare and have only occurred in marine systems (Obergand Fuiman 2015). Previous field investigations of fish FA composition in freshwater sys-tems have mainly focused on temporal and spatial changes e.g. Dayhuff and Wells (2005),and a direct, quantitative comparison of fish FA profile to their food sources has yet to bemade (Guo et al. 2017). Our mesocosm experiment attempted to identify the fate of dif-ferent primary production sources through primary and then secondary consumers byproviding alternate sources of food in addition to that generated from flooding dry wet-land sediment. Using flooded wetland mesocosms potentially would have provided morerealistic knowledge of the food web mechanisms of wetland inundation rather than feed-ing zooplankton fed specific primary food sources to fish. However, future experimentsattempting to identify the mechanisms of the transfer of basal food sources in wetlands tosecondary consumers may wish to directly feed fish primary consumers raised on specificbasal food sources.
Acknowledgements
Michael Faint from University of New England is thanked for proving space in the agronomy polytunnelfor the mesocosms. David Francis from Deakin University is thanked for organising the fatty acid profileanalyses. Simon Mitrovic from University of Technology Sydney is thanked for organising the countingof bacteria. Sam Lewis is thanked for assisting with the collection of wetland soils. Lindsey Frost madeuseful comments on earlier drafts of the manuscript.
Disclosure statement
No potential conflict of interest was reported by the author(s).
Funding
This research forms part of and was funded by the Environmental Water Knowledge and ResearchProject which is funded by the Australian Government’s Department of the Environment and Energy andcoordinated by the Murray–Darling Freshwater Research Centre. All work was conducted under the UNE
JOURNAL OF FRESHWATER ECOLOGY 185

Animal Ethics Committee Authority No.: AEC17-091 and NSW Department of Primary IndustriesScientific Collection permit P17/0056-1.0 & OUT17/34715. Data from the mesocosm experiment is freelyavailable at 10.4121/uuid:2f1210af-2898-4330-93ad-96d934e7fcf2.
Notes on contributors
Ivor Growns is a Research Fellow at the University of New England, where he has conducted research onfood webs and environmental flows.
Darren Ryder is a Professor at the University of New England, where he leads the Aquatic Ecology andRiver Restoration Research Group.
Paul McInerney is a Research Scientist at the Commonwealth Scientific and Industrial ResearchOrganisation, where his primary interest is in energy flow within aquatic ecosystems.
Nick Bond is a Professor at LaTrobe University, where he studies the effects of flow variability on river-ine ecosystems.
Galen Holt is an Associate Research Fellow at Deakin University, where his primary focus on the effectsof variation on populations, communities, and ecosystems.
Rebecca Lester is an Associate Professor at Deakin University, where she studies the function and struc-ture of ecosystems and in the development of management strategies that incorporate good ecologicaloutcomes with human activities.
Ross Thompson is Director and Professor in the Centre for Applied Water Science at the University ofCanberra, where his fundamental research is in food web ecology.
References
Ahlgren G, Gustafsson IB, Boberg M. 1992. Fatty acid content and chemical composition of freshwatermicroalgae. J Phycol. 28(1):37–50.
Alfaro AC, Thomas F, Sergent L, Duxbury M. 2006. Identification of trophic interactions within an estu-arine food web (northern New Zealand) using fatty acid biomarkers and stable isotopes. EstuarineCoastal Shelf Sci. 70(1-2):271–286.
Anderson M, Gorley RN, Clarke RK. 2008. Permanovaþ for primer: guide to software and statisticalmethods. Plymouth: Primer-E Limited.
Anderson MJ. 2001. Permutation tests for univariate or multivariate analysis of variance and regression.Can J Fish Aquat Sci. 58(3):626–639.
Christie W. 2003. Lipid analysis: isolation, separation, identification and structural analysis of lipids.England: Oily Press.
Arthington AH. 2012. Environmental flows: saving rivers in the third millennium. London: University ofCalifornia Press.
Arthington AH, Kennen JG, Stein ED, Webb JA. 2018. Recent advances in environmental flows scienceand water management—innovation in the Anthropocene. Freshw Biol. 63(8):1022–1034.
Arthington AH, Pusey BJ. 2003. Flow restoration and protection in Australian rivers. River Res Appl.19(5-6):377–395.
Arts MT, Brett MT, Kainz M. 2009. Lipids in aquatic ecosystems. New York, NY: Springer Science &Business Media.
Balcombe SR, Closs GP. 2016. Patchiness in food resources drives fish abundances in emergent macro-phytes under field and experimental conditions. Hydrobiologia. 781(1):127–142.
Balcombe SR, Humphries P. 2006. Diet of the western carp gudgeon (Hypseleotris klunzingeri Ogilby) inan Australian floodplain lake: the role of water level stability. J Fish Biology. 68(5):1484–1493.
Boulton AJ, Lloyd LN. 1992. Flooding frequency and invertebrate emergence from dry floodplain sedi-ments of the River Murray, Australia. Regul Rivers Res Mgmt. 7(2):137–151.
Bowen S, Simpson SL. 2010. Changes in extent and condition of the vegetation communities of theGwydir wetlands and floodplain 1996-2008: final report. NSW Wetland Recovery Program, NSWDepartment of Environment Climate Change and Water, Sydney.
186 I. GROWNS ET AL.
Carpenter EJ, Harvey HR, Fry B, Capone DG. 1997. Biogeochemical tracers of the marine cyanobacteriumTrichodesmium. Deep Sea Res Part I. 44(1):27–38.
Chesson J. 1978. Measuring preference in selective predation. Ecology. 59(2):211–215.Chesson J. 1983. The estimation and analysis of preference and its relatioship to foraging models.
Ecology. 64(5):1297–1304.Clarke KR. 1993. Non-parametric multivariate analyses of changes in community structure. Austral Ecol.
18(1):117–143.Clarke KR, Gorley RN, Somerfield PJ, Warwick RM. 2014. Change in marine communities: an approach
to statistical analysis and interpretation. 3rd ed. Plymouth: PRIMER-E Limited.Conlan JA, Rocker MM, Francis DS. 2017. A comparison of two common sample preparation techniques
for lipid and fatty acid analysis in three different coral morphotypes reveals quantitative and qualitativedifferences. PeerJ. 5:e3645.
D’Souza FML, Loneragan NR. 1999. Effects of monospecific and mixed-algae diets on survival, develop-ment and fatty acid composition of penaeid prawn (Penaeus spp.) larvae. Mar Biol. 133(4):621–633.
Dalsgaard J, John MS, Kattner G, M€uller-Navarra D, Hagen W. 2003. Fatty acid trophic markers in thepelagic marine environment. Adv Mar Biol. 46:225–340.
Davidson NC, Fluet-Chouinard E, Finlayson CM. 2018. Global extent and distribution of wetlands: trendsand issues. Mar Freshwater Res. 69(4):620–627.
Davies PM, Naiman RJ, Warfe DM, Pettit NE, Arthington AH, Bunn SE. 2014. Flow–ecology relation-ships: closing the loop on effective environmental flows. Mar Freshwater Res. 65(2):133–141.
Dayhuff LE, Wells MJM. 2005. Identification of fatty acids in fishes collected from the Ohio River usinggas chromatography-mass spectrometry in chemical ionization and electron impact modes. JChromatogr A. 1098(1-2):144–149.
de Kluijver A, Yu J, Houtekamer M, Middelburg JJ, Liu Z. 2012. Cyanobacteria as a carbon source forzooplankton in eutrophic Lake Taihu, China, measured by 13C labeling and fatty acid biomarkers.Limnol Oceanogr. 57(4):1245–1254.
Docker B, Robinson I. 2014. Environmental water management in Australia: experience from the Murray-Darling Basin. Int J Water Resour Dev. 30(1):164–177.
Falk-Petersen S, Dahl TM, Scott CL, Sargent JR, Gulliksen B, Kwasniewski S, Hop H, Millar R-M. 2002.Lipid biomarkers and trophic linkages between ctenophores and copepods in Svalbard waters. MarEcol Prog Ser. 227:187–194.
Freese HM, Martin-Creuzburg D. 2013. Food quality of mixed bacteria–algae diets for Daphnia magna.Hydrobiologia. 715(1):63–76.
Gawne B, Roots J, Hale J, Stewardson M. 2014. Commonwealth Environmental Water Office long–termintervention monitoring project: basin evaluation plan. Report prepared for the CommonwealthEnvironmental Water Office by The Murray–Darling Freshwater Research Centre. MDFRC Publication42:2014.
Goedkoop W, Sonesten L, Ahlgren G, Boberg M. 2000. Fatty acids in profundal benthic invertebrates andtheir major food resources in Lake Erken, Sweden: seasonal variation and trophic indications. Can JFish Aquat Sci. 57(11):2267–2279.
Goncalves A, Azeiteiro U, Pardal M, De Troch M. 2012. Fatty acid profiling reveals seasonal and spatialshifts in zooplankton diet in a temperate estuary. Estuarine Coastal Shelf Sci. 109:70–80.
Guo F, Bunn SE, Brett MT, Kainz MJ. 2017. Polyunsaturated fatty acids in stream food webs – high dis-similarity among producers and consumers. Freshw Biol. 62(8):1325–1334.
Hayakawa K, Tsujimura S, Napolitano GE, Nakano S-i, Kumagai M, Nakajima T, Jiao C. 2002. Fatty acidcomposition as an indicator of physiological condition of the cyanobacterium Microcystis aeruginosa.Limnology. 3:29–35.
Horne AC, Kaur S, Szemis JM, Costa AM, Nathan R, Webb JA, Stewardson MJ, Boland N. 2018. Activemanagement of environmental water to improve ecological outcomes. J Water Resour Plann Manage.144(12):04018079.
Iverson SJ, Field C, Don Bowen W, Blanchard W. 2004. Quantitative fatty acid signature analysis: a newmethod of estimating predator diets. Ecol Monogr. 74(2):211–235.
Jenkins KM, Boulton AJ, Ryder DS. 2005. A common parched future? Research and management ofAustralian arid-zone floodplain wetlands. Hydrobiologia. 552(1):57–73.
Johns R, Nichols P, Perry GJP. 1979. Fatty acid composition of ten marine algae from Australian waters.Phytochemistry. 18(5):799–802.
Kainz M, Arts MT, Mazumder A. 2004. Essential fatty acids in the planktonic food web and their eco-logical role for higher trophic levels. Limnol Oceanogr. 49(5):1784–1793.
JOURNAL OF FRESHWATER ECOLOGY 187
Kelly JR, Scheibling RE. 2012. Fatty acids as dietary tracers in benthic food webs. Mar Ecol Prog Ser. 446:1–22.
King AJ. 2004. Density and distribution of potential prey for larval fish in the main channel of a flood-plain river: pelagic versus epibenthic meiofauna. River Res Appl. 20(8):883–897.
Kingsford RT. 2000. Ecological impacts of dams, water diversions and river management on floodplainwetlands in Australia. Austral Ecol. 25(2):109–127.
Kohlbach D, Schaafsma FL, Graeve M, Lebreton B, Lange BA, David C, Vortkamp M, Flores H. 2017.Strong linkage of polar cod (Boreogadus saida) to sea ice algae-produced carbon: evidence from stom-ach content, fatty acid and stable isotope analyses. Prog Oceanogr. 152:62–74.
Lemly AD, Kingsford RT, Thompson JR. 2000. Irrigated agriculture and wildlife conservation: conflict ona global scale. Environ Manage. 25(5):485–512.
Lowe WH, Likens GE, Power ME. 2006. Linking scales in stream ecology. BioScience. 56(7):591–597.2.0.CO;2]
Magnone L, Bessonart M, Gadea J, Salhi M. 2015. Trophic relationships in an estuarine environment: aquantitative fatty acid analysis signature approach. Estuarine Coastal Shelf Sci. 166:24–33.
Malzahn AM, Aberle N, Clemmesen C, Boersma M. 2007. Nutrient limitation of primary producersaffects planktivorous fish condition. Limnol Oceanogr. 52(5):2062–2071.
Manly B. 1974. A model for certain types of selection experiments. Biometrics. 30(2):281–294.Masclaux H, Bec A, Kainz MJ, Perriere F, Desvilettes C, Bourdier G. 2012. Accumulation of polyunsatur-
ated fatty acids by cladocerans: effects of taxonomy, temperature and food. Freshwater Biol. 57(4):696–703.
Meredith SN, Matveev VF, Mayes P. 2003. Spatial and temporal variability in the distribution and diet ofthe gudgeon (Eleotridae: Hypseleotris spp.) in a subtropical Australian reservoir. Mar Freshwater Res.54(8):1009–1017.
Meziane T, Tsuchiya M. 2000. Fatty acids as tracers of organic matter in the sediment and food web of amangrove/intertidal flat ecosystem, Okinawa, Japan. Mar Ecol Prog Ser. 200:49–57.
Murray-Darling Basin Authority. 2011a. Delivering a healthy working basin: about the draft basin plan.Canberra: Murray-Darling Basin Authority.
Murray-Darling Basin Authority. 2011b. The proposed ‘environmentally sustainable level of take’ for sur-face water of the Murray-Darling Basin: methods and outcomes. Canberra: MDBA.
Napolitano GE. 1999. Fatty acids as trophic and chemical markers in freshwater ecosystems. In: Arts MT,Wainman BC, editors. Lipids in freshwater ecosystems. New York, NY: Springer; p. 21–44.
Ning NS, Nielsen DL, Hillman TJ, Suter PJ. 2010. The influence of planktivorous fish on zooplanktoncommunities in riverine slackwaters. Freshwater Biol. 55(2):360–374.
O’Connell M, Baldwin DS, Robertson AI, Rees G. 2000. Release and bioavailability of dissolved organicmatter from floodplain litter: influence of origin and oxygen levels. Freshwater Biol. 45(3):333–342.
Oberg EW, Fuiman LA. 2015. Linking fatty acids in the diet and tissues to quality of larval southernflounder (Paralichthys lethostigma). J Exp Mar Biol Ecol. 467:7–15.
Paulsen M, Hammer C, Malzahn AM, Polte P, Von Dorrien C, Clemmesen C. 2014. Nutritional situationfor larval Atlantic herring (Clupea harengus L.) in two nursery areas in the western Baltic Sea. ICES JMar Sci. 71(4):991–1000.
Peltomaa ET, Aalto SL, Vuorio KM, Taipale SJ. 2017. The importance of phytoplankton biomoleculeavailability for secondary production. Front Ecol Evol. 5:128.
Poff NL, Zimmerman JKH. 2010. Ecological responses to altered flow regimes: a literature review toinform the science and management of environmental flows. Freshwater Biol. 55:194–205.
Ravinet M, Syv€aranta J, Jones RI, Grey J. 2010. A trophic pathway from biogenic methane supports fishbiomass in a temperate lake ecosystem. Oikos. 119(2):409–416.
Robson BJ, Lester RE, Baldwin DS, Bond NR, Drouart R, Rolls RJ, Ryder DS, Thompson RM. 2017.Modelling food-web mediated effects of hydrological variability and environmental flows. Water Res.124:108–128.
Rolls RJ, Baldwin DS, Bond NR, Lester RE, Robson BJ, Ryder DS, Thompson RM, Watson GA. 2017. Aframework for evaluating food-web responses to hydrological manipulations in riverine systems. JEnviron Manage. 203:136–150.
Rossi S, Sabat�es A, Latasa M, Reyes E. 2006. Lipid biomarkers and trophic linkages between phytoplank-ton, zooplankton and anchovy (Engraulis encrasicolus) larvae in the NW Mediterranean. J PlanktonRes. 28(6):551–562.
Ryder DS, Watts RJ, Nye E, Burns A. 2006. Can flow velocity regulate epixylic biofilm structure in a regu-lated floodplain river? Mar Freshwater Res. 57(1):29–36.
188 I. GROWNS ET AL.
Sheldon F, Walker KF. 1997. Changes in biofilms induced by flow regulation could explain extinctions ofaquatic snails in the lower River Murray, Australia. Hydrobiologia. 347:97–108.
Southwell M, Wilson G, Ryder D, Sparks P, Thoms M. 2015. Monitoring the ecological response ofCommonwealth Environmental Water delivered in 2013-14 in the Gwydir River system. A report tothe Department of Environment. Armidale: University of New England.
Stoffels RJ, Humphries P. 2003. Ontogenetic variation in the diurnal food and habitat associations of anendemic and an exotic fish in floodplain ponds: consequences for niche partitioning. Environ BiolFishes. 66(3):293–305.
Taipale SJ, Brett MT, Pulkkinen K, Kainz MJ. 2012. The influence of bacteria-dominated diets onDaphnia magna somatic growth, reproduction, and lipid composition. FEMS Microbiol Ecol. 82(1):50–62.
Thompson R, Bond N, Poff N, Byron N 2019. Towards a systems approach for river basin management—lessons from Australia’s largest river. River Res Appl. 35(5):466–475.
Tonkin JD, Poff NL, Bond NR, Horne A, Merritt DM, Reynolds LV, Olden JD, Ruhi A, Lytle DA. 2019.Prepare river ecosystems for an uncertain future. Nat Publish Group. 570(7761):301–303.
Vestal JR, White DC. 1989. Lipid analysis in microbial ecology. BioScience. 39(8):535–541.Volkman J, Jeffrey S, Nichols P, Rogers G, Garland C. 1989. Fatty acid and lipid composition of 10 spe-
cies of microalgae used in mariculture. J Exp Mar Biol Ecol. 128(3):219–240.Vorosmarty CJ, McIntyre PB, Gessner MO, Dudgeon D, Prusevich A, Green P, Glidden S, Bunn SE,
Sullivan CA, Liermann CR, et al. 2010. Global threats to human water security and river biodiversity.Nature. 467(7315):555–561.
Wakeham SG. 1995. Lipid biomarkers for heterotrophic alteration of suspended particulate organic matterin oxygenated and anoxic water columns of the ocean. Deep Sea Res Part I. 42(10):1749–1771.
Whipple AA, Viers JH. 2019. Coupling landscapes and river flows to restore highly modified rivers.Water Resour Res. 55:4512–4532.
Willers C, Jansen van Rensburg P, Claassens S. 2015. Phospholipid fatty acid profiling of microbial com-munities–a review of interpretations and recent applications. J Appl Microbiol. 119(5):1207–1218.
Williams DD, Heeg N, Magnusson AK. 2007. Habitat background selection by colonizing intermittentpond invertebrates. Hydrobiologia. 592(1):487–498.
Williamson N, Kobayashi T, Outhet D, Bowling LC. 2018. Survival of cyanobacteria in rivers followingtheir release in water from large headwater reservoirs. Harmful Algae. 75:1–15.
Wolfenden BJ, Wassens SM, Jenkins KM, Baldwin DS, Kobayashi T, Maguire J. 2018. Adaptive manage-ment of return flows: lessons from a case study in environmental water delivery to a floodplain river.Environ Manage. 61(3):481–496.
Xu X, Li W, Fujibayashi M, Nomura M, Sakamaki T, Nishimura O, Li X. 2014. Feedback of threshold viaestimating sources and composition of sedimentary organic matter across trophic gradients in fresh-water lakes. Sci Total Environ. 500-501:373–382.
JOURNAL OF FRESHWATER ECOLOGY 189
Related Documents