Top Banner
The U.S. Nursing Workforce: Trends in Supply and Education Figures from the report available at bhpr.hrsa.gov/healthworkforce/reports/nursingw orkforce/
29

The U.S. Nursing Workforce: Trends in Supply and Education Figures from the report available at bhpr.hrsa.gov/healthworkforce/reports/nursingworkforce

Dec 17, 2015

Download

Documents

Welcome message from author
This document is posted to help you gain knowledge. Please leave a comment to let me know what you think about it! Share it to your friends and learn new things together.
Transcript
Page 1: The U.S. Nursing Workforce: Trends in Supply and Education Figures from the report available at bhpr.hrsa.gov/healthworkforce/reports/nursingworkforce/

The U.S. Nursing Workforce: Trends in Supply and Education

Figures from the report available atbhpr.hrsa.gov/healthworkforce/reports/nursingworkforce/

Page 2: The U.S. Nursing Workforce: Trends in Supply and Education Figures from the report available at bhpr.hrsa.gov/healthworkforce/reports/nursingworkforce/

Figure 2. The per Capita RN Workforce, Ranked by State

IdahoHawaii

CaliforniaNew Mexico

OklahomaAlaska

VirginiaWashington

ColoradoMichigan

South CarolinaArkansas

North CarolinaMaryland

IndianaNew York

West VirginiaNew Hampshire

TennesseeWisconsin

OhioPennsylvaniaNorth DakotaRhode Island

NebraskaSouth Dakota

0 200 400 600 800 1,000 1,200 1,400

Page 3: The U.S. Nursing Workforce: Trends in Supply and Education Figures from the report available at bhpr.hrsa.gov/healthworkforce/reports/nursingworkforce/

Figure 4. The per Capita LPN Workforce, Ranked by State

OregonAlaska

NevadaWashingtonNew Mexico

CaliforniaIllinois

MontanaIdaho

New JerseyVermont

North CarolinaSouth Carolina

KentuckyTexas

ConnecticutFlorida

AlabamaSouth Dakota

VirginiaPennsylvania

OhioMississippiOklahomaTennessee

North Dakota0 50 100 150 200 250 300 350 400 450

Page 4: The U.S. Nursing Workforce: Trends in Supply and Education Figures from the report available at bhpr.hrsa.gov/healthworkforce/reports/nursingworkforce/

Figure 5. Nursing Workforce Distribution in Rural and Urban Areas  

Rural444,688

Rural165,980 Rural

52,153,208

Urban2,379,953

Urban524,058 Urban

254,590,000

0%

20%

40%

60%

80%

100%

RNs LPNs U.S. Population

Page 5: The U.S. Nursing Workforce: Trends in Supply and Education Figures from the report available at bhpr.hrsa.gov/healthworkforce/reports/nursingworkforce/

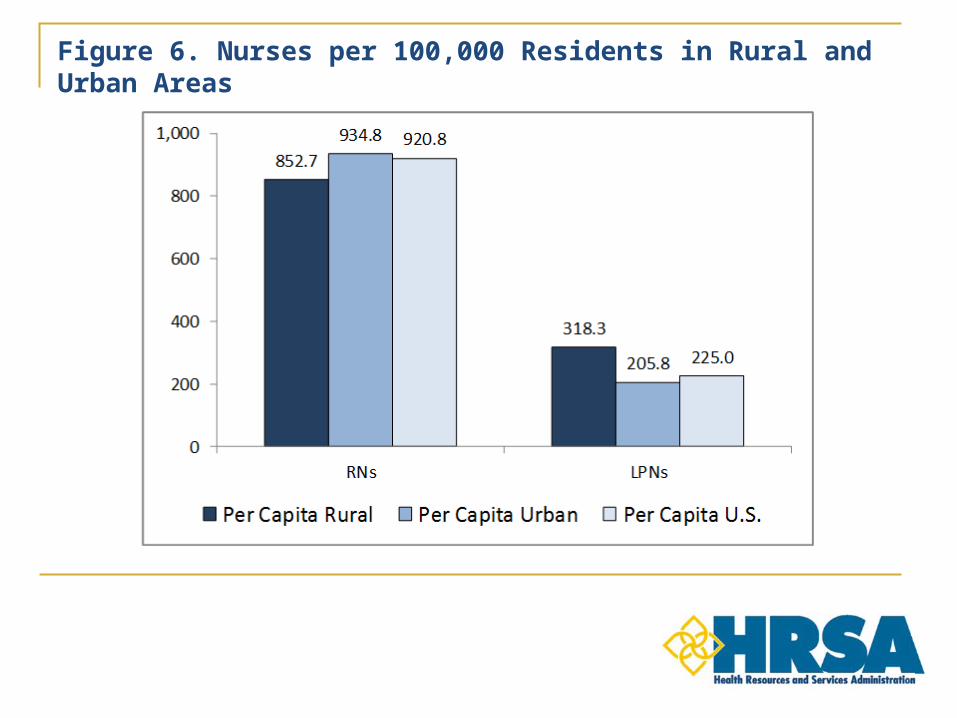
Figure 6. Nurses per 100,000 Residents in Rural and Urban Areas

Page 6: The U.S. Nursing Workforce: Trends in Supply and Education Figures from the report available at bhpr.hrsa.gov/healthworkforce/reports/nursingworkforce/

Figure 7. Growth in the U.S. Nursing Workforce

Page 7: The U.S. Nursing Workforce: Trends in Supply and Education Figures from the report available at bhpr.hrsa.gov/healthworkforce/reports/nursingworkforce/

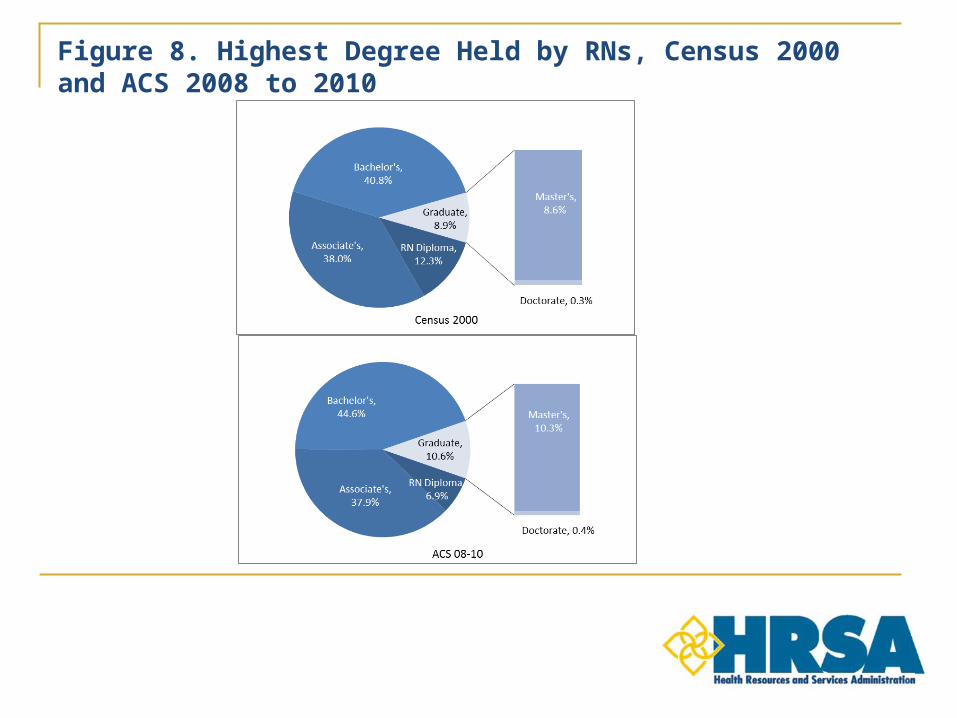
Figure 8. Highest Degree Held by RNs, Census 2000 and ACS 2008 to 2010

Page 8: The U.S. Nursing Workforce: Trends in Supply and Education Figures from the report available at bhpr.hrsa.gov/healthworkforce/reports/nursingworkforce/

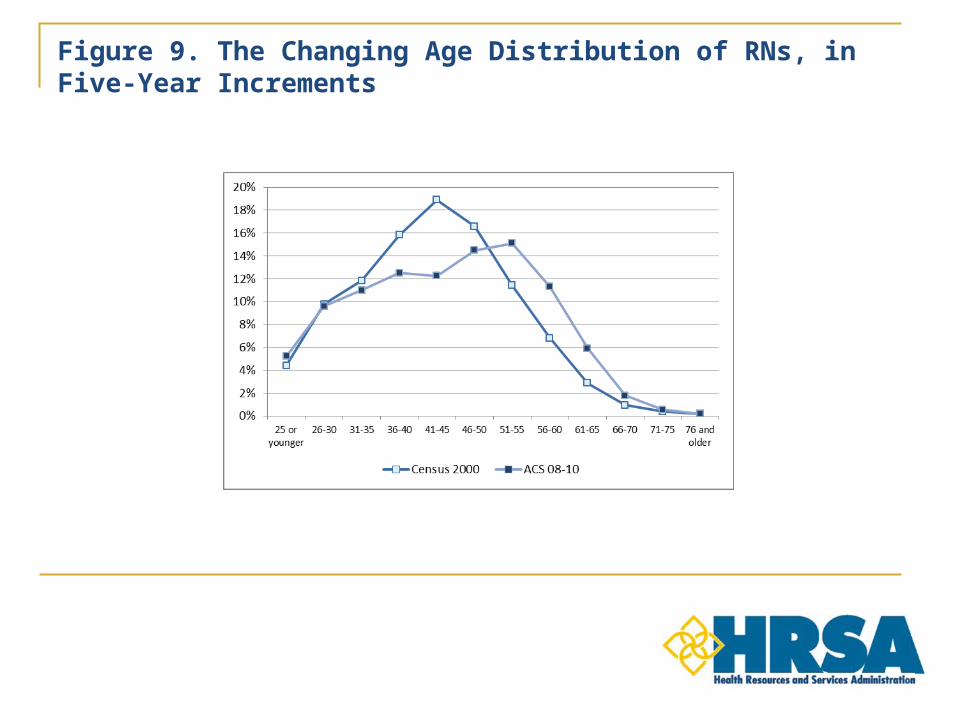
Figure 9. The Changing Age Distribution of RNs, in Five-Year Increments

Page 9: The U.S. Nursing Workforce: Trends in Supply and Education Figures from the report available at bhpr.hrsa.gov/healthworkforce/reports/nursingworkforce/

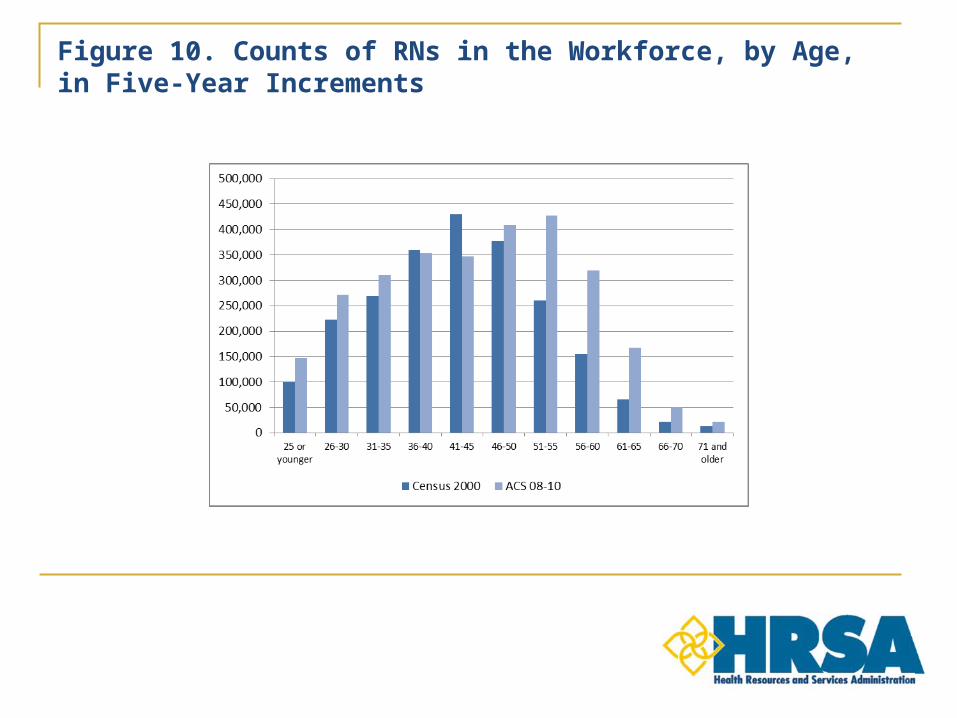
Figure 10. Counts of RNs in the Workforce, by Age, in Five-Year Increments

Page 10: The U.S. Nursing Workforce: Trends in Supply and Education Figures from the report available at bhpr.hrsa.gov/healthworkforce/reports/nursingworkforce/

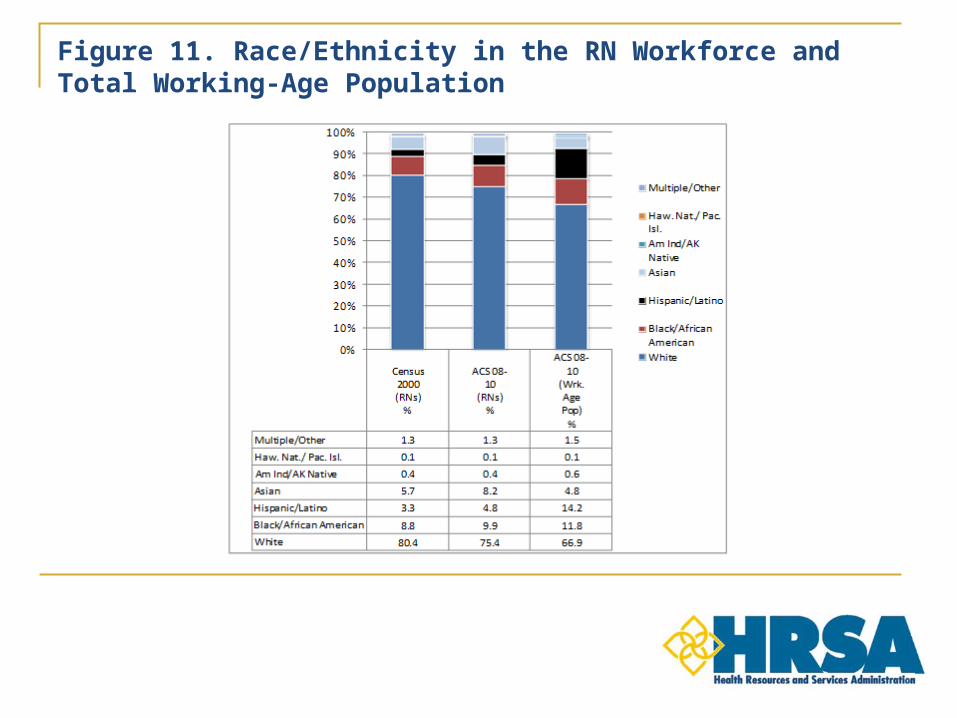
Figure 11. Race/Ethnicity in the RN Workforce and Total Working-Age Population

Page 11: The U.S. Nursing Workforce: Trends in Supply and Education Figures from the report available at bhpr.hrsa.gov/healthworkforce/reports/nursingworkforce/

Figure 12. Changing Age Distribution of LPNs, in Five-Year Increments

Page 12: The U.S. Nursing Workforce: Trends in Supply and Education Figures from the report available at bhpr.hrsa.gov/healthworkforce/reports/nursingworkforce/

Figure 13. Counts of LPNs in the Workforce, by Age, in Five-Year Increments

Page 13: The U.S. Nursing Workforce: Trends in Supply and Education Figures from the report available at bhpr.hrsa.gov/healthworkforce/reports/nursingworkforce/

Figure 14. Race/Ethnicity in the LPN Workforce and Total Working-Age Population

Page 14: The U.S. Nursing Workforce: Trends in Supply and Education Figures from the report available at bhpr.hrsa.gov/healthworkforce/reports/nursingworkforce/

Figure 15. Average Hours Worked by RNs, by Age

Page 15: The U.S. Nursing Workforce: Trends in Supply and Education Figures from the report available at bhpr.hrsa.gov/healthworkforce/reports/nursingworkforce/

Figure 16. Average Hours Worked by LPNs, by Age

Page 16: The U.S. Nursing Workforce: Trends in Supply and Education Figures from the report available at bhpr.hrsa.gov/healthworkforce/reports/nursingworkforce/

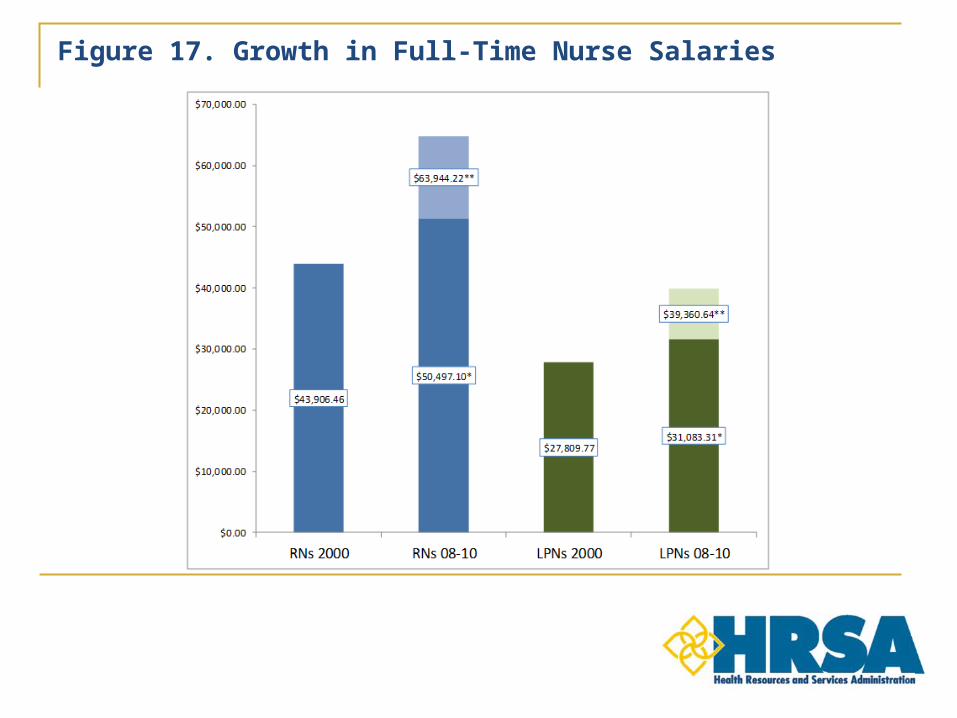
Figure 17. Growth in Full-Time Nurse Salaries

Page 17: The U.S. Nursing Workforce: Trends in Supply and Education Figures from the report available at bhpr.hrsa.gov/healthworkforce/reports/nursingworkforce/

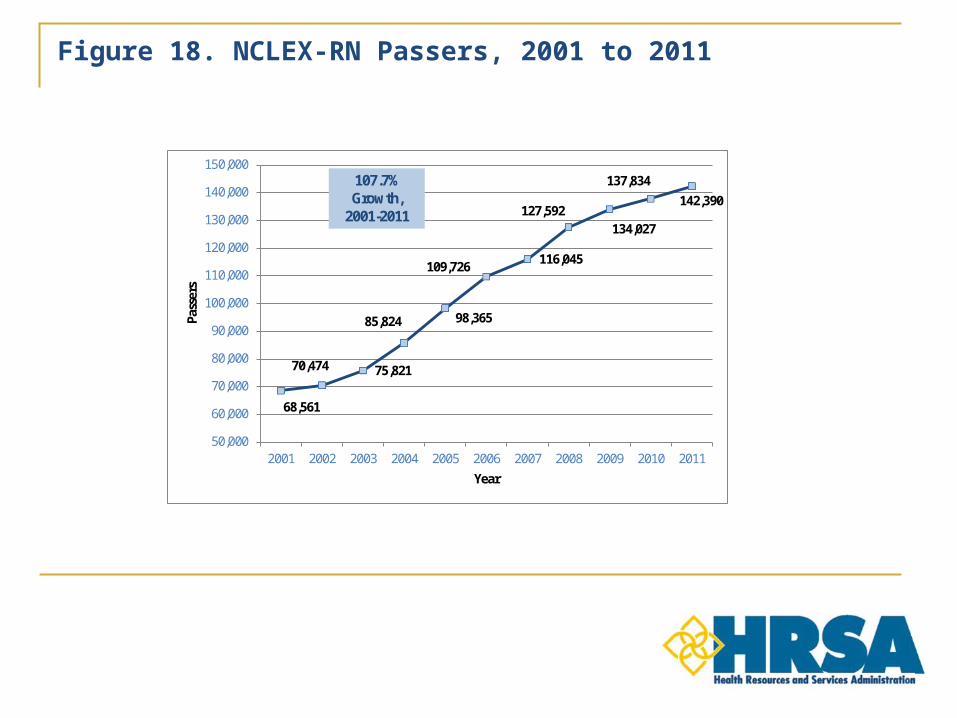
Figure 18. NCLEX-RN Passers, 2001 to 2011

68,561

70,474 75,821

85,824 98,365

109,726 116,045

127,592134,027

137,834142,390

50,000

60,000

70,000

80,000

90,000

100,000

110,000

120,000

130,000

140,000

150,000

2001 2002 2003 2004 2005 2006 2007 2008 2009 2010 2011

Pass

ers

Year

107.7%Growth,

2001-2011

Page 18: The U.S. Nursing Workforce: Trends in Supply and Education Figures from the report available at bhpr.hrsa.gov/healthworkforce/reports/nursingworkforce/

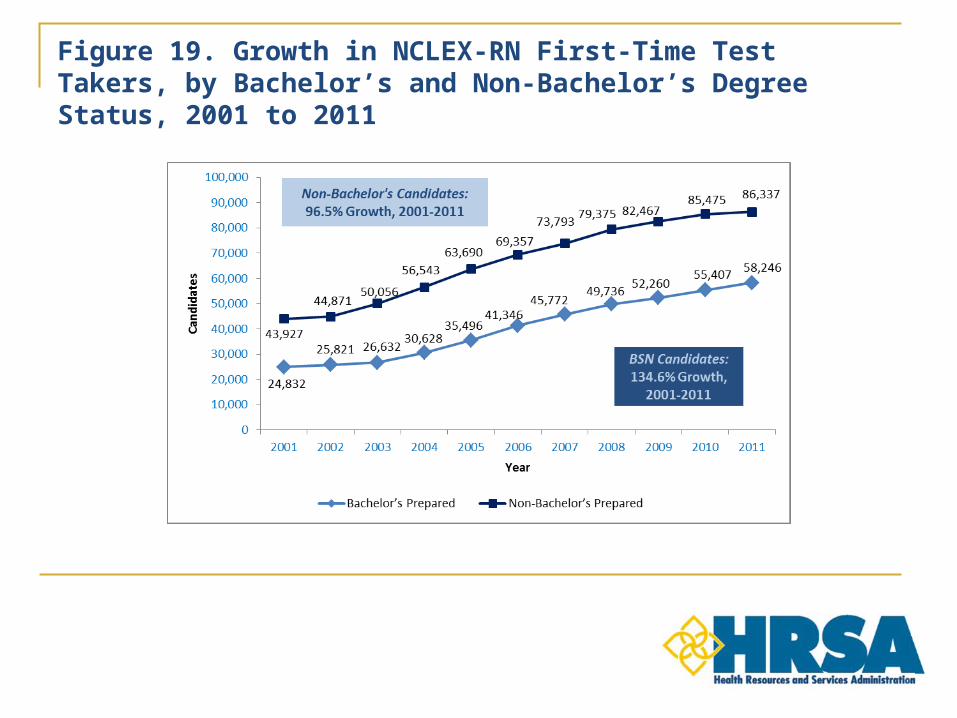
Figure 19. Growth in NCLEX-RN First-Time Test Takers, by Bachelor’s and Non-Bachelor’s Degree Status, 2001 to 2011

Page 19: The U.S. Nursing Workforce: Trends in Supply and Education Figures from the report available at bhpr.hrsa.gov/healthworkforce/reports/nursingworkforce/

Figure 20. Total Number and Percentage of NCLEX-RN First-Time Test Takers, by Bachelor’s and Non-Bachelor’s Degree Status, 2001 vs. 2011

Page 20: The U.S. Nursing Workforce: Trends in Supply and Education Figures from the report available at bhpr.hrsa.gov/healthworkforce/reports/nursingworkforce/

Figure 22. NCLEX-PN Passers, 2001to 2011

Page 21: The U.S. Nursing Workforce: Trends in Supply and Education Figures from the report available at bhpr.hrsa.gov/healthworkforce/reports/nursingworkforce/

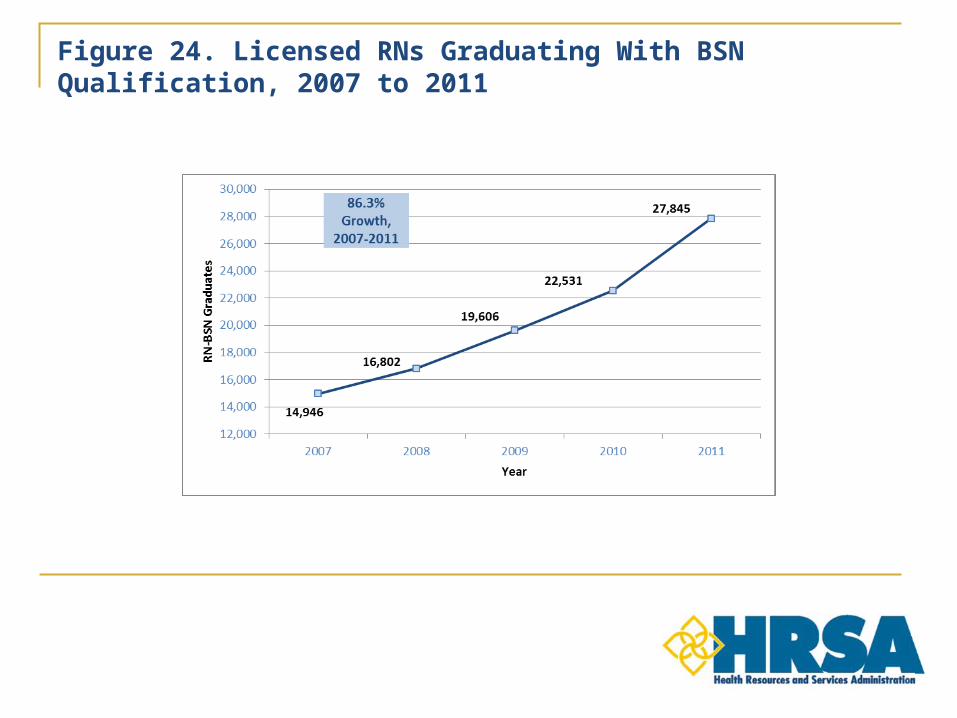
Figure 24. Licensed RNs Graduating With BSN Qualification, 2007 to 2011

Page 22: The U.S. Nursing Workforce: Trends in Supply and Education Figures from the report available at bhpr.hrsa.gov/healthworkforce/reports/nursingworkforce/

Figure 25. Master’s and Doctoral Graduates, 2007 to 2011

Page 23: The U.S. Nursing Workforce: Trends in Supply and Education Figures from the report available at bhpr.hrsa.gov/healthworkforce/reports/nursingworkforce/

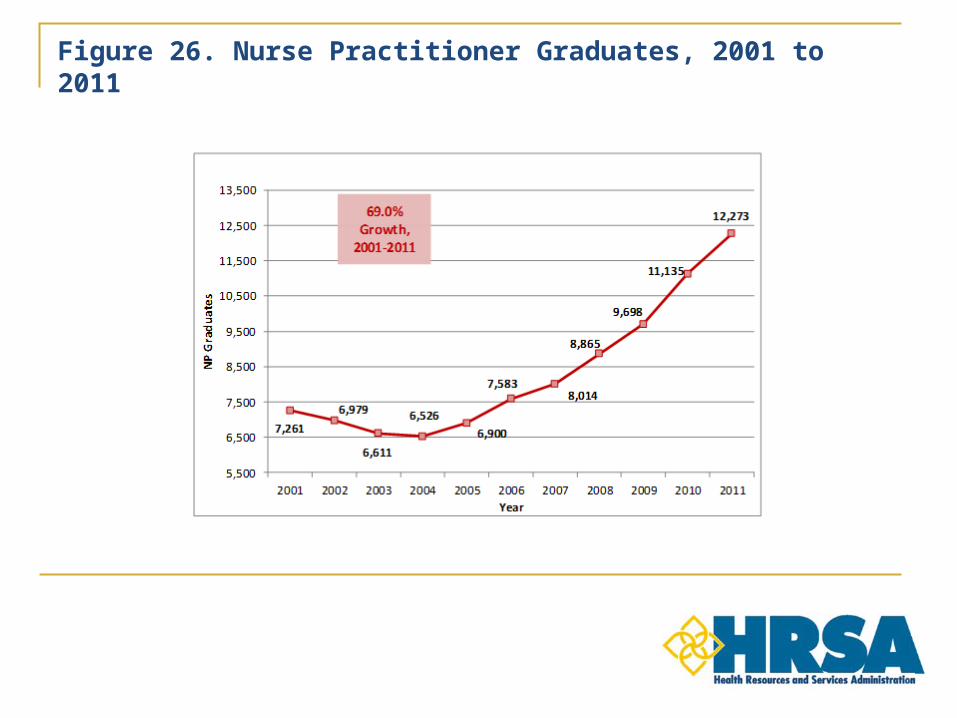
Figure 26. Nurse Practitioner Graduates, 2001 to 2011

Page 24: The U.S. Nursing Workforce: Trends in Supply and Education Figures from the report available at bhpr.hrsa.gov/healthworkforce/reports/nursingworkforce/

Figure 27. Nurse Anesthetist Graduates, 2001 to 2011

Page 25: The U.S. Nursing Workforce: Trends in Supply and Education Figures from the report available at bhpr.hrsa.gov/healthworkforce/reports/nursingworkforce/

Figure 28. Newly Certified Nurse Midwives, 2001 to 2011

Page 26: The U.S. Nursing Workforce: Trends in Supply and Education Figures from the report available at bhpr.hrsa.gov/healthworkforce/reports/nursingworkforce/

Figure 29. Internationally Educated Nurses Passing the NCLEX-RN, 2001 to 2011

Page 27: The U.S. Nursing Workforce: Trends in Supply and Education Figures from the report available at bhpr.hrsa.gov/healthworkforce/reports/nursingworkforce/

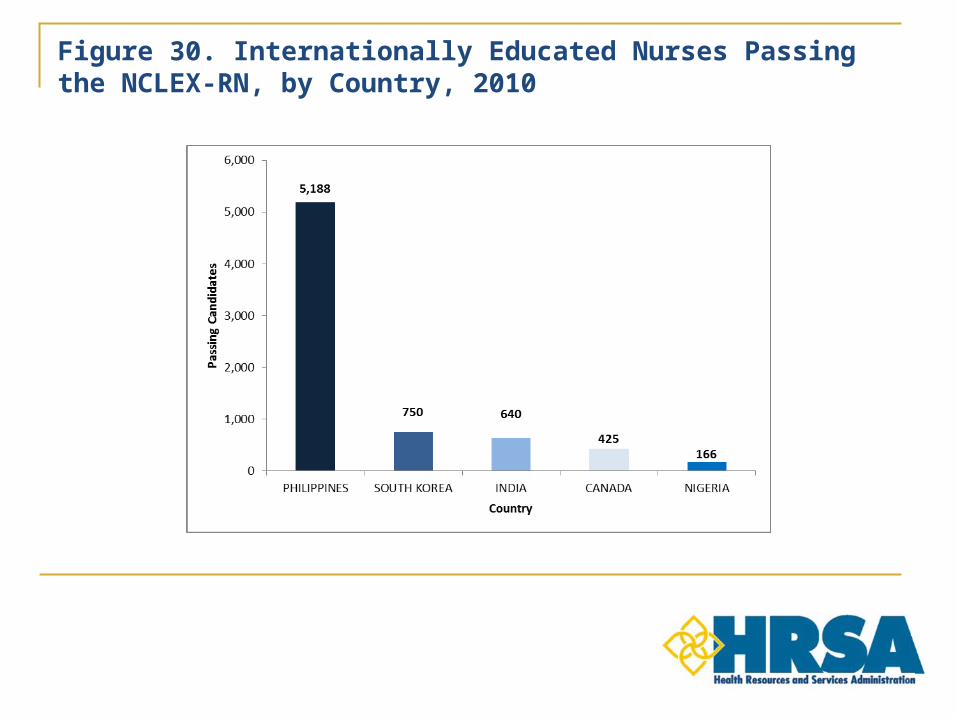
Figure 30. Internationally Educated Nurses Passing the NCLEX-RN, by Country, 2010

Page 28: The U.S. Nursing Workforce: Trends in Supply and Education Figures from the report available at bhpr.hrsa.gov/healthworkforce/reports/nursingworkforce/

Figure 31. Internationally Educated Nurses Passing the NCLEX-PN, 2001 to 2011

Page 29: The U.S. Nursing Workforce: Trends in Supply and Education Figures from the report available at bhpr.hrsa.gov/healthworkforce/reports/nursingworkforce/

Figure 32. Internationally Educated Nurses Passing the NCLEX-PN, by Country, 2010