Issues in International Health Policy July 2011 The U.S. Health System in Perspective: A Comparison of Twelve Industrialized Nations David A. Squires Abstract: The Organization for Economic Cooperation and Development (OECD) tracks and reports on more than 1,200 health system measures across 34 industrialized countries. This analysis concentrated on 2010 OECD health data for Australia, Canada, Denmark, France, Germany, Netherlands, New Zealand, Norway, Sweden, Switzerland, the United Kingdom, and the United States. Health care spending in the U.S. towers over the other countries. The U.S. has fewer hospital beds and physicians, and sees fewer hospital and physician visits, than in most other countries. Prescription drug utilization, prices, and spending all appear to be highest in the U.S., as does the supply, utilization, and price of diagnostic imaging. U.S. per- formance on a limited set of quality measures is variable, ranking highly on five-year cancer survival, middling on in-hospital case-specific mortality, and poorly on hospital admissions for chronic conditions and amputations due to diabetes. Findings suggest opportunities for cross- national learning to improve health system performance. OVERVIEW Findings from cross-national comparisons of health care systems can inform pub- lic policy, highlight areas where nations could improve, and yield benchmarks for high performance. The Organization for Economic Cooperation and Development (OECD) annually tracks and reports on more than 1,200 health system measures across 34 industrialized countries, ranging from population health status and non- medical determinants of health to health care resources and utilization. Since 1998, The Commonwealth Fund has sponsored an analysis of cross-national health systems based on OECD health data to place the performance of the U.S. health system in an international context. This analysis examined 2010 OECD health data for 12 countries (Australia, Canada, Denmark, France, Germany, Netherlands, New Zealand, Norway, Sweden, Switzerland, the United Kingdom, and the United States) as well as data from To learn more about new publications when they become available, visit the Fund's Web site and register to receive e-mail alerts. Commonwealth Fund pub. 1532 Vol. 16 The mission of The Commonwealth Fund is to promote a high performance health care system. The Fund carries out this mandate by supporting independent research on health care issues and making grants to improve health care practice and policy. Support for this research was provided by The Commonwealth Fund. The views presented here are those of the author and should not be attributed to The Commonwealth Fund or its directors, officers, or staff. For more information about this study, please contact: David A. Squires, M.A. Senior Research Associate International Program in Health Policy and Innovation The Commonwealth Fund [email protected]

Welcome message from author
This document is posted to help you gain knowledge. Please leave a comment to let me know what you think about it! Share it to your friends and learn new things together.
Transcript
Issues in International Health PolicyJuly 2011
The U.S. Health System in Perspective: A Comparison of Twelve Industrialized Nations
David A. Squires
Abstract: The Organization for Economic Cooperation and Development (OECD) tracks and reports on more than 1,200 health system measures across 34 industrialized countries. This analysis concentrated on 2010 OECD health data for Australia, Canada, Denmark, France, Germany, Netherlands, New Zealand, Norway, Sweden, Switzerland, the United Kingdom, and the United States. Health care spending in the U.S. towers over the other countries. The U.S. has fewer hospital beds and physicians, and sees fewer hospital and physician visits, than in most other countries. Prescription drug utilization, prices, and spending all appear to be highest in the U.S., as does the supply, utilization, and price of diagnostic imaging. U.S. per-formance on a limited set of quality measures is variable, ranking highly on five-year cancer survival, middling on in-hospital case-specific mortality, and poorly on hospital admissions for chronic conditions and amputations due to diabetes. Findings suggest opportunities for cross-national learning to improve health system performance.
OVERVIEWFindings from cross-national comparisons of health care systems can inform pub-lic policy, highlight areas where nations could improve, and yield benchmarks for high performance. The Organization for Economic Cooperation and Development (OECD) annually tracks and reports on more than 1,200 health system measures across 34 industrialized countries, ranging from population health status and non-medical determinants of health to health care resources and utilization. Since 1998, The Commonwealth Fund has sponsored an analysis of cross-national health systems based on OECD health data to place the performance of the U.S. health system in an international context.
This analysis examined 2010 OECD health data for 12 countries (Australia, Canada, Denmark, France, Germany, Netherlands, New Zealand, Norway, Sweden, Switzerland, the United Kingdom, and the United States) as well as data from
To learn more about new publications when they become available, visit the Fund's Web site and register to receive e-mail alerts.
Commonwealth Fund pub. 1532 Vol. 16
The mission of The Commonwealth Fund is to promote a high performance health care system. The Fund carries out this mandate by supporting independent research on health care issues and making grants to improve health care practice and policy. Support for this research was provided by The Commonwealth Fund. The views presented here are those of the author and should not be attributed to The Commonwealth Fund or its directors, officers, or staff.
For more information about this study, please contact:
David A. Squires, M.A.Senior Research AssociateInternational Program in Health Policy
and InnovationThe Commonwealth [email protected]

2 The Commonwealth Fund
the 2009 OECD Health Care Quality Indicators—an OECD project initiated in 2002 that aims to measure and compare the quality of health service provision across countries. Data on drug utilization and prices, as well as magnetic resonance imaging (MRI) prices, from other sources were also included.
Among the 12 countries, the U.S. differs mark-edly on a number of health system measures.1 Health care spending in the U.S. in 2008 towered over the comparison countries, both per capita and as a percent-age of gross domestic product (GDP). The U.S. had a comparatively low number of hospital beds and physi-cians per capita, and patients in the U.S. had fewer hos-pital and physician visits than in most other countries. However, hospital spending per visit was highest in the U.S. Prescription drug utilization, prices, and spending all appeared highest in the U.S., as did the supply, utili-zation, and price of diagnostic imaging. With regard to quality, U.S. performance on a limited set of measures was variable. Five-year survival rates for patients with three types of cancer were relatively high; the U.S. ranked near the middle on in-hospital, case-specific mortality for three conditions within 30 days of admission. The U.S. also had among the highest rates of hospital admissions for five chronic conditions and the greatest number of lower-extremity amputations due to diabetes. These find-ings suggest that the U.S. health system is not delivering superior results despite being more expensive, indicat-ing opportunities for cross-national learning to improve health system performance.
KEY FINDINGSThe comparative findings from the OECD that follow are for 2008, although data for 2007 and 2006 were used in some instances, as indicated in the exhibits. Where data from those years were not available, no data are presented. The median for all OECD countries is also included in Exhibits 1, 4, and 5; for Exhibits 6, 8, 9, 10, and 11, the median is included for only the coun-tries shown, due to incompleteness of data. All currency amounts are listed in U.S. dollars (USD) and adjusted for national differences in cost of living.
The United States Continues to Outspend All Other Countries on Health Care (Exhibits 1, 2, and 3)
• In 2008, health care spending in the U.S. reached $7,538 per capita—far more than in any other country studied and more than double the OECD median of $2,995. Health care spending in the next-highest spending countries—Norway and Switzerland—was less than two-thirds as much per capita ($5,003 and $4,627, respectively). In all but two of the remaining eight countries, spending per capita was less than half the U.S. figure, and in New Zealand it was close to one-third ($2,683).
• The U.S. spent 16 percent of its GDP on health care. This proportion was nearly double the OECD median (8.7%) and over 40 percent more than the country spending the second-largest share of GDP (France 11.2%).
• From 1998 to 2008, health care spending per capita in the U.S. grew at an annual adjusted rate of 3.4 percent. This rate was slightly below the OECD median (3.9%). Health care spending in several countries, like Norway (0.8%), rose markedly slower, while in others, like the U.K. (4.9%), spending rose markedly faster. Health care spending growth in the U.S. since 1980 has dwarfed that of the other coun-tries, both per capita and as a percentage of GDP (Exhibit 2).
• Breaking down the distribution of health care financ-ing in 2008 by source, the U.S. stood out with far greater private health care spending excluding out-of-pocket payments ($3,119) than the other countries, which rely on government-payer or social insurance models rather than private insurance.2 Out-of-pocket spending was also higher in the U.S. ($912) than in all other countries except Switzerland ($1,424), likely reflecting cost-sharing and coverage gaps.3 Yet even with more than half of total health care spending coming from private sources, per capita public health care spending in the U.S. ($3,507), primarily in Medicare and Medicaid, outstripped public spending in all other countries, except for Norway ($4,213) (Exhibit 3).

The U.S. Health System in Perspective: A Comparison of Twelve Industrialized Nations 3
Exhibit 1. Health Spending in Select OECD Countries, 2008
Total Health Spending
Per capitac Percent GDPAverage annual real growth rate per capita:
1998–2008Australia $3,353a 8.5%a 3.6%a
Canada $4,079e 10.4%e 3.4%e
Denmark $3,540a 9.7%a 3.5%a
France $3,696 11.2% 2.3%Germany $3,737 10.5% 1.8%Netherlands $4,063e 9.9%e 4.1%e
New Zealand $2,683 9.9% 4.4%Norway $5,003e 8.5%e 0.8%e
Sweden $3,470 9.4% 3.9%Switzerland $4,627e 10.7%e 1.9%e
United Kingdom $3,129 8.7% 4.9%United States $7,538 16.0% 3.4%OECD median $2,995 8.7% 3.9%
a 2007. c Adjusted for differences in cost of living. e Estimate. Source: OECD Health Data 2010 (Oct. 2010).
Note: PPP = purchasing power parity—an estimate of the exchange rate required to equalize the purchasing power of different currencies, given the prices of goods and services in the countries concerned.Source: OECD Health Data 2010 (Oct. 2010).
Exhibit 2. International Comparison of Spending on Health, 1980–2008
Average spending on healthper capita ($US PPP)
Total expenditures on healthas percent of GDP
0
1000
2000
3000
4000
5000
6000
7000
8000
1980
1981
1982
1983
1984
1985
1986
1987
1988
1989
1990
1991
1992
1993
1994
1995
1996
1997
1998
1999
2000
2001
2002
2003
2004
2005
2006
2007
2008
USNORSWIZCANNETHGERFRDENSWEAUSUKNZ
0
2
4
6
8
10
12
14
16
1980
1981
1982
1983
1984
1985
1986
1987
1988
1989
1990
1991
1992
1993
1994
1995
1996
1997
1998
1999
2000
2001
2002
2003
2004
2005
2006
2007
2008
USFRSWIZGERCANNETHNZDENSWEUKNORAUS

4 The Commonwealth Fund
Relatively Few Physicians and Physician Visits in the United States (Exhibit 4)
• In 2008, the U.S. had the fewest practicing physi-cians per 1,000 population (2.43) among the 10 countries where data were available, and was below the OECD median (3.00).
• There were four doctor consultations per capita in the U.S., which was tied with Switzerland for the sec-ond-fewest among the 12 countries, and well below the OECD median (6.4 per capita). Only Sweden had fewer consultations (2.9); Germany had nealry twice as many (7.8).
Hospital Admission Rates Lower and Stays Shorter in the U.S., but Higher Spending per Discharge (Exhibits 4 and 5)
• In 2008, the supply of acute-care hospital beds in the U.S. (2.7 per 1,000 population) was below the OECD median (3.3 per 1,000 population). Only New Zealand (2.2) and Norway (2.7) had fewer beds
per 1,000, while Germany stood out with the most beds (5.7 per 1,000 population).
• The average length of stay for acute care in the U.S. was 5.5 days, which was shorter than six countries and the OECD median, but longer than Sweden (4.5 days), Norway (4.8 days), and France (5.2 days). Since 1980, average length of stay has notably decreased in all countries where data is available, including the U.S. which has historically had among the shortest stays (data not shown).
• Most countries had more hospital discharges than the U.S. (130 per 1,000 population), which was below the OECD median (161 per 1,000 population).
• Although hospital stays were relatively infrequent and short in the U.S., hospital spending per discharge far exceeded all other countries at $16,708—nearly triple the OECD median of $5,949. The country with the second-highest spending, Canada, spent only 75 percent as much per discharge ($12,669), and in both Germany and France, hospital stays were
*2007.Source: OECD Health Data 2010 (Oct. 2010).
Exhibit 3. Health Care Expenditure per Capita by Source of Funding, 2008Adjusted for Differences in Cost of Living
Dollars
3,5074,213
2,736 2,863 2,869 2,875 2,8412,263
2,5852,158
3,119
467616 548
756
600
489 543
2,991
382
154
8660
484197
35487
912
372
273
347
1,424
605
0
1,000
2,000
3,000
4,000
5,000
6,000
7,000
8,000
US NOR SWIZ CAN GER FR DEN* SWE AUS* UK NZ
Out-of-pocket spending
Private spending
Public spending
7,538
5,0034,627
4,0793,737 3,696 3,540 3,470 3,353
3,1292,683

The U.S. Health System in Perspective: A Comparison of Twelve Industrialized Nations 5
Exhibit 4. Supply and Utilization of Doctors and Hospitals in Select OECD Countries, 2008
Physician Supply and Use Hospital Supply, Use, and SpendingPracticing
physicians per 1,000 pop.
Doctor consultations
per capita
Acute care hospital beds
per 1,000 pop.
Average length of stay for acute care
(days)
Hospital discharges
per 1,000 pop.Australia 2.97a 6.4 3.5b 5.9b 163a
Canada —f 5.7a 2.7a 7.5a 84a
Denmark 3.42a 8.9 3.0 —f 159France —f 6.9 3.5 5.2 264Germany 3.56 7.8 5.7 7.6 232
Netherlands —f 5.9 2.9 5.9 113New Zealand 2.46 4.3a 2.2 —f 140Norway 4.01 —f 2.5 4.8 172Sweden 3.58b 2.9 —f 4.5a 165a
Switzerland 3.82 4.0a 3.3 7.7 169United Kingdom 2.61 5.9 2.7 7.1 136United States 2.43 4.0a 2.7a 5.5 130b
OECD median 3.00 6.4 3.3 6.0 161
a 2007. b 2006. f Data not available. Source: OECD Health Data 2010 (Oct. 2010).
* 2007. ** 2006.Source: OECD Health Data 2010 (Oct. 2010).
Exhibit 5. Hospital Spending per Discharge, 2008Adjusted for Differences in Cost of Living
Dollars
4,5664,762
5,949
7,1747,729
9,0649,1189,2309,422
12,20012,669
16,708
0
2,000
4,000
6,000
8,000
10,000
12,000
14,000
16,000
18,000
US** CAN* NETH SWIZ* DEN* NOR** SWE* AUS* NZ OECDMedian
FR GER

6 The Commonwealth Fund
nearly one-quarter as expensive ($4,566 and $4,762, respectively) (Exhibit 5).
The U.S. Has the Highest Drug Utilization, Prices, and Spending (Exhibits 6 and 7)
• According to The Commonwealth Fund 2010 International Health Policy Survey in 11 Countries, adults in the U.S. were the most likely to take at least one prescription drug regularly (61%) and to take at least four prescription drugs regularly (25%).4 Switzerland had the lowest drug utilization. Compared with the U.S., only two-thirds as many Swiss adults were taking a regular prescription (40%) and only two-fifths were taking at least four prescrip-tions (10%).
• An analysis by Gerard Anderson of data from IMS Health found that 2006–07 prices for the 30 most-commonly prescribed drugs were highest in the U.S.,
with drugs in Canada second-most expensive (0.77 relative to 1.00 price level in the U.S.).5 Of the seven other countries for which data were available, four had price levels that were less than half the U.S. level (Exhibit 7).6
• Not surprising, given the higher rates of utilization and higher prices, spending in 2008 on pharmaceu-ticals was highest in the U.S. among the 12 coun-tries, at $897 per capita (data not shown). A 2008 analysis of OECD data conducted by consulting firm McKinsey found that the U.S. annually spends $98 billion more on pharmaceuticals than would be expected based on per-capita income relative to other wealthy countries, and that this higher spending is due both to higher prices and a more expensive drug mix.7
• Pharmaceutical spending per capita in the U.S. also increased at the highest average annual real growth
Exhibit 6. Supply, Use, and Price of Pharmaceuticals in Select OECD Countries
Pharmaceutical Use, 2010g Pharmaceutical Spending
% adults taking at least one prescription
regularly
% adults taking at least four
prescriptions regularlyPer capita,
2008c
% total health spending,
2008
Average annual real growth rate per capita: 1998–2008
Australia 54% 18% $480a 14.3%a 4.9%a
Canada 56% 17% $701e 17.2%e 4.6%e
Denmark —f —f $303a 8.6%a 2.9%a
France 45% 17% $607 16.4% 3.0%Germany 54% 12% $563 15.1% 2.9%Netherlands 56% 15% —f —f —f
New Zealand 55% 18% $257 9.6% 0.8%a
Norway 54% 14% $381e 7.6%e –0.8%e
Sweden 50% 17% $457 13.2% 3.5%Switzerland 40% 10% $461a 10.3%a 2.0%a
United Kingdom 52% 13% $368 11.8% 2.3%a
United States 61% 25% $897 11.9% 5.3%Median (countries shown) 54% 17% $461 11.9% 3.5%
a 2007. c Adjusted for differences in cost of living. e Estimate. f Data not available. g Source: Commonwealth Fund 2010 International Health Policy Survey of Eleven Countries. Source: OECD Health Data 2010 (Oct. 2010), unless otherwise specified.

The U.S. Health System in Perspective: A Comparison of Twelve Industrialized Nations 7
rate of 5.3 percent between 1998 and 2008, com-pared with growth of less than 1 percent in New Zealand (0.8%) and negative growth in Norway (–0.8%) (data not shown).
• Despite having the highest per capita spending on pharmaceuticals as a percentage of total health care spending, the U.S. (11.9%) ranked near the middle of the other countries included in the analysis, reflecting the higher cost of the U.S. system as a whole (data not shown).
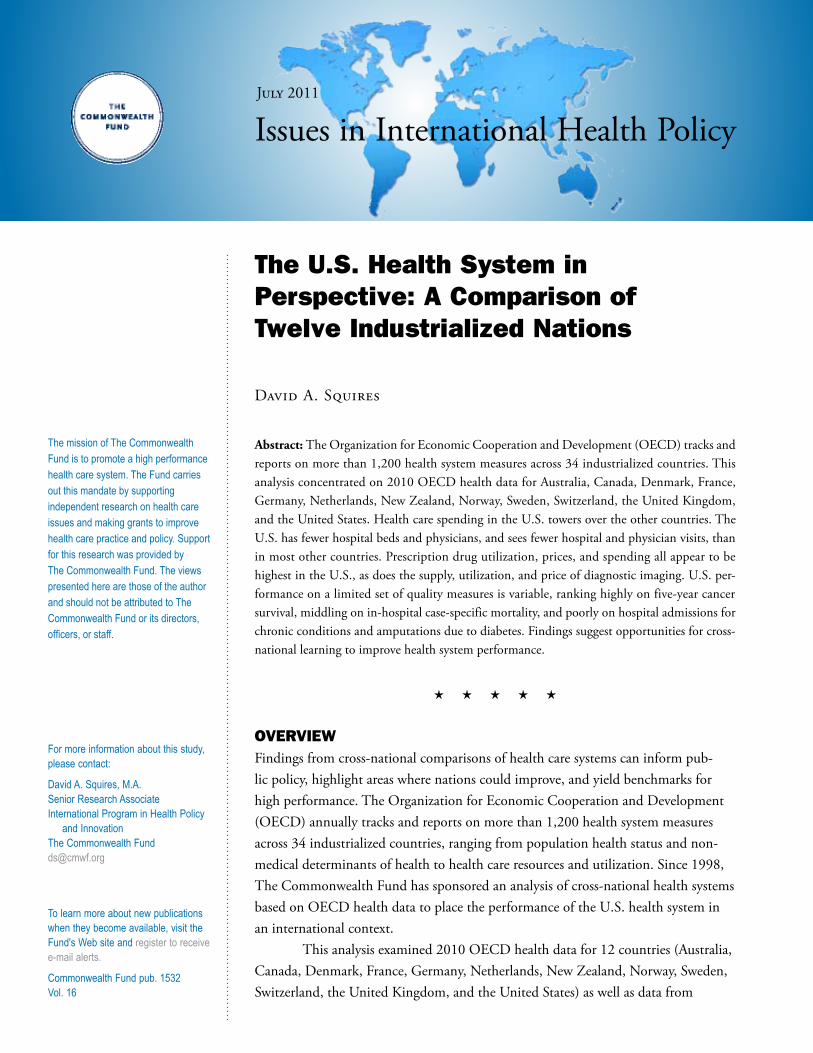
Wide Proliferation of Diagnostic Imaging at High Prices (Exhibit 8)
• The U.S. had a large supply of diagnostic imaging machines in 2008 compared with the other countries for which data were available. Computerized tomog-raphy (CT) scanners were prevalent in the U.S. (34.3 per million population) compared with other coun-tries, with only Australia (56.0 per million popula-tion) having more. The U.S. also had the most MRI machines (25.9 per million population) of any of the six countries where data was available.
• Use of diagnostic imaging in 2008 was highest in the U.S., with more CT and MRI exams per-formed—228 and 91 per 100,000 population, respectively—than in any of the six countries where data was available.
• According to an analysis by the International Federation of Health Plans, MRI scan and imag-ing fees in 2009 were highest in the U.S. ($1,200) among the six countries for which data was available.8
The U.S. Sees More Hospital Admissions for Chronic Conditions (Exhibit 9)
• Of five chronic conditions, the U.S. had the highest hospital admissions rates for three in 2007: asthma (120 per 100,000 population), congestive heart failure (441 per 100,000 population), and diabetes acute complications (57 per 100,000 population). The U.S. had the fifth-highest rate of admissions for chronic obstructive pulmonary disease among 11 countries (203 per 100,000 population), and the sixth-highest rate of admission for hypertension among 10 countries (49 per 100,000 population).
Source: IMS Health.
Exhibit 7. Drug Prices for 30 Most Commonly Prescribed Drugs, 2006–07U.S. is set at 1.0
0.34
0.440.450.490.51
0.63
0.760.77
1.00
0.0
0.2
0.4
0.6
0.8
1.0
US CAN GER SWIZ UK AUS NETH FR NZ
8 The Commonwealth Fund
• Lower-extremity amputations due to diabetes were performed at a rate of 36 per 100,000 population among adults age 15 and older in the U.S— the highest rate among these countries.
Variable Rates of Five-Year Cancer Survival and Cancer Mortality in the U.S. (Exhibit 10)
• From 2002 to 2007, the five-year survival rate for three cancers in the U.S. was relatively high among the eight countries reporting though the ranking varied by condition. For breast cancer, the five-year survival rate in the U.S. was 90.5 percent, the high-est among the eight countries reporting and 12 percentage points higher than the lowest performer (the U.K. at 78.5%). The five-year survival rate for colorectal cancer was also highest in the U.S. at 65.5%, which was nearly 14 percentage points higher than the lowest performer (the U.K. at 51.6%). On cervical cancer, the U.S. (67.0%) ranked fourth out
of eight countries reporting, behind New Zealand (67.7%), the Netherlands (69.0%), and Canada (71.9%).
• The U.S. had middling-to-low rates of mortality due to cervical cancer (2.1 per 100,000 population), breast cancer (20.7 per 100,000 population), and colorectal cancer (14.4 per 100,000 population). Of the nine countries for which data were available, only the U.S. and France had mortality rates below the median for all three types of cancer.
Variable Rates of In-Hospital Case-Fatality in the U.S. (Exhibit 11)
• Rates of in-hospital case-fatality—that is, the ratio of in-hospital deaths among people admitted with a particular condition—within 30 days of admission for three conditions was available for eight countries. For acute myocardial infarction, the U.S. had the
Exhibit 8. Supply, Use, and Price of Diagnostic Imaging in Select OECD Countries
MRI Machines CT ScannersDevices per million pop.,
2008
Exams per 100,000 pop.,
2008
MRI scan and imaging fees,
2009g
Devices per million pop.,
2008
Exams per 100,000 pop.,
2008Australia 5.6 21d —f 56.0b,e 94d
Canada 6.7a 42 $824 12.7a 122Denmark —f 38 —f 21.5 84France —f 49 $436 —f 130Germany —f —f $839 —f —f
Netherlands 10.4 39 $567 10.3 60New Zealand 9.6 —f —f 12.4 —f
Switzerland —f —f —f 32.0 —f
United Kingdom 6.9 —f $179 10.2 —f
United States 25.9a 91a $1,200 34.3a 228a
Median (countries shown) 8.3 40 $696 17.1 108
Note: Data on CT scanners and MRI units do not include those outside hospitals in Germany and only for a small number in France. For the United Kingdom, the data refer only to scanners in the public sector. For Australia, the number of MRI units includes only those eligible for reimbursement under Medicare, the universal public health system; in 1999, 60% of total MRI units were eligible for Medicare reimbursement. Also for Australia and France, data for CT and MRI exams refer only to utilization by out-patients and private in-patients (excluding those in public hospitals). Data not available for Norway or Sweden. a 2007. b 2006. d Difference in methodology. e Estimate. f Data not available. g Source: International Federation of Health Plans, 2009 Comparative Price Report. Source: OECD Health Data 2010 (Oct. 2010), unless otherwise specified.

The U.S. Health System in Perspective: A Comparison of Twelve Industrialized Nations 9
third-highest fatality rate (5.1 per 100 patients), and for hemorrhagic stroke, the second-highest fatality rate (25.5 per 100 patients). For ischemic stroke, the U.S. had the fourth-lowest fatality rate (4.2 per 100 patients). Denmark (acute myocardial infarction: 2.9 per 100 patients; hemorrhagic stroke: 16.7 per 100 patients; ischemic stroke: 3.1 per 100 patients) and Sweden (acute myocardial infarction: 2.9 per 100 patients; hemorrhagic stroke: 12.8 per 100 patients; ischemic stroke: 3.9 per 100 patients) had the lowest fatality rates for all three conditions.
WHAT IS DRIVING HIGHER HEALTH CARE SPENDING IN THE U.S.? Spending on health care in the U.S. in 2008 far exceeded that seen in other countries. In both dollar figures and as a percentage of GDP, no country came within 70 percent of U.S. spending ($7,538 per capita, 16% GDP). This higher spending does not seem to simply reflect higher income. In Norway, the only country studied with higher per capita income than the U.S., health care spending accounted for only 8.5% of GDP.
Although much higher health care spending marks the U.S. as an outlier, containing spending growth is a shared challenge among these 12 countries. From 1998 to 2008, all countries experienced a rate of growth that exceeded inflation, with growth expected to continue. A recent analysis from the Centers for Medicare and
Exhibit 9. Hospital Admissions for Chronic Diseases and Diabetes Amputations in Select OECD Countries, 2007
Hospital Admissions for Chronic Diseases per 100,000 Population,
Age 15 and OlderDiabetes lower
extremity amputations per 100,000
population, age 15 and olderAsthma
Chronic obstructive pulmonary
diseaseCongestive heart failure Hypertension
Diabetes acute
complications
Canada 18 190 146 15 23 11Denmark 43 320 165 85 20 21France 43 79 276 —e —e 13Germany 21 184 352 213 14 —e
Netherlands 26b 154b 171b,d 19b 8b 11b
New Zealand 73 308 206 16 1 12Norway 42 243 188 70 20 11Sweden 25 192 289 61 19 12Switzerland 32a 100a 155a 55a 12a 16a
United Kingdom 76 236 117 11 32 9United States 120a,c 203a,c 441a,c 49a,c 57a,c 36a,c
Median (countries shown) 42 192 188 52 19.5 12
Age-sex standardized rates. Data not available for Australia. a 2006. b 2005. c U.S. does not fully exclude day cases. d Netherlands includes admissions for additional diagnosis codes, which marginally elevates rates. e Data not available. Source: OECD Health Care Quality Indicators Data 2009.

10 The Commonwealth Fund
Exhibit 10. Five-Year Survival and Mortality Rates for Cervical, Breast, and Colorectal Cancer in Select OECD Countries
Cancer Five-Year Relative Survival Rate (%), 2002–07
Cancer Mortality Rates per 100,000 Pop., 2007
Cervical cancer (females only)
Breast cancer (females only)
Colorectal cancer
Cervical cancer (females only)
Breast cancer (females only)
Colon cancer
Canada 71.9e 87.1 60.7e —g —g —g
Denmark 61.3 82.4 54.4 2.6a 28.6a 25.3a
France —g —g 57.1f 1.5 22.0 16.0Netherlands 69.0d 85.2 58.1d 2.0a 24.0a 24.1a
New Zealand 67.7 82.1 60.9 1.7 25.3 20.8Norway 65.9d 81.9 57.8d 2.7 17.9 21.8Sweden 65.8c 86.1 59.8c 2.3 18.3 16.9United Kingdom 59.4 78.5 51.6 2.2 24.4 17.1United States 67.0e 90.5 65.5e 2.1b 20.7b 14.4b
Median (countries shown) 66.5 83.8 58.1 2.2 23.0 19.0
Age standardized rates (%). No data available for Australia, Germany, or Switzerland. a 2006. b 2005. c 2003–08. d 2001–06. e 2000–05. f 1997–02. g Data not available. Source: OECD Health Data 2010 (Oct. 2010) and OECD Health Care Quality Indicators Data 2009.
Exhibit 11. Rates of In-Hospital Case-Fatality Within 30 Days of Admission in Select OECD Countries
In-Hospital Case-Fatality Within 30 Days of Admission per 100 Patients, 2007
Acute myocardial infarction Hemorrhagic stroke Ischemic strokeCanada 4.2 23.2 7.6Denmark 2.9 16.7 3.1Netherlands 6.6b 25.2b 5.6b
New Zealand 3.3 23.8 6.3Norway 3.2 13.7 3.3Sweden 2.9 12.8 3.9United Kingdom 6.3 26.3 9.0United States 5.1a 25.5a 4.2a
Median (countries shown) 3.8 23.5 4.9
Note: Figures do not account for death that occurs outside of the hospital, possibly influencing the ranking for countries, such as the U.S., that have shorter lengths of stay. Medicare data is available on 30-day mortality in the U.S., but this is not currently available from private insurers. Age-sex standardized rates (%). No data available for Australia, France, Germany, or Switzerland. a 2006. b 2005. Source: OECD Health Care Quality Indicators Data 2009.

The U.S. Health System in Perspective: A Comparison of Twelve Industrialized Nations 11
Medicaid Services projects U.S. national health expendi-ture to grow at a rate of 6.1 percent from 2009 to 2019.9
There are many forces driving health care spend-ing. An annual series of Commonwealth Fund-sponsored analyses of OECD health data dating back to 1999 has explored a number of potential factors, including: admin-istrative complexity, the aging of the population, the practice of “defensive medicine” under threat of malprac-tice litigation, chronic disease burden, health care supply and utilization rates, access to care, resource allocation, and the use of technologically advanced equipment and procedures.10 These and other studies have found, con-trary to often-cited explanations, the U.S. has a relatively young population, average or below-average rates of chronic conditions, and comparatively few doctor visits and hospitalizations compared with other industrialized countries.11 Instead, these studies suggest major reasons for higher spending include substantially higher prices and more fragmented care delivery that leads to duplica-tion of resources and extensive use of poorly coordinated specialists.
Because of their uniformity, pharmaceuticals allow for a relatively direct comparison across countries. This analysis finds the U.S. to be highest among 12 countries on drug utilization, prices, and spending. In strong con-trast, New Zealand stands out with the lowest per capita spending on pharmaceuticals—only 29 percent of what the U.S. spends—with almost no real growth in this fig-ure over the past 10 years. The difference does not seem to stem from lower utilization. New Zealand adults on average consume the second-most prescriptions among the 12 countries, although they may take a less expen-sive mix of drugs. Rather, the spending divergence likely appears to be largely because of pricing. The 30 most-commonly prescribed drugs were three times cheaper in New Zealand than in the U.S. New Zealand’s success suggests possible policy lessons for the U.S., including nationally negotiated rates, reference pricing, and com-parative cost-effectiveness review for new medications. These policies are already widely employed among other countries.12
Despite much higher spending, U.S. performance in terms of quality is variable relative to other countries. While cancer care in the U.S. seems to be of particularly high quality based on five-year survival rates, the high rates of hospital admissions for chronic diseases sug-gest opportunities for improvement. These results echo previous comparative studies that find the U.S. to have middling or highly uneven quality. A 2010 cross-national study conducted by The Commonwealth Fund ranked the U.S. sixth of seven countries in terms of quality, with average performance on effectiveness and patient-cen-teredness and low performance on safety and coordina-tion.13 With chronic disease on the rise amidst an aging demographic and accounting for ever more health care spending, more effective treatment and management in primary care settings may have the potential to simulta-neously improve patient care while preventing the unnec-essary use of scarce and expensive resources.14

12 The Commonwealth Fund
Notes
1 Organization for Economic Cooperation and Development, OECD Health Data 2009 (Paris: OECD, Nov. 2009); Organization for Economic Cooperation and Development, OECD Health Care Quality Indicators Data 2009 (Paris: OECD, Nov. 2009).
2 In the Netherlands, Switzerland, and Germany, residents receive their insurance through competing insurers, but the market and industry is regulated and subsidized to such a degree that the OECD considers these public.
3 C. Schoen, R. Osborn, D. Squires, M. M. Doty, R. Pierson, and S. Applebaum, “How Health Insurance Design Affects Access to Care and Costs, by Income, in Eleven Countries,” Health Affairs, Dec. 2010 29(12):2323–34.
4 2010 Commonwealth Fund International Health Policy Survey.
5 IMS Health, analysis by Gerard Anderson.6 These findings align with previous research findings
that the U.S. has, on average, higher drug prices than other industrialized countries. See P. M. Danzon and M. F. Furukawa, “International Prices and Availability of Pharmaceuticals in 2005,” Health Affairs, Jan. 2008 27(1):221–33.
7 McKinsey Global Institute, “Accounting for the Cost of Health Care in the United States” (McKinsey and Company, 2008).
8 International Federation of Health Plans, “2009 Comparative Price Report: Medical and Hospital Fees by Country,” Presented at International Federation of Health Plans council meeting (Preignac, France, September 2–4, 2009).
9 A. M. Sisko1, C. J. Truffer, S. P. Keehan et al., “National Health Spending Projections: The Estimated Impact of Reform Through 2019,” Health Affairs, Oct. 2010 29(10):1933–41.
10 G. F. Anderson and D. Squires, Measuring the U.S. Health Care System: A Cross-National Comparison, (New York: The Commonwealth Fund, June 2010); G. F. Anderson, B. K. Frogner, and U. E. Reinhardt, “Health Spending in OECD Countries in 2004: An Update,” Health Affairs, Sept./Oct. 2007 26(5):1481–89; G. F. Anderson, P. S. Hussey, B. K. Frogner et al., “Health Spending in the United States and the Rest of the Industrialized World,” Health Affairs, July/Aug. 2005 24(4):903–14; U. E. Reinhardt, P. S. Hussey, and G. F. Anderson, “U.S. Health Care Spending in an International Context,” Health Affairs, May/June 2004 23(3):10–25; G. F. Anderson, U. E. Reinhardt, P. S. Hussey et al., “It’s the Prices, Stupid: Why the United States Is So Different from Other Countries,” Health Affairs, May/June 2003, 22(3):89–105; U. E. Reinhardt, P. S. Hussey, and G. F. Anderson, “Cross-National Comparisons of Health Systems Using OECD Data, 1999,” Health Affairs, May/June 2002 21(3):169–81; G. F. Anderson and P. S. Hussey, “Comparing Health System Performance in OECD Countries,” Health Affairs, May/June 2001 20(3):219–32; G. F. Anderson, J. Hurst, P. S. Hussey et al., “Health Spending and Outcomes: Trends in OECD Countries, 1960–1998,” Health Affairs, May/June 2000 19(3):150–57; and G. F. Anderson and J. P. Poullier, “Health Spending, Access, and Outcomes: Trends in Industrialized Countries,” Health Affairs, May/June 1999 18(3):178–92.
11 P. A. Muennig and S. A. Glied, “What Changes in Survival Rates Tell Us About U.S. Health Care,” Health Affairs, Nov. 2010 29(11):2105–13.
12 S. Morgan and J. Kennedy, Prescription Drug Accessibility and Affordability in the United States and Abroad (New York: The Commonwealth Fund, June 2010).
13 K. Davis, C. Schoen, and K. Stremikis, Mirror, Mirror on the Wall: How the Performance of the U.S. Health Care System Compares Internationally: 2010 Update (New York: The Commonwealth Fund, June 2010).
14 H. J. Jiang, C. A. Russo, and M. L. Barrett, Nationwide Frequency and Costs of Potentially Preventable Hospitalizations, 2006, Healthcare Cost and Utilization Project Statistical Brief #72 (Rockville, Md.: Agency for Healthcare Research and Quality, April 2009).
The U.S. Health System in Perspective: A Comparison of Twelve Industrialized Nations 13
About the Author
David A. Squires, M.A., is senior research associate for the International Program in Health Policy and Practice at The Commonwealth Fund. He is responsible for research support for the Fund’s annual international health policy surveys; researching and tracking health care policy developments in industrialized countries; preparing presentations; monitoring the research projects of the current class of Harkness Fellows; and tracking the impact of the fellows’ proj-ects and publications on U.S. and home country policy. Squires joined the Fund in September 2008, having worked for Abt Associates, Inc., as associate analyst in domestic health for the previous two years. Squires graduated magna cum laude with a B.A. in English and minors in economics and philosophy from Bates College. He holds a master’s degree in bioethics from New York University.
Acknowledgments
The author would like to acknowledge Robin Osborn, Cathy Schoen, Gerard Anderson, and Lihan Wei for their con-tributions to this brief.
Editorial support was provided by Deborah Lorber.

Related Documents