THE UNIVERSITY OF CHICAGO Analysis and Automatic Recognition of Tones in Mandarin Chinese A DISSERTATION SUBMITTED TO THE FACULTY OF THE DIVISION OF THE PHYSICAL SCIENCES IN CANDIDACY FOR THE DEGREE OF DOCTOR OF PHILOSOPHY DEPARTMENT OF COMPUTER SCIENCE BY DINOJ SURENDRAN CHICAGO, ILLINOIS SEPTEMBER 27, 2007

Welcome message from author
This document is posted to help you gain knowledge. Please leave a comment to let me know what you think about it! Share it to your friends and learn new things together.
Transcript

THE UNIVERSITY OF CHICAGO
Analysis and Automatic Recognition of Tones in Mandarin Chinese
A DISSERTATION SUBMITTED TO
THE FACULTY OF THE DIVISION OF THE PHYSICAL SCIENCES
IN CANDIDACY FOR THE DEGREE OF
DOCTOR OF PHILOSOPHY
DEPARTMENT OF COMPUTER SCIENCE
BY
DINOJ SURENDRAN
CHICAGO, ILLINOIS
SEPTEMBER 27, 2007

TABLE OF CONTENTS
1 INTRODUCTION 5
1.1 Syllables in Mandarin Chinese . . . . . . . . . . . . . . . . . . . . . . 6
1.2 Contributions of this Thesis . . . . . . . . . . . . . . . . . . . . . . . 8
1.2.1 How important is Tone in Mandarin? . . . . . . . . . . . . . . 9
1.2.2 What are good basic features based on Duration, Pitch, andIntensity? . . . . . . . . . . . . . . . . . . . . . . . . . . . . . 10
1.2.3 Can Voice Quality help Tone Recognition? . . . . . . . . . . 11
1.2.4 How useful is Context? . . . . . . . . . . . . . . . . . . . . . . 12
1.2.5 Are Strong Syllables easier to recognize? . . . . . . . . . . . . 12
2 QUANTIFYING THE IMPORTANCE OF RECOGNIZING TONES 13
2.1 The Simplest Definition of Functional Load . . . . . . . . . . . . . . . 13
2.2 Functional Load of Mandarin Tones (I) . . . . . . . . . . . . . . . . . 16
2.3 Generalized Functional Load calculations . . . . . . . . . . . . . . . . 19
2.4 Interpretation of Functional Load Computations . . . . . . . . . . . . 21
2.5 Functional Load of Mandarin Tones (II) . . . . . . . . . . . . . . . . 22
2.6 Functional Load Versus Perceptual Ease . . . . . . . . . . . . . . . . 24
2.7 Conclusions . . . . . . . . . . . . . . . . . . . . . . . . . . . . . . . . 27
3 LOCAL FEATURES BASED ON DURATION, PITCH, AND INTENSITY 28
3.1 Evaluating Classification Performance . . . . . . . . . . . . . . . . . . 29
3.2 Speaker Normalization . . . . . . . . . . . . . . . . . . . . . . . . . . 31
3.3 Features based on Duration . . . . . . . . . . . . . . . . . . . . . . . 34
2

3
3.4 Features Based on Pitch . . . . . . . . . . . . . . . . . . . . . . . . . 38
3.5 Features based on Overall Intensity . . . . . . . . . . . . . . . . . . . 49
3.6 Combining the Duration, Pitch, and Intensity Features . . . . . . . . 54
3.7 Conclusions . . . . . . . . . . . . . . . . . . . . . . . . . . . . . . . . 55
4 CONTOUR HEIGHT ADJUSTMENT 59
4.1 Pitch Height Adjustment . . . . . . . . . . . . . . . . . . . . . . . . . 61
4.2 Intensity Adjustments . . . . . . . . . . . . . . . . . . . . . . . . . . 66
4.3 Conclusions . . . . . . . . . . . . . . . . . . . . . . . . . . . . . . . . 69
5 VOICE QUALITY MEASURES FOR MANDARIN TONE RECOGNITION 71
5.1 Measures of Voice Quality Considered . . . . . . . . . . . . . . . . . . 72
5.1.1 Glottal Flow Estimation . . . . . . . . . . . . . . . . . . . . . 73
5.1.2 Harmonic-Formant Differences . . . . . . . . . . . . . . . . . . 74
5.1.3 Spectral Center of Gravity . . . . . . . . . . . . . . . . . . . . 76
5.1.4 Spectral Tilt . . . . . . . . . . . . . . . . . . . . . . . . . . . . 76
5.1.5 Band Energy . . . . . . . . . . . . . . . . . . . . . . . . . . . 76
5.2 Classification Task . . . . . . . . . . . . . . . . . . . . . . . . . . . . 77
5.3 Results . . . . . . . . . . . . . . . . . . . . . . . . . . . . . . . . . . . 78
5.4 Band Energy Features . . . . . . . . . . . . . . . . . . . . . . . . . . 81
5.5 Subsets of Band Energy Features . . . . . . . . . . . . . . . . . . . . 83
5.6 Conclusions . . . . . . . . . . . . . . . . . . . . . . . . . . . . . . . . 86
6 COARTICULATION 89
6.1 Using different classifiers for different contexts . . . . . . . . . . . . . 89

4
6.2 Adding True Labels of Neighboring Syllables as Features . . . . . . . 92
6.3 Adding Predicted Probabilities of Labels as Features . . . . . . . . . 93
6.4 Conclusions . . . . . . . . . . . . . . . . . . . . . . . . . . . . . . . . 95
7 STRENGTH 97
7.1 Predicting Focus in Lab Speech . . . . . . . . . . . . . . . . . . . . . 98
7.2 Predicting Strength in Broadcast Speech . . . . . . . . . . . . . . . . 102
7.3 Conclusions . . . . . . . . . . . . . . . . . . . . . . . . . . . . . . . . 107
8 CONCLUSIONS 110

CHAPTER 1
INTRODUCTION
All human languages use sequences of words to convey information. In languages
like English, Dutch and most Indo-European languages, words are just sequences of
discrete units called phonemes. However, as Yip (2002) points out, most languages
in the world are tonal, which means that their words are also defined by intonational
patterns based on the pitch (rate of vocal fold vibration) with which words are said.
Each pattern, or tone, is associated with a unit, such as a syllable, word, or morpheme.
Speakers of non-tonal languages learning a tonal language have been observed to have
activity in previously unused parts of their cortex (Wang et al. (2003)).
This thesis is an investigation of tones in Mandarin Chinese. Chapter 2 tackles the
question of how important it is to recognize tones, while the remaining chapters focus
on the automatic recognition of tones.
Figure 1.1 Averaged pitch contours for four citation-speech utterances of ‘ma’. FromXu (1997).
5

6
1.1 Syllables in Mandarin Chinese
Each syllable in Mandarin has one of five tones:
1. High Tone. Also called High-Level since the pitch stays fairly constant.
2. Rising Tone.
3. Low Tone. Also called Low-Rising, since the pitch tends to start off low and
then increase.
4. Falling Tone.
5. Neutral Tone. This is, to some extent, a ‘none of the above’ category. All
syllables with neutral tone are unstressed.
The distribution of these tones is far from uniform. Falling tones are the most com-
mon, with about a third of all syllables having it, while only around six percent have
neutral tone. Table 1.1 has the distribution based on forty thousand syllables from
the Mandarin Voice of America TDT 2 corpus (Wayne (2000)).
Table 1.1 Distribution of five tones in Mandarin test data (40 798 syllables) fromnews broadcasts in the Mandarin Voice of America TDT 2 corpus. About a third ofall syllables have Falling Tone.
High Rising Low Falling Neutral0.23 0.24 0.14 0.33 0.06
We shall write each Mandarin syllable using the form PPPT, where PPP is its phone-
mic component and T, a number from 1 to 5, is its tonal component. For example,
the monosyllabic word ‘ma1’ (‘mother’) is ‘ma’ said with a high tone, while ‘ma2’

7
(‘hemp’) is ‘ma’ said with a rising tone, ‘ma3’ (‘horse’) is said with a low tone, and
‘ma4’ (‘scold’,‘curse’) a falling tone.
Figure 1.1 from Xu (1997) shows stereotypical shapes of these tones based on their
average pitch contour over several speakers and utterances. In practice, pitch contours
rarely achieve these idealized shapes. There are several reasons for this, some of which
we outline here.
• Anticipatory Coarticulation. The pitch contour of a syllable is affected by that
of the syllable after it.
• Carryover Coarticulation. The pitch contour of a syllable is affected by that of
the syllable before it.
• Syllable Strength. Some syllables are said more clearly than others.
• Phonology. Certain sequences of tones do not occur. The most famous example
is third tone sandhi, where a low tone is converted to a rising tone if it is followed
by another low tone, i.e. two low tones do not occur in succession.
• Phrase level effects such as Declination, where the average pitch steadily de-
creases as the utterance progresses.
Most Mandarin syllables are of the form [C]V[N] or [C]VV[N], where C = consonant,
V = vowel, N = nasal, and square brackets denote optionality (Chao (1968)). (The
exceptions include, for example, degenerate syllables of the form N.) The initial C, if
present, is called the syllable’s onset. The rest of the syllable is called its rhyme.
We shall refer to a collection of syllables said with a single breath as a ‘phrase’.

8
1.2 Contributions of this Thesis
Until recently, tone recognition methods were so poor that it was better to leave them
out of the entire speech recognition pipeline. This has started to change. For example,
Lei et al. (2005) obtained an improvement in character-level classification accuracy
from 64.3% to 66.8% on multi-speaker telephone speech by adding the posteriors
output from a separate tone recognition module to the traditional MFCC feature
vector used at the base of a complete speech recognition system.
Most of this thesis focuses on ways that could improve such modules.
One of the primary ways in which this thesis is different is the scope of experiments
considered on a large dataset. Our primary dataset is a collection of 1159 news
stories from the Mandarin Voice of America (VOA) Topic Detection and Tracking
(TDT) 2 dataset of Wayne (2000). It has about ten hours of speech containing over
160 000 syllables. To deal with such a large dataset, we implemented1 a series of
classifiers based on the fast Conjugate Gradient Least Squares algorithm of Keerthi
and DeCoste (2005).
The contributions of this thesis, listed in order of importance, are:
1. Finding a set of new band energy features that improve tone recognition, par-
ticularly of low and neutral tones. This was determined during the course of
testing about twenty types of voice quality measures. The recognition of these
two tones, particularly neutral tone, is a particularly hard problem, and this
1NAFLA is the C++ package we implemented for this thesis to perform fast k-class classi-
fication with probability estimates. It is a general purpose tool, and freely available online at
http://people.cs.uchicago.edu/∼dinoj/nafla/ .

9
new (and easy to compute) set of features is a promising new method for those
working on tone recognition in research and industry. It is also possible that
they will be of use in investigating other intonational problems, such as detect-
ing L∗ and related pitch accents in English.
2. Quantifying the importance of tone in Mandarin Chinese.
3. Investigating, using a large corpus of broadcast news speech, the best features
involving pitch, duration, and intensity, and finding simple locally-based ways
of adjusting them for better performance.
4. Investigating the use of context; if we know the tones of a syllable’s neighbors,
how much easier is it to recognize its tone?
5. Testing the hypothesis that stronger syllables are easier to recognize.
1.2.1 How important is Tone in Mandarin?
Chapter 2 considers the problem of quantifying the use, or functional load, of tones in
Mandarin Chinese. This is done using an information theoretic method introduced by
Surendran and Niyogi (2003) and based on definitions suggested by Hockett (1955)
and Wang (1967). We reproduce, using better calculations, the result presented in
Surendran and Niyogi (2003) and Surendran and Levow (2004a) that tone recognition
in Mandarin Chinese is an important task; the information lost if one is unable to
distinguish between tones is more than that lost if one is unable to distinguish between
vowels.

10
1.2.2 What are good basic features based on Duration, Pitch, and
Intensity?
Using a corpus with about ten hours of Mandarin broadcast news speech from Wayne
(2000), we perform possibly the most extensive and detailed investigation of acoustic
features for Mandarin tone recognition to date. Our corpus is an order of magnitude
larger than those used in previous investigations of this type done in the phonetics
community. And since it is a corpus of ‘Speech Recognition size’, the conclusions we
reach are of likely benefit to speech researchers, even if the nature of our controlled
experiment assumes that we know syllable boundaries.
It is well accepted that the most important acoustic cue for the recognition of tones
in Mandarin is pitch, followed by duration and intensity. In Section 3 we investigate
a couple of hundred features based on these three cues and obtain a core set of sixty-
eight features. In the process we find a few features that we have not seen elsewhere,
like the gradient of the intensity contour in various parts of a syllable. We also answer
a host of other, smaller questions, such as those below.
• Should intensity be measured only above 500 Hz? (No.)
• Does pitch trimming help? (Yes.)
• Are there useful durational features other than the length of a syllable? (Yes.)
• If speaker normalization has already been done at the frame level, does it help
to do it at the feature level as well? (Yes.)
• Individually, are pitch features more important than durational features? (No.)

11
• Does pitch help with the recognition of the neutral tone? (No.)
• Is the value of pitch more important than the changes in pitch? (No.)
With these sixty-eight features, accuracy is about 58.9%, with relatively poor recog-
nition for low and neutral tones.
In Chapter 4 we investigate several methods for modifying our pitch and intensity
features based on local pitch/intensity. For example, the average pitch does tend
to drop as the phrase progresses. We find that it helps to subtract from our pitch
measures the average value of pitch in the previous syllable. It also helps, though
not by much, to subtract from our intensity measures the average value of intensity
in the three-syllable window around the current syllable. This improves classification
accuracy to 60.4%.
1.2.3 Can Voice Quality help Tone Recognition?
In Chapter 5, we investigate the use of voice quality measures for Mandarin Tone
Recognition. We test over twenty possible measures, such as Normalized Amplitude
Quotient (Alku and Backstrom (2002)) and Spectral Balance (Sluijter and van Heuven
(1996)), on a small dataset of broadcast speech. We find that features involving band
energy measures — the intensity between certain frequencies — are the most useful for
tone recognition. We add sixty additional features to increase classification accuracy
to 63.7%, with large improvements in the recognition of neutral tone.

12
1.2.4 How useful is Context?
In Chapter 6, we investigate the use of tonal context. How much easier is it to
recognize a syllable if we know the tones of its neighbors? If we create different
classifiers for different tonal contexts, accuracy increases to 67.2% if we know the
true contexts. This provides a useful upper bound on performance. The fact that this
upper bound is not higher shows how hard this problem is, and that any improvement
in performance at this point is highly significant. Naturally, knowing the true tones
of neighbors is impossible, but when we create another classifier that uses the 63.7%
classifier to provide guesses of contexts, accuracy improves to 65.0%.
1.2.5 Are Strong Syllables easier to recognize?
Several factors contribute to making some syllables in Mandarin (and other languages)
more prominent, or stronger, than others. These include lexical stress, focus, syllable
position, word type, phrase boundary effects, and others.
We would expect that stronger syllables are easier to recognize, and test this hypoth-
esis in Chapter 7. We verify this to be true on a small corpus of lab speech from
Xu (1999), where syllables in focussed words are recognized with over 99% accuracy,
and are able to use this to improve classification accuracy of all syllables. However,
in broadcast speech, we find that while stronger syllables are recognized better, the
difference is not enough to suggest an algorithm that makes use of the difference.

CHAPTER 2
QUANTIFYING THE IMPORTANCE OF RECOGNIZING
TONES
When faced with a problem to be solved, the first question that needs to be is asked
is ‘How important is it to solve this problem?’ This thesis tackles the problem of rec-
ognizing tones in Mandarin Chinese. We must therefore first quantify the importance
of recognizing tones.
In this chapter, we perform further calculations and analysis using the principle of
the functional load of a contrast — a quantitative measurement of the uncertainty in
recognizing linguistic units of a language when the contrast is absent (Hockett (1955),
Wang (1967), Surendran and Niyogi (2003), Surendran (2003)).
Some of the results reported here are akin to those in earlier work (Surendran and
Levow (2004a), Surendran and Niyogi (2003), Surendran (2003)) but they were done
here with improved computational techniques and a larger dataset. All calculations
in this chapter were done using an automatically transcribed corpus of 949 111 words
in 151 940 sentences from the Mandarin VOA TDT 2 collection. It contained 1020
syllable tokens and 19 788 word tokens.
2.1 The Simplest Definition of Functional Load
The information theoretic definition of functional load we introduced in Surendran
(2003) and Surendran and Niyogi (2003) has a couple of parameters based on how the
13

14
language is modelled. We will get to the full definition in Section 2.3. For now, we just
consider the most straightforward definition, which is equivalent to the Percentage of
Information Extracted measure offered by Carter (1987) for speech recognition.
Suppose that a language L has a set of words (called its vocabulary) W (L) and that
the probability of a word w ∈ W (L) occurring is pw. The information transmitted
per word, in bits, is equivalent to the uncertainty in guessing the identity of the next
word.
H(L) = −∑
w∈W (L)
pw log2 pw (2.1)
Now, suppose some phonological transformation θ is applied to language L that par-
titions its vocabulary so that the resulting language θ(L) has vocabulary W (θ(L)).
For example, if L was English and θ removed the contrast between the phonemes /l/
and /r/ then θ(L) would be English where words like ‘lice’ /lais/ and ‘rice’ /rais/
sounded alike.
Each ‘word’ in the transformed language θ(L) corresponds to a set of words in the
original language and its probability is the sum of the probabilities of the words in
this set. For example the probability of the word {lice, rice} in θ(L) is the sum of
the probabilities of lice and rice in L.
The entropy of θ(L) is
H(θ(L)) =∑
u∈W (θ(L))
qu log2 qu, where qu =∑
w∈u
pw (2.2)

15
The Functional Load of the transformation θ is defined to be
FL(θ; L) =H(L) − H(θ(L))
H(L)(2.3)
If we want to measure the FL of some contrast e.g. between all tones or between a
pair of tones, we define θ to be the transformation that removes the contrast.
To illustrate, consider a toy language L represented by a sequence of one-letter words
from the vocabulary W (L) = {a, b, c, d}. The corpus to be used is abdccaaccaabbabababa.
The word a occurs 9 times, b occurs 6 times, c occurs 4 times, d occurs once. The
probability of each word occurring is pa = 920
= 0.45, pb = 0.3, pc = 0.2, pd = 0.05.
The entropy H(L) is −0.45 log2 0.45−0.3 log2 0.3−0.2 log2 0.2−0.05 log2 0.05 = 1.72.
Suppose we wish to find the functional load of the ‘a versus c’ contrast. In other
words, how much information do we lose if we cannot make the distinction between
a and c? To do this, we use the transformation θno ac that converts all occurrences
of a or c in L to a new word and leaving all other words unchanged. Using (for
convenience) upper case letters for the words in the transformed language,
θ(x) =
E if x = a or c
B if x = b
D if x = d
(2.4)
The transformed language θno ac(L) has vocabulary {B, D, E} = {{b}, {d}, {a, c}}
with probabilities qB = pb = 0.3, qD = pd = 0.05 and pE = pa + pc = 0.65.
The entropy of θno ac(L) is −0.65 log2 0.65−0.3 log2 0.3−0.05 log 0.05 = 1.141, so the

16
functional load of the a− c contrast is FL(θno ac; L) = (1.720−1.141)/1.720 = 0.337.
2.2 Functional Load of Mandarin Tones (I)
First, a note on notation: we describe Mandarin syllables using Pinyin notation with
the number of the tone following the phonemic representation of the syllable. So
‘ma1’ is the syllable ‘ma’ said with a high tone and ‘ma2’ with a rising tone. The
numbers 3, 4 and 5 stand for the low, falling, and neutral tones respectively.
Now suppose we wish to measure the FL of tones in Mandarin. Here the contrast
is being able to distinguish between any pair of tones in the language. The removal
of the contrast makes all tones sound alike. Then we should define θno tone to be the
transformation that makes all tones sound alike. This transformation will convert,
for example, the words ‘men2’ and ‘men5’ to the same word ‘menT’, and ‘yi1-zhi2’,
‘yi1-zhi4’, ‘yi1-zhi1’, ‘yi4-zhi4’, ‘yi3-zhi4’ and ‘yi3-zhi1’ to the same word ‘yiT-zhiT’.
The FL of θno tone is 0.021. However, this absolute value cannot be interpreted as is.
It must be compared to that of other contrasts. So if we wish to see how important
tonal contrasts are, we must compare their load to that of, for instance, the contrasts
between different vowels or consonants.
We define the transformation removing all vocalic contrasts as θno vowel. It transforms
‘xin2’,‘xun2’ to ‘xVn2’ and ‘xuan2’,‘xian2’ to ‘xVVn2’, Its FL is 0.019.
We define the transformation removing all consonantal contrasts as θno consonants.
It transforms ‘lin1’,‘qin1’,‘bin1’,‘jin1’,‘yin1’,‘xin1’, ‘ping1’, ‘ling1’, ‘ding1’, ‘qing1’,
‘ying1’, ‘ting1’, ‘xing1’, ‘jing1’ to ‘CiC1’. Its FL is 0.060.

17
To summarize, with this definition of FL :
1. It is about three times more important to recognize consonants than it is to
recognize either tones or vowels.
2. It is slightly more important to recognize tones than vowels.
Tones are clearly important in Mandarin. But what of the contrast between individual
pairs of tones? For example, Mandarin speakers sometimes find it hard to distinguish
between the Rising and Low tones Huang (2001). How important is this bitonal
contrast compared to the other bitonal contrasts?
Suppose we wish to measure the FL of the bitonal contrast between the Rising tone
and Low tone. We define θ23 to be the transformation that converts the two tones to
the same tone and leaves all other tones and phonemes unchanged. This procedure
can be used for any pair of tones, and Table 2.1 shows the functional load of all
bitonal contrasts.
Table 2.1 Functional Load of all bitonal contrasts using word unigrams. All valuesshould be multiplied by 0.001.
rise low fall neuthigh 2.27 3.54 4.85 0.02rise 2.27 4.28 0.96low 3.82 0.01fall 0.18
The most important bitonal contrasts all involve falling tones, distinguishing it from
high, rising, and low tones respectively.
The least important contrasts all involve the neutral tone. This is partly because only

18
about six percent of all syllables have neutral tone, but that is not the only reason.
Suppose that Mandarin syllables have only tones and no phonemes; such a language
has only five syllables. The empirical distribution of the five tones is high 0.2695,
rising 0.2244, low 0.1596, falling 0.2778, and neutral 0.0688. The resulting entropy is
2.1950. Now, if the high-rising contrast was lost, the new ‘high+rising’ toned syllable
would have probability 0.4939 and low, falling, and neutral tones would have the
same probabilities. The resulting entropy is 1.6820. Thus the FL of the high-rising
contrast is (2.195 − 1.682)/2.195 = 0.234.
Table 2.2 shows the FL of all bitonal contrasts when Mandarin syllables have only
tones and no phonemes. While the FL of contrasts involving the neutral tone are
still lowest, they are still comparable to the FLs of the other bitonal contrasts. Sim-
ilarly, the FL of contrasts involving falling tones are much smaller (relative to other
contrasts) than they are in the word unigram case.
Table 2.2 Functional Load of all bitonal contrasts if Mandarin syllables had nophonemes. The figures here are based on the empirical probabilities of syllableswith the five tones: high 0.2695, rising 0.2244, low 0.1596, falling 0.2778, and neutral0.0688. All values below should be multiplied by 0.1.
rise low fall neuthigh 2.34 2.06 2.47 1.34rise 1.84 2.25 1.12low 1.88 0.75fall 1.38

19
2.3 Generalized Functional Load calculations
The definition of Functional Load we have used so far is based on the assumption
that a language is a set of single word utterances. Naturally, this is overly simplis-
tic, though it is still more advanced than most measures suggested earlier in the
Linguistics literature; see the surveys in Meyerstein (1970) and Surendran (2003).
Several models have been proposed for modelling languages, but there is a tradeoff
between linguistic thoroughness and engineering possibility and the data required to
produce an adequate model. We use Markov Models, a model that has worked well in
speech recognition and was first suggested for the purposes of quantifying functional
load by the linguist Hockett (1955) based on the work of Shannon (1951). We assume
that a language L is a sequence1 of linguistic objects (phonemes, syllables, words,
etc) generated by a finite-order Markov Process.
In a k = (n − 1)-order Markov Process, the probability that an object occurring is
dependent on the object and the previous k objects (i.e. the last n objects including
the object itself) that have occurred. As k, n increase, the sequences generated by
the process become more linguistically plausible, but the probabilities of the model
need more data to be estimated adequately.
Since a Markov Process is a stochastic ergodic process (Cover and Thomas (1991)),
the probability distribution of objects generated by it is stationary; we can thus
meaningfully speak of the probability of an object of L. And for a k = (n − 1)-order
Markov process, we can speak meaningfully of pu1u2...un, the probability of a sequence
1Equivalently, a set of sequences, by adding an end-of-sequence marker to the language’s vocab-
ulary.

20
of n objects (an n-gram) u1, u2, . . . un occurring in succession in language L.
The entropy of L is taken to be the entropy of the Markov Process; equivalently, the
entropy of the stationary distribution of objects of L generated by the Process. In
other words, it is :
Hn,object(L) = −1
n
∑
u1∈W (L)
. . .∑
un∈W (L)
pu1u2...unlog2 pu1u2...un
(2.5)
If we had an infinite corpus of sequences from L, then we would know the true values
of pu1u2...unfor any n, and Hn,object(L) will approach the true entropy of L as n → ∞.
However, we only have a finite (though large) corpus of data instead. So we count the
number of times each n-gram occurs, and then estimate pu1u2...unby the smoothed
count of the n-gram u1u2 . . . un in the corpus divided by the total number of n-
grams. There are several possible smoothing methods (Chen and Goodman (1998)),
the Simple Good-Turing method is used here.
With these technical details out of the way, we can proceed with the more general
definition of the functional load of a contrast. It is basically as before, but with more
parameters.
Suppose that θ is the phonological transformation representing the absence of a con-
trast. When it is applied to all objects in L, it is also applied to all n-grams in the
canonical way. The probability of a transformed n-gram v1 . . . vn ∈ W (θ(L)) × . . . ×
W (θ(L)) is∑
u1∈v1. . .
∑
un∈vnpu1...un
. The entropy of the resulting language θ(L) is

21
Hn,object(θ(L)) = −1
n
∑
v1∈W (θ(L))
. . .∑
vn∈W (θ(L))
pv1v2...vnlog2 pv1v2...vn
(2.6)
Finally, the FL of the contrast is then
FLn,object(θ; L) =Hn,object(L) − Hn,object(θ(L))
Hn,object(L)(2.7)
This reduces to the definition in Section 2.1 when n = 1, k = 0 and the objects are
words i.e. a language modelled as a 0-order Markov Process generating sequences of
words.
2.4 Interpretation of Functional Load Computations
Three things affect the computation of functional load :
1. The order of the Markov Process assumed to generate the language.
2. The linguistic objects (words, syllables, etc) assumed to be generated by said
process.
3. The corpus used to estimate probabilities of the process.
How do we choose which set of FL calculations to use when there are so many choices?
It would be nice to be able to give a simple answer, but this is not possible. Generally,
we should use as large a corpus as possible, and as high an order as possible. As for
whether to use words or syllables or some other linguistic object such as phonemes

22
or phrases, it depends on the situation — using words is most natural, but assumes
that the word segmentation problem has already been solved.
One option, which is not always available, is to calculate FL using as many possible
combinations of the three factors above as possible, and draw conclusions from their
combination.
Ideally, we will find that conclusions drawn only with the most natural method (word
unigrams) tend to hold true when done with more sophisticated methods. This would
be optimal in terms of linguistic interpretability and the amount of data usually
available.
The primary thing to note when interpreting FL values is that they are relative values,
not absolute. We can only answer the question of ‘How important is a contrast?’
relatively to other contrasts.
2.5 Functional Load of Mandarin Tones (II)
Table 2.3 Functional Load of Tones, Vowels, and Consonants in Mandarin Chineseusing Markov Processes of syllables or words of various orders.
Object Words SyllablesOrder 0 1 2 0 1 2 3Tones 0.0214 0.0056 0.0008 0.1074 0.0499 0.0133 0.0031Vowels 0.0187 0.0048 0.0004 0.0809 0.0364 0.0085 0.0016
Consonants 0.0600 0.0219 0.0030 0.1991 0.1142 0.0371 0.0077
In Section 2.2 we calculated the FL of Mandarin tones using word unigrams. In
Section 2.3 we provided a more general definition of FL. In this Section we calculate
the FL of Mandarin tones using this more general definition.

23
Table 2.3 shows the FL of these three contrasts using seven types of Markov Processes
: 0−, 1− and 2−order processes generating words and 0−, 1−, 2− and 3−order
processes generating syllables.
In all cases, the consonantal contrast easily has the highest FL while the tonal contrast
is slightly more important than the vowel contrast.
Similar conclusions were drawn in Surendran and Levow (2004b) (and replicated in
Section 2.2) but those calculations were only done with the 0-order word model, mak-
ing it unclear if tones were more important than vowels or had the same importance
as vowels.
Table 2.4 shows the FL of the ten bitonal contrasts using the seven Markov processes.
We can draw the following conclusions, as they are true for nearly all seven processes:
• Contrasts involving the Falling tone are the most important. The most impor-
tant contrast is either High / Falling or Rising / Falling, both of which are more
important than Low / Falling.
• Contrasts involving the Neutral tone are generally the least important. The
possible exception is the Rising / Neutral contrast, which may be of comparable
importance to the Rising / High contrast.
• Of the contrasts involving the High tone, the High / Falling contrast is more
important than the High / Low contrast, which is more important than the
High / Rising contrast.
• Rising / Low is of similar importance to Rising / High.
Tables 2.3 and 2.4 also illustrate two more points:

24
1. The higher the order n − 1, the lower the absolute values of FL.
2. For a fixed order, the values of FL are higher for syllables than words. This is
because words, being composed of syllables, are longer and have more informa-
tion than syllables.
Table 2.4 Functional Load of Bitonal contrasts in Mandarin Chinese using MarkovModels of syllables or words of various orders. Values should be multiplied by 0.001.
Object Words SyllablesOrder 0 1 2 0 1 2 3
high.fall 4.8453 1.0349 0.1529 29.4600 11.8546 2.7737 0.6403rise.fall 4.2760 1.1177 0.1658 21.5065 9.4544 2.6424 0.7051low.fall 3.8244 0.8410 0.1132 24.1158 9.0869 2.0696 0.4813high.low 3.5425 0.7270 0.0841 20.4890 7.7634 1.7586 0.3974rise.low 2.2732 0.5294 0.1101 15.2540 5.4677 1.2523 0.3010high.rise 2.2714 0.3829 0.0472 16.4362 6.2425 1.4098 0.2980rise.neut 0.9623 0.5037 0.0604 2.7569 1.7649 0.5690 0.1295fall.neut 0.1828 0.0414 0.0014 0.6318 0.1518 0.0288 0.0047high.neut 0.0198 0.0010 0.0000 0.1658 0.0256 0.0027 0.0005low.neut 0.0128 0.0004 0.0000 0.3803 0.0712 0.0038 0.0004
2.6 Functional Load Versus Perceptual Ease
For speech recognition research, the main use of FL values is to determine which
contrasts need to be recognized better. It is no great loss if a contrast that is difficult
to automatically recognize turns out to have a low FL.
From other research viewpoints, such as those of language evolution and psycholin-
guistics, it would be interesting to see if contrasts that are difficult to recognize by
native speakers turn out to have low FL.

25
To do this, we will need data on how easily Mandarin speakers distinguish between
each pair of tones. We use that determined by the perceptual experiment of Huang
(2001). They found that the response times in ‘same-different’ tasks offered good
insight into the perceptual similarity of six bitonal contrasts (neutral tone was ex-
cluded). Table 2.5 shows the response times and error rates for each contrast along
with their FL using word unigrams. The error rates are too low to be significant and
are only provided for completeness.
Table 2.5 Response Times and Error Rates in Huang (2001)’s experiment, comparedwith FL using word unigrams.
Tone A Tone B Response Time (ms) Error Rate (%) FL (×0.001)A vs B B vs A Mean A vs B B vs A Mean
Rising Low 699.4 667.4 683.4 11 7 9.0 2.27High Falling 602.4 572.6 587.5 4 4 4.0 4.85High Low 572.8 584.2 578.5 3 6 4.5 3.54High Rising 568.9 556.7 562.8 4 7 5.5 2.27Rising Falling 512.1 583.2 547.6 0 4 2.0 4.28Low Falling 542.9 547.0 545.0 5 2 3.5 3.82
We make the following observations:
1. The correlation between the response times and functional load is -0.489 but
not significant (p = 0.325).
2. Humans find it hard (compared to other tones) to distinguish between the rising
and low tones. Fortunately, this has one of the lowest FL compared the the other
non-neutral contrasts.
3. The rising/high contrast has nearly the same FL as the rising/low contrast, but
is one of the easiest to recognize by humans.

26
2 2.5 3 3.5 4 4.5 5540
560
580
600
620
640
660
680
700
Functional Load (Linguistic Usefulness) x 0.001
Resp
onse
Tim
e (P
erce
ptua
l Sim
ilarit
y), m
s
23
14 13
12
24 34
Figure 2.1 Perceptual Similarity versus Functional Load of six bitonal contrasts inMandarin. The four tones are 1 - High, 2 - Rising, 3 - Low, 4 - Falling. PerceptualSimilarity is based on Response Times in a same-different task by Tsan et al (2001).Functional Load is based on word unigrams calculated from a corpus of nearly amillion words from Mandarin Voice of America (TDT2) broadcasts.
The contradictions of (2) and (3), which are summarized by the negative but far-
from-significant correlation in (1), mean that the only conclusion we can draw is that
Mandarin places less linguistic importance on the most similar pair of tones (neutral
tone aside).
We cannot say that this is a general linguistic trend — indeed, evidence from the
Cantonese merger of /n/ and /l/ is of the opposite trend (Surendran (2003) Suren-
dran and Niyogi (2006)). /n/ merged with /l/ in word-initial position when, of all
consonants that /n/ could have merged with, only the /n/-/m/ contrast had a higher
FL than the /l/-/n/ contrast.

27
2.7 Conclusions
Recognizing tones in Mandarin Chinese is clearly an important problem; at least as
important as recognizing vowels. Fortunately for automatic tone recognition systems,
Mandarin places less linguistic importance on the most similar pair of tones (Rising
and Low).
The remainder of this thesis focuses on finding better features and methods for the
automatic recognition of Mandarin tones.

CHAPTER 3
LOCAL FEATURES BASED ON DURATION, PITCH,
AND INTENSITY
There are several possible features based on acoustic measurements that can be used
to determine whether a Mandarin syllable has a high, rising, low, falling, or neutral
tone.
A basic contribution of this thesis is investigating the efficacy of hundreds of such
measurements using a large corpus of data. Typically, researchers who investigate
such features in detail - primarily phoneticians and linguists - do so on small collec-
tions of data, usually of lab speech. Meanwhile, engineers who have access to large
corpora of data do not have the time or inclination to make detailed investigations;
often because the time required for training is too large.
We have a large corpus of non-lab-speech data, and a very fast classification algorithm,
and can therefore perform experiments of interest to both communities. However,
since we assume that syllable and phonemic boundaries are known to some extent,
our investigations will be of more immediate interest to the phonetics community.
In this chapter, we introduce a basic subset of forty-eight features based on syllable
duration, pitch, and overall intensity. These will form our baseline for finding better
features in the next few chapters.
Our data is 163 195 syllables (122 397 training, 40 798 testing) from 1159 stories from
news broadcasts in the Mandarin Voice of America TDT 2 corpus from Wayne (2000)
that had been automatically segmented, force aligned, and manually spot-checked
28

29
by Levow (2005). Since longer stories tend to have interviews and other speaker
crossovers, we only picked stories under one minute in duration. We then assumed
that each such story had only a single speaker.
We used a fixed classification algorithm, a one-versus-one ensemble (Wu et al. (2004))
of linear RLS (Regularized Least Squares) binary classifiers (Keerthi and DeCoste
(2005)).
with Platt-Scaled outputs (Platt (2000), Lin et al. (2003)) that produces probabil-
ity estimates as predictions. For each syllable, the classifier produced a probability
estimate of how likely it was to have each of the five possible tones.
3.1 Evaluating Classification Performance
Given a set of training examples, a classification algorithm produces a classifier. For
each test example xm, m = 1, . . . , M with true label tm ∈ C = {high, rising, low,
falling, neutral}, the classifier produces a probability distribution pc(xm) = Prob(xm
is in class c), c ∈ C. The predicted label for xm is um := arg maxc∈Cpc(xm). The
probability that xm is classified correctly, which we call PCorr, is qm := ptm(xm).
We used three performance metrics to evaluate our classification results. Note that
M is the number of test examples.
Accuracy 1M
∑Mm=1[[um = tm]] Percentage of test examples correctly classified. Note
that [[x]] is the characteristic function (1 if x is true and 0 otherwise).
This is the most commonly reported result in the literature. However, it does
not offer as much information as the other two measures below.

30
MPCorr 1M
∑Mm=1 qm. Average PCorr (probability of the correct label being predicted)
over all test examples.
Maximizing MPCorr is important because in a complete speech recognition sys-
tem, the ‘Local Syllable Tone Prediction’ module (which is what this thesis
investigates) would have the predictions it outputs used as inputs further on
in the speech processing pipeline. Predicting a probability distribution over all
classes is more useful than a single predicted class (which corresponds to the
Accuracy measure).
MeanF 1C
∑Cc=1
2RcPc
Rc+PcAverage of per-class F score. The F score Fc for class c is the
reciprocal mean 1Fc
= 12
(
1Rc
+ 1Pc
)
of the precision Pc and recall Rc for class c.
Rc is the number of test examples correctly predicted to be class c divided
by the true number of test examples of class c i.e. the fraction of c-examples
recognized as such.
Pc is the number of test examples correctly predicted to be class c divided by
the number predicted to be class c i.e. the fraction of c-predictions that were
correct.
Maximizing MeanF is important because it encourages classifiers to do similarly
well on each class. Label bias is going to be a considerable problem in this task
as some tones are far more common than others. This measure offers the best
insight into how well neutral tones (the least common and hardest to classify)
are recognized.
As an example, consider the values of the three performance measures for the baseline
algorithm, which is that all syllables are classified with the a priori probability dis-
tribution. In other words, each syllable is predicted to be high with probability 0.23,

31
rising with probability 0.24, low 0.14, falling 0.33, and neutral 0.06; these probabil-
ities reflect the distribution of the tones in our dataset. If we were to force a single
decision, then all syllables would be classified as falling.
Accuracy only takes into consideration the single decision. The universal decision
‘falling’ is correct for 33% of all syllables and wrong for the rest. Thus Accuracy is
0.33.
MPCorr is∑
class c P(syllable is from class c) P(syllable is classified as class c) =
∑
c P (c)P (c) = 0.23(0.23) + 0.24(0.24) + . . . + 0.06(0.06) = 0.2426.
Finally, MeanF also takes into consideration just the single decision made for each
syllable. For falling tone, precision is 0.33 and recall is 1.0, so F is 0.5. But for all
other syllables, precision and recall are 0, so F is also 0. Thus the average F score is
0.5/5 = 0.1.
3.2 Speaker Normalization
Since different speakers speak differently, some form of feature normalization is nearly
always required in speech recognition. The most obvious way of normalizing a feature
is z-normalizing using the distribution of its values across all syllables said by the same
speaker. This should get rid of effects such as some speakers talking faster (having
shorter syllables) than others.
Per-Speaker-Syllable-z-Normalization (PSSZN) works as follows. For each feature,
we consider its values v1, . . . , vN for all N syllables spoken by the same speaker. After

32
computing the mean µ = 1N
∑Nn=1 vn and standard deviation σ =
√
√
√
√
1
N
N∑
n=1
(vn − µ)2,
we replace each vn by (vn − µ)/σ.
If N is large — in other words, if we know that we have lots of syllables from the
same speaker — then normalization will help. In our case — we assume that each
story is spoken by a single speaker and have at most a minute’s worth of speech for
each speaker — N varies from 25 to 250 and is 140 on average. As it is not a priori
clear that this is large enough to be useful, we tested this for each acoustic feature in
one of two ways.
Allowing ourselves to jump ahead a bit, this chapter investigates a total of forty eight
features : six durational, twenty-one pitch-based, and twenty-one based on overall
intensity.
We ran forty eight experiments. In each one, we classified tones (using the training
and test set mentioned above) using both pre- and post-PSSZN versions of the feature.
We then had, for each of the 40 798 test examples, the value of PCorr with and without
PSSZN. We compared these with a Wilcoxon Matched Pairs test at 0.01 significance.
(The distribution of PCorr is not normal, so a paired t-test is invalid.)
For forty seven features, the normalized version of the feature had significantly better
values of PCorr than the unnormalized features. The only exception was syllable
duration, for which the reverse was true. We chose to use PSSZ-Normalized features
always. Features will be PSSZN unless otherwise mentioned.

33
−3 −2 −1 0 1 2 30
500
syll.duration
HIGHmean = −0.042
−3 −2 −1 0 1 2 30
500RISING
mean = 0.200
−3 −2 −1 0 1 2 30
500LOW
mean = −0.005
−3 −2 −1 0 1 2 30
500FALLING
mean = −0.014
−3 −2 −1 0 1 2 30
500NEUTRAL
mean = −0.560
Figure 3.1 Distribution of syllables based on the speaker-normalized duration of eachsyllable. On average, rising toned syllables are longest and neutral toned syllablesare shortest.

34
3.3 Features based on Duration
The durations of a syllable offer some cues to recognizing which tone it carries. This is
particularly the case for neutral toned syllables, which tend to be shorter than others
as they are only found on unstressed syllables; stressed syllables tend to be longer.
The longest syllables tend to have rising tone, as reported by Kratochvil (1998). He
reports the average duration of syllables from a single female speaker (referred to as
GMZ) as the following:
Rising (138 ± 66) > High (133 ± 59) > Low (129 ± 65) > Falling (119 ± 65) >
Neutral (101 ± 56)
In other words, her syllables with rising tone were, on average, 138 milliseconds,
with a standard deviation of 66 milliseconds. Our corresponding statistics, which
are over several speakers and thus more reliable, are below. The speaker-normalized
distributions of syllable duration are shown in Figure 3.1.
Rising (224 ± 85) > Low (208 ± 79) > Falling (207 ± 73) > High (205 ± 74) >
Neutral (166 ± 76)
As before, rising toned syllables are longest and neutral toned syllables are short-
est. There is little to distinguish between the other tones, especially with the large
standard deviations. In addition, it appears that GMZ is a speaker who is faster
than average and whose high toned syllables are relatively longer than average. The
former is a reminder of the need for speaker normalization, the latter a reminder for
the inadequacy of it.

35
The duration of a syllable is not the only plausible temporal cue available, though
there has been inadequate exploration of such alternative possibilities. A syllable
has many parts, such as their rhyme and voiced portion, and their durations can be
considered as well. We also considered the non-silent parts of each syllable; this was
initially just to deal with segmentation errors at the starts and end of phrases, though
it also dealt with (justifiably or not) the silence at the start of stop-initial syllables.
Silence was detected using a simple linear silence-versus-non-silence classifier trained
on a per-story basis on overall intensity.
In all, we used six durational features for each syllable:
• Duration of the syllable.
• Duration of the rhyme.
• Number of voiced frames in the syllable, i.e. frames for which we could obtain
a pitch measurement. Note that this is equivalent to the duration of the voiced
portion of the syllable.
• Number of voiced samples in the rhyme.
• Duration of the syllable minus duration of silent regions at the start and end of
the syllable.
• Duration of the rhyme minus duration of any silent region at the end of the
rhyme.
With these features, MPCorr was 0.2831, MeanF 0.2861, and Accuracy 36.8%. (Note
that this is with PSSZ-Normalized features; without any normalization, MPCorr was

36
0.2711, MeanF 0.2486 and Accuracy 34.9%. If both unnormalized and normalized
features are used, there is little improvement : MPCorr was 0.2837, MeanF 0.2882 and
Accuracy 37.0%. )
While this performance is low, it is better than the baseline result of allocating prob-
abilities for each syllable according to the entire distribution.
Table 3.1 Comparing performance with durational features against baseline.
MPCorr Accuracy MeanF
Duration 0.2831 36.8 0.2861Baseline 0.2426 33.0 0.1000
In other words, using just durational features does not improve classification accuracy
much, but it does improve the probability of an accurate prediction more, and the
mean F score a great deal. The last is largely because durational features help with the
recognition of high and falling tones, as the confusion matrix and summary analysis
in Tables 3.2 and 3.3 show. Surprisingly, duration by itself does not help as much
with the recognition of neutral tones as one might expect.
Table 3.2 Confusion Matrix, classifying using six durational features.
High Rising Low Falling NeutralHigh 3440 681 246 4821 71Rising 1348 1705 459 6418 67Low 335 894 997 3390 103Falling 2423 1261 799 8739 118Neutral 69 91 208 1964 151
To determine the relative importance of the six features, we performed six classifica-
tion experiments, each using all but one of the six durational features. The results,
which are in Table 3.4, indicate that the duration of the voiced part of the rhyme is

37
Table 3.3 Summary of classification results using six durational features.
MPCorr Recall Precision MeanF
High 0.3148 0.3715 0.4517 0.4077Rising 0.2668 0.1706 0.3681 0.2331Low 0.2091 0.1743 0.3680 0.2366
Falling 0.3309 0.6551 0.3450 0.4520Neutral 0.1454 0.0608 0.2961 0.1009Average 0.2534 0.2865 0.3658 0.2861
the most important feature, and that none of the six features can be removed without
decreasing MPCorr.
Table 3.4 Durational features ranked by importance based on the drop in MPCorr
when the feature is removed from the set of all six PSSZ-Normalized features. Alsoshown are the corresponding decrease in Accuracy and decrease in MeanF. As anexample of how to read these figures, observe that when the number of voiced framesin the rhyme is excluded, MPCorr decreases from 0.2831 to 0.2831− 0.0213 = 0.2618.
MPCorr Acc (%) MeanF
all 6 features 0.2831 36.84 0.2861
Feature removed ∆ MPCorr ∆ Acc (%) ∆ MeanF
#voiced frames, rhyme 0.0213 1.98 0.0549#voiced frames, syllable 0.0056 0.78 0.0119duration, non-silent rhyme 0.0044 0.28 0.0125duration, rhyme 0.0034 -0.13 0.0185duration, syllable 0.0028 0.05 0.0146duration, non-silent syllable 0.0002 0.05 0.0036
Durational features offer some information for all tones, including the neutral tone,
although they not offer as much information for neutral tone recognition as one might
expect due to the large overlap between the durations of neutral and non-neutral toned
syllables.

38
The duration of the syllable is not as informative as the duration of other syllabic
units, such as its rhyme and voiced segments. The most useful durational feature is
the number of voiced frames in its rhyme, which we had not expected a priori. Figure
3.2 shows the distribution of this feature for all five tones.
3.4 Features Based on Pitch
Pitch features have long been known to be the most useful cue in tone recognition,
particularly for the four primary tones. For example, as Figure 3.4 shows, high toned
syllables typically have the highest pitch and low toned syllables the lowest; this can
also be seen in the averaged idealized pitch contour shapes in Figure 1.1 in Section 1.
However, pitch is not particularly good for the recognition of neutral tones; see Figure
3.3, which shows the six-point pitch contours of several syllables that were accurately
recognized1 using pitch and other acoustic cues. While pitch contours for the first
four syllables are not always ideal, there is little to distinguish neutral tones from
other tones (particularly low tones).
For each story, we computed the fundamental frequency F0hz in Hertz for all voiced
frames using Praat’s Boersma and Weenink (2005) “To Pitch... 0.002 50 600’ com-
mand. We then applied an intuitive trimming algorithm to eliminate large jumps in
pitch, and then used simple linear interpolation to ‘fill in’ values of F0hz for unvoiced
frames. Others have used more complex methods of interpolation, such as splines
(Lei (2006)).
1The corresponding picture for some other syllables — not just well recognized ones — can be
found in Figure 8.1 in the Appendix.

39
−3 −2 −1 0 1 2 30
500
rhyme.numvoiced
HIGHmean = 0.341
−3 −2 −1 0 1 2 30
500RISINGmean = 0.082
−3 −2 −1 0 1 2 30
500LOWmean = −0.415
−3 −2 −1 0 1 2 30
500FALLINGmean = −0.009
−3 −2 −1 0 1 2 30
500NEUTRALmean = −0.625
Figure 3.2 Distribution of syllables based on the speaker-normalized number of voicedframes in the rhyme of each syllable. While, on average, rising toned syllables havethe longest syllable durations, high toned syllables have the highest number of voicedframes in the rhyme. The contour tones - rising and falling - have average valuesof this feature, while the low and especially neutral tones have short voiced rhymesegments.

40
Figure 3.3 Sample six-point normalized pitch contours of sixty syllables that wererecognized correctly using features based on both pitch and other acoustic cues. Thevertical axis of each syllable is between ±4 standard deviations.
41
−3 −2 −1 0 1 2 30
500pitch.mean
HIGHmean = 0.561
−3 −2 −1 0 1 2 30
500RISINGmean = −0.198
−3 −2 −1 0 1 2 30
500LOWmean = −0.728
−3 −2 −1 0 1 2 30
500FALLINGmean = 0.157
−3 −2 −1 0 1 2 30
500NEUTRALmean = −0.516
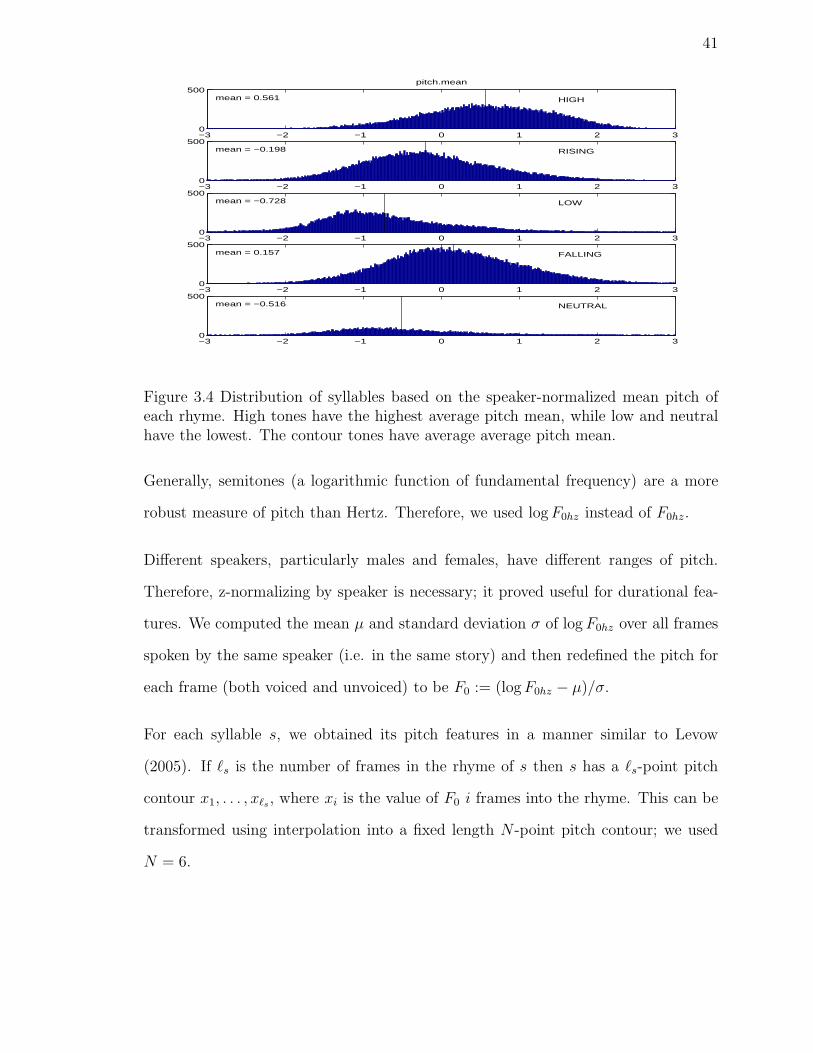
Figure 3.4 Distribution of syllables based on the speaker-normalized mean pitch ofeach rhyme. High tones have the highest average pitch mean, while low and neutralhave the lowest. The contour tones have average average pitch mean.
Generally, semitones (a logarithmic function of fundamental frequency) are a more
robust measure of pitch than Hertz. Therefore, we used log F0hz instead of F0hz.
Different speakers, particularly males and females, have different ranges of pitch.
Therefore, z-normalizing by speaker is necessary; it proved useful for durational fea-
tures. We computed the mean µ and standard deviation σ of log F0hz over all frames
spoken by the same speaker (i.e. in the same story) and then redefined the pitch for
each frame (both voiced and unvoiced) to be F0 := (log F0hz − µ)/σ.
For each syllable s, we obtained its pitch features in a manner similar to Levow
(2005). If ℓs is the number of frames in the rhyme of s then s has a ℓs-point pitch
contour x1, . . . , xℓs, where xi is the value of F0 i frames into the rhyme. This can be
transformed using interpolation into a fixed length N -point pitch contour; we used
N = 6.

42
We then computed the following 2N + 9 = 21 features :
• f0 n:N, where n varies from 1 to N . This is the N -point pitch contour.
f0 1:N is F0 at the start of the rhyme,
f0 N:N is F0 at the end of the rhyme,
f0 n:N is F0 at a fraction (n-1)/(N-1) of the way into the rhyme is obtained
using interpolation of x1, . . . , xℓ (ℓ = ℓs).
• D(f0) n:(N-1), where n varies from 1 to N −1. This is the (N −1)-point pitch
difference contour.
D(f0) n:(N-1) := (f0 n+1:N) - (f0 n:N) .
• f0 mean : mean of x1, . . . , xℓ. This is the average pitch across the rhyme. Note
the computation with the original variable-length contour, not the duration-
normalized fixed-length contour.
• f0 stdv : standard deviation of x1, . . . , xℓ.
• f0 med : median of x1, . . . , xℓ.
• f0 max : maximum of x1, . . . , xℓ.
• f0 min : minimum of x1, . . . , xℓ.
• f0 range = f0 max − f0 min : range of values of the f0 across the rhyme.
• f0 grad : Gradient of the line of best fit to x1, . . . , xℓ.
• f0 grad12 : Gradient of the line of best fit to xℓ/2, . . . , xℓ i.e. gradient of the
pitch contour in the last half of the rhyme.

43
• f0 grad34 : Gradient of the line of best fit to x1, . . . , x3ℓ/4 i.e. gradient of the
pitch contour in the first three quarters of the rhyme.
• f0 grad54 : Gradient of the line of best fit to x1, . . . , x5ℓ/4 i.e. gradient of the
pitch contour in the ‘stretched rhyme’ i.e. the rhyme plus a quarter of the way
into the next syllable (onset included).
These features were then normalized again, using PSSZN. With these doubly normal-
ized 21 pitch features, MPCorr was 0.3823, Accuracy 54.64%, and MeanF 0.4222. No
syllables with neutral tone were ever recognized. Table 3.5 shows the corresponding
confusion matrix, and Table 3.6 has more details of the result.
It is notable that no syllable is ever recognized as having neutral tone — pitch is
completely useless for recognizing neutral tone. Pitch also has some trouble
recognizing low tone.
The pitch trimming helped; without it, MPCorr was 0.3744, Accuracy 54.26%, MeanF
0.4172. In addition, comparing PCorr pairwise for each test example using the
Wilcoxon test shows that trimmed measurements are significantly better.
The second normalization (feature-wise in addition to frame-wise) also helped; with-
out PSSZN, MPCorr was only 0.3640, RMSE 0.6708, Accuracy 53.5%, and MeanF 0.4044.
It is still possible that not all our 21 pitch features are useful. To determine which
features are more important, we carried out 21 experiments. In each experiment we
determined classification performance when all but one of the pitch features was used.
Results are listed in Table 3.7.
Different measures of performance react differently to a feature’s removal. For ex-

44
Table 3.5 Confusion Matrix when using only twenty one pitch-based features. Notethat the neutral tone is never recognized. 22291 out of 40798 test examples werecorrectly classified.
High Rising Low Falling NeutralHigh 4974 1983 155 2147 0Rising 1690 6574 424 1309 0Low 488 1736 1633 1862 0
Falling 1881 1780 568 9110 1Neutral 238 1166 354 725 0
Table 3.6 Performance when using only twenty one pitch-based features. The classi-fication accuracy is 54.63%.
Ave PCorr Recall Precision F scoreHigh 0.3868 0.5372 0.5365 0.5369Rising 0.3866 0.6576 0.4966 0.5658Low 0.2484 0.2855 0.5211 0.3689
Falling 0.4874 0.6829 0.6012 0.6395Neutral 0.0920 0.0000 0.0000 0.0000Mean 0.3202 0.4327 0.4311 0.4222
Overall 0.3823

45
−3 −2 −1 0 1 2 30
500
pitch.stdv
HIGHmean = −0.360
−3 −2 −1 0 1 2 30
500 RISINGmean = −0.085
−3 −2 −1 0 1 2 30
500 LOWmean = 0.100
−3 −2 −1 0 1 2 30
500 FALLINGmean = 0.306
−3 −2 −1 0 1 2 30
500 NEUTRALmean = −0.198
Figure 3.5 Distribution of syllables based on the speaker-normalized standard devia-tion of the pitch contour of each syllable.
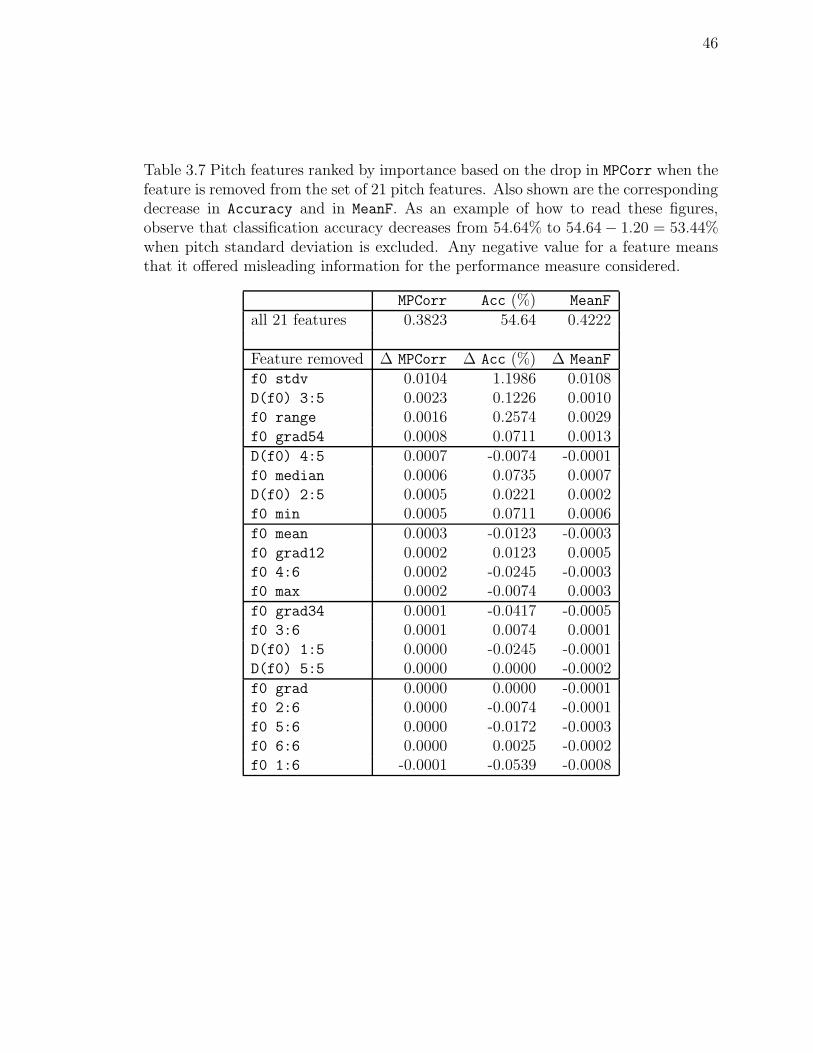
ample, when mean f0 is removed, MPCorr decreases from 0.3823 to 0.3820 while
Accuracy increases from 54.64% to 54.65%. Both changes are significant since the
number of test examples is large. In this thesis, we are more interested at this stage
in good probability estimation than classification accuracy,
The most obvious result is that the most important features measure changes
in pitch rather than the value of the pitch. The most important feature is the
standard deviation of the pitch, which measures how much the pitch changes. Like
the third most important feature (pitch range = maximum minus minimum value
of pitch during the duration of the rhyme), it does not measure the direction of the
change i.e. whether a syllable is rising or falling. However, as Figure 3.5 shows,
the pitch in falling syllables tends to vary far more than it does for other syllables.
Unsurprisingly, high toned syllables have the least variation in pitch.
46
Table 3.7 Pitch features ranked by importance based on the drop in MPCorr when thefeature is removed from the set of 21 pitch features. Also shown are the correspondingdecrease in Accuracy and in MeanF. As an example of how to read these figures,observe that classification accuracy decreases from 54.64% to 54.64 − 1.20 = 53.44%when pitch standard deviation is excluded. Any negative value for a feature meansthat it offered misleading information for the performance measure considered.
MPCorr Acc (%) MeanF
all 21 features 0.3823 54.64 0.4222
Feature removed ∆ MPCorr ∆ Acc (%) ∆ MeanF
f0 stdv 0.0104 1.1986 0.0108D(f0) 3:5 0.0023 0.1226 0.0010f0 range 0.0016 0.2574 0.0029f0 grad54 0.0008 0.0711 0.0013D(f0) 4:5 0.0007 -0.0074 -0.0001f0 median 0.0006 0.0735 0.0007D(f0) 2:5 0.0005 0.0221 0.0002f0 min 0.0005 0.0711 0.0006f0 mean 0.0003 -0.0123 -0.0003f0 grad12 0.0002 0.0123 0.0005f0 4:6 0.0002 -0.0245 -0.0003f0 max 0.0002 -0.0074 0.0003f0 grad34 0.0001 -0.0417 -0.0005f0 3:6 0.0001 0.0074 0.0001D(f0) 1:5 0.0000 -0.0245 -0.0001D(f0) 5:5 0.0000 0.0000 -0.0002f0 grad 0.0000 0.0000 -0.0001f0 2:6 0.0000 -0.0074 -0.0001f0 5:6 0.0000 -0.0172 -0.0003f0 6:6 0.0000 0.0025 -0.0002f0 1:6 -0.0001 -0.0539 -0.0008

47
−3 −2 −1 0 1 2 30
500
pitch.gradient54
HIGH
mean = 0.022
−3 −2 −1 0 1 2 30
500RISING
mean = 0.504
−3 −2 −1 0 1 2 30
500LOW
mean = −0.010
−3 −2 −1 0 1 2 30
500FALLING
mean = −0.413
−3 −2 −1 0 1 2 30
500NEUTRAL
mean = 0.175
Figure 3.6 Distribution of syllables based on the speaker-normalized grad54 of thepitch contour of each rhyme. This is the gradient of the pitch contour in the rhymeand a quarter of the way into the next syllable.
Of the four gradient measures, the most important one is grad54, which takes into
account the start of the following syllable. Also surprising is the fact that the features
involving the magnitude of the pitch change (standard deviation and range) are more
important than the direction of said change. Figure 3.6 shows the distribution of
grad54 for the five tones. As expected, it is very positive for rising tones, very
negative for falling tones and near zero for the level tones.

48
−3 −2 −1 0 1 2 30
500
1000
1500pitch.derivcontour.3:5
HIGH
mean = 0.121
−3 −2 −1 0 1 2 30
500
1000
1500RISING
mean = 0.517
−3 −2 −1 0 1 2 30
500
1000
1500LOW
mean = −0.204
−3 −2 −1 0 1 2 30
500
1000
1500FALLING
mean = −0.387
−3 −2 −1 0 1 2 30
500
1000
1500NEUTRAL
mean = 0.048
Figure 3.7 Distribution of syllables based on the speaker-normalized difference of themiddle of the pitch contour of each rhyme (diff(f0) 3:5).
MPCorr Accuracy MeanF
All 21 features 0.3823 54.64 0.4222
Minus grad 0.3823 54.64 0.4223
Minus grad34 0.3822 54.68 0.4227
Minus grad12 0.3821 54.63 0.4217
Minus grad54 0.3815 54.57 0.4209
Minus all grads 0.3803 54.18 0.4178
Minus stdv + range 0.3714 53.48 0.4116
Minus all grads + stdv + range 0.3687 52.68 0.4050
Next, consider the two sets of measures we have of the pitch contour. We have the
6-point absolute pitch contour itself, and the 5-point difference contour. The former
are amongst the least important features, and if we leave the entire absolute contour
out, our performance actually improves on two measures (MeanF 0.4235, Accuracy

49
54.75%) though not on the primary measure MPCorr (0.3820). On the other hand,
the difference features are among the more important features, particularly in the
middle of the rhyme. If the 5-point difference contour is removed from the feature
set, performance drops on all measures: MPCorr 0.3787, Accuracy 54.38%, and MeanF
0.4206.
Figure 3.7 shows that, like the gradient features, the pitch in the middle of the rhyme
is usually increasing a lot for rising tones and decreasing a lot for falling tones.
3.5 Features based on Overall Intensity
Intensity is not as important as pitch in tone recognition, but it does play a role, as
noted by Kratochvil (1998).
For each story, we computed the intensity E for all frames using Praat’s Boersma
and Weenink (2005) “To Intensity... 0 50” command. Frames were 16ms apart and
had the energy between 0 and 4000 Hz. No logarithmizing was done.
Having obtained an intensity contour for the entire story — no interpolation being
necessary — we computed 21 intensity features in the same way as our 21 pitch
features. MPCorr was 0.2970, Accuracy 42.23%, and MeanF 0.3182. Table 3.9 has the
confusion matrix and Table 3.8 has more details. (Again, these features are doubly
speaker-normalized. If we normalize only by frame and do not use PSSZN, MPCorr
drops to 0.2926, Accuracy 42.12%, and MeanF 0.3099.)
Research in other languages (Sluijter and van Heuven (1996), Tamburini (2003))
suggests that the energy below 500 Hz is not useful to the recognition of intonational

50
Table 3.8 Performance when using only twenty one overall intensity-based features.17231 out of 40798 test examples were correctly classified (Classification Accuracy =42.23%)
Ave PCorr Recall Precision F scoreHigh 0.2793 0.2453 0.4019 0.3046Rising 0.3038 0.4306 0.4424 0.4364Low 0.2010 0.1591 0.4163 0.2302
Falling 0.3771 0.7211 0.4209 0.5315Neutral 0.1271 0.0507 0.3378 0.0882Mean 0.2576 0.3214 0.4038 0.3182
Overall 0.2970
Table 3.9 Confusion Matrix when using only twenty one pitch-based features. Notethat the neutral tone is never recognized.
High Rising Low Falling NeutralHigh 2271 1905 173 4884 26Rising 1484 4305 427 3736 45Low 442 1333 910 2945 89
Falling 1403 1834 397 9619 87Neutral 51 355 279 1672 126

51
patterns. To verify this, we performed the same classification task using the intensity
above 500Hz instead of overall intensity. Recognition performance dropped; MPCorr
was 0.2735, Accuracy 38.03, and MeanF 0.2652. We therefore concluded that the
energy under 500Hz was still useful for tone recognition in Mandarin.
As with pitch, we then performed 21 experiments. In each one, we calculated the loss
in performance when one of the intensity features was removed from the full set. Table
3.10 shows the features ranked according to which ones’ removal caused the most loss
in MPCorr. The gradient features, particularly grad54, were most important, which is
rather surprising, considering that they are not commonly used features. Figure 3.8
shows the distribution of this feature for each of the five tones. They are particularly
useful for neutral tones i.e. the intensity in neutral toned syllables decreases a great
deal during the course of the rhyme.
As with pitch, the absolute intensity contour is not as useful as the difference contour.
In fact, the most useful measure of absolute intensity during the rhyme is not the
contour or mean or median, but the maximum intensity. The intensity in low and
neutral toned syllables does not tend to go high, as shown in Figure 3.9.

52
−3 −2 −1 0 1 2 30
500
intensity.gradient54
HIGHmean = 0.209
−3 −2 −1 0 1 2 30
500RISING
mean = 0.310
−3 −2 −1 0 1 2 30
500LOW
mean = −0.057
−3 −2 −1 0 1 2 30
500FALLING
mean = −0.241
−3 −2 −1 0 1 2 30
500NEUTRAL
mean = −0.600
Figure 3.8 Distribution of syllables based on grad54, the gradient of the intensitycontour in the rhyme and the first quarter of the succeeding syllable.
−3 −2 −1 0 1 2 30
500
intensity.max
HIGHmean = 0.218
−3 −2 −1 0 1 2 30
500RISING
mean = −0.132
−3 −2 −1 0 1 2 30
500LOW
mean = −0.461
−3 −2 −1 0 1 2 30
500FALLING
mean = 0.220
−3 −2 −1 0 1 2 30
500NEUTRAL
mean = −0.436
Figure 3.9 Distribution of syllables based on the maximum intensity during the rhyme.

53
Table 3.10 Intensity features ranked by importance based on the drop in MPCorr
when the feature is removed from the set of 21 PSSZN overall intensity features. Alsoshown are the corresponding decrease in Accuracy and in MeanF. As an example ofhow to read these figures, observe that classification accuracy decreases from 42.23%to 42.23− 0.24 = 41.99% when grad54 is excluded. Any negative value for a featuremeans that it offered misleading information for the performance measure considered.
PCorr Acc MeanF
All 21 features 0.2970 42.23 0.3182Feature Removed ∆ PCorr ∆ Acc ∆ MeanF
int grad54 0.0023 0.2402 0.0031int grad34 0.0016 0.2010 0.0029int max 0.0015 0.0368 0.0034int grad 0.0006 0.0907 0.0014int median 0.0002 0.1373 0.0030D(int) 4:5 0.0001 0.0515 0.0011D(int) 5:5 0.0001 0.0809 0.0009int stdv 0.0001 0.0637 0.0004int range 0.0001 -0.0147 -0.0012int 4:6 0.0001 0.0539 0.0007int min 0.0001 0.0024 -0.0011D(int) 2:5 0.0000 0.0049 0.0000D(int) 3:5 0.0000 0.0073 0.0008int grad12 0.0000 -0.0711 -0.0006int 1:6 0.0000 0.0073 0.0002int 2:6 0.0000 -0.0343 -0.0006int 6:6 0.0000 0.0466 -0.0007int mean 0.0000 0.0980 0.0011D(int) 1:5 -0.0001 0.0515 0.0018int 3:6 -0.0001 0.0319 0.0004int 5:6 -0.0001 0.0196 0.0006

54
−3 −2 −1 0 1 2 30
500
intensity.median
HIGHmean = 0.234
−3 −2 −1 0 1 2 30
500RISING
mean = −0.036
−3 −2 −1 0 1 2 30
500LOW
mean = −0.549
−3 −2 −1 0 1 2 30
500FALLING
mean = 0.150
−3 −2 −1 0 1 2 30
500NEUTRAL
mean = −0.296
Figure 3.10 Distribution of syllables based on the median intensity during the rhyme.
3.6 Combining the Duration, Pitch, and Intensity Features
With 21 pitch, 21 intensity, and 6 durational features, we calculated performance
when using all 48 features. MPCorr was 0.4388, Accuracy 58.93%, and MeanF 0.5241.
There is still some trouble with recognizing the low and neutral tones.
Table 3.11 Performance when using only all 48 local features based on pitch, duration,and intensity. 24043 out of 40798 test examples were correctly classified (ClassificationAccuracy = 58.93%.
Ave PCorr Recall Precision F scoreHigh 0.4354 0.5671 0.5880 0.5774Rising 0.4618 0.6578 0.5798 0.6164Low 0.2920 0.3476 0.5483 0.4255
Falling 0.5269 0.7202 0.6104 0.6608Neutral 0.2233 0.2501 0.5344 0.3407Mean 0.3879 0.5086 0.5722 0.5241
Overall 0.4388

55
Table 3.12 Confusion Matrix when using all 48 local features based on pitch, duration,and intensity.
High Rising Low Falling NeutralHigh 5251 1630 205 2101 72Rising 1493 6576 529 1299 100Low 399 1420 1988 1769 143
Falling 1680 1170 657 9607 226Neutral 108 545 247 962 621
We performed 48 experiments, each removing one feature, to determine which fea-
ture’s removal caused the most drop in MPCorr. The results of this are summarized
in Table 3.13. Naturally, the pitch features were more important than the intensity
features. Surprisingly, the durational features tended to be more important than
the pitch features individually. As a whole, of course, the pitch features were more
important as there are far more pitch features than there are durational features.
One of the reasons durational features are so important is that they help recognize
neutral tones. This is shown in Table 3.14, which orders the features according to the
drop in MPCorr among neutral toned syllables when the feature is removed. It clearly
shows that the most important features for recognition of neutral tone are durational
followed by intensity-based features. Even the most useful pitch feature — standard
deviation — does not make the top ten.
3.7 Conclusions
This chapter provides one of the largest and most detailed investigations of basic local
acoustic features for Mandarin tone recognition. It provides a solid foundation for

56
Table 3.13 Features ranked by importance based on the drop in MPCorr when thefeature is removed from the set of all 48 basic features.
MPCorr Accuracy MeanF
All 48 features 0.4388 58.93 0.5241Feature Removed ∆ MPCorr ∆ Accuracy ∆ MeanF
rhyme numvoiced 0.0056 0.5963 0.0053f0 stdv 0.0054 0.6698 0.0061syll numvoiced 0.0039 0.2752 0.0036syll duration 0.0033 0.3340 0.0129rhyme duration 0.0028 0.2139 0.0077int grad54 0.0021 0.2629 0.0023rhyme nsil duration 0.0016 0.1330 0.0030D(f0) 3:5 0.0016 0.2237 0.0009f0 range 0.0008 0.1085 0.0012f0 grad54 0.0008 0.1600 0.0017int max 0.0008 0.0178 0.0009f0 median 0.0007 0.1036 0.0009D(f0) 2:5 0.0005 0.0570 0.0004f0 max 0.0005 0.0448 0.0008int grad34 0.0004 0.1551 0.0024int median 0.0004 -0.0557 -0.0016D(f0) 4:5 0.0003 0.0889 0.0011f0 mean 0.0003 0.0889 0.0001f0 min 0.0003 0.0448 0.0005syll nsil duration 0.0002 0.0227 0.0004f0 grad12 0.0002 0.0301 0.0002f0 4:6 0.0002 0.0325 -0.0001int stdv 0.0002 0.0153 0.0001int grad 0.0002 0.0987 0.0011f0 grad 0.0001 0.0472 0.0006f0 2:6 0.0001 0.0497 0.0006f0 5:6 0.0001 0.0031 -0.0002D(int) 1:5 0.0001 0.0399 0.0002D(int) 4:5 0.0001 0.0202 -0.0001int 2:6 0.0001 0.0595 0.0011int 6:6 0.0001 0.0399 0.0003int mean 0.0001 0.0031 0.0003D(f0) 1:5 0.0000 0.0031 -0.0001D(f0) 5:5 0.0000 -0.0214 -0.0003f0 grad34 0.0000 0.0546 0.0007f0 3:6 0.0000 0.0693 0.0004f0 6:6 0.0000 -0.0018 0.0001D(int) 2:5 0.0000 0.0766 0.0008D(int) 3:5 0.0000 0.0448 0.0005int range 0.0000 0.0227 0.0002int grad12 0.0000 0.0031 -0.0005int 3:6 0.0000 0.0521 0.0007int 4:6 0.0000 0.0227 0.0003int 5:6 0.0000 0.0595 0.0007int min 0.0000 0.0448 0.0001f0 1:6 -0.0001 -0.0092 -0.0006D(int) 5:5 -0.0001 0.0178 0.0002int 1:6 -0.0001 0.0104 0.0000

57
Table 3.14 Features ranked by importance based on the drop in MPCorr for neutral-toned syllables when the feature is removed from the set of all 48 basic features.
MPCorr (neut) MPCorr Accuracy MeanF
All 21 features 0.2233 0.4388 58.9300 0.5241Feature Removed ∆ MPCorr (neut) ∆ MPCorr ∆ Accuracy ∆ MeanF
syll duration 0.0291 0.0033 0.3340 0.0129rhyme duration 0.0208 0.0028 0.2139 0.0077syll numvoiced 0.0065 0.0039 0.2752 0.0036rhyme nsil duration 0.0050 0.0016 0.1330 0.0030int max 0.0041 0.0008 0.0178 0.0009int grad34 0.0035 0.0004 0.1551 0.0024int grad 0.0024 0.0002 0.0987 0.0011rhyme numvoiced 0.0012 0.0056 0.5963 0.0053D(int) 1:5 0.0011 0.0001 0.0399 0.0002int median 0.0011 0.0004 -0.0557 -0.0016int grad54 0.0008 0.0021 0.2629 0.0023int 2:6 0.0008 0.0001 0.0595 0.0011f0 stdv 0.0007 0.0054 0.6698 0.0061syll nsil duration 0.0006 0.0002 0.0227 0.0004f0 6:6 0.0002 0.0000 -0.0018 0.0001D(int) 4:5 0.0002 0.0001 0.0202 -0.0001int grad12 0.0002 0.0000 0.0031 -0.0005D(f0) 2:5 0.0001 0.0005 0.0570 0.0004f0 grad34 0.0001 0.0000 0.0546 0.0007f0 grad54 0.0001 0.0008 0.1600 0.0017D(int) 3:5 0.0001 0.0000 0.0448 0.0005int 1:6 0.0001 -0.0001 0.0104 0.0000int 3:6 0.0001 0.0000 0.0521 0.0007D(f0) 5:5 0.0000 0.0000 -0.0214 -0.0003f0 grad 0.0000 0.0001 0.0472 0.0006f0 grad12 0.0000 0.0002 0.0301 0.0002f0 4:6 0.0000 0.0002 0.0325 -0.0001f0 median 0.0000 0.0007 0.1036 0.0009int mean 0.0000 0.0001 0.0031 0.0003D(f0) 3:5 -0.0001 0.0016 0.2237 0.0009f0 3:6 -0.0001 0.0000 0.0693 0.0004D(int) 2:5 -0.0001 0.0000 0.0766 0.0008D(int) 5:5 -0.0001 -0.0001 0.0178 0.0002int stdv -0.0001 0.0002 0.0153 0.0001int 5:6 -0.0001 0.0000 0.0595 0.0007D(f0) 1:5 -0.0002 0.0000 0.0031 -0.0001D(f0) 4:5 -0.0002 0.0003 0.0889 0.0011f0 2:6 -0.0002 0.0001 0.0497 0.0006f0 mean -0.0002 0.0003 0.0889 0.0001int 4:6 -0.0002 0.0000 0.0227 0.0003int min -0.0002 0.0000 0.0448 0.0001f0 range -0.0004 0.0008 0.1085 0.0012f0 5:6 -0.0004 0.0001 0.0031 -0.0002int range -0.0005 0.0000 0.0227 0.0002f0 1:6 -0.0006 -0.0001 -0.0092 -0.0006int 6:6 -0.0006 0.0001 0.0399 0.0003f0 max -0.0007 0.0005 0.0448 0.0008f0 min -0.0007 0.0003 0.0448 0.0005

58
the rest of this thesis.
Over a hundred experiments were carried out in this chapter, resulting in (amongst
others) the following observations:
• Pitch is of little use in recognizing neutral tone. For that, duration and intensity
features are more important.
• Individually, the most important features are durational, followed by pitch and
intensity. As a whole, pitch features are more important than durational fea-
tures as there are more of them.
• Among the pitch features, those that deal with changes in pitch are more im-
portant than those dealing with absolute pitch.
• For both pitch and intensity, the difference contours are more important than
the absolute contours.
• Speaker normalization using PSSZN is important, even for pitch and intensity
where frame normalization has already occurred.
• The most important absolute intensity feature is the maximum value it reaches
during the rhyme.
• Gradient features, particularly grad54 (which accounts for the start of the fol-
lowing syllable), are useful for pitch and intensity, and should be further inves-
tigated.
• With our current features, recognition of neutral and low tones is still behind
the recognition of the other two tones.

CHAPTER 4
CONTOUR HEIGHT ADJUSTMENT
We observed in the previous chapter that for both pitch and intensity, the more
important features measured changes in height rather than height itself. It has been
suggested, particularly in the case of pitch, that the height of a contour needs to be
modified in order to be useful.
For example, if two high toned Mandarin syllables occur in a phrase, the latter tends
to have lower pitch because of phrase-level declination (Shih (1998), Liao (1994),
Shih (2000)) or discourse effects (Xu and Wang (1997)). Syllables following a focused
syllable tend to have lower pitch height and lower pitch range (Xu (1997)). Fujisaki’s
model of tone (Fujisaki et al. (1990)) considered the (log) pitch of a syllable to be the
sum of its lexical tone plus a phrase component and a base frequency.
Just as Levow (2005) obtained improved performance by modifying the pitch contour
of a phrase so that its gradient over the course of the phrase was zero, this chapter
investigates several simple changes for both pitch and intensity. It is a far more
extensive investigation than that done in Surendran and Levow (2006).
We are interested in a locally-based modification of the height of a pitch / intensity
contour. To do so, we considered several possibilities. First, note that our twenty-one
features for pitch and intensity can be divided into two classes:
HD Height Dependent. These N + 4 absolute features are changed if the height is
adjusted. They are mean, median, maximum, minimum, and the N -point con-
tour.
59

60
HI Height Independent. These N + 5 features are unchanged even if the height is
adjusted. They are standard deviation, range, the four gradient features, and
the (N − 1)-point difference contour.
Each form of height adjustment we considered involved subtracting a value vs from the
interpolated pre-frame-normalized contour x1, . . . , xℓsof a syllable s. The HD features
were then recomputed using the modified ℓs-point contour and PSSZ-Normalized.
(Note how the adjustment is done prior to the normalization; otherwise we could
have just added the adjustment as a feature since we are using a linear classifier.)
The syllable-dependent vs was one of the following. Note that v0 refers to the mean
of the pitch/intensity over all syllables spoken in the same phrase as s.
• Mstart : pitch/intensity 20ms before the start of the rhyme.
• Mmid : pitch/intensity at the middle of the rhyme.
• M1prev : mean value of pitch/intensity for the previous syllable in the phrase
(or v0 if this is the first syllable of the phrase).
• M1succ : mean value for the succeeding syllable in the phrase (or v0 if this is
the last syllable of the phrase).
• M1win : mean value for the previous, current, and succeeding syllable in the
phrase (or v0 if this is the first or last syllable of the phrase).
• M2prev : mean value for the previous two syllables in the phrase (or v0 if this
is the first or second syllable of the phrase).

61
• M2succ : mean value for the succeeding two syllables in the phrase (or v0 if this
is the penultimate or last syllable of the phrase).
• M2win : mean value for the five syllables around this syllable (or v0 if this is the
first, second, penultimate, or last syllable of the phrase).
For example, pitch min Mmid refers to the minimum pitch in the rhyme minus the
pitch in the middle of the rhyme, while intensity max M1prev refers to the maxi-
mum intensity in the rhyme minus the average intensity of the previous syllable. Mmid
refers collectively to the N +4 features involving height adjusted by mid-rhyme value.
4.1 Pitch Height Adjustment
Table 4.1 shows the results of classification with various sets of pitch-related features
based on the above choices. We reach the following conclusions.
• Most pitch height adjustments offer little advantage, with several worse than
their unadjusted counterparts.
• M1prev is the best pitch height adjustment. In other words, it is useful to
subtract the average pitch of the previous syllable from the pitch of the current
syllable.
• M1prev is better than M1win and M2prev is better than M2win. This suggests
that adjustments should not involve the pitch of succeeding syllables, only pre-
ceding ones. This is important for linguistic arguments about pitch assimilation
and carryover; as noted by Xu (1997), the pitch of a syllable is more likely to
be affected by the preceding than the succeeding syllable.

62
Table 4.1 Classification performance using various subsets of pitch features based onpitch height adjustment. The baseline is HI + HD, which is our basic twenty-onelocal features. Accuracy when using only the ten pitch height-dependent features is52.38%. This changes to 52.17% when adjusted by the mean pitch in the previoussyllable’s rhyme. Accuracy when the two experiments are repeated with the elevenheight-independent features added is 54.64% (baseline) and 54.98% respectively, andincreases to 56.47% when all three sets of features are combined.
MPCorr Accuracy MeanF
HD 0.3640 52.38 0.4037Mmid 0.3337 48.55 0.3307Mstart 0.3308 48.46 0.3315M1prev 0.3694 52.17 0.3995M1succ 0.3462 49.61 0.3714M1win 0.3661 51.83 0.4001M2prev 0.3675 52.66 0.4060M2succ 0.3521 50.53 0.3816M2win 0.3655 52.27 0.4045HI 0.3490 51.58 0.3658HI+ Mmid 0.3525 51.80 0.3697HI+ Mstart 0.3522 51.81 0.3692HI+ M1prev 0.3889 54.98 0.4230HI+ M1succ 0.3657 52.71 0.3957HI+ M1win 0.3848 54.61 0.4220HI+ M2prev 0.3859 55.19 0.4258HI+ M2succ 0.3711 53.39 0.4056HI+ M2win 0.3839 54.98 0.4261HI+ HD 0.3823 54.64 0.4222HI+ HD+ Mmid 0.3846 55.02 0.4263HI+ HD+ Mstart 0.3844 54.80 0.4234HI+ HD+ M1prev 0.3989 56.47 0.4408HI+ HD+ M1succ 0.3855 54.85 0.4248HI+ HD+ M1win 0.3915 55.51 0.4331HI+ HD+ M2prev 0.3919 55.92 0.4355HI+ HD+ M2succ 0.3850 54.51 0.4221HI+ HD+ M2win 0.3872 55.18 0.4289

63
• M1prev is better than M2prev, suggesting that a ’look-back’ of more than one
syllable is harmful. This is unexpected, and an important discovery.
• Classification performance is similar using HD and M1prev. However, they are
not redundant sets of features, since performance improves when both are used.
Admittedly, classification accuracy decreases slightly (from 54.64% to 56.47%),
but the more important measures show improvement when the N + 4 M1prev
features are added to the 2N+9 unadjusted features (HI+ HD) : MPCorr increases
from 0.3823 to 0.3989, and MeanF increases from 0.4222 to 0.4408. Table 4.2
shows the confusion matrix using these 31 features, while Table 4.3 shows the
resulting summary statistics.
• Pitch features are good (per class F score above 0.5) at recognizing falling,
rising, and high tones, decent for recognizing low tones, and still completely
useless for recognizing neutral tones.
We shall use the set HI+ HD+ M1prev of 31 pitch features in all future experiments.
Table 4.2 Confusion Matrix when using the 31 pitch features HD + HI + M1prev.These pitch features clearly fail to recognize neutral tone.
High Rising Low Falling NeutralHigh 5261 1649 153 2196 0Rising 1493 6827 449 1227 1Low 461 1747 1845 1665 1
Falling 1934 1690 610 9104 2Neutral 234 1149 386 714 0
Of these 31 features, it would be useful to see which are most important. We thus
conducted 31 classification experiments, each with one feature removed. Results are

64
Table 4.3 Summary of classification results when using the 31 pitch features HD + HI
+ M1prev.
MPCorr Recall Precision MeanF
High 0.4095 0.5682 0.5607 0.5644Rising 0.4041 0.6829 0.5227 0.5921Low 0.2739 0.3226 0.5359 0.4028
Falling 0.4980 0.6825 0.6108 0.6446Neutral 0.0935 0.0000 0.0000 0.0000Average 0.3358 0.4512 0.4460 0.4408
shown in Table 4.4 with features ranked according to which one’s removal led to the
largest decrease in MPCorr.
Curiously, there are only two features, both to do with mid-rhyme height, where the
M1prev feature is ranked higher than its unadjusted equivalent. Despite that, the
benefit adjusted features combined is clear.

65
Table 4.4 Pitch features ranked by importance based on the drop in the averageMPCorr of the probability of correct prediction when the feature is removed from theset of 31 pitch features HD + HI + M1Prev.
MPCorr Acc (%) MeanF
all 31 features 0.3989 56.47 0.4408
Feature removed ∆ MPCorr ∆ Acc (%) ∆ MeanF
f0 stdv 0.0104 1.3481 0.0115D(f0) 3:5 0.0022 0.2549 0.0023f0 range 0.0014 0.3701 0.0038f0 grad54 0.0006 0.2010 0.0019D(f0) 2:5 0.0005 0.0270 0.0004D(f0) 4:5 0.0004 0.1201 0.0012f0 grad12 0.0002 0.0466 0.0007f0 mean 0.0002 0.0417 0.0002f0 min 0.0002 -0.0049 0.0001f0 grad34 0.0001 0.0221 0.0004f0 1:6 0.0001 0.0490 0.0005f0 5:6 0.0001 0.0466 0.0007f0 2:6 M1prev 0.0001 0.0098 0.0002f0 4:6 M1prev 0.0001 -0.0000 -0.0000f0 max M1prev 0.0001 0.0294 0.0002f0 mean M1prev 0.0001 0.0392 0.0003f0 min M1prev 0.0001 0.0392 0.0005D(f0) 5:5 -0.0000 -0.0515 -0.0005f0 grad -0.0000 0.0343 0.0003f0 2:6 -0.0000 0.0074 0.0001f0 3:6 -0.0000 0.0049 -0.0000f0 4:6 -0.0000 0.0245 -0.0000f0 6:6 -0.0000 0.0172 -0.0000f0 max -0.0000 0.0662 0.0006f0 median -0.0000 0.0098 0.0002f0 1:6 M1prev -0.0000 0.0074 -0.0000f0 3:6 M1prev -0.0000 0.0025 0.0001f0 5:6 M1prev -0.0000 0.0343 0.0004f0 6:6 M1prev -0.0000 0.0515 0.0003f0 median M1prev -0.0000 -0.0074 -0.0001D(f0) 1:5 -0.0002 -0.0245 -0.0003

66
4.2 Intensity Adjustments
We repeated our pitch height adjustment experiments with intensity measurements.
Table 4.5 shows the results.
Table 4.5 Classification performance using various subsets of intensity features basedon intensity height adjustment.
MPCorr Accuracy MeanF
HD 0.2851 39.87 0.2873Mmid 0.2808 40.19 0.2581Mstart 0.2745 39.09 0.2493M1prev 0.2821 39.94 0.2764M1succ 0.2824 39.62 0.2819M1win 0.2847 40.33 0.2878M2prev 0.2814 40.21 0.2826M2succ 0.2829 39.63 0.2811M2win 0.2823 40.12 0.2840HI 0.2808 40.19 0.2581HI+ Mmid 0.2822 40.42 0.2640HI+ Mstart 0.2840 40.51 0.2678HI+ M1prev 0.2939 42.09 0.3089HI+ M1succ 0.2940 41.82 0.3110HI+ M1win 0.2961 42.48 0.3205HI+ M2prev 0.2933 42.29 0.3147HI+ M2succ 0.2944 41.88 0.3116HI+ M2win 0.2941 42.30 0.3176HI+ HD 0.2970 42.23 0.3182HI+ HD+ Mmid 0.2971 42.23 0.3182HI+ HD+ Mstart 0.2986 42.25 0.3208HI+ HD+ M1prev 0.2989 42.63 0.3232HI+ HD+ M1succ 0.2992 42.39 0.3230HI+ HD+ M1win 0.2992 42.60 0.3247HI+ HD+ M2prev 0.2980 42.45 0.3223HI+ HD+ M2succ 0.2989 42.54 0.3247HI+ HD+ M2win 0.2985 42.62 0.3251
No adjustment works better than the unadjusted features, but several offer small but

67
significantly improved performance when added to the 21 intensity features. The best
such adjustment is M1win, which subtracts the mean of the three syllables centered
around the current syllable.
We decided to use the 31 intensity features HD + HI + M1win in future experiments,
namely the original 21 plus the 10 height-dependent features adjusted by the average
intensity in the three-syllable window surrounding the current syllable. Results of
classifying with these features can be found in Tables 4.6 and 4.7.
Table 4.6 Confusion Matrix when using the 31 intensity features HD + HI + M1win.
High Rising Low Falling NeutralHigh 2273 1914 191 4855 26Rising 1434 4395 409 3703 56Low 420 1379 1007 2820 93
Falling 1394 1874 408 9570 94Neutral 59 353 287 1651 133
Table 4.7 Summary of classification results when using the 31 intensity features HD +HI + M1win.
MPCorr Recall Precision MeanF
High 0.2814 0.2455 0.4073 0.3064Rising 0.3049 0.4396 0.4433 0.4414Low 0.2057 0.1761 0.4374 0.2511
Falling 0.3788 0.7174 0.4235 0.5326Neutral 0.1291 0.0536 0.3308 0.0922Mean 0.2600 0.3264 0.4085 0.3247
For completeness, and to determine the relative importance of these 31 features, we
carried out 31 experiments, in each one determining classification performance when
one feature was removed. Table 4.8 displays the results ordered by change in MPCorr.
1. Regardless of performance measure, the most important intensity features are

68
Table 4.8 Intensity features ranked by importance based on the drop in the averageMPCorr of the probability of correct prediction when the feature is removed from theset of 31 intensity features HD + HI + M1win.
MPCorr Acc (%) MeanF
all 31 features 0.2992 42.60 0.3247
Feature Removed ∆ MPCorr ∆ Acc (%) ∆ MeanF
int grad54 0.0022 0.2108 0.0030int grad34 0.0017 0.3064 0.0042int grad 0.0007 0.1961 0.0026int stdv 0.0002 -0.0441 -0.0006int 2:6 0.0002 0.0245 0.0003int max 0.0002 0.0515 0.0008int 2:6 M1win 0.0002 -0.0343 -0.0004int mean M1win 0.0002 -0.0368 -0.0004D(int) 2:5 0.0001 0.0466 0.0004D(int) 4:5 0.0001 0.0490 0.0008D(int) 5:5 0.0001 -0.0147 -0.0004int range 0.0001 0.0049 -0.0005int grad12 0.0001 0.0221 -0.0003int 1:6 0.0001 -0.0466 -0.0002int 3:6 0.0001 -0.0809 -0.0008int 5:6 0.0001 -0.0196 -0.0010int min 0.0001 0.0025 -0.0002int 1:6 M1win 0.0001 -0.0025 0.0000int 4:6 M1win 0.0001 0.0172 0.0001int 5:6 M1win 0.0001 0.0098 -0.0007int max M1win 0.0001 0.0147 0.0004int median M1win 0.0001 0.0294 0.0011D(int) 1:5 0.0000 -0.0245 0.0007D(int) 3:5 0.0000 0.0637 0.0003int 4:6 0.0000 -0.0123 -0.0001int 6:6 0.0000 -0.0368 -0.0007int mean 0.0000 0.0270 0.0009int median 0.0000 0.0343 0.0014int 3:6 M1win 0.0000 -0.0074 -0.0004int 6:6 M1win 0.0000 -0.0417 -0.0004int min M1win 0.0000 0.0172 0.0005

69
gradients : grad34, grad54,grad. They all include the second half of the rhyme,
but grad12, the gradient of that section, is the least important gradient feature
- possibly due to redundancy.
2. No feature’s removal resulted in an increase in MPCorr, suggesting that no fea-
ture is doing harm.
3. Several feature’s removal resulted in an increase in accuracy, though never more
than 0.1%.
4. The intensity difference contour is more important than the intensity contour
(adjusted by M1win or not).
5. The maximum intensity is more useful than the minimum or range (maximum−minimum).
6. Mean and median intensity are also useful, though not as useful as maximum.
4.3 Conclusions
Adjusting the height of both pitch and intensity helps, particularly for the former.
The improvement for intensity is small but significant. For pitch, it is better to
adjust using just the immediately preceding syllable than using succeeding syllables
or syllables further away. The former agrees with evidence from Xu (1997) that the
pitch of a syllable is more likely to be affected by the preceding than the succeeding
syllable. The latter, however, is surprising; we had expected a larger window to be
more beneficial.
Performance when using the 48 unadjusted features from the previous chapter is
MPCorr 0.4388, Accuracy 58.93%, and MeanF 0.5241.

70
When the twenty adjusted features (ten pitch, ten intensity) are added, MPCorr in-
creases to 0.4536, Accuracy to 60.40%, and MeanF to 0.5400. Tables 4.9 and 4.10
have more details.
We shall refer to the subset of 68 acoustic features (6 durational, 31 pitch, 31 overall
intensity) as PID68. Normalization at the syllable level (PSSZN) is useful for all
features, and this will be always be assumed in future.
Despite the improvement, more work still clearly remains to be done, particularly for
Low and Neutral tone recognition.
Table 4.9 Confusion Matrix when using the 68 PID features.
High Rising Low Falling NeutralHigh 5432 1367 206 2177 77Rising 1319 6787 534 1254 103Low 355 1466 2186 1561 151
Falling 1677 1180 673 9608 202Neutral 138 520 291 906 628
Table 4.10 Summary of classification results when using the PID68 features.
MPCorr Recall Precision MeanF
High 0.4541 0.5867 0.6089 0.5976Rising 0.4771 0.6789 0.5996 0.6368Low 0.3201 0.3822 0.5620 0.4550
Falling 0.5356 0.7202 0.6196 0.6662Neutral 0.2248 0.2529 0.5409 0.3447Mean 0.4023 0.5242 0.5862 0.5400
Overall 0.4536

CHAPTER 5
VOICE QUALITY MEASURES FOR MANDARIN TONE
RECOGNITION
Traditionally, the acoustic cues used to automatically recognize Mandarin tones are
based on pitch, duration, and overall intensity. The previous chapters determined
good features based on them; now we look for alternative acoustic cues.
We wish to know if other cues can offer any additional information. In particular,
cues that measure, in some sense, the ‘strength of a syllable’. It is reasonable to
believe that such cues will aid the recognition of neutral and possibly low tones.
It has been reported (Davison (1991), Belotel-Greni and Greni (2004)) that the third
and fourth tones are sometimes produced with creaky voice. Syllables with neutral
tone cannot be lexically stressed.
There has been much investigation in the last ten years of Voice Quality (VQ). This
measures how far speech is from modal speech (Epstein (2002)). Modal speech cor-
responds to an ‘average’ half-open half-closed setting of the vocal folds.
VQ is hard to define perceptually, as listeners disagree on judging modality away from
categorical extremes (Kreiman and Gerratt (1996)), but articulatorily it measures
the tension of the vocal folds during speech (Pulakka (2005)). Generally, very closed
glottal constrictions lead to creaky voice while very open constrictions lead to breathy
voice (Ladefoged (1971); Keating and Esposito (2006)).
VQ has proved useful for various recognition tasks, such as emotion classification
71

72
(Gobl and Chasaide (2003)), detecting phrase boundaries in English (Epstein (2002))
and Swedish (Gobl (1988)). In vowel-by-vowel analysis, it is useful for detecting pitch
accent in German (Lintfert and Wokurek (2005)) and prominence / narrow focus in
English (Campbell and Beckman (1997); Eriksson et al. (2001)). On the other hand,
it is not a useful cue for detecting stress in Dutch (Sluijter and van Heuven (1996)).
5.1 Measures of Voice Quality Considered
Since there is no standard measure for VQ, we tried over twenty measures. Each is
defined for frames rather than syllables, and is PSSZ-Normalized.
For all features other than the band energy features, if a syllable had ℓ frames with
values x1, . . . , xℓ then the value of the feature for the syllable is a four-dimensional
vector consisting of:
• mean µ = 1ℓ
∑ℓi=1 xi,
• standard deviation√
1ℓ(ℓ−1)
∑ℓi=1(xi − µ)2,
• gradient of the line of best fit to x1, . . . , xℓ
• mid-point x⌊ℓ/s⌋
The band energy features are different in that each such feature has B bands. We
take the value of such a feature for a syllable to be a B-dimensional vector consisting
of only the mean of each band for all frames in the syllable.
Glottal Flow measures were calculated using Aparat, written by Airas et al. (2005),
and Harmonic-Formant measures were calculated using a Praat script of Yoon et al.

73
Figure 5.1 Idealized template of glottal opening shape giving rise to the OQa andClQ measure. The horizontal axis is time while the vertical axis is for the area of theglottal cross-section.
(2005). All other measures involving energy measurements were obtained using the
multi-taper spectrogram (Perceval and Walden (1993)) by considering overlapping
20ms frames of speech stepped every 5ms.
5.1.1 Glottal Flow Estimation
Some VQ measures are based on estimating glottal flow during speech and matching
it to idealized templates of glottal air flow to the data in the segment. An example
template is shown below: the horizontal axis is time while the vertical axis represents
the openness of the vocal folds (volume through it or the area of its cross-section).
The glottal opening time is the time between events a and b. OQa is the fraction
of the period that is spent opening the glottis, i.e. b−aperiod
. It is lower when the voice

74
quality is higher (Pulakka (2005)).
The glottal closing time is the time between events b and c. ClQ is the fraction of
the period that is spent closing the glottis, i.e. c−bperiod
. It is also lower when the voice
quality is higher.
Several other templates for glottal shapes have been suggested, leading to several
variations on OQa and ClQ. With a rectangular pulse instead of a triangular pulse,
the fraction of glottal closing time is called NAQ (Normalized Amplitude Quotient)
(Alku and Backstrom (2002)).
Variations of fraction of glottal opening time include the two Open Quotient mea-
sures OQ1, OQ2 (Holmberg et al. (1998)), the Quasi-Open Quotient QOQ. We also
considered the Speed Quotients SQ1, SQ2,
For each measure, we computed its values every 5ms as follows. We calculated the
value of each measure in overlapping segments of 32 ms and 64 ms (also stepped every
5ms) using Aparat Airas et al. (2005). We then defined the value of a measure at any
point in time to be the mean of its values in all segments containing the point.
5.1.2 Harmonic-Formant Differences
Another common measure of voice quality comes from careful analysis of the harmon-
ics and formants of the speech signal.
As Figure 5.2 from Keating and Esposito (2006) shows, harmonics are multiples of
the fundamental frequency of a segment of a speech signal. The amplitude of the
n-th harmonic (n × f0) is called Hn; only the first two harmonics H1 and H2 are

75
Figure 5.2 Speech spectrum |S(f)| in dB, showing harmonics H1= |S(F0)| and H2=|S(F1)| and the magnitudes A1 of the first formant and A2 of the second formant.Taken from Keating and Esposito (2006).
important for our purposes.
The position of the first two or three formants of a steady state sonorant are generally
enough to determine its identity. Each formant has one or two harmonics that occur
in or around it; the amplitude of the largest harmonic in the nth formant is called
An.
In the linear source-filter model, which is a simple but effective model of speech, the
positions of harmonics and formants are independent of each other. Harmonics are
determined by the vocal folds in the throat (the source) while formants are determined
by the state of the vocal tract and lips (the filter).
We used the method of Yoon et al. (2005) to calculate H1, H2, A1, A2, and A3
on our twenty stories. Two common measures of voice quality are the differences

76
H1−H2 and H1−A3 (Epstein (2002); Yoon et al. (2005)), and other differences were
also considered for the sake of completeness.
5.1.3 Spectral Center of Gravity
The Spectral Center of Gravity (SCG) was proposed in van Son and van Santen
(2005) as a summary measure for Spectral Balance, and was shown there to correlate
with lexical stress in American English.
If |S(f)| is the energy at frequency f , then the SCG is (∫
f |S(f)|df)/(∫
|S(f)|df).
SCG is higher when there is more energy at higher frequencies.
5.1.4 Spectral Tilt
The Spectral Tilt of a short segment of speech is defined to be the gradient of the
line of best fit to its spectrum between A and B Hertz. There has not been adequate
investigation of what the best values of A and B are, but we used A = 500 and
B = 4000.
5.1.5 Band Energy
Band Energy is the energy in each of a collection of frequency bands. This is much
easier to calculate than any of the measures previously calculated as no pitch calcu-
lation or inverse filtering is required. However, more values are required as this is not
a summary measure like all those mentioned above.

77
One of the earliest band energy measures to be found useful for an intonational
recognition task was Spectral Balance SvH4 , introduced by Sluijter and van Heuven
Sluijter and van Heuven (1996). It consists of the bands 0-500, 500-1000, 1000-2000
and 2000-4000 Hz, and predicts stress in Dutch sentences.
Another band energy measure, which we denote as vSN5, consists of bands 100-300,
300-800, 800-2500, 2500-3500 and 3500-8000 Hz; van Santen and Niu (2002) found
that a weighted combination of the energies in these bands correlates with pitch accent
and stress in American English.
We also used four other sets of bands:
EQ31 has the thirty-one overlapping bands of 250 Hz bandwidth between 0 and
4000Hz: 0-250 Hz, 125-375, 250-500,. . . , 3750-4000.
EQ15 has fifteen overlapping bands of 500 Hz bandwidth between 0 and 4000Hz :
0-500, 250-750, 500-1000, . . . , 3250-3750, 3500-4000.
EQ8 has a subset of bands of EQ15 : 0-500, 500-1000, 1000-1500, . . . , 3500-4000.
EQ7 has all but the 0-500 band of EQ8. This is because only bands above 500 Hz
should measure vocal effort ; increased effort shortens the closing phrase of the glottal
pulse, which leads to higher energies above 500Hz (Sluijter and van Heuven (1996)).
5.2 Classification Task
All VQ features (other than band energy, SCG and tilt) took a particularly long time
to compute. Therefore, the experiments reported in this section used a small subset

78
Table 5.1 Fractional distribution of tones in the subset of the Mandarin VOA TDT2Corpus used in most experiments in this chapter. There were 1383 syllables in total.
High Rising Low Falling Neutral0.22 0.26 0.14 0.33 0.06
of the data: 20 stories. To make up for this, we performed 4-fold cross-validation
with five stories per fold.
To this end, we fixed a dataset of news broadcast Mandarin speech, a classification al-
gorithm, and a set of core features involving pitch, overall intensity and duration. We
determined classification performance using these features, and then ran twenty other
experiments, in each one using the core set augmented by the ℓ− or B−dimensional
vector for a VQ feature.
The core set of features for each syllable were 66 of the PID68 features found in
Chapters 3 and 4. We did not use the non-silent rhyme or syllable durations owing
to an experimental error, but this is unlikely to affect our results.
5.3 Results
The best features were those based on band energy. This cannot be attributed merely
to such features having more than four dimensions, since even the Spectral Balance
measure of Sluijter and van Heuven (1996), which has just four bands, is better than
all features not involving band energy. Tables 5.3 and 5.4 show the confusion matrix
and other summary statistics using the 66 core features with and without the 7 band
energy features of EQ7. Most of the improvement is in the neutral tone; there is little
change in recognition for the third or fourth tones.

79
Table 5.2 Classification performance using a variety of VQ features in addition to acore set of 66 features based on overall intensity, pitch, and duration. The baseline,using no VQ features, is in bold.
MPCorr Accuracy MeanF VQ dim.EQ15 0.4498 0.6081 0.5594 15EQ7 0.4482 0.6077 0.5644 7EQ8 0.4476 0.6035 0.5613 8EQ31 0.4439 0.6002 0.5585 31vSN5 0.4414 0.6066 0.5521 5SvH4 0.4354 0.5907 0.5345 4tilt 0.4345 0.5945 0.5318 4OQa 0.4336 0.5862 0.5155 4H1−H2 0.4327 0.5911 0.5195 4NAQ 0.4318 0.5862 0.5194 4H1−A3 0.4314 0.5870 0.5191 4AQ 0.4308 0.5900 0.5214 4SCG 0.4308 0.5840 0.5095 4— 0.4306 0.5862 0.5132 0OQ2 0.4304 0.5862 0.5161 4H1−A2 0.4303 0.5873 0.5209 4ClQ 0.4301 0.5866 0.5174 4QOQ 0.4296 0.5892 0.5169 4SQ2 0.4284 0.5809 0.5068 4SQ1 0.4283 0.5847 0.5079 4OQ1 0.4281 0.5858 0.5173 4

80
Table 5.3 Confusion Matrix and other statistics when classifying 2656 syllables fromtwenty stories using 66 features based on duration, pitch and overall intensity, andno VQ features.
High Rising Low Falling Neutral Precision Recall F
High 297 115 10 149 8 0.593 0.513 0.550Rising 70 473 28 103 12 0.588 0.690 0.635Low 24 91 111 132 4 0.541 0.307 0.392Falling 98 84 39 637 19 0.599 0.726 0.656Neutral 12 41 17 43 39 0.476 0.257 0.333Mean 0.559 0.499 0.513
Table 5.4 Confusion Matrix and other statistics when classifying 2656 syllables fromtwenty stories using 66 features based on duration, pitch and overall intensity, plus15 features based on the mean energies in the bands EQ15.
High Rising Low Falling Neutral Precision Recall F
High 322 104 9 140 4 0.609 0.556 0.581Rising 80 466 31 101 8 0.611 0.679 0.643Low 31 86 113 129 3 0.538 0.312 0.395Falling 85 77 46 652 17 0.615 0.743 0.673Neutral 11 30 11 38 62 0.660 0.408 0.504Mean 0.606 0.540 0.559
Of the glottal features, OQa and NAQ work best. They have also proved more useful
than their variants elsewhere in the literature (Alku and Backstrom (2002); Pulakka
(2005)).
Of the formant-harmonic features, the differences H1−H2 and H1−A3 work, as ex-
pected, better than H1−A2.
While the size of the data does not permit many definitive conclusions, there is enough
evidence to suggest that band energy features, particularly EQ15, are an appropriate
measure of VQ for our purposes.

81
5.4 Band Energy Features
In chapters 3 and 4, we determined PID68, a set of 68 features based on pitch,
overall intensity, and duration and computed using at most a three-syllable window.
Using PID68, the average probability of a correct classification is 0.4536, classification
accuracy 60.40%, and average F score 0.5400. The hardest tones to recognize were
the neutral tone (F score 0.345) and low tone (F score 0.455); the F scores for other
tones were at least 0.6.
So far in this chapter, we have found that the band energy features EQ15 greatly
aid in the recognition of the neutral tone on a small dataset. We now investigate its
use on the same large dataset that we used in Chapter 3. We also consider various
subsets of the bands, both with and without PID68.
EQ15 consists of fifteen bands, each of 500Hz in bandwidth. Band energy measure-
ments were found using multi-taper spectral analysis (Perceval and Walden (1993)) by
considering overlapping 20ms speech chunks every 5ms. We refer to bands according
to their mid-frequency: The first band B250 covers 0-500 Hz, the second band B500
covers 250-750 Hz, B750 500-1000 Hz, . . ., B3500 3250-3750 Hz, B3750 3500-4000 Hz.
Suppose that a syllable s has energy measurements for ℓ := ℓs frames in its rhyme.
Let xin, for i = 1, . . . , ℓ and n = 1, . . . , 15 be the energy in the band 250n±250 Hz
for the i-th frame. For each band n we computed six features:
• grad : gradient of the band intensity contour x1n, x2n, . . . , xℓn.
• mean : average band-passed intensity µn := 1ℓ
∑ℓi=1 xin

82
• stdv : standard deviation
√
√
√
√
1
ℓ(ℓ − 1)
ℓ∑
i=1
(xin − µn)2
• mid : intensity in middle of rhyme: x⌈ ℓ
2⌉n
• meanMstart : mean minus rhyme-initial intensity : µn − x1n
• meanMmid : mean minus intensity in middle of rhyme : µn − x⌈ ℓ
2⌉n
Thus we considered 90 PSSZ-Normalized Band Energy features using 6 types of mea-
surements in 15 bands. Using the 90 features only, MPCorr was 0.3305, Accuracy
45.70%, MeanF 0.4185.
(As with the overall intensity features, while the improvement provided by PSSZ-
Normalization is significant at p < 0.01, it is small. Without it, MPCorr 0.3266,
Accuracy 45.70%, and MeanF 0.4142. Significance was measured, as before, using the
Wilcoxon Matched Pairs test on PCorr for each syllable using the 90 normalized and
unnormalized features.)
With just the 68 PID features, MPCorr is 0.4536, Accuracy 60.40%, and MeanF 0.5400.
Adding the 90 band features, MPCorr is 0.4888, Accuracy 64.06%, and MeanF 0.6159.
Band features result in a huge improvement in the recognition of neutral
tones : the F score for neutral toned syllables increases from 0.3447 with PID68 to
0.6139 with the additional 90 band features.

83
Table 5.5 Classification Results using all band measures in each of 15 bands. Forexample, when using the six measures summarizing the band energy between 0 and500 Hz, MPCorr is 0.2602, and it increases to 0.4569 with the PID68 features added.
MPCorr Acc (%) MeanF F (neutral)B250 0.2602 35.47 0.2066 0.0322B500 0.2667 37.09 0.2413 0.0111B750 0.2567 35.04 0.1979 0.0000B1000 0.2541 34.92 0.1879 0.0000B1250 0.2534 34.80 0.1885 0.0000B1500 0.2555 35.32 0.1960 0.0039B1750 0.2582 35.78 0.2074 0.0172B2000 0.2580 36.08 0.2078 0.0048B2250 0.2563 35.73 0.1980 0.0000B2500 0.2555 35.42 0.1919 0.0016B2750 0.2562 35.59 0.1960 0.0008B3000 0.2581 36.03 0.2014 0.0000B3250 0.2598 36.52 0.2048 0.0000B3500 0.2636 37.26 0.2279 0.0024B3750 0.2663 36.85 0.2363 0.0008Band90 0.3305 45.70 0.4185 0.4611PID68 0.4536 60.40 0.5400 0.3447PID68 + B250 0.4569 60.85 0.5485 0.3676PID68 + B500 0.4643 61.55 0.5664 0.4394PID68 + B750 0.4608 61.21 0.5623 0.4339PID68 + B1000 0.4562 60.77 0.5472 0.3669PID68 + B1250 0.4566 60.78 0.5502 0.3822PID68 + B1500 0.4594 60.96 0.5619 0.4420PID68 + B1750 0.4606 61.06 0.5615 0.4321PID68 + B2000 0.4589 61.01 0.5518 0.3771PID68 + B2250 0.4583 61.03 0.5472 0.3539PID68 + B2500 0.4584 61.06 0.5496 0.3703PID68 + B2750 0.4576 60.92 0.5468 0.3607PID68 + B3000 0.4576 60.67 0.5443 0.3583PID68 + B3250 0.4581 60.77 0.5434 0.3496PID68 + B3500 0.4573 60.73 0.5430 0.3494PID68 + B3750 0.4546 60.46 0.5403 0.3445PID68 + Band90 0.4888 64.06 0.6159 0.6139
5.5 Subsets of Band Energy Features
However, 90 band energy features is too many, and we need to investigate which of the
90 features are actually necessary. To do so, we computed classification performance
for each of the 90 band energy features; results are in Table 8.1 in the Appendix. The
most important frequencies were below 1000 Hz and above 3000 Hz. The former is
somewhat surprising considering that energy under 500 Hz has often been dismissed
as a measure of vocal strength. Also, the important features mostly involved mean,

84
grad, and meanMstart. At the other end, features involving meanMmid and stdv were
always in the bottom half of useful features regardless of which performance measure
was used.
Looking for patterns in a table with results from ninety experiments is difficult. Since
the features are made up of six measures from fifteen frequency bands, it made sense
to see what performance would be like with the appropriate subsets of features.
First, we performed two sets of fifteen experiments. In the first, we determined
classification performance for each of the 15 bands using each measurement for all six
types in that band. This was then repeated with the PID68 features added. Table 5.5
has the results. It shows, for example, that neutral tone is best recognized between
250-1000 Hz and between 1250-2000 Hz.
The result using all energy bands is far better than the result using any one frequency
band. This effect is much more pronounced when PID features are absent; the F score
for neutral tone using any band is under 0.04, but the same F score when all bands
are combined is 0.46.
The importance of a band depends on whether the PID68 features are present or not.
For example, consider the results when classifying using B750. Without any PID
features, the six features computed using the energy from 500-1000Hz are of no use
in recognizing neutral tone. But when PID features are included, the B750 features
provide valuable information on recognizing neutral tones; the F score for neutral
tone recognition increases from 0.345 to 0.434.
There is a relatively large gap between the amount of use of the most important
band (B500) and the other bands. But at the other end of the scale, it is difficult to

85
determine which bands can be left out. Listing the fifteen bands in descending order
of the increase in MPCorr when they are added to the PID68 features, we have B500,
B750, B1750, B1500, B2000, B2500, B2250, B3250, B2750, B3000, B3500, B250,
B1250, B1000, B3750. It is difficult to find any patterns that could justify leaving
the bottom n bands out for any value of n.
We therefore decided to keep all fifteen bands, and investigate instead the six types
of measures based on each band. Table 5.6 shows the result of two sets of six exper-
iments. In each we determined classification performance, with and without PID68,
using one of the six measurements (mean, grad, . . ., meanMmid) for all 15 bands.
The results of these experiments split the six types of band energy measurements into
three pairs.
1. The most important measurements are mean and mid.
2. The second most important are meanMstart and grad.
3. The least important are meanMend and stdv.
Table 5.6 shows the result of various subsets of these features. The primary result is
that if we use just the four most important summary statistics mean, mid, meanMstart,
grad for each of the fifteen bands, i.e. using 60 instead of 90 features, we can almost
match the performance with 90 bands, with MPCorr0.4864, classification accuracy
63.7%, and mean F score 0.6116. A further improvement in MPCorr from 0.4864 to
0.4888 is not worth thirty extra features, so we decided to use the 15×4 = 60 features
Band60 in future experiments. We will refer to the 128 feature combination of it with
PID68 as PIDB128.

86
Table 5.6 Classification results using various types of band energy features, before andafter adding the core set of pitch, durational, and overall intensity features PID68.mean refers to the 15 features involving the mean energy in each of the fifteen frequencybands, stdv is the 15 features involving the standard deviation of the energy in eachband, and so on. Band30 refers to the 30 features mean + mid while Band60 refersto the 60 features mean + mid + meanMstart + grad, and Band90 refers to all 90band energy features.
MPCorr Acc (%) MeanF F (neutral)mean 0.2852 38.63 0.3298 0.3322mid 0.2712 36.24 0.2711 0.1625grad 0.2624 36.51 0.2115 0.0893meanMstart 0.2621 36.08 0.2034 0.0154stdv 0.2506 34.61 0.1856 0.0024meanMmid 0.2469 32.94 0.1506 0.0000Band30 0.2904 39.12 0.3408 0.3365Band60 0.3198 44.29 0.3989 0.4258Band90 0.3321 46.02 0.4256 0.4785PID68 0.4536 60.40 0.5400 0.3447PID68 + mean 0.4762 63.01 0.5972 0.5530PID68 + mid 0.4705 62.42 0.5875 0.5230PID68 + meanMstart 0.4600 61.09 0.5566 0.4010PID68 + grad 0.4598 61.07 0.5564 0.4057PID68 + meanMmid 0.4582 61.00 0.5509 0.3734PID68 + stdv 0.4579 60.89 0.5501 0.3795PID68 + Band30 0.4793 63.18 0.5988 0.5550PID68 + Band60 0.4864 63.69 0.6116 0.6050PID68 + Band90 0.4888 64.06 0.6159 0.6139
5.6 Conclusions
We tested twenty possible measures of vocal strength in a small Mandarin tone classi-
fication task. While the size of the data does not permit many definitive conclusions,
there is enough evidence to suggest that band energy features are an appropriate
measure of VQ for our purposes.

87
Table 5.7 Confusion Matrix when classifying using PIDB128. 25983 out of 40798syllables were correctly classified, so that classification accuracy was 63.69%.
High Rising Low Falling NeutralHigh 5672 1308 263 1979 37Rising 1309 6739 546 1231 172Low 425 1358 2394 1404 138
Falling 1424 1131 715 9859 211Neutral 96 302 176 590 1319
Table 5.8 Classification performance using PIDB128. Classification Accuracy is63.69%.
MPCorr Precision (Recall) F
High 0.4819 0.6354 0.6126 0.6238Rising 0.4929 0.6218 0.6741 0.6469Low 0.3462 0.5848 0.4186 0.4879
Falling 0.5597 0.6545 0.7391 0.6942Neutral 0.4069 0.7027 0.5312 0.6050Mean 0.4575 0.6398 0.5951 0.6116
Overall 0.4864

88
Of the band energy features, Spectral Balance — the feature from the literature that
inspired our choice of other band energy measures — was the least useful for Mandarin
tone classification. EQ15 was the most useful.
EQ15 consists of fifteen bands, each containing the energy in a frequency band of
bandwidth 500Hz. In each band, we calculated the average energy, mid-rhyme energy,
change in energy in the first half of the rhyme, and gradient of the energy contour
through the rhyme. With these additional sixty features to add to PID68, classification
performance improved; MPCorr increases from 0.454 to 0.486, classification accuracy
improves from 60.4% to 63.7%, and the average F score increases from 0.540 to 0.612.
Most of this improvement is for neutral tones, the F score for which increases from
0.345 to 0.605. Clearly, band energy features are very useful for Mandarin Tone
Recognition. Future researchers will do well to investigate which bands, and combi-
nation of bands, provide the best cues, particularly for low tone, whose recall remains
below fifty percent.

CHAPTER 6
COARTICULATION
Tonal coarticulation refers to the tone of a syllable being realized differently depending
on the tones of the neighboring syllables (Xu (1997)). Human listeners somehow
compensate for this Xu (1991).
There are several possible ways of dealing with this problem automatically. First,
it would be worth establishing an upper bound on classification performance. If we
(hypothetically) knew what the preceding or succeeding syllable’s tone was, how well
could we recognize the current syllable’s tone?
This chapter considers two ways of doing so, in Sections 6.1 and 6.2, before proposing
a method in Section 6.3 to improve performance using guesses of context instead of
actual context.
6.1 Using different classifiers for different contexts
In our first set of experiments, we partitioned the full set of syllables (both training
and testing examples) into K contexts. For each context we created a different clas-
sifier using a common classification algorithm trained on the portion of the training
set with that context. The classifier was then tested on the portion of the testing set
with said context. This was done for all contexts, and the results combined.
We considered the following three sets of contexts:
89

90
Experiment 1A : Six contexts depending on preceding syllable. Context 0 had all
phrase-initial syllables. Context t, t = 1, . . . , 5, had all syllables whose preceding
syllable had tone t. (Tone 1 = High, 2 Rising, 3 Low, 4 Falling, 5 Neutral).
Experiment 1B : Six contexts depending on succeeding syllable. Context 0 had all
phrase-final syllables. Context t, t = 1, . . . , 5, had all syllables whose succeeding
syllable had tone t.
Experiment 1C : Thirty-five contexts depending on both the previous and succeed-
ing syllable. Context 6t+u has the preceding tone t and succeeding tone u. t is
0 for phrase-initial syllables and u is 0 for phrase-final syllables. For example,
context 4 = 6 · 0 + 4 is for phrase-initial syllables succeeded by the fourth tone
(Falling), context 12 = 6 · 2 + 0 is for phrase-final syllables preceded by the
second tone (Rising), and context 19 = 6 · 3 + 1 is for syllables preceded by
third tone (Low) and followed by first tone (High). There are no phrases with
one syllable, so context 0 does not exist.
Of course, during real experiments, we will never know what the true context of a
test example is. The aim of these experiments is to provide an upper bound on the
usefulness of context. Table 6.1 shows their results.
Context does provide an increase in classification accuracy, from 63.7% with no con-
text to 67.2% when the tones of both neighboring syllables are known. The mean F
score also improves, from 0.612 to 0.645.
However, while it is clear that context helps, there is still some ambiguity over which
context helps most. The context that provided the best MeanF and accuracy —
knowledge of both neighbors’ tones — did not provide the best MPCorr. In fact,

91
Table 6.1 Classification performance in experiments where syllables were classifieddifferently according to their tonal context. For example, when different classifierswere created conditioned on knowing the tone of the preceding syllable, the Mean Fscore was 0.6434 for all syllables and 0.6718 for all rising-toned syllables.
None Pre (1A) Post (1B) Pre & Post (1C)MPCorr 0.4864 0.5145 0.5127 0.4954Acc (%) 63.69 66.33 66.07 67.15MeanF 0.6116 0.6434 0.6384 0.6451F High 0.5986 0.6444 0.6480 0.6492F Rising 0.6338 0.6718 0.6745 0.6874F Low 0.4737 0.5541 0.5458 0.5772F Falling 0.6756 0.7131 0.7080 0.7210F Neutral 0.5462 0.6337 0.6156 0.5906MPCorr High 0.4618 0.4978 0.5001 0.4650MPCorr Rising 0.4890 0.5180 0.5289 0.5132MPCorr Low 0.3429 0.4063 0.3919 0.4058MPCorr Falling 0.5509 0.5860 0.5776 0.5700MPCorr Neutral 0.4102 0.4290 0.4252 0.3445
MPCorr for neutral tones with the Bi tonal context was even worse than with no
context at all.
While this is not the first time MPCorr and Accuracy behave differently, it remains
a curious result. The most likely reason is that training on the thirty five (as op-
posed to six) partitioned classes individually offers smaller datasets to learn from,
and estimating probabilities well requires more data than making a decision.
Fortunately, this discrepancy is not significant for us. This experiment shows us two
things. First, context helps. Second, context does not help as much as we would
like. It is surprising that even when we know the tones of both neighboring syllables,
classification accuracy is only about 67%.
When viewed differently, this is actually an encouraging conclusion; it suggests that

92
our features are already very good, and approaching the limits of what is possible
when context is available.
6.2 Adding True Labels of Neighboring Syllables as
Features
Having said that, it still behooves us to see if we can make use of context in other
ways. In the experiments of Section 6.1, we created several classifiers, one per context.
An alternative method is to add context as a feature and then use a single classifier.
Table 6.2 Summary of results from all experiments performed in this chapter.
MPCorr Acc MeanF
No context 0.4864 63.69 0.6116One Classifier Per Context
1A Pre 0.5145 66.33 0.64341B Post 0.5127 66.07 0.63841C Pre+Post 0.4954 67.15 0.6451
Context is Feature2A Pre 0.4589 64.13 0.61352B Post 0.4556 63.68 0.60662C Pre+Post 0.4684 65.05 0.6243
Predicted-Context is Feature3A Pre 0.4502 63.34 0.60263B Post 0.4516 63.27 0.60303C Pre+Post 0.4972 64.46 0.62264 Pre+Post+current 0.4980 64.99 0.6290
Again, we performed three experiments, in each case adding five or ten binary features.
Experiment 2A Five additional binary features were added to the core set of 128
pitch-duration-intensity-bands features determined so far. The t-th additional

93
feature was 1 if the tone of the preceding syllable was t, for t = 1 . . . 5, and 0
otherwise (or if the syllable was phrase-initial).
Experiment 2B Like 2A, but for the succeeding syllable.
Experiment 2C Both the five extra features from 2A and 2B were added.
The results of these experiments are also in Table 6.2. The performance is not as
good as with the experiments of Section 6.1, which has probably got something to do
with the fact that our base binary classifier is linear rather than, say, a decision tree.
This time, it is clear from all three performance metrics that knowing the tones of
both neighbors is more useful than just knowing the tone of one neighbor. However,
even the best result does not provide an improvement in MPCorr over the no-context
case, though it does improve the other two performance metrics.
6.3 Adding Predicted Probabilities of Labels as Features
The method of adding context using features deserves further investigation. Instead
of adding a five-dimensional binary vector v for each neighbor with v(t) = 1 if the
neighbor has tone t, we could add a five-dimensional probability vector p with p(t)
being the probability that the neighbor has tone t. If we take the view that no
syllable ever truly has one tone, then this method would be more powerful than that
of Section 6.2 if we knew the true probabilities.
Of course, we do not know the true probabilities. However, we have estimates of
them. We can run a two-phase experiment. In the first phase, we train and test using
our 128 core features as before. This produces a 5-dimensional probability vector

94
p̃ for each syllable that we can use as a substitute for p in the second phase. The
advantage of this method is that it is a practical algorithm; we are not using any
more information than is already available.
So, we performed three more experiments, each using the same first phase and only
differing in the second phase.
Experiment 3A Five additional real-valued features were added to the core set of
128 features. The t-th additional feature was the probability, as estimated using
the 128 features and no context (phase 1) that the previous syllable had tone
t. If the syllable was phrase initial, we used the empirical fraction of all tones
that were t in the training data.
Experiment 3B Like 3A, but for the succeeding syllable, with empirical fraction
values for phrase-final syllables.
Experiment 3C Both the five extra features from 3A and 3B were added.
Once again, the results of these experiments are also in Table 6.2.
3C has much better performance than 3A or 3B for all three measures. While using the
probability-estimate vector as an added feature for just one neighbor does not improve
MPCorr over the no-context case, using the vectors for both neighbors certainly does;
MPCorr improves from 0.486 to 0.497, accuracy improves from 63.7% to 64.5%, and
the mean F score improves from 0.612 to 0.623.
On the other hand, now that we are adding the empirical probabilities for both
neighbors, why not also include said probabilities for the current syllable?

95
Experiment 4 As with Experiment 3C, but we also add another five-dimensional
vector whose t-th component is the estimated probability (using 128 features)
that the current syllable has tone t.
At first sight, this seems a waste, since the second phase will produce probabilities
very similar to the empirical probabilities for the current syllable. However, a second
glance reveals that it is actually adding difference features as well since the base clas-
sifier is linear. We are adding features like “the difference between the (estimated)
probability that the current syllable has tone t while the previous/next syllable has
tone u”. To verify this, we performed another experiment. This was just like Ex-
periment 4, but instead of adding five extra features to 3C having the probabilities
for the current syllable, we added ten extra features — the differences between the
probabilities p̃(t) for successive syllables. Classification performance was the same as
that of Experiment 4. On the other hand, this also means that the useful features
that are added have t equal to u.
And results do improve slightly again, though the difference is marginal for MPCorr
(0.497 → 0.498), with accuracy increasing from 64.5% to 65.0% and MeanF increasing
from 0.623 to 0.629.
6.4 Conclusions
Context clearly helps. Furthermore, in all our experiments, the context involving
knowledge of the tone of the previous syllable is slightly better than that involving
knowledge of the succeeding syllable. This is further evidence for carryover effects of
coarticulation being larger than anticipatory effects (Xu (1997)), though we have to

96
admit that we expected the difference in performance to be larger. The two neigh-
boring tones do not provide redundant information; performance generally improved
when knowledge of both neighbors’ tones was used.
However, even when context is not available, we can use estimates of it to obtain
improved performance over not using any contextual information at all. We suggest
a two-phase algorithm where probability estimates of syllables’ tones from the first
phase are added as features in the second phase. This results in an improvement in
classification accuracy from 63.7% (no context) to 65.0%, though it is still less than
the idealized accuracy of 67.2% when the context is fully known. Similar statements
apply for the other two performance metrics.

CHAPTER 7
STRENGTH
Not all syllables are enunciated with the same amount of clarity. In fact, when they
are, as was often the case with early speech synthesis systems, the result is unnatural
and robotic. There are several reasons why some syllables are spoken more ‘strongly’
than others, such as lexical stress, metrical stress patterns, focus, and accent.
Roughly speaking, every word in the lexicon is stored as a sequence of syllables. In
a language like Mandarin Chinese, each syllable has a sequence of phonemes, a tone,
and a marker called ‘lexical strength’ that corresponds to how important it is for the
syllable to be articulated correctly.
The notion of ‘lexical strength’ is not universally agreed upon. In some languages,
it is associated not with syllables, but with sets of syllables or with morphemes. It
also goes by various names in the literature. Many Bantu languages have an ‘accent’
marker; each accent is associated with a tone-bearing unit that is a set of syllables.
English syllables traditionally each come with a ternary value called lexical stress;
syllables are said to be unstressed, or bear primary or secondary stress. In Mandarin,
some say the concept of lexical strength does not exist, and that the primary rea-
son why certain syllables are stronger than others is metrical stress patterns. The
most definitive and empirical work on the subject, that of Kochanski et al. (2003),
associated each syllable in a word with a real-valued strength.
In any case, when a speaker utters a sequence of words, syllables with higher lexical
strength are more likely to have their pitch behave in a manner closer to their idealized
forms. If the speaker places particular emphasis (often called ‘focus’ or ‘narrow focus’)
97

98
on a word, all syllables in it are made ‘stronger’, but the effect is greater on those
syllables with higher lexical strength.
For our purposes, we do not need to know the underlying reasons for why certain
syllables are said with greater strength than others. This does make a difference; for
example, if the cause of emphasis is the word being focused, then not only will the
pitch and pitch range of the syllable be increased, but the pitch and pitch range of the
succeeding syllables will be decreased (Xu (1997)). That will not happen for other
causes of emphasis such as the maintenance of metrical stress patterns. However,
such differences are out of the scope of this work; all we wish to find is a way to
determine which syllables are stronger than others, not why they are stronger.
In this chapter, we first describe work we did earlier in Surendran et al. (2005) on
a small corpus of focus-labelled lab speech, where we were able to use predictions of
the strength of a syllable to improve tone classification accuracy. We then consider
alternative measures of strength.
7.1 Predicting Focus in Lab Speech
In Xu (1999), a large, controlled collection of clean Mandarin speech was elicited
from eight native speakers. Each spoke 480 three-word phrases under varying focus
conditions. The words were of length 2, 1, and 2 syllables, and the first and fifth
syllables always had High tone. There were four focus conditions: one where no word
was focused and the other three focusing one word each. We refer to a phrase having
neutral focus as a 0-focus phrase, and a phrase with focus on its n-th word as a
n-focus phrase. If a n-focus phrase has only n words, it has final focus.

99
The classification task is to recognize the tones of the second, third, and fourth
syllables of each phrase. There were 11520 such syllables, with equal numbers of
the four tones. (There were no syllables with neutral tone.) Owing to test design,
syllables were balanced over focus conditions.
As this was a very clean database, and had no neutral tone, the only feature we used
was the 20-point PSSZ-Normalized pitch contour of the syllable. This normalization
did not account for downdrift between the syllables of a phrase, only within syllables.
The entire dataset consisted of 11520 syllables; each syllable represented by a vector
in R20, and had a label from 1 to 4 representing its tone.
For this 4-class problem, we used a one-versus-one ensemble of binary classifiers whose
results were combined using the method of Wu et al. (2004). Each binary classifier
was a linear support vector machines1 Platt Scaling (Platt (2000),Lin et al. (2003))
was used to convert the raw outputs of the SVMs into values between 0 and 1 that
could be interpreted as probabilities.
All classification results reported here are with four-way cross-validation on the above
task. Each fold had 6 × 480 = 2880 phrases (8640 syllables) from six speakers in the
training set and 960 phrases (2880 syllables) from the remaining two speakers in the
test set. No syllables from the same speaker were ever in both test and training sets.
Without using any focus-related information, classification accuracy was 84.8%. This
is high because the dataset is of clean lab speech. It compares with, for example,
accuracy of 81.6% for read digit strings reported by Wang and Seneff (2000).
We partitioned the syllables into four groups, as suggested by Xu et al. (2004) When
1We used the LIBSVM package of Chang and Lin (2001) for this experiment.

100
creating classifiers for each group separately, classification accuracy increased from
84.8% to 91.3%. Performance varied according to the focus condition of each syllable.
No-focus The syllable is in a phrase with neutral focus. Such syllables were classified
with accuracy 92.3%.
Pre-focus The syllable is in a word before the focused word of the phrase. These
were also classified with accuracy 92.3%.
In-focus The syllable is in the focused word of the phrase. These were classified
almost perfectly, at 99.2% accuracy.
Post-focus The syllable is in a word after the focused word of the phrase. These
were the hardest to classify, at 80.6% accuracy.
While we expected syllables in focused words to be easier to recognize, we had not
expected them to be this easy. Clearly, the effect of non-focused syllables on adjacent
focused syllables is minimal. Of course, the reverse is not true, and we have high
error rates on other syllables.
That the error rate for post-focus syllables (19.4%) is much worse than that for pre-
focus syllables (7.7%) is indicative of the observation by Xu (1997) that articulatory
effects are asymmetric; the carryover effect is more than the anticipatory effect. Fur-
thermore, post-focus syllables have a lower and compressed pitch range. This has
two effects that make recognizing their tone difficult. First, the tone on the syllable
immediately after focus is on a steep downward ramp that lasts for nearly a syllable,
which severely distorts its pitch contour. Second, the compressed pitch range means
that, although post-focus syllables are treated separately, there is simply less room
for variation in the pitch contours to distinguish between tones.

101
The error rates for pre-focus and no-focus syllables are identical. While this is a co-
incidence (their confusion matrices are not identical), it does bring up the theoretical
question of whether no-focus and pre-focus syllables behave similarly.
We tested this hypothesis by repeating the above experiment with pre-focus and no-
focus syllables grouped in the same class. In other words, a single classifier was created
for syllables that were either pre-focus or no-focus. Accuracy remained at 91.3%,
indicating that the two kinds of syllables behaved similarly. On the other hand, when
we grouped post-focus and no-focus syllables together, accuracy dropped to 88.3%,
indicating that those kinds of syllables did not behave similarly. Accuracy dropped
nearly to baseline, to 85.0%, when no-focus, pre-focus, and post-focus syllables were
all grouped together.
These results agree with earlier observations of Xu et al. (2004) that while pre-focus
syllables will have a similar pitch range to no-focus syllables, post-focus syllables will
have a lower pitch range than any other kind of syllable.
In other words, a possible method of improving tone recognition is to determine which
(if any) of the syllables in a phrase are focused, and creating different tone classifiers
based on where the syllable is in relation to the focused syllable.
Of course, we do not really know which syllables are focused, both in training and
testing. However, since tones are best recognized on syllables with focus, we hypoth-
esize that the confidence of tone prediction can be used to predict which syllables in a
phrase are focused. Recall that our K-class classifier produces, for each test syllable, a
K-dimensional probability distribution whose k-th component is the probability that
the syllable has tone k. We define the confidence of a prediction to be the highest

102
probability in the predicted probability distribution. Bear in mind that confidence is
not the same as accuracy or PCorr; it is quite possible for confident predictions to be
wrong.
We trained a single classifier to recognize tone on all syllables (the 84.8% classifier),
and then used the confidence of its predictions to predict the location of the focused
word of each phrase. (The success rate on recognizing the 3-way focus condition of
each syllable was 63%.) We created three different classifiers conditioned on pre-focus
(which includes neutral-focus), in-focus, and post-focus syllables based on predicted
focus condition. The classification accuracy was 90.2%, which is still a large improve-
ment on baseline, and surprisingly close to the 91.3% obtained when the correct focus
is known.
To summarize, this is an example of a situation where tone recognition was improved
on lab speech by assuming that the syllables in a phrase with highest prediction
confidence were the ones with highest strength. It remains to be seen if such methods
can be extended successfully to more realistic datasets.
7.2 Predicting Strength in Broadcast Speech
In the previous section, we found that syllables in focused words were far better
recognized than other syllables in a lab speech corpus. Our first task is to see if
the same holds true for broadcast speech, where we do not have a readily available
measure of syllable strength, let alone focus condition.
Previous work, both in Mandarin and other languages, indicates that the best cues
for acoustic prominence are duration and intensity. Tamburini (2003) found that

103
the duration of the syllable nucleus was longer for prominent syllables in American
English, and that such syllables had higher energy, particularly in the 500-2000Hz
band. He suggested a peak-picking algorithm based on local maxima of (for each
syllable) the product of the syllable’s nucleus’ duration and its energy between 500-
2000 Hz. Kochanski et al. (2006) were able to predict syllable prominence judgements
by English speakers using cues based on overall intensity and duration — pitch,
periodicity, and spectral tilt were of little use. Sluijter and van Heuven (1996) found
that energies in the bands 0-500 Hz, 500-1000 Hz, 1000-2000 Hz, and 2000-4000 Hz
could be used to predict stress in Dutch.
There is not as much lexical strength in Mandarin as there is in stress-timed languages
like English. But some syllables are stronger than others, as has been investigated by
Kochanski et al. (2003). They created, using StemML (Kochanski and Shih (2000,
2003)), a system to recreate pitch contours of Mandarin sentences by learning a single
pattern for each tone and modelling coarticulation with a strength value for each
syllable; stronger syllables were less affected by coarticulation (i.e. the pitch of their
neighbors) than weaker syllables. For each read sentence in their corpus, Kochanski
et al. (2003) obtained a strength value for each of its syllables that resulted in the
best fit to the pitch contours in the sentence. They then analyzed which cues, both
acoustic and otherwise, best predicted said strength. For example, longer syllables
and word-initial syllables tended to be stronger.
Using the feature set PIDE128, classification accuracy is 63.7% and the mean proba-
bility margin is 0.178 over all test syllables. The probability margin of a classification
on an example is the probability that the correct label was recognized minus the
highest probability of a wrong label; it is positive if and only if the classification is

104
correct.
However, for word-initial syllables only, they are 65.2% and 0.201 respectively, which
is a small improvement. In other words, word-initial syllables are slightly better rec-
ognized, which is consistent with the tendency for them to have higher strength. On
the other hand, we would have expected more improvement. Further analysis reveals
that the small increase is largely due to the drop in recognition for monosyllabic words
(62.1%, 0.155); syllables at the start of longer words are recognized with accuracy
above 67.0%.
Table 7.1 Mean Classification Probability Margin / Classification Accuracy for testsyllables when split according to tone and to what position the syllable had in itsword. For example, accuracy was 65.2% for all word-initial syllables, 67.5% for allword-initial syllables in trisyllabic words, and 74.3% for all word-initial High-tonedsyllables in trisyllabic words.
Pos # sylls Overall High Rising Low Falling Neutral
any 40798 0.178/63.7 0.162/61.3 0.203/67.4 -0.063/41.9 0.294/73.9 0.077/53.1
1 22669 0.201/65.2 0.193/63.1 0.199/66.6 -0.055/41.4 0.322/76.4 0.225/67.02 13980 0.125/59.4 0.102/57.2 0.185/66.2 -0.090/40.4 0.235/68.7 -0.273/20.03 3000 0.249/71.3 0.132/62.7 0.307/77.2 0.001/53.7 0.379/80.4 0.199/64.94 899 0.170/64.0 0.061/54.1 0.189/67.3 -0.051/47.2 0.314/75.6 -0.019/42.25 250 0.277/73.6 0.186/59.1 0.446/89.5 0.024/48.6 0.350/83.2 0.124/58.3
1/1 8689 0.155/62.1 0.113/57.4 0.175/64.6 -0.124/34.5 0.241/71.8 0.227/67.1
1/2 10979 0.232/67.2 0.212/63.6 0.219/68.5 -0.004/46.6 0.377/79.4 -0.032/61.52/2 10979 0.129/59.9 0.083/55.2 0.222/69.8 -0.083/41.2 0.225/68.1 -0.273/19.9
1/3 2101 0.234/67.5 0.317/74.3 0.176/63.6 -0.099/36.0 0.372/80.6 —2/3 2101 0.130/60.0 0.122/60.3 0.033/51.7 -0.007/47.5 0.336/76.7 -0.319/22.23/3 2101 0.263/72.1 0.082/58.6 0.351/80.7 -0.022/51.5 0.402/82.4 0.200/65.1
1/4 707 0.218/67.6 0.325/76.0 0.224/70.6 -0.139/33.1 0.344/79.9 —2/4 707 0.073/54.7 0.163/62.4 0.058/53.3 -0.241/30.0 0.210/65.6 -0.224/27.33/4 706 0.215/68.8 0.168/65.5 0.262/74.1 0.042/57.7 0.288/71.3 —4/4 706 0.170/63.7 0.030/52.9 0.222/68.3 -0.091/44.1 0.327/77.1 -0.019/42.2
Their pitch reconstruction worked best when words were given a certain structure

105
of lexical strength. Bisyllabic words were strong-weak, i.e. the first syllable was
stronger than the second. Trisyllabic words were strong-weak-weak, while words with
four syllables also alternated: strong-weak-strong-weak. We tested this by computing
recognition performance for all subsets involving the i-th syllable of a k-syllable word,
for 1 ≤ i ≤ k ≤ 4. Table 7.1 has the results.
For bisyllabic words, the first syllable (67.2%) was far better recognized than the
second (59.9%).
For trisyllabic words, the first syllable (67.5%) is better recognized than the second
(60.0%) but not as well recognized as the third (72.1%). The last is surprising, as
Kochanski et al. (2003) found that the third syllable was weakest.
For four-syllable words, the first (67.6%) and third syllables (68.8%) were strongest,
with second syllables (54.7%) weakest. Fourth syllables were recognized with accuracy
63.7%. This is generally the same as Kochanski et al. (2003), but they found that
third syllables were only slightly stronger than second syllables and that the fourth
syllables were weakest.
Differences aside, the vital point to know from now, from both these experiments
and those of Kochanski et al. (2003), is that word-initial syllables, at least for poly-
syllabic words, tend to be better recognized and have higher strength. However, the
improvement is too small to make use of a technique such as that in Section 7.1.
Experiments in other languages show that the best acoustic cues for lexical stress are
duration and intensity, particularly above 500Hz. To see if this could be used to find
a well-recognized subset of Mandarin syllables, we determined various subsets using
the following method. Using two or three of the following features:

106
• Duration of the rhyme of the syllable.
• Mean value of intensity during the rhyme
• Mean value of intensity above 500Hz during the rhyme
Recall that all features were PSSZ-Normalized, so that their values tended to be
between -5 and 5. For values of M = 0, 1 and W = 1, 2, 3, we considered all syllables
with values of all chosen features greater than M and greater than those of its W
neighbors on either side. We also considered subsets thereof of word-initial syllables.
This gave a total of twelve subsets for each set of features. We used three sets of
features:
• Rhyme Duration & Mean Intensity
• Rhyme Duration & Mean Intensity above 500Hz & Mean Intensity
• Rhyme Duration & Mean Intensity above 500Hz
Of the thirty-six subsets, only sixteen had more than a hundred syllables out of the
total test set of about forty thousand syllables. Recognition rates for these subsets
are shown in Table 7.2 .
On the whole, we only get subsets with classification accuracy above 70% if we con-
sider word-initial syllables. However, word segmentation is unlikely to be available
at this stage of the speech recognition process and we thus limit ourselves to those
subsets involving syllables from anywhere in a word.
It seems that intensity above 500Hz is a better cue for strength than overall intensity,
although earlier experiments in Chapter 3 show that it is not as good for general

107
tone recognition. This is not a contradiction; tone and strength are not the same
concept and, neutral tone aside, features useful for recognizing one may not be useful
for recognizing the other.
The best cue — that still leads to a relatively large set of syllables — seems to be local
peaks of duration and intensity above 500Hz where one only considers the immediate
neighboring syllables (W=1) and values above the average over all syllables in the
phrase (M=0). For this subset, accuracy is 67.6%, which is not much larger than
63.7% if we wish to use it to bootstrap algorithmic improvements based on well-
recognized syllables like we did in Section 7.1.
7.3 Conclusions
We would expect that syllables enunciated with higher strength are easier to rec-
ognize, such as word-initial syllables and syllables with relatively high duration and
energy. This is certainly true with lab speech, with nearly perfect recognition for
focused syllables in a four-tone lab speech corpus using only pitch cues. However,
the trend, while present, is far smaller on broadcast speech. Word-initial syllables for
polysyllabic words are easier to recognize, as are syllables that have peaks in duration
and intensity above 500 Hz.
However, recognition rates are still low, in the 68% range, making it unlikely that
determining such syllables early on will improve classification performance.
The reasons for the small difference are not clear. It could be due to the extensive
training that news broadcast speakers have; they are able to articulate with relative
clarity even those syllables with lower strength. For normal speakers, the difference

108
in recognition performance between strong and weak syllables may well be greater.

109
Table 7.2 Recognition performance for syllables whose values for each feature listedis more than M and more than that of its 2W neighbors. Also shown are subsetsthereof of syllables that are word-initial in polysyllabic words. The feature ‘duration’refers to the duration of the rhyme, ‘intensity’ refers to the mean energy during therhyme, and ‘int> 500’ refers to the mean energy above 500 Hz during the rhyme.Only combinations that have at least 100 syllables are shown. For example, 145syllables have duration and intensity-above-500-Hz greater than their six neighborsand PSSZ-Normalized values greater than 1.0; these syllables are recognized with75.9% accuracy.
M W word num. of Mean Acc
init syllables PCorr
all sylls 40798 0.178 63.69Duration & Intensity
0 1 0 2042 0.503 64.590 2 0 691 0.479 59.480 3 0 315 0.440 53.650 1 1 336 0.625 77.080 2 1 104 0.599 70.19
Duration & Intensity & Int> 500Hz0 1 0 1157 0.486 63.270 2 0 302 0.456 56.950 3 0 105 0.388 46.670 1 1 142 0.582 69.01
Duration & Int> 500Hz0 1 0 2986 0.505 67.550 2 0 1160 0.498 66.550 3 0 583 0.484 64.840 1 1 252 0.569 70.241 1 0 319 0.510 69.281 2 0 212 0.530 71.701 3 0 145 0.536 75.86

CHAPTER 8
CONCLUSIONS
In this thesis, we determined that the recognition of tones in Mandarin Chinese was
an important problem, as tones carry at least as much information as vowels.
We conducted hundreds of experiments on a large and difficult dataset of broadcast
speech to determine a set of 68 features involving pitch, duration, and overall intensity,
some of which (such as various gradient features) have not been suggested before. We
determined that modifying the pitch and intensity of a syllable based on its neighbors
was useful; in particular, subtracting the mean pitch of the preceding syllable.
We carried out experiments with a small dataset of broadcast speech to determine
which of twenty voice quality measures were of use in tone recognition, and found that
the easiest to calculate — energy in various frequency bands — was the most useful.
Further experiments determined a set of 60 band energy features that greatly aided
the recognition of low and neutral tones. However, the recall for low tones remained
below fifty percent.
We found that context — knowing the tones of surrounding syllables — did not help
as much one would have expected, suggesting our features are already capturing a lot
of contextual information.
Finally, we investigated the hypothesis that stronger syllables were easier to recognize.
This was certainly true for lab speech, but the effect was much less for broadcast
speech.
110

APPENDIX
Pitch Contours of Various Syllables
Figure 8.1 Sample six-point normalized pitch contours of sixty syllables. The verticalaxis of each syllable is between ±4 standard deviations.
111

112
Computation of Band Energy Features
The Matlab code for this is as follows: suppose ts is the vector representing a sound
file with N elements representing N/r seconds of sound sampled at r Hertz. This
spectral computation heart of this code was originally written by Partha Niyogi.
r=8000; N=length(ts);
NW = 3; K = 5; pad=512;
winsize = 0.020;
winstep = 0.005;
numframes=floor( ((N/r)-winsize)/winstep );
[E,V]=dpss(winsize * r,NW,’calc’);
E = E(:,1:K);
timesteps=(0:numframes-1)*(winstep)+(winsize/2); % in seconds
S = zeros(numframes,pad/2);
for j=1:(numframes)
TSM=ts((j-1)*(winstep*r)+[1:(winsize*r)]);
J=(fft(TSM(:,ones(1,K)).*(E(:,1:K)),pad))’;
J=J(:,1:pad/2);
S(j,:)=(sum(J.*conj(J)));
end
S = log(max(exp(1),(S/K)));
[T,F] = size(S);

113
% S(t,f) = intensity around f-th freq band at timesteps(t) seconds
% f-th freq band is around (sr/2)*f/(pad/2) Hz = f * 4000/256 Hz

114
Relative Importance of Band Energy Measurements
Table 8.1 Classification performance, ranked by MPCorr, when using exactly one bandenergy feature; see Section 5 for details. For example, when classifying using onlythe mean energy between 3000 and 3500 Hz, classification accuracy was 34.3%.
Feature MPCorr Acc MeanF Feature MPCorr Acc MeanF
B500 meanMstart 0.2522 34.84 0.1611 B2250 grad 0.2448 32.82 0.1265
B3250 mean 0.2516 34.30 0.1609 B1500 mean 0.2448 33.08 0.1334
B3500 mean 0.2513 34.20 0.1690 B3000 meanMstart 0.2448 33.02 0.1247
B500 grad 0.2512 34.42 0.1634 B3000 grad 0.2446 32.61 0.1224
B3750 grad 0.2512 33.72 0.1484 B2250 meanMstart 0.2445 33.02 0.1244
B3000 mean 0.2506 34.20 0.1573 B2750 meanMstart 0.2445 32.99 0.1232
B3750 mean 0.2503 33.84 0.1548 B2750 grad 0.2442 32.51 0.1207
B750 meanMstart 0.2496 34.51 0.1710 B2500 meanMstart 0.2442 33.07 0.1209
B750 grad 0.2495 33.94 0.1546 B2500 grad 0.2441 32.59 0.1214
B3250 mid 0.2495 34.01 0.1591 B500 stdv 0.2436 32.84 0.1097
B250 meanMstart 0.2495 34.26 0.1506 B1250 mid 0.2434 32.68 0.1087
B3000 mid 0.2494 33.88 0.1549 B250 stdv 0.2433 33.00 0.1176
B250 grad 0.2493 33.81 0.1515 B1250 mean 0.2430 32.80 0.1128
B1000 grad 0.2491 33.99 0.1568 B750 mid 0.2430 32.63 0.1056
B2750 mean 0.2490 33.78 0.1527 B2750 meanMmid 0.2428 32.62 0.1050
B3500 mid 0.2488 33.74 0.1582 B750 mean 0.2427 32.75 0.1050
B2250 mean 0.2486 33.71 0.1507 B2500 meanMmid 0.2427 32.64 0.1013
B2500 mean 0.2486 33.66 0.1503 B3000 meanMmid 0.2427 32.64 0.1042
B1750 grad 0.2485 33.46 0.1485 B1000 mid 0.2426 32.68 0.0990
B1000 meanMstart 0.2485 34.03 0.1519 B500 meanMmid 0.2426 32.72 0.1032
B3500 grad 0.2484 33.30 0.1427 B2250 meanMmid 0.2425 32.62 0.1001
B2750 mid 0.2484 33.59 0.1510 B3750 stdv 0.2424 32.66 0.1019
B1250 grad 0.2483 33.58 0.1517 B1000 mean 0.2423 32.69 0.0995
B1500 grad 0.2483 33.58 0.1524 B750 stdv 0.2423 32.74 0.1028
B2000 mean 0.2481 33.68 0.1498 B2000 meanMmid 0.2423 32.67 0.0997
B2500 mid 0.2476 33.31 0.1460 B3250 meanMmid 0.2423 32.66 0.1007
B2250 mid 0.2474 33.38 0.1446 B1500 meanMmid 0.2422 32.69 0.0992
B1250 meanMstart 0.2474 33.58 0.1464 B1750 meanMmid 0.2422 32.69 0.0995
B1500 meanMstart 0.2470 33.59 0.1446 B1250 meanMmid 0.2421 32.69 0.0991
B1750 meanMstart 0.2470 33.61 0.1444 B250 meanMmid 0.2420 32.69 0.0997
B2000 mid 0.2468 33.44 0.1420 B750 meanMmid 0.2420 32.71 0.1005
B2000 grad 0.2467 33.08 0.1371 B1000 stdv 0.2419 32.70 0.0986
B1750 mean 0.2467 33.47 0.1451 B3500 stdv 0.2419 32.70 0.0986
B3750 mid 0.2465 32.90 0.1308 B1750 stdv 0.2418 32.70 0.0986
B1750 mid 0.2461 33.32 0.1354 B3500 meanMmid 0.2418 32.69 0.0989
B500 mid 0.2458 32.89 0.1245 B1250 stdv 0.2417 32.70 0.0986
B2000 meanMstart 0.2458 33.27 0.1360 B1500 stdv 0.2417 32.70 0.0986
B3500 meanMstart 0.2457 33.12 0.1375 B2000 stdv 0.2417 32.70 0.0986
B3250 grad 0.2454 32.68 0.1273 B1000 meanMmid 0.2417 32.71 0.0994
B3750 meanMstart 0.2454 33.04 0.1429 B2250 stdv 0.2416 32.70 0.0986
B500 mean 0.2453 32.82 0.1232 B2500 stdv 0.2416 32.70 0.0986
B250 mid 0.2451 32.57 0.1063 B2750 stdv 0.2416 32.70 0.0986
B250 mean 0.2449 32.52 0.1045 B3000 stdv 0.2416 32.70 0.0986
B1500 mid 0.2449 33.13 0.1266 B3250 stdv 0.2416 32.70 0.0986
B3250 meanMstart 0.2449 33.02 0.1281 B3750 meanMmid 0.2414 32.70 0.0986

REFERENCES
Airas, M., Pulakka, H., Backstrom, T., and Alku, P. (2005). A toolkit forvoice inverse filtering and parametrisation. In Proceedings of Interspeech 2005,http://aparat.sourceforge.net, Lisbon, Portugal.
Alku, P. and Backstrom, T. (2002). Normalized amplitude quotient for parametriza-tion of the glottal flow. Journal of the Acoustical Society of America, 112(2):701–710.
Belotel-Greni, A. and Greni, M. (2004). The creaky voice phonation and the orga-nization of Chinese discourse. In International Symposium on Tonal Aspects ofLanguages: With Emphasis on Tone Languages, Beijing 2004.
Boersma, P. and Weenink, D. (2005). Praat: doing phonetics by computer.http://www.praat.org.
Campbell, N. and Beckman, M. E. (1997). Accent, stress, and spectral tilt. TheJournal of the Acoustical Society of America, 101(5):3195–3195.
Carter, D. (1987). Information-theoretical analysis of phonetic dictionary access.Computer Speech and Language, 2:1–11.
Chang, C.-C. and Lin, C.-J. (2001). Libsvm : a library for support vector machines.Software available at http://www.csie.ntu.edu.tw/∼cjlin/libsvm.
Chao, Y. R. (1968). A Grammar of Spoken Chinese. Berkeley: University of CaliforniaPress.
Chen, S. and Goodman, J. (1998). An empirical study of smoothing techniques forlanguage modeling. Technical Report TR-10-98, Harvard University.
Cover, T. M. and Thomas, J. A. (1991). Elements of Information Theory. Wiley-Interscience, New York, NY.
Davison, D. S. (1991). An acoustic study of so-called creaky voice in tianjin Mandarin.UCLA Working Papers in Phonetics, 78:50–57.
Epstein, M. (2002). Voice Quality and Prosody in English. PhD thesis, University ofCalifornia at Los Angeles.
Eriksson, A., Thunberg, G. C., and Traunm, H. (2001). Syllable prominence: A mat-ter of vocal effort, phonetic distinctness and top-down processing. In Proceedingsof EuroSpeech 2001, pages 399–402.
115

116
Fujisaki, H., Hirose, K., Halle, P., and Lei, H. (1990). Analysis and modelling oftonal features in polysyllabic words and sentences of the standard Chinese. InProceeedings of ICSLP ’90 (Kobe, Japan), pages 841–844.
Gobl, C. (1988). Voice source dynamics in connected speech. Technical report, RoyalInstitute of Technology, Stockholm.
Gobl, C. and Chasaide, A. N. (2003). The role of voice quality in communicatingemotion, mood and attitude. Speech Commun., 40(1-2):189–212.
Hockett, C. F. (1955). A manual of phonology. International Journal of AmericanLinguistics, 21.
Holmberg, E., Hillman, R., and Perkell, J. (1998). Glottal airow and transglottalair pressure measurements for male and female speakers in soft, normal, and loudvoice. Journal of the Acoustical Society of America, 84(2):511–529.
Huang, T. (2001). The interplay of perception and phonology in tone 3 sandhi inChinese putonghua. Ohio State University Working Papers in Linguistics, 55:23–42.
Keating, P. A. and Esposito, C. (2006). Linguistic voice quality. UCLA WorkingPapers in Phonetics, 105:85–91.
Keerthi, S. and DeCoste, D. (2005). A modified finite newton method for fast solutionof large scale linear svms. Journal of Machine Learning Research, 6:341–361.
Kochanski, G., Grabe, E., Coleman, J., and Rosner, B. (2006). Loudness predictsprominence; fundamental frequency lends little. Journal of the Acoustical Societyof America, 118:1038–1054.
Kochanski, G. and Shih, C. (2003). Prosody modeling with soft templates. SpeechCommunication, 39:311–352.
Kochanski, G., Shih, C., and Jing, H. (2003). Quantitative measurement of prosodicstrength in Mandarin. Speech Communication, pages 625–645.
Kochanski, G. P. and Shih, C. (2000). Stem-ml: Language independent prosodydescription. In Proceedings of the 6th International Conference on Spoken LanguageProcessing.
Kratochvil, P. (1998). Intonation in beijing Chinese. In Hirst, D. and di Cristo, E.,editors, Intonation Systems.
Kreiman, J. and Gerratt, B. (1996). The perceptual structure of pathologic voicequality. Journal of the Acoustical Society of America, 100(3):1787–1795.

117
Ladefoged, P. (1971). Preliminaries to linguistic phonetics. University of ChicagoPress.
Lei, X. (2006). Modeling lexical tones for mandarin large vocabulary continuous speechrecognition. PhD thesis, University of Washington.
Lei, X., Hwang, M.-Y., and Ostendorf, M. (2005). Incorporating tone-related mlpposteriors in the feature representation for Mandarin asr. In Proceedings of Inter-speech 2005.
Levow, G.-A. (2005). Context in multilingual tone and pitch accent recognition. InProceedings of the 9th European Conference of Speech Communication and Tech-nology.
Liao, R. (1994). Pitch Contour Formation in Mandarin Chinese. PhD thesis, TheOhio State University.
Lin, H., Lin, C.-J., and Weng, R. (2003). A note on platt’s probabilistic outputs forsupport vector machines. Technical report, Department of Computer Science andInformation Engineering, National Taiwan University.
Lintfert, B. and Wokurek, W. (2005). Voice quality dimensions of pitch accents. InProceedings of the 9th European Conference on Speech Communication and Tech-nology, pages 2409–2412.
Meyerstein, R. S. (1970). Functional load: Descriptive limitations, alternatives ofassessment and extensions of application. Janua Linguarum, Series Minor, 99.
Perceval, D. B. and Walden, A. T. (1993). Spectral Analysis for Physical Applications.Cambridge University Press, Cambridge, U.K.
Platt, J. (2000). Probabilistic outputs for support vector machines and comparisonto regularized likelihood methods. In Smola, A., Bartlett, P., Schoelkopf, B., andSchuurmans, D., editors, Advances in Large Margin Classifiers, pages 61–74.
Pulakka, H. (2005). Analysis of human voice production using inverse filtering, high-speed imaging, and electroglottography. Master’s thesis, Helsinki University ofTechnology Acoustics Laboratory.
Shannon, C. E. (1951). Prediction and entropy of printed English. Bell SystemsTechnical Journal, 30:50–64.
Shih, C. (1998). Tone and intonation in Mandarin. Technical Report 3, PhoneticsLab, Cornell University.
Shih, C. (2000). A declination model of Mandarin Chinese. In Botinis, A., editor,Intonation: Analysis, Modelling, and Technology, pages 243–268.

118
Sluijter, A. M. C. and van Heuven, V. J. (1996). Spectral balance as an acous-tic correlate of linguistic stress. Journal of the Acoustical Society of America,100(4):2471–2485.
Surendran, D. (2003). Functional load. Master’s thesis, University of Chicago Com-puter Science Department.
Surendran, D. and Levow, G.-A. (2004a). The functional load of tone in Mandarin isas high as that of vowels. In Proceedings of the International Conference on SpeechProsody 2004, pages 99–102, Nara, Japan.
Surendran, D. and Levow, G.-A. (2004b). The functional load of vowels in Mandarinis as high as that of vowels. In Proc. Intl. Conf. Speech Prosody, volume 1, pages99–102.
Surendran, D. and Levow, G.-A. (2006). Additional cues for Mandarin tone recogni-tion tr-2006-04. Technical report, University of Chicago.
Surendran, D., Levow, G.-A., and Xu, Y. (2005). Tone recognition in Mandarin usingfocus. In Proceedings of the 9th European Conference of Speech Communication andTechnology.
Surendran, D. and Niyogi, P. (2003). Measuring the usefulness (functional load) ofphonological contrasts, technical report tr-2003-12. Technical report, University ofChicago.
Surendran, D. and Niyogi, P. (2006). Quantifying the functional load of phonemicoppositions, distinctive features, and suprasegmentals. In Thomsen, O. N., editor,Current trends in the theory of linguistic change. In commemoration of EugenioCoseriu (1921-2002). Amsterdam & Philadelphia: Benjamins.
Tamburini, F. (2003). Automatic prosodic prominence detection in speech usingacoustic features: an unsupervised system. In Proceedings of Eurospeech 2003,Geneva, Switzerland.
van Santen, J. P. H. and Niu, X. (2002). Prediction and synthesis of prosodic effects onspectral balance of vowels. In Proceedings of IEEE Workshop on Speech Synthesis.
van Son, R. J. J. H. and van Santen, J. P. H. (2005). Duration and spectral balanceof intervocalic consonants: A case for efficient communication. Speech Communi-cation, pages 100–123.
Wang, C. and Seneff, S. (2000). Improved tone recognition by normalizing for coar-ticulation and intonation effects. In Proceedings of the International Conference onSpoken Language Processing (ICSLP), pages 83–86.

119
Wang, W. S.-Y. (1967). The measurement of functional load. Phonetica, 16:36–54.
Wang, Y., Sereno, J. A., Jongman, A., and Hirsch, J. (2003). fmri evidence forcortical modification during learning of Mandarin lexical tone. Journal of CognitiveNeuroscience, 15:1019 – 1027.
Wayne, C. L. (2000). Multilingual topic detection and tracking: Successful researchenabled by corpora and evaluation. In Proceedings of the Language Resources andEvaluation Conference (LREC).
Wu, T.-F., Lin, C.-J., and Weng, R. C. (2004). Probability estimates for multi-class classification for pairwise coupling. Journal of Machine Learning Research,5:975–1005.
Xu, Y. (1991). Perception of coarticulated tones. Journal of the Acoustical Societyof America, 90:2362.
Xu, Y. (1997). Contextual tonal variations in Mandarin. Journal of Phonetics, 25:62–83.
Xu, Y. (1999). Effects of tone and focus on the formation and alignment of f0 contours.Journal of Phonetics, 27:55–105.
Xu, Y. and Wang, Q. E. (1997). What can tone studies tell us about intonation? InProceedings of the ESCA Workshop on Intonation (Athens, Greece), pages 337–340.
Xu, Y., Xu, C. X., and Sun, X. (2004). On the temporal domain of focus. In Proc.Intl. Conf. Speech Prosody, Nara, Japan, volume 1, pages 81–94.
Yip, M. (2002). Tone. Cambridge Textbooks in Linguistics. Cambridge UniversityPress.
Yoon, T.-J., Cole, J., Hasegawa-Johnson, M., and Shih, C. (2005). Acoustic correlatesof non-modal phonation in telephone speech. In Proceedings of the 149th Meetingof the Acoustical Society of America.
Related Documents


