Welcome message from author
This document is posted to help you gain knowledge. Please leave a comment to let me know what you think about it! Share it to your friends and learn new things together.
Transcript


METHODOLOGY
• Penn Schoen Berland conducted 2,250 telephone interviews between May 10 and June 6, 2012, among Americans aged 60 and older:
Audience Sample Size Margin of Error
National* 1,000 +/- 3.1%
Upstate NY** 250 +/- 6.2%
Milwaukee** 250 +/- 6.2%
Miami** 250 +/- 6.2%
Dallas** 250 +/- 6.2%
Orange County** 250 +/- 6.2%
*National – Nationally representative sample of Americans aged 60 and older
**Regional Oversamples – Americans aged 60 and older in five designated markets chosen to examine the differences and similarities in aging across America
2

EXECUTIVE SUMMARY

Older adults are upbeat about aging
• The past year has been a good one for seniors
– Close to 70 percent of seniors say the past year of their lives has been normal or better than normal
• Seniors are staying in the workforce
– Among those still employed full or part time, the majority (69 percent) say they are still working to bring in income
– They also cite productivity (76 percent) and enjoyment (70 percent) as reasons
• Many seniors plan to “age in place”
– Approximately 90 percent of seniors intend to continue living in their current homes for the next five to 10 years
– Of these individuals, 85 percent are confident in their abilities to do so without making significant modifications to their homes
4
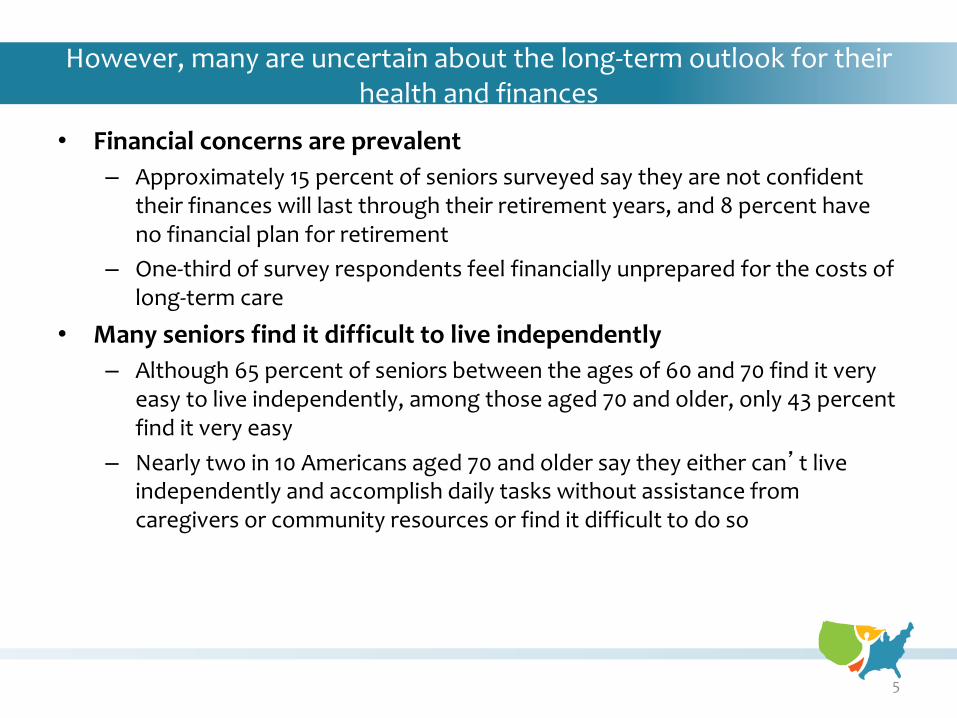
However, many are uncertain about the long-term outlook for their health and finances
• Financial concerns are prevalent
– Approximately 15 percent of seniors surveyed say they are not confident their finances will last through their retirement years, and 8 percent have no financial plan for retirement
– One-third of survey respondents feel financially unprepared for the costs of long-term care
• Many seniors find it difficult to live independently
– Although 65 percent of seniors between the ages of 60 and 70 find it very easy to live independently, among those aged 70 and older, only 43 percent find it very easy
– Nearly two in 10 Americans aged 70 and older say they either can’t live independently and accomplish daily tasks without assistance from caregivers or community resources or find it difficult to do so
5

And many are uncertain about the long-term outlook for their health and finances
• Communities are facing the pressure of the aging population
– More than 25 percent of seniors in their 60s say they are not confident their communities will have the resources and services they need to lead a healthy and independent life over the next five to 10 years
– Only half of seniors say their communities offer a high-quality public transportation system
– Approximately 42 percent of seniors say their communities have no bearing on their health or happiness
• Low- to moderate-income seniors face a unique set of challenges
– 72 percent of low- to moderate-income seniors report having a chronic health condition
– Nearly half (47 percent) of these seniors are not confident that their incomes will be sufficient to meet their monthly expenses over the next five to 10 years
6

LANDSCAPE

Seniors reflect on the past year positively
• The majority of respondents say the past year has been “normal,” and less than 10 percent say it has been “the worst yet”
8
In general, would you say the past year of your life has been…?

The majority of seniors expect their quality of life to improve or remain the same
• Respondents aged 70 and over are the most pessimistic about their future quality of life
9
When thinking about the next five to 10 years, do you expect your overall quality of life (including your financial well-being, mental and physical health, recreation and leisure time, and family situation) to get much better, somewhat better, stay about the same,
get somewhat worse, or get much worse?
60-64 (%) 65-69 (%) 70+ (%)
Much better 13 13 8
Somewhat better 25 20 15
Stay about the same 41 43 49
Somewhat worse 14 18 17
Much worse 5 4 8
Better
Worse
Same
60- 64 (%) 65- 69 (%) 70+ (%)

Seniors were positive about their health over the past year
• More than a quarter of seniors aged 65 to 69 say their health was better than normal
10
With regard to your health, would you say the past year of your life has been…?

The majority of seniors expect their health to remain the same over the next five to 10 years
• Similarly, at least one in five respondents aged 60 to 64 expect their health to improve in the next five to 10 years
11
When thinking about the next five to 10 years, do you expect your health to get much better, somewhat better, stay about the same, get somewhat worse, or get much worse?
60-64 (%) 65-69 (%) 70+ (%)
Much better 10 8 6
Somewhat better 12 11 8
Stay about the same 53 51 52
Somewhat worse 20 24 23
Much worse 2 4 8
60- 64 (%) 65- 69 (%) 70+ (%)
Better
Worse
Same

A vast majority of seniors say it is easy to live independently – even those over the age of 70
• Less than 5 percent cannot accomplish daily tasks without a caregiver, while 13 percent of seniors aged 70 and older find it difficult to do so
12
In general, is it easy or difficult for you to live independently and accomplish your daily tasks without assistance from caregivers (who help with buying groceries,
cleaning, and taking you to the doctor) or community resources, such as transportation, home health care, Meals on Wheels and wellness programs?

• Older adults (aged 65 plus) are less likely to strongly agree with the statement
Seniors lead lives of purpose and passion
How strongly do you agree or disagree with the following statement:
“I have a strong sense of purpose and passion about my life and my future.”
60-64 (%) 65-69 (%) 70+ (%)
Strongly agree 63 55 55
Somewhat agree 26 23 28
Neither agree nor disagree 5 8 8
Somewhat disagree 5 10 4
Strongly disagree 1 2 1
13

Many seniors are staying in the workforce longer
• More than a quarter of respondents aged 60 to 64 are still working full time, and 11 percent are employed part time
• One in five seniors over the age of 65 are still employed either full or part time
14
Which of the following best describes your current employment status?

Income, activity and enjoyment are the top drivers of the aging workforce
• While many seniors are still working for the income, just as many are motivated by enjoyment and a desire to stay active
15
For which, if any, of the following reasons are you still working? Please tell me all that apply.

However, job opportunities for seniors are limited
• Almost half of boomers surveyed do not believe that their communities offer job opportunities for people their age
16
Thinking about your community, please tell me how strongly you agree or disagree with the following statement:
“My community offers job opportunities for people of my age.”
60-64 (%) 65-69 (%) 70+ (%)
Strongly agree 11 12 9
Somewhat agree 18 19 17
Neither agree not disagree 16 18 13
Somewhat disagree 15 14 10
Strongly disagree 30 19 26

Seniors are largely satisfied with community resources and services
• Seniors aged 70 and older are the most satisfied with their communities’ resources and services, and the most optimistic about the availability of these services over the next five to 10 years
17
How satisfied are you with your community’s resources and services, with regard to helping you lead a healthy and independent lifestyle?
How confident are you that your community will have all of the resources and services you
need to help you lead a healthy and independent lifestyle for the next five to 10
years?
Confident
Not confident
Neither
Satisfied
Not satisfied
Neither/ Have not used these services
enough to have an opinion
60- 64 (%) 65- 69 (%)
70+ (%) 60- 64 (%) 65- 69 (%)
70+ (%)

ECONOMIC SECURITY AND HOUSING

The majority of older adults find it easy to pay monthly living expenses
• Roughly one in four seniors have difficulty paying monthly living expenses, and nearly an equal amount are not confident in their long-term prospects
19
In general, based on your current income and savings, how easy or difficult is it for you to pay your monthly living expenses? Showing National
Easy
Difficult
Neither
How confident are you that your income will be sufficient to meet your monthly expenses over
the next five to 10 years? Showing National
Confident
Not confident
Neither
60- 64 (%) 65- 69 (%) 70+ (%) 60- 64 (%)
65- 69 (%) 70+ (%)

Seniors are confident in their financial planning
• Close to seven in 10 older adults are confident that their finances will carry them through retirement
– The same number are confident they could pay for an unexpected expense
– However, more than one quarter of those aged 60 to 64 are not confident in or do not have a financial plan for retirement
20
How confident are you that your financial plan is sufficient to last for all of your retirement years?
If a significant unexpected expense (such as an accident or medical need) were to occur in
your life today, how confident are you that you would have the ability to pay?
Confident
Not confident
Neither
Confident
Not confident
Neither
Do not have a financial plan
60- 64 (%) 65- 69 (%) 70+ (%)
60- 64 (%) 65- 69 (%) 70+ (%)

• Nearly 90 percent of seniors aged 70 and older access medical insurance benefits through Medicare
Medicare is the most common source of medical insurance benefits among seniors…
Through what organizations, if any, do you access medical insurance benefits? Please tell me all that apply.
21

… and most see Medicare as an affordable option
• However, close to one-third of respondents are not confident they know all of the government benefits that are available to help meet their needs
• One in four seniors aged 60 to 64 are not confident that they can afford Medicare premiums, and for those eligible, one-third of seniors aged 70 and older are not confident that they can afford Medicare premiums
22
How confident are you that you know all of the government benefits to which you are entitled?
How confident are you that you will be able to afford your Medicare premiums,
deductibles and co-payments in future years?
Confident
Not confident
Neither
Confident
Not confident
Neither
60- 64 (%) 65- 69 (%) 70+ (%) 60- 64 (%) 65- 69 (%)
70+ (%)

Seniors believe the housing options in their communities are affordable
• Roughly seven in 10 consider available housing options affordable, and 40 percent of seniors aged 65 to 69 consider them very affordable
• Nearly 20 percent of respondents aged 60 to 64 think their options are unaffordable
23
How affordable are the housing options currently available to you?
60-64 (%) 65-69 (%) 70+ (%)
Very affordable 35 40 38
Somewhat affordable 32 29 31
Neither 9 9 10
Somewhat unaffordable 10 7 7
Very unaffordable 8 4 6
Affordable
Unaffordable
Neither
60- 64 (%) 65- 69 (%) 70+ (%)

• Close to nine in 10 older Americans intend to continue living in their current homes for the next five to 10 years
Most plan to continue living in current home
Do you intend to continue living in your current home for the next five to 10 years?
IF YES: Do you plan to make any modifications to your home to help you age in place? (N= 903)
If yes…
24

Seniors are confident that they will be able to stay in their current homes over the coming years…
• More than half of the national sample is very confident in their ability to stay in their current homes during the next five to 10 years
25
How confident are you that you can stay in your current home for the next five to 10 years without the need for significant home modifications?
60-64 (%) 65-69 (%) 70+ (%)
Very confident 56 56 54
Somewhat confident 29 26 32
Neither 4 3 4
Not very confident 5 8 5
Not at all confident 5 4 2
Confident
Not confident
Neither
60- 64 (%) 65- 69 (%) 70+ (%)
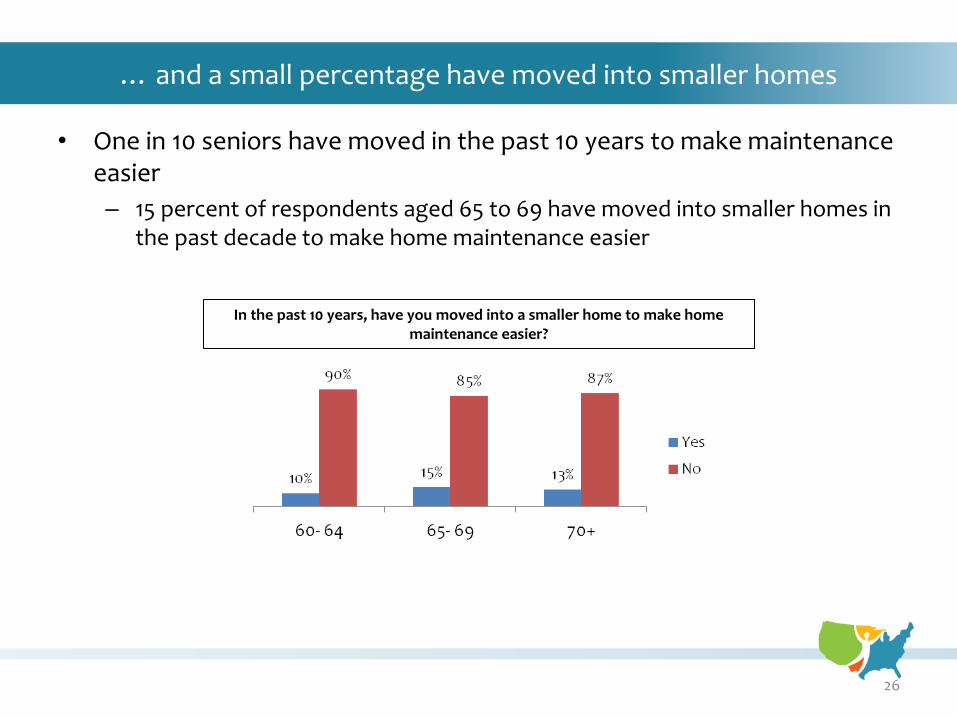
… and a small percentage have moved into smaller homes
• One in 10 seniors have moved in the past 10 years to make maintenance easier
– 15 percent of respondents aged 65 to 69 have moved into smaller homes in the past decade to make home maintenance easier
26
In the past 10 years, have you moved into a smaller home to make home maintenance easier?

While many plan to stay put, only some seniors are making home modifications
• One in five seniors have made significant home modifications to help them age in place
27
Have you made any significant modifications to your home to help you age in place? This could include adding handrails in a bathroom, moving your
bedroom downstairs, etc.

The main reasons to stay are comfort in their homes and to be near friends and family
• Desire to stay in a home they like and to be near friends and family are more popular reasons than the cost of moving to stay in one’s home
• Nearly one in four seniors cannot move either because they can’t afford the cost of moving or do not believe they could sell their home
28
IF YES: For which of the following reasons do you plan to stay in your home? Please tell me all that apply. Showing National (N = 903)

Seniors who intend to move seek a different community or region
• One in five respondents who intend to move in the next five to 10 years seek a different community or region
29
IF NO: Which of the following reasons best describes why you would move? Showing National (N = 101)

• Respondents are evenly split between staying in their current cities or regions and moving to a new city or region
Those intending to move are undecided on where to live
IF NO: Where do you plan to live when you move? Showing National (N = 101)
IF NEW CITY: For which of the following reasons would you move to a new city? Please select all that
apply. Showing National (N = 38)
30

Older adults view senior-living facilities in their community favorably
• Seniors aged 70 and older are the most favorable toward senior-living facilities in their community
31
In general, how favorable is your view of the senior-living facilities in your community? This would include patio homes or apartment communities geared
toward seniors, assisted-living facilities and the like.
Favorable
Not favorable
Neither
60-64 (%) 65-69 (%) 70+ (%)
Very favorable 22 27 34
Somewhat favorable 34 30 34
Neither 15 13 8
Somewhat unfavorable 9 9 5
Very unfavorable 8 8 6
60- 64 (%) 65- 69 (%) 70+ (%)

HEALTH AND WELLNESS

High blood pressure is the most prevalent self-reported chronic condition among seniors
• High blood pressure, diabetes and arthritis are more common among respondents aged 70 and older
33
What chronic conditions, if any, do you suffer from?

Seniors are confident in their abilities to proactively manage their health
• Seniors aged 65 to 69 are the most confident in their abilities to manage health conditions to reduce their needs to see a doctor
• Nearly one in five seniors aged 60 to 64 are not confident in their abilities to manage health conditions to reduce the need to see a doctor
34
IF SUFFERS FROM CHRONIC CONDITION: How confident are you that you can do the tasks and activities needed to manage your
health condition(s), as to reduce your need to see a doctor? (N= 608)
Confident
Not confident
Neither
60- 64 (%) 65- 69 (%) 70+ (%)

Beyond just taking medication, confidence in their abilities to manage illness is strong
• More than 80 percent of respondents are confident that they can do things besides taking medication to reduce the effects of illness on daily life
• Still, more than one in 10 respondents aged 60 to 64 are not confident
Confident
Not confident
Neither
IF SUFFERS FROM CHRONIC CONDITION: How confident are you that you can do things other than just taking medications to
reduce how much your illness affects your daily life? (N= 608)
35
60- 64 (%) 65- 69 (%) 70+ (%)

Older adults believe that they manage their mental health and stress levels well
National Gen Pop.
60-64 (%) 65-69 (%) 70+ (%)
Very well 62 56 62 65
Somewhat well 30 34 32 26
Neither 3 3 3 3
Somewhat poorly 3 4 2 2
Very poorly 1 2 1 1
How well would you say you manage your mental health and stress levels? Showing National
36
• Approximately 92 percent of seniors aged 65 and older say they manage their mental health and stress levels very or somewhat well

Older adults are exercising frequently
How often do you exercise or engage in physical activity to help you maintain your health?
37
• More than one-third of seniors exercise or engage in physical activity every day
– Seniors aged 70 and older are the most active; 39 percent are physically active every day

Seniors overwhelmingly report that they have good lines of communication with their doctors
• Only 4 percent of seniors say they communicate poorly with their doctors regarding health questions and concerns
38
How well would you say you communicate with your doctors regarding your health questions and concerns, including your test results?
Well
Poorly
Neither
60-64 (%) 65-69 (%) 70+ (%)
Very well 67 72 78
Somewhat well 23 21 15
Neither 4 2 2
Somewhat poorly 2 2 2
Very poorly 2 0 2
60- 64 (%) 65- 69 (%) 70+ (%)

• The majority of respondents are very confident in their knowledge of what their medications do and how to watch for side effects
Seniors are confident in their abilities to manage their medication
How confident are you that you know what your medications do and know what side effects to watch for?
39
Confident
Not confident
Neither
60-64 (%) 65-69 (%) 70+ (%)
Very confident 68 72 68
Somewhat confident 16 16 18
Neither 5 5 5
Not very confident 3 2 4
Not at all confident 1 0 1
60- 64 (%) 65- 69 (%) 70+ (%)

Seniors are confident in their abilities to see a primary care physician, but when requiring specialized care, confidence levels differ
• While roughly four in five respondents are very confident in their abilities to see a primary care physician in their community, only two in five are very confident in their abilities to see a geriatric care physician
40
60-64 (%) 65-69 (%) 70+ (%)
PCP Geriatric PCP Geriatric PCP Geriatric
Very confident 81 39 76 39 82 45
Somewhat confident 10 18 16 20 12 16
Neither 1 9 1 6 1 10
Not very confident 2 4 3 5 2 4
Not at all confident 4 7 2 7 1 7
If you were in need of medical care, how confident are you that you could see each of the following in your
community? Showing % Very confident

Seniors believe that it is easy to get to the offices of physicians they see most frequently
• Nearly one in 10 seniors aged 60 to 64 find it very or somewhat difficult
41
Thinking about the physician(s) whom you see most frequently, how easy or difficult is it for you to get to your physicians’ offices?
Easy
Difficult
Neither
60-64 (%) 65-69 (%) 70+ (%)
Very easy 69 74 73
Somewhat easy 17 16 20
Neither easy nor difficult 3 3 1
Somewhat difficult 5 5 4
Very difficult 4 2 1
60- 64 (%) 65- 69 (%) 70+ (%)

One quarter of seniors in need of long-term care find it difficult to afford…
Do you currently need any long-term care or support services?
Showing National
IF YES: How easy or difficult is it for you to afford your long-term care or support
services. Showing National (N = 78)
If yes…
Easy
Difficult
I receive these services for
free
42
• Approximately one in five seniors in need of long-term care receive these services for free

… and many seniors who don’t currently need these services believe that they would be unable to afford them in the future
• For those who do not currently need long-term care, roughly one-third are not confident they would be able to afford these services if they need them someday
IF NO: How confident are you that you would be able to afford long-term care or support services if you need them someday? (N= 927)
Confident
Not confident
Neither
60-64 (%) 65-69 (%) 70+ (%)
Very confident 19 27 25
Somewhat confident 31 26 35
Neither 8 10 6
Not very confident 23 22 15
Not at all confident 15 12 13 43
60- 64 (%) 65- 69 (%) 70+ (%)

Seniors are very confident in their abilities to maintain their health over the next decade
• Less than 10 percent are not confident in their abilities to do the things needed to maintain their health over the next five to 10 years
44
How confident are you that you will be able to do the things needed to maintain your health over the next five to 10 years?
Confident
Not confident
Neither / Don’t know what to do
60-64 (%) 65-69 (%) 70+ (%)
Very confident 44 47 33
Somewhat confident 43 40 46
Neither 4 2 6
Not very confident 3 5 6
Not at all confident 3 3 2
Don't know what to do to maintain my health 1 2 4
60- 64 (%) 65- 69 (%) 70+ (%)

COMMUNITY ACCESSIBILITY

• Older respondents are more likely to be able to meet all of their everyday needs without leaving their communities
Seniors can meet their everyday needs without leaving their communities
Are you able to meet all of your everyday needs without leaving your community?
46

Many say the community they live in does not impact their abilities to lead happy and healthy lives…
Does the community in which you live help you or hinder you in your ability to lead a happy and healthy life? Showing National
IF IT HELPS: Do you think your community will continue helping you be
happy and healthy over the next 5-10 years? Showing National (N= 500)
If helps…
60-64 (%) 65-69 (%) 70+ (%)
Help 47 52 51
Hinder 7 4 2
Neither 42 42 41 47
• Only half say the community they live in helps them lead a happy and healthy life

But the biggest complaints are affordability and walkability
• Respondents who say their communities hinder their abilities to lead a happy and healthy life would prefer a more affordable community or a more walkable community
48
Does the community in which you live help you or hinder you in your ability to lead a happy and healthy life? Showing National
IF IT HINDERS: What sort of community would help you lead a happy and healthy life? Please tell me all that apply. Showing National (N= 39)
If hinders…

Many seniors lack access to high-quality transportation…
Thinking about your community, please tell me how strongly you agree or disagree with the following statements.
Showing % strongly agree
A high-quality public transportation service is available in my community
I feel safe when I walk in my community
• Less than one-third of seniors strongly agree that there is a high-quality public transportation service in their community
• More than half strongly agree they feel safe walking in their community
49

… but also do not feel that they can walk as a means of travel
How often do you walk to places where you regularly need to go, such as church, the grocery store, the drug store, etc.?
• More than half of respondents never walk to places they regularly go
• Approximately 15 percent of respondents aged 65 to 69 walk everyday to places they need to regularly go
50

Awareness of services offered by non-profits and local government varies
Thinking about your community, please tell me how strongly you agree or disagree with the following statements. Showing % strongly agree
The local government in my community provides support services that can help older
adults with their daily needs
There are non-profit organizations, churches, or other types of organizations in my community that provide support services to help older adults with
their daily needs
• Seniors aged 65 and older are more likely to strongly agree that there are non-profits, churches and other organizations that provide support services for older adults
51
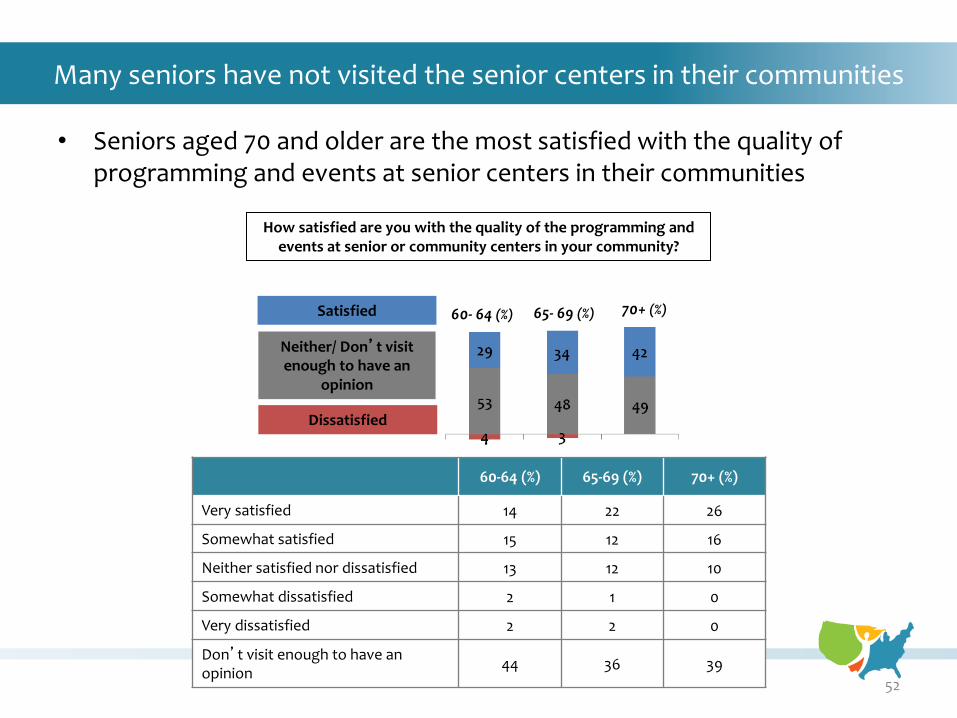
Many seniors have not visited the senior centers in their communities
• Seniors aged 70 and older are the most satisfied with the quality of programming and events at senior centers in their communities
52
How satisfied are you with the quality of the programming and events at senior or community centers in your community?
Satisfied
Dissatisfied
Neither/ Don’t visit enough to have an
opinion
60-64 (%) 65-69 (%) 70+ (%)
Very satisfied 14 22 26
Somewhat satisfied 15 12 16
Neither satisfied nor dissatisfied 13 12 10
Somewhat dissatisfied 2 1 0
Very dissatisfied 2 2 0
Don’t visit enough to have an opinion
44 36 39
60- 64 (%) 65- 69 (%) 70+ (%)

FAMILY AND CAREGIVERS

Older adults live close to relatives…
• Close to one-third of seniors either live with their nearest relatives or within walking distance
How close do your nearest relatives live, not including your spouse?
54

… and spend a good deal of time with relatives
• Seniors aged 70 and older spend the most time visiting relatives; 63 percent visit relatives at least once a week
How often do you spend time visiting with your relatives?
55

Older seniors are more likely to have someone they consider a caregiver
Do you have someone you consider a caregiver in your life? Showing National
IF YES: Is your caregiver a member of your family? Showing National (N= 500)
If yes…
IF YES: Is your caregiver a member of your family?
60-64 (%) (N= 249)
65- 69 (%) (N= 215)
70+ (%) (N= 601)
Yes 93 91 84
No 6 8 15
• More than half of seniors aged 70 and older have someone they consider a caregiver
– The vast majority of caregivers are family members
56
Do you have someone you consider a caregiver in your life?
60-64 (%) 65-69 (%) 70+ (%)
Yes 42 39 60
No 57 60 40

Nearly 50 percent of all seniors have a caregiver who lives in their home
• Seniors aged 70 and older are less likely than younger seniors to have a caregiver who lives with them
57
IF YES: How far away does your caregiver live? (N= 500)

Some seniors anticipate children or grandchildren acting as caregivers
• More than 40 percent of seniors aged 70 and older say it is likely a child or grandchild will need to act as a caregiver at some point in the future
58
IF NO: How likely is it that one of your children or grandchildren will need to serve as a caregiver for you at some point in the future? (N= 567)
60-64 (%) 65-69 (%) 70+ (%)
Very likely 16 15 20
Somewhat likely 21 20 22
Neither likely nor unlikely 11 8 6
Somewhat unlikely 18 13 13
Very unlikely 16 25 20
Don’t have any children or grandchildren 14 13 8
Likely
Not likely
Neither / Don’t have children
60- 64 (%) 65- 69 (%) 70+ (%)

Some older adults act as caregivers for someone else
• Nearly one-third of seniors aged 60 to 69 act as a caregiver for someone else
Do you act as a caregiver for someone else? Showing National
IF YES: Would you benefit from services designed to support caregivers, such as respite care? Showing National (N = 281)
If yes…
Do you act as a caregiver for someone else?
60-64 (%) 65-69 (%) 70+ (%)
Yes 29 32 26
No 71 68 74
Would you benefit from services designed to support caregivers, such as respite care?
60-64 (%) (N= 204)
65- 69 (%) (N= 175)
70+ (%) (N= 259)
Yes 37 44 50
No 50 38 40
59

One in five seniors are aware of the services offered by their communities, but the majority who know don’t take advantage of them
If you needed help attending to your everyday needs, is there a service in your
community you could call to request help? Showing National
IF YES: Have you ever used this service? National (N= 616)
If yes…
• Older seniors are either more aware of or have greater access to services in their communities to assist them in meeting everyday needs
60
If you needed help attending to your everyday needs, is there a service in your community you could call to request help?
60-64 (%) 65-69 (%) 70+ (%)
Yes 57 62 64
No 19 16 15
Don’t know 24 22 21

Older adults prefer to be called “senior citizens” or “seniors”
• Approximately 43 percent of respondents in the national sample prefer a variation of “seniors,” and 15 percent prefer “retirees”
Which of these do you think is the best term for people your age? Showing National
61
Related Documents