1 The United Republic of Tanzania FERTILITY AND NUPTIALITY 2012 Population and Housing Census 2015 Volume IV

Welcome message from author
This document is posted to help you gain knowledge. Please leave a comment to let me know what you think about it! Share it to your friends and learn new things together.
Transcript

1
The United Republic of Tanzania
FERTILITY AND NUPTIALITY
2012 Population and
Housing Census
2015
Volume IV

2
Director General,
National Bureau of Statistics,
18 Kivukoni Road,
P.O. Box 796,
11992 Dar es Salaam – Tanzania.
Tel: +255 22 2122722/3
Fax: +255 22 2130852
Email: [email protected]
Website: www.nbs.go.tz
Chief Government Statistician,
Office of Chief Government Statistician,
P.O. Box 2321,
Zanzibar.
Tel: +255 24 2231869
Fax: +255 24 2231742
Email: [email protected]
Website: www.ocgs.go.tz
NBS Vision
To be a preferable source of official statistics in Tanzania
NBS Mission
To facilitate informed decision-making process, through provision of relevant, timely and reliable user-
driven statistical information, coordinating statistical activities and promoting the adherence to statistical
methodologies and standards
For comments and suggestions, please contact:

Thematic Report on Fertility and Nuptiality
And
May, 2015
The United Republic of Tanzania
National Bureau of Statistics
Ministry of Finance
Dar es Salaam
Office of Chief Government Statistician
President’s Office, Finance, Economy and
Development Planning
Zanzibar

i
UNITED REPUBLIC OF TANZANIA, ADMINISTRATIVE BOUNDARIES

ii
Foreword
The 2012 Population and Housing Census (PHC) for the United Republic of Tanzania was carried
out on the 26th
August, 2012. This was the fifth Census after the Union of Tanganyika and Zanzibar
in 1964. Other censuses were carried out in 1967, 1978, 1988 and 2002. The 2012 PHC, like
previous censuses, will contribute to the improvement of quality of life of Tanzanians through the
provision of current and reliable data for policy formulation, development planning and service
delivery as well as for monitoring and evaluating national and international development
frameworks.
The 2012 PHC is unique as the collected information will be used in monitoring and evaluating the
Development Vision 2025 for Tanzania Mainland and Zanzibar Development Vision 2020, Five
Year Development Plan 2011/12–2015/16, National Strategy for Growth and Reduction of Poverty
(NSGRP) commonly known as MKUKUTA and Zanzibar Strategy for Growth and Reduction of
Poverty (ZSGRP) commonly known as MKUZA. The Census will also provide information for the
evaluation of the Millennium Development Goals (MDGs) in 2015. The Poverty Monitoring
Master Plan, which is the monitoring tool for NSGRP and ZSGRP, mapped out core indicators for
poverty monitoring against the sequence of surveys, with the 2012 PHC being one of them. Several
of these core indicators for poverty monitoring are measured directly from the 2012 PHC. The
Census provides a denominator for the determination of other indicators such as enrolment and
literacy rates, infant and maternal mortality rates, unemployment rate and others.
The success of the census depended upon the cooperation and contributions from the Government,
development partners, various institutions and the public at large. A special word of thanks should
go to Government leaders at all levels, particularly Minister for Finance; Minister of State,
President’s Office, Finance, Economy and Development Planning, Zanzibar; Members of
Parliament; Members of House of Representatives; Councilors; Regional and District Census
Committees chaired by Regional and District Commissioners; Supervisors; Field Assistants;
Enumerators; Local Leaders and Heads of households.
Our special gratitude should go to the following: UNFPA, DFID, Government of Japan, JICA,
UNDP, , UNICEF, USAID, World Bank and other development partners for providing assistance
in terms of equipment, long and short term consultancies, training and funding. We would like to
thank religious and political party leaders, as well as Non-Governmental Organizations (NGOs),

iii
mass media and the general public for their contribution towards the successful implementation of
the Census.
Last but not least, we would wish to acknowledge the vital contributions to the project by the
President of the United Republic of Tanzania, H.E. Dr. Jakaya Mrisho Kikwete, the President of
Zanzibar, Hon. Dr. Ali Mohamed Shein, Hajjat Amina Mrisho Said, the 2012 Commissioner for
PHC and Mr. Mwalim Haji Ameir, the Census Commissar for Zanzibar. Special thanks should also
go to the Management and staff of the National Bureau of Statistics (NBS) and Office of Chief
Government Statistician, Zanzibar (OCGS). Their commitment and dedication made significant
contributions to the overall efficiency of the census operations. We would also like to convey our
appreciation to all other Government Officials who worked tirelessly to ensure successful
implementation of the 2012 PHC.
May, 2015
Hon. Mizengo Peter Pinda (MP),
Prime Minister, United Republic of Tanzania
Hon. Ambassador Seif Ali Iddi (MP and MHR),
Second Vice President, Zanzibar

iv
Executive Summary
The 2012 Population and Housing Census (PHC) for the United Republic of Tanzania was carried
out on the 26th
August, 2012. This was the fifth Census after the Union of Tanganyika and Zanzibar
in 1964. Other censuses were carried out in 1967, 1978, 1988 and 2002. This monograph on
Nuptiality and Fertility provides a detailed analysis on nuptiality and fertility status as collected
from the Census. Important findings from the report are summarized below:-
Fertility
Fertility Levels and Trends: The Total Fertility Rate in Tanzania is 5.5 per woman. This means
that, at current fertility levels an average woman residing in Tanzania would have given 5.5 births
by the end of her reproductive life. Fertility shows a fairly standard pattern observed in many
developing countries. Rates start from low levels at very young ages (15-19), rising to a peak
somewhere in the twenties, then declining gradually from thirties to forties. Although TFR of 5.5
is still high, the level decreased from 6.9 recorded in the 1978 Census which is equivalent to a
reduction of 1.4 children per woman from 1978 to 2012.
Adolescent Fertility : Adolescent Fertility Rate is 81 per thousand women aged 15 – 19.
Adolescent fertility contributed 1.6 percent of the total TFR in the country. Slightly less than a
quarter (23.3 percent) had at least one birth at the time of the Census in 2012. Adolescent fertility
is low in Tanzania Zanzibar (11.6/1,000 women aged 15 - 19) as compared to Tanzania Mainland
(23.3/1,000 women aged 15 - 19). Early marriage seems to be a strong factor underlying adolescent
fertility in the country. The relative contribution of adolescent fertility was highest in Mtwara,
Lindi and Morogoro regions, where early marriages are common.
Fertility Differentials: Fertility levels differ widely in Tanzania. TFR for Tanzania Mainland (5.7
per woman) was relatively higher than that of Tanzania Zanzibar (5.2 per woman). TFR ranges
from 8.5 for Geita to 3.6 for Dar es Salaam. In general regions around Lake Victoria, Western part
and Pemba have higher rate of fertility than other regions in the country. A total fertility rate for
rural areas (6.5) is relatively higher than that for urban areas (4.1).
Married women (including those living together) have higher fertility (6.8 births per woman) than
the national average of 5.5 births per woman. The lowest TFR was recorded among the never
married and widowed both at 3.0 births per woman.

v
Fertility is negatively associated with the educational attainment of the mother. Total Fertility Rate
decreases from 7.0 for women with no education or who have attended pre-primary education only
to 3.2 for women with tertiary education (university or related).
Women engaged in agricultural activities (farmers, livestock keepers and fishers) have the highest
TFR (5.9) when compared to other occupations. Fertility levels were low among women engaged in
occupations that require professional training or other skills.
Nuptiality
Marital Status: Marriage is almost universal in Tanzania. At age 50, the percentage of the
population still single is only 7.2 percent for males and 11.9 percent for females. Over fifty percent
of the population aged 15 years and above of both male and female were either married or leaving
together at the time of the Census in August, 2012. The proportion of people who have never been
married was relatively higher among the male population (38 percent) than the female population
(33 percent). People living in rural areas were more likely to be married as than those in urban
areas. The difference was more pronounced among women (61.1 percent in rural against 52.1
percent in urban) than among men (58.7 percent versus 53.1 percent respectively).
Widowhood and Divorce: Widowhood increases with age irrespective of sex, but with higher
proportions among women. For males in age groups 50-54 years, 55-59 years and 60 years and
over, the proportion widowed was 3.9 percent, 4.3 percent and 11 percent, respectively. The
proportion widowed for females in corresponding ages was 7.3 percent, 9.5 percent and 30.8
percent, respectively. The percentages of divorced people are almost the same according to the
place of residence for both sexes. However, the proportion of the widowed population was slightly
higher in rural areas (3.2 percent) than in urban areas (4.7 percent).
Age at First Marriage: Males marry at a relatively older age as compared to females. The mean
age at first marriage for males was 25.8 compared to 22.3 years for females. On average, mean age
at first marriage was 24 years and was slightly higher in urban areas (25 years) than rural areas
(23.3 years). Average mean age at marriage increased slightly for males from 24.9 to 25.8 years
between 1978 and 2012 but increased by 3.2 years for females over the same period. Dar es
Salaam Region had the highest mean age at marriage for both males (27.5 years) and females (24.4
years) followed by Urban West (26.8 years for males and 23.9 years for females) and Kilimanjaro
(26.8 years for males and 23.9 years for females). The region with the lowest mean age at marriage
was Rukwa (23.3 years for males and 19.9 years for females).

vi
Population of Childless Women: About four percent (4.4) of the female population aged 45 – 49
were childless. The percentage of childless women in that age category was higher in Tanzania
Zanzibar (5.2 percent) as compared to Tanzania Mainland (4.3 percent).

vii
Summary of Key Indicators for Tanzania, Tanzania Mainland and Tanzania Zanzibar; 2012 Census
Region TFR
CBR (per
1000 women)
Mean Children
Ever Born(wom
en 45-49 years)
Childless Women
(45 to 49 Years)
(%)
Mean Age at
First Birth
(years)
Adolescents with at Least
One Birth (%)
Adolescent Fertility (Births
per 1000 Women)
Mean Age at First Marriage (years) Married/Living
Together (%)
Never Married
(%)
Separated/Divorced
(%)
Widowed (%)
Male Female
Tanzania 5.5 41.7 5.9 4.4 20.2 23.3 81.2 25.8 22.3 57.5 35.5 3.9 3.1
Tanzania Mainland 5.5 41.7 5.9 4.3 20.1 23.7 82.7 25.7 22.3 57.5 35.5 3.8 3.1
Dodoma 5.9 41.7 6.2 3.4 19.9 26.5 94.0 24.8 21.1 62.1 30.2 4.2 3.4
Arusha 4.3 35.2 5.2 3.0 22.0 14.6 45.5 26.4 22.4 57.4 37.0 2.9 2.7
Kilimanjaro 4.3 29.8 5.1 3.6 22.0 13.7 43.2 26.8 23.9 56.2 35.7 3.6 4.5
Tanga 5.7 41.3 6.0 4.3 20.6 21.7 77.2 26.0 22.3 59.0 33.2 4.0 3.8
Morogoro 4.9 37.6 5.6 4.5 19.7 27.4 98.2 25.5 21.8 58.4 33.9 4.5 3.2
Pwani 4.7 35.7 5.5 3.9 20.1 25.0 79.8 26.0 22.5 58.0 33.0 4.9 4.0
Dar es Salaam 3.6 36.7 4.5 5.8 23.1 12.0 37.7 27.5 24.4 49.1 44.5 4.2 2.3
Lindi 4.6 34.9 5.4 6.9 19.5 28.6 98.9 25.1 21.7 61.8 29.4 5.4 3.4
Mtwara 4.1 32.1 4.7 5.9 19.3 30.0 99.6 24.2 21.5 63.0 28.0 5.7 3.2
Ruvuma 4.9 36.8 5.4 4.3 19.4 29.3 93.7 24.5 21.3 62.6 31.4 3.2 2.8
Iringa 4.6 35.3 5.5 3.8 21.3 15.9 53.7 25.7 22.4 58.6 34.8 2.9 3.6
Mbeya 5.1 40.5 5.9 5.0 20.1 22.3 90.4 24.6 21.1 60.2 33.0 3.4 3.4
Singida 7.4 48.0 6.6 4.7 19.6 24.4 90.2 25.8 21.7 59.4 33.4 3.3 3.9
Tabora 7.0 49.6 6.6 3.7 19.0 36.5 127.1 25.7 22.1 56.6 36.8 3.7 2.9
Rukwa 7.3 52.0 7.1 3.2 18.9 30.7 127.0 23.3 19.9 66.2 28.7 3.0 2.1
Kigoma 7.3 48.4 7.1 3.0 20.2 22.0 82.2 25.2 22.6 55.8 36.3 4.1 3.8
Shinyanga 6.1 44.1 6.2 4.4 19.5 31.2 96.8 26.0 22.4 55.8 37.5 3.8 2.9
Kagera 6.4 44.2 6.8 3.1 20.3 20.5 78.3 24.4 21.0 61.3 31.4 4.2 3.1
Mwanza 6.7 48.2 6.6 4.5 20.1 26.2 87.6 26.1 22.8 54.4 38.7 4.0 2.9
Mara 7.0 49.0 6.4 4.7 19.0 30.5 119.4 25.6 21.4 58.4 35.4 2.8 3.4
Manyara 6.3 41.6 6.7 2.8 20.9 19.5 70.2 25.8 21.9 58.6 34.8 3.3 3.4
Njombe 4.2 33.4 5.3 4.3 21.5 15.2 50.9 25.2 22.1 59.9 33.6 2.7 3.8
Katavi 7.4 51.1 6.9 4.0 18.4 36.8 140.3 24.7 20.9 62.0 32.8 3.0 2.3
Simiyu 7.9 52.2 6.9 3.5 19.4 32.1 101.3 26.9 23.3 53.7 40.2 3.1 3.1

viii
Region TFR
CBR (per
1000 women)
Mean Children
Ever Born(wom
en 45-49 years)
Childless Women
(45 to 49 Years)
(%)
Mean Age at
First Birth
(years)
Adolescents with at Least
One Birth (%)
Adolescent Fertility (Births
per 1000 Women)
Mean Age at First Marriage (years) Married/Living
Together (%)
Never Married
(%)
Separated/Divorced
(%)
Widowed (%)
Male Female
Geita 8.5 56.9 6.9 4.4 18.9 31.6 125.0 25.1 21.5 58.7 35.5 3.6 2.3
Tanzania Zanzibar 5.2 38.9 6.5 5.2 22.9 11.6 35.6 26.3 23.3 57.1 36.2 4.6 2.1
Kaskazini Unguja 5.5 38.8 6.5 6.1 22.9 10.9 29.1 26.0 23.3 57.6 35.4 4.5 2.6
Kusini Unguja 4.8 38.4 6.4 4.0 21.9 17.5 47.9 25.7 22.0 60.4 31.8 5.7 2.1
Mjini Magharibi 4.3 36.0 5.9 5.9 23.7 9.3 26.1 26.8 23.9 54.8 38.4 4.9 1.9
Kaskazini Pemba 7.3 46.3 7.1 4.7 21.8 13.0 46.9 25.4 22.3 60.0 34.1 3.6 2.3
Kusini Pemba 7.4 48.4 7.7 2.7 22.7 14.8 58.6 25.5 22.5 59.4 34.6 3.9 2.2

ix
Table of contents
Foreword ................................................................................................................................... ii
Executive Summary ......................................................................................................................... iv
Summary of Key Indicators for Tanzania, Tanzania Mainland and Tanzania Zanzibar; 2012
Census ............................................................................................................................... vii
Table of contents .............................................................................................................................. ix
List of Tables ................................................................................................................................. xii
List of Figures ................................................................................................................................ xiv
List of Maps ................................................................................................................................ xiv
Chapter One ................................................................................................................................... 1
Introduction ................................................................................................................................... 1
1.1 Background on 2012 Population and Housing Census ....................................................... 1
1.2 Objectives of the 2012 PHC ................................................................................................ 2
1.3 Objectives of Fertility and Nuptiality Monograph .............................................................. 2
1.4 Sources of Fertility and Nuptiality Data ............................ Error! Bookmark not defined.
1.4.1 Other Sources of Fertility Data .......................................... Error! Bookmark not defined.
1.4.2 Population and Housing Census ........................................ Error! Bookmark not defined.
1.4.3 Household Sample Surveys ............................................... Error! Bookmark not defined.
1.5 Census Questions on Fertility and Nuptiality ..................................................................... 3
1.6 Limitation of Fertility Data from the Census ...................................................................... 4
1.7 Quality of Nuptiality and Fertility Data ............................. Error! Bookmark not defined.
1.8 Concepts and Definitions .................................................................................................... 5
1.9 Linkage between Nuptiality and Fertility ........................................................................... 9
Chapter Two ................................................................................................................................. 11
Nuptiality ................................................................................................................................. 11
2.1 Introduction ....................................................................................................................... 11
2.2 Measures of Nuptiality ....................................................... Error! Bookmark not defined.
2.2.1 Marital Status by Age and Sex .......................................................................................... 11
2.2.2 Marital Status by Place of Residence ................................................................................ 14
2.2.3 Age Sex-Specific Marriage Rates ..................................................................................... 19
2.2.4 Singulate Mean Age at First Marriage .............................................................................. 20
2.2.5 Mean Age at First Birth .................................................................................................... 23

x
Chapter Three ............................................................................................................................... 26
Fertility Levels, Trends and Patterns .......................................................................................... 26
3.1 Introduction ....................................................................................................................... 26
3.2 Fertility Estimation ............................................................ Error! Bookmark not defined.
3.3. Determination of a Most Likely Estimate of Fertility for 2012 ........................................ 26
3.4 Fertility Measures, Levels and Trends .............................................................................. 29
3.4.1 Measures of Fertility ......................................................................................................... 29
3.4.2 Fertility Levels .................................................................................................................. 29
3.4.2.1 Total Fertility Rate ............................................................................................................ 29
3.4.2.2 Crude Birth Rate ............................................................................................................... 32
3.4.2.3 General Fertility Rate ........................................................................................................ 34
3.4.2.4 Gross Reproduction Rate .................................................................................................. 34
3.5 Fertility Trends .................................................................................................................. 35
3.5.1 Total Fertility Rate ............................................................................................................ 35
3.5.2 Adjusted Crude Birth Rate ................................................................................................ 37
3.6 Fertility Patterns ................................................................................................................ 38
3.6.1 Age-Specific Fertility Rates .............................................................................................. 38
Chapter Four ................................................................................................................................. 40
Fertility Differentials ..................................................................................................................... 40
4.1 Introduction ....................................................................................................................... 40
4.2 Fertility by Age ................................................................................................................. 40
4.3 Fertility by Marital Status ................................................................................................. 41
4.4 Fertility by Education Level ............................................................................................. 42
4.5 Fertility by Occupation ..................................................................................................... 43
4.6 Fertility by Region and Residence .................................................................................... 44
4.6.1 Total Fertility Rates by Region and Residence ................................................................. 44
4.6.2 Average Parity by Region and Residence ......................................................................... 46
Chapter Five ................................................................................................................................. 47
Adolescent Fertility ....................................................................................................................... 47
5.1 Introduction ....................................................................................................................... 47
5.2 Levels of Adolescent Fertility ........................................................................................... 47
5.2.1 Contribution of Adolescent Fertility to Total Fertility Rate ............................................. 49

xi
5.3 Adolescent Fertility Differentials ...................................................................................... 51
5.3.1 Education Status ................................................................................................................ 51
5.3.2 Residence .......................................................................................................................... 53
Chapter Six ................................................................................................................................. 55
Lifetime Fertility ........................................................................................................................... 55
6.1 Introduction ....................................................................................................................... 55
6.2 Mean Number of Children Ever Born ............................................................................... 55
6.3 Parity Distribution and Progression Ratios ....................................................................... 57
6.3.1 Parity Distribution ............................................................................................................. 57
6.3.2 Parity Progression Ratios .................................................................................................. 58
6.4 Population of Women who are Childless .......................................................................... 59
Chapter Seven ................................................................................................................................ 61
Summary, Conclusion and Brief Policy Implications ................................................................ 61
7.1 Introduction ....................................................................................................................... 61
7.2 Nuptiality .......................................................................................................................... 61
7.3 Fertility Patterns, Levels, Trends and Differentials .......................................................... 62
7.3.1 Patterns and Levels ........................................................................................................... 62
7.3.2 Fertility Trends .................................................................................................................. 63
7.3.3 Fertility Differentials ......................................................................................................... 63
7.3.4 Adolescent Fertility ........................................................................................................... 64
7.3.5 Lifetime Fertility ............................................................................................................... 64
References ................................................................................................................................. 65
Appendices ................................................................................................................................. 67
Estimation and Adjustment of the 2012 PHC Fertility Data ........................................................... 67
Direct Estimates of Age-specific and Total Fertility Rates ............................................................. 67
The P/F Ratio Technique ................................................................................................................. 68
The Relational Gompertz Technique .............................................................................................. 69
Arriaga’s Technique ........................................................................................................................ 69
The Synthetic Intercensal P/F Ratio Technique .............................................................................. 69
The Own-Children Technique ......................................................................................................... 69
xii
Determination of a Most Likely Estimate of Fertility for 2012 ...................................................... 70
Summary of Results of Methods Used to Determine a Most Likely Total Fertility Rate from the 2012
Census.................................................................................................................................................... 70
Total Fertility Rate Estimates from Censuses and Surveys Data, 1982 ................................................ 71
Appendix I: Mean Number of Children Ever Born 2002 and 2012 ............................................ 72
Appendix II: Adjusted Age Specific Fertility Rates, 2012 ........................................................... 72
Appendix III: Mean Number of Children Ever Born by Region, 2012 .......................................... 73
Appendix IV: Major Indicators of Fertility and Nuptiality in Tanzania, 2012 .............................. 74
Appendix V: Recorded and Adjusted Crude Birth Rate by Region, 1967-2012 Censuses ........... 75
Appendix VI: Child Woman Ratio by Region ................................................................................ 76
Appendix VII: Mean at First Marriage and Age First Birth by Region and District ....................... 77
Annex: Questionnaires .................................................................................................................. 82
Annex 1: Short Questionnaire ......................................................................................................... 82
Annex 2: Long Questionnaire ......................................................................................................... 89
List of Tables
Table 2.1: Percentage Distribution of Population Aged 15 Years and Above by Marital Status
and Sex; Tanzania, 2012 Census ................................................................................ 12
Table 2.2: Percentage of Distribution of Population Aged 15 Years and Above by Census Year,
Sex and Marital Status; Tanzania, 2012 Census ........................................................ 12
Table 2.3: Percentage Distribution of Population Aged 15 Years and Above, by Age, Sex and
Marital Status; Tanzania, 2012 Census ...................................................................... 13
Table 2.4: Percentage Distribution of Population Aged 15 Years and Above by Sex, Marital
Status and Rural-Urban Residence; Tanzania, 2012 Census ..................................... 14
Table 2. 5: Percentage Distribution of Never Married Population Age 15 Years and Above by
Five Years Age Groups, Rural – Urban Residence and Sex; Tanzania, 2012 Census
15
Table 2.6: Percentage Distribution of Married or Living Together Population Age 15 Years and
Above by Five Years Age Groups, Rural – Urban Residence and Sex; Tanzania,
2012 Census ............................................................................................................... 15
Table 2.7: Percentage Distribution of Divorced or Separated Population Age 15 Years and
Above by Five Years Age Groups, Rural – Urban Residence and Sex; Tanzania,2012
Census ........................................................................................................................ 16
Table 2.8: Percentage Distribution of Widowed Population Age 15 Years and Above by Five
Years Age Groups, Rural – Urban Residences and Sex; Tanzania, 2012 Census ..... 16

xiii
Table 2.9: Percentage Distribution of Never Married Population Age 15 Years and Above by
Five Years Age Groups; Tanzania, 1978-2012 Censuses .......................................... 17
Table 2.10: Percentage Distribution of Married Population Age 15 Years and Above by Five
Years Age Groups and Sex; Tanzania, 1978-2012 Censuses .................................... 18
Table 2.11: Percentage Distribution of Divorce Population Aged 30 Years and Above by Five
Years Age Groups and Sex; Tanzania, 1978-2012 Censuses .................................... 18
Table 2.12: Percentage Distribution of Widowed Population Aged 30 Years and Above by Five
Years Age Groups and Sex; Tanzania, 1978-2012 Censuses .................................... 19
Table 2.13: Age-Sex Specific Marriage Rate for Population Age 15 Years and Above by Five
Years Age Group, Place of Residence and Sex; Tanzania, 2012 Census .................. 20
Table 2.14: Average Age at First Marriage by Sex and Average Age at First Birth by Place of
Residence; Tanzania, 2012 Census ........................................................................... 25
Table 3.1: Summary of Results of Methods Used to Determine a Most Likely Total Fertility Rate
from the 2012 Census; Tanzania, 2012 Census ......................................................... 27
Table 3.2: Reported and Estimated Total Fertility Rates; 2012 Census; Tanzania, 2012 Census ..
30
Table 3.3: Estimated Crude Birth Rates, General Fertility Rates, Gross Reproduction Rates and
Net Reproduction Rates; Tanzania, 2012 Census ...................................................... 33
Table 3.4: Estimated Total Fertility Rate by Region, Tanzania; 1967-2012 Censuses ............... 36
Table 3.5: Crude Birth Rate Trend, Tanzania, Tanzania Mainland and Tanzania Zanzibar; 1988-
2012 Censuses ............................................................................................................ 37
Table 3.6: Recorded and Adjusted Age Specific Rate; Tanzania, 2012 Census ......................... 38
Table 4.1: Urban Age Specific Fertility as a Proportion of Total ASFR; Tanzania, 2012 Census .
41
Table 4.2: Recorded Total Fertility Rates by Occupation of Woman; Tanzania, 2012 Census .. 44
Table 4. 3: Estimated Total Fertility Rate by Region; Tanzania, 2002 and 2012 Censuses ........ 45
Table 4.4: Reported Average CEB by Region and Residence; Tanzania, 2012 Census ............. 46
Table 5.1: Adolescent Fertility Rate; Tanzania, 2012 Census .................................................... 48
Table 5.2: Percentage of Adolescents with at Least One Birth by their Education Attainment;
Tanzania, 2012 Census ............................................................................................... 51
Table 5.3: Percentage of Adolescents with at Least One Birth by Education Attainment of the
Household Head; Tanzania, 2012 Census .................................................................. 52
Table 5.4: Percentage Distribution of Adolescents with at Least One Birth by Residence;
Tanzania, 2012 Census ............................................................................................... 53
Table 5.5: Percentage of Adolescent with at Least One Birth by Region and Rural – Urban
Residence; Tanzania, 2012 Census ............................................................................ 54
xiv
Table 6.1: Mean Number of Children Ever Born by Region; Tanzania, 2012 Census ............... 56
Table 6.2: Percentage Distribution of Women Five year’s Age group 15 - 49 by Total Children
Ever Born_1+; Tanzania, 2012 Census. ..................................................................... 57
Table 6.3: Percentage Distribution of Women Five year’s Age group 15 - 49 by Total Children
Ever Born_1+; Tanzania Rural, 2012 Census. ........................................................... 58
Table 6.4: Percentage Distribution of Women Five year’s Age group 15 - 64 by Total Children
Ever Born_1+; Tanzania Urban, 2012 Census. .......................................................... 58
Table 6.5: Parity Progression Ratios by Age, Residence; Tanzania, 2012 Census ..................... 59
Table 6.6: Percentage Distribution of Women Who are Childless Age 45 to 49 by Place of
Residence; Tanzania, 2012 Census ............................................................................ 60
List of Figures
Figure 2.1: Mean Age at First Marriage in Years by Place of Residence and Sex; Tanzania, 2012
Census ........................................................................................................................ 21
Figure 2.2: Mean Age at First Marriage by Sex; Tanzania, 1978 – 2012 Censuses ..................... 23
Figure 3.1:Total Fertility Rate Estimates from Censuses and Surveys Data; Tanzania, 2012
Census ........................................................................................................................ 27
Figure 3.2: Total Number of Births in the Last 12 Months Preceding the Census by Age Group;
Tanzania, 2012 Census ............................................................................................... 32
Figure 3.3: Total Fertility Rates for Tanzania, Tanzania Mainland and Tanzania Zanzibar; 1967
– 2012 Censuses ......................................................................................................... 35
Figure 3.4: Age-Specific Fertility Rates for Tanzania; 1988-2012 Census .................................. 39
Figure 4.1: ASFR by Residence; Tanzania, 2012 Census ............................................................. 40
Figure 4.2: Fertility Differentials by Marital Status; Tanzania, 2012 Census .............................. 42
Figure 4.3: Fertility Differentials by Education Level; Tanzania, 2012 Census .......................... 43
Figure 6.1: Pattern of Mean Number of Children Ever Born by Women; Tanzania, 2012 Census
57
List of Maps
Map 2.1: Mean Age at First Marriage in Years by Place of Residence and Sex; Tanzania, 2012
Census ........................................................................................................................ 22
Map 3. 1: Estimated Total Fertility Rates by Region; Tanzania, 2012 Census .......................... 31
Map 5.1: Percentage Contribution of Adolescent Fertility to TFR by Region; Tanzania, 2012
Census ........................................................................................................................ 50

xv
List of Abbreviations
AFR - Adolescent Fertility Rate
ASMRs - Age-sex Specific Rates are General Marriage Rates
ASFR - Age-Specific Fertility Rate
CBR - Crude Birth Rate
CEB - Children Ever Born
CMR - Crude Marriage Rate
DHS - Demographic and Health Survey
EA - Enumeration Area
EAC - East African Community
FLE - Family Life Education
GFR - General Fertility Rate
GMR - General Marriage Rate
GRR - Gross Reproduction Rate
MDGs - Millennium Development Goals
MKUZA - Mpango wa Kupumguza Umasikini Zanzibar
NBS - National Bureau of Statistics
NHIF - National Health Insurance Fund
NSGRP - National Strategy for Growth and Reduction of Poverty
NRR - Net Reproduction Rate
OCGS - Office of Chief Government Statistician
OMR - Optical Mark Reader
PHC - Population and Housing Census
PPR - Parity Progression Ratio
SMAM - Singulate Mean Age at Marriage
TFR - Total Fertility Rate
THMIS - Tanzania HIV/AIDS and Malaria Indicator Surveys
UN - United Nations
UNDP - United Nations Development Programme
UNFPA - United Nation Population Fund

xvi
UNICEF - United Nations Population Fund
URT - United Republic of Tanzania
USAID - United States Agency for International Development
WHO - World Health Organization
ZSGRP - Zanzibar Strategy for Growth and Reduction of Poverty
1
Chapter One
Introduction
1.1 Background on 2012 Population and Housing Census
The 2012 Population and Housing Census (PHC) for the United Republic of Tanzania was
executed under the provision of the Statistics Act No. 1, of 2002. This was the fifth Census after the
Union of Tanganyika and Zanzibar in 1964 and was conducted in accordance with the United
Nations Principles and Recommendations for population counts. Other censuses were carried out in
1967, 1978, 1988 and 2002. The census was undertaken on a de-facto basis and the reference was
the night of 25th
/26th
August, 2012. Like the previous censuses, the 2012 PHC enumerated people
by the place of residence on the census night. All persons found within the country were
enumerated, regardless of their nationalities or citizenship and diplomats were enumerated for the
first time in the history of census undertaking in Tanzania. The enumeration continued for two
weeks, from 26th
August to 8th
September 2012. The last week was mainly dedicated to
enumerating populations that were difficult to reach and sorting of completed questionnaires in
preparation for their dispatch to the Data Processing Center.
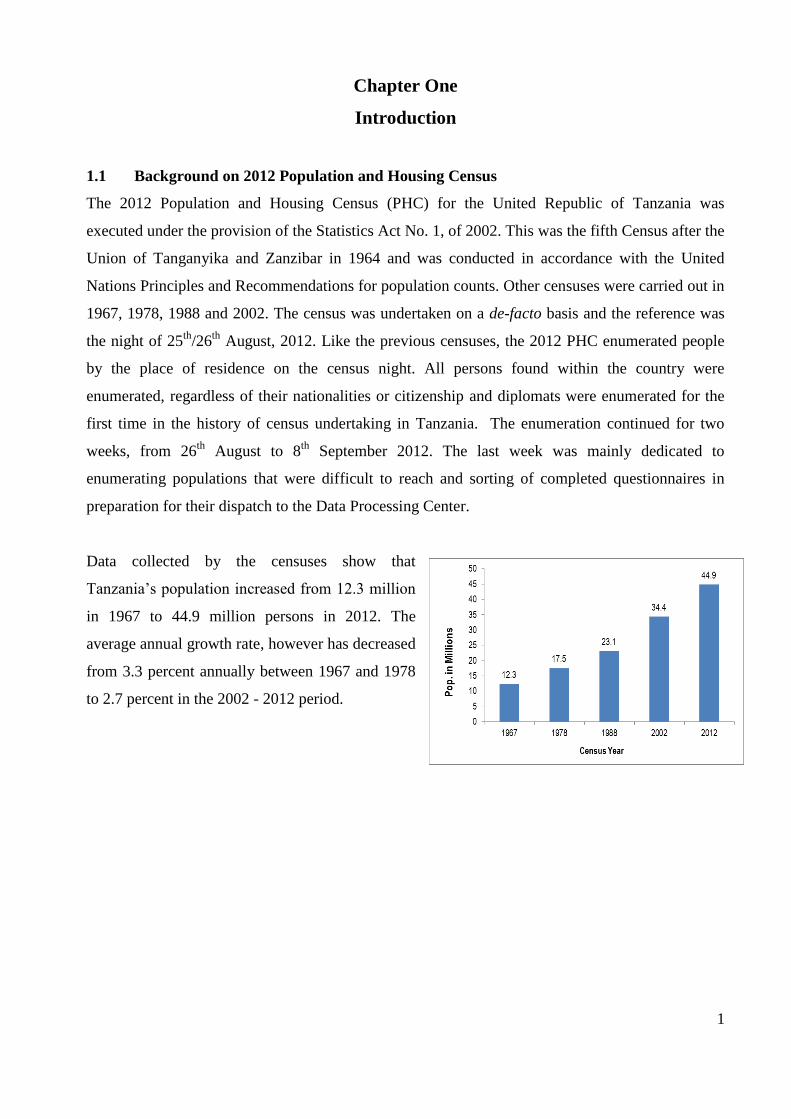
Data collected by the censuses show that
Tanzania’s population increased from 12.3 million
in 1967 to 44.9 million persons in 2012. The
average annual growth rate, however has decreased
from 3.3 percent annually between 1967 and 1978
to 2.7 percent in the 2002 - 2012 period.

2
1.2 Objectives of the 2012 PHC
The 2012 PHC provides the government with information on the size, distribution, composition and
other social economic characteristics of the population as well as information on housing
conditions. This information is important in providing updated benchmark data for the formulation,
implementation, monitoring and evaluation of population programmes and policies, including
Tanzania Development Vision 2025 and Vision 2020 for Tanzania Zanzibar, Five Year
Development Plan 2011/12–2015/16, National Strategy for Growth and Reduction of Poverty
(NSGRP) commonly known as MKUKUTA and Zanzibar Strategy for Growth and Reduction of
Poverty (ZSGRP) commonly known as MKUZA. The Census was also supposed to provide
information for the evaluation of progress towards achieving Millennium Development Goals
number two and five of (MDGs) in 2015. The Poverty Monitoring Master Plan, which is the
monitoring tool for NSGRP and ZSGRP, mapped out core indicators for poverty monitoring
against the sequence of surveys, with the 2012 PHC being one of them. Several of these core
indicators for poverty monitoring are measured directly from the 2012 PHC. The Census provides a
denominator for the determination of other indicators such as fertility levels and trends, enrolment
and literacy rates, infant and maternal mortality rates, unemployment rate and others.
1.3 Purpose of Fertility and Nuptiality Monograph
Generally the purpose of this monograph are to determine the levels, patterns and trends of fertility
and nuptiality and in particular it seeks to:
1) Analyze marriage and nuptiality levels and trends;
2) Examine nuptiality differentials by residence and social characteristics;
3) Analyze the level and trends of fertility;
4) Determine fertility differentials by residence and social characteristics; and
5) Suggest policy recommendations.
In this monograph, various measures or indices of fertility levels and trends analyzed are: average
parities; Total Fertility Rate (TFR); Age-Specific Fertility Rate (ASFR); Crude Birth Rate (CBR)
and Age Specific Parity. Moreover, fertility differentials were estimated with respect to place of
residence, marital status, education attainment, and occupation of the respondents. Nuptiality
estimates are obtained from data on marital status. An analysis of nuptiality levels and trends has
been based on proportions of different marital statuses as portrayed in the census data. In order to
reduce substantial errors inherent in such direct estimates of fertility levels and trends, indirect
techniques were used to adjust some of the measures and indices.
3
1.4 Census Questions on Fertility and Nuptiality
Overall, the 2012 PHC asked more questions about nuptiality and fertility than the 2002 Census. In
measuring nuptiality and fertility in the 2012 Census, questions on nuptiality for the two censuses
were exactly the same with seven categories of marital status. On fertility, the questions on children
ever born were also the same for the two censuses but for current fertility there were two questions
in 2012 Census against one question in 2002 PHC. The question asked in the 2002 Census was
how many male/female were born alive in the last 12 months while for the 2012 Census the
questions asked were how many male/female children were born alive in the last 12 months and
how many male/female children were born alive in the last 12 months and are still alive. The
essence of the second question asked in 2012 Census was to cross-check the information to ensure
that no inclusion of still birth or late fetal births were included in the data collected for fertility.

4
1.5 Quality of Fertility and Nuptiality Data
Census data in Tanzania like many other developing nations is faced with coverage and content
errors, which vary both in nature and magnitude from one region to another. Coverage errors result
from omission of certain pockets of the population, while content errors pertain to misreporting or
misclassification of events. Although efforts were made to generate complete and accurate data on
fertility and nuptiality, some common problems of censuses in developing countries remain and
have to be managed in this analysis. Such problems include over-reporting of live births by younger
women, under-reporting of live births by older women, age and event misreporting.
Fertility estimates in this monograph are based on current and lifetime fertility data, while
nuptiality estimates are obtained from data on marital status. Errors that affect current fertility data
include age misreporting, omission of births, incorrect dating of recent births or reference period
error and use of short time period which raise uncertainties in the reported fertility levels due to
sample variability of observed numbers of births.
Errors that affect the lifetime fertility data include the possible misstatement of the age of women
especially in their earlier lifetime fertility, under-reporting of births of women above 35 years and
unmarried adolescents who would not like to be reported as mothers. Other errors in the reported
births are the omission of births by older women mainly due to memory lapse, especially of those
births that ended in the early death of the child. Older women also tend to forget grown-up
children, those born to another husband or man, children who left the household soon after birth
and children not present at home for various reasons. Also, errors in such data can and do occur due
to wrongful inclusion of still births and late fetal deaths. There are also factors that may tend to
inflate the number of births, for example the inclusion of step or adopted children or grandchildren,
the inclusion of dead children, and non-inclusion of parity of a sizeable proportion of women who
did not state their parities, or a dash or a space left blank (UN, 1983).
Age and sex structure of the population is also important in explaining levels, trends and patterns of
fertility and nuptiality. Hence, the quality of age data is assessed mainly by examining the extent of
age misreporting and age heaping by women of reproductive age. Furthermore, examining average
parities, parity distributions and proportion childless will give further insights into the quality of
reporting of fertility data for various cohorts. The quality of nuptiality data, on the other hand, is
influenced by individual perceptions. The validation of such data is embedded in the cultural
norms and practices that determine respondent’s perceptions and engagement into various marital

5
statuses and conditions. Given the possibilities of these distortions, caution needs to be taken in
interpreting the reported data. In this situation, indirect techniques cannot be avoided.
1.8 Concepts and Definitions
General
Age is the number of years one had lived as at last birthday in reference to the census night.
Census Night is a reference night of the census. Reference night for Tanzania 2012 Population and
Housing Census was the night of 25th
/26th
August 2012.
Urban Area - Countries differ in their definitions of urban, although it is fairly common for the
urban population to consist of those living in towns and cities of a few thousand persons or more
especially if the population of such areas is largely non-agricultural. For the purpose of the 2012
PHC, urban population consists of people living in areas legally recognized (gazetted) as urban and
all areas recognized by Local Government Authorities as urban.
Population Growth Rate is the fractional rate at which the number of individuals in a population
increases. It specifically refers to the change in population over a unit time period, often expressed
as a percentage of the number of individuals in the population at the beginning of that period.
Household refers to a person or group of persons who reside in the same homestead or compound
but not necessarily in the same dwelling unit, have the same cooking arrangements, and are
answerable to the same household head, except for a collective household.
Head of Household is a person who is acknowledged as such by other household members.
Nuptiality
Crude Marriage Rate (CMR) measures the incidence of marriage and is defined as the marriages
per one thousand of the total population. The CMR is calculated by the following formula:
CMR= 1000*P
M
Where M is number of marriages persons and P is the total population
Divorced Persons are those persons who were once married but their marriages were permanently
terminated and have not remarried. Note that in polygamous marriages the divorce of one or more
wives does not categorize the husband as divorced if he still lives with the other wife (wives).

6
The General Marriage Rate (GMR) is the measure of the marriages per one thousand of the
marriageable age population.
GMR= 1000*15P
M
Where M is number of married persons and 15P is total population at age 15 and above
Living Together - Persons in consensual unions or socially recognized stable unions.
The Mean Age at First Birth is defined as the average length of single life expressed in years
among those who experienced child-bearing before age 50.
Step 1: Calculation of the person years lived in a childless state, denoted by A where
A= 15 + 5*4945
1915
x
xS
Where xS= Proportional childless in the age group x
Step 2: Estimation of the proportion of the remaining childless at age 50, denoted by B
where
B=
2
54504945 SS
If the proportion women childless in age group 50-54 is not available, then B= 4945S
Step 3: Estimation of the proportional childless by age 50, denoted by C, i.e. C=1-B
Step 4: Calculation of the number of person-years lived by proportion childless, denoted by
D, i.e. D=50*B
Step 5: Calculation of Mean age at first birth=
C
DA
Married - Persons who are formally married irrespective of the type of marriage, which may be
customary, civil or religious marriage.
Singulate Mean Age at Marriage (SMAM) is defined as the average length of single life
expressed in years among those who marry before age 50.The Singulate Mean Age at Marriage is
calculated from data on the proportion never married by age and sex by using the following
formula:
Step 1: Calculation of the person years lived in a single state, denoted by A
A= 15 + 5*4945
1915
x
xS

7
Where xS= Proportion single in the age group x
Step 2: Estimation of the proportion of the remaining single at age 50, denoted by B
B=
2
54504945 SS
If the proportion single in age group 50-54 is not available, then B= 4945S
Step 3: Estimation of the proportion ever married by age 50, denoted by C i.e. C=1-B
Step 4: Calculation of the number of person-years lived by proportion not married, denoted
by D, i.e. D=50*B
Step 5: Calculation of SMAM=
C
DA
Never Married: Persons who have remained single all their lives excluding persons who have
lived with another person and are now living alone.
Separated:- Persons who were once married but now are living apart. Those who live apart
because their spouses are employed far away from home or for similar reasons are considered to be
in union (married or living together).
Widowed - Persons whose marriages were terminated by death and have not remarried since.
However, in polygamous marriages the death of one or more wives does not make the husband a
widower if he still has another wife (wives).
Fertility
Adolescent Fertility rate is the number of births per 1,000 women ages 15-19.
Age Specific Fertility Rate is calculated as number of births in a year to mothers of a specific age
per woman (or per 1000 women) of the same age at midyear. ASFR is usually calculated for
women in each 5-year age group for ages 15-49 years.
ASFRa = (Ba/Ea) x1000
Where:
Ba = number of births to women in age group a in a given year or reference period; and
Ea =number of person-years of exposure in age group a during the specified reference
period

8
Children Ever Born (CEB) to women in a particular age group is the mean number of children
born alive to women in that age group. The number of children ever born to a particular woman is a
measure of her lifetime fertility experience up to the moment at which the data are collected.
Childlessness is the condition of being without children. Two distinguished types of childlessness
are voluntary and involuntary. Voluntary childlessness is a consequence of having made a decision
not to reproduce. To be childlessness not by choice is defined as involuntary childlessness.
Crude Birth Rate (CBR): The CBR is defined as the number of births in a year divided by the
mid-year population, multiplied by 1000. While all other indices are derived by using births of
women in childbearing age, the indicator on CBR includes all births in the population including
from women outside the reproductive age group 15 – 49.
Where B is births in a year, P is the total population or mid-year population. The CBR is a
general indicator of fertility in a population or country or a particular area.
Current Fertility refers to the total number of live births in the year preceding the census date, of
women of reproductive age (15-49 years).
General Fertility Rate (GFR) is defined as the number of live births per 1,000 women aged 15-
49 years in a population per year represented as:
Where B is the number of births in a year and Pf15 – 49 is the number of women aged 15 to 49
years.
Gross Reproduction Rate (GRR) is the measure analogous to the total fertility rate, but it refers
only to female births. Thus, it is derived as the same manner of TFR but uses a set of Age-Specific
Fertility Rates calculated based on female births only.
GRR = TFR x Proportion of Births that are female
Live Birth is defined as the complete expulsion or extraction from its mother of a product of
conception, irrespective of the duration of pregnancy, which after separation, breathes or shows any
other evidence of life, such as beating of the heart, pulsation of the umbilical cord, or definite
movement of voluntary muscles, whether or not the umbilical cord has been cut or the placenta is
attached; each product of such a birth is considered live-born.

9
Net Reproduction Rate (NRR) is the average number of daughters that would be born to a female
(or a group of females) if she passed through her lifetime conforming to the age-specific fertility
and mortality rates of a given year. This rate is similar to the gross reproduction rate but takes into
account that some females will die before completing their childbearing years
Total Fertility Rate (TFR)
TFR is the average number of children that would be born to a woman by the time she ended her
child-bearing if she were to pass through all her childbearing years conforming to the age-specific
fertility rates of a given year. TFR is the sum of the age-specific fertility rate (ASFR) for women
aged 15-49, in 5-year age intervals.
TFR is calculated as 5*∑ASFRs where there are 5-year age groups
Or ∑ASFRs per singe year 15 to 49
Parity is the number of children born alive to a woman.
Parity Progression Ratio (PPR) is the probability of having another child given that the mother
has reached certain parity. PPRs are usually represented as a0, a1, a2 and so on. The term a0 is a
measure of infertility. Women progressing to higher parities usually have high fertility rates. Zero
parity women are those with no live births and single parity refers to those women who have one
child and so on. PPR can be calculated by using the following formula:
borneverchildrenxleastatwithWomen
borneverchildrenxleastatwithWomenax
1
1.9 Linkage between Nuptiality and Fertility
The analysis of nuptiality trends and differentials contribute to our understanding of fertility trends
and differentials because most childbearing occurs within marriage. Changes in fertility are usually
conditioned by differences in the proportions marrying and age at marriage. Marriage is one of the
proximate determinants of fertility (Bongaarts, 1978). Marriage at later ages allows women to
prolong their education and delay first births, and such women tend to have fewer children.
Divorce, separation or widowhood also have an impact on fertility. Divorce reduces the proportion
of the reproductive period during which women are exposed to intercourse and consequently tend
to have a depressing effect on fertility. Also, marital dissolution tends to reduce fertility if re-
marriage is infrequent or delayed.

10
Studies also suggest that women in polygynous marriages have a lower fertility than women in
monogamous marriages. The analysis carried out on census data from several countries, found a
negative relationship between polygyny prevalence and community fertility.
In general, age at marriage, form of marriage, duration of marriage, divorce and widowhood all
determine the woman’s period of exposure to child-bearing and therefore the level of fertility. A
woman who marries at the age of thirty-five years is very unlikely to produce more than one or two
children because of declining fertility with age, while a girl who marries at the age of eighteen
years would have the potential to produce ten children by age thirty-five.

11
Chapter Two
Nuptiality
2.1 Introduction
Nuptiality status is one of the basic population characteristics generally determined in population
censuses and household surveys. Nuptiality refers to marriage as a population phenomenon,
including the rate at which it occurs, the characteristics of persons united in marriage, and the
dissolution of such unions through divorce, separation and widowhood. The institution of marriage
is, therefore, a milestone stage in the growth of human evolution.
In the 2012 PHC, marital status referred to personal status of each individual in relation to defined
six categories: Never married, married, living together, divorced, separated and widowed. The
question was: “What is the current marital status of [NAME]?”
The analysis of marital status and nuptiality is important in helping to understand the social
dynamics of a society and how it changes over time. Indeed, marriage is the major determinant of
fertility, especially in a country such as Tanzania where the large majority of children are born in
wedlock. Thus, knowing how many people are in union or not and at what age they tend to get
married enables us to understand more about the dynamics of the population. In addition, the
comparison of the distribution of marital status at different periods provides information on how a
society is evolving.
2.2 Marital Status by Age and Sex
Table 2.1 shows the marital status of persons aged 15 years and above in the 2012 PHC. Fifty seven
(57 percent) of the male population aged 15 years and above were in union (50.5 and 6.3 percent
married or living together respectively) which was slightly higher than that for females (58
percent, including 51.6 percent married and 6.5 living together). The proportion of people who
have never been married was significantly higher among the male population (38 percent) than
among the female population (33 percent). The majority of never married persons are in younger
age groups which explains the relatively high percentage of unmarried population (38 for male and
33 for female).
The proportion of married male population in Tanzania Mainland (50.4 percent) was almost the
same as that for Tanzania (50.5 percent), while the proportion of married males was higher in

12
Tanzania Zanzibar (56.4 percent) compared to Tanzania and Tanzania Mainland. Results further
show extremely low proportions of person living together in Tanzania Zanzibar (0.6 and 0.7
percent for males and females respectively) compared to those in Tanzania Mainland (6.5 and 6.7
for males and females respectively). The proportion of females who were divorced in Tanzania
Zanzibar was higher (5.6 percent) than that for Tanzania Mainland (3.4 percent) which may be
explained by major differences in religious belief between the Mainland and Zanzibar.
Table 2.1: Percentage Distribution of Population Aged 15 Years and Above by Marital Status
and Sex; Tanzania, 2012 Census
Marital status Tanzania Tanzania Mainland Tanzania Zanzibar
Male Female Male Female Male Female
Total 11,654,542 12,938,491 11,310,935 12,547,931 343,607 390,560
Never married 38.3 33.0 38.3 32.9 38.8 34.0
Married 50.5 51.6 50.4 51.5 56.4 56.5
Living together 6.3 6.5 6.5 6.7 0.6 0.7
Divorced 2.3 3.5 2.3 3.4 2.9 5.6
Separated 0.7 1.2 0.7 1.2 0.2 0.3
Widowed 1.9 4.2 1.9 4.3 1.2 2.9
Table 2.2 compares the percentage distribution of population aged 15 years and above by marital
status in 1978, 1988, 2002 and 2012 PHCs. Major observation from the results is the patterns of
males versus females. While male patterns have remained more or less unchanged since 1978 in all
statuses, females show major change in never married and widowed categories. The percentage of
never married females has more than doubled over the period and the percentage of widowed
females dropped from 9.1 percent in 1978 to 4.2 percent in 2012. Doubling of never married
females may be associated with development in the education sector whereby girls are increasingly
getting equal opportunities in education and spending more years in schools as compared to three
decades ago.
Table 2.2: Percentage of Distribution of Population Aged 15 Years and Above by Census
Year, Sex and Marital Status; Tanzania, 2012 Census
Census Year Male Female
Never married
Married Divorced Widowed Never
married Married Divorced Widowed
1978 33.2 61.4 3.7 1.7 15.5 69.5 5.8 9.1
1988 38.3 57.0 3.1 1.6 21.5 63.8 6.2 8.5
2002 39.2 56.1 3.2 1.5 24.5 60.1 6.7 8.6
2012 38.3 56.8 3.0 1.9 33.0 58.1 4.7 4.2

13
Table 2.3 and Figure 2.1 present the percentage of population aged 15 and above by marital status,
age and sex from the 2012 Census. Marriage is associated with the individual’s age, and hence, the
distribution by marital status concurrently varies with age. The proportion of males who have never
been married in the population decreases significantly from 92.2 percent for the age group 15–19 to
6.5 percent for those aged 60 years and above. (Corresponding figures for females are 83.3 and 15
percent). Like in many Sub-Saharan African countries, marriage is almost universal and this is
confirmed by results that show that at age 50, the percentage of the population still single was only
7.2 percent for males and 11.9 percent for females.
The age structure shows that widowhood also increases with age irrespective of sex, but with
higher proportions among women. For males in age groups 50-54 years, 55-59 years and 60 years
and over, the proportion widowed was 3.9 percent, 4.3 percent and 11 percent, respectively. The
proportion widowed for females in corresponding age groups was 7.3 percent, 9.5 percent and 30.8
percent, respectively. There are three factors that may explain big gaps between the two sexes.
Firstly, in many marriages, wives are younger than their husbands; secondly, women on average
tend to live longer than men and thirdly, widowed men, especially al older ages, have a greater
chance of remarrying than widowed women.
Table 2.3: Percentage Distribution of Population Aged 15 Years and Above, by Age, Sex
and Marital Status; Tanzania, 2012 Census
Age Total Never Married Married Living Together Divorced Separated Widowed
Male Total 11,654,542 38.3 50.5 6.3 2.3 0.7 1.9
15-19 2,185,879 92.2 7.6 0.2 0.0 0.0 0.0
20-24 1,715,419 68.7 25.3 3.1 2.8 0.1 0.1
25-29 1,490,891 37.5 51.9 9.7 0.6 0.3 0.1
30-34 1,335,795 20.3 65.1 9.7 4.1 0.7 0.1
35-39 1,148,252 13.6 71.8 9.6 3.9 0.9 0.2
40-44 917,866 10.4 76.2 8.8 2.0 1.1 1.6
45-49 700,443 6.8 77.6 8.0 2.4 1.3 4.0
50-54 593,696 7.2 77.5 7.4 2.6 1.4 3.9
55-59 384,188 6.9 74.5 8.5 4.3 1.5 4.3
60 and above 1,182,113 6.5 70.5 7.0 3.5 1.5 11.0
Female Total 12,938,491 33.0 51.6 6.5 3.5 1.2 4.2
15-19 2,309,554 83.3 14.7 1.9 0.0 0.0 0.0
20-24 2,100,896 46.2 44.1 7.2 2.3 0.3 0.1
25-29 1,809,019 24.9 63.0 10.1 1.3 0.7 0.0
30-34 1,503,808 16.8 68.3 8.6 5.0 1.3 0.1
35-39 1,238,028 13.3 71.4 7.9 5.5 1.7 0.2
40-44 939,611 12.1 72.4 6.9 4.4 2.3 1.9
45-49 776,612 9.6 70.8 6.0 5.0 2.5 6.1

14
50-54 594,285 11.9 67.2 5.2 5.7 2.7 7.3
55-59 376,083 13.5 57.1 7.9 9.2 2.9 9.5
60 and above 1,290,595 15.0 40.4 4.9 6.7 2.2 30.8
2.2.2 Marital Status by Place of Residence
Population in rural areas is more likely to be married than those living in urban areas as shown in
Table 2.4. Percentage of never married urban population (53.1 percent for males and 39.7 for
females) was higher than that of rural population (36.4 percent for males and 29.6 percent for
females). The observed marital patterns by place of residence is consistent with fertility patterns
reported in Chapter Four i.e. Higher proportion of never married population in urban compared to
rural areas is likely associated with lower fertility in the former vis-a-vis the latter areas. Many
societies in developing countries regard marriage as a necessity and marriage is considered
important for reproduction and social status. Furthermore, relatively hard economic conditions in
urban areas as compared to rural may force urban population to remain single. Results further show
that the percentage of widowed populations was more than twice among female population (4.2
percent) than male population (1.9 percent). As highlighted in Section 2.2.1 of this Chapter, this is
caused by several factors including more chances for widowed men to remarry than women, and
since the Census questionnaire sought the prevailing status of marriage, differences between the
two sexes is inevitable.
Table 2.4: Percentage Distribution of Population Aged 15 Years and Above by Sex, Marital
Status and Rural-Urban Residence; Tanzania, 2012 Census
Sex and Marital Status Number Percentage
Tanzania Rural Urban Tanzania Rural Urban
Male
Never Married 4,466,795 2,838,300 1,628,495 38.3 36.4 42.2
Married or Living Together 6,628,641 4,578,377 2,050,264 56.8 58.7 53.1
Divorced or Separated 341,034 222,705 118,329 3.0 2.9 3.1
Widowed 218,072 156,370 61,702 1.9 2.0 1.6
Female
Never Married 4,264,033 2,544,123 1,719,910 33.0 29.6 39.7
Married or Living Together 7,520,418 5,263,871 2,256,547 58.1 61.1 52.1
Divorced or Separated 606,828 393,889 212,939 4.7 4.6 4.9
Widowed 547,212 407,399 139,813 4.2 4.7 3.2
The proportion of the population who had never married was higher in urban than in rural areas for
all age groups and sex (Table 2.5). Relatively higher percentages of urban unmarried women in age
group 25–39 have an influence on urban fertility lowering it as compared to rural areas.

15
Table 2.5: Percentage Distribution of Never Married Population Age 15 Years and Above
by Five Years Age Groups, Rural – Urban Residence and Sex; Tanzania, 2012
Census
Age Rural Urban
Male Female Male Female
Total 36.4 29.6 42.2 39.7
15-19 92.0 81.2 92.7 87.1
20-24 65.7 41.7 73.6 53.4
25-29 33.5 21.0 43.9 31.3
30-34 17.6 13.8 24.7 22.1
35-39 11.8 10.8 16.7 18.1
40-44 9.2 10.3 12.6 16.3
45-49 6.1 8.3 8.4 12.6
50 and above 6.3 13.3 8.0 16.2
Table 2.6 compares the proportion of population aged 15 years and above who reported that they
were currently in union (currently married or living together). The proportion in union was higher
in rural areas (58.7 for males and 61.1 for females) than urban areas (53.1 for males and 52.1 for
females) in all age groups and for both males and females. The trend shows that the proportion
increases with increasing age for both males and females.
Table 2.6: Percentage Distribution of Married or Living Together Population Age 15
Years and Above by Five Years Age Groups, Rural – Urban Residence and
Sex; Tanzania, 2012 Census
Age Rural Urban
Male Female Male Female
Total 58.7 61.1 53.1 52.1
15-19 8.0 18.7 7.3 12.9
20-24 31.3 55.8 23.5 43.8
25-29 65.5 77.1 55.2 66.4
30-34 77.6 80.3 70.3 70.8
35-39 83.4 82.3 77.9 73.1
40-44 86.4 81.9 82.1 73.6
45-49 86.7 79.2 83.1 71.2
50 and above 81.5 56.9 78.4 51.7
.
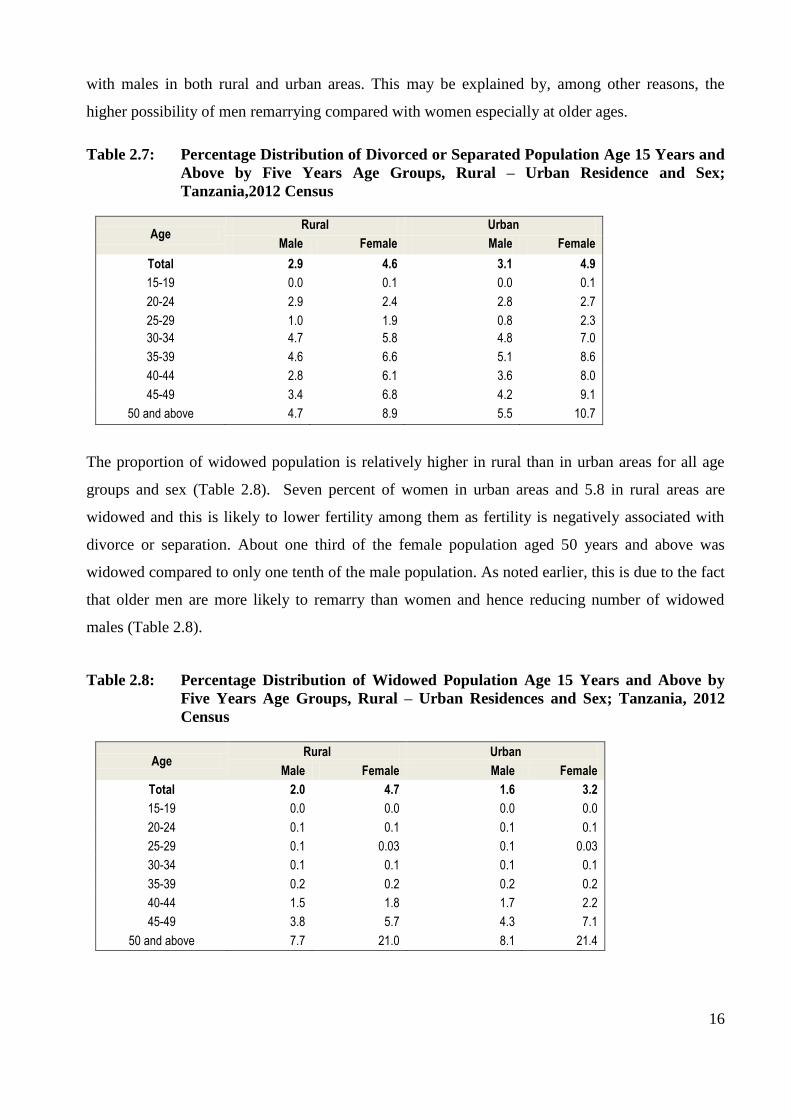
Persons living in urban areas are slightly more likely to be divorced than their counterparts in rural
areas. Table 2.7 shows that, for all age groups 15 years and above for both sexes, the proportion of
the divorced or separated population was higher in urban than rural areas. Furthermore, results
reveal that the percentage of the divorced or separated were relatively high for females as compared
16
with males in both rural and urban areas. This may be explained by, among other reasons, the
higher possibility of men remarrying compared with women especially at older ages.
Table 2.7: Percentage Distribution of Divorced or Separated Population Age 15 Years and
Above by Five Years Age Groups, Rural – Urban Residence and Sex;
Tanzania,2012 Census
Age Rural Urban
Male Female Male Female
Total 2.9 4.6 3.1 4.9
15-19 0.0 0.1 0.0 0.1
20-24 2.9 2.4 2.8 2.7
25-29 1.0 1.9 0.8 2.3
30-34 4.7 5.8 4.8 7.0
35-39 4.6 6.6 5.1 8.6
40-44 2.8 6.1 3.6 8.0
45-49 3.4 6.8 4.2 9.1
50 and above 4.7 8.9 5.5 10.7
The proportion of widowed population is relatively higher in rural than in urban areas for all age
groups and sex (Table 2.8). Seven percent of women in urban areas and 5.8 in rural areas are
widowed and this is likely to lower fertility among them as fertility is negatively associated with
divorce or separation. About one third of the female population aged 50 years and above was
widowed compared to only one tenth of the male population. As noted earlier, this is due to the fact
that older men are more likely to remarry than women and hence reducing number of widowed
males (Table 2.8).
Table 2.8: Percentage Distribution of Widowed Population Age 15 Years and Above by
Five Years Age Groups, Rural – Urban Residences and Sex; Tanzania, 2012
Census
Age Rural Urban
Male Female Male Female
Total 2.0 4.7 1.6 3.2
15-19 0.0 0.0 0.0 0.0
20-24 0.1 0.1 0.1 0.1
25-29 0.1 0.03 0.1 0.03
30-34 0.1 0.1 0.1 0.1
35-39 0.2 0.2 0.2 0.2
40-44 1.5 1.8 1.7 2.2
45-49 3.8 5.7 4.3 7.1
50 and above 7.7 21.0 8.1 21.4

17
Tables 2.9 to 2.12 compare the proportion of never-married, the proportion married, the proportion
divorced and the proportion widowed, by age and sex, for the 2012 census with the previous
censuses of 1978, 1988 and 2002.
Table 2.9 shows that there was an increase of the never married population for both sexes from
1978 to 2012. An increase was more pronounced for females than males this may be explained by
the marginal increased in Mean Age at Marriage for females. The percentage of females increased
from 15.5 percent in 1978 to 33 percent in 2012 compared with the increase from 33.2 to 38.2 for
males over the same period. The percentage of females aged 60 years and above who remained
unmarried increased from 1.7 percent to 15 percent, a reflection of rising age at marriage.
Table 2.9: Percentage Distribution of Never Married Population Age 15 Years and Above
by Five Years Age Groups; Tanzania, 1978-2012 Censuses
Age Male Female
1978 1988 2002 2012 1978 1988 2002 2012
Total 33.2 38.3 39.2 38.3 15.5 21.5 24.5 33.0
15-19 96.5 95.9 96.5 92.2 62.4 70.6 74.8 83.3
20-24 65.4 69.2 69.3 68.7 16.1 25.9 30.0 46.2
25-29 28.6 36.0 36.2 37.5 5.4 11.6 15.8 24.9
30-34 11.8 17.0 18.4 20.3 2.9 6.3 10.0 16.8
35-39 7.5 9.3 11.4 13.6 1.9 3.8 7.3 13.3
40-44 5.1 6.5 8.0 10.4 1.6 2.7 5.9 12.1
45-49 4.4 4.8 6.5 6.8 1.4 2.4 4.7 9.6
50-54 3.7 4.2 5.5 7.2 1.6 2.0 4.3 11.9
55-59 3.3 3.5 4.8 6.9 1.7 1.9 4.2 13.5
60 and above 2.2 3.1 4.3 6.5 1.7 2.4 5.2 15.0
The proportion of married population or in union decreased steadily for both sexes between 1978
and 2012 (Table 2.10). A decline in the proportion married was more pronounced among females
than males. The proportion of the female population that was married dropped from 69.5 percent in
1978 to 58.1 percent, while that for males dropped from 61.4 percent to 56.8 percent over the same
period. Such a decline may possibly be due to changing socio-economic conditions in the country.
However, there is need to investigate further as to why.
18
Table 2.10: Percentage Distribution of Married Population Age 15 Years and Above by
Five Years Age Groups and Sex; Tanzania, 1978-2012 Censuses
Male Female
1978 1988 2002 2012 1978 1988 2002 2012
Total 61.4 57.0 56.1 56.8 69.5 63.8 60.1 58.1
15-19 3.4 3.9 3.3 7.8 35.7 28.3 24.1 16.6
20-24 33.0 29.9 29.6 28.4 78.7 69.9 65.5 51.3
25-29 68.2 61.8 61.3 61.6 87.9 81.6 76.8 73.1
30-34 83.1 79.3 77.7 74.8 89.1 84.0 79.3 74.9
35-39 86.7 85.7 83.6 81.4 87.3 84.6 79.2 79.3
40-44 88.4 87.0 85.7 85.0 84.0 81.3 75.4 79.3
45-49 88.1 87.7 86.2 85.6 78.2 77.2 72.2 76.8
50-54 87.4 87.0 85.5 84.9 70.3 70.0 65.2 72.4
55-59 87.7 87.2 85.0 83.0 63.1 63.1 59.2 65.0
60 and above 86.6 81.9 79.7 77.5 40.8 41.0 35.5 45.3
Note: “Married” in this table includes living together.
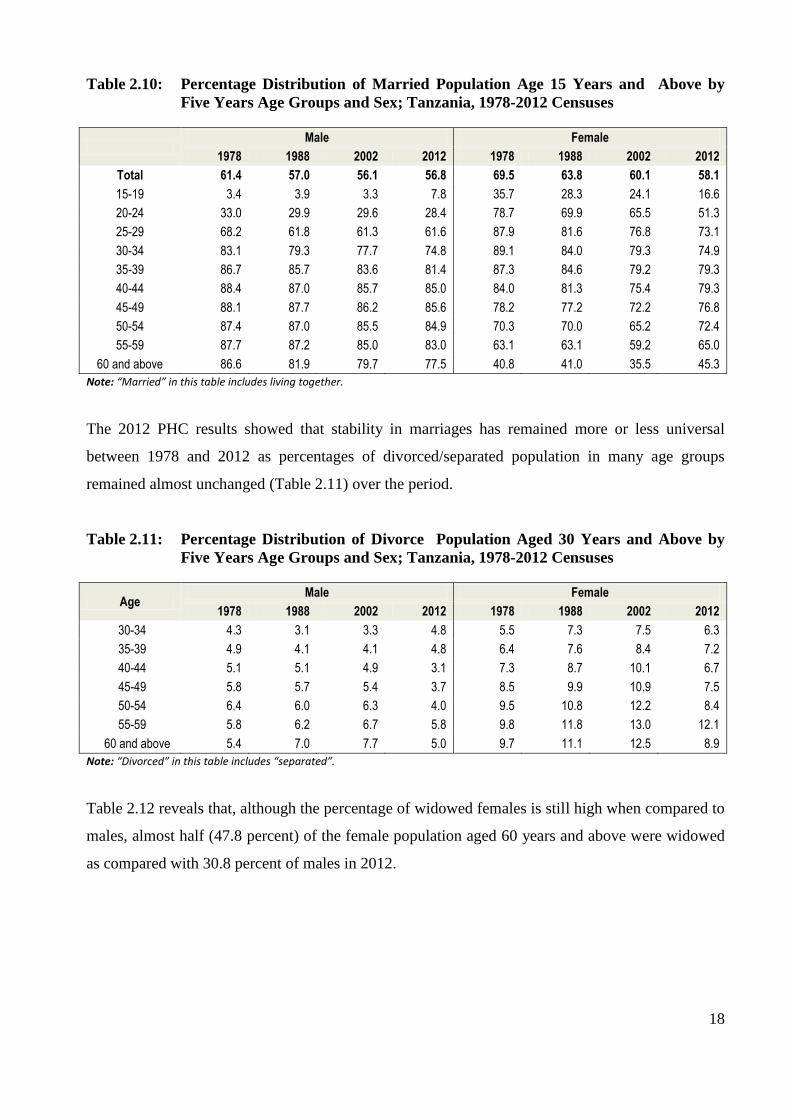
The 2012 PHC results showed that stability in marriages has remained more or less universal
between 1978 and 2012 as percentages of divorced/separated population in many age groups
remained almost unchanged (Table 2.11) over the period.
Table 2.11: Percentage Distribution of Divorce Population Aged 30 Years and Above by
Five Years Age Groups and Sex; Tanzania, 1978-2012 Censuses
Age Male Female
1978 1988 2002 2012 1978 1988 2002 2012
30-34 4.3 3.1 3.3 4.8 5.5 7.3 7.5 6.3
35-39 4.9 4.1 4.1 4.8 6.4 7.6 8.4 7.2
40-44 5.1 5.1 4.9 3.1 7.3 8.7 10.1 6.7
45-49 5.8 5.7 5.4 3.7 8.5 9.9 10.9 7.5
50-54 6.4 6.0 6.3 4.0 9.5 10.8 12.2 8.4
55-59 5.8 6.2 6.7 5.8 9.8 11.8 13.0 12.1
60 and above 5.4 7.0 7.7 5.0 9.7 11.1 12.5 8.9
Note: “Divorced” in this table includes “separated”.
Table 2.12 reveals that, although the percentage of widowed females is still high when compared to
males, almost half (47.8 percent) of the female population aged 60 years and above were widowed
as compared with 30.8 percent of males in 2012.

19
Table 2.12: Percentage Distribution of Widowed Population Aged 30 Years and Above by
Five Years Age Groups and Sex; Tanzania, 1978-2012 Censuses
Age Male Female
1978 1988 2002 2012 1978 1988 2002 2012
30-34 0.7 0.6 0.6 0.1 2.5 2.4 3.2 0.1
35-39 0.9 0.8 0.9 0.2 4.4 4.0 5.2 0.2
40-44 1.5 1.4 1.4 1.6 7.1 7.3 8.6 1.9
45-49 1.6 1.7 2.0 4.0 11.9 10.5 12.2 6.1
50-54 2.5 2.7 2.7 3.9 18.6 17.2 18.3 7.3
55-59 3.2 3.1 3.5 4.3 25.4 23.1 23.6 9.5
60 and above 5.8 8.0 8.3 11.0 47.8 45.4 46.7 30.8
2.2.3 Age-Specific Marriage Rates
Age -Specific Marriage Rates (ASMRs) are general marriage rates that consider age distribution of
the population. However, these rates do not take into consideration the fact that married couples
may not of the same age, which is one of the disadvantages of the method. For example, in
Tanzania and in fact in many countries husbands are often older than their wives.
Table 2.13 shows the Age-Specific Marriage Rate by Place of Residence for the 2012 Census.
Marriage rates increase with increasing age for both males and females. The table reveals that
marriage rates are low in younger age groups but reaches their peak in age group 40 – 49. Age
Specific Marriage Rate for males (ASMRm) rises slowly but shows a sharp increase in age 25 – 29
years which corresponds with average age at first marriage for male of 25.8 years. On the other
hand, ASMR for females (ASMRf) rises sharply in the age group 20 – 24 consistent with average
age at first marriage for females of 22.3 years. (ASMRm) for males reaches 705/1000 per thousand
population for those aged 60 years and above but that for women drops to 403/1000 for the same
age group. Similar patterns were also observed in rural and urban areas.
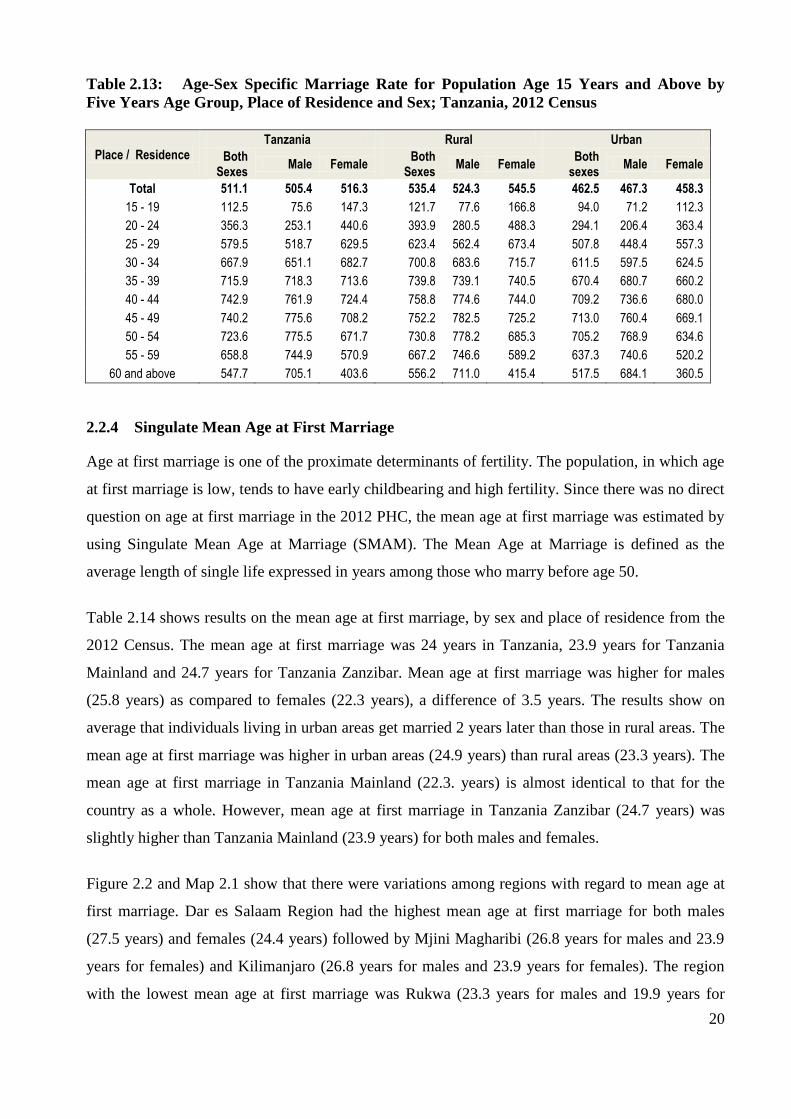
20
Table 2.13: Age-Sex Specific Marriage Rate for Population Age 15 Years and Above by
Five Years Age Group, Place of Residence and Sex; Tanzania, 2012 Census
Place / Residence Tanzania Rural Urban
Both Sexes
Male Female Both
Sexes Male Female
Both sexes
Male Female
Total 511.1 505.4 516.3 535.4 524.3 545.5 462.5 467.3 458.3
15 - 19 112.5 75.6 147.3 121.7 77.6 166.8 94.0 71.2 112.3
20 - 24 356.3 253.1 440.6 393.9 280.5 488.3 294.1 206.4 363.4
25 - 29 579.5 518.7 629.5 623.4 562.4 673.4 507.8 448.4 557.3
30 - 34 667.9 651.1 682.7 700.8 683.6 715.7 611.5 597.5 624.5
35 - 39 715.9 718.3 713.6 739.8 739.1 740.5 670.4 680.7 660.2
40 - 44 742.9 761.9 724.4 758.8 774.6 744.0 709.2 736.6 680.0
45 - 49 740.2 775.6 708.2 752.2 782.5 725.2 713.0 760.4 669.1
50 - 54 723.6 775.5 671.7 730.8 778.2 685.3 705.2 768.9 634.6
55 - 59 658.8 744.9 570.9 667.2 746.6 589.2 637.3 740.6 520.2
60 and above 547.7 705.1 403.6 556.2 711.0 415.4 517.5 684.1 360.5
2.2.4 Singulate Mean Age at First Marriage
Age at first marriage is one of the proximate determinants of fertility. The population, in which age
at first marriage is low, tends to have early childbearing and high fertility. Since there was no direct
question on age at first marriage in the 2012 PHC, the mean age at first marriage was estimated by
using Singulate Mean Age at Marriage (SMAM). The Mean Age at Marriage is defined as the
average length of single life expressed in years among those who marry before age 50.
Table 2.14 shows results on the mean age at first marriage, by sex and place of residence from the
2012 Census. The mean age at first marriage was 24 years in Tanzania, 23.9 years for Tanzania
Mainland and 24.7 years for Tanzania Zanzibar. Mean age at first marriage was higher for males
(25.8 years) as compared to females (22.3 years), a difference of 3.5 years. The results show on
average that individuals living in urban areas get married 2 years later than those in rural areas. The
mean age at first marriage was higher in urban areas (24.9 years) than rural areas (23.3 years). The
mean age at first marriage in Tanzania Mainland (22.3. years) is almost identical to that for the
country as a whole. However, mean age at first marriage in Tanzania Zanzibar (24.7 years) was
slightly higher than Tanzania Mainland (23.9 years) for both males and females.
Figure 2.2 and Map 2.1 show that there were variations among regions with regard to mean age at
first marriage. Dar es Salaam Region had the highest mean age at first marriage for both males
(27.5 years) and females (24.4 years) followed by Mjini Magharibi (26.8 years for males and 23.9
years for females) and Kilimanjaro (26.8 years for males and 23.9 years for females). The region
with the lowest mean age at first marriage was Rukwa (23.3 years for males and 19.9 years for

21
females). Generally, regions with high mean age at first marriage had low fertility rates as
compared to those with low mean age at marriage (Refer to Chapter 3 and 4 of this Publication).
Figure 2.1: Mean Age at First Marriage in Years by Place of Residence and Sex; Tanzania,
2012 Census

22
Map 2.1: Mean Age at First Marriage in Years by Place of Residence and Sex; Tanzania,
2012 Census
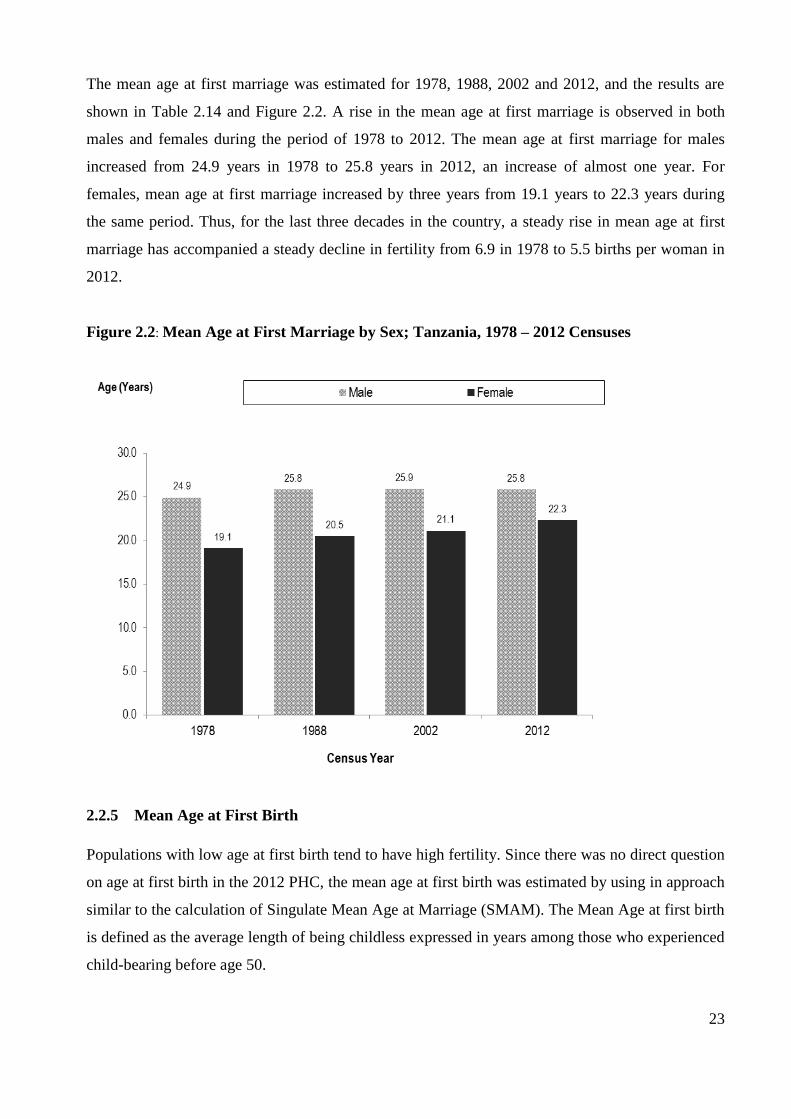
23
The mean age at first marriage was estimated for 1978, 1988, 2002 and 2012, and the results are
shown in Table 2.14 and Figure 2.2. A rise in the mean age at first marriage is observed in both
males and females during the period of 1978 to 2012. The mean age at first marriage for males
increased from 24.9 years in 1978 to 25.8 years in 2012, an increase of almost one year. For
females, mean age at first marriage increased by three years from 19.1 years to 22.3 years during
the same period. Thus, for the last three decades in the country, a steady rise in mean age at first
marriage has accompanied a steady decline in fertility from 6.9 in 1978 to 5.5 births per woman in
2012.
Figure 2.2: Mean Age at First Marriage by Sex; Tanzania, 1978 – 2012 Censuses
2.2.5 Mean Age at First Birth
Populations with low age at first birth tend to have high fertility. Since there was no direct question
on age at first birth in the 2012 PHC, the mean age at first birth was estimated by using in approach
similar to the calculation of Singulate Mean Age at Marriage (SMAM). The Mean Age at first birth
is defined as the average length of being childless expressed in years among those who experienced
child-bearing before age 50.
24
Table 2.14 shows the mean age at first birth by place of residence in the 2012 Census. The mean
age at first birth was 20.2 years for Tanzania, 20.1 years for Tanzania Mainland and 22.9 years for
Tanzania Zanzibar. The results further reveal that females in urban areas delay their first births by
almost three years as compared to those in rural areas. On average, women in urban areas stay in
school longer and are more informed on family planning services, which may explain the
difference of the two groups. Likewise, mean age at first marriage was higher in Tanzania Zanzibar
(23.3 years) than Tanzania Mainland (22.3 years). Education system in Tanzania Zanzibar, which is
compulsory up to Form Two, allows young women to stay in school longer and in so doing
delaying childbearing. For Tanzania Mainland, education is compulsory up to standard seven, and
therefore a good number of girls who do not continue with secondary education start childbearing
at an early age.
Comparison of mean age at first marriage and mean age at first birth indicate that many females
give birth before getting married. On average, females were married 2 years later than first birth.
(Table 2.14). However, the difference between mean age at first marriage and average age at first
birth was less than one year for Tanzania Zanzibar.
Only in Arusha District Council on Tanzania Mainland was average age at first birth lower than
average age at first marriage. However, in 4 Districts out of 10 in Tanzania Zanzibar, average age
at marriage was lower than average age at first birth. (Average Age at First Marriage and First Birth
at Regional and District Level is attached as Appendix VII).

25
Table 2.14: Average Age at First Marriage by Sex and Average Age at First Birth by Place
of Residence; Tanzania, 2012 Census
Region Average Age at First Marriage Average Age
at First Birth for Mothers Both Sexes Male Female
Tanzania 24.0 25.8 22.3 20.2
Rural 23.3 25.2 21.6 19.3
Urban 25.0 26.7 23.4 21.7
Tanzania Mainland 23.9 25.7 22.3 20.1
Rural 23.3 25.2 21.6 19.3
Urban 24.9 26.7 23.3 21.6
Dodoma 22.9 24.8 21.1 19.9
Arusha 24.3 26.4 22.4 22.0
Kilimanjaro 25.2 26.8 23.9 22.0
Tanga 24.0 26.0 22.3 20.6
Morogoro 23.6 25.5 21.8 19.7
Pwani 24.1 26.0 22.5 20.1
Dar es Salaam 26.0 27.5 24.4 23.1
Lindi 23.2 25.1 21.7 19.5
Mtwara 22.8 24.2 21.5 19.3
Ruvuma 22.9 24.5 21.3 19.4
Iringa 23.9 25.7 22.4 21.3
Mbeya 22.7 24.6 21.1 20.1
Singida 23.7 25.8 21.7 19.6
Tabora 23.8 25.7 22.1 19.0
Rukwa 21.5 23.3 19.9 18.9
Kigoma 23.8 25.2 22.6 20.2
Shinyanga 24.2 26.0 22.4 19.5
Kagera 22.6 24.4 21.0 20.3
Mwanza 24.4 26.1 22.8 20.1
Mara 23.4 25.6 21.4 19.0
Manyara 23.8 25.8 21.9 20.9
Njombe 23.5 25.2 22.1 21.5
Katavi 22.7 24.7 20.9 18.4
Simiyu 25.0 26.9 23.3 19.4
Geita 23.2 25.1 21.5 18.9
Tanzania Zanzibar 24.7 26.3 23.3 22.9
Rural 23.8 25.5 22.3 21.9
Urban 25.5 27.0 24.2 23.9
Kaskazini Unguja 24.6 26.0 23.3 22.9
Kusini Unguja 23.8 25.7 22.0 21.9
Mjini Magharibi 25.3 26.8 23.9 23.7
Kaskazini Pemba 23.7 25.4 22.3 21.8
Kusini Pemba 23.9 25.5 22.5 22.7
26
Chapter Three
Fertility Levels, Trends and Patterns
3.1 Introduction
Fertility is perhaps the most important of the components of population change, so it remains a
subject of active research. Fertility rates have, in some countries, tracked fairly closely general
measures of economic conditions such as unemployment rate. The link between social economic
development and population change calls for analysis of fertility estimates and their relationship to
socio-economic development. This analysis will furnish policy makers and planners with
information for effective policies and practical interventions.
Estimation of fertility levels for Tanzania and its regions from the 2012 census is based on reported
live births by age of mother in the 12 months preceding the census and reported number of children
ever born by age of mother. However, given the limitations of the 2012 census data explained in
chapter one of this document, several indirect methods were used to estimate adjusted fertility
indicators to evaluate the direct estimates of age-specific and total fertility rates based on births in
the year preceding the census. Finally, a decision about the most plausible level of fertility in
Tanzania and its regions in 2012 has been informed by review of estimated fertility levels and
trends based on the 1988 and 2002 censuses; nationally representative Demographic and Health
Surveys undertaken in 1991, 1996, 1999, 2004 and 2010 (TDHS); and the 2007-08 Tanzania
HIV/AIDS and Malaria Indicator Surveys (THMIS) (Details of different estimation methods is
attached as Annex I).
3.2. Determination of a Most Likely Estimate of Fertility for 2012
Table 3.1 presents age-specific and total fertility rates from the 2002 and 2012 censuses either
directly estimated from reported births during the 12 months preceding the census or as indirectly
estimated using each of the methods discussed. The range of TFR estimates for 2012 is 4.9 births
per woman (reported) to 6.4 births per woman (P/F ratio technique). The reported TFR level of 4.9
is likely to be too low, reflecting a history of underreporting of births in Tanzanian censuses, but
some additional information may be useful in making a choice of most likely TFR level for 2012.

27
Table 3.1: Summary of Results of Methods Used to Determine a Most Likely Total Fertility
Rate from the 2012 Census; Tanzania, 2012 Census
Age Reported Brass P/F Ratio
Relational Gompertz
Arriaga* Synthetic P/F ratio
Own-children
2002 2012 2002 2012 2012 2002 2012 2002-12 2006-10
15-19 0.065 0.0721 0.1234 0.1126 5.884 0.1131 0.095 0.0954 0.128
20-24 0.186 0.203 0.3029 0.2754 5.859 0.2898 0.237 0.2706 0.235
25-29 0.190 0.221 0.2979 0.2887 5.897 0.2866 0.249 0.2871 0.235
30-34 0.167 0.1988 0.2581 0.2553 5.912 0.2481 0.221 0.2555 0.201
35-39 0.127 0.1568 0.1935 0.1986 5.912 0.1848 0.171 0.1983 0.146
40-44 0.068 0.0886 0.0988 0.1063 5.868 0.0957 0.093 0.1090 0.076
45-49 0.029 0.0417 0.0372 0.0463 5.970 0.0339 0.039 0.0482 0.035
TFR 4.2 4.9 6.6 6.4 5.9 6.3 5.5 6.3 5.3
‘* Estimates shown for 2002 are based on the 1988 and 2002 censuses; for 2012, on the 2002 and 2012 censuses
Figure 3.1 shows these estimates of TFR along with estimates from the 1988 census, and 5-year
average TFRs from five Demographic and Health Surveys (DHS). The Arriaga technique estimates
from the 1988, 2002 and 2012 censuses show a slowly declining trend in total fertility of 6 births
per woman in 2012. The Brass P/F ratio estimates, Relational Gompertz, and synthetic P/F ratio
estimates suggest similarly high TFRs, at or close to 6 births per woman.
Figure 3.1:Total Fertility Rate Estimates from Censuses and Surveys Data; Tanzania, 2012
Census
4.5
5.0
5.5
6.0
6.5
7.0
7.5
1980 1985 1990 1995 2000 2005 2010 2015
DHS 1991-92 DHS 1996 DHS 1999
DHS 2004 2002 PHC indirect DHS 2010
Synthetic P/F ratio 2002-12 2012 PHC direct 2012 PHC BrassP/F
2012 PHC Arriaga RelGompertz 1988 PHC indirect
Note
The largest circles on this chart are the averages of the TDHS direct estimates for periods of 0-4 and 5-9
years preceding the survey

28
These estimates all may be on the high side because of the historically higher fertility reflected in
the children ever born used to adjust fertility patterns in these methods. In contrast, the DHS direct
estimates, based on pregnancy history data, suggest a slowly declining TFR trend but at a lower
level. Specifically, averages of the two DHS estimates for periods 0-4 and 5-9 years prior to each
survey are circled to draw attention to the fact that DHS surveys in Tanzania consistently exhibit
more rapidly declining TFRs for each survey than does the data for the surveys taken collectively.
The average TFR estimates for periods 0-4 and 5-9 years prior to each survey from the five DHS
surveys indicate a relatively slow decline in TFR over time, a trend implying a value of about 5.5
births per woman for 2012.
The own-children technique, derived from a cross-tabulation of mothers and children by age from
the 2012 CPH, suggests a TFR of roughly 5.3 births per woman for the 5-year period preceding the
census. Taken together, estimates from the 2012 PHC suggest a possible range of total fertility of
4.9 to 6.4 births per woman for 2012, centered on a value of around 5.6 births per woman. The
DHS survey trendline and own-children estimate for the period preceding the 2012 census strongly
suggests that a TFR estimate of about 5.5 births per woman may be the most likely case, and this is
the level accepted for the 2012 Population and Housing Census. Fertility indicators presented in
the following section are based on this assessment of national fertility levels and trend up to 2012.

29
3.3 Fertility Measures, Levels and Trends
3.3.1 Measures of Fertility
Information on Children Ever Born (CEB) and births in the last 12 months was collected from all
women aged 12 to 49 years, however most of the analysis in this publication is based on women
aged 15 – 49 years. Key measures of fertility presented in this Chapter are Age Specific Fertility
Rates, Total Fertility Rates and Crude Birth Rates and Gross Reproduction Rates. Others are
General Fertility Rate, Net Fertility Rate, Adolescent and Lifetime fertility.
3.3.2 Total Fertility Rate
Table 3.2 shows reported and adjusted TFR for Tanzania, Tanzania Mainland, Tanzania Zanzibar
and Regions. The results show the TFR of 5.5 for Tanzania and Tanzania Mainland and 5.2
for Tanzania Zanzibar.
Map 3.1 and Table 3.2 reveal wide variations of TFRs among regions, ranging from 8.5 for Geita to
3.6 for Dar es Salaam. Generally, fertility levels are higher in regions around Lake Victoria,
Western part and Pemba when compared with other parts of the country.

30
Table 3.2: Reported and Estimated Total Fertility Rates; 2012 Census; Tanzania, 2012
Census
Region Total Fertility Rate
Reported Adjusted
Tanzania 4.9 5.5
Tanzania Mainland 4.9 5.5
Dodoma 5.0 5.9
Arusha 5.3 4.3
Kilimanjaro 3.6 4.3
Tanga 4.7 5.7
Morogoro 4.2 4.9
Pwani 4.3 4.7
Dar es Salaam 2.9 3.6
Lindi 4.0 4.6
Mtwara 4.0 4.1
Ruvuma 4.7 4.9
Iringa 4.2 4.6
Mbeya 4.2 5.1
Singida 6.2 7.4
Tabora 6.2 7.0
Rukwa 7.1 7.3
Kigoma 6.4 7.3
Shinyanga 5.5 6.1
Kagera 6.0 6.4
Mwanza 5.8 6.7
Mara 6.3 7.0
Manyara 5.5 6.3
Njombe 3.7 4.2
Katavi 7.3 7.4
Simiyu 6.3 7.9
Geita 6.9 8.5
Tanzania Zanzibar 4.7 5.2
Kaskazini Unguja 4.8 5.5
Kusini Unguja 4.9 4.8
Mjini Magharibi 3.8 4.3
Kaskazini Pemba 6.1 7.3
Kusini Pemba 6.5 7.4

31
Map 3. 1: Adjusted Total Fertility Rates by Region; Tanzania, 2012 Census

32
3.3.3 Crude Birth Rate
Crude Birth Rate (CBR) is a measure of fertility equal to the ratio of births occurring in a year to
women aged 15-49 years relative to total population. Overall, Tanzanian women gave an estimated
1,871,040 births during the last 12 months prior to the census. As expected, there are fewer
reported births for age groups 15-19 and 45-49 in the last 12 months preceding the census
compared to age groups 20-24, 25-29 and 30-34, as shown in Figure 3.2. Most of the births
occurred among women aged 20-29.
Figure 3.2: Total Number of Births in the Last 12 Months Preceding the Census by Age
Group; Tanzania, 2012 Census
This crude measure is influenced by age structure since it includes in its denominator the old,
children and males, none of whom are at risk of giving birth. Thus, it can sometimes mislead if
used for comparing different population or the same population at widely different times. With this
limitation notwithstanding, CBR remains a good general indicator showing the changes in the total
population in respect of births that have taken place over a 12 months period prior to the census.
Crude Birth Rate is also widely used since it is easily estimated with minimum data requirements.
In 2012, the crude birth rate in Tanzania was about 42 per 1,000 population, the same as for
Tanzania Mainland while for Tanzania Zanzibar, CBR was about 39 births per 1,000 population.
Different parts of the country registered varied crude birth rates, as shown in Table 3.3. The
differences may be due to different socio-economic conditions existing in different regions. Geita
registered the highest crude birth rate of 56 births per 1,000, followed by Rukwa and Simiyu (CBR
of 52 births per 1,000 population) which is consistent with high TFRs in these regions. On the other

33
hand, the region with the lowest crude birth rate was Kilimanjaro with 30 births per 1,000
population.
Table 3.3: Estimated Crude Birth Rates, General Fertility Rates, Gross Reproduction
Rates and Net Reproduction Rates; Tanzania, 2012 Census
Region CBR General Fertility Rate Gross Reproduction Rate Net Reproduction Rate
Tanzania 42 171.6 2.8 2.4
Tanzania Mainland 42 172.1 2.8 2.4
Dodoma 42 184.2 3.0 2.7
Arusha 35 133.7 2.2 2.1
Kilimanjaro 30 124.3 2.2 2.0
Tanga 41 170.9 2.9 2.5
Morogoro 38 154.4 2.5 2.2
Pwani 36 147.0 2.4 2.0
Dar es Salaam 37 115.5 1.8 1.5
Lindi 35 139.4 2.4 2.1
Mtwara 32 128.3 2.1 1.9
Ruvuma 37 150.8 2.4 2.1
Iringa 35 144.2 2.4 1.9
Mbeya 40 160.2 2.6 2.2
Singida 48 217.9 3.7 3.4
Tabora 50 222.2 3.6 3.1
Rukwa 52 233.5 3.7 3.1
Kigoma 48 217.4 3.7 3.2
Shinyanga 44 191.9 3.1 2.6
Kagera 44 198.8 3.2 2.7
Mwanza 48 202.8 3.4 3.0
Mara 49 220.1 3.6 3.1
Manyara 42 189.9 3.1 2.8
Njombe 33 133.2 2.2 1.8
Katavi 51 232.0 3.8 3.2
Simiyu 52 237.0 4.0 3.5
Geita 57 255.8 4.3 3.7
Tanzania Zanzibar 39 149.3 2.6 2.3
Kaskazini Unguja 39 154.6 2.8 2.6
Kusini Unguja 38 147.1 2.3 2.0
Mjini Magharibi 36 127.2 2.1 1.9
Kaskazini Pemba 46 198.6 3.7 3.3
Kusini Pemba 48 207.7 3.7 3.3

34
3.3.4 General Fertility Rate
General Fertility Rate (GFR) is defined as number of births per 1,000 women of reproductive age.
GFR is, therefore a birth rate because it expresses the births relative to the number of women of
reproductive age. The main advantage of GFR over CBR is that it controls for age and sex structure
by relating the births to roughly the women at risk of having them. Although the GFR represents a
refinement over the CBR, it also has its limitation. The limitation arises from the fact that the
frequency of births varies by age of women within the span of reproductive ages. The GFR
indicates, in part, the extent to which the level of births in a country is attributable to the age
composition of its population. General Fertility Rate for Tanzania was 171.6 births per 1,000
women of reproductive age (Table 3.4). GFR ranges from 256/1000 women in Geita to 115 births
per thousand women in Dar es Salaam.
3.3.5 Gross Reproduction Rate
The association between fertility and economic development has contributed to population policies
aimed at fertility reduction. However, it is important that a population ensures that fertility does not
decline below the replacement level. Three indicators are used to capture the likelihood of the
population to be replaced. These are Total Fertility Rate (TFR), Gross Reproduction Rate (GRR)
and Net Reproduction Rate (NRR). For a population to be replaced, TFR should be greater or equal
to 2.1 children per woman and GRR and NRR should be greater than or equal to one (1) to ensure
that each female is replaced by a daughter. The GRR is a measure analogous to the total fertility
rate, but it refers only to female births. Therefore, it is derived in the same manner as the TFR1 but
uses a set of age-specific fertility rates calculated based on female births only. It can also be derived
by multiplying the TFR by the proportion of all births that are female. The GRR is interpreted as
the average number of daughters that would replace each woman in the absence of female mortality
from birth through the childbearing years, based on a set of age specific fertility rates. This index
assumes that none of the girls die before they reach the age of their mothers in the reproductive
years.
Analysis of the 2012 Census data indicates a GRR of 2.8 which implies that, on average, a woman
in Tanzania would have about three daughters during her childbearing age. On the other hand,
NRR for Tanzania is 2.4 which is more above replacement level of one girl child per woman.
1 The TFR is derived by the sum of 5 year average age-specific fertility rates, and multiply their sum by five or it is the sum of ASFRs for all women
15-49 years

35
3.4 Fertility Trends
3.4.1 Total Fertility Rate
Tanzania has been undertaking Demographic Health Surveys (DHS) and censuses regularly,l which
have endowed the country with a wealth of data to examine fertility trends. Data from all the past
censuses and surveys indicate a downward trend of fertility in the country. This is evidenced in
Figure 3.3 and Table 3.4 which shows the Total Fertility Rate decline from a high of 6.9 children
per woman in 1978 to 6.5 in 1988, and dropping to 6.3 in 2002 and to 5.5 in 2012.
Although fertility level is still high when compared to developed countries, Tanzania has
experienced a reduction of 1.4 children per woman from 1978 to 2012. Several correlates are
consistent with the observed trend, notably increased modern contraceptive prevalence rate from
18.4 percent in 1996 to 26 percent in 2004 and 34 percent in 2010 (TDHS, 2010). Decline in
fertility is also associated with increased levels of education among women in the country, increase
in mean age at first marriage and urbanisation.
Figure 3.3: Total Fertility Rates for Tanzania, Tanzania Mainland and Tanzania
Zanzibar; 1967 – 2012 Censuses

36
Table 3.4: Estimated Total Fertility Rate by Region, Tanzania; 1967-2012 Censuses
Region 1967 1978 1988 2002 2012
Tanzania 6.6 6.9 6.5 6.3 5.5
Tanzania Mainland 6.6 6.9 6.5 6.3 5.5
Dodoma 6.9 7.4 6.7 6.8 5.9
Arusha 7.1 6.9 6.6 5.0 4.3
Kilimanjaro 7.9 7.6 7.1 5.2 4.3
Tanga 6.9 7.1 6.4 6.1 5.7
Morogoro 6.0 6.3 6.3 5.9 4.9
Pwani 4.9 5.3 5.0 5.3 4.7
Dar es Salaam 4.3 5.7 4.6 3.8 3.6
Lindi - 5.9 5.7 5.2 4.6
Mtwara 5.0 6.2 5.7 5.0 4.1
Ruvuma 6.7 6.4 6.6 5.8 4.9
Iringa 8.4 7.3 6.7 5.7 4.6
Mbeya 7.6 7.4 6.5 5.9 5.1
Singida 6.1 6.9 6.1 6.8 7.4
Tabora 5.5 6.2 6.4 7.7 7.0
Rukwa - 8.7 7.5 7.6 7.3
Kigoma 5.9 7.1 6.9 7.9 7.3
Shinyanga 7.5 7.1 7.2 8.1 6.1
Kagera 7.1 7.6 7.2 7.9 6.4
Mwanza 6.9 7.4 7.0 7.2 6.7
Mara 7.1 7.4 7.6 6.9 7.0
Manyara N/A N/A N/A 7.2 6.3
Njombe N/A N/A N/A N/A 4.2
Katavi N/A N/A N/A N/A 7.4
Simiyu N/A N/A N/A N/A 7.9
Geita N/A N/A N/A N/A 8.5
Tanzania Zanzibar 6.5 7.0 6.9 6.2 5.2
Kaskazini Unguja N/A 7.0 6.8 7.3 5.5
Kusini Unguja N/A 6.6 6.9 5.7 4.8
Mjini Magharibi N/A 6.2 6.4 5.1 4.3
Kaskazini Pemba N/A 7.8 7.4 7.4 7.3
Kusini Pemba N/A 7.5 7.3 8.1 7.4
Note
i. N/A – Not Applicable
ii. Manyara, Njombe, Katavi, Simiyu, Geita, Kaskazini Unguja, Kusini Unguja, Mjini Magharibi, Kaskazini
Pemba and Kusini Pemba regions did not exist during the corresponding Censuses. Njombe, Katavi, Simiyu
and Geita are new regions; where Njombe was formed from Iringa, Katavi was formed from Rukwa, Simiyu
was formed from Shinyanga and Mwanza and Geita was formed from Mwanza, Kagera and Shinyanga

37
3.4.2 Adjusted Crude Birth Rate
Table 3.5 presents adjusted Crude Birth Rate at National and Regional level from 1988 to 2012.
The results show declining CBR from 47 births per 1000 in 1988 to 42 in 2012 which is consistent
with declining fertility in the country. The decline was more pronounced in Tanzania Zanzibar (49
to 39 per 1000 births) than Tanzania Mainland (47 to 42 per 1000 birth).
Table 3.5: Crude Birth Rate Trend, Tanzania, Tanzania Mainland and Tanzania
Zanzibar; 1988-2012 Censuses
Region 1988 2002 2012
Tanzania 47 43 41.7
Tanzania Mainland 47 43 41.7
Dodoma 48 44 41.7
Arusha 46 43 35.2
Kilimanjaro 47 36 29.8
Tanga 46 40 41.3
Morogoro 45 41 37.6
Pwani 33 38 35.7
Dar es Salaam 38 35 36.7
Lindi 42 37 34.9
Mtwara 44 36 32.1
Ruvuma 46 41 36.8
Iringa 49 40 35.3
Mbeya 51 42 40.5
Singida 46 43 48.0
Tabora 45 48 49.6
Rukwa 52 52 52.0
Kigoma 47 56 48.4
Shinyanga 51 49 44.1
Kagera 49 48 44.2
Mwanza 50 46 48.2
Mara 53 47 49.0
Manyara N/A 46 41.6
Njombe N/A N/A 33.4
Katavi N/A N/A 51.1
Simiyu N/A N/A 52.2
Geita N/A N/A 56.9
Tanzania Zanzibar 49 43 38.9
Kaskazini Unguja 44 43 38.8
Kusini Unguja 46 38 38.4
Mjini Magharibi 51 42 36.0
Kaskazini Pemba 52 46 46.3
Kusini Pemba 51 45 48.4
Note:
i. N/A - Not Applicable
ii. Njombe, Katavi, Simiyu and Geita are new regions; where Njombe was formed from Iringa, Katavi was
formed from Rukwa, Simiyu was formed from Shinyanga and Mwanza and Geita was formed from Mwanza,
Kagera and Shinyanga

38
3.5 Fertility Patterns
3.5.1 Age-Specific Fertility Rates
The frequency of childbearing varies considerably from one group to another within the
reproductive age range. This variation is reflected in the calculated age-specific fertility rates
(ASFRs). Age-Specific Fertility Rate is a valuable measure of the current childbearing performance
of women, as it is not directly influenced by age or sex composition of the whole population. Table
3.6 shows a fairly standard pattern among women in all age groups. Rates start from low levels at
very young ages (15-19), rising to a peak in the mid - twenties, then declining gradually to forties.
Table 3.6: Recorded and Adjusted Age Specific Rate; Tanzania, 2012 Census
Age Age Specific Fertility Rates (ASFR)
Reported Adjusted
15-19 0.072 0.095
20-24 0.203 0.237
25-29 0.221 0.249
30-34 0.199 0.221
35-39 0.157 0.171
40-44 0.089 0.093
45-49 0.042 0.039
Total Fertility Rate (TFR) 4.9 5.5
Results from the three Censuses, portrays the same patterns of fertility, i.e. slow start at younger
ages of 15 – 19, an early peak in mid – twenties and gradually falling in older age group of 45 – 49
years (Figure 3.3). However the ASFR for women aged 45-49 from the 2012 census is relatively
higher than that of 1988 and 2002, indicating that more women are giving birth at older ages
compared to 20 years ago. This observation calls for interventions, as complications of childbearing
are higher for this group than for the middle age groups. At the same time, the ASFR of 15-19 has
shown a declining trend, implying a decrease in adolescent fertility as result of young females
spending more years in school than two decades ago. The age-specific fertility rate of a population
varies from time to time depending on marriage patterns and family planning practices, among
other factors.

39
Figure 3. 4: Age-Specific Fertility Rates for Tanzania; 1988-2012 Census

40
Chapter Four
Fertility Differentials
4.1 Introduction
Differential fertility refers to the study of fertility differences between specific population groups.
The common analyses are by socio-economic group, by religion, by education level, by race, by
occupation, by residence (urban/rural region), by wife’s work experience and by husband’s income
(Karki, 2012). Further, Karki state that three main sources contribute to differences in fertility of
specific population groups. These are the differences in the number of children which couples in
the various population groups desire to have, difference in their knowledge, attitude and practice of
fertility control which enables them to obtain such desires, and difference caused by the
demographic characteristics of each population group. From the 2012 PHC, differentials to be
studied here are age, marital status, education level, occupation and residence.
4.2 Fertility by Age
Age is, to say the least, one of the most important variables in the study of fertility. Figure 4.1
illustrates that the age-specific fertility rates increase with age of mother until around age 25-29
when the levels start to decrease with age. Results further illustrates that Urban ASFR are below
the national average and Rural ASFR for all age groups.
Figure 4.1: ASFR by Residence; Tanzania, 2012 Census

41
Table 4.1 shows Urban Age-Specific Fertility Rate as a proportion of total ASFR. Results show
that most births occur in rural as compared to urban areas for all age groups. The ratio of urban to
total ASFR ranges from 0.33 percent for age group 15 – 19 to 0.41 percent for those aged 25 – 34.
Table 4.1: Urban Age Specific Fertility as a Proportion of Total ASFR; Tanzania, 2012
Census
Age Group ASFR Urban ASFR Rural RuralASFR
UrbanASFR
15-19 0.059 0.119 0.33
20-24 0.177 0.283 0.38
25-29 0.200 0.289 0.41
30-34 0.176 0.253 0.41
35-39 0.125 0.199 0.39
40-44 0.062 0.108 0.36
45-49 0.028 0.045 0.39
4.3 Fertility by Marital Status
In Tanzania, just like in many other countries in sub Saharan Africa, marriage is a strong
determinant of fertility, because traditionally women are expected to bear children once married.
Figure 4.4 shows that women who were in union (married and living together) had higher fertility
rate above the national average of 5.5 births per woman. Total Fertility Rate among married women
was 6.8. The lowest TFR was recorded among the never married and widowed, both at 3.0 births
per woman.

42
Figure 4.2: Fertility Differentials by Marital Status; Tanzania, 2012 Census
4.4 Fertility by Education Level
Education level is one of the important factors that affect fertility levels in a society. The effects of
education on fertility can be divided into three parts; those that act on the demand for children,
those that affect the supply of children and those that influence the costs of fertility regulation.
Education facilitates the acquisition of information concerning family planning and in particular it
is associated with the use of more effective contraceptive methods. Education increases husband-
wife communication and it imparts a sense of control over one’s destiny, which may encourage
attempts to control childbearing. Furthermore, education increases couples’ income potential,
making a wide range of contraceptive methods affordable and delays entry into marital unions
(See also Kpedkepo, 1982) and in so doing reducing fertility.
Results from Tanzania 2012 PHC further prove that fertility is negatively associated with the
educational attainment of the mother. Figure 4.5 show that Total Fertility Rate (TFR) decreases as
education level of the mother increases. Total Fertility Rate decreases from 7.0 for women with no
education or who have attended pre-primary education only to 3.2 for women with tertiary
education (university or related). This suggests that the national TFR of 5.5 children per woman is
mainly influenced by women who had never attended school or with pre-primary education alone.
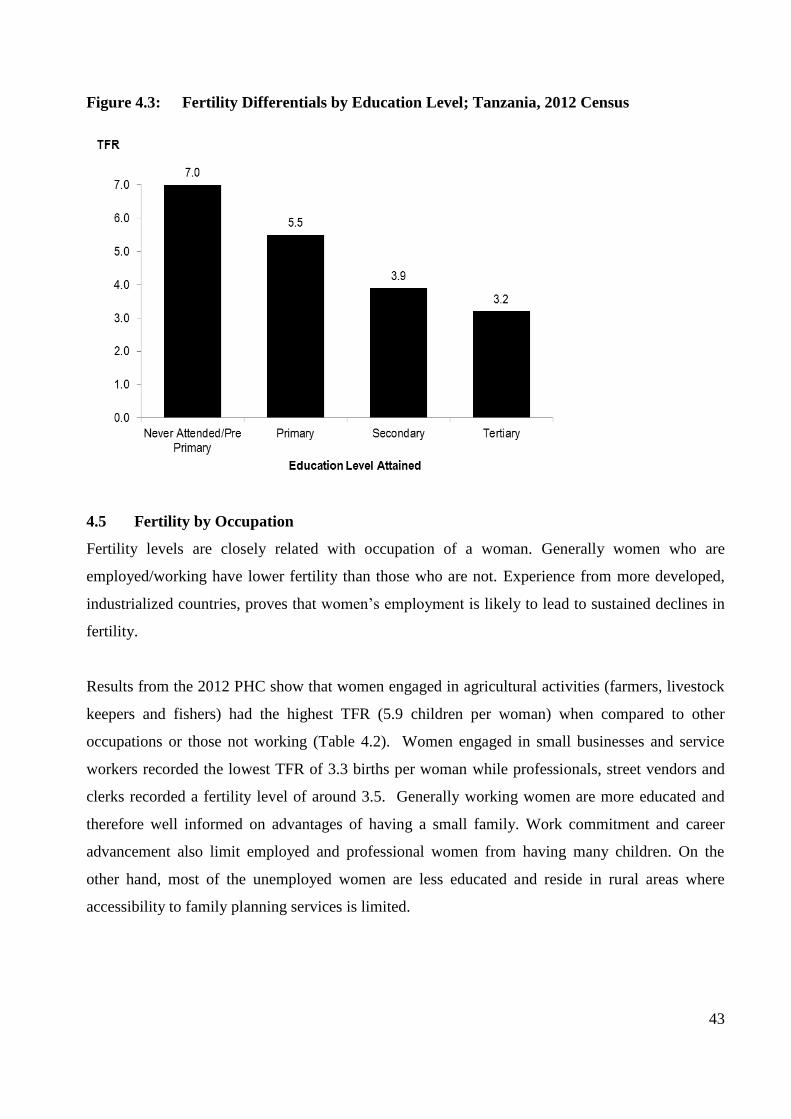
43
Figure 4.3: Fertility Differentials by Education Level; Tanzania, 2012 Census
4.5 Fertility by Occupation
Fertility levels are closely related with occupation of a woman. Generally women who are
employed/working have lower fertility than those who are not. Experience from more developed,
industrialized countries, proves that women’s employment is likely to lead to sustained declines in
fertility.
Results from the 2012 PHC show that women engaged in agricultural activities (farmers, livestock
keepers and fishers) had the highest TFR (5.9 children per woman) when compared to other
occupations or those not working (Table 4.2). Women engaged in small businesses and service
workers recorded the lowest TFR of 3.3 births per woman while professionals, street vendors and
clerks recorded a fertility level of around 3.5. Generally working women are more educated and
therefore well informed on advantages of having a small family. Work commitment and career
advancement also limit employed and professional women from having many children. On the
other hand, most of the unemployed women are less educated and reside in rural areas where
accessibility to family planning services is limited.

44
Table 4.2: Recorded Total Fertility Rates by Occupation of Woman; Tanzania, 2012
Census
Occupation of Woman Total Fertility Rate
Professionals and Managers 3.6
Technicians 4.1
Small Business and Service 3.3
Agriculture 5.9
Street Vendors 3.5
Clerks 3.5
Not working 4.6
4.6 Fertility by Region and Residence
4.6.1 Total Fertility Rates by Region and Residence
Generally urban fertility rates are lower than rural fertility rates, especially in developing countries.
Studies have shown that urban fertility in Sub-Saharan Africa is on average almost 30 percent
lower than rural fertility (Shapiro and Tambashe 2000; Dudley and Pillet 1998). Results from the
2012 PHC indicate the same pattern for Tanzania.
The TFR in rural areas was higher (6.5 children per woman) compared to urban TFR (4.1 children
per woman), which means that, on average, women in rural areas of Tanzania have two children
more than those in urban areas. Data from Table 4.6 and Figure 4.7 show that for all the regions in
Tanzania, the estimated TFR for rural areas was higher than that for urban areas. Regions with the
largest difference between rural and urban fertility rates were Tabora (2.9), Simiyu (2.6), Mwanza
and Kagera (2.5) while regions with the lowest differences were Kusini Unguja (0.3), Kaskazini
Unguja (0.4) and Kilimanjaro (1.9). Variation between rural and urban areas fertility rates
probably portrays the differences of socio-economic development between rural and urban areas of
a particular region.
Generally regions around Lake Victoria, Western part of the country and Pemba regions have high
fertility rates when compared with other parts of the country. The highest TFR of 8.5 was estimated
for Geita region, and the lowest (3.6) was estimated from Dar es Salaam. Other regions with TFR
of 7 or more were Rukwa (7.1), Kigoma (7.3), Tabora (7.0), Singida (7.4) and Kaskazini Pemba
(7.4). Other regions are Mara (7.0), Katavi (7.4), Simiyu (7.9) and Kusini Pemba (7.3). High level
of fertility in these regions is consistent with mean age at first marriage and mean age at first births.
All these regions had average mean age at first marriage and mean age at first birth below the
national average of 22.3 and 20 years, respectively.

45
Table 4. 3: Estimated Total Fertility Rate by Region; Tanzania, 2002 and 2012 Censuses
Region 2002 TFR
2012
TFR Rural Urban Difference
(Rural-Urban)
Tanzania 6.3 5.5 6.5 4.1 2.3
Tanzania Mainland 6.3 5.5 6.4 4.1 2.3
Dodoma 6.8 5.9 6.3 4.3 2.0
Arusha 5.0 4.3 5.1 3.1 2.0
Kilimanjaro 5.2 4.3 4.8 3.4 1.4
Tanga 6.1 5.7 6.1 4.3 1.8
Morogoro 5.9 4.9 5.4 3.8 1.5
Pwani 5.3 4.7 5.4 3.9 1.5
Dar es Salaam 3.8 3.6 N/A 3.6 -
Lindi 5.2 4.6 4.8 3.8 1.1
Mtwara 5.0 4.1 4.3 3.6 0.7
Ruvuma 5.8 4.9 5.1 4.5 0.7
Iringa 5.7 4.6 5.1 3.5 1.6
Mbeya 5.9 5.1 5.7 4.4 1.3
Singida 6.8 7.4 7.5 5.1 2.4
Tabora 7.7 7.0 7.5 4.6 2.9
Rukwa 7.6 7.3 7.8 6.4 1.3
Kigoma 7.9 7.3 7.7 5.6 2.1
Shinyanga 8.1 6.1 6.8 4.4 2.4
Kagera 7.9 6.4 6.7 4.3 2.5
Mwanza 7.2 6.7 7.9 5.4 2.5
Mara 6.9 7.0 7.4 5.2 2.3
Manyara 7.2 6.3 6.6 4.3 2.3
Njombe N/A 4.2 4.6 3.5 1.0
Katavi N/A 7.4 8.1 6.0 2.1
Simiyu N/A 7.9 8.1 5.5 2.6
Geita N/A 8.5 8.7 6.8 1.8
Tanzania Zanzibar 6.2 5.2 6.2 4.5 1.7
Kaskazini Unguja 7.3 5.5 5.6 5.2 0.4
Kusini Unguja 5.7 4.8 4.8 4.5 0.3
Mjini Magharibi 5.1 4.3 4.8 4.2 0.6
Kaskazini Pemba 7.4 7.3 7.8 6.7 1.1
Kusini Pemba 8.1 7.4 7.9 5.9 2.0
Note:
i. N/A- Not Applicable
ii. Dar es Salaam Region is completely urban and therefore a difference of TFR between rural and urban area
cannot be calculated. iii. Njombe, Katavi, Simiyu and Geita are new regions; where Njombe was formed from Iringa, Katavi was
formed from Rukwa, Simiyu was formed from Shinyanga and Mwanza and Geita was formed from Mwanza,
Kagera and Shinyanga

46
4.6.2 Average Parity by Region and Residence
The regional analysis of reported average parities indicates that average parity has been lowest for
women in Dar es Salaam (1.8) and highest for women in Kaskazini Pemba (4.7) followed by
Singida and Geita (3.5) (See Table 4.4). Women in rural areas had high parity when compared to
those living in urban areas for all regions in the country.
Table 4.4: Reported Average CEB by Region and Residence; Tanzania, 2012 Census
Region Total Rural Urban Difference
(Rural-Urban)
Tanzania 2.9 3.3 2.1 1.2
Tanzania Mainland 2.9 3.3 2.1 1.2
Dodoma 3.1 3.4 2.1 1.3
Arusha 2.3 2.6 1.7 0.9
Kilimanjaro 2.5 2.7 1.9 0.8
Tanga 3.1 3.3 2.3 1.0
Morogoro 2.8 3.1 2.1 1.0
Pwani 2.7 3.1 2.2 0.9
Dar es Salaam 1.8 N/A 1.8 -
Lindi 2.9 3.1 2.3 0.8
Mtwara 2.6 2.8 2.1 0.7
Ruvuma 2.8 3.0 2.3 0.7
Iringa 2.6 3.0 1.9 1.1
Mbeya 2.8 3.2 2.3 0.9
Singida 3.5 3.7 2.6 1.1
Tabora 3.3 3.4 2.4 1.0
Rukwa 3.4 3.5 2.9 0.6
Kigoma 3.3 3.4 2.6 0.8
Shinyanga 3.1 3.3 2.3 1.0
Kagera 3.3 3.4 2.1 1.3
Mwanza 3.2 3.7 2.5 1.2
Mara 3.4 3.6 2.6 1.0
Manyara 3.1 3.2 2.3 0.9
Njombe 2.6 2.8 1.9 0.9
Katavi 3.3 3.5 2.8 0.7
Simiyu 3.4 3.5 2.6 0.9
Geita 3.5 3.5 2.8 0.7
Tanzania Zanzibar 2.8 3.6 2.3 1.3
Kaskazini Unguja 3.1 3.1 2.9 0.2
Kusini Unguja 2.8 2.8 2.7 0.1
Mjini Magharibi 2.3 2.7 2.2 0.5
Kaskazini Pemba 4.7 3.6 3.1 0.5
Kusini Pemba 3.4 3.6 3.1 0.5
Note:
i. N/A- Not Applicable
ii. Dar es Salaam Region is completely urban and therefore a difference of TFR between rural and urban area
cannot be calculated.

47
Chapter Five
Adolescent Fertility
5.1 Introduction
The issue of adolescent fertility is important for health, social and economic reasons. Children born
to adolescent women (mothers aged 15 – 19 years) face an increased risk of illness and death.
Adolescent mothers themselves are more likely to experience difficult pregnancy outcomes and
maternity-related mortality than older women, and they are more constrained in their ability to
pursue educational opportunities than their counterparts who delay childbearing. Pregnancy is the
leading cause of death for adolescent females in many developing countries (WHO, 2012), with
adolescent mothers twice as likely to die from pregnancy-related complications compared to
mothers aged 20 years and above (Patton et al., 2009).
Early childbearing is also associated with lower educational attainment and persistent poverty
among those who become mothers during adolescent ages. The 2010 Tanzania Demographic and
Health Survey, reports that 52 percent of teenagers who had no education had begun childbearing
compared to only six percent of women who attended secondary education. The Programme of
Action of the 1994 International Conference on Population and Development (ICPD) highlighted
the importance of reducing adolescent pregnancy and the multiple factors underlying adolescent
fertility, and recommended that governments take actions to substantially reduce adolescent
pregnancies.
5.2 Levels of Adolescent Fertility
Results show that the Adolescent Fertility Rate (AFR) for Tanzania was 81 births per 1,000 women
aged 15 – 19 years (Table 5.1). This rate is very high when compared with a 2015 Millennium
Development Goals which aims at reducing AFR to 5.4 per 1,000 women aged 15 – 19 years by
2015. Regions in Tanzania Zanzibar have lower AFR when compared to those in Tanzania
Mainland, which may be explained by different education systems between Tanzania Mainland and
Tanzania Zanzibar. The education system in Tanzania Zanzibar allows young girls to stay longer in
school than those on the Mainland and hence delaying childbearing.
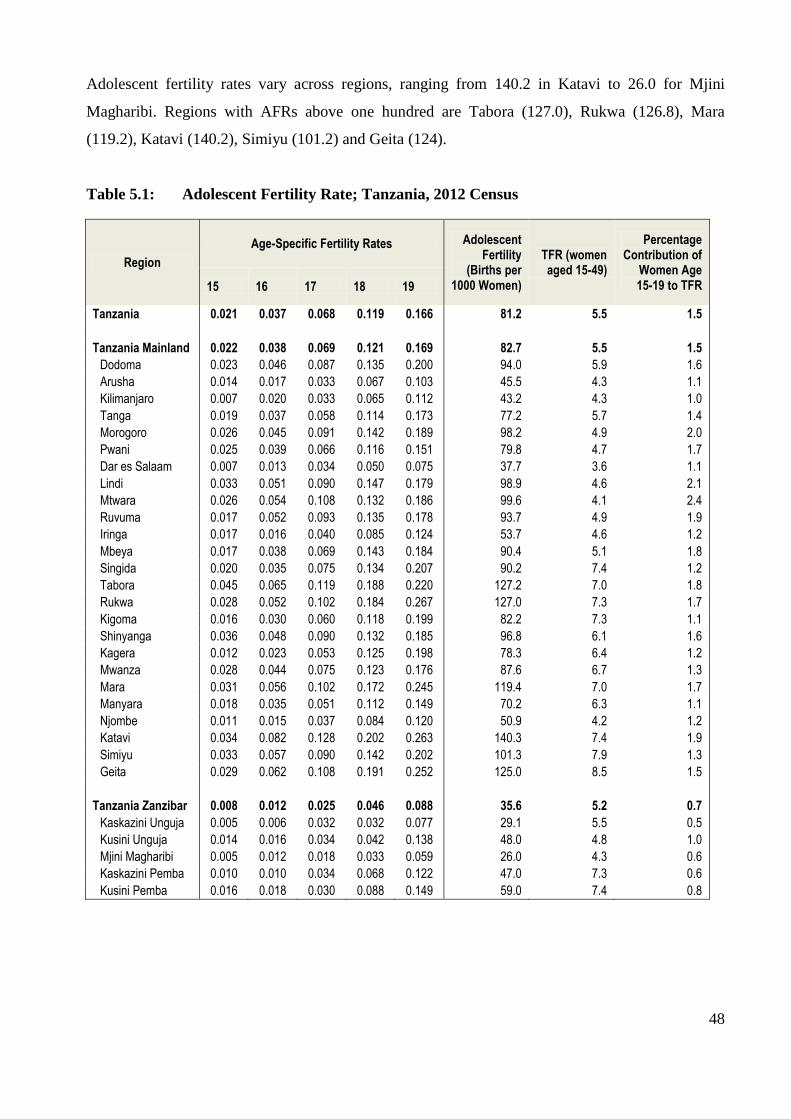
48
Adolescent fertility rates vary across regions, ranging from 140.2 in Katavi to 26.0 for Mjini
Magharibi. Regions with AFRs above one hundred are Tabora (127.0), Rukwa (126.8), Mara
(119.2), Katavi (140.2), Simiyu (101.2) and Geita (124).
Table 5.1: Adolescent Fertility Rate; Tanzania, 2012 Census
Region
Age-Specific Fertility Rates Adolescent Fertility
(Births per 1000 Women)
TFR (women aged 15-49)
Percentage Contribution of
Women Age 15-19 to TFR 15 16 17 18 19
Tanzania 0.021 0.037 0.068 0.119 0.166 81.2 5.5 1.5
Tanzania Mainland 0.022 0.038 0.069 0.121 0.169 82.7 5.5 1.5
Dodoma 0.023 0.046 0.087 0.135 0.200 94.0 5.9 1.6
Arusha 0.014 0.017 0.033 0.067 0.103 45.5 4.3 1.1
Kilimanjaro 0.007 0.020 0.033 0.065 0.112 43.2 4.3 1.0
Tanga 0.019 0.037 0.058 0.114 0.173 77.2 5.7 1.4
Morogoro 0.026 0.045 0.091 0.142 0.189 98.2 4.9 2.0
Pwani 0.025 0.039 0.066 0.116 0.151 79.8 4.7 1.7
Dar es Salaam 0.007 0.013 0.034 0.050 0.075 37.7 3.6 1.1
Lindi 0.033 0.051 0.090 0.147 0.179 98.9 4.6 2.1
Mtwara 0.026 0.054 0.108 0.132 0.186 99.6 4.1 2.4
Ruvuma 0.017 0.052 0.093 0.135 0.178 93.7 4.9 1.9
Iringa 0.017 0.016 0.040 0.085 0.124 53.7 4.6 1.2
Mbeya 0.017 0.038 0.069 0.143 0.184 90.4 5.1 1.8
Singida 0.020 0.035 0.075 0.134 0.207 90.2 7.4 1.2
Tabora 0.045 0.065 0.119 0.188 0.220 127.2 7.0 1.8
Rukwa 0.028 0.052 0.102 0.184 0.267 127.0 7.3 1.7
Kigoma 0.016 0.030 0.060 0.118 0.199 82.2 7.3 1.1
Shinyanga 0.036 0.048 0.090 0.132 0.185 96.8 6.1 1.6
Kagera 0.012 0.023 0.053 0.125 0.198 78.3 6.4 1.2
Mwanza 0.028 0.044 0.075 0.123 0.176 87.6 6.7 1.3
Mara 0.031 0.056 0.102 0.172 0.245 119.4 7.0 1.7
Manyara 0.018 0.035 0.051 0.112 0.149 70.2 6.3 1.1
Njombe 0.011 0.015 0.037 0.084 0.120 50.9 4.2 1.2
Katavi 0.034 0.082 0.128 0.202 0.263 140.3 7.4 1.9
Simiyu 0.033 0.057 0.090 0.142 0.202 101.3 7.9 1.3
Geita 0.029 0.062 0.108 0.191 0.252 125.0 8.5 1.5
Tanzania Zanzibar 0.008 0.012 0.025 0.046 0.088 35.6 5.2 0.7
Kaskazini Unguja 0.005 0.006 0.032 0.032 0.077 29.1 5.5 0.5
Kusini Unguja 0.014 0.016 0.034 0.042 0.138 48.0 4.8 1.0
Mjini Magharibi 0.005 0.012 0.018 0.033 0.059 26.0 4.3 0.6
Kaskazini Pemba 0.010 0.010 0.034 0.068 0.122 47.0 7.3 0.6
Kusini Pemba 0.016 0.018 0.030 0.088 0.149 59.0 7.4 0.8

49
5.2.1 Contribution of Adolescent Fertility to Total Fertility Rate
Adolescent fertility contributed 1.5 percent of the Total Fertility Rate (TFR) at national level. The
contribution is high for Tanzania Mainland (1.5 percent) when compared to Tanzania Zanzibar (0.7
percent). Table 5.1 reveals that the largest contribution of adolescent fertility to total fertility rate is
observed from Mtwara region (2.4 percent) followed by Lindi (2.1 percent) and Morogoro (2.0
percent). These are the regions where early marriages are relatively more common compared to
other regions. On the other hand, the contribution of AFR to TFR was 1 percent or less for regions
in Tanzania Zanzibar.

50
Map 5.1: Percentage Contribution of Adolescent Fertility to TFR by Region; Tanzania,
2012 Census

51
5.3 Adolescent Fertility Differentials
5.3.1 Education Status
Table 5.2 shows percentage of girls who had at least one birth at the time of Census and their education attainment. Results confirm that early childhood
fertility is negatively related to education status of girls. Teenagers with no educations are more likely to start childbearing than the more educated.
Results show that 42.2 percent of girls with no education had started childbearing compared with only 9 percent with university or related education.
Table 5.2: Percentage of Adolescents with at Least One Birth by their Education Attainment; Tanzania, 2012 Census
Education Attainment Number of Females Percentage
Total 15 16 17 18 19 Total 15 16 17 18 19
Total 2,309,557 470,210 466,818 431,719 536,140 404,670 23.3 8.7 12.7 19.7 32.9 43.8
Never Attended 247,510 46,304 44,293 40,394 70,325 46,195 42.2 15.8 24.3 38.1 55.8 68.8
Primary 1,255,414 295,000 256,300 219,320 277,669 207,125 26.9 9.3 14.4 23.7 39.2 54.5
Secondary 800,599 128,906 166,226 172,005 185,992 147,470 11.9 5.0 7.0 10.2 15.0 21.8
University and Other related 5,735 N/A N/A N/A 2,155 3,580 9.0 N/A N/A N/A 6.2 10.7
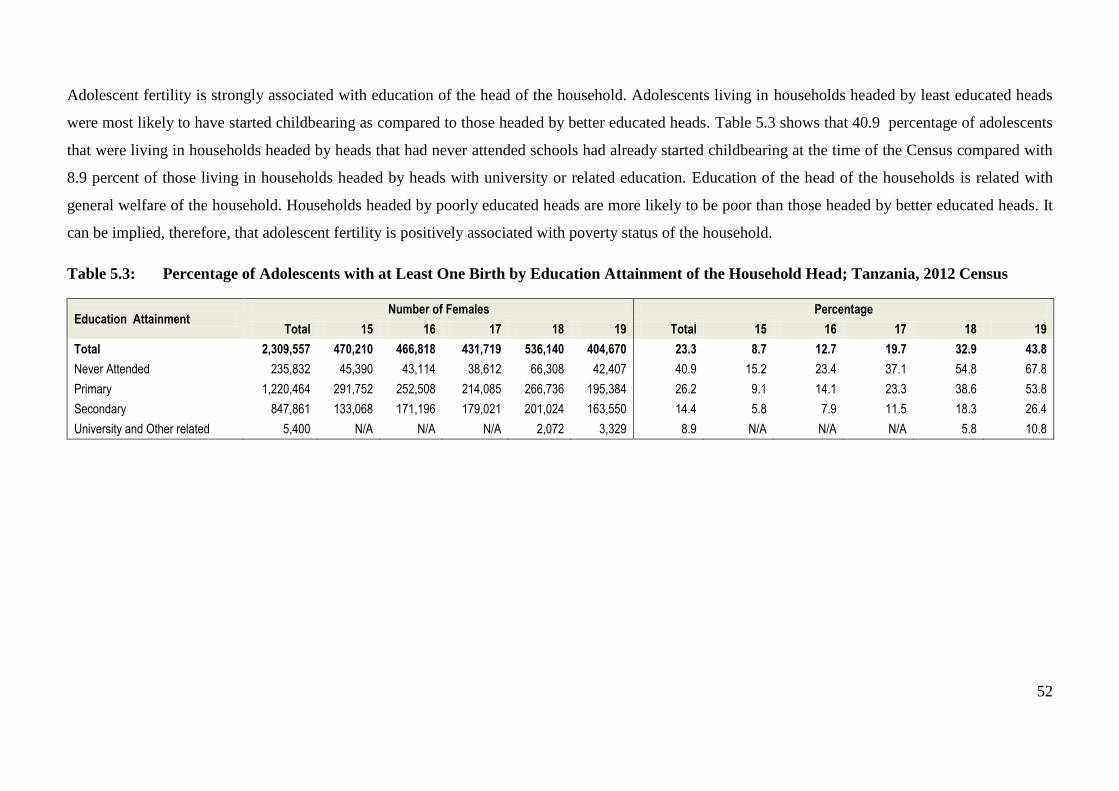
52
Adolescent fertility is strongly associated with education of the head of the household. Adolescents living in households headed by least educated heads
were most likely to have started childbearing as compared to those headed by better educated heads. Table 5.3 shows that 40.9 percentage of adolescents
that were living in households headed by heads that had never attended schools had already started childbearing at the time of the Census compared with
8.9 percent of those living in households headed by heads with university or related education. Education of the head of the households is related with
general welfare of the household. Households headed by poorly educated heads are more likely to be poor than those headed by better educated heads. It
can be implied, therefore, that adolescent fertility is positively associated with poverty status of the household.
Table 5.3: Percentage of Adolescents with at Least One Birth by Education Attainment of the Household Head; Tanzania, 2012 Census
Education Attainment Number of Females Percentage
Total 15 16 17 18 19 Total 15 16 17 18 19
Total 2,309,557 470,210 466,818 431,719 536,140 404,670 23.3 8.7 12.7 19.7 32.9 43.8
Never Attended 235,832 45,390 43,114 38,612 66,308 42,407 40.9 15.2 23.4 37.1 54.8 67.8
Primary 1,220,464 291,752 252,508 214,085 266,736 195,384 26.2 9.1 14.1 23.3 38.6 53.8
Secondary 847,861 133,068 171,196 179,021 201,024 163,550 14.4 5.8 7.9 11.5 18.3 26.4
University and Other related 5,400 N/A N/A N/A 2,072 3,329 8.9 N/A N/A N/A 5.8 10.8

53
5.3.2 Residence
Table 5.4 gives percentage of adolescent girls with at least one birth by the time of Census in
August, 2012. Results show that 23.3 percent of all adolescent had given at least one birth. Fertility
among adolescents is very low at age 15 and 16 but becomes substantial at ages 17 to 19. The
percentage of adolescents who have started childbearing was substantially higher in rural (28.1
percent) than in urban areas (14.8 percent) and higher in Tanzania Mainland (23.7 percent) than
Tanzania Zanzibar (11.6 percent).
Table 5.4: Percentage Distribution of Adolescents with at Least One Birth by Residence;
Tanzania, 2012 Census
Age Tanzania Tanzania Mainland Tanzania Zanzibar
Total Rural Urban Total Rural Urban Total Rural Urban
Total 23.3 28.1 14.8 23.7 28.5 15.0 11.6 14.1 9.0
15 8.7 10.4 5.2 8.9 10.5 5.3 4.3 4.9 3.6
16 12.7 15.7 7.2 12.9 15.9 7.3 6.1 6.7 5.5
17 19.7 24.7 11.5 20.0 25.1 11.6 9.4 11.4 7.5
18 32.9 39.9 20.1 33.5 40.5 20.5 15.1 18.2 11.7
19 43.8 53.2 29.0 44.5 53.8 29.6 23.2 30.5 16.1
Table 5.5 shows the percentage of girls aged 15 – 19 who had started childbearing by region and
residence. Overall, the percentage of adolescent who had at least one birth was high in the regions
around Lake Victoria and Western part of the country. These are the same regions with high Total
Fertility Rates in the country and their higher levels of adolescent fertility contribute to the higher
TFRs. Katavi had the highest percentage of adolescent mothers (36.8 percent) and the lowest was
in Mjini Magharibi (9.3 percent). Generally, percentage of adolescent mothers was lower in
Tanzania Zanzibar than Tanzania Mainland. Percentage of adolescent mothers was less than 10
percent for all regions in Tanzania Zanzibar, while the region with lowest percentage was Dar es
Salaam (12 percent).
The percentage of adolescents who had started childbearing was higher in rural than urban areas for
all regions in the country except Kaskazini and Kusini Unguja. At the national level, the percentage
of adolescent mothers in rural areas (28.1 percent) was twice that in urban areas (14.8 percent). A
similar pattern was for other 19 regions in Tanzania Mainland. Differences in socio-economic
conditions between the rural and urban population largely explain these variations.

54
Table 5.5: Percentage of Adolescent with at Least One Birth by Region and Rural –
Urban Residence; Tanzania, 2012 Census
Region Number of Adolescents
Adolescents with at Least One Birth
Percentage
Total Rural Urban Total Rural Urban Total Rural Urban
Tanzania 2,309,557 1,483,204 826,353 538,686 416,619 122,067 23.3 28.1 14.8
Dodoma 94,273 72,982 21,291 25,022 21,656 3,366 26.5 29.7 15.8
Arusha 96,436 58,833 37,603 14,058 10,661 3,397 14.6 18.1 9.0
Kilimanjaro 86,151 61,673 24,478 11,821 9,171 2,650 13.7 14.9 10.8
Tanga 97,335 71,130 26,205 21,078 17,360 3,718 21.7 24.4 14.2
Morogoro 106,190 68,633 37,557 29,114 22,100 7,014 27.4 32.2 18.7
Pwani 49,973 30,230 19,743 12,512 8,728 3,784 25.0 28.9 19.2
Dar es Salaam 275,312 N/A 275,312 32,934 N/A 32,934 12.0 N/A 12.0
Lindi 34,908 26,910 7,998 9,968 8,453 1,515 28.6 31.4 18.9
Mtwara 53,091 37,835 15,256 15,914 12,861 3,053 30.0 34.0 20.0
Ruvuma 64,612 45,025 19,587 18,905 15,025 3,880 29.3 33.4 19.8
Iringa 46,278 29,019 17,259 7,366 5,338 2,028 15.9 18.4 11.8
Mbeya 149,609 91,383 58,226 33,389 23,949 9,440 22.3 26.2 16.2
Singida 58,489 48,403 10,086 14,275 12,753 1,522 24.4 26.3 15.1
Tabora 118,435 100,521 17,914 43,215 39,543 3,672 36.5 39.3 20.5
Rukwa 52,273 37,958 14,315 16,034 12,521 3,512 30.7 33.0 24.5
Kigoma 106,019 82,553 23,466 23,311 19,131 4,180 22.0 23.2 17.8
Shinyanga 82,044 66,112 15,932 25,595 22,807 2,788 31.2 34.5 17.5
Kagera 121,740 106,995 14,745 25,002 23,225 1,777 20.5 21.7 12.1
Mwanza 148,248 88,175 60,073 38,867 e28,566 10,301 26.2 32.4 17.1
Mara 86,078 67,230 18,848 26,295 22,240 4,055 30.5 33.1 21.5
Manyara 67,043 56,103 10,940 13,085 11,520 1,565 19.5 20.5 14.3
Njombe 35,155 23,993 11,162 5,354 4,146 1,208 15.2 17.3 10.8
Katavi 29,270 20,460 8,810 10,762 8,331 2,431 36.8 40.7 27.6
Simiyu 86,160 79,381 6,779 27,627 26,362 1,265 32.1 33.2 18.7
Geita 90,499 73,828 16,671 28,602 24,835 3,767 31.6 33.6 22.6
Kaskazini Unguja 10,015 9,174 841 1,087 985 102 10.9 10.7 12.1
Kusini Unguja 5,673 5,337 336 991 928 63 17.5 17.4 18.8
Mjini Magharibi 34,498 4,523 29,975 3,211 655 2,556 9.3 14.5 8.5
Kaskazini Pemba 12,258 9,850 2,408 1,596 1,330 267 13.0 13.5 11.1
Kusini Pemba 11,492 8,955 2,537 1,696 1,440 257 14.8 16.1 10.1

55
Chapter Six
Lifetime Fertility
6.1 Introduction
The 2012 Population and Housing Census collected information from women aged 15 -49 on the
total number of children ever born as well as the births that occurred in the last 12 months
preceding the Census. The number of children ever born to a woman at the time of the Census is
used to capture lifetime fertility of a woman. Lifetime fertility therefore, refers to the number of
children born alive during the entire reproductive period of a woman.
6.2 Mean Number of Children Ever Born
The average number of children ever born (CEB) in the lifetime of women at the census by 5-year
age group is presented in Table 6.1 and Figure 6.1. The results show that parity ranges from 0 to 7
for women aged 12 – 49 years. The number of children ever born to a woman increases with age,
and therefore, the parity curves shows a slow increase in early stages of reproductive stages
followed by a stable increase. The mean parity starts to increase at the age of 18-19 years,
confirming earlier observations that adolescent fertility level in the country is high.
Regional variations are observed with four regions registering parity of above seven (Rukwa 7.079;
Kigoma 7.121; Kaskazini Pemba 7.124; Kusini Pemba 7.721). Arusha and Kilimanjaro recorded
the lowest parity of 5.150 and 5.109 respectively. This observation is consistency with current
fertility where regions around Lake Victoria, Western part of the country and Pemba showed the
higher TFR compared with other part of the country (Refer to Chapter Three of this Document).

56
Table 6.1: Mean Number of Children Ever Born by Region; Tanzania, 2012 Census
Parity 1 2 3 4 5 6 7
Region 15-19 20-24 25-29 30-34 35-39 40-44 45-49
Tanzania 0.337 1.421 2.731 3.946 4.949 5.600 5.945
Tanzania Mainland 0.343 1.437 2.746 3.952 4.942 5.583 5.924
Dodoma 0.360 1.552 2.910 4.150 5.194 5.944 6.197
Arusha 0.203 1.072 2.171 3.200 4.048 4.663 5.150
Kilimanjaro 0.187 1.047 2.137 3.227 4.109 4.731 5.109
Tanga 0.306 1.423 2.795 3.996 4.896 5.531 5.980
Morogoro 0.380 1.424 2.591 3.636 4.581 5.209 5.588
Pwani 0.344 1.363 2.500 3.585 4.468 5.144 5.517
Dar es Salaam 0.160 0.823 1.705 2.590 3.285 3.848 4.546
Lindi 0.376 1.422 2.448 3.443 4.290 4.879 5.416
Mtwara 0.377 1.338 2.297 3.193 3.835 4.374 4.702
Ruvuma 0.374 1.475 2.654 3.690 4.534 5.067 5.400
Iringa 0.207 1.141 2.394 3.564 4.543 5.216 5.546
Mbeya 0.309 1.369 2.731 3.960 4.915 5.543 5.906
Singida 0.361 1.618 3.192 4.644 5.787 6.546 6.562
Tabora 0.584 1.918 3.387 4.749 5.825 6.294 6.619
Rukwa 0.437 1.851 3.499 5.001 6.219 6.927 7.079
Kigoma 0.321 1.527 3.220 4.759 6.013 6.846 7.121
Shinyanga 0.479 1.746 3.172 4.495 5.504 5.997 6.208
Kagera 0.284 1.586 3.193 4.613 5.750 6.476 6.804
Mwanza 0.399 1.623 3.175 4.603 5.754 6.382 6.620
Mara 0.465 1.901 3.491 4.899 5.860 6.370 6.424
Manyara 0.278 1.369 2.854 4.264 5.488 6.234 6.674
Njombe 0.196 1.137 2.318 3.435 4.321 4.931 5.338
Katavi 0.554 1.972 3.433 4.850 6.003 6.545 6.904
Simiyu 0.539 1.868 3.521 5.049 6.231 6.781 6.876
Geita 0.480 1.997 3.728 5.123 6.222 6.803 6.869
Tanzania Zanzibar 0.170 0.942 2.271 3.746 5.166 6.113 6.510
Kaskazini Unguja 0.156 0.930 2.468 4.227 5.672 6.560 6.532
Kusini Unguja 0.224 1.100 2.315 3.511 4.823 5.752 6.447
Mjini Magharibi 0.135 0.739 1.824 3.086 4.357 5.238 5.888
Kaskazini Pemba 0.205 1.335 3.173 5.042 6.497 7.227 7.124
Kusini Pemba 0.222 1.262 3.053 4.998 6.453 7.505 7.721

57
Figure 6.1: Pattern of Mean Number of Children Ever Born by Women; Tanzania, 2012
Census
6.3 Parity Distribution and Progression Ratios
6.3.1 Parity Distribution
The changes in fertility by age may be further explained by examining the parity distribution of
women. The parity distribution of women showed a zero parity of 76.7 percent and 30.5 percent for
women in age groups 15-19 and 20-24 respectively. These women were about twice more than the
rest of the childless women in the female population. The percentage of women with zero parity
declined steadily as age advanced as shown in Table 6.2. As expected, the percentage of women
with high parity increases with age.
Table 6.2: Percentage Distribution of Women Five year’s Age group 15 - 49 by Total
Children Ever Born_1+; Tanzania, 2012 Census.
Age Group Women 0 1 2 3 4 5 6 7 8 9 10+
Total 12,032,885 24.1 13.2 12.7 10.9 9.5 7.4 6.3 4.7 3.7 2.7 4.9
15 - 19 2,309,557 76.7 16.2 5.0 1.4 0.6 0.1 0.0 0.0 0.0 0.0 0.0
20 - 24 2,100,897 30.5 28.4 22.2 10.9 5.0 1.9 0.8 0.2 0.1 0.0 0.0
25 - 29 1,809,024 11.1 15.6 22.3 20.5 14.9 7.9 4.3 1.8 1.0 0.4 0.3
30 - 34 1,503,813 5.7 8.4 14.3 17.2 17.2 13.7 10.4 5.9 3.4 1.7 2.0
35 - 39 1,238,033 4.2 5.6 9.6 12.6 14.6 13.7 12.7 9.6 7.1 4.4 5.9
40 - 44 939,619 3.9 4.9 7.8 10.0 12.0 12.2 12.2 10.4 8.8 6.6 11.1
45 - 49 776,619 4.4 4.6 6.9 8.8 10.6 11.2 11.5 10.6 9.3 7.3 14.9

58
The parity distribution of women for rural and urban areas as displayed in Table 6.3 and 6.4 reveal
some variations. Urban women of zero parity (31.5 percent) were higher in proportion than their
rural counterparts (20.2 percent). This observation may be influenced by relatively higher number
of urban women aged 15-24 with zero parity compared to their counterparts in rural areas. The
percentage of women with zero parity decreased steadily with age for both urban and rural women.
Table 6.3: Percentage Distribution of Women Five year’s Age group 15 - 49 by Total
Children Ever Born_1+; Tanzania Rural, 2012 Census.
Age Group Women 0 1 2 3 4 5 6 7 8 9 10+
Total 7,889,802 20.2 12.0 11.7 10.7 9.9 8.3 7.3 5.7 4.6 3.4 6.2
15 - 19 1,483,204 71.9 19.1 6.2 1.8 0.7 0.1 0.1 0.0 0.0 0.0 0.0
20 - 24 1,298,528 21.9 28.1 25.7 13.8 6.5 2.6 1.1 0.3 0.1 0.0 0.0
25 - 29 1,125,281 7.0 10.9 19.7 22.8 18.5 10.5 5.8 2.5 1.4 0.5 0.3
30 - 34 960,180 3.9 5.5 10.0 15.2 18.3 16.5 13.2 7.8 4.6 2.3 2.7
35 - 39 824,156 3.2 4.0 6.6 9.7 13.1 14.4 14.7 11.9 9.1 5.7 7.6
40 - 44 651,068 3.3 3.9 5.8 7.8 10.2 11.7 12.9 11.9 10.5 8.1 13.9
45 - 49 541,288 4.0 3.9 5.7 7.3 9.1 10.4 11.6 11.4 10.3 8.5 17.7
Table 6.4: Percentage Distribution of Women Five year’s Age group 15 - 64 by Total
Children Ever Born_1+; Tanzania Urban, 2012 Census.
Age Group
Women 0 1 2 3 4 5 6 7 8 9 10+
Total 4,143,083 31.5 15.5 14.6 11.2 8.7 5.8 4.3 2.8 2.0 1.3 2.3
15 - 19 826,353 85.2 10.9 2.9 0.7 0.3 0.0 0.0 0.0 0.0 - 0.0
20 - 24 802,369 44.5 28.9 16.6 6.2 2.5 0.8 0.4 0.1 0.0 0.0 0.0
25 - 29 683,743 17.9 23.2 26.6 16.6 9.0 3.6 1.8 0.7 0.4 0.1 0.1
30 - 34 543,633 8.8 13.7 21.8 20.8 15.4 8.8 5.3 2.5 1.4 0.7 0.9
35 - 39 413,877 6.1 8.8 15.5 18.3 17.8 12.3 8.8 5.0 3.3 1.7 2.4
40 - 44 288,551 5.3 7.1 12.2 15.2 16.2 13.2 10.6 7.1 5.1 3.1 4.8
45 - 49 235,331 5.2 6.1 9.8 12.2 14.0 12.8 11.3 8.7 6.8 4.6 8.4
6.3.2 Parity Progression Ratios
Parity Progression Ratio (PPR) measures the rate at which families are growing and the likelihood
that a woman with “n” children proceeds to “n+1” children. Table 6.6 presents PPR by five years
age groups for women aged 15 – 49. The table reveals that probability of a woman having an
additional child is high and stable between 83 to 96 percent up to the sixth child which is slightly
above the national TFR of 5.5 children per woman. PPR ranges between 78 and 70 percent after
child number 6, suggesting that majority of women with already high parity are likely to pursue
additional childbearing.

59
Variation is observed between rural and urban areas. Table 6.5 results show that 80 percent of
women in rural areas will probably proceed to have seventh child. However, PPR for urban areas
drops from 85 to 80 percent after the fourth child.
Table 6.5: Parity Progression Ratios by Age, Residence; Tanzania, 2012 Census
Age Group 2 3 4 5 6 7 8 9
Tanzania
20 - 24 0.592 0.460 0.423 - - - - -
25 - 29 0.825 0.696 0.599 0.512 0.496 - - -
30 - 34 0.911 0.834 0.760 0.683 0.631 0.557 - -
35 - 39 0.941 0.894 0.844 0.785 0.743 0.679 0.645 0.589
40 - 44 0.949 0.915 0.880 0.836 0.801 0.751 0.718 0.667
45 - 49 0.952 0.924 0.896 0.859 0.828 0.785 0.748 0.705
Tanzania Rural
20 - 24 0.641 0.487 0.433 - - - - -
25 - 29 0.883 0.760 0.635 0.533 0.501 - - -
30 - 34 0.943 0.890 0.811 0.720 0.650 0.568 - -
35 - 39 0.958 0.929 0.887 0.829 0.773 0.700 0.654 0.594
40 - 44 0.960 0.938 0.911 0.872 0.830 0.774 0.733 0.678
45 - 49 0.959 0.938 0.916 0.884 0.851 0.805 0.762 0.717
Tanzania Urban
20 - 24 0.480 0.375 0.383 - - - - -
25 - 29 0.717 0.548 0.485 0.427 0.466 - - -
30 - 34 0.850 0.718 0.627 0.560 0.548 0.505 - -
35 - 39 0.906 0.818 0.737 0.653 0.632 0.583 0.594 0.556
40 - 44 0.925 0.861 0.798 0.731 0.700 0.655 0.646 0.606
45 - 49 0.935 0.890 0.846 0.790 0.757 0.716 0.695 0.655
6.4 Population of Women who are Childless
The percentage of childless women at the end of the reproductive (45 – 49 years) period is an
indicator of the prevalence of sterility in a population. This measure, however, overestimates the
true prevalence of sterility because some of the childless women at the end of their reproductive
period may not have had children for reasons not related to their physiological ability to become
pregnant or to give birth. Moreover, Census results indicates some of the women aged 45 – 49
actually gave births in the last 12 months prior to the Census, so it is not definite that all these
women will remain childless.
Table 6.6 shows 4.4 percent of women aged 45 – 49 were childless at the time of the Census in
2012. Percentage of childless women was relatively higher among urban women (5.7 percent)

60
compared to rural women (4.7 percent). Percentage of women aged 45 – 49 without children
ranged from 6.9 percent in Lindi to 2.7 percent for Kusini Pemba. With the exception of Shinyanga
and Mara regions, percentage of women of 45-45 without children was higher in urban than rural
areas.
Table 6.6: Percentage Distribution of Childless Women Aged 45 to 49 by Place of
Residence; Tanzania, 2012 Census
Place of Residence Total women Total Women
Without Children
Percentage of Women who are Childless
Total Rural Urban
Tanzania 776,622 34,004 4.4 4.0 5.2
Tanzania Mainland 748,541 32,554 4.3 4.0 5.2
Dodoma 34,142 1,169 3.4 3.5 3.2
Arusha 26,990 807 3.0 2.6 3.7
Kilimanjaro 36,394 1,325 3.6 3.5 4.3
Tanga 47,749 2,067 4.3 4.0 5.4
Morogoro 37,274 1,660 4.5 4.2 5.0
Pwani 18,424 722 3.9 3.7 4.5
Dar es Salaam 76,428 4,426 5.8
5.8
Lindi 24,616 1,690 6.9 6.5 8.3
Mtwara 28,082 1,655 5.9 5.6 7.1
Ruvuma 26,779 1,156 4.3 4.3 4.4
Iringa 16,789 641 3.8 3.6 4.5
Mbeya 55,556 2,773 5.0 4.9 5.3
Singida 32,105 1,499 4.7 4.6 5.1
Tabora 28,645 1,068 3.7 3.7 3.9
Rukwa 12,176 395 3.2 3.1 3.6
Kigoma 28,722 876 3.0 2.9 3.6
Shinyanga 20,330 885 4.4 4.4 3.9
Kagera 36,287 1,116 3.1 2.8 5.8
Mwanza 47,649 2,130 4.5 4.4 4.7
Mara 24,968 1,167 4.7 4.5 5.5
Manyara 21,898 614 2.8 2.7 3.5
Njombe 13,128 567 4.3 4.1 5.2
Katavi 6,491 258 4.0 2.9 6.6
Simiyu 20,619 720 3.5 3.4 4.3
Geita 26,300 1,168 4.4 4.2 5.6
Tanzania Zanzibar 28,081 1,450 5.2 4.7 5.7
Kaskazini Unguja 4,755 292 6.1 6.2 5.7
Kusini Unguja 2,284 92 4.0 3.8 6.8
Mjini Magharibi 12,182 719 5.9 5.5 6.0
Kaskazini Pemba 5,248 247 4.7 4.8 4.4
Kusini Pemba 3,612 99 2.7 2.5 3.6

61
Chapter Seven
Summary, Conclusion and Recommendations
7.1 Introduction
There is a strong relationship between levels of national development with nuptiality and fertility.
In developing countries where nuptiality is almost universal, the level of fertility is very high,
which in turn has strong implications to the development of the country because of high population
dynamics (Todaro, 1992). Furthermore, nuptiality and fertility levels must reflect the national and
international population goals like the National Population Policy of Tanzania (2006) and the
Millennium Development Goals (2000).
7.2 Nuptiality
In terms of nuptiality, the PHC results indicate that adolescents aged 15-19 belong to the never
married category which may be an indicator that most youth stay in school longer, which may lead
to a positive result of lowering fertility. On the other hand, if not handled carefully it may lead to
more single mothers and breakdown of families at younger ages and poor care of children. This
may lead some young mothers to neglect their children, hence leading to the mushrooming of street
children. An increase of mean age at first marriage for girls from 19.1 to 22.3 years that has been
observed between 1978 and 2012 censuses may lead to positive results of reducing fertility at large
as the length of reproduction span of women of about 30 years is reduced. Nonetheless, marriage at
older ages may push women to bear children above age 35 years, which may risk their maternal and
child health.
Moreover, the PHC results have shown that the proportion of married females decreased from 69.5
percent in 1978 to 58.1 percent. The same trend was observed among males which decreased from
61.4 percent in 1978 to 56.8 percent in 2012. These results are supported by the increase in the
average age at first marriage from 24.9 years in 1978 to 25.8 years in 2012 for males and from 19.1
years in 1978 to 22.3 percent in 2012 for females. Also, the mean age at first marriage was higher
in urban areas than rural areas and relatively developed regions like Kilimanjaro had higher mean
age at first marriage compared to periphery regions like Rukwa, Mtwara and Lindi. These results
indicate that in order to reduce fertility level at national level, more development inputs should be
injected into “less” developed regions.

62
As a whole these changes, especially the increase at the mean age at first marriage of females, will
have positive results in the reduction of fertility in the country as stipulated by the Development
Vision 2025 (Tanzania Mainland) and Zanzibar Development Vision 2020, the National Population
Policy, National Strategy for Growth and Reduction of Poverty in Tanzania Mainland and Zanzibar
Strategy for Growth and reduction of Poverty and Millennium Development Goals (2015).
7.3 Fertility Patterns, Levels, Trends and Differentials
7.3.1 Patterns and Levels
The 2012 PHC results indicate that Tanzania’s fertility patterns, levels and trends are typical of
developing countries of Sub-Saharan Africa. This is because the crude birth rate as high as 30 per
thousand is more prevalent in developing countries. The age-specific fertility rate, as a measure of
current child bearing performance, peaks at age group 20-25 years, which coincides with the mean
age at first marriage. The TFR that has been estimated for Tanzania is 5.5, 5.7 for Tanzania
Mainland and 5.2 for Tanzania Zanzibar. These indicators are quite high; hence more efforts should
be done to bring socio-economic development to all regions of Tanzania as a result of the country’s
“Big Results Now” programme. Middle income countries like Singapore, Hong Kong and Southern
Korea have managed to reduce TFR to below 3. It has been observed that developed regions like
Dar es Salaam (TFR 3.5), Mjini Magharibi (TFR 4.3), and Kilimanjaro (TFR 4.3) have a higher per
capita income compared with regions with high TFR like Geita (TFR 8.4) and Kusini Pemba (TFR
7.4).
Moreover, there is an association between population reproduction and development. The 2012
PHC results indicate that the Gross Reproduction Rates (GRR) and Net Reproduction Rates (NRR)
are similar to other developing countries. As a whole, with NRR of 2.4 for Tanzania Mainland and
2.3 for Tanzania Zanzibar, the country has a high potential of the population replacing itself with
time. It is evident that every woman in the reproductive ages will be replaced by more than two
daughters. This gives the potential for the population of Tanzania to grow faster during the next 50
years. This, therefore, calls for concerted efforts to adopt fertility reduction measures such as
modern family planning.
Life time fertility indicates that “less developed” regions like Rukwa (7.1), Kigoma (7.1),
Kaskazini Pemba (7.1) and Kusini Pemba (7.7) had more ever born children compared to
“developed regions” like Arusha (5.1), Kilimanjaro (5.2) and Dar es Salaam. There are other

63
regions with low parity like Mtwara (4.7) because of high marriage instabilities whose
interventions in terms of population dynamics must be both social and developmental.
7.3.2 Fertility Trends
Although the fertility of the country is still high, there is evidence which shows that it has been
declining from 6.9 in 1967 to 5.5 in the 2012 Census. This decline is the result of interventions in
terms of health and development of the country. This reduction of about 1.4 children per woman
indicated some stagnation in fertility reduction which calls upon more investment in development
so that the country turns to be a Middle Income by 2025 which will in turn trigger further changes
in fertility and other population dynamics variables like mortality. To this end, the National
Population Policy needs to be reviewed so that it integrates the Big Results Now.
7.3.3 Fertility Differentials
The PHC 2012 results indicate that there are substantial differentials of fertility levels by marital
status, education and occupation of woman, rural – urban residence and between regions. Fertility
levels are high among married women (6.3 children per woman) as compared to other groups.
Results also confirm that, fertility levels are negatively associated with education of mothers.
National TFR of 5.5 children per woman is mainly influenced by women who had never been to
school or with no education who had a TFR of 7 children per woman. Women who were engaged
in agriculture (farmers, livestock keepers and fishers) had the highest TFR of 5.9 when compared to
other groups or those who were not working.
There were differences between rural and urban areas. Fertility levels were high in rural (6.5) than
in urban areas (5.4). This means, that on average, women in rural areas of Tanzania have two more
children than those in urban areas. Substantial variations are observed among regions. Total fertility
rates ranges from as high as 8.4 in Geita to 3.6 in Dar es Salaam. Generally, regions around Lake
Victoria, Western part of the country and Pemba Regions had the highest levels when compared to
other parts of the country. The 2012 PHC results indicate that there are substantial differentials
between rural and urban areas. Poverty in rural areas is still rampart; hence there is urgent need to
focus development initiatives in order to eradicate poverty of the rural population. MKUKUTA and
MKUZA should be reviewed to incorporate the fertility differentials in development. This policy
should be extended to regional differentials where more investment should be directed to regions
with “low development” such as Katavi and Kigoma.

64
7.3.4 Adolescent Fertility
The PHC 2012 shows that adolescent fertility rate (AFR) was 81 births per thousand women aged
15 – 19. Results further shows that 23 percent of adolescent girls already had at least one birth at
the time of the Census in 2012. The contribution of adolescent fertility was 1.5 percent to total
fertility rate. These levels are high when compared to developed countries where AFR are less than
10 per 1000 women aged 15 – 19. Adolescent fertility is associated with high maternal and child
death. It is also associated with lower educational attainment and labour force participation rate.
This calls upon the Government and the Civil Society to intervene in reproductive health by
expanding and strengthening Family Life Education in secondary and vocational education
institutions. Since the contribution of adolescent fertility to the total fertility is high the National
Health Policy coupled with other policies such the National Population Policy should be revisited
to incorporate some of the findings of PHC 2012. More social and health interventions in regions
with high adolescent fertility contribution to total fertility like Morogoro, Lindi, Mtwara and Katavi
in Tanzania Mainland and Northern Pemba, South Pemba should be introduced.
7.3.5 Lifetime Fertility
The 2012 Population and Housing Census results show that parity ranges from 0 to 7 for women
aged 12 – 49 years. The mean parity remain close to 18 - 19 years, confirming earlier observations
that, adolescent fertility level in the country is high. Parity Progression Ratio (PPR) reveal that the
probability of a woman having an additional child is high and stable between 83 to 96 percent up to
the sixth child which is slightly above the national TFR of 5.5 children per woman. PPR ranges
between 78 and 70 percent after child number 6, suggesting that a majority of women with already
high parity are likely to pursue additional childbearing.
About four percent (4.4 percent) of women aged 45 – 49 were childless at the time of the Census in
2012. Percentage of childless women was relatively higher among urban women (5.7 percent)
compared to rural women (4.7 percent). Childlessness is an indirect measure of the prevalence of
sterility in a population, although this overestimates the true prevalence of sterility because some of
the childless women at the end of their reproductive period may have not had children for reasons
not related to their physiological ability to become pregnant or to give birth.

65
References
Arriaga, EE ,1983. Estimating fertility from data on children ever-born by age of mother.
International Research Document, No. 11, US Bureau of the Census, Washington DC.
Bledsoe, C. H., & B. Cohen. 1993. Social dynamics of adolescent fertility in sub Saharan Africa,
Washington: National Academy Press.
Bongaarts J. 1978. A framework for analyzing the proximate determinants of fertility. Population
and Development Review, vol 4, no. 1, pp. 105-132.
Brass, W. 1981. “The use Gompertz relational model to estimate fertility,” in Proceedings of the
International Population Conference, Manila, International Union for the Scientific Study of
Population, vol. 3, pp. 345-362. Liège.
Kpedkepo, G.M.K. 1982. Essentials of Demographic Analysis for Africa, Heinmann, London.
Kuznets, S. 1974. “Rural-urban differences in fertility: An international comparison”, Proceedings
of the American Philosophical Society, 118(1): 1-29.
McDonald P. F., Ruzicka L. F., and Caldwell J. C. 1981. Interrelations between nuptiality and
fertility: the evidence from the World Fertility Survey. In, World Fertility Survey Conference 1980:
Record of proceedings, vol 2, pp77- 126.
Michael.P. 1992. Economics for a Developing World, Addison-Wesley
Randall S. 1996. Whose reality? Local perceptions of fertility versus demographic analysis.
Population Studies, vol. 50, no. 2, pp. 221-234
Shapiro, D and B.O. Tambashe 2000. Fertility transition in urban and rural areas of Sub-Saharan
Africa. Revised version of paper presented at the 1999 Chaire Quetelet Symposium in
Demography, Catholic University of Louvain, Louvain-la-Neuve, Pennsylvania State University.
Shryock, H.S., Jacob Siegel et al. 1976. Methods and Materials of Demography, Washington,
D.C:U.S. Government Printing Office
Udjo E. O. 1987. A determinant of fertility and its cultural context among Nigeria’s Kanuri. In,
Ebigbola and Van de Walle (eds.): The cultural roots of African fertility regimes, Ile-Ife, pp. 227-
293.
Udjo E. O. 1989. Age of marriage, polygyny, divorce, re-marriage, and effect on the fertility of the
Kanuri of N. E. Nigeria. Contributed paper, International Union for the Scientific Study of
Population XXIst General Conference (Session F21), New Delhi.
United Nations. 1983. Manual X: Indirect Techniques for Demographic Estimation.
ST/ESA/SER.A/81, New York.
United Republic of Tanzania. 2006. Analytical Report 2002 Census, Volume X. Dar es Salaam

66
United Republic of Tanzania. 2013. Population Distribution by Age and Sex, Volume II. National
Bureau of Statistics and Office of the Chief Government Statistician. Tanzania.
United Republic of Tanzania. 2006. National Population Policy. Ministry of Planning, Economy
and Empowerment. Dar es Salaam, Tanzania.

67
Appendices
Estimation and Adjustment of the 2012 PHC Fertility Data
Estimation of fertility levels for Tanzania and its regions from the 2012 census is based on reported
live births by age of mother in the 12 months preceding the census and reported number of children
ever born by age of mother. However, given the limitations of the 2012 census data explained in
chapter one of this document, several indirect methods were used to estimate adjusted fertility
indicators to evaluate the direct estimates of age-specific and total fertility rates based on births in
the year preceding the census. Finally, a decision about the most plausible level of fertility in
Tanzania and its regions in 2012 has been informed by review of estimated fertility levels and
trends based on the 1988 and 2002 censuses; nationally representative Demographic and Health
Surveys undertaken in 1991, 1996, 1999, 2004 and 2010 (TDHS); and the 2007-08 Tanzania
HIV/AIDS and Malaria Indicator Survey (THMIS).
Direct Estimates of Age-specific and Total Fertility Rates
Because fertility rates based on reported births in the year preceding the census may be subject to
misreporting for reasons having to do with the reference period or with underreporting or over-
reporting for other reasons, analysis of fertility data from censuses conducted in Tanzania and in
other countries has historically involved indirect estimation as a means of assessing data quality, as
the basis for inferring trends, and as the basis for adjusting fertility levels if appropriate. Five
indirect techniques were used to derive alternative fertility estimates from the 2012 census. These
techniques are Brass’s P/F ratio technique, Brass’s relational Gompertz method, a synthetic
intercensal Brass P/F ratio method, Arriaga’s two-census technique (Arriaga et al 1994: 207-211;
United Nations 1983: chapter 2) and the own-children technique (East-West Center 1992).
The P/F ratio and relational Gompertz methods use reported births and children ever born from one
census and make the assumption that fertility is relatively stable over the 15 to 20 years preceding
the inquiry. The synthetic P/F ratio and Arriaga techniques use data from two censuses to allow for
changing fertility during an intercensal period. Each of these methods makes other assumptions
about the data used in estimation, including accurate age reporting by women and roughly
consistent reporting of births and children ever born by women in each 5-year age group (15 to 49).
The own-children technique relies on children and mothers tabulated by age of children and age of
mother plus an estimate of mortality level and pattern in the population. The technique estimates
births during the fifteen years preceding the census from surviving children at different ages and

68
age-specific fertility rates by matching these births to a population of women survived by
enumerated women from the census.
The P/F Ratio Technique
Brass's P/F ratio method is widely used in estimating fertility when the quality of available census
data is unknown or suspect. The P/F ratio technique adjusts an age-specific fertility pattern to a
level of fertility derived from comparison of information on children ever born (parity, P) and
cumulated age-specific fertility (F). Underlying the method is the empirical observation that
respondents, when asked about their fertility, are likely to provide reports which may contain at
least two types of errors: (1) in responding to the question on children ever born, older women
commonly omit some births, possibly a high proportion of the dead rather than the living children,
so that the average parities of women 45-49 cannot be used to measure completed fertility without
some allowance for this omission; and (2) over- or under-representation of births in the 12 months
preceding the census on the part of all women of reproductive age, even though the information on
live births in the 12 months preceding the census generally provides a fair idea of the age pattern of
fertility.
The P/F ratio method has been shown to provide a useful check on the quality of directly estimated
age-specific and total fertility from census data provided that (1) the distribution of numbers of
children ever born is the same for women who report and those who did not report, and (2) fertility
has been constant. If fertility has not been constant but rather, declining, the results of the technique
may be biased upward.2 In analyzing the 2012 census, the ratio of parity to cumulated fertility for
women ages 25-34 was used to adjust all reported age-specific fertility rates because women in the
age group 25-34 are less likely than older women to have memory lapse in reporting their ages and
the number of their children. Brass’s P/F Ratio technique yields an estimate of 6.4 births per
woman, or 1.5 births per woman more than the reported total fertility rate, for the period preceding
the 2012 census. (Table 3.1)
2 In addition, underreporting of children ever born will cause a downward bias in the adjusted estimates. Children who
died in infancy (especially in very early infancy), as well as those living away from home, are the births most likely to
be omitted, especially by older women. Over-reporting of children ever born will cause an upward bias in the adjusted
estimates. Over-reporting of children can sometimes occur when stillbirths, late foetal deaths, or adopted children are
mistakenly included. In addition, if the pattern of fertility taken as the "actual" pattern contains errors, the estimated
age-specific fertility rates will be incorrect. This may also affect the level of the total fertility rate (Arriaga, 2012:246).

69
The Relational Gompertz Technique
The relational Gompertz technique also estimates total fertility rates based on information on the
number of children ever born by age of mother and a pattern of fertility (Brass, 1981). The
technique uses the Gompertz function, which closely follows the pattern of cumulative fertility
rates (Arriaga, 1994). Once the total fertility rate has been estimated, an age-specific fertility rate
pattern can be adjusted to the estimated level as measured by that total fertility rate. The relational
Gompertz technique applied to data from the 2012 census indicates a total fertility rate of 5.9
(Table 3.1).
Arriaga’s Technique
Arriaga’s technique (for two dates) was also used to estimate fertility. This technique uses average
numbers of children ever born in two censuses, and the change in children ever born between the
two censuses for women in each age group, to obtain a set of age-specific fertility rates and a total
fertility rate for the period immediately following the first census and for the period immediately
preceding the second census. Since the technique does not assume that fertility is constant, it can
provide an estimate of fertility when it has been changing. Arriaga’s technique, which provided the
TFR estimate accepted as the best estimate from the 2002 census, indicates that total fertility in
2012 was about 6 births per women. This is an implied decrease of about 0.3 births per women
compared with the 2002 census estimate, but it is also more than one birth per woman higher than
the unadjusted TFR from the 2012 census.
The Synthetic Intercensal P/F Ratio Technique
A second method suited to estimation of fertility level when fertility has been declining, known as
the synthetic intercensal P/F ratio technique, was also used to estimate TFR for the 2002-2012
intercensal period. This technique uses average parity and cumulated average age-specific fertility
rates from two censuses to calculate a P/F ratio, using that ratio to adjust reported age-specific
fertility (United Nations 1983: 41-45). TFR as measured by the synthetic intercensal P/F ratio
technique is 6.3.
The Own-Children Technique
This technique provides estimates of age-specific and total fertility for each of 15 years preceding
the inquiry using matched children and their mothers, the ages of those children and mothers, and
an index of mortality to reverse-survive children and mothers. Census data on births and children

70
ever born are not required by this method. The own-children technique estimate of TFR from the
2012 census is slightly lower -- between 5.3 (mean value for 2006-2010) and 5.4 (mean for 2007 to
2009) using an estimate of life expectancy at birth of 60 years and Coale-Demeny North model
mortality.
Determination of a Most Likely Estimate of Fertility for 2012
Table 3.15 presents age-specific and total fertility rates from the 2002 and 2012 censuses either
directly estimated from reported births during the 12 months preceding the census or as indirectly
estimated using each of the methods discussed. The range of TFR estimates for 2012 is 4.9 births
per woman (reported) to 6.4 births per woman (P/F ratio technique). The reported TFR level of 4.9
is likely to be too low, reflecting a history of underreporting of births in Tanzanian censuses, but
some additional information may be useful in making a choice of most likely TFR level for 2012.
Summary of Results of Methods Used to Determine a Most Likely Total Fertility Rate from
the 2012 Census
Age Reported Brass P/F Ratio
Relational Gompertz
Arriaga* Synthetic P/F ratio
Own-children
2002 2012 2002 2012 2012 2002 2012 2002-12 2006-10
15-19 0.065 0.0721 0.1234 0.1126 5.884 0.1131 0.095 0.0954 0.128
20-24 0.186 0.203 0.3029 0.2754 5.859 0.2898 0.237 0.2706 0.235
25-29 0.190 0.221 0.2979 0.2887 5.897 0.2866 0.249 0.2871 0.235
30-34 0.167 0.1988 0.2581 0.2553 5.912 0.2481 0.221 0.2555 0.201
35-39 0.127 0.1568 0.1935 0.1986 5.912 0.1848 0.171 0.1983 0.146
40-44 0.068 0.0886 0.0988 0.1063 5.868 0.0957 0.093 0.1090 0.076
45-49 0.029 0.0417 0.0372 0.0463 5.970 0.0339 0.039 0.0482 0.035
TFR 4.2 4.9 6.6 6.4 5.9 6.3 5.5 6.3 5.3 ‘* Estimates shown for 2002 are based on the 1988 and 2002 censuses; for 2012, on the 2002 and 2012 censuses
Figure shows these estimates of TFR along with estimates from the 1988 census, and 5-year
average TFRs from five Demographic and Health Surveys (DHS). The Arriaga technique estimates
from the 1988, 2002 and 2012 censuses show a slowly declining trend in total fertility culminating
in a level of 6 births per woman in 2012. The Brass P/F ratio estimates, relational Gompertz, and
synthetic P/F ratio estimates suggest similarly high TFRs, at or close to 6 births per woman.
These estimates all may be on the high side because of the historically higher fertility reflected in
the children ever born used to adjust fertility patterns in these methods. In contrast, the DHS direct
estimates, based on pregnancy history data, suggest a slowly declining TFR trend but at a lower

71
level. Specifically, averages of the two DHS estimates for periods 0-4 and 5-9 years prior to each
survey are circled to draw attention to the fact that DHS surveys in Tanzania consistently exhibit
more rapidly declining TFRs for each survey than does the data for the surveys taken collectively.
The average TFR estimates for periods 0-4 and 5-9 years prior to each survey from the five DHS
surveys indicate a relatively slow decline in TFR over time, a trend implying a value of about 5.5
births per woman for 2012.
The own-children technique, derived from a cross-tabulation of mothers and children by age from
the 2012 CPH, suggests a TFR of roughly 5.3 births per woman for the 5-year period preceding the
census, or a level of around 5.5 births per woman in 2012. Taken together, estimates from the 2012
CPH suggest a possible range of total fertility of 4.9 to 6.4 births per woman for 2012, centered on
a value of around 5.6 births per woman. The DHS survey trendline and own-children estimate for
the period preceding the 2012 census strongly suggests that a TFR estimate of about 5.5 births per
woman may be the most likely case, and this is the level accepted for the 2012 census. This
analysis also suggests that the relatively high indirect estimates reported for the 1988 and 2002
censuses may have been high.
Total Fertility Rate Estimates from Censuses and Surveys Data, 1982
4.5
5.0
5.5
6.0
6.5
7.0
7.5
1980 1985 1990 1995 2000 2005 2010 2015
DHS 1991-92 DHS 1996 DHS 1999
DHS 2004 2002 PHC indirect DHS 2010
Synthetic P/F ratio 2002-12 2012 PHC direct 2012 PHC BrassP/F
2012 PHC Arriaga RelGompertz 1988 PHC indirect
Note
The largest circles on this chart are the averages of the TDHS direct estimates for periods of 0-4 and 5-9
years preceding the survey

72
Appendix I: Mean Number of Children Ever Born 2002 and 2012
Appendix II: Adjusted Age Specific Fertility Rates, 2012
Region Age group
15-19 20-24 25-29 30-34 35-39 40-44 45-49
Tanzania 0.095 0.238 0.250 0.221 0.172 0.093 0.039
Tanzania Mainland 0.097 0.240 0.250 0.220 0.170 0.092 0.039
Dodoma 0.111 0.262 0.260 0.232 0.184 0.098 0.039
Arusha 0.055 0.185 0.205 0.177 0.131 0.073 0.037
Kilimanjaro 0.052 0.197 0.210 0.186 0.131 0.065 0.023
Tanga 0.091 0.250 0.260 0.226 0.171 0.096 0.037
Morogoro 0.112 0.212 0.211 0.187 0.147 0.073 0.032
Pwani 0.093 0.202 0.204 0.183 0.142 0.082 0.032
Dar es Salaam 0.045 0.145 0.176 0.159 0.106 0.057 0.031
Lindi 0.114 0.208 0.192 0.160 0.135 0.082 0.033
Mtwara 0.115 0.193 0.172 0.145 0.117 0.064 0.024
Ruvuma 0.109 0.223 0.213 0.182 0.136 0.079 0.031
Iringa 0.065 0.217 0.227 0.193 0.134 0.059 0.021
Mbeya 0.105 0.235 0.235 0.194 0.145 0.074 0.030
Singida 0.108 0.304 0.329 0.298 0.237 0.135 0.064
Tabora 0.149 0.297 0.301 0.274 0.211 0.113 0.062
Rukwa 0.151 0.318 0.312 0.277 0.232 0.125 0.054
Kigoma 0.098 0.287 0.326 0.306 0.247 0.129 0.062
Shinyanga 0.114 0.260 0.278 0.242 0.190 0.098 0.039
Kagera 0.096 0.306 0.300 0.250 0.193 0.105 0.030
Mwanza 0.104 0.278 0.302 0.269 0.218 0.124 0.053
Mara 0.142 0.307 0.313 0.273 0.208 0.108 0.049
Manyara 0.084 0.255 0.293 0.266 0.206 0.103 0.045
Njombe 0.062 0.215 0.207 0.164 0.124 0.055 0.016
Katavi 0.164 0.299 0.302 0.280 0.228 0.130 0.067
Simiyu 0.120 0.311 0.350 0.329 0.265 0.142 0.067
Geita 0.149 0.348 0.362 0.335 0.269 0.159 0.069
Tanzania Zanzibar 0.043 0.179 0.243 0.242 0.193 0.096 0.034
Kaskazini Unguja 0.036 0.191 0.263 0.262 0.217 0.084 0.046
Kusini Unguja 0.056 0.187 0.229 0.224 0.165 0.077 0.022
Mjini Magharibi 0.032 0.137 0.203 0.214 0.163 0.079 0.027
Kaskazini Pemba 0.059 0.276 0.360 0.333 0.263 0.131 0.048
Kusini Pemba 0.071 0.277 0.346 0.323 0.266 0.165 0.038
Pi Age Group Tanzania Tanzania Mainland Tanzania Zanzibar
2002 2012 2002 2012 2002 2012
1 15-19 0.286 0.337 0.291 0.343 0.132 0.170
2 20-24 1.508 1.421 1.519 1.437 1.132 0.942
3 25-29 2.890 2.731 2.893 2.746 2.765 2.271
4 30-34 4.284 3.946 4.279 3.952 4.444 3.746
5 35-39 5.458 4.949 5.437 4.942 6.067 5.166
6 40-44 6.451 5.600 6.430 5.583 7.106 6.113
7 45-49 7.078 5.945 7.062 5.924 7.655 6.510

73
Appendix III: Mean Number of Children Ever Born by Region, 2012
Pi 1 2 3 4 5 6 7
Region 15-19 20-24 25-29 30-34 35-39 40-44 45-49
Tanzania 0.337 1.421 2.731 3.946 4.949 5.600 5.945
Tanzania Mainland 0.343 1.437 2.746 3.952 4.942 5.583 5.924
Dodoma 0.360 1.552 2.910 4.150 5.194 5.944 6.197
Arusha 0.203 1.072 2.171 3.200 4.048 4.663 5.150
Kilimanjaro 0.187 1.047 2.137 3.227 4.109 4.731 5.109
Tanga 0.306 1.423 2.795 3.996 4.896 5.531 5.980
Morogoro 0.380 1.424 2.591 3.636 4.581 5.209 5.588
Pwani 0.344 1.363 2.500 3.585 4.468 5.144 5.517
Dar es Salaam 0.160 0.823 1.705 2.590 3.285 3.848 4.546
Lindi 0.376 1.422 2.448 3.443 4.290 4.879 5.416
Mtwara 0.377 1.338 2.297 3.193 3.835 4.374 4.702
Ruvuma 0.374 1.475 2.654 3.690 4.534 5.067 5.400
Iringa 0.207 1.141 2.394 3.564 4.543 5.216 5.546
Mbeya 0.309 1.369 2.731 3.960 4.915 5.543 5.906
Singida 0.361 1.618 3.192 4.644 5.787 6.546 6.562
Tabora 0.584 1.918 3.387 4.749 5.825 6.294 6.619
Rukwa 0.437 1.851 3.499 5.001 6.219 6.927 7.079
Kigoma 0.321 1.527 3.220 4.759 6.013 6.846 7.121
Shinyanga 0.479 1.746 3.172 4.495 5.504 5.997 6.208
Kagera 0.284 1.586 3.193 4.613 5.750 6.476 6.804
Mwanza 0.399 1.623 3.175 4.603 5.754 6.382 6.620
Mara 0.465 1.901 3.491 4.899 5.860 6.370 6.424
Manyara 0.278 1.369 2.854 4.264 5.488 6.234 6.674
Njombe 0.196 1.137 2.318 3.435 4.321 4.931 5.338
Katavi 0.554 1.972 3.433 4.850 6.003 6.545 6.904
Simiyu 0.539 1.868 3.521 5.049 6.231 6.781 6.876
Geita 0.480 1.997 3.728 5.123 6.222 6.803 6.869
Tanzania Zanzibar 0.170 0.942 2.271 3.746 5.166 6.113 6.510
Kaskazini Unguja 0.156 0.930 2.468 4.227 5.672 6.560 6.532
Kusini Unguja 0.224 1.100 2.315 3.511 4.823 5.752 6.447
Mjini Magharibi 0.135 0.739 1.824 3.086 4.357 5.238 5.888
Kaskazini Pemba 0.205 1.335 3.173 5.042 6.497 7.227 7.124
Kusini Pemba 0.222 1.262 3.053 4.998 6.453 7.505 7.721
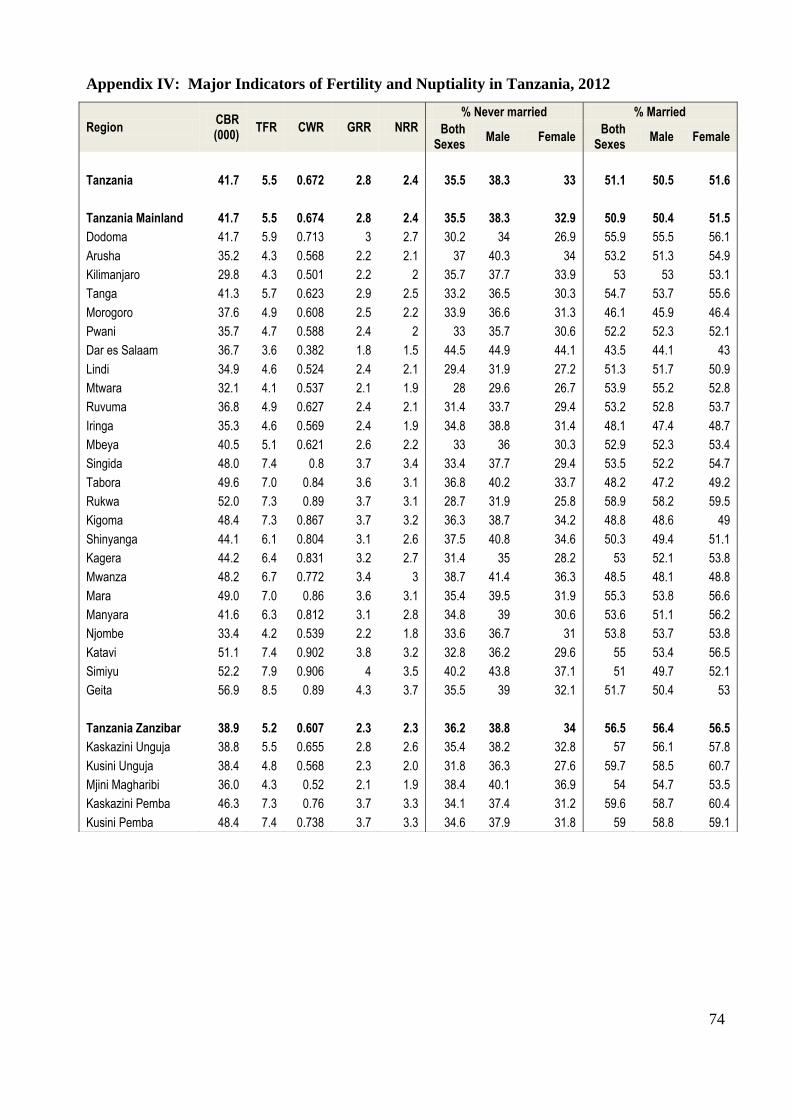
74
Appendix IV: Major Indicators of Fertility and Nuptiality in Tanzania, 2012
Region CBR (000)
TFR CWR GRR NRR % Never married % Married
Both Sexes
Male Female Both
Sexes Male Female
Tanzania 41.7 5.5 0.672 2.8 2.4 35.5 38.3 33 51.1 50.5 51.6
Tanzania Mainland 41.7 5.5 0.674 2.8 2.4 35.5 38.3 32.9 50.9 50.4 51.5
Dodoma 41.7 5.9 0.713 3 2.7 30.2 34 26.9 55.9 55.5 56.1
Arusha 35.2 4.3 0.568 2.2 2.1 37 40.3 34 53.2 51.3 54.9
Kilimanjaro 29.8 4.3 0.501 2.2 2 35.7 37.7 33.9 53 53 53.1
Tanga 41.3 5.7 0.623 2.9 2.5 33.2 36.5 30.3 54.7 53.7 55.6
Morogoro 37.6 4.9 0.608 2.5 2.2 33.9 36.6 31.3 46.1 45.9 46.4
Pwani 35.7 4.7 0.588 2.4 2 33 35.7 30.6 52.2 52.3 52.1
Dar es Salaam 36.7 3.6 0.382 1.8 1.5 44.5 44.9 44.1 43.5 44.1 43
Lindi 34.9 4.6 0.524 2.4 2.1 29.4 31.9 27.2 51.3 51.7 50.9
Mtwara 32.1 4.1 0.537 2.1 1.9 28 29.6 26.7 53.9 55.2 52.8
Ruvuma 36.8 4.9 0.627 2.4 2.1 31.4 33.7 29.4 53.2 52.8 53.7
Iringa 35.3 4.6 0.569 2.4 1.9 34.8 38.8 31.4 48.1 47.4 48.7
Mbeya 40.5 5.1 0.621 2.6 2.2 33 36 30.3 52.9 52.3 53.4
Singida 48.0 7.4 0.8 3.7 3.4 33.4 37.7 29.4 53.5 52.2 54.7
Tabora 49.6 7.0 0.84 3.6 3.1 36.8 40.2 33.7 48.2 47.2 49.2
Rukwa 52.0 7.3 0.89 3.7 3.1 28.7 31.9 25.8 58.9 58.2 59.5
Kigoma 48.4 7.3 0.867 3.7 3.2 36.3 38.7 34.2 48.8 48.6 49
Shinyanga 44.1 6.1 0.804 3.1 2.6 37.5 40.8 34.6 50.3 49.4 51.1
Kagera 44.2 6.4 0.831 3.2 2.7 31.4 35 28.2 53 52.1 53.8
Mwanza 48.2 6.7 0.772 3.4 3 38.7 41.4 36.3 48.5 48.1 48.8
Mara 49.0 7.0 0.86 3.6 3.1 35.4 39.5 31.9 55.3 53.8 56.6
Manyara 41.6 6.3 0.812 3.1 2.8 34.8 39 30.6 53.6 51.1 56.2
Njombe 33.4 4.2 0.539 2.2 1.8 33.6 36.7 31 53.8 53.7 53.8
Katavi 51.1 7.4 0.902 3.8 3.2 32.8 36.2 29.6 55 53.4 56.5
Simiyu 52.2 7.9 0.906 4 3.5 40.2 43.8 37.1 51 49.7 52.1
Geita 56.9 8.5 0.89 4.3 3.7 35.5 39 32.1 51.7 50.4 53
Tanzania Zanzibar 38.9 5.2 0.607 2.3 2.3 36.2 38.8 34 56.5 56.4 56.5
Kaskazini Unguja 38.8 5.5 0.655 2.8 2.6 35.4 38.2 32.8 57 56.1 57.8
Kusini Unguja 38.4 4.8 0.568 2.3 2.0 31.8 36.3 27.6 59.7 58.5 60.7
Mjini Magharibi 36.0 4.3 0.52 2.1 1.9 38.4 40.1 36.9 54 54.7 53.5
Kaskazini Pemba 46.3 7.3 0.76 3.7 3.3 34.1 37.4 31.2 59.6 58.7 60.4
Kusini Pemba 48.4 7.4 0.738 3.7 3.3 34.6 37.9 31.8 59 58.8 59.1

75
Appendix V: Recorded and Adjusted Crude Birth Rate by Region, 1967-2012 Censuses
Region 1967 1978 1988 2002 2012
Recorded Adjusted Recorded Adjusted Recorded Adjusted Recorded Adjusted Recorded Adjusted
Tanzania NA 47 46 49 38 47 35 43 36 41.7
Tanzania Mainland NA 47 46 49 38 47 35 43 37 41.7
Dodoma 61 48 44 52 40 48 35 44 37 41.7
Arusha 56 47 48 48 40 46 33 43 31 35.2
Kilimanjaro 57 51 46 48 38 47 28 36 24 29.8
Tanga 58 46 42 47 35 46 33 40 34 41.3
Morogoro 50 44 48 45 34 45 31 41 32 37.6
Pwani 48 37 40 35 34 33 30 38 32 35.7
Dar es Salaam NA 33 42 48 34 38 24 35 30 36.7
Lindi NA
41 43 34 42 28 37 30 34.9
Mtwara 49 35 38 47 34 44 28 36 31 32.1
Ruvuma 62 46 44 47 35 46 30 41 35 36.8
Iringa 58 55 45 53 35 49 30 40 31 35.3
Mbeya 62 52 46 55 36 51 32 42 33 40.5
Singida 55 45 40 47 41 46 35 43 40 48.0
Tabora 55 40 43 45 38 45 35 48 43 49.6
Rukwa
56 62 42 52 39 52 50 52.0
Kigoma 54 43 54 52 42 47 43 56 42 48.4
Shinyanga 65 51 48 49 47 51 41 49 39 44.1
Kagera 53 50 48 49 46 49 42 48 41 44.2
Mwanza 62 49 48 51 43 50 40 46 41 48.2
Mara 62 52 68 53 42 53 42 47 43 49.0
Manyara NA NA NA NA NA NA 38 46 36 41.6
Njombe NA NA NA NA NA NA NA NA 16 33.4
Katavi NA NA NA NA NA NA NA NA NA 51.1
Simiyu NA NA NA NA NA NA NA NA 50 52.2
Geita NA NA NA NA NA NA NA NA
56.9
Tanzania Zanzibar 58 48 48 48 45 49 32 43 35 38.9
Kaskazini Unguja NA NA 47 46 47 44 31 43 33 38.8
Kusini Unguja NA NA 39 41 42 46 28 38 38 38.4
Mjini Magharibi NA NA 47 47 40 51 30 42 31 36.0
Kaskazini Pemba NA NA 54 53 47 52 36 46 38 46.3
Kusini Pemba NA NA 53 48 51 51 35 45 42 48.4
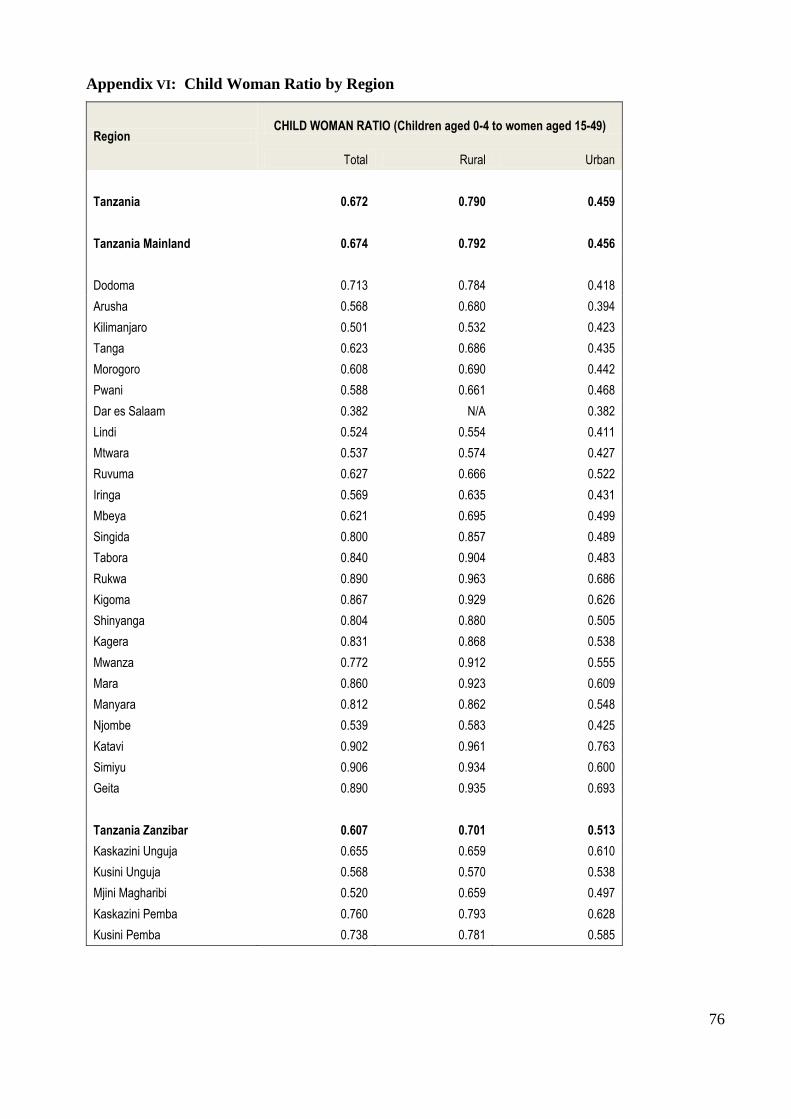
76
Appendix VI: Child Woman Ratio by Region
Region CHILD WOMAN RATIO (Children aged 0-4 to women aged 15-49)
Total Rural Urban
Tanzania 0.672 0.790 0.459
Tanzania Mainland 0.674 0.792 0.456
Dodoma 0.713 0.784 0.418
Arusha 0.568 0.680 0.394
Kilimanjaro 0.501 0.532 0.423
Tanga 0.623 0.686 0.435
Morogoro 0.608 0.690 0.442
Pwani 0.588 0.661 0.468
Dar es Salaam 0.382 N/A 0.382
Lindi 0.524 0.554 0.411
Mtwara 0.537 0.574 0.427
Ruvuma 0.627 0.666 0.522
Iringa 0.569 0.635 0.431
Mbeya 0.621 0.695 0.499
Singida 0.800 0.857 0.489
Tabora 0.840 0.904 0.483
Rukwa 0.890 0.963 0.686
Kigoma 0.867 0.929 0.626
Shinyanga 0.804 0.880 0.505
Kagera 0.831 0.868 0.538
Mwanza 0.772 0.912 0.555
Mara 0.860 0.923 0.609
Manyara 0.812 0.862 0.548
Njombe 0.539 0.583 0.425
Katavi 0.902 0.961 0.763
Simiyu 0.906 0.934 0.600
Geita 0.890 0.935 0.693
Tanzania Zanzibar 0.607 0.701 0.513
Kaskazini Unguja 0.655 0.659 0.610
Kusini Unguja 0.568 0.570 0.538
Mjini Magharibi 0.520 0.659 0.497
Kaskazini Pemba 0.760 0.793 0.628
Kusini Pemba 0.738 0.781 0.585

77
Appendix VII: Mean at First Marriage and Age First Birth by Region and District
Region Average Age at First Marriage Ave Age First Birth
District Total Males Females Age
difference Age FB - Mar diff
Tanzania Total 23.9 25.5 22.3 3.2 20.2 2.1
Tanzania Rural 23.4 25.1 21.8 3.3 19.3 2.5
Tanzania Urban 24.6 26.3 23.2 3.1 21.7 1.5
Tanzania Mainland Total 23.8 25.5 22.3 3.2 20.1 2.2
Tanzania Mainland Rural 23.4 25.1 21.8 3.3 19.3 2.5
Tanzania Mainland Urban 24.6 26.2 23.1 3.1 21.6 1.5
Zanzibar Total 24.8 26.3 23.5 2.8 22.9 0.6
Zanzibar Rural 23.6 25.3 22.1 3.2 21.9 0.2
Zanzibar Urban 25.9 27.3 24.7 2.6 23.9 0.8
Dodoma 23.0 24.8 21.4 3.4 19.9 1.5
Kondoa District Council 23.4 25.8 21.2 4.6 20.3 0.9
Mpwapwa District Council 22.6 24.1 21.3 2.9 19.6 1.6
Kongwa District Council 22.8 24.3 21.3 3.0 19.0 2.3
Chamwino District Council 22.3 24.0 20.7 3.4 19.2 1.4
Dodoma Municipal Council 24.4 25.8 23.1 2.7 21.8 1.3
Bahi District Council 22.3 24.1 20.7 3.3 18.7 2.1
Chemba District Council 22.3 24.7 20.0 4.8 19.1 0.9
Arusha 24.2 26.2 22.5 3.7 22.0 0.5
Monduli District Council 23.5 26.1 21.4 4.7 20.7 0.6
Meru District Council 24.5 26.2 23.0 3.2 22.2 0.8
Arusha City Council 24.8 26.3 23.3 3.0 23.5 -0.2
Karatu District Council 25.4 26.8 24.1 2.7 22.4 1.7
Ngorongoro District Council 22.7 26.2 20.2 6.0 19.5 0.6
Arusha District Council 24.2 26.0 22.6 3.4 22.3 0.3
Longido District Council 23.3 26.4 21.0 5.4 20.0 1.0
Kilimanjaro 25.0 26.5 23.6 3.0 22.0 1.6
Rombo District Council 25.9 27.2 24.8 2.4 22.2 2.5
Mwanga District Council 25.0 26.7 23.5 3.2 21.1 2.4
Same District Council 23.7 25.2 22.2 3.1 20.8 1.3
Moshi District Council 25.8 27.1 24.5 2.6 22.0 2.5
Hai District Council 25.1 26.8 23.5 3.3 22.5 1.0
Moshi Municipal Council 25.1 26.6 23.6 3.0 23.4 0.2
Siha District Council 23.9 26.1 21.9 4.2 21.2 0.8
Tanga 24.0 25.8 22.5 3.3 20.6 1.9
Lushoto District Council 23.7 25.5 22.4 3.1 21.2 1.2
Korogwe District Council 23.9 25.9 22.3 3.5 20.4 1.9
Muheza District Council 24.4 26.1 23.0 3.1 20.5 2.5
Tanga City Council 25.4 26.8 24.2 2.5 22.1 2.2
Pangani District Council 24.3 25.7 23.3 2.4 20.1 3.2
Handeni District Council 23.4 25.4 21.7 3.7 19.4 2.3
Kilindi District Council 22.4 24.8 20.3 4.5 18.4 1.9
Mkinga District Council 24.4 26.0 23.2 2.9 19.5 3.6
Korogwe Town Council 24.9 26.4 23.6 2.9 21.3 2.3
Handeni Town Council 24.6 26.2 23.3 2.9 20.3 3.0
Morogoro 23.5 25.2 21.9 3.4 19.7 2.1
Kilosa District Council 22.9 24.7 21.2 3.5 18.8 2.4
Morogoro District Council 23.5 25.3 21.9 3.4 19.3 2.6
Kilombero District Council 23.6 25.4 21.9 3.5 20.1 1.8
Ulanga District Council 23.5 25.3 21.8 3.5 19.5 2.3
Morogoro Municipal Council 25.0 26.6 23.7 2.8 22.1 1.6

78
Mvomero District Council 23.3 25.1 21.5 3.6 19.5 2.0
Gairo District Council 22.2 23.6 20.8 2.7 18.3 2.5
Table . Average Age at First Marriage and First Birth, Tanzania: 2012 -- continued Region Average Age at First Marriage Ave Age First Birth
District Total Males Females Age
difference Age FB - Mar diff
Pwani 24.0 25.6 22.6 3.1 20.1 2.4
Bagamoyo District Council 24.0 25.5 22.6 2.9 20.1 2.5
Kibaha District Council 24.6 26.1 23.2 2.9 21.0 2.3
Kisarawe District Council 24.3 25.8 23.0 2.8 20.5 2.5
Mkuranga District Council 24.0 25.6 22.7 2.9 20.1 2.6
Rufiji District Council 23.4 25.3 21.9 3.5 18.9 2.9
Mafia District Council 23.3 25.2 21.7 3.5 20.4 1.3
Kibaha Town Council 25.0 26.6 23.3 3.3 22.0 1.3
Dar es Salaam 25.1 26.8 23.6 3.2 23.1 0.5
Kinondoni Municipal Council 25.3 26.8 23.9 3.0 23.4 0.5
Ilala Municipal Council 25.1 26.7 23.6 3.1 23.0 0.7
Temeke Municipal Council 24.9 26.8 23.1 3.7 22.9 0.2
Lindi 23.3 24.9 21.8 3.2 19.5 2.3
Kilwa District Council 23.3 25.4 21.4 4.0 19.6 1.8
Lindi District Council 23.2 24.9 21.8 3.2 18.9 2.9
Nachingwea District Council 22.7 24.0 21.4 2.6 19.5 1.9
Liwale District Council 23.5 25.2 22.1 3.1 19.5 2.6
Ruangwa District Council 23.5 25.0 22.2 2.8 19.2 3.0
Lindi Municipal Council 24.8 26.3 23.5 2.8 20.5 3.0
Mtwara 22.7 24.1 21.5 2.6 19.3 2.2
Mtwara District Council 22.7 24.5 21.2 3.3 18.8 2.4
Newala District Council 22.8 24.1 21.7 2.4 19.1 2.6
Masasi District Council 22.2 23.1 21.3 1.8 18.7 2.7
Tandahimba District Council 22.5 24.3 20.9 3.3 18.8 2.2
Mtwara Municipal Council 24.5 26.0 23.3 2.6 21.7 1.6
Nanyumbu District Council 22.0 23.2 21.0 2.2 18.2 2.8
Masasi Town Council 22.8 23.8 21.9 1.9 20.2 1.7
Ruvuma 22.9 24.4 21.6 2.8 19.4 2.1
Tunduru District Council 22.5 24.0 21.2 2.8 18.9 2.3
Songea District Council 23.7 25.5 22.0 3.4 19.4 2.6
Mbinga District Council 22.3 23.6 21.1 2.5 19.6 1.5
Songea Municipal Council 24.4 25.7 23.2 2.5 20.8 2.4
Namtumbo District Council 23.5 25.1 22.0 3.1 19.0 3.0
Nyasa District Council 22.4 23.6 21.2 2.5 18.6 2.5
Iringa 24.0 25.5 22.7 2.8 21.3 1.4
Iringa District Council 23.9 25.5 22.3 3.2 20.5 1.8
Mufindi District Council 23.6 25.0 22.4 2.6 21.0 1.4
Iringa Municipal Council 25.6 26.8 24.5 2.3 22.8 1.7
Kilolo District Council 23.7 25.3 22.2 3.0 20.6 1.6
Mafinga Town Council 24.3 25.5 23.4 2.1 22.4 1.0
Mbeya 22.8 24.5 21.3 3.3 20.1 1.1
Chunya District Council 22.8 24.9 20.8 4.1 18.0 2.9
Mbeya District Council 22.6 24.2 21.2 3.0 20.4 0.9
Kyela District Council 23.1 24.8 21.6 3.2 20.1 1.5
Rungwe District Council 23.7 25.2 22.4 2.8 20.7 1.7
Ileje District Council 22.3 23.9 20.9 3.0 20.7 0.2
Mbozi District Council 22.1 23.6 20.6 3.0 20.0 0.6
Mbarali District Council 23.0 24.8 21.4 3.3 19.6 1.8
Mbeya City Council 24.4 25.8 23.2 2.6 22.7 0.4

79
Momba District Council 20.3 22.5 18.2 4.3 18.0 0.3
Tunduma Town Council 22.4 24.1 21.4 2.7 21.0 0.4
Table . Average Age at First Marriage and First Birth, Tanzania: 2012 -- continued Region Average Age at First Marriage Ave Age First Birth
District Total Males Females Age
difference Age FB - Mar diff
Singida 23.8 25.8 22.0 3.8 19.6 2.4
Iramba District Council 24.1 26.0 22.2 3.8 18.9 3.4
Singida District Council 23.5 25.5 21.5 3.9 19.7 1.8
Manyoni District Council 23.3 25.3 21.5 3.8 18.8 2.6
Singida Municipal Council 24.4 26.2 22.7 3.4 21.9 0.9
Ikungi District Council 24.2 26.3 22.2 4.0 19.9 2.3
Mkalama District Council 23.7 25.4 22.1 3.3 19.3 2.8
Tabora 23.8 25.6 22.3 3.3 19.0 3.3
Nzega District Council 24.1 25.7 22.8 2.8 19.6 3.2
Igunga District Council 24.5 26.3 22.9 3.4 19.3 3.7
Uyui District Council 24.0 25.6 22.6 3.0 18.4 4.2
Urambo District Council 23.8 25.6 22.0 3.5 19.0 3.0
Sikonge District Council 23.4 25.1 21.8 3.3 18.4 3.4
Tabora Municipal Council 24.5 26.1 23.0 3.1 21.1 1.9
Kaliua District Council 22.8 24.8 21.0 3.8 18.0 3.0
Rukwa 21.7 23.2 20.3 2.9 18.9 1.4
Kalambo District Council 20.8 22.2 19.5 2.6 18.2 1.4
Sumbawanga District Council 21.1 22.8 19.6 3.3 18.4 1.1
Nkasi District Council 22.0 23.6 20.6 2.9 18.8 1.9
Sumbawanga Municipal Council 22.7 24.1 21.5 2.6 20.5 1.0
Kigoma 23.3 24.6 22.0 2.6 20.2 1.8
Kibondo District Council 21.7 23.0 20.5 2.4 19.6 0.9
Kasulu District Council 22.7 23.8 21.8 2.0 19.3 2.4
Kigoma District Council 24.6 26.1 23.4 2.7 20.7 2.7
Kigoma-Ujiji Municipal Council 25.3 27.0 23.7 3.3 21.9 1.8
Uvinza District Council 23.4 25.1 21.8 3.2 19.3 2.5
Buhigwe District Council 23.4 24.8 22.3 2.5 21.1 1.2
Kakonko District Council 21.9 23.2 20.7 2.5 19.8 0.9
Kasulu Town Council 23.9 25.3 22.7 2.6 21.0 1.7
Shinyanga 24.3 26.0 22.7 3.3 19.5 3.2
Shinyanga Municipal Council 24.9 26.6 23.3 3.2 21.5 1.8
Kishapu District Council 25.1 26.9 23.4 3.5 19.5 3.9
Shinyanga District Council 24.4 26.1 22.9 3.2 18.7 4.2
Kahama District Council 23.7 25.4 22.1 3.3 18.7 3.5
Kahama Town Council 23.5 25.3 21.9 3.4 20.1 1.8
Kagera 22.6 24.2 21.1 3.1 20.3 0.8
Karagwe District Council 22.5 24.1 20.9 3.2 20.8 0.1
Bukoba District Council 23.6 25.1 22.1 3.0 20.4 1.7
Muleba District Council 23.2 25.1 21.5 3.6 20.6 0.9
Biharamulo District Council 22.1 23.7 20.7 3.0 19.4 1.3
Ngara District Council 21.8 23.1 20.7 2.4 20.2 0.4
Bukoba Municipal Council 24.0 26.0 22.2 3.7 21.7 0.6
Missenyi District Council 23.4 25.2 21.7 3.5 20.5 1.2
Kyerwa District Council 21.8 23.4 20.3 3.1 19.4 0.9
Mwanza 24.6 26.1 23.1 3.0 20.1 3.0
Ukerewe District Council 24.6 25.9 23.4 2.5 19.5 3.9
Magu District Council 24.5 26.2 22.9 3.2 19.8 3.1
Nyamagana Municipal Council 24.1 25.8 22.5 3.3 21.6 1.0

80
Kwimba District Council 24.8 26.5 23.3 3.2 19.1 4.3
Sengerema District Council 24.3 25.9 22.7 3.2 19.4 3.3
Ilemela Municipal Council 24.6 26.2 23.3 2.9 21.8 1.5
Misungwi District Council 24.9 26.4 23.5 2.9 19.5 4.0
Table . Average Age at First Marriage and First Birth, Tanzania: 2012 -- continued Region Average Age at First Marriage Ave Age First Birth
District Total Males Females Age
difference Age FB - Mar diff
Mara 23.6 25.5 21.9 3.7 19.0 2.8
Tarime District Council 21.9 24.1 20.1 4.0 18.6 1.5
Serengeti District Council 23.2 25.4 21.2 4.2 19.1 2.1
Musoma District Council 24.8 26.5 23.3 3.2 19.3 4.1
Bunda District Council 24.3 26.0 22.8 3.3 19.3 3.5
Musoma Municipal Council 24.6 26.3 23.1 3.2 20.3 2.8
Rorya District Council 22.9 24.9 21.2 3.7 18.4 2.8
Butiama District Council 24.4 26.3 22.7 3.6 18.8 3.9
Manyara 24.0 26.0 22.2 3.7 20.9 1.3
Babati District Council 24.3 26.0 22.7 3.2 20.9 1.8
Hanang District Council 24.2 26.0 22.3 3.6 21.3 1.0
Mbulu District Council 25.0 26.3 23.7 2.5 21.9 1.8
Simanjiro District Council 22.7 25.8 20.0 5.8 19.6 0.4
Kiteto District Council 22.6 24.9 20.6 4.4 19.3 1.3
Babati Town Council 24.6 26.5 22.7 3.9 21.7 1.0
Njombe 23.6 25.1 22.5 2.6 21.5 1.0
Njombe Town Council 24.6 25.9 23.5 2.5 22.4 1.1
Wang'ing'ombe District Council 23.8 25.3 22.5 2.7 21.3 1.2
Makete District Council 23.7 25.0 22.6 2.5 22.0 0.6
Njombe District Council 24.6 25.9 23.5 2.5 20.9 2.6
Ludewa District Council 23.5 25.0 22.2 2.8 20.1 2.0
Makambako Town Council 23.5 24.9 22.3 2.5 22.1 0.2
Katavi 22.9 24.8 21.1 3.8 18.4 2.6
Mpanda Town Council 23.3 25.2 21.8 3.4 19.9 1.8
Mpanda District Council 22.7 25.1 20.4 4.6 17.2 3.2
Mlele District Council 22.7 24.5 21.0 3.5 18.4 2.7
Simiyu 24.9 26.8 23.4 3.4 19.4 4.0
Bariadi District Council 24.5 26.5 22.7 3.8 19.5 3.2
Itilima District Council 25.2 27.1 23.7 3.3 19.4 4.4
Meatu District Council 25.4 27.0 24.0 3.0 19.3 4.7
Maswa District Council 25.0 26.7 23.6 3.1 19.7 3.9
Busega District Council 24.4 26.4 22.7 3.7 19.2 3.5
Geita 23.3 25.0 21.7 3.4 18.9 2.8
Geita District Council 23.4 25.0 21.8 3.2 18.8 3.0
Nyang'hwale District Council 24.1 25.7 22.6 3.1 18.1 4.5
Mbogwe District Council 23.5 25.2 21.9 3.3 19.0 3.0
Bukombe District Council 22.6 24.5 20.9 3.7 19.1 1.8
Chato District Council 23.0 24.8 21.3 3.5 19.2 2.1
Kaskazini Unguja 24.1 25.7 22.6 3.1 22.9 -0.3
Kaskazini A District 24.3 26.0 22.8 3.1 23.3 -0.5
Kaskazini B District 23.8 25.3 22.2 3.2 22.2 -0.1
Kusini Unguja 23.7 25.4 22.0 3.4 21.9 0.1
Kati District 23.7 25.5 22.0 3.4 22.0 0.0
Kusini District 23.6 25.4 22.0 3.4 21.7 0.3
Mjini Magharibi 25.6 27.0 24.4 2.6 23.7 0.8
Magharibi District 24.2 25.7 22.9 2.7 22.5 0.4
Mjini District 26.6 27.9 25.4 2.5 24.6 0.8
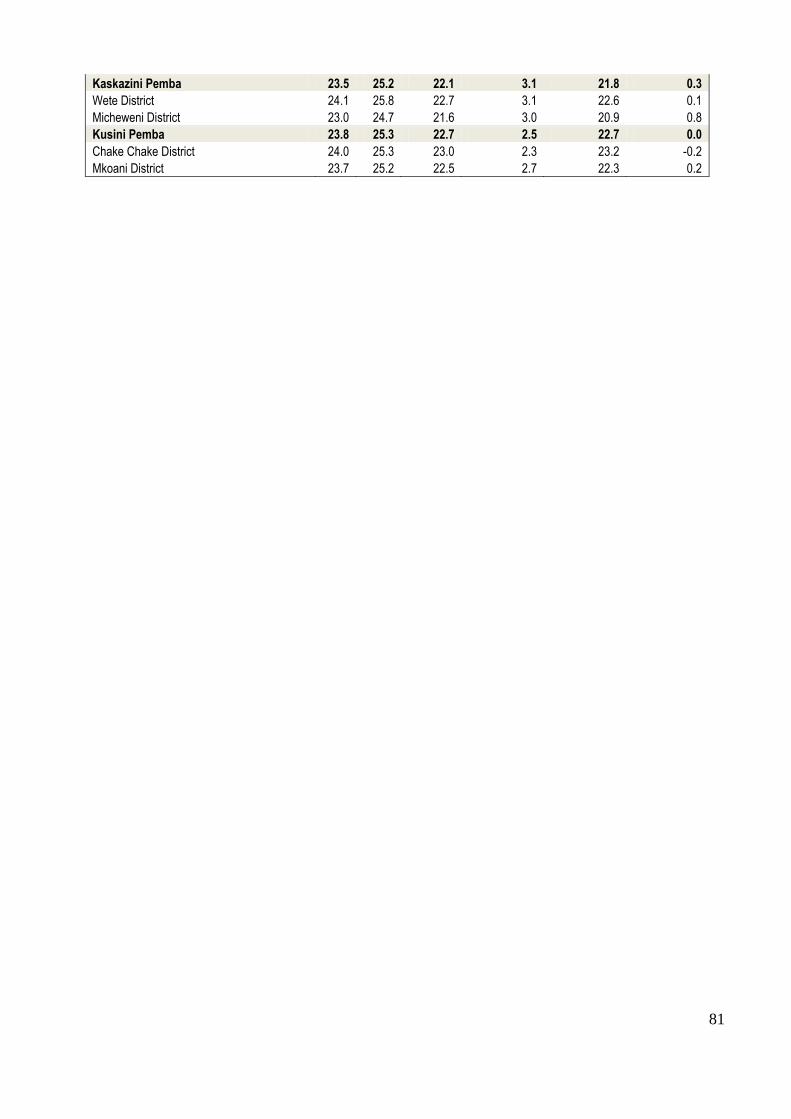
81
Kaskazini Pemba 23.5 25.2 22.1 3.1 21.8 0.3
Wete District 24.1 25.8 22.7 3.1 22.6 0.1
Micheweni District 23.0 24.7 21.6 3.0 20.9 0.8
Kusini Pemba 23.8 25.3 22.7 2.5 22.7 0.0
Chake Chake District 24.0 25.3 23.0 2.3 23.2 -0.2
Mkoani District 23.7 25.2 22.5 2.7 22.3 0.2
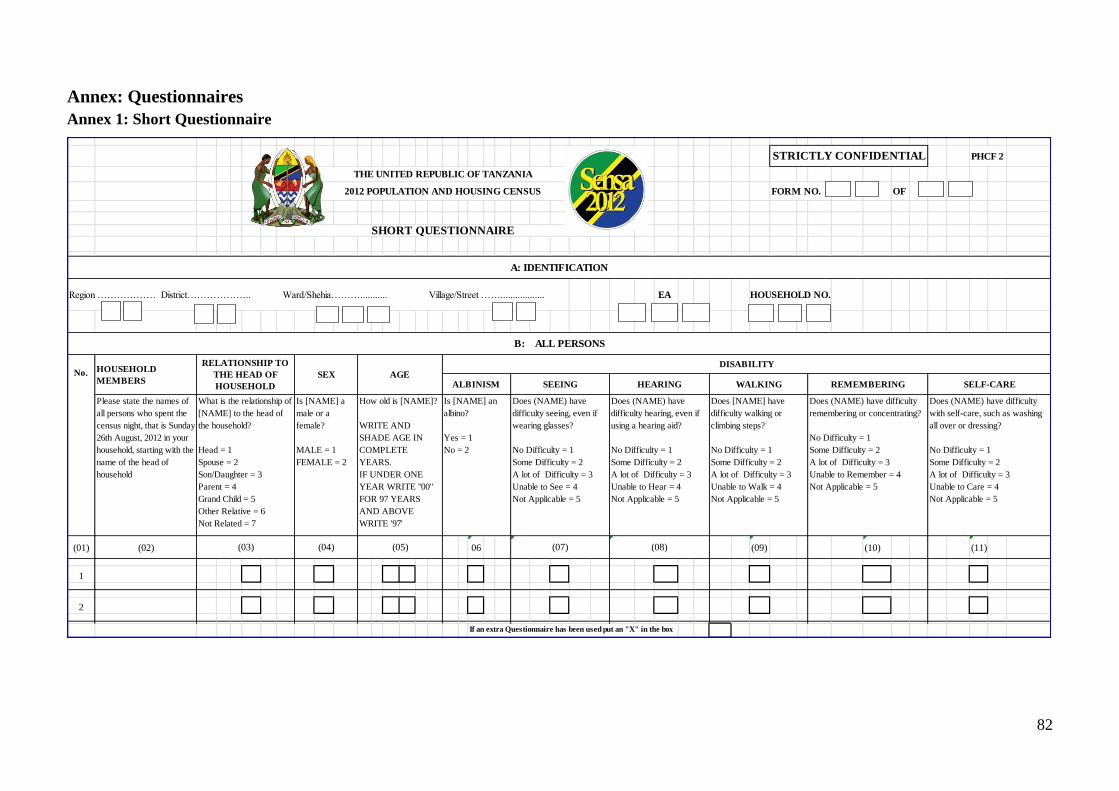
82
Annex: Questionnaires
Annex 1: Short Questionnaire
PHCF 2
FORM NO. OF
Region ……………… District……………….. Ward/Shehia………........... Village/Street …….................. EA
Please state the names of
all persons who spent the
census night, that is Sunday
26th August, 2012 in your
household, starting with the
name of the head of
household
(01) (02) 06 (09) (10) (11)
1
2
If an extra Questionnaire has been used put an "X" in the box
(08)
Does (NAME) have difficulty
remembering or concentrating?
No Difficulty = 1
Some Difficulty = 2
A lot of Difficulty = 3
Unable to Remember = 4
Not Applicable = 5
(07)
REMEMBERING
(03) (04) (05)
Does [NAME] have
difficulty walking or
climbing steps?
No Difficulty = 1
Some Difficulty = 2
A lot of Difficulty = 3
Unable to Walk = 4
Not Applicable = 5
WALKINGHEARINGALBINISMAGE
Does (NAME) have
difficulty hearing, even if
using a hearing aid?
No Difficulty = 1
Some Difficulty = 2
A lot of Difficulty = 3
Unable to Hear = 4
Not Applicable = 5
Does (NAME) have
difficulty seeing, even if
wearing glasses?
No Difficulty = 1
Some Difficulty = 2
A lot of Difficulty = 3
Unable to See = 4
Not Applicable = 5
STRICTLY CONFIDENTIAL
B: ALL PERSONS
No. HOUSEHOLD
MEMBERS
RELATIONSHIP TO
THE HEAD OF
HOUSEHOLD
SEX
Is [NAME] an
albino?
Yes = 1
No = 2
What is the relationship of
[NAME] to the head of
the household?
Head = 1
Spouse = 2
Son/Daughter = 3
Parent = 4
Grand Child = 5
Other Relative = 6
Not Related = 7
SEEING
Is [NAME] a
male or a
female?
MALE = 1
FEMALE = 2
HOUSEHOLD NO.
A: IDENTIFICATION
How old is [NAME]?
WRITE AND
SHADE AGE IN
COMPLETE
YEARS.
IF UNDER ONE
YEAR WRITE "00"
FOR 97 YEARS
AND ABOVE
WRITE '97'
THE UNITED REPUBLIC OF TANZANIA
2012 POPULATION AND HOUSING CENSUS
SHORT QUESTIONNAIRE
DISABILITY
Does (NAME) have difficulty
with self-care, such as washing
all over or dressing?
No Difficulty = 1
Some Difficulty = 2
A lot of Difficulty = 3
Unable to Care = 4
Not Applicable = 5
SELF-CARE

83
(01)
Ye
s
No
Cle
ft P
ala
te
Spin
al befida
Spin
al cord
inju
ries
Menta
l health
Psoriasis
1 1 2 1 2 3 4 5
2 1 2 1 2 3 4 5
3 1 2 1 2 3 4 5
4 1 2 1 2 3 4 5
5 1 2 1 2 3 4 5
6 1 2 1 2 3 4 5
7 1 2 1 2 3 4 5
B: ALL PERSONS
What is current marital
status of [NAME]?
READ ALL
RESPONSES TO
RESPONDENT
Never Married = 1
Married = 2
Living together = 3
Divorced = 4
Separated = 5
Widowed = 6
Not Stated = 7
[NAME] is a citizen of which
country?
IF TANZANIAN, WRITE CODE
1 IN THE BOX ON THE LEFT
WRITE CODE OF THE
COUNTRY IN THE TWO
BOXES ON THE RIGHT.
FOR DUAL CITIZENSHIP,
WRITE CODE "98"
CODES ARE ON A SEPARATE
SHEET
Which region/country does
[NAME] usually live?
WRITE AND SHADE CODE
FOR THE REGION AND
DISTRICT IF LIVING IN
TANZANIA, OR THE
COUNTRY CODE
FOLLOWED BY "44" IF
LIVING OUTSIDE
TANZANIA.
Where do you spend most of your time
during a day?
WRITE AND SHADE REGION
AND DISTRICT CODES IF
SPENDS MOST OF THE DAY
TIME IN TANZANIA OR THE
COUNTRY CODE FOLLOWED BY
"444" IF OUTSIDE TANZANIA
CODES FOR THE 5th BOX
Rural =1
Regional /District Headquarters =2
Other Urban= 3
PLACE OF RESIDENCE BIRTH CERTIFICATENo. WHERE RESPONDENT SPENDS
MOST OF THE DAY TIME
Does (NAME) has birth
certificate/notification?
Yes birth certificate= 1
Yes birth notification= 2
No = 3
Don't Know = 4
DISABILITY
OTHER DISABILITIES
11A)
Does, [NAME] have other type of disabilities/difficulties
among the following?
READ ALL TYPES OF DISABILITIES/DIFFICULTIES
TO RESPONDENT.
(12) (13) (14) (15)
MARITAL STATUS CITIZENSHIP
(16)
IF ANSWER IS NO, GO
TO QUESTION 12MULTIPLE RESPONSE IS ALLOWED

84
No.
(01) (17) (18)
1
2
3
4
5
6
7
8
C: EDUCATION: ALL PERSONS AGED 4 YEARS AND ABOVE
(19)
LITERACY EDUCATION ATTAINMENT LEVEL OF EDUCATION
Can [NAME] read and write
a short sentence in Kiswahili,
English, Kiswahili and English
or any other language?
Kiswahili = 1
English = 2
Kiswahili and English = 3
Other Languages = 4
Illiterate = 5
Are you/Is [NAME] currently attending, partially
attended, completed or never attended school?
Now attending =1
Partially attended =2
Completed =3
Never attended =4
IF THE ANSWER IS 'NEVER ATTENDED' SKIP TO
SECTION D
What level of education has [NAME]
completed or is currently attending?
WRITE AND SHADE THE
APPROPRIATE CODE.
CODES ARE IN SEPARATE
HANDBOOK

85
Yes = 1
No = 2
IF THE ANSWER IS YES, RECORD THE NUMBER OF DEATHS
(21) (22) (24) (25) (26) (27)
1
2
3
4
5
6
If number of death is more than 8, use an extra questionnaire
What was the cause
of death?
Road Accident = 1
Other Injuries = 2
Suicide = 3
Violence = 4
Sickness/Disease = 5
Martenal Death = 6
Other = 7
How old was the deceased at the
time of death?
WRITE AGE IN COMPLETED
YEARS. IF UNDER ONE YEAR
WRITE "00" IF IS 97 YEARS
OR ABOVE WRITE '97'
D: GENERAL AND MATERNAL DEATHS
IF THE ANSWER IS NO, SKIP TO SECTION E
(23)
PLEASE RECORD INFORMATION ON DEATHS THAT OCCURRED IN THE HOUSEHOLD DURING THE LAST 12 MONTHS.
DO NOT FORGET CHILDHOOD MORTALITY
Did the death occur during
pregnancy?
Yes = 1
No = 2
IF THE ANSWER IS YES,
SKIP TO SECTION E
Did the death occur during
childbirth
Yes = 1
No = 2
IF THE ANSWER IS YES
SKIP TO SECTION E
Did the death occur during
the 6 weeks period following
the end of pregnancy,
irrespective of the way the
pregnancy ended?
Yes = 1
No = 2
IF DEATH IS OF WOMAN AGED BETWEEN 12 AND 49 YEARS
(20) Was there any death which occurred in this household during the last 12 months?
Dea
th S
eria
l N
um
ber
Was the
deceased a male
or a female?
Male =1
Female =2

86
Yes No
Maize 1 2 Cattle
Paddy 1 2 Goats
Cassava 1 2 Sheeps
Banana 1 2 Poultry
Other Crops 1 2
Has/is any member of this
household operated/operating
any land for agricultural
purposes during 2011/12
agricultural year?
Yes = 1
No = 2
IF THE ANSWER IS NO,
SKIP TO QUESTION 30
Which of the following crops did the
household grow?
Was any member of this
household engaged in raising
cattle, goats, sheep or poultry
up to the census night?
Yes = 1
No = 2
IF THE ANSWER IS NO,
SKIP TO QUESTION 32
How many cattle, goats or sheep were
available during the Census night?
IF NO, WRITE AND SHADE CODE
"00000"
E: AGRICULTURE AND LIVESTOCK
Is there any member of this
household who is currently
engaged in fish farming?
Yes = 1
No = 2
AGRICULTURE LIVESTOCK FISH FARMING
(28) (29) (30) (31) (32)
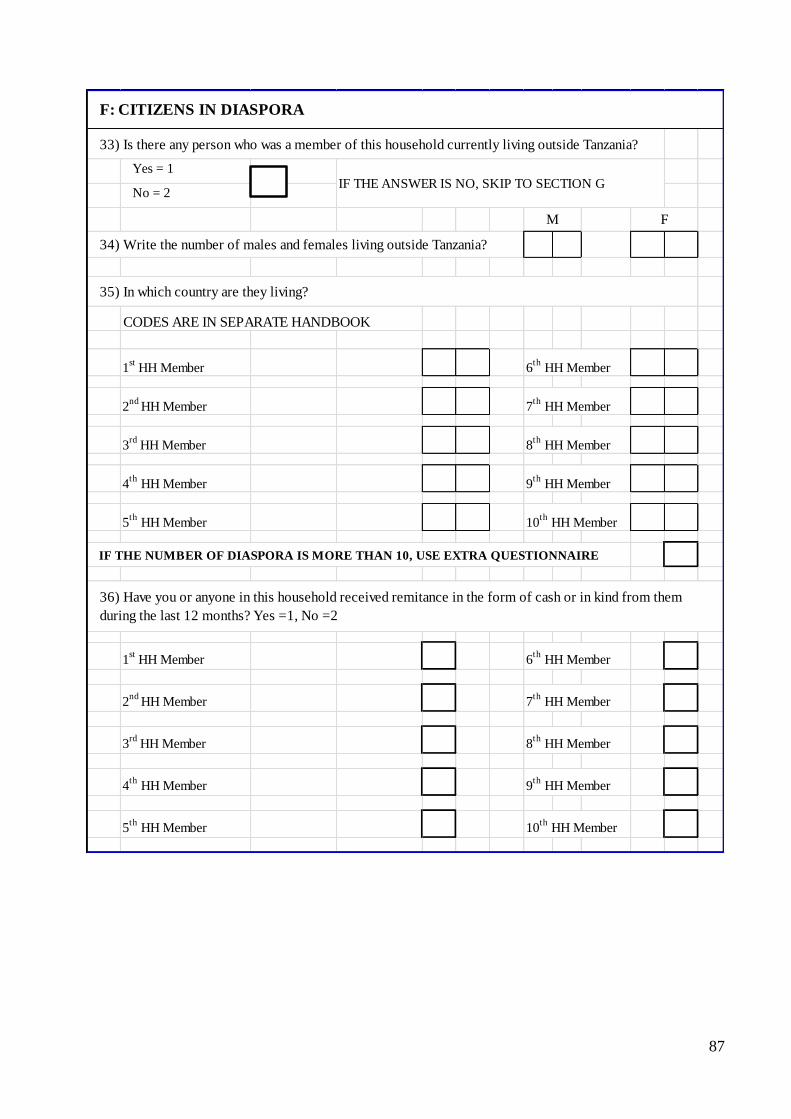
87
33) Is there any person who was a member of this household currently living outside Tanzania?
Yes = 1
No = 2
34) Write the number of males and females living outside Tanzania?
CODES ARE IN SEPARATE HANDBOOK
1st
HH Member 6th
HH Member
2nd
HH Member 7th
HH Member
3rd
HH Member 8th
HH Member
4th
HH Member 9th
HH Member
5th
HH Member 10th
HH Member
IF THE NUMBER OF DIASPORA IS MORE THAN 10, USE EXTRA QUESTIONNAIRE
1st
HH Member 6th
HH Member
2nd
HH Member 7th
HH Member
3rd
HH Member 8th
HH Member
4th
HH Member 9th
HH Member
5th
HH Member 10th
HH Member
36) Have you or anyone in this household received remitance in the form of cash or in kind from them
during the last 12 months? Yes =1, No =2
F
IF THE ANSWER IS NO, SKIP TO SECTION G
F: CITIZENS IN DIASPORA
M
35) In which country are they living?

88
37) Is there a person in this household who is a member of the following social security funds?
Yes = 1
No = 2
Fund
National Social Security Fund (NSSF) =1
Zanzibar Social Security Fund (ZSSF) =2
Parastatal Pension Fund (PPF) =3
Public Service Pension Fund (PSPF) =4
Government Employee Provident Fund (GEPF) =5
Local Authority Pension Fund (LAPF) =6
National Health Insurance Fund/Community Health Fund (NHIF/CHF) =7
Other Funds =8
H: TOTAL NUMBER OF PERSONS IN THE HOUSEHOLD
Males
Females
Total
DATE HOUSEHOLD ENUMERATED
NAME OF SUPERVISOR
DATE OF EDITING QUESTIONNAIRE
IF THE ANSWER IS NO, GO TO SECTION H, MULTIPLE RESPONSE IS ALLOWED
Day Month
G: SOCIAL SECURITY FUNDS
Day Month

Annex 2
89
Annex 2: Long Questionnaire
FO RM NO . O F
A: IDENTIFICATION
Region ……………………… District………………..… Ward/Shehia……………..………… Village/Street ………………. EA .............................. HOUSEHOLD NO.
Please state the
names of all
persons who spent
the census night,
that is Sunday 26th
August, 2012 in
your household,
starting with the
name of the head
of household
(01) (02) '(06) (09) (10)
1
2
If an extra Questionnaire has been used put an "X" in the box
Does (NAME) have difficulty
remembering or
concentrating?
No Difficulty = 1
Some Difficulty = 2
A lot of Difficulty = 3
Unable to Remember = 4
Not Applicable = 5
Does (NAME) have
difficulty with self-care,
such as washing all over
or dressing?
No Difficulty = 1
Some Difficulty = 2
A lot of Difficulty = 3
Unable to Care = 4
Not Applicable = 5
(03) (04) (05) (07) (08) (11)
WALKING REMEMBERING SELFCARE
What is the
relationship of
[NAME] to the head
of the household?
Head = 1
Spouse = 2
Son/Daughter = 3
Parent = 4
Grand Child = 5
Other Relative = 6
Not Related = 7
Is [NAME]
a male or a
female?
Male = 1
Female = 2
How old is [NAME]?
WRITE AND
SHADE AGE IN
COMPLETE
YEARS.
IF UNDER ONE
YEAR WRITE "00"
FOR 97 YEARS
AND ABOVE
WRITE '97'
Is [NAME] an
albino?
Yes = 1
No = 2
Does (NAME) have
difficulty seeing,
even if wearing
glasses?
No Difficulty = 1
Some Difficulty = 2
A lot of Difficulty =
3
Unable to See = 4
Not Applicable = 5
Does (NAME) have
difficulty hearing,
even if using a
hearing aid?
No Difficulty = 1
Some Difficulty = 2
A lot of Difficulty =
3
Unable to Hear = 4
Not Applicable = 5
Does [NAME]
have difficulty
walking or climbing
steps?
No Difficulty = 1
Some Difficulty = 2
A lot of Difficulty =
3
Unable to Walk = 4
Not Applicable = 5
B: ALL PERSONS
No .
HOUSEHOLD
MEMBERS
RELATIONSHIP
TO THE HEAD
OF HOUSEHOLD
SEX AGE
DISABILITY
ALBINISM SEEING HEARING
PHCF 3
THE UNITED REPUBLIC OF TANZANIA
2012 POPULATION AND HOUSING CENSUS STRICTLY CONFIDENTIAL
LONG QUESTIONNAIRE

Annex 2
90
B: ALL PERSONS
(01)
Ye
s
No
Cle
ft P
ala
te
Spin
al befida
Spin
al cord
inju
ries
Menta
l health
Psoriasis
1 1 2 1 2 3 4 5
2 1 2 1 2 3 4 5
3 1 2 1 2 3 4 5
4 1 2 1 2 3 4 5
5 1 2 1 2 3 4 5
6 1 2 1 2 3 4 5
7 1 2 1 2 3 4 5
8 1 2 1 2 3 4 5
No.DISABILITY
OTHER DISABILITIES
11A)
Does, [NAME] have other type of disabilities/difficulties
among the following?
READ ALL TYPES OF DISABILITIES/DIFFICULTIES
TO RESPONDENT.
IF ANSWER IS NO, GO
TO QUESTION 12MULTIPLE RESPONSE IS ALLOWED
What is current marital
status of [NAME]?
READ ALL
RESPONSES TO
RESPONDENT
Never Married = 1
Married = 2
Living together = 3
Divorced = 4
Separated = 5
Widowed = 6
Not Stated = 7
[NAME] is a citizen of which
country?
IF TANZANIAN, WRITE
CODE 1 IN THE BOX ON
THE LEFT
WRITE CODE OF THE
COUNTRY IN THE TWO
BOXES ON THE RIGHT.
FOR DUAL CITIZENSHIP,
WRITE CODE "98"
CODES ARE ON A
SEPARATE SHEET
MARITAL STATUS CITIZENSHIP
(12) (13)

Annex 2
91
(15) (18) (20) (21)
Father Mother
1
2
3
4
5
6
C: EDUCATION: ALL PERSONS AGED 4 YEARS AND
ABOVE
LITERACYEDUCATION
ATTAINMENT
LEVEL OF
EDUCATION
Which region/country
does [NAME] usually
live?
WRITE AND SHADE
CODE FOR THE
REGION AND
DISTRICT IF LIVING
IN TANZANIA, OR
THE COUNTRY
CODE FOLLOWED
BY "44" IF LIVING
OUTSIDE
TANZANIA.
CODES ARE IN
SEPARATE
HANDBOOK
B: ALL PERSONS
PLACE OF
RESIDENCENo.
(22)(16)
PLACE OF
RESIDENCE IN 2011
Where was [NAME] living
in 2011?
WRITE AND SHADE
CODE FOR THE
REGION AND
DISTRICT IF LIVING IN
THE COUNTRY, OR
THE COUNTRY CODE
FOLLOWED BY "44" IF
LIVING OUTSIDE
TANZANIA.
FOR CHILDREN AGED
'00' IN QUESTION 05
WRITE CODE '9798'
PLACE OF BIRTH
In which region/country
was [NAME] born?
WRITE CODE FOR THE
REGION AND
DISTRICT IF BORN IN
THE COUNTRY, OR
THE COUNTRY CODE
FOLLOWED BY "44" IF
BORN OUTSIDE
TANZANIA.
CODES ARE IN
SEPARATE
HANDBOOK
Is [NAME]'s
Father alive?
Is [NAME]'s
Mother alive?
Yes = 1
No = 2
Don't Know = 3
What level of
education has
[NAME]
completed or is
currently
attending?
WRITE AND
SHADE THE
APPROPRIAT
E CODE.
CODES ARE
IN SEPARATE
HANDBOOK
(14) (19)(17)
Are you/is [NAME]
currently attending,
partially attended,
completed or never
attended school?
Now attending =1
Partially attended =2
Completed =3
Never attended =4
IF THE ANSWER IS
'NEVER
ATTENDED' SKIP
TO SECTION D
BIRTH CERTIFICATE
Does (NAME) has birth
certificate/notification?
Yes birth certificate= 1
Yes birth notification= 2
No = 3
Don't Know = 4
Can [NAME] read
and write a short
sentence in Kiswahili,
English, Kiswahili and
English or any other
language?
Kiswahili = 1
English = 2
Kiswahili and English =
3
Other Languages = 4
Illiterate = 5
WHERE
RESPONDENT
SPENDS MOST OF
Where do you spend most
of your time during the
day?
WRITE AND SHADE
REGION AND
DISTRICT CODES IF
SPENDS MOST OF
THE DAY TIME IN
TANZANIA OR THE
COUNTRY CODE
FOLLOWED BY "444"
IF OUTSIDE
TANZANIA. CODES
ARE IN SEPARATE
HANDBOOK
CODES FOR THE 5th
BOX
Rural =1
Regional /District
Headquarters =2
Other Urban= 3
SURVIVAL OF
PARENTS

Annex 2
92
(25)
M F M F
1
2
3
4
5
6
7
8
(27)(23) (24)
No.
In the last 12 months, did
[NAME] mainly….
Worked for payment,
worked without payment,
worked for own benefit, not
worked but actively seeking
for work, available for work
but not actively seeking for
work, household chores (e.g.
cooking), full time student or
unable to work/sick/too
old/disable
WRITE AND SHADE THE
APPROPRIATE CODE.
CODES ARE IN
SEPARATE HANDBOOK
In the week preceding
census’ night, did [NAME]
mainly….
Worked for payment,
worked without payment,
worked for own benefit,
not worked but actively
seeking for work, available
for work but not actively
seeking for work,
household chores (e.g.
cooking), full time student
or unable to work/sick/too
old/disable
WRITE AND SHADE
THE APPROPRIATE
CODE. IF CODE
GREATER THAN '3'
SKIP TO SECTION E
CODES ARE IN
SEPARATE
HANDBOOK
Was [NAME] an
employer, employee,
own account worker
non-agriculture, own
account worker
agriculture, contributing
family worker, or an
apprentice in the week
preceding the census'
night?
WRITE AND SHADE
THE APPROPRIATE
CODE.
CODES ARE IN
SEPARATE
HANDBOOK
How many
male/female
children were
born alive to
[NAME] and are
now living
elsewhere?
IF SHE HAS
NO CHILDREN
LIVING
ELSEWHERE
WRITE AND
SHADE ''00''
How many
male/female
children were
born alive to
[NAME] and are
now
unfortunately
dead?
IF NONE OF
HER
CHILDREN
HAS DIED
WRITE AND
SHADE ''00''
How many of the
male/female children
who were born alive
to [NAME] in the last
12 months are still
alive?
IF THERE IS NO
CHILD SURVIVING
WRITE AND
SHADE ''0''
CHILDREN EVER BORN
INDUSTRY
What is the main
activity at
[NAME'S] place of
work for the week
preceding the
census' night?
WRITE AND
SHADE THE
APPROPRIATE
CODE.
CODES ARE IN
SEPARATE
HANDBOOK
How many
male/female children
were born alive to
[NAME] in the last 12
months (i.e. 26 August
2011 - 25 August
2012)?
IF THERE IS NO
CHILD BORN
ALIVE IN THE
LAST 12 MONTHS
WRITE AND
SHADE ''0''. DON’T
ASK FEMALES
AGED 50 YEARS
AND ABOVE
(32)(28)
D: ECONOMIC ACTIVITY: ALL PERSONS AGED 5 YEARS AND ABOVE
(26)
What type of work
did [NAME] do in
the week preceding
the census' night?
WRITE AND
SHADE THE
APPROPRIATE
CODE.
CODES ARE IN
SEPARATE
HANDBOOK
ECONOMIC ACTIVITY OCCUPATION EMPLOYMENT
STATUS
E: FEMALES AGED 12 YEARS AND ABOVE
How many
male/female children
were born alive to
[NAME] and are
now living with
you/her in this
household?
IF SHE IS NOT
LIVING WITH
ANY OF HER
CHILDREN
WRITE AND
SHADE ''00''
(31)
FERTILITY IN LAST 12 MONTHS
FOR WOMEN AGED 12 TO 49 YEARS
M F
(29) (30)
M F M F

Annex 2
93
F: GENERAL AND MATERNAL DEATHS IN THE HOUSEHOLD
IF THE ANSWER IS NO, SKIP TO SECTION G
RECORD THE NUMBER OF DEATHS
(34) (37)
1
2
3
4
5
6
7
8
If number of death is more than 8, use an extra questionnaire
PLEASE RECORD INFORMATION ON DEATHS THAT OCCURRED IN THE HOUSEHOLD DURING THE LAST 12 MONTHS. DO NOT FORGET CHILDHOOD
MORTALITY
Did the death occur during pregnancy?
Yes = 1
No = 2
IF THE ANSWER IS YES SKIP TO
SECTION G
Did the death occur during
childbirth?
Yes = 1
No = 2
IF THE ANSWER IS YES
SKIP TO SECTION G
Did the death occur during
the 6 weeks period following
the end of pregnancy,
irrespective of the way the
pregnancy ended?
Yes = 1
No = 2
IF DEATH IS OF A WOMAN AGED 12 TO 49 YEARS
Dea
th S
eria
l Num
ber
Was the deceased a
male or a female?
Male =1
Female =2
(40)(35)
What was the cause of
death?
Road Accident = 1
Other Injuries = 2
Suicide = 3
Domestic Violence = 4
Sickness/Disease = 5
Martenal Death = 6
Other = 7
(33) Was there any death which occurred in this household during the last 12 months? YES=1 NO=2
(38) (39)
How old was the deceased at the
time of death?
WRITE AGE IN COMPLETED
YEARS. IF UNDER ONE YEAR
WRITE "00" IF 97 YEARS OR
ABOVE WRITE '97'
(36)

Annex 2
94
Owned by household=1
Title deed= 1
Iron sheets =1
Cement =1
Stones =1
Lived in without paying any rent=2
Residential Licence= 2
Tiles =2
Ceramic tiles =2
Cement bricks =2
Rented privately =3 Offer = 3 Concrete =3 Parquet or Polished wood =3 Sundried bricks =3
Rented by employer =4 Customary ownership = 4 Asbestos =4 Terazzo =4 Baked bricks =4
Rented by government at a subsidized rent =5 Contract = 5 Grass/Leaves =5 Vinyl or Asphalt strips =5 Timber =5
Owned by Employer - Free of charge =6 Registration (Zanzibar) = 6 Mud and Leaves =6 Wood Planks =6 Timber ana Sheets =6
Owned by Employer - With rent =7 No legal right = 7 Plastics/Box =7 Palm/Bamboo =7 Poles and Mud =7
Tent =8 Earth/Sand =8 Grass =8
Dung =9 Tent =9
1-Modern floor
0-Non modern floor
(43)
What is the ownership status of the main dwelling used
by the household?
IF THE ANSWER IS CODE 2 OR ABOVE, SKIP
TO QUESTION 43
(42)
What legal right do you have
over the ownership of this land
where your house is built?
(45)
What are the main roofing
materials used for the
main building of this
household?
(44)
G: HOUSING CONDITIONS AND OWNERSHIP OF ASSETS
What are the main wall
materials used for the main
building of this household?
What are the main flooring materials
used for the main building of this
household?
(41)

Annex 2
95
(47)
Piped water into dwelling =01
Electricity (TANESCO/ZECO) =01
Electricity (TANESCO/ZECO) =01
Piped water in the yard/plot =02
Solar =02
Solar =02
Public tap/standpipe =03 Generator/private sources =03 Generator (private source) =03
Tubewell/borehole =04 Cooking Gas =04 Gas (Industrial) =04
Protected dug well =05 Gas (Biogas) =05 Gas (Biogas) =05
Unprotected dug well =06 Electricity (Wind) =06 Electricity (Wind) =06
Protected spring =07 Paraffin =07 Acetylene lamp =07
Unprotected spring =08 Coal =08 Kerosene (lantern/chimney) =08
Rainwater collection =09 Charcoal =09 Kerosene (Wick lamps) =09
Bottled water =10 Firewood =10 Candles =10
Cart with small tank/drum =11 Wood/ residuals =11 Firewood =11
Tanker truck =12 Animal residuals =12 Torch/Rechargeable lamps =12
Surface water (river, dam, lake, pond,
stream,charco, canal, irrigation channels)
=13 Not Applicable =13
Improved cooking fuel Have electricityNon improved cooking fuel Have no electricity
Improved source
Non improved source
What is the main source of drinking water for
this household?
(49)(48)
What is the main source of energy used by
this household for cooking?
What is the main source of energy used by
this household for lighting?
How many rooms are available
for sleeping in this household?
G: HOUSING CONDITIONS AND OWNERSHIP OF ASSETS
RECORD NUMBER OF
ROOMS FOR
SLEEPING
(46)
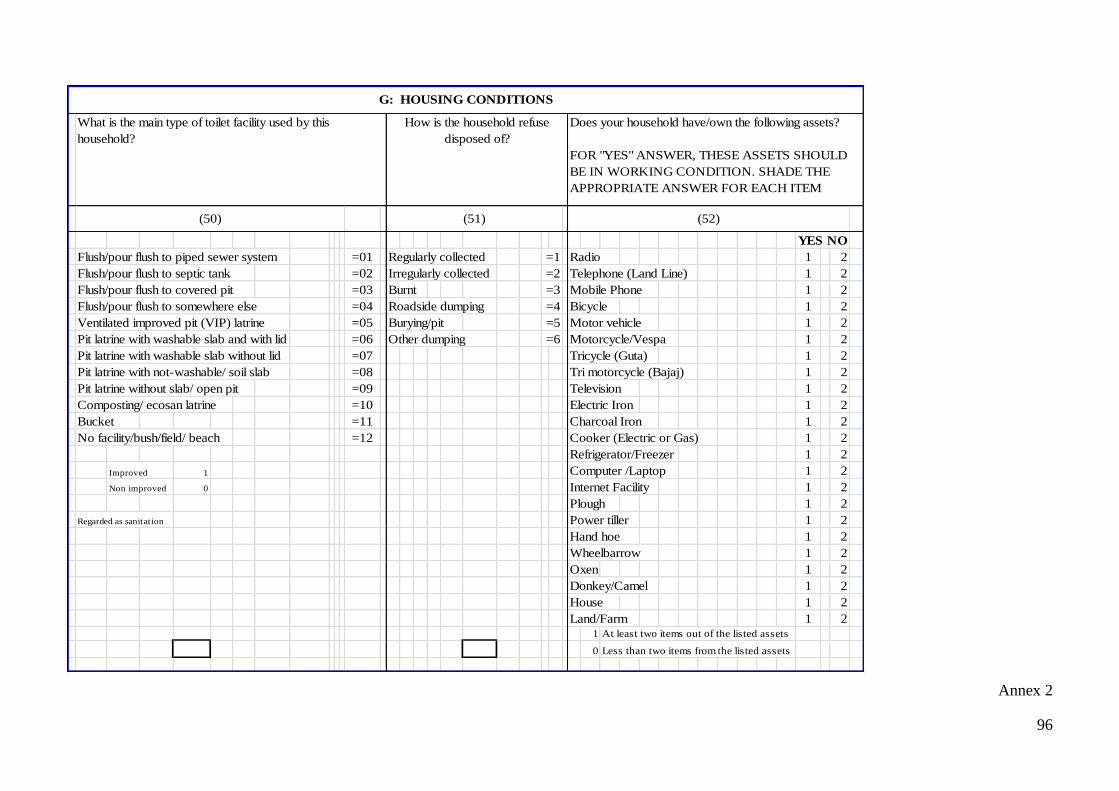
Annex 2
96
YES NO
Flush/pour flush to piped sewer system =01 Regularly collected =1 Radio 1 2
Flush/pour flush to septic tank =02 Irregularly collected =2 Telephone (Land Line) 1 2
Flush/pour flush to covered pit =03 Burnt =3 Mobile Phone 1 2
Flush/pour flush to somewhere else =04 Roadside dumping =4 Bicycle 1 2
Ventilated improved pit (VIP) latrine =05 Burying/pit =5 Motor vehicle 1 2
Pit latrine with washable slab and with lid =06 Other dumping =6 Motorcycle/Vespa 1 2
Pit latrine with washable slab without lid =07 Tricycle (Guta) 1 2
Pit latrine with not-washable/ soil slab =08 Tri motorcycle (Bajaj) 1 2
Pit latrine without slab/ open pit =09 Television 1 2
Composting/ ecosan latrine =10 Electric Iron 1 2
Bucket =11 Charcoal Iron 1 2
No facility/bush/field/ beach =12 Cooker (Electric or Gas) 1 2
Refrigerator/Freezer 1 2
Improved 1 Computer /Laptop 1 2
Non improved 0 Internet Facility 1 2
Plough 1 2
Regarded as sanitation Power tiller 1 2
Hand hoe 1 2
Wheelbarrow 1 2
Oxen 1 2
Donkey/Camel 1 2
House 1 2
Land/Farm 1 21 At least two items out of the listed assets
0 Less than two items from the listed assets
G: HOUSING CONDITIONS
Does your household have/own the following assets?
FOR "YES" ANSWER, THESE ASSETS SHOULD
BE IN WORKING CONDITION. SHADE THE
APPROPRIATE ANSWER FOR EACH ITEM
(52)(51)(50)
What is the main type of toilet facility used by this
household?
How is the household refuse
disposed of?

Annex 2
97
Yes No
Maize 1 2
Paddy 1 2
Cassava 1 2
Banana 1 2
Other Crops 1 2
Cattle
GoatsSheepPoultry
LIVESTOCKAGRICULTURE
(54) (55) (56)
How many cattle, goats or sheep
were available during the Census
night?
IF NO, WRITE AND SHADE
CODE "00000"
Is there any member of
this household who is
currently engaged in fish
farming?
Yes = 1
No = 2
(57)(53)
H: AGRICULTURE AND LIVESTOCK
FISH FARMING
Has/is any member of this
household
operated/operating any land
for agricultural purposes
during 2011/12 agricultural
year?
Yes = 1
No = 2
IF THE ANSWER IS NO,
SKIP TO QUESTION 55
Which of the following crops did the household
grow?
Was any member of this
household engaged in
raising cattle, goats, sheep
or poultry up to the census
night?
Yes = 1
No = 2
IF THE ANSWER IS
NO, SKIP TO
QUESTION 57

Annex 2
98
59) Write the number of males and females living outside Tanzania? Males
Females
CODES ARE IN SEPARATE HANDBOOK
Total
1st
HH Member 6th
HH Member
2nd
HH Member 7th
HH Member
3rd
HH Member 8th
HH Member
4th
HH Member 9th
HH Member
5th
HH Member 10th
HH Member
IF THE NUMBER OF DIASPORA IS MORE THAN 10, USE EXTRA QUESTIONNAIRE
1st
HH Member 6th
HH Member
2nd
HH Member 7th
HH Member
3rd
HH Member 8th
HH Member
4th
HH Member 9th
HH Member
5th
HH Member 10th
HH Member
62) Is there a person in this household who is a member of the following social security funds?
National Social Security Fund (NSSF) =1
Zanzibar Social Security Fund (ZSSF) =2
Parastatal Pension Fund (PPF) =3
Public Service Pension Fund (PSPF) =4
Government Employee Provident Fund (GEPF) =5
Local Authority Pension Fund (LAPF) =6
National Health Insurance Fund/Community Health Fund (NHIF/CHF) =7
Other Fund =8
J: SOCIAL SECURITY FUNDS
60) In which country are they living?
Month
61) Have you or anyone in this household received remitance in the form of cash or in kind from them during the last 12 months?
Yes =1, No =2
DATE OF EDITING QUESTIONNAIREDay Month
Fund
NAME OF SUPERVISOR
Yes = 1 No = 2 IF THE ANSWER IS NO, GO TO SECTION H. MULTIPLE RESPONSE IS
ALLOWED
DATE HOUSEHOLD ENUMERATED
Day
I: CITIZENS IN DIASPORA K: TOTAL NUMBER OF PERSONS IN THE HOUSEHOLD
58) Is there any person who was a member of this household currently living outside Tanzania? Yes = 1 No = 2
IF THE ANSWER IS NO, SKIP TO SECTION J
M F
Related Documents