The Unexpected Consequences of Water Conservation on Water Reuse Facilities Linda Sawyer 925.210.2536 [email protected] Linda Sawyer WateReuse Northern California | December 8, 2017

Welcome message from author
This document is posted to help you gain knowledge. Please leave a comment to let me know what you think about it! Share it to your friends and learn new things together.
Transcript

The Unexpected Consequences of Water Conservation on Water Reuse Facilities
Linda Sawyer
Linda Sawyer
WateReuse Northern California | December 8, 2017

• Decreased Flows and Flow Projections
• Treatment Process Loading Capacity
• Alkalinity Limitations
• Effluent Quality
• Recycled Water Flows
Water Conservation and Water Reuse
Brown and Caldwell 2
REUSE
ADVANCED TREATMENT
DISCHARGE

Decreased Flows and Flow Projections
Brown and Caldwell 3
REUSE
ADVANCED TREATMENT
DISCHARGE
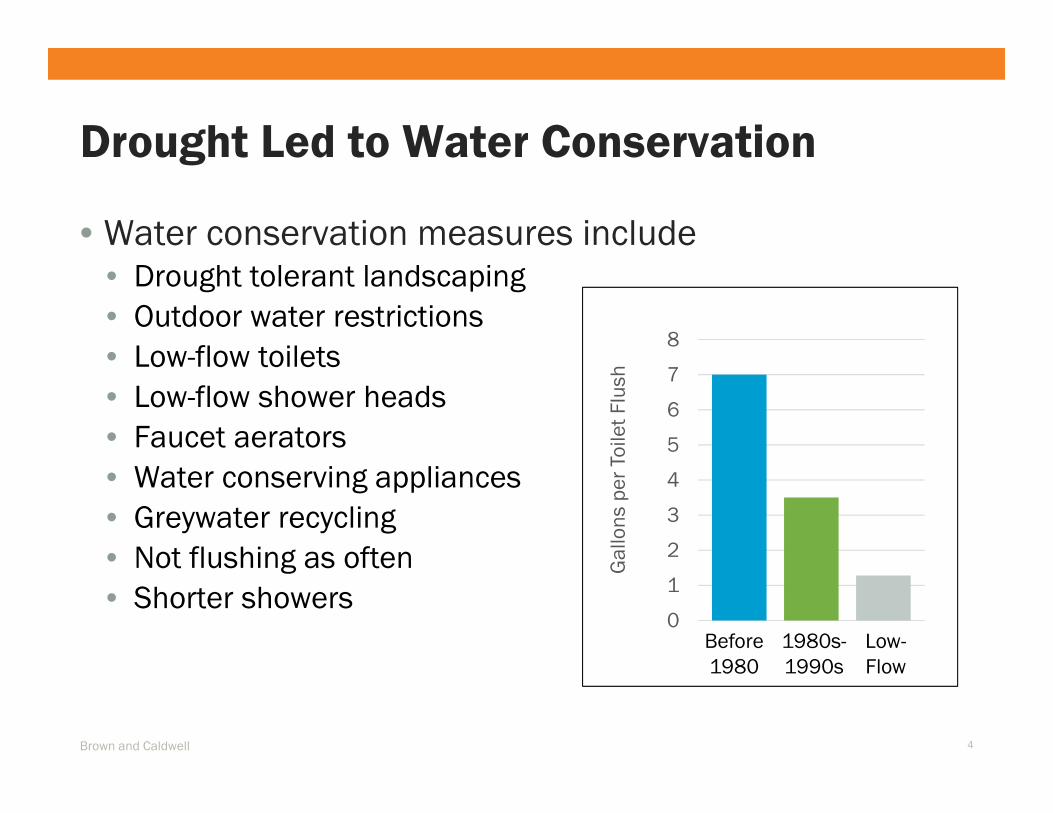
• Water conservation measures include• Drought tolerant landscaping• Outdoor water restrictions• Low-flow toilets• Low-flow shower heads• Faucet aerators• Water conserving appliances• Greywater recycling• Not flushing as often• Shorter showers
Drought Led to Water Conservation
Brown and Caldwell 4
0
1
2
3
4
5
6
7
8
Gal
lons
per
Toi
let F
lush
Before 1980
1980s-1990s
Low-Flow

Water Conservation Results in Lower Wastewater Flows
Brown and Caldwell 5Summer flow is July through September
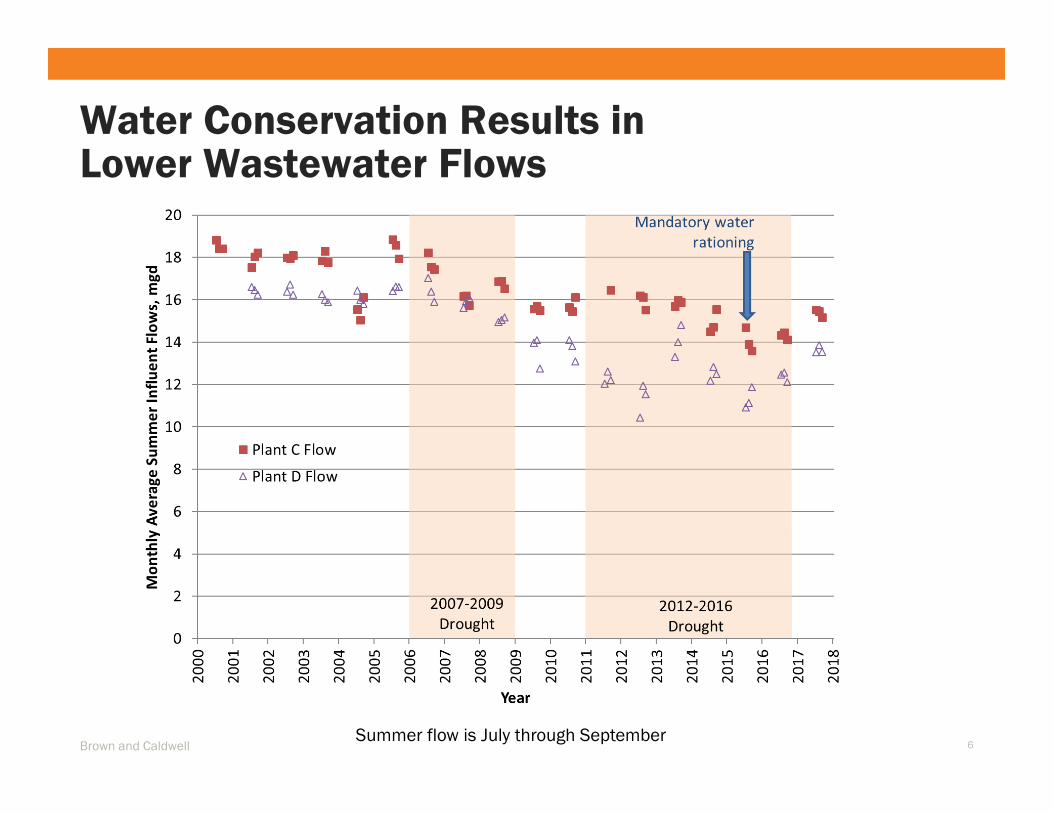
Water Conservation Results in Lower Wastewater Flows
Brown and Caldwell 6Summer flow is July through September
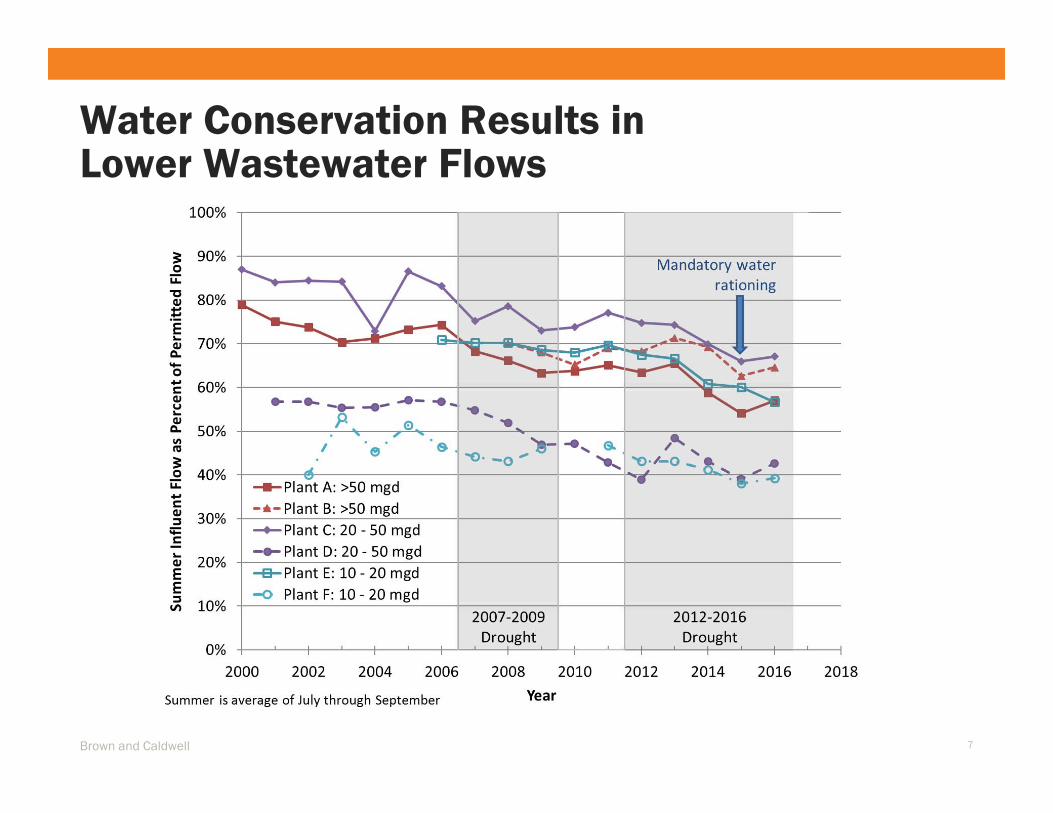
Water Conservation Results in Lower Wastewater Flows
Brown and Caldwell 7

Water Conservation Results in Lower Wastewater Flows
Brown and Caldwell 8

Water Conservation Results in Lower Wastewater Flows
Brown and Caldwell 9
Letters indicate different plants. Flow range is permitted flow. Ratios based on summer flow (average of July through September).
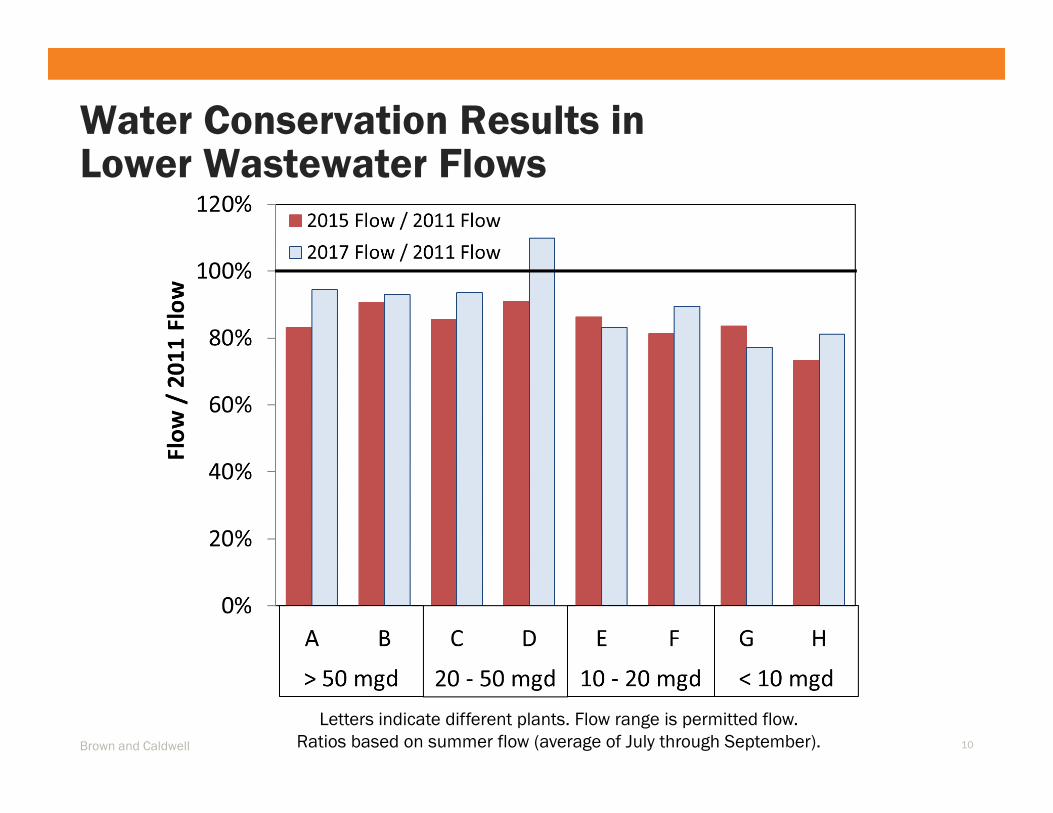
Water Conservation Results in Lower Wastewater Flows
Brown and Caldwell 10
Letters indicate different plants. Flow range is permitted flow. Ratios based on summer flow (average of July through September).
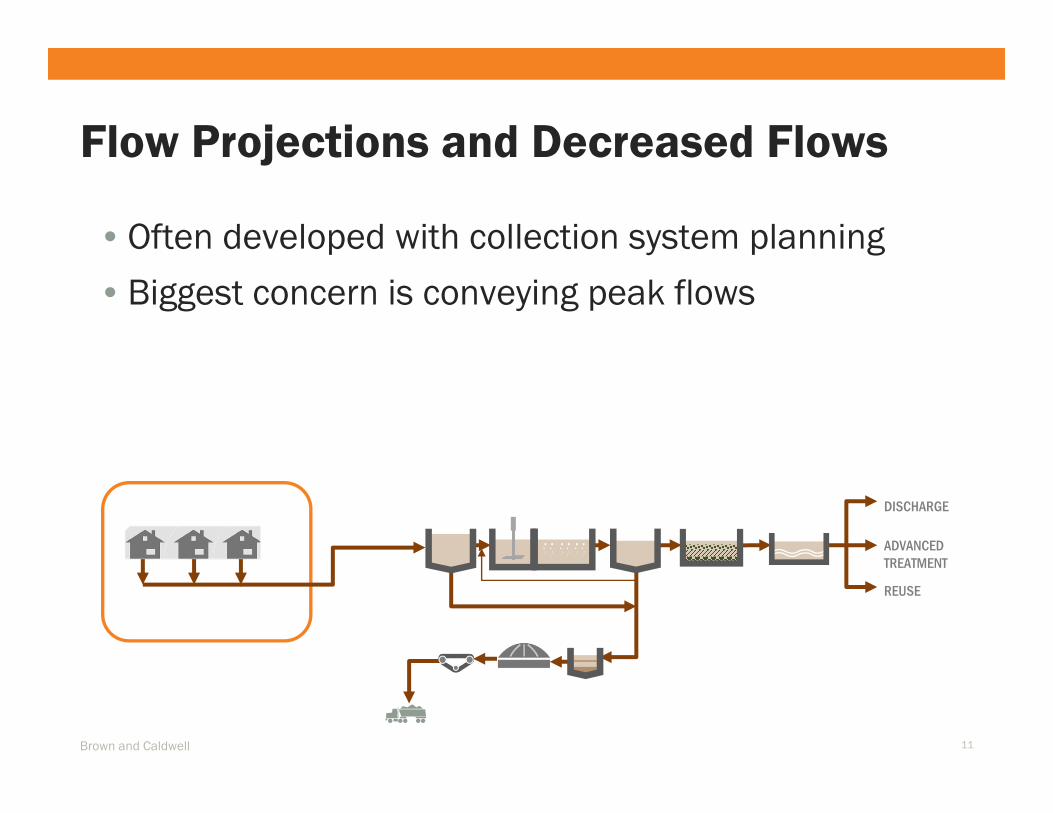
Flow Projections and Decreased Flows
Brown and Caldwell 11
• Often developed with collection system planning
• Biggest concern is conveying peak flows
REUSE
ADVANCED TREATMENT
DISCHARGE

Flow Projections Conservatively High
Brown and Caldwell 12

Treatment Process Loading Capacity
Brown and Caldwell 13
REUSE
ADVANCED TREATMENT
DISCHARGE
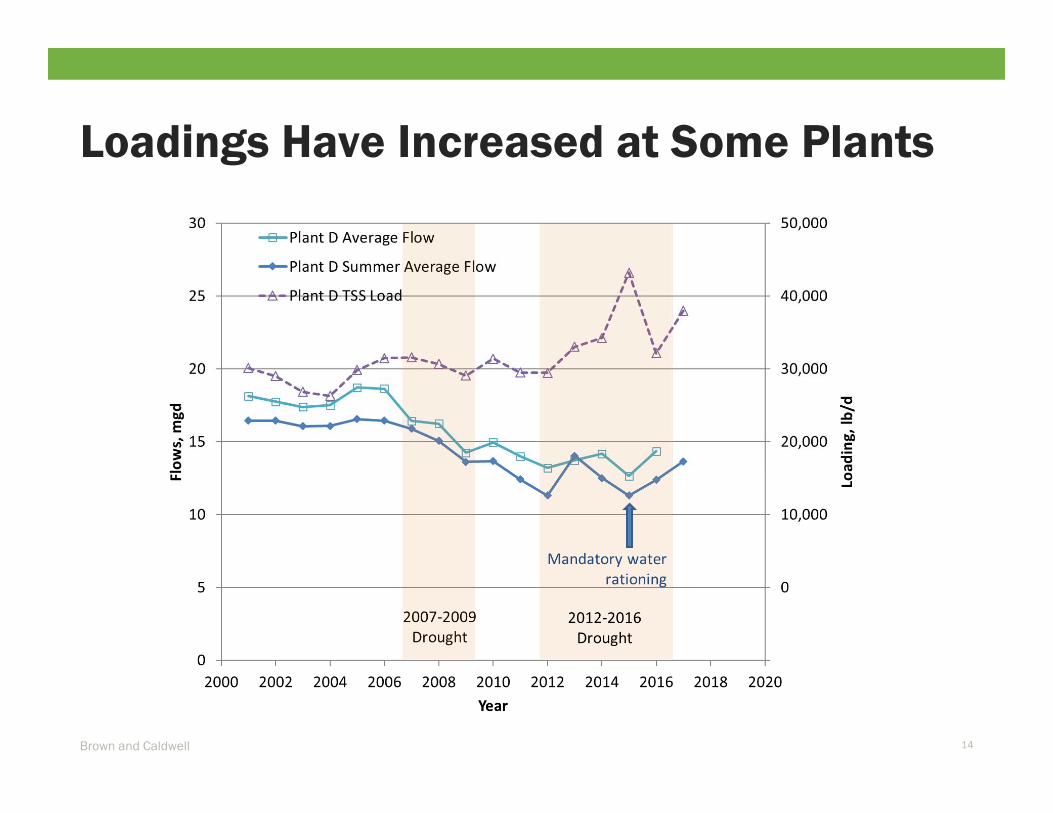
Loadings Have Increased at Some Plants
Brown and Caldwell 14
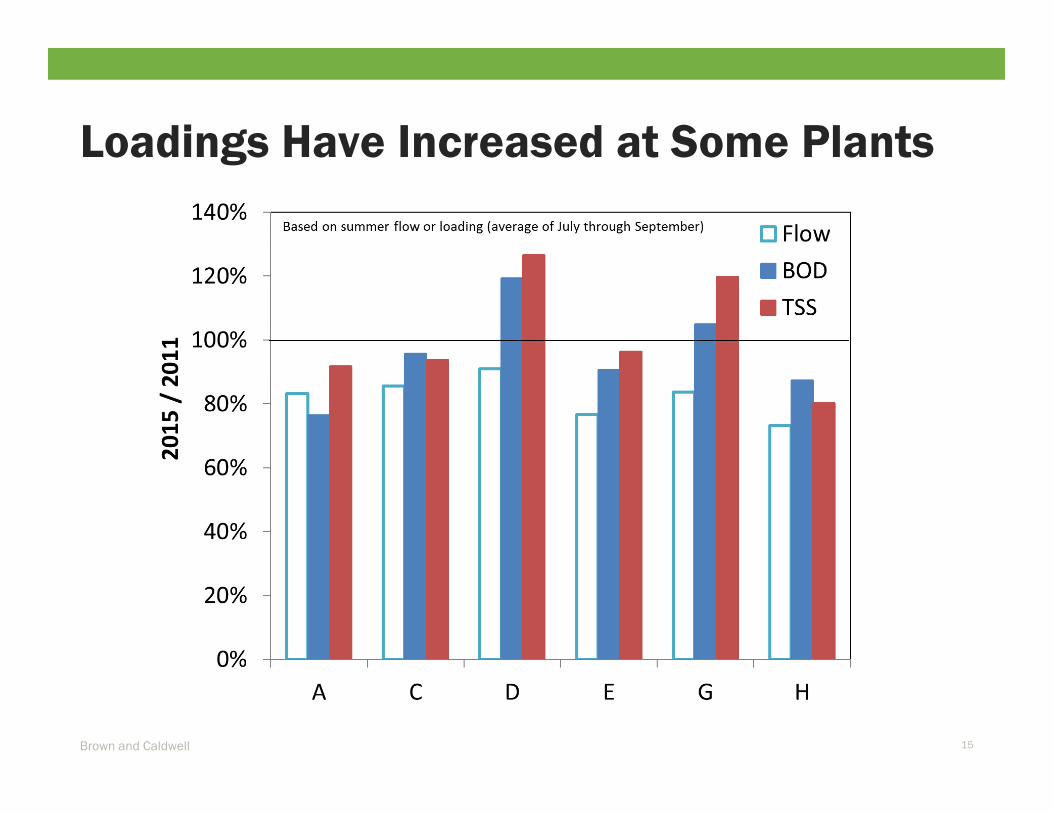
Loadings Have Increased at Some Plants
Brown and Caldwell 15
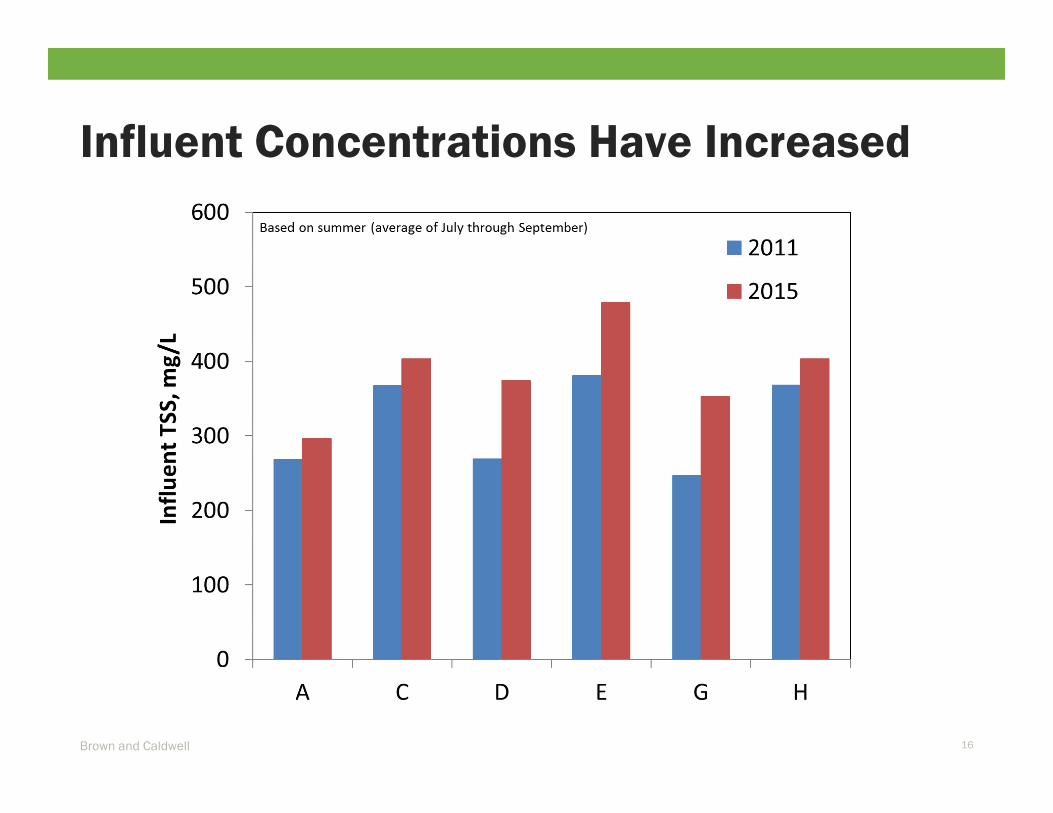
Influent Concentrations Have Increased
Brown and Caldwell 16
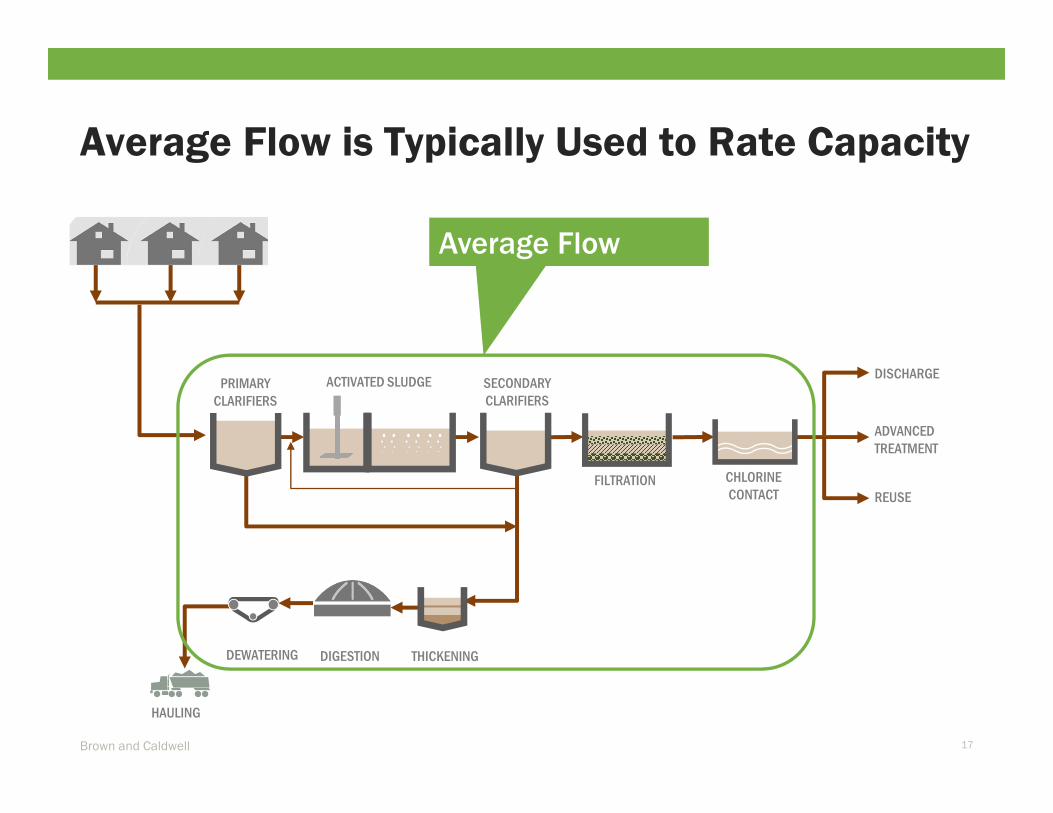
Average Flow is Typically Used to Rate Capacity
Brown and Caldwell 17
DEWATERING THICKENING
HAULING
SECONDARY CLARIFIERS
FILTRATION CHLORINE CONTACT
ACTIVATED SLUDGEPRIMARY CLARIFIERS
REUSE
DIGESTION
ADVANCED TREATMENT
DISCHARGE
Average Flow
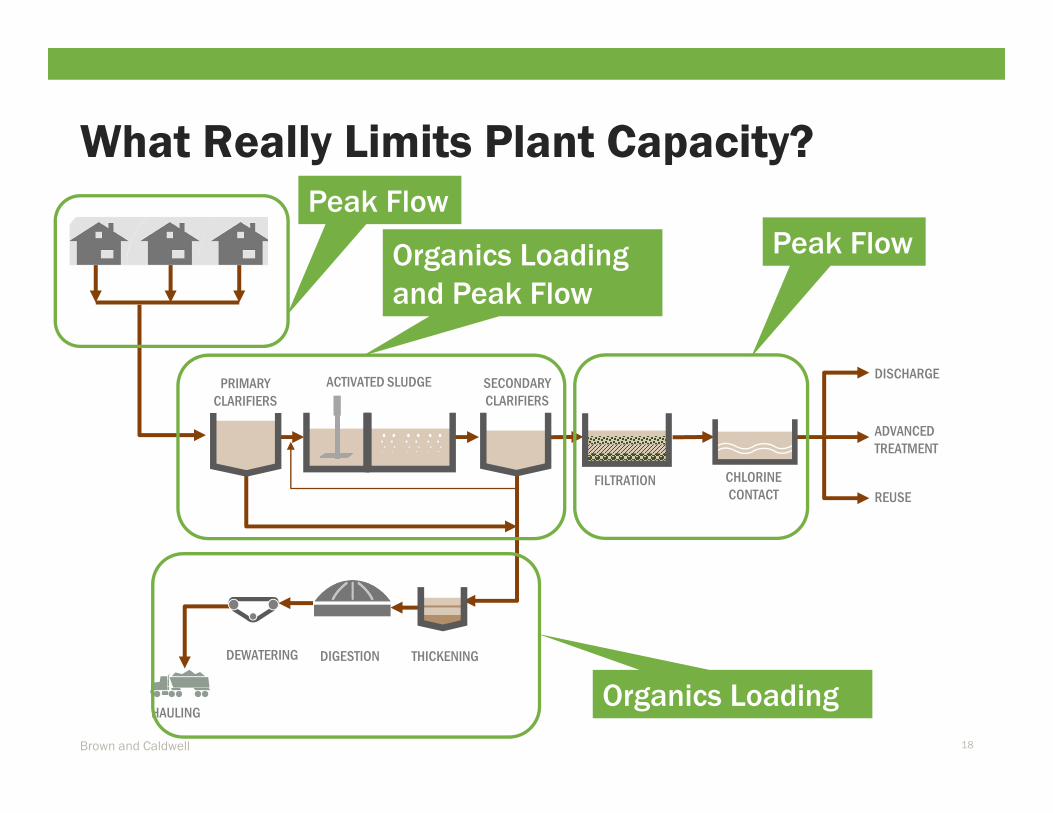
What Really Limits Plant Capacity?
Brown and Caldwell 18
DEWATERING THICKENING
HAULING
SECONDARY CLARIFIERS
FILTRATION CHLORINE CONTACT
ACTIVATED SLUDGEPRIMARY CLARIFIERS
REUSE
DIGESTION
ADVANCED TREATMENT
DISCHARGE
Organics Loading and Peak Flow
Peak FlowPeak Flow
Organics Loading

Example of Plant Capacity Change
Brown and Caldwell 19
Plant designed in the 1970s:
12 mgd at 120 gal/capita-day
20,000 lb BOD/day at 0.2 lb BOD/capita-day
Population: 100,000
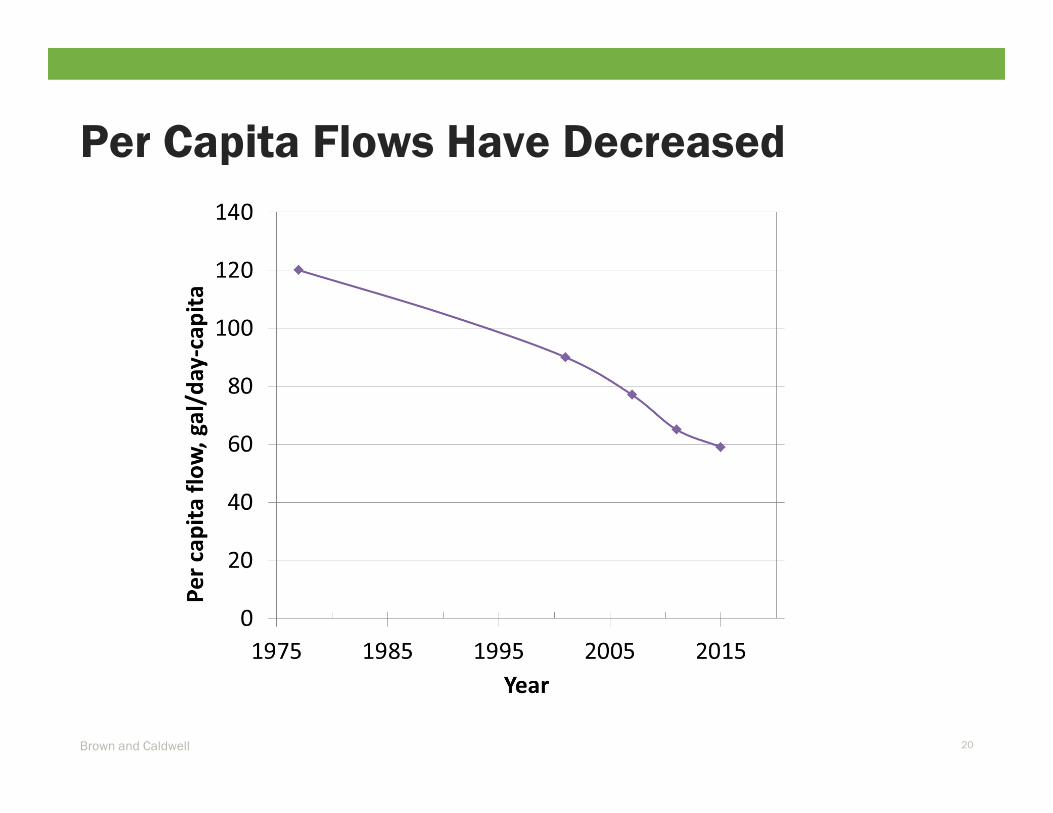
Per Capita Flows Have Decreased
Brown and Caldwell 20
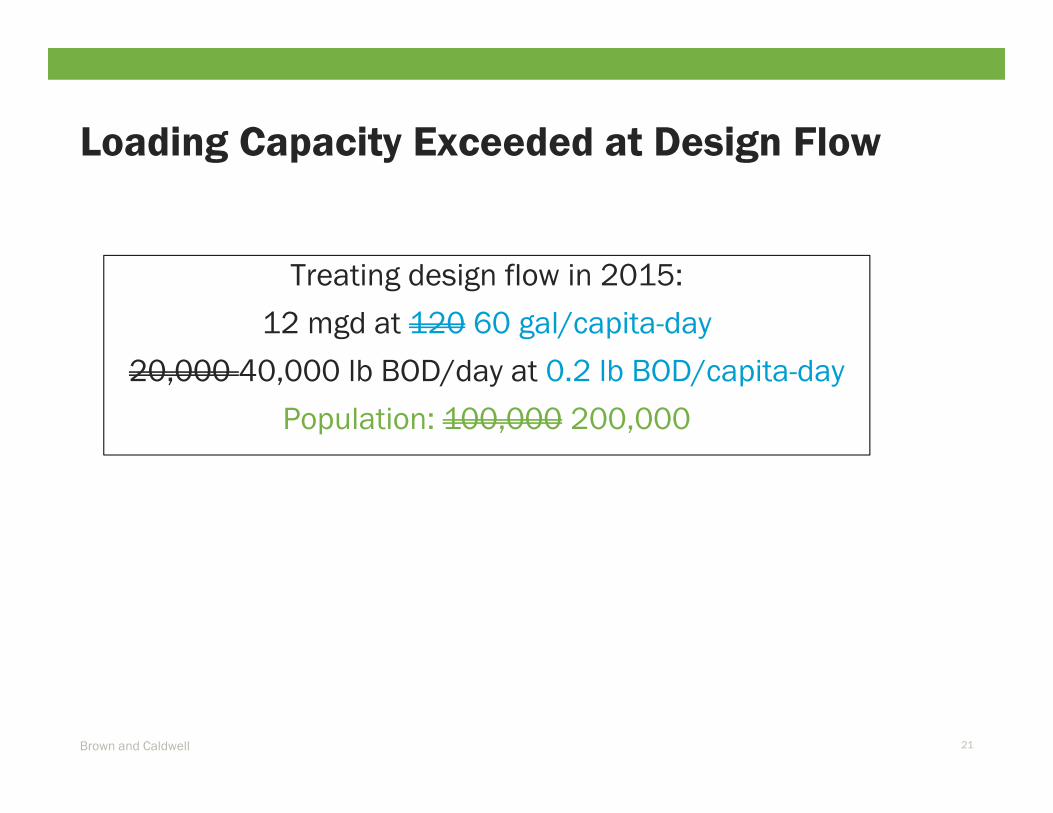
Treating design flow in 2015:
12 mgd at 120 60 gal/capita-day
20,000 40,000 lb BOD/day at 0.2 lb BOD/capita-day
Population: 100,000 200,000
Loading Capacity Exceeded at Design Flow
Brown and Caldwell 21
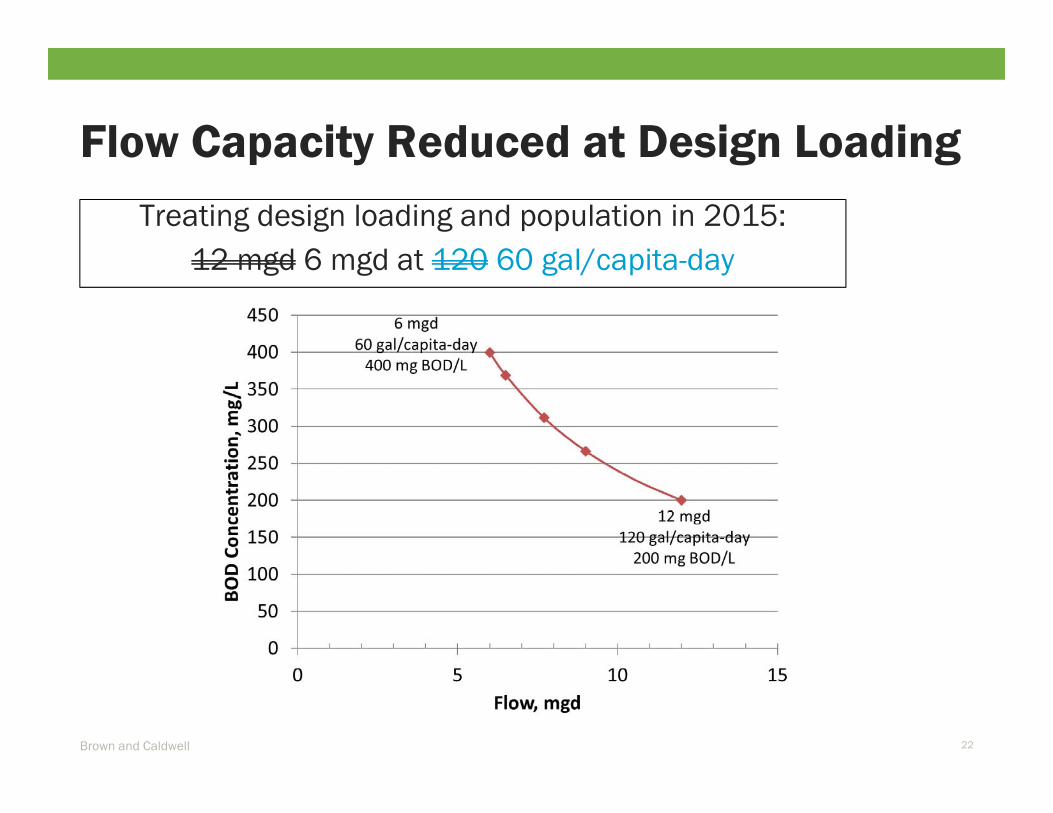
Flow Capacity Reduced at Design Loading
Brown and Caldwell 22
Treating design loading and population in 2015: 12 mgd 6 mgd at 120 60 gal/capita-day
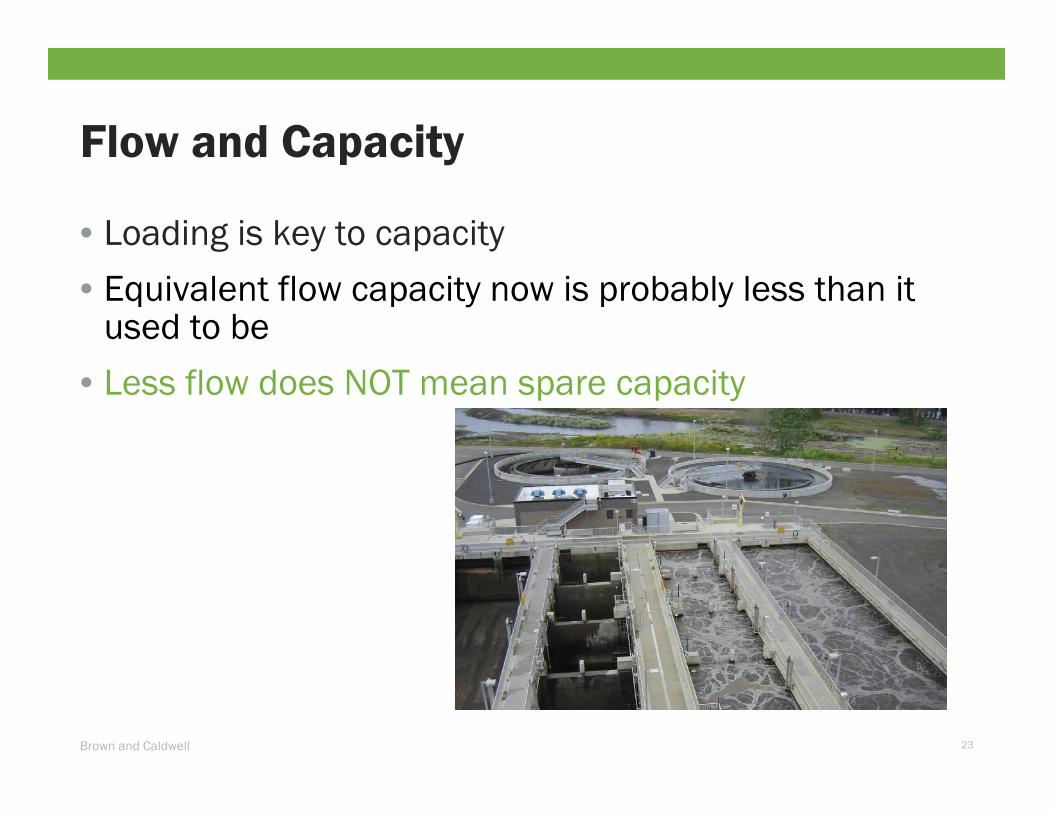
• Loading is key to capacity
• Equivalent flow capacity now is probably less than it used to be
• Less flow does NOT mean spare capacity
Flow and Capacity
Brown and Caldwell 23
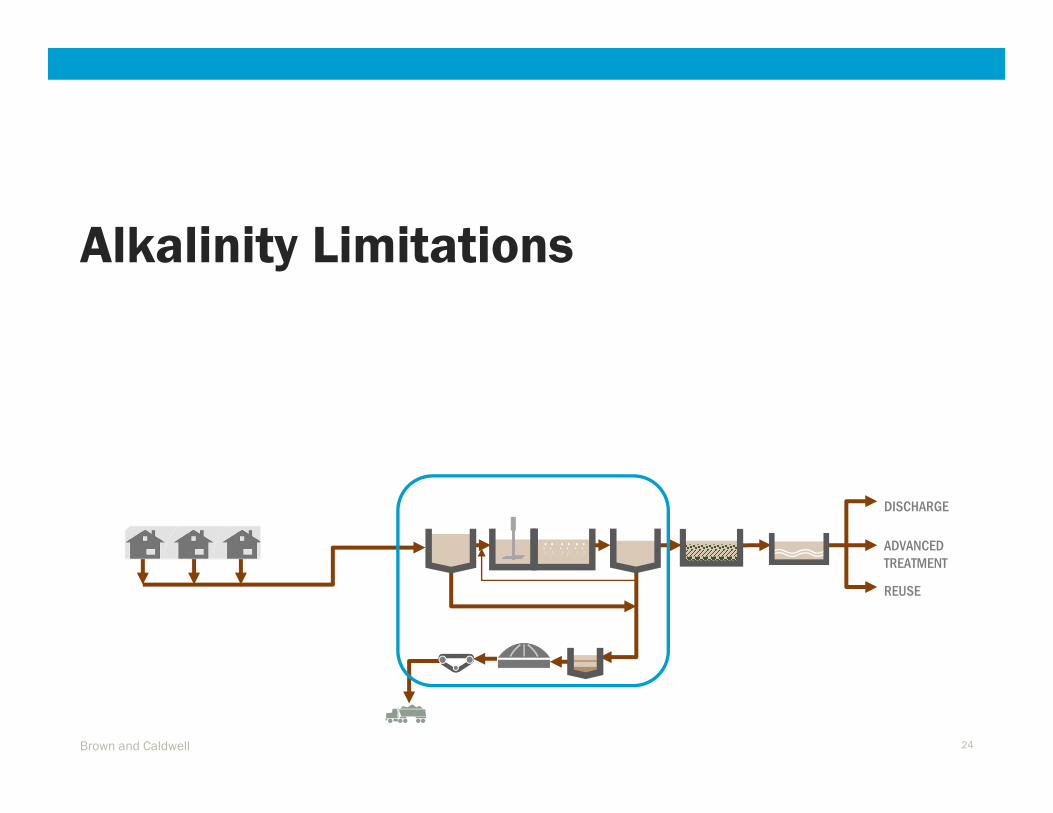
Alkalinity Limitations
Brown and Caldwell 24
REUSE
ADVANCED TREATMENT
DISCHARGE

Alkalinity is needed for nitrification
Brown and Caldwell 25
Nitrification consumes alkalinity (7.2 g Alkalinity (as CaCO3) destroyed/g N)
1 g Ammonia-N (NH3/NH4
+)
1 g Nitrite-N (NO2
-)
1 g Nitrate-N (NO3
-)
Alkalinity
O2
O2
Nitrogen Gas (N2)
1 g Nitrite -N(NO2
-)
Carbon
Carbon
Alkalinity
Alkalinity
Denitrification recovers some alkalinity

• Process includes primary clarifiers and activated sludge
• Flow decreased 12%
• Converting to nitrification
Case Study – El Estero Plant in Santa Barbara
Brown and Caldwell 26
Reference: Sawyer et al, “Planning for Future Droughts – Lessons Learned at Water Resource Recovery Facilities, WEFTEC 2016,
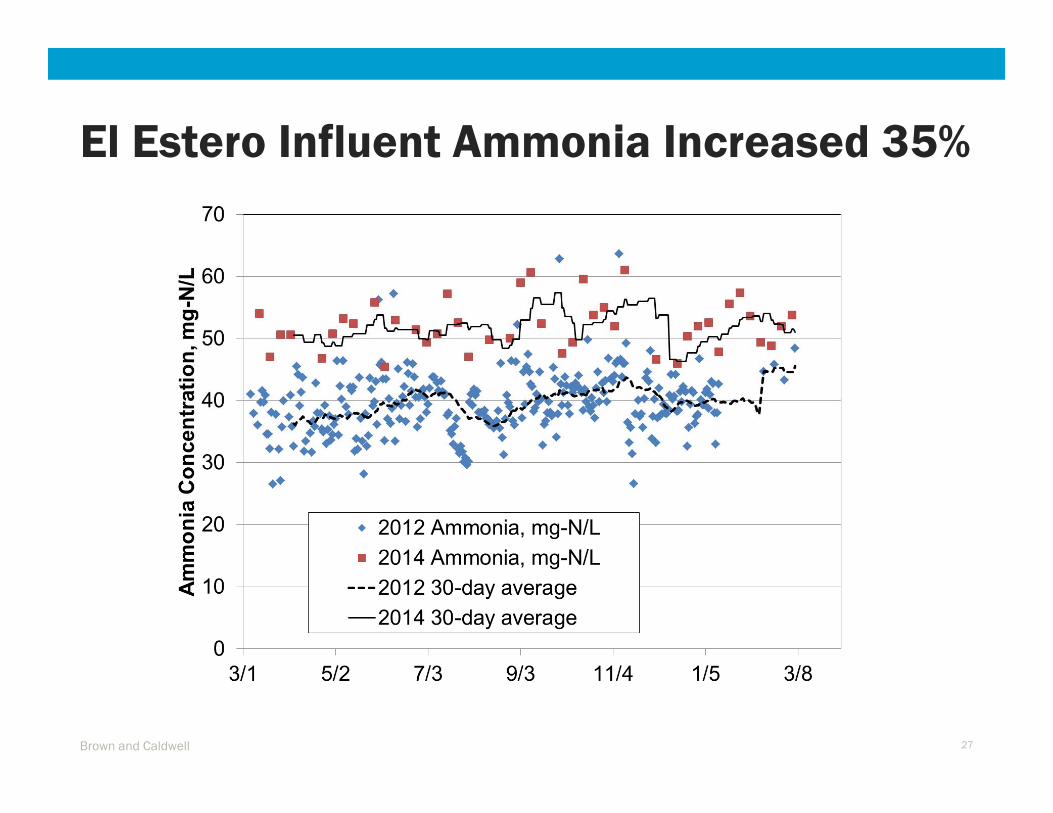
El Estero Influent Ammonia Increased 35%
Brown and Caldwell 27
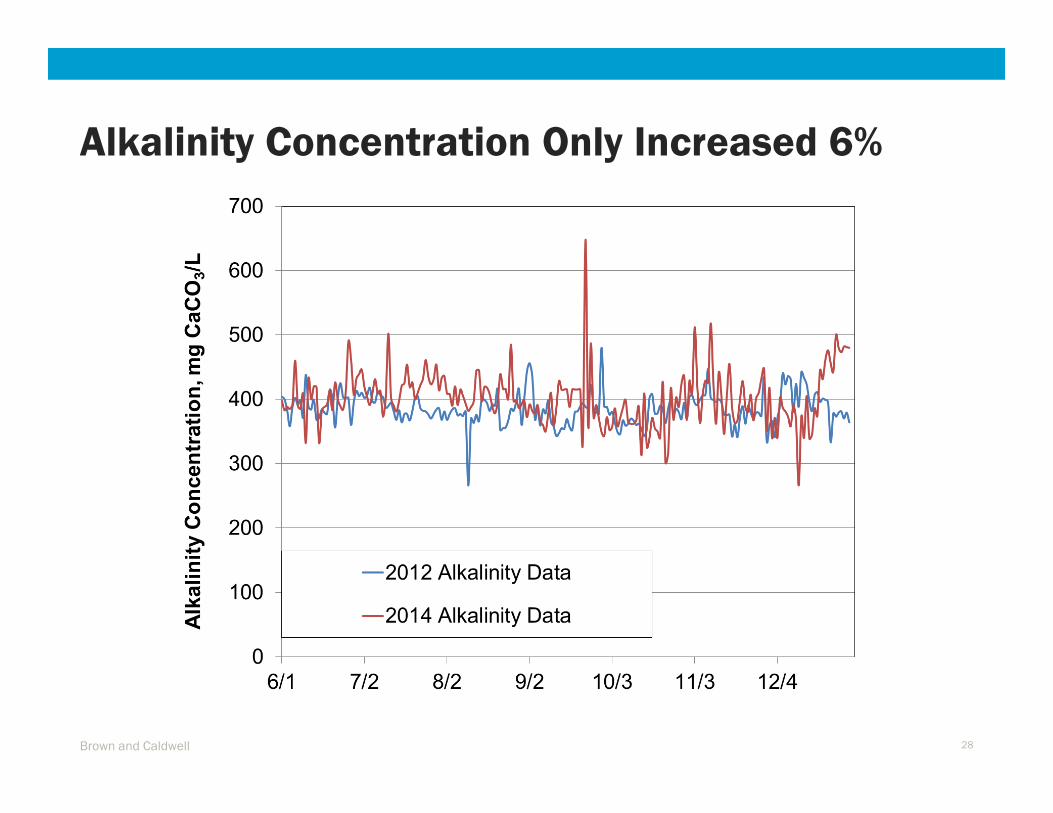
Alkalinity Concentration Only Increased 6%
Brown and Caldwell 28
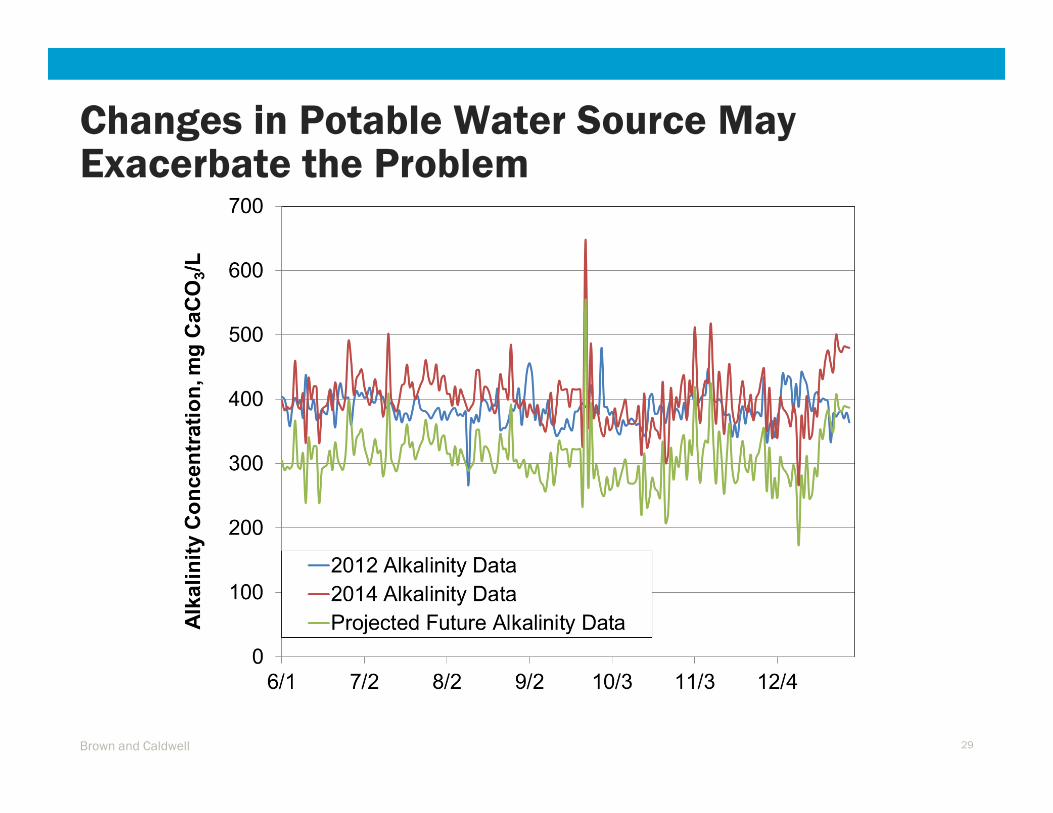
Changes in Potable Water Source May Exacerbate the Problem
Brown and Caldwell 29

• Before drought, alkalinity was sufficient
• Based on 2014 data, alkalinity supplementation was needed
• Source water changes can exacerbate the problem
• Monitor alkalinity and add chemical if needed
Alkalinity Supplementation Needed
Brown and Caldwell 30
2012 2014 Projected with desalination
Average alkalinity, mg CaCO3/L 385 402 309
Average Ammonia, mg N/L 39 52 52

Effluent Quality
Brown and Caldwell 31
REUSE
ADVANCED TREATMENT
DISCHARGE

Plant C Effluent Nitrate has Increased
Brown and Caldwell 32
Plant C
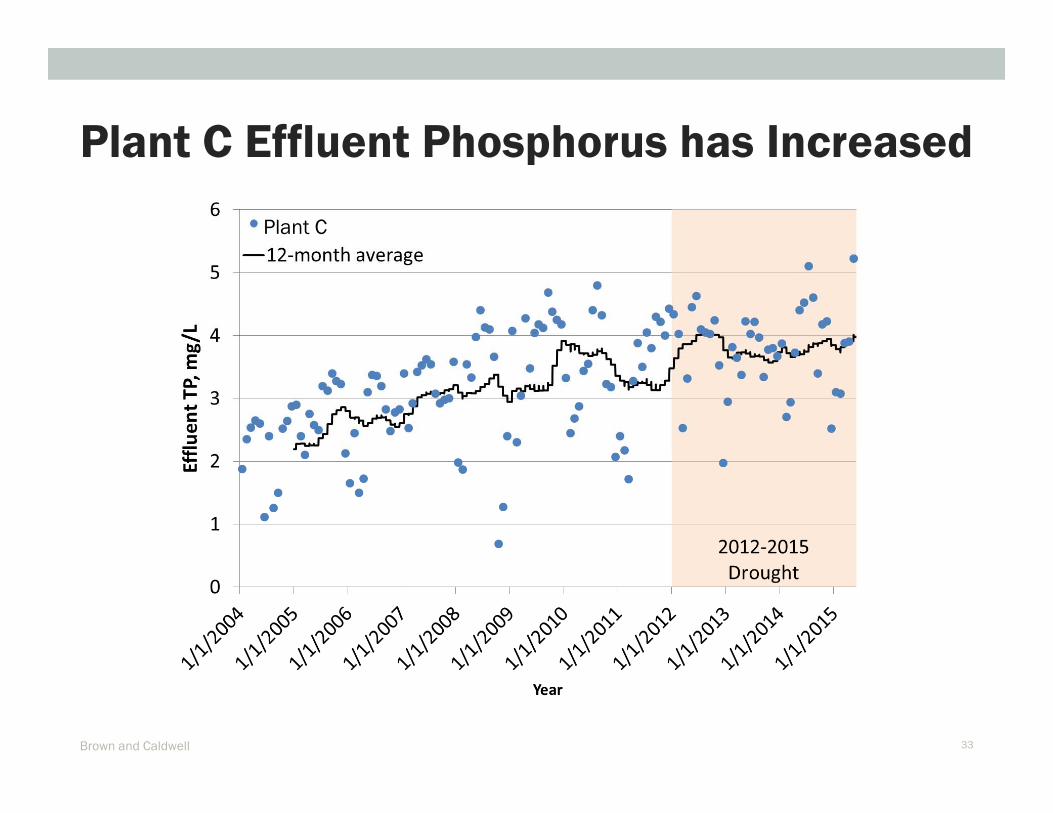
Plant C Effluent Phosphorus has Increased
Brown and Caldwell 33
Plant C
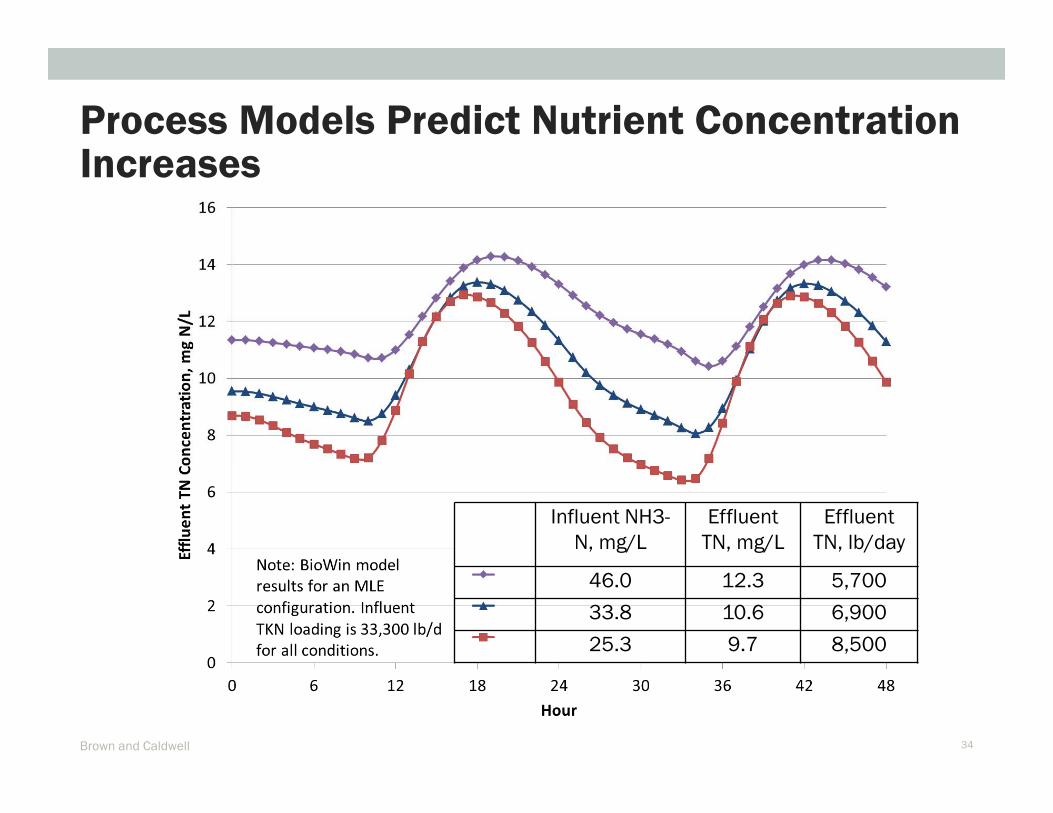
Process Models Predict Nutrient Concentration Increases
Brown and Caldwell 34
Influent NH3-N, mg/L
Effluent TN, mg/L
Effluent TN, lb/day
46.0 12.3 5,700
33.8 10.6 6,900
25.3 9.7 8,500
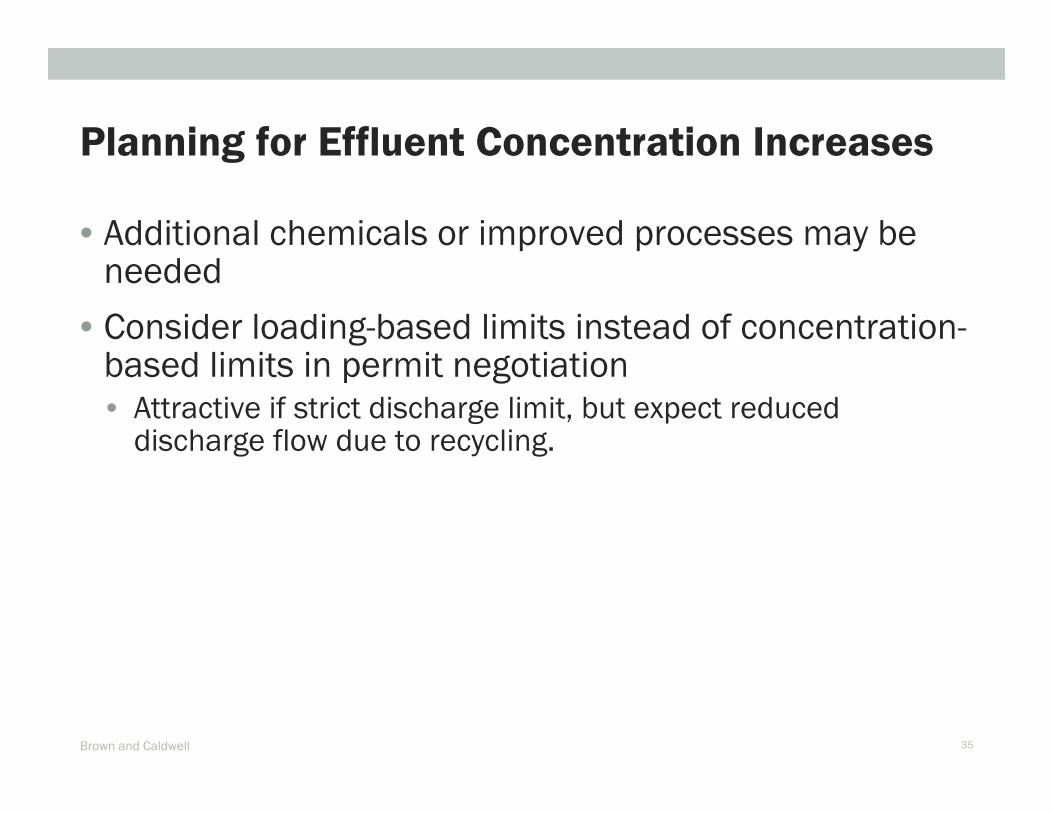
• Additional chemicals or improved processes may be needed
• Consider loading-based limits instead of concentration-based limits in permit negotiation• Attractive if strict discharge limit, but expect reduced
discharge flow due to recycling.
Planning for Effluent Concentration Increases
Brown and Caldwell 35
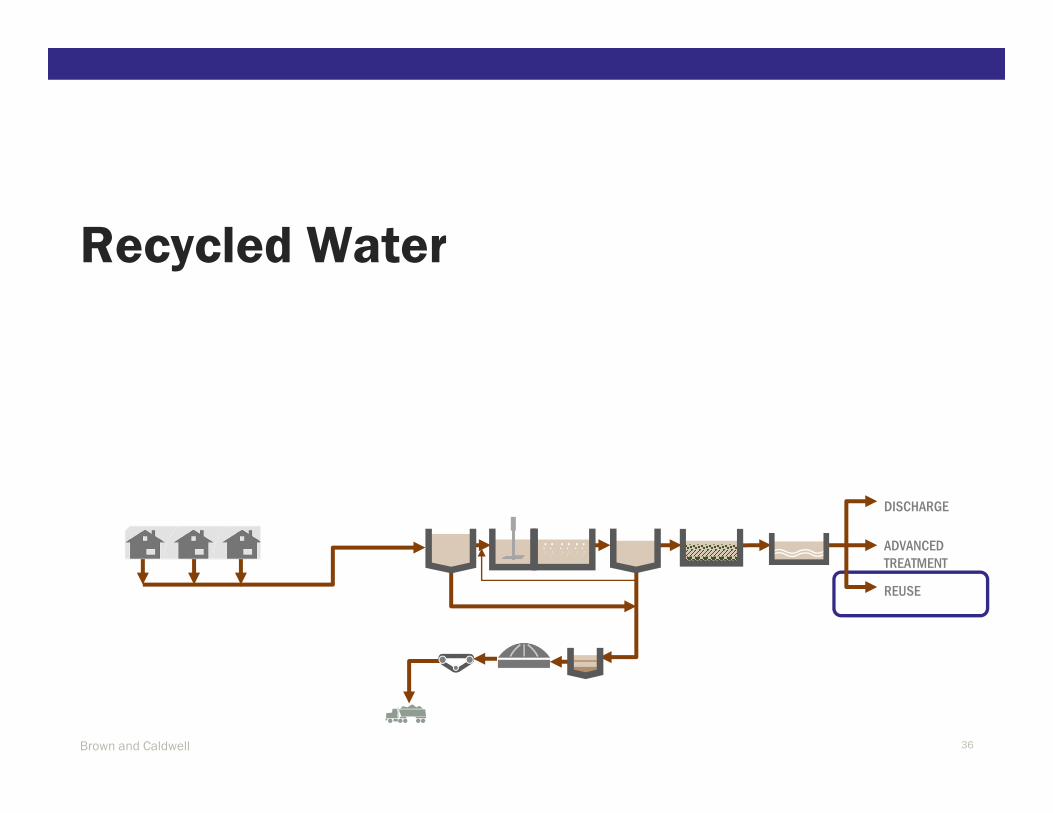
Recycled Water
Brown and Caldwell 36
REUSE
ADVANCED TREATMENT
DISCHARGE

• Excess capacity (stranded assets)
• Insufficient water to meet demands
• Revenue impacts
Less Water Available Due to Conservation
Brown and Caldwell 37
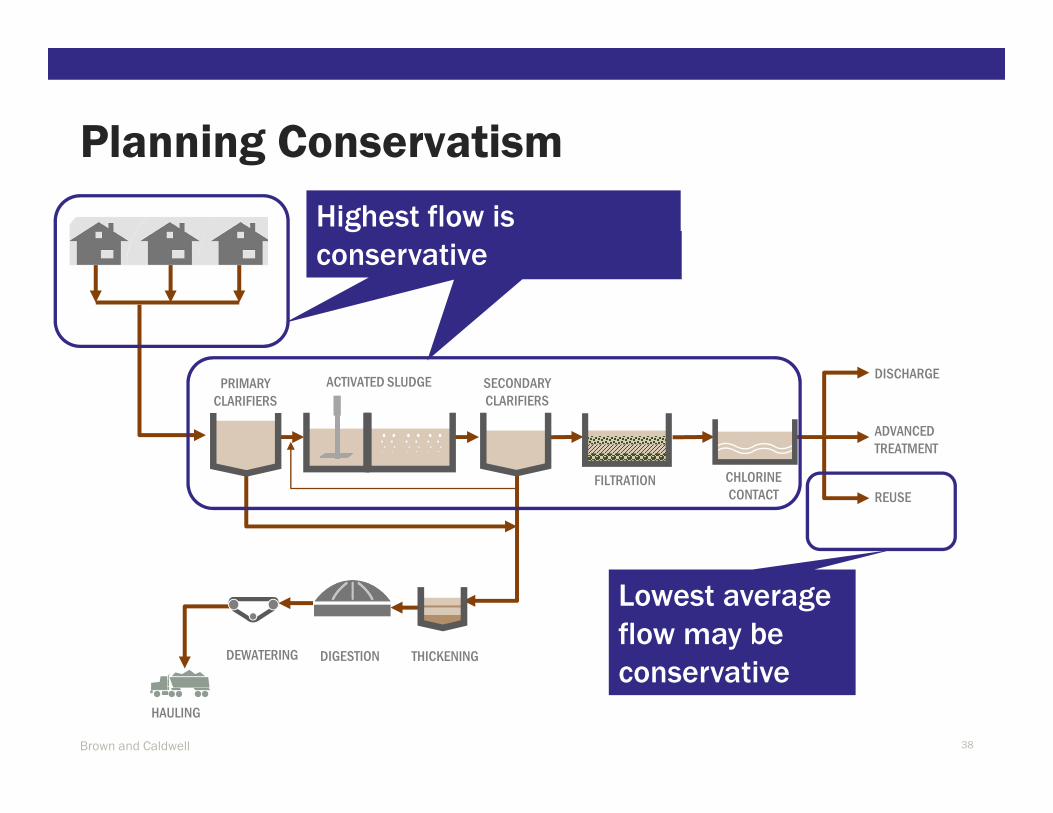
Planning Conservatism
Brown and Caldwell 38
DEWATERING THICKENING
HAULING
SECONDARY CLARIFIERS
FILTRATION CHLORINE CONTACT
ACTIVATED SLUDGEPRIMARY CLARIFIERS
REUSE
DIGESTION
ADVANCED TREATMENT
DISCHARGE
Lowest average flow may be conservative
Highest flow is conservative
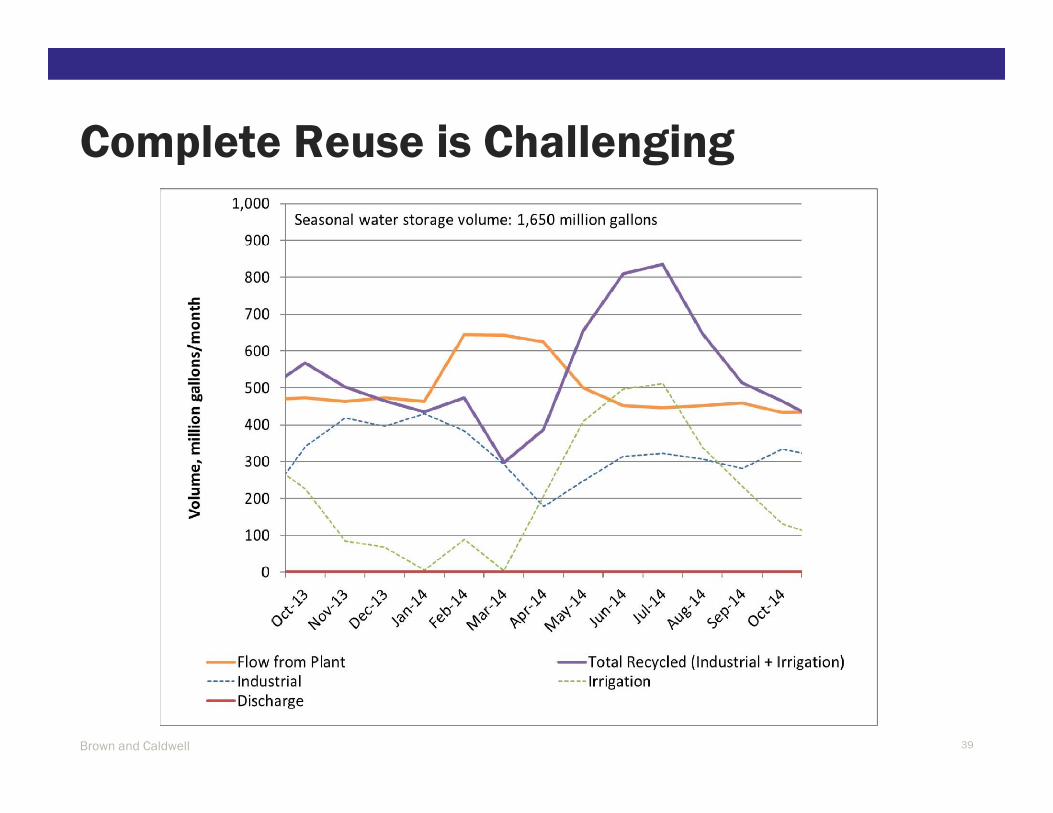
Complete Reuse is Challenging
Brown and Caldwell 39
• Less water available for recycling
• Peak reuse demand is often in a different season and year than peak influent flow
• IPR and DPR demands are year-round, but brine disposal is required
Recycled Water – Challenges
Brown and Caldwell 40

Planning for Water Conservation
Brown and Caldwell 41
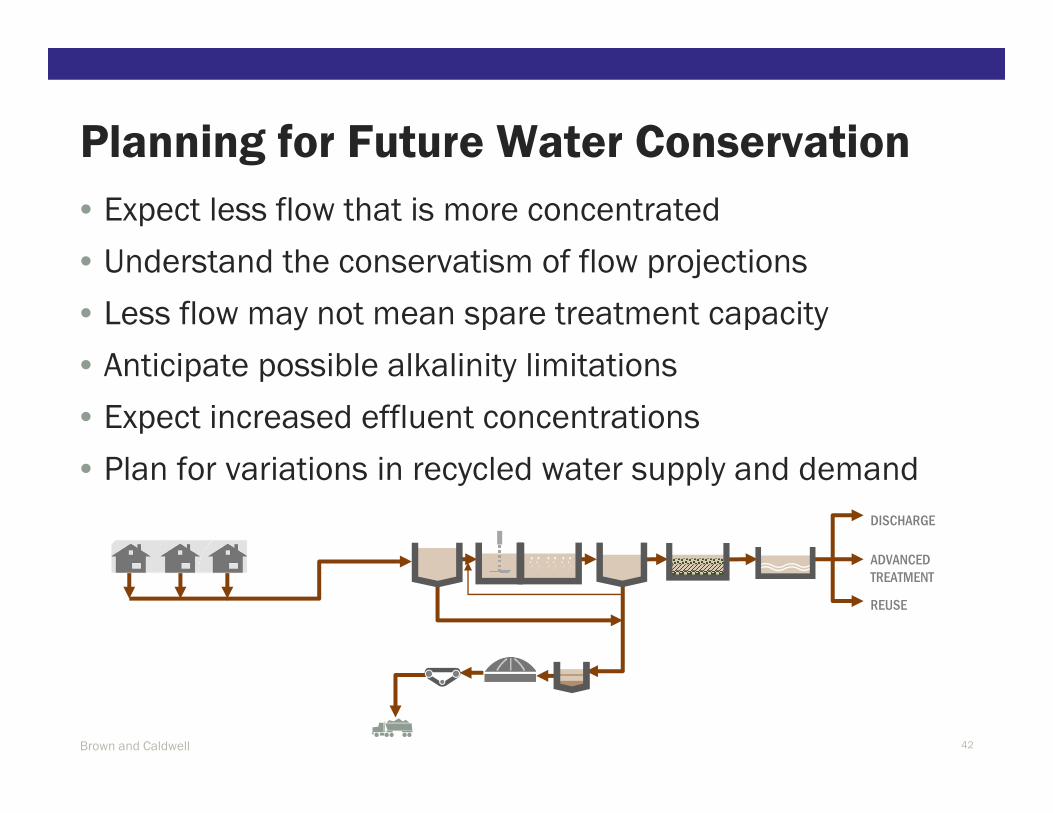
• Expect less flow that is more concentrated
• Understand the conservatism of flow projections
• Less flow may not mean spare treatment capacity
• Anticipate possible alkalinity limitations
• Expect increased effluent concentrations
• Plan for variations in recycled water supply and demand
Planning for Future Water Conservation
Brown and Caldwell 42
REUSE
ADVANCED TREATMENT
DISCHARGE

Thank You
Related Documents