Soc Choice Welf DOI 10.1007/s00355-015-0880-9 The tyranny puzzle in social preferences: an empirical investigation Frank A. Cowell · Marc Fleurbaey · Bertil Tungodden Received: 3 August 2012 / Accepted: 6 February 2015 © Springer-Verlag Berlin Heidelberg 2015 Abstract When forming their preferences about the distribution of income, rational people may be caught between two opposite forms of “tyranny.” Giving absolute priority to the worst-off imposes a sort of tyranny on the rest of the population, but giving less than absolute priority imposes a reverse form of tyranny where the worst- off may be sacrificed for the sake of small benefits to many well-off individuals. We formally show that this intriguing dilemma is more severe than previously recognised, and we examine how people negotiate such conflicts with a questionnaire-experimental study. Our study shows that both tyrannies are rejected by a majority of the participants, which makes it problematic for them to define consistent distributive preferences on the distribution. JEL Classification H20 · H21 1 Introduction It is now well established that people are deeply concerned about fairness and inequal- ity in the distribution of resources and advantages and, more interestingly, that there is F. A. Cowell London School of Economics, London, UK e-mail: [email protected] M. Fleurbaey Princeton University, Princeton, USA e-mail: mfl[email protected] B. Tungodden (B ) Norwegian School of Economics, Bergen, Norway e-mail: [email protected] 123

Welcome message from author
This document is posted to help you gain knowledge. Please leave a comment to let me know what you think about it! Share it to your friends and learn new things together.
Transcript
Soc Choice WelfDOI 10.1007/s00355-015-0880-9
The tyranny puzzle in social preferences: an empiricalinvestigation
Frank A. Cowell · Marc Fleurbaey ·Bertil Tungodden
Received: 3 August 2012 / Accepted: 6 February 2015© Springer-Verlag Berlin Heidelberg 2015
Abstract When forming their preferences about the distribution of income, rationalpeople may be caught between two opposite forms of “tyranny.” Giving absolutepriority to the worst-off imposes a sort of tyranny on the rest of the population, butgiving less than absolute priority imposes a reverse form of tyranny where the worst-off may be sacrificed for the sake of small benefits to many well-off individuals. Weformally show that this intriguing dilemma is more severe than previously recognised,and we examine how people negotiate such conflicts with a questionnaire-experimentalstudy. Our study shows that both tyrannies are rejected by a majority of the participants,which makes it problematic for them to define consistent distributive preferences onthe distribution.
JEL Classification H20 · H21
1 Introduction
It is now well established that people are deeply concerned about fairness and inequal-ity in the distribution of resources and advantages and, more interestingly, that there is
F. A. CowellLondon School of Economics, London, UKe-mail: [email protected]
M. FleurbaeyPrinceton University, Princeton, USAe-mail: [email protected]
B. Tungodden (B)Norwegian School of Economics, Bergen, Norwaye-mail: [email protected]
123
F. A. Cowell et al.
substantial diversity in their social preferences.1 In this paper we study how people’ssocial preferences about the distribution of income deal with an intriguing conflictbetween two very natural fairness principles Fleurbaey and Tungodden (2010). Eachfairness principle seeks to avoid a particular type of “tyranny”.
The first type of tyranny is where social preferences are driven entirely by weight ofnumbers, as in utilitarianism, so that a tiny benefit to sufficiently many rich individualscould justify imposing a large loss on any disadvantaged member of society; the secondis where social preferences are driven entirely by the interests of one person, as inmaximin which gives absolute priority to the worst-off individual, regardless of thecost to the rest of society. It is actually possible, in theory, to find social preferencesthat avoid the two types of tyrannies, but the resolution involves a further conflictwith other fundamental welfare principles that are almost always taken as given inconventional welfare economics.2 Hence, in welfare economics we face a dilemma inhow to deal with these two tyrannies.
Our paper makes two contributions. First, we show formally that this intriguingdilemma is more severe than previously recognised. It has so far been identified whenthe possible size of the population is unbounded. We introduce slightly stronger butstill compelling versions of the axioms used to formalize the two tyrannies, and wethen show that this dilemma may occur even in small populations. Second, we studyhow people react to this dilemma when they think about the distribution of income.Do they lean in the direction of one type of “tyranny” or the other? Are they con-cerned about the standard welfare principles that are taken for granted in conventionalwelfare economics? An empirical analysis of the issue requires elicitation of socialpreferences over possibly very large populations—in other words in situations wherelaboratory experiments are impossible; so we pursue these questions using a speciallydesigned questionnaire study of opinions.3 We find that a majority is indeed againstboth tyrannies: the dilemma thus appears to capture an important challenge in people’ssocial preferences.
The paper is organised as follows. Section 2 formally explains the nature of thedilemma that lies at the heart of this paper, introduces stronger versions of the funda-mental axioms, and reports a formal result showing that this dilemma may even occurin small populations. Sections 3 and 4 set out our approach to an empirical investiga-tion of the problem and present the main results. Sections 5 and 6 examine the role of
1 See, for example Andreoni and Miller (2002), Bellemare et al. (2008), Cappelen et al. (2007, 2013),Charness and Rabin (2002), Engel (2011), Engelmann and Strobel (2004), Fehr and Fischbacher (2002)Fisman et al. (2007), Henrich et al. (2001) and Konow (2000).2 Such social preferences have strange forms because of the violation of the Pigou-Dalton condition andreplication invariance. They either have thresholds where priority changes sharply, or become more andmore inequality averse when the population increases, which is hard to reconcile with conventional welfareprinciples.3 On the issue of the questionnaire method versus laboratory experiments note that Cappelen et al. (2011)find that questionnaire data and behavioural data support the same conclusions on social preferences. Onapplications of the questionnaire-experimental method to ethical issues underlying one or other of thetyrannies see, for example, Amiel and Cowell (1999), Amiel et al. (2009, 2012), Frohlich et al. (1987a, b),Gaertner (1994) and Gaertner and Schokkaert (2012).
123
The tyranny puzzle in social preferences
respondents’ background in accounting for the pattern of answers to the questionnairestudy and discuss the detailed comments that they provide. Section 7 concludes.
2 Theory
Social welfare functions devised by economists sometimes encounter two problems,both of which are relevant here: (1) they may conflict with certain ethical principlesthat appear to be reasonable in theory; (2) they may conflict with judgments madeby rational, well-informed people in practice. We begin (in Sect. 2.1) by setting outthe possible theoretical conflict or dilemma at the heart of the present paper; we thenmodify the theory a little to nudge it in the direction of practical judgments, but showthat the dilemma remains (Sect. 2.2). We then consider how the modified theory andthe puzzle that it presents can be confronted with evidence from people’s judgmentslater in the paper.
2.1 The dilemma
Consider the following four welfare principles that appear to be intuitively reasonable.
• Avoiding mob tyranny Such a tyranny takes place when the weight of numbers isdecisive in a social welfare judgment involving many gainers who gain very littleand few losers who lose a lot (indeed the loss may be so great that the loser is amongthe worst-off ex post).
• Avoiding individual tyranny This tyranny takes place when the well-being of oneloser is decisive in a social welfare judgment involving many gainers who gain alot and one loser who loses very little.
• Respect for progressive transfers In its strict form this means that a transfer froma poorer to a richer member of society produces a welfare decrease; in its weakerform it requires that such a transfer should not increase welfare (Dalton 1920; Pigou1912).
• Irrelevance of replication Social-welfare comparisons of income distributions areunaffected by “scaling up” the population (Dalton 1920).
It is clear that many commonly used welfare criteria are consistent with some, butnot all, of these principles. Among the most popular criteria, the additively separablesocial welfare function
∑i ϕ(xi ), where xi denotes the outcome for individual i in
terms of utility, income , wealth,... and ϕ is an increasing transform, fails to avoid mobtyranny, whereas the maximin criterion mini xi fails to avoid individual tyranny.
Previous work has focused on the logically weakest versions of the principles thatgive rise to the dilemma.4 This is the usual way in axiomatic analysis, but it may givethe impression that the dilemma is weaker than it really is. For example, consider thefollowing axiom to rule out mob tyranny: “if a worst-off person is sufficiently poor andgains enough, there is a small loss that is tolerable for all the best-off people, no matter
4 See Fleurbaey and Tungodden (2010) and Fleurbaey et al. (2009), where impossibility theorems areprovided for a domain of potential populations that contains populations of arbitrarily large size.
123
F. A. Cowell et al.
how many of these best-off people there are” (Fleurbaey and Tungodden 2010). Thisis clearly violated by the criterion
∑i ϕ(xi ) when the potential size of the population
is unbounded. But if, instead, there were a maximum potential size of the population,M , then even the simple utilitarian criterion
∑i xi satisfies the axiom. Indeed, a loss
of one unit by any individual will always prevail against a gain of 1/M units or lessby the rest of the population, when the population size cannot exceed M .
If the dilemma occurs only when there is no limit to the size of the population,one may think that it is not a very serious issue, especially in practical applications.But this impression is misleading. In this paper we demonstrate that the dilemma ismore severe than previously recognised, by showing that it may also hold for smallpopulations if the axioms contain bounds on the parameters. The guiding intuition ofour result is that even for small population, it may not be possible to give sufficientpriority to the poor person against all the rich. We therefore propose formulating avariant of the axiom that contains bounds in the form of parameters.
A similar issue arises in connection with the following axiom that rules out individ-ual tyranny: “for every person there is some small loss that can be taken as acceptable ifall the other members of society have a large enough gain and the size of the populationis large enough.” In its weakest form it is compatible with an arbitrarily high degreeof priority to the worse off (Fleurbaey and Tungodden 2010). Consider the criterion∑
i ϕ(xi ) with a concave ϕ. This satisfies the axiom, for any degree of concavity (anydegree of inequality aversion) and arbitrarily large populations: but again one maywant to limit the degree of concavity of ϕ, otherwise individual tyranny will prevail atsome point in finite populations. Therefore we also formulate a version of this axiomthat puts a bound on the priority assigned to the loser.
2.2 Result
Consider a population of size N , belonging to N , a set of non-empty finite subsets ofpositive integers. An allocation is x = (xi )i∈N ∈ R
|N |+ , where xi is the outcome for
person i and |N | denotes the cardinality of N . Let x−i = (x j ) j �=i , x−M = (xi )i∈N\M
and let x(k) denote the kth component of x by increasing order: x(1) ≤ x(2) ≤ · · · ≤x(|N |). Also let k ∗ N denote a k-replica of N (i.e., a population of size k |N | containingthe members of N and k − 1 clones for each of them) and k ∗ x the correspondingreplica of an allocation x (i.e., an allocation giving x to k disjoint |N |-sized subsetsof k ∗ N , one of which is N itself). The subsets of worst-off and best-off individualsare defined as follows:
W (x) ={
i ∈ N∣∣∣xi = min
j∈Nx j
}
,
B(x) ={
i ∈ N∣∣∣xi = max
j∈Nx j
}
.
The mean of the components of x is x̄ = 1|N |
∑i∈N xi .
Social preferences are characterised by a social preordering function R defined onN , which associates every N ∈ N with a preordering RN on R
|N |+ , with P N denoting
123
The tyranny puzzle in social preferences
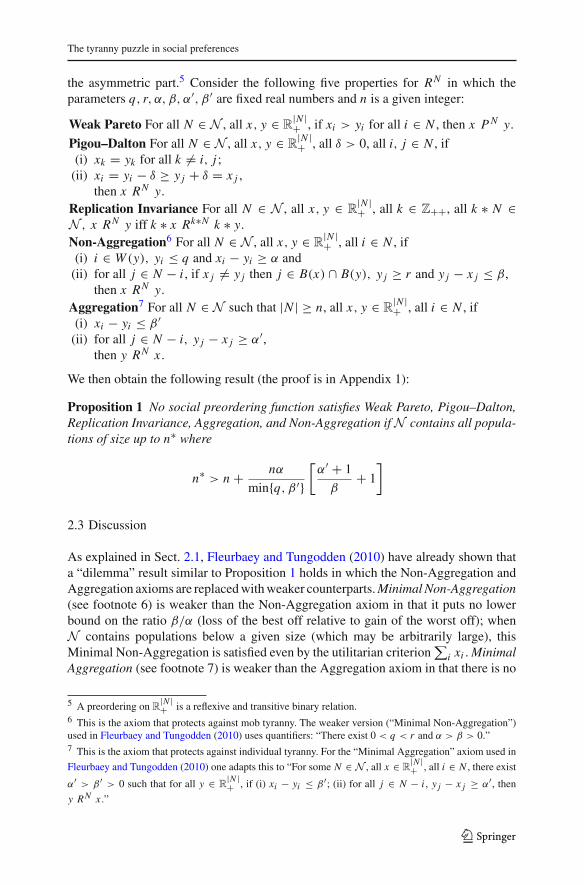
the asymmetric part.5 Consider the following five properties for RN in which theparameters q, r, α, β, α′, β ′ are fixed real numbers and n is a given integer:
Weak Pareto For all N ∈ N , all x, y ∈ R|N |+ , if xi > yi for all i ∈ N , then x P N y.
Pigou–Dalton For all N ∈ N , all x, y ∈ R|N |+ , all δ > 0, all i, j ∈ N , if
(i) xk = yk for all k �= i, j ;(ii) xi = yi − δ ≥ y j + δ = x j ,
then x RN y.Replication Invariance For all N ∈ N , all x, y ∈ R
|N |+ , all k ∈ Z++, all k ∗ N ∈
N , x RN y iff k ∗ x Rk∗N k ∗ y.Non-Aggregation6 For all N ∈ N , all x, y ∈ R
|N |+ , all i ∈ N , if
(i) i ∈ W (y), yi ≤ q and xi − yi ≥ α and(ii) for all j ∈ N − i , if x j �= y j then j ∈ B(x) ∩ B(y), y j ≥ r and y j − x j ≤ β,
then x RN y.Aggregation7 For all N ∈ N such that |N | ≥ n, all x, y ∈ R
|N |+ , all i ∈ N , if
(i) xi − yi ≤ β ′(ii) for all j ∈ N − i, y j − x j ≥ α′,
then y RN x .
We then obtain the following result (the proof is in Appendix 1):
Proposition 1 No social preordering function satisfies Weak Pareto, Pigou–Dalton,Replication Invariance, Aggregation, and Non-Aggregation if N contains all popula-tions of size up to n∗ where
n∗ > n + nα
min{q, β ′}[α′ + 1
β+ 1
]
2.3 Discussion
As explained in Sect. 2.1, Fleurbaey and Tungodden (2010) have already shown thata “dilemma” result similar to Proposition 1 holds in which the Non-Aggregation andAggregation axioms are replaced with weaker counterparts. Minimal Non-Aggregation(see footnote 6) is weaker than the Non-Aggregation axiom in that it puts no lowerbound on the ratio β/α (loss of the best off relative to gain of the worst off); whenN contains populations below a given size (which may be arbitrarily large), thisMinimal Non-Aggregation is satisfied even by the utilitarian criterion
∑i xi . Minimal
Aggregation (see footnote 7) is weaker than the Aggregation axiom in that there is no
5 A preordering on R|N |+ is a reflexive and transitive binary relation.
6 This is the axiom that protects against mob tyranny. The weaker version (“Minimal Non-Aggregation”)used in Fleurbaey and Tungodden (2010) uses quantifiers: “There exist 0 < q < r and α > β > 0.”7 This is the axiom that protects against individual tyranny. For the “Minimal Aggregation” axiom used in
Fleurbaey and Tungodden (2010) one adapts this to “For some N ∈ N , all x ∈ R|N |+ , all i ∈ N , there exist
α′ > β ′ > 0 such that for all y ∈ R|N |+ , if (i) xi − yi ≤ β ′; (ii) for all j ∈ N − i , y j − x j ≥ α′, then
y RN x .”
123
F. A. Cowell et al.
upper bound on the ratio α′/β ′ (the gain of all relative to the loss of one) and on therequired size of the population.
Proposition 1 itself says more than Fleurbaey and Tungodden (2010). It confirms theintuition that the dilemma is more severe—it may occur even for smaller populations—when the parameters n, α, α′ are small and the parameters β, β ′, q are large. That is,when one accepts a reduction in the outcome for one person for the sake of a gain toall others in a small population and with a low gain-loss ratio, while one also wantsto give priority to the worst-offs in the case of a low gain-loss ratio.
However Proposition 1 also raises what sounds like a question in practical ethics:what are reasonable values of the parameters and what is the induced size of thepopulation that generates a dilemma? It is not easy to address these issues purely onprinciple; and people with similar views may suggest substantially different values.We therefore find it interesting to study what people consider to be reasonable in thiscontext. There is a tradition of empirical ethics that has studied people’s attitudesabout redistribution by the use of questionnaire-experimental techniques (Amiel andCowell 1999; Gaertner and Schokkaert 2012). This school has examined in particularif people endorse the Pigou-Dalton principle and has sought to estimate their aversionto inequality. We apply this approach to the study of trade-offs between rich and poorinvolving the problems of mob tyranny and individual tyranny, and then use our resultto derive from the responses the size of the population that makes the dilemma appearfor the respondents.
In summary, the tension between avoiding mob tyranny and avoiding individualtyranny depends on the possible size of the population and on the degree of inequalityaversion that one is willing to adopt, in other words, on how afraid of individualtyranny one is. The greater the inequality aversion (the less one is afraid of individualtyranny), the greater the size of the population that is needed to make mob tyrannyoccur. One may therefore ask if, with the typical degree of inequality aversion thatone encounters in a society, the population size that is needed to reveal the tensionis realistic or astronomical. In the latter case the problem might be dismissed as ofpurely theoretical interest; but in the former case decision-makers and practitionersshould seriously worry about it.
3 The empirical approach
To establish whether the two tyrannies pose a dilemma in practice we needed to elicitpeople’s social preferences in situations that capture the problems discussed in Sect.2. In contrast to many contributions in the social-preference literature, conventionallaboratory experiments are not feasible here because we focus on the nature of socialpreferences for moral questions involving large populations. For this reason we haveused the established technique of preference elicitation by means of questionnaire.8
The questionnaire combines verbal and numerical questions, contains questions inboth closed and open form, and allows for respondents’ comments.
8 The method is set out in detail in Amiel and Cowell (1999); see also Gaertner and Schwettmann (2007)and the references therein for an application focusing on equity judgments that give priority to the worst-off.
123
The tyranny puzzle in social preferences
3.1 Questionnaire summary
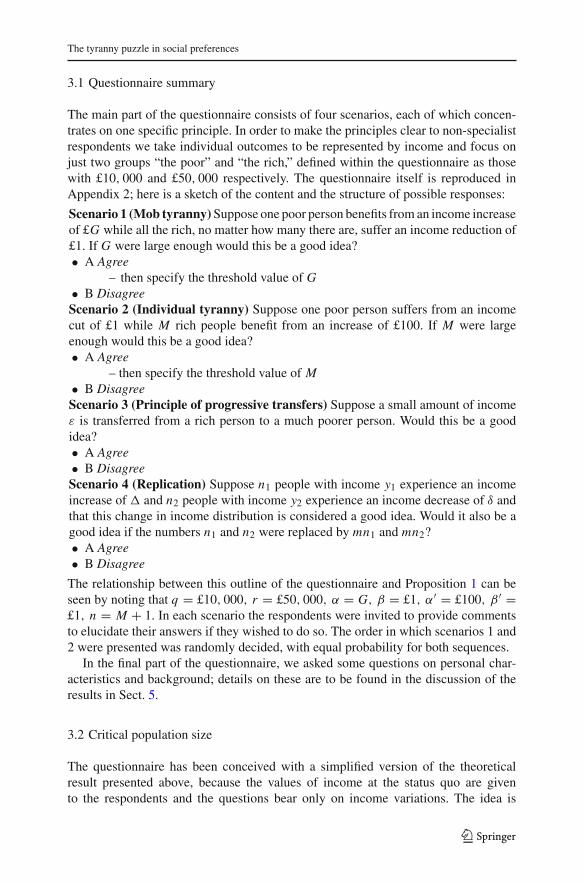
The main part of the questionnaire consists of four scenarios, each of which concen-trates on one specific principle. In order to make the principles clear to non-specialistrespondents we take individual outcomes to be represented by income and focus onjust two groups “the poor” and “the rich,” defined within the questionnaire as thosewith £10, 000 and £50, 000 respectively. The questionnaire itself is reproduced inAppendix 2; here is a sketch of the content and the structure of possible responses:
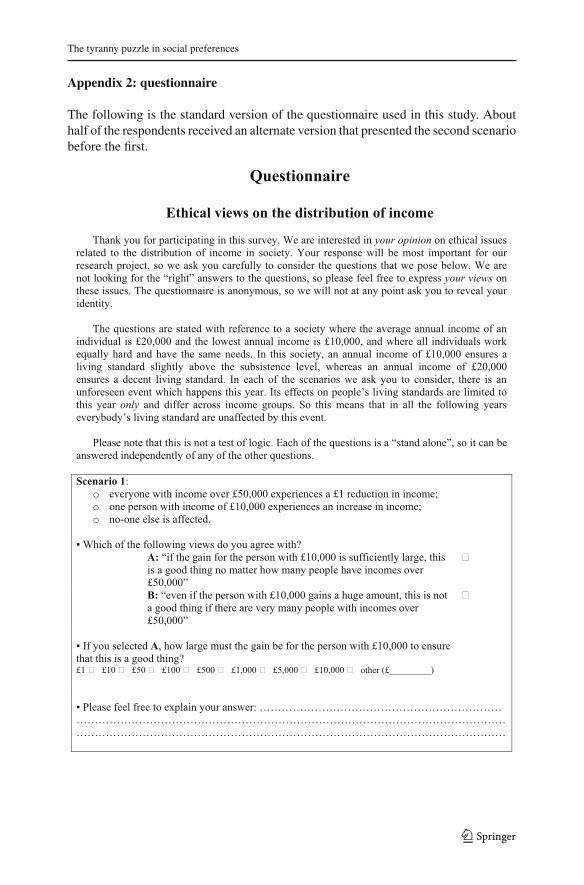
Scenario 1 (Mob tyranny) Suppose one poor person benefits from an income increaseof £G while all the rich, no matter how many there are, suffer an income reduction of£1. If G were large enough would this be a good idea?• A Agree
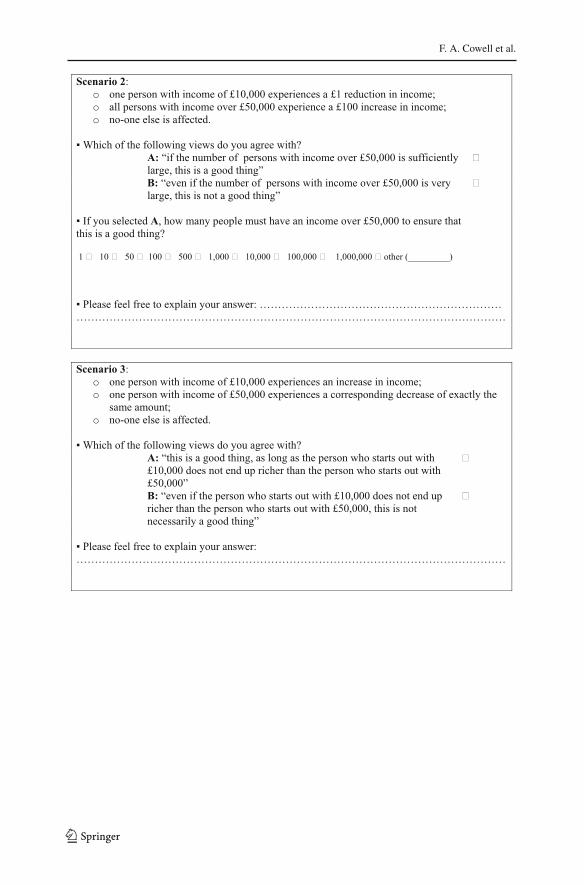
– then specify the threshold value of G• B DisagreeScenario 2 (Individual tyranny) Suppose one poor person suffers from an incomecut of £1 while M rich people benefit from an increase of £100. If M were largeenough would this be a good idea?• A Agree
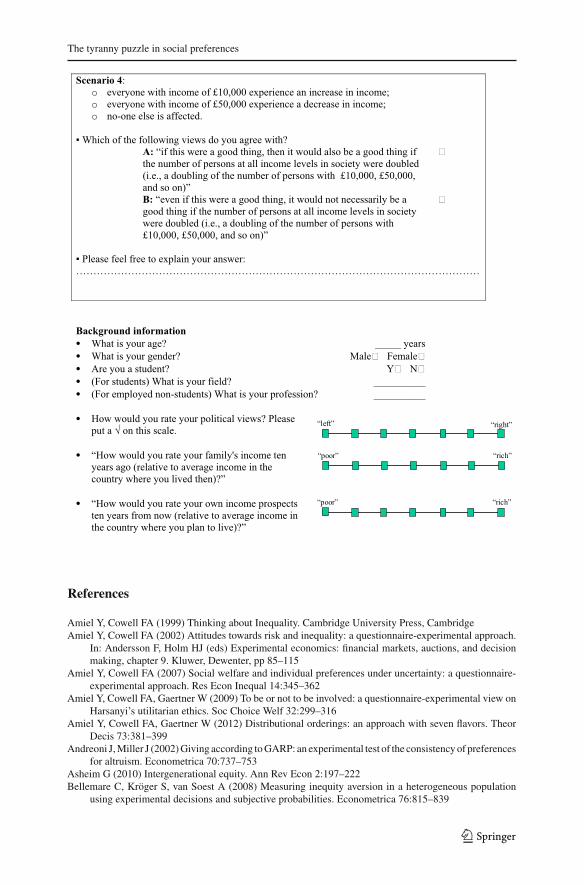
– then specify the threshold value of M• B DisagreeScenario 3 (Principle of progressive transfers) Suppose a small amount of incomeε is transferred from a rich person to a much poorer person. Would this be a goodidea?• A Agree• B DisagreeScenario 4 (Replication) Suppose n1 people with income y1 experience an incomeincrease of � and n2 people with income y2 experience an income decrease of δ andthat this change in income distribution is considered a good idea. Would it also be agood idea if the numbers n1 and n2 were replaced by mn1 and mn2?• A Agree• B Disagree
The relationship between this outline of the questionnaire and Proposition 1 can beseen by noting that q = £10, 000, r = £50, 000, α = G, β = £1, α′ = £100, β ′ =£1, n = M + 1. In each scenario the respondents were invited to provide commentsto elucidate their answers if they wished to do so. The order in which scenarios 1 and2 were presented was randomly decided, with equal probability for both sequences.
In the final part of the questionnaire, we asked some questions on personal char-acteristics and background; details on these are to be found in the discussion of theresults in Sect. 5.
3.2 Critical population size
The questionnaire has been conceived with a simplified version of the theoreticalresult presented above, because the values of income at the status quo are givento the respondents and the questions bear only on income variations. The idea is
123
F. A. Cowell et al.
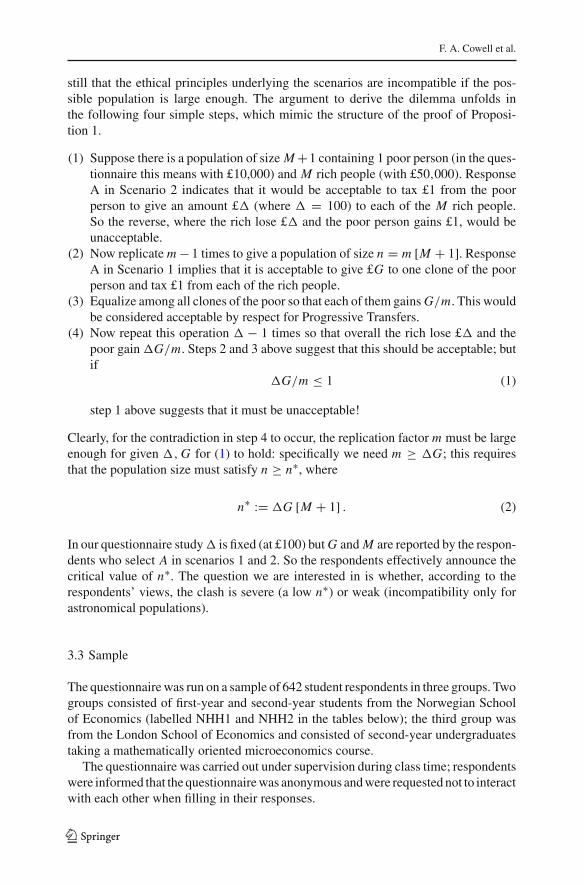
still that the ethical principles underlying the scenarios are incompatible if the pos-sible population is large enough. The argument to derive the dilemma unfolds inthe following four simple steps, which mimic the structure of the proof of Proposi-tion 1.
(1) Suppose there is a population of size M +1 containing 1 poor person (in the ques-tionnaire this means with £10,000) and M rich people (with £50,000). ResponseA in Scenario 2 indicates that it would be acceptable to tax £1 from the poorperson to give an amount £� (where � = 100) to each of the M rich people.So the reverse, where the rich lose £� and the poor person gains £1, would beunacceptable.
(2) Now replicate m − 1 times to give a population of size n = m [M + 1]. ResponseA in Scenario 1 implies that it is acceptable to give £G to one clone of the poorperson and tax £1 from each of the rich people.
(3) Equalize among all clones of the poor so that each of them gains G/m. This wouldbe considered acceptable by respect for Progressive Transfers.
(4) Now repeat this operation � − 1 times so that overall the rich lose £� and thepoor gain �G/m. Steps 2 and 3 above suggest that this should be acceptable; butif
�G/m ≤ 1 (1)
step 1 above suggests that it must be unacceptable!
Clearly, for the contradiction in step 4 to occur, the replication factor m must be largeenough for given �, G for (1) to hold: specifically we need m ≥ �G; this requiresthat the population size must satisfy n ≥ n∗, where
n∗ := �G [M + 1] . (2)
In our questionnaire study � is fixed (at £100) but G and M are reported by the respon-dents who select A in scenarios 1 and 2. So the respondents effectively announce thecritical value of n∗. The question we are interested in is whether, according to therespondents’ views, the clash is severe (a low n∗) or weak (incompatibility only forastronomical populations).
3.3 Sample
The questionnaire was run on a sample of 642 student respondents in three groups. Twogroups consisted of first-year and second-year students from the Norwegian Schoolof Economics (labelled NHH1 and NHH2 in the tables below); the third group wasfrom the London School of Economics and consisted of second-year undergraduatestaking a mathematically oriented microeconomics course.
The questionnaire was carried out under supervision during class time; respondentswere informed that the questionnaire was anonymous and were requested not to interactwith each other when filling in their responses.
123
The tyranny puzzle in social preferences
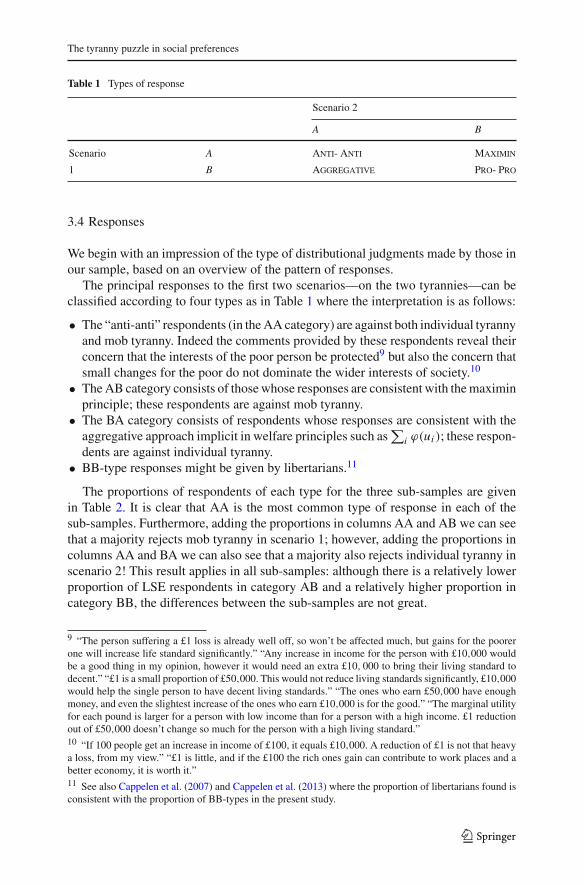
Table 1 Types of response
Scenario 2
A B
Scenario A Anti- Anti Maximin
1 B Aggregative Pro- Pro
3.4 Responses
We begin with an impression of the type of distributional judgments made by those inour sample, based on an overview of the pattern of responses.
The principal responses to the first two scenarios—on the two tyrannies—can beclassified according to four types as in Table 1 where the interpretation is as follows:
• The “anti-anti” respondents (in the AA category) are against both individual tyrannyand mob tyranny. Indeed the comments provided by these respondents reveal theirconcern that the interests of the poor person be protected9 but also the concern thatsmall changes for the poor do not dominate the wider interests of society.10
• The AB category consists of those whose responses are consistent with the maximinprinciple; these respondents are against mob tyranny.
• The BA category consists of respondents whose responses are consistent with theaggregative approach implicit in welfare principles such as
∑i ϕ(ui ); these respon-
dents are against individual tyranny.• BB-type responses might be given by libertarians.11
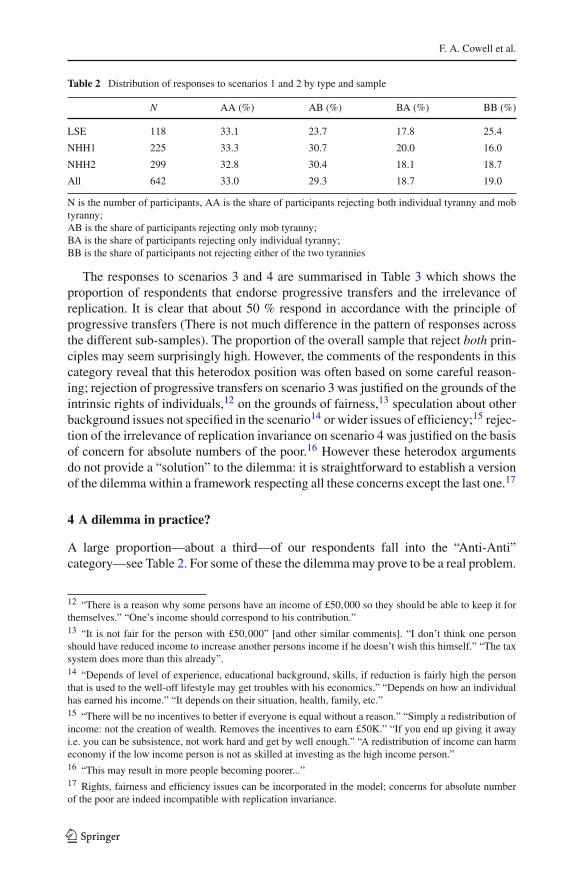
The proportions of respondents of each type for the three sub-samples are givenin Table 2. It is clear that AA is the most common type of response in each of thesub-samples. Furthermore, adding the proportions in columns AA and AB we can seethat a majority rejects mob tyranny in scenario 1; however, adding the proportions incolumns AA and BA we can also see that a majority also rejects individual tyranny inscenario 2! This result applies in all sub-samples: although there is a relatively lowerproportion of LSE respondents in category AB and a relatively higher proportion incategory BB, the differences between the sub-samples are not great.
9 “The person suffering a £1 loss is already well off, so won’t be affected much, but gains for the poorerone will increase life standard significantly.” “Any increase in income for the person with £10,000 wouldbe a good thing in my opinion, however it would need an extra £10, 000 to bring their living standard todecent.” “£1 is a small proportion of £50,000. This would not reduce living standards significantly, £10,000would help the single person to have decent living standards.” “The ones who earn £50,000 have enoughmoney, and even the slightest increase of the ones who earn £10,000 is for the good.” “The marginal utilityfor each pound is larger for a person with low income than for a person with a high income. £1 reductionout of £50,000 doesn’t change so much for the person with a high living standard.”10 “If 100 people get an increase in income of £100, it equals £10,000. A reduction of £1 is not that heavya loss, from my view.” “£1 is little, and if the £100 the rich ones gain can contribute to work places and abetter economy, it is worth it.”11 See also Cappelen et al. (2007) and Cappelen et al. (2013) where the proportion of libertarians found isconsistent with the proportion of BB-types in the present study.
123
F. A. Cowell et al.
Table 2 Distribution of responses to scenarios 1 and 2 by type and sample
N AA (%) AB (%) BA (%) BB (%)
LSE 118 33.1 23.7 17.8 25.4
NHH1 225 33.3 30.7 20.0 16.0
NHH2 299 32.8 30.4 18.1 18.7
All 642 33.0 29.3 18.7 19.0
N is the number of participants, AA is the share of participants rejecting both individual tyranny and mobtyranny;AB is the share of participants rejecting only mob tyranny;BA is the share of participants rejecting only individual tyranny;BB is the share of participants not rejecting either of the two tyrannies
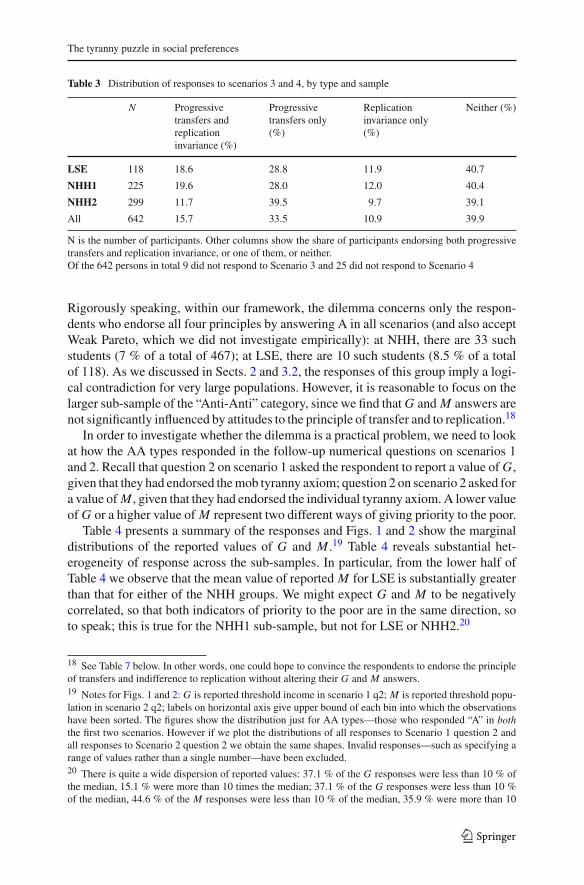
The responses to scenarios 3 and 4 are summarised in Table 3 which shows theproportion of respondents that endorse progressive transfers and the irrelevance ofreplication. It is clear that about 50 % respond in accordance with the principle ofprogressive transfers (There is not much difference in the pattern of responses acrossthe different sub-samples). The proportion of the overall sample that reject both prin-ciples may seem surprisingly high. However, the comments of the respondents in thiscategory reveal that this heterodox position was often based on some careful reason-ing; rejection of progressive transfers on scenario 3 was justified on the grounds of theintrinsic rights of individuals,12 on the grounds of fairness,13 speculation about otherbackground issues not specified in the scenario14 or wider issues of efficiency;15 rejec-tion of the irrelevance of replication invariance on scenario 4 was justified on the basisof concern for absolute numbers of the poor.16 However these heterodox argumentsdo not provide a “solution” to the dilemma: it is straightforward to establish a versionof the dilemma within a framework respecting all these concerns except the last one.17
4 A dilemma in practice?
A large proportion—about a third—of our respondents fall into the “Anti-Anti”category—see Table 2. For some of these the dilemma may prove to be a real problem.
12 “There is a reason why some persons have an income of £50,000 so they should be able to keep it forthemselves.” “One’s income should correspond to his contribution.”13 “It is not fair for the person with £50,000” [and other similar comments]. “I don’t think one personshould have reduced income to increase another persons income if he doesn’t wish this himself.” “The taxsystem does more than this already”.14 “Depends of level of experience, educational background, skills, if reduction is fairly high the personthat is used to the well-off lifestyle may get troubles with his economics.” “Depends on how an individualhas earned his income.” “It depends on their situation, health, family, etc.”15 “There will be no incentives to better if everyone is equal without a reason.” “Simply a redistribution ofincome: not the creation of wealth. Removes the incentives to earn £50K.” “If you end up giving it awayi.e. you can be subsistence, not work hard and get by well enough.” “A redistribution of income can harmeconomy if the low income person is not as skilled at investing as the high income person.”16 “This may result in more people becoming poorer...”17 Rights, fairness and efficiency issues can be incorporated in the model; concerns for absolute numberof the poor are indeed incompatible with replication invariance.
123
The tyranny puzzle in social preferences
Table 3 Distribution of responses to scenarios 3 and 4, by type and sample
N Progressivetransfers andreplicationinvariance (%)
Progressivetransfers only(%)
Replicationinvariance only(%)
Neither (%)
LSE 118 18.6 28.8 11.9 40.7
NHH1 225 19.6 28.0 12.0 40.4
NHH2 299 11.7 39.5 9.7 39.1
All 642 15.7 33.5 10.9 39.9
N is the number of participants. Other columns show the share of participants endorsing both progressivetransfers and replication invariance, or one of them, or neither.Of the 642 persons in total 9 did not respond to Scenario 3 and 25 did not respond to Scenario 4
Rigorously speaking, within our framework, the dilemma concerns only the respon-dents who endorse all four principles by answering A in all scenarios (and also acceptWeak Pareto, which we did not investigate empirically): at NHH, there are 33 suchstudents (7 % of a total of 467); at LSE, there are 10 such students (8.5 % of a totalof 118). As we discussed in Sects. 2 and 3.2, the responses of this group imply a logi-cal contradiction for very large populations. However, it is reasonable to focus on thelarger sub-sample of the “Anti-Anti” category, since we find that G and M answers arenot significantly influenced by attitudes to the principle of transfer and to replication.18
In order to investigate whether the dilemma is a practical problem, we need to lookat how the AA types responded in the follow-up numerical questions on scenarios 1and 2. Recall that question 2 on scenario 1 asked the respondent to report a value of G,given that they had endorsed the mob tyranny axiom; question 2 on scenario 2 asked fora value of M , given that they had endorsed the individual tyranny axiom. A lower valueof G or a higher value of M represent two different ways of giving priority to the poor.
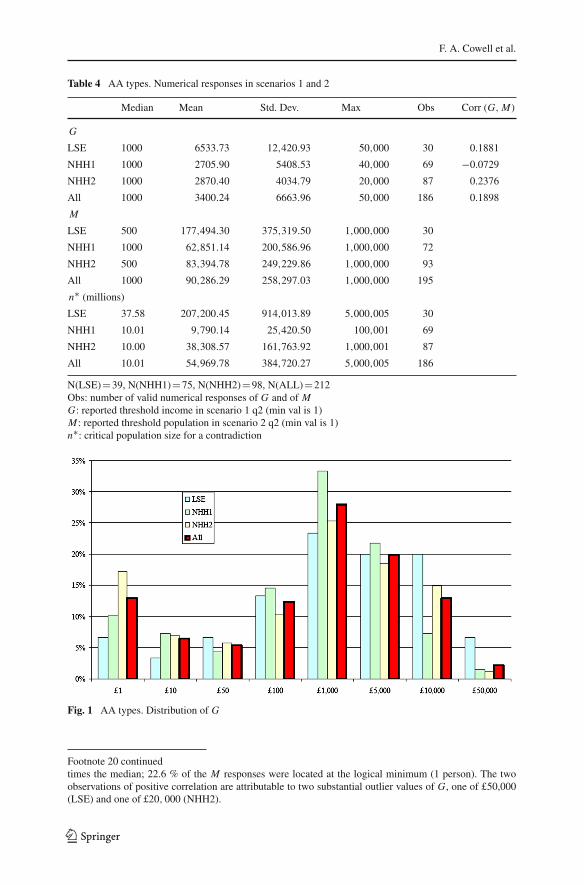
Table 4 presents a summary of the responses and Figs. 1 and 2 show the marginaldistributions of the reported values of G and M .19 Table 4 reveals substantial het-erogeneity of response across the sub-samples. In particular, from the lower half ofTable 4 we observe that the mean value of reported M for LSE is substantially greaterthan that for either of the NHH groups. We might expect G and M to be negativelycorrelated, so that both indicators of priority to the poor are in the same direction, soto speak; this is true for the NHH1 sub-sample, but not for LSE or NHH2.20
18 See Table 7 below. In other words, one could hope to convince the respondents to endorse the principleof transfers and indifference to replication without altering their G and M answers.19 Notes for Figs. 1 and 2: G is reported threshold income in scenario 1 q2; M is reported threshold popu-lation in scenario 2 q2; labels on horizontal axis give upper bound of each bin into which the observationshave been sorted. The figures show the distribution just for AA types—those who responded “A” in boththe first two scenarios. However if we plot the distributions of all responses to Scenario 1 question 2 andall responses to Scenario 2 question 2 we obtain the same shapes. Invalid responses—such as specifying arange of values rather than a single number—have been excluded.20 There is quite a wide dispersion of reported values: 37.1 % of the G responses were less than 10 % ofthe median, 15.1 % were more than 10 times the median; 37.1 % of the G responses were less than 10 %of the median, 44.6 % of the M responses were less than 10 % of the median, 35.9 % were more than 10
123
F. A. Cowell et al.
Table 4 AA types. Numerical responses in scenarios 1 and 2
Median Mean Std. Dev. Max Obs Corr (G, M)
G
LSE 1000 6533.73 12,420.93 50,000 30 0.1881
NHH1 1000 2705.90 5408.53 40,000 69 −0.0729
NHH2 1000 2870.40 4034.79 20,000 87 0.2376
All 1000 3400.24 6663.96 50,000 186 0.1898
M
LSE 500 177,494.30 375,319.50 1,000,000 30
NHH1 1000 62,851.14 200,586.96 1,000,000 72
NHH2 500 83,394.78 249,229.86 1,000,000 93
All 1000 90,286.29 258,297.03 1,000,000 195
n∗ (millions)
LSE 37.58 207,200.45 914,013.89 5,000,005 30
NHH1 10.01 9,790.14 25,420.50 100,001 69
NHH2 10.00 38,308.57 161,763.92 1,000,001 87
All 10.01 54,969.78 384,720.27 5,000,005 186
N(LSE)=39, N(NHH1)=75, N(NHH2)=98, N(ALL)=212Obs: number of valid numerical responses of G and of MG: reported threshold income in scenario 1 q2 (min val is 1)M : reported threshold population in scenario 2 q2 (min val is 1)n∗: critical population size for a contradiction
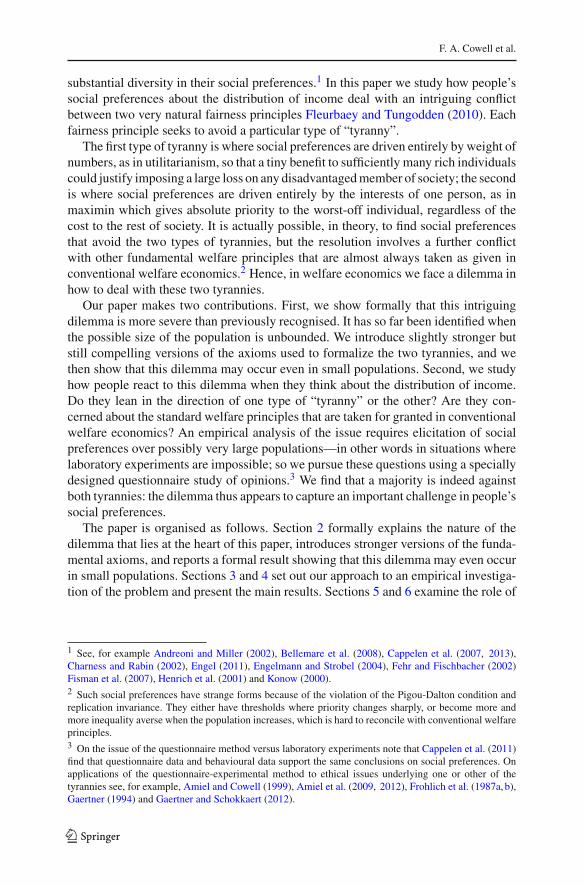
Fig. 1 AA types. Distribution of G
Footnote 20 continuedtimes the median; 22.6 % of the M responses were located at the logical minimum (1 person). The twoobservations of positive correlation are attributable to two substantial outlier values of G, one of £50,000(LSE) and one of £20, 000 (NHH2).
123
The tyranny puzzle in social preferences
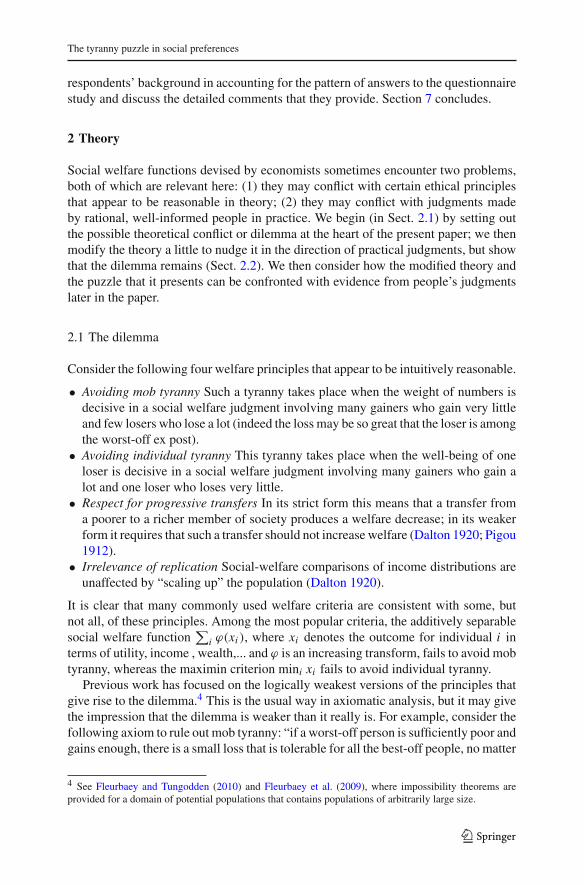
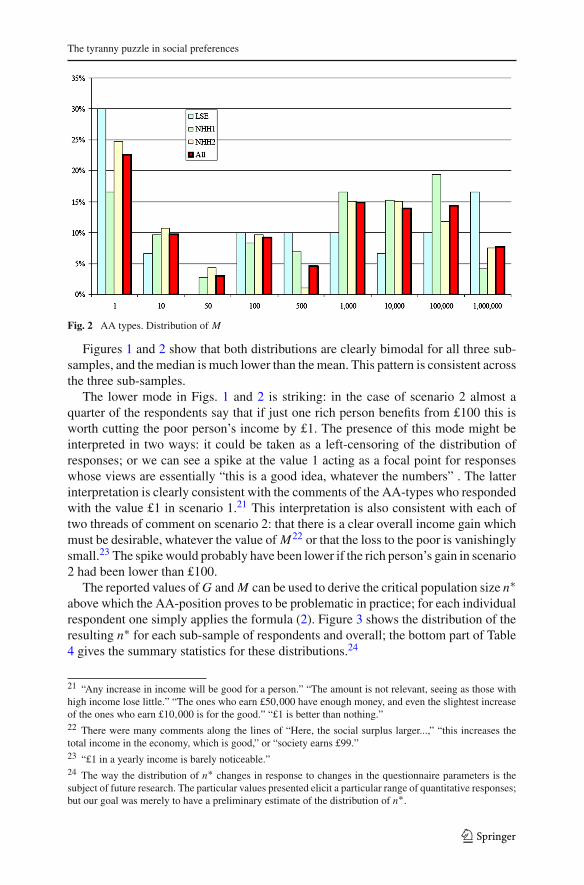
Fig. 2 AA types. Distribution of M
Figures 1 and 2 show that both distributions are clearly bimodal for all three sub-samples, and the median is much lower than the mean. This pattern is consistent acrossthe three sub-samples.
The lower mode in Figs. 1 and 2 is striking: in the case of scenario 2 almost aquarter of the respondents say that if just one rich person benefits from £100 this isworth cutting the poor person’s income by £1. The presence of this mode might beinterpreted in two ways: it could be taken as a left-censoring of the distribution ofresponses; or we can see a spike at the value 1 acting as a focal point for responseswhose views are essentially “this is a good idea, whatever the numbers” . The latterinterpretation is clearly consistent with the comments of the AA-types who respondedwith the value £1 in scenario 1.21 This interpretation is also consistent with each oftwo threads of comment on scenario 2: that there is a clear overall income gain whichmust be desirable, whatever the value of M22 or that the loss to the poor is vanishinglysmall.23 The spike would probably have been lower if the rich person’s gain in scenario2 had been lower than £100.
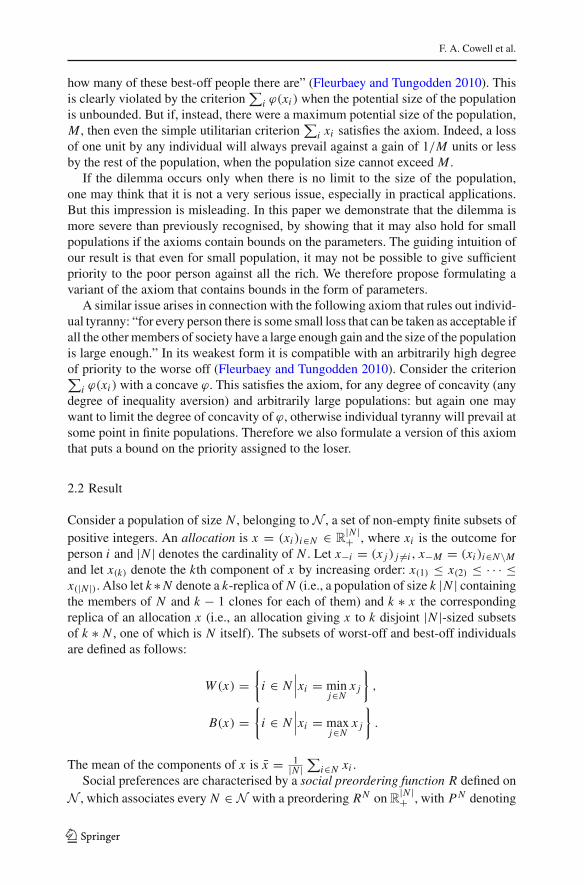
The reported values of G and M can be used to derive the critical population size n∗above which the AA-position proves to be problematic in practice; for each individualrespondent one simply applies the formula (2). Figure 3 shows the distribution of theresulting n∗ for each sub-sample of respondents and overall; the bottom part of Table4 gives the summary statistics for these distributions.24
21 “Any increase in income will be good for a person.” “The amount is not relevant, seeing as those withhigh income lose little.” “The ones who earn £50,000 have enough money, and even the slightest increaseof the ones who earn £10,000 is for the good.” “£1 is better than nothing.”22 There were many comments along the lines of “Here, the social surplus larger...,” “this increases thetotal income in the economy, which is good,” or “society earns £99.”23 “£1 in a yearly income is barely noticeable.”24 The way the distribution of n∗ changes in response to changes in the questionnaire parameters is thesubject of future research. The particular values presented elicit a particular range of quantitative responses;but our goal was merely to have a preliminary estimate of the distribution of n∗.
123
F. A. Cowell et al.
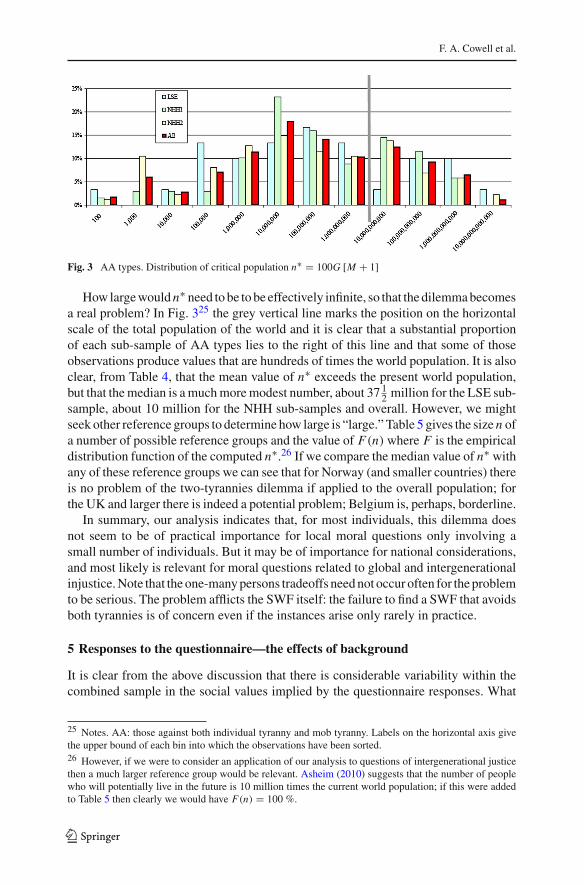
Fig. 3 AA types. Distribution of critical population n∗ = 100G [M + 1]
How large would n∗ need to be to be effectively infinite, so that the dilemma becomesa real problem? In Fig. 325 the grey vertical line marks the position on the horizontalscale of the total population of the world and it is clear that a substantial proportionof each sub-sample of AA types lies to the right of this line and that some of thoseobservations produce values that are hundreds of times the world population. It is alsoclear, from Table 4, that the mean value of n∗ exceeds the present world population,but that the median is a much more modest number, about 37 1
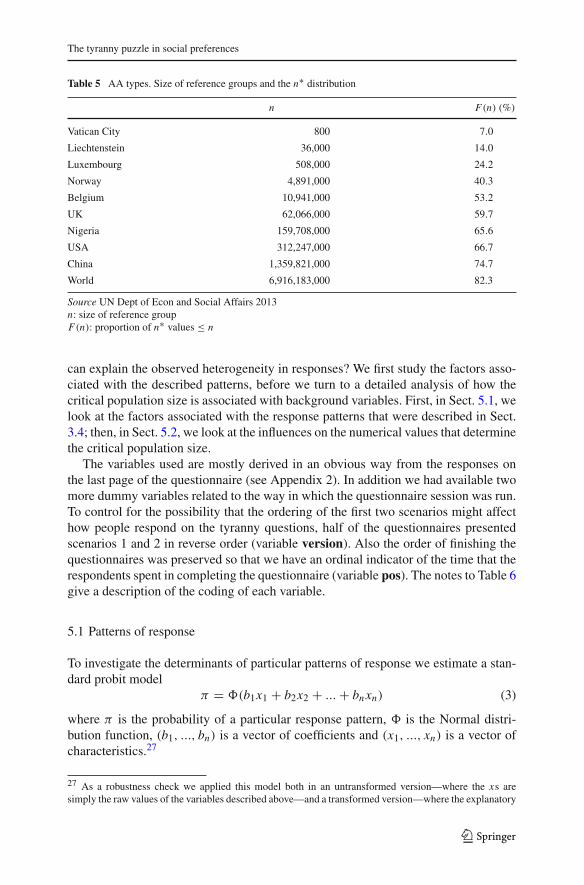
2 million for the LSE sub-sample, about 10 million for the NHH sub-samples and overall. However, we mightseek other reference groups to determine how large is “large.” Table 5 gives the size n ofa number of possible reference groups and the value of F(n) where F is the empiricaldistribution function of the computed n∗.26 If we compare the median value of n∗ withany of these reference groups we can see that for Norway (and smaller countries) thereis no problem of the two-tyrannies dilemma if applied to the overall population; forthe UK and larger there is indeed a potential problem; Belgium is, perhaps, borderline.
In summary, our analysis indicates that, for most individuals, this dilemma doesnot seem to be of practical importance for local moral questions only involving asmall number of individuals. But it may be of importance for national considerations,and most likely is relevant for moral questions related to global and intergenerationalinjustice. Note that the one-many persons tradeoffs need not occur often for the problemto be serious. The problem afflicts the SWF itself: the failure to find a SWF that avoidsboth tyrannies is of concern even if the instances arise only rarely in practice.
5 Responses to the questionnaire—the effects of background
It is clear from the above discussion that there is considerable variability within thecombined sample in the social values implied by the questionnaire responses. What
25 Notes. AA: those against both individual tyranny and mob tyranny. Labels on the horizontal axis givethe upper bound of each bin into which the observations have been sorted.26 However, if we were to consider an application of our analysis to questions of intergenerational justicethen a much larger reference group would be relevant. Asheim (2010) suggests that the number of peoplewho will potentially live in the future is 10 million times the current world population; if this were addedto Table 5 then clearly we would have F(n) = 100 %.
123
The tyranny puzzle in social preferences
Table 5 AA types. Size of reference groups and the n∗ distribution
n F(n) (%)
Vatican City 800 7.0
Liechtenstein 36,000 14.0
Luxembourg 508,000 24.2
Norway 4,891,000 40.3
Belgium 10,941,000 53.2
UK 62,066,000 59.7
Nigeria 159,708,000 65.6
USA 312,247,000 66.7
China 1,359,821,000 74.7
World 6,916,183,000 82.3
Source UN Dept of Econ and Social Affairs 2013n: size of reference groupF(n): proportion of n∗ values ≤ n
can explain the observed heterogeneity in responses? We first study the factors asso-ciated with the described patterns, before we turn to a detailed analysis of how thecritical population size is associated with background variables. First, in Sect. 5.1, welook at the factors associated with the response patterns that were described in Sect.3.4; then, in Sect. 5.2, we look at the influences on the numerical values that determinethe critical population size.
The variables used are mostly derived in an obvious way from the responses onthe last page of the questionnaire (see Appendix 2). In addition we had available twomore dummy variables related to the way in which the questionnaire session was run.To control for the possibility that the ordering of the first two scenarios might affecthow people respond on the tyranny questions, half of the questionnaires presentedscenarios 1 and 2 in reverse order (variable version). Also the order of finishing thequestionnaires was preserved so that we have an ordinal indicator of the time that therespondents spent in completing the questionnaire (variable pos). The notes to Table 6give a description of the coding of each variable.
5.1 Patterns of response
To investigate the determinants of particular patterns of response we estimate a stan-dard probit model
π = (b1x1 + b2x2 + ... + bn xn) (3)
where π is the probability of a particular response pattern, is the Normal distri-bution function, (b1, ..., bn) is a vector of coefficients and (x1, ..., xn) is a vector ofcharacteristics.27
27 As a robustness check we applied this model both in an untransformed version—where the xs aresimply the raw values of the variables described above—and a transformed version—where the explanatory
123
F. A. Cowell et al.
Table 6 Probit results for question 1 (scenarios 1 and 2) by types
Type AA Type AB Type BA
Version 0.0689 0.0672 −0.2326∗∗ −0.2457∗∗ 0.2026∗ 0.2287∗(−1.01) (0.62) (−2.14) (−2.19) (1.70) (1.87)
Pos 0.2244 0.2405 −0.0112 −0.0497 −0.0508 −0.0490
(1.23) (1.29) (−0.06) (−0.26) (−0.24) (−0.23)
nhh1 −0.0174 −0.0405 0.2463 0.1957 −0.0159 0.0673
(−0.11) (−0.26) (1.50) (1.17) (−0.09) (0.37)
nhh2 −0.0165 −0.0089 0.2571 0.1645 −0.0044 0.0778
(−0.11) (−0.06) (1.58) (0.98) (−0.02) (0.42)
Sex 0.1319 0.0935 −0.1849∗ −0.2124∗ 0.1694 0.1993
(1.21) (0.83) (−1.66) (−1.84) (1.36) (1.55)
Age −0.0030 −0.0028 0.0147 0.0174 −0.0354 −0.0437
(−0.12) (−0.11) (0.59) (0.70) (−1.05) (−1.26)
Political views 0.0434 0.0594 −0.1428∗∗∗ −0.1283∗∗ 0.1070∗ 0.1126∗(0.91) (1.19) (−2.92) (−2.50) (1.94) (1.94)
Family income −0.0535 −0.0586 −0.0258 −0.0021 0.0360 0.0026
(−0.98) (−1.06) (−0.45) (−0.04) (0.59) (0.04)
Prospects 0.0346 0.0085 −0.0875 −0.0905 0.0413 0.0341
(0.49) (0.12) (−1.17) (−1.18) (0.52) (0.42)
Progressive transfers 0.0039 0.2504∗∗ −0.1160
(0.04) (2.19) (−0.94)
Replication 0.3279∗∗∗ 0.0740 −0.2176
(2.74) (0.59) (−1.52)
_Cons −0.6972 −0.6709 0.3845 0.1055 −1.1975 −0.8335
(−1.01) (−0.95) (0.55) (0.15) (−1.40) (−0.94)
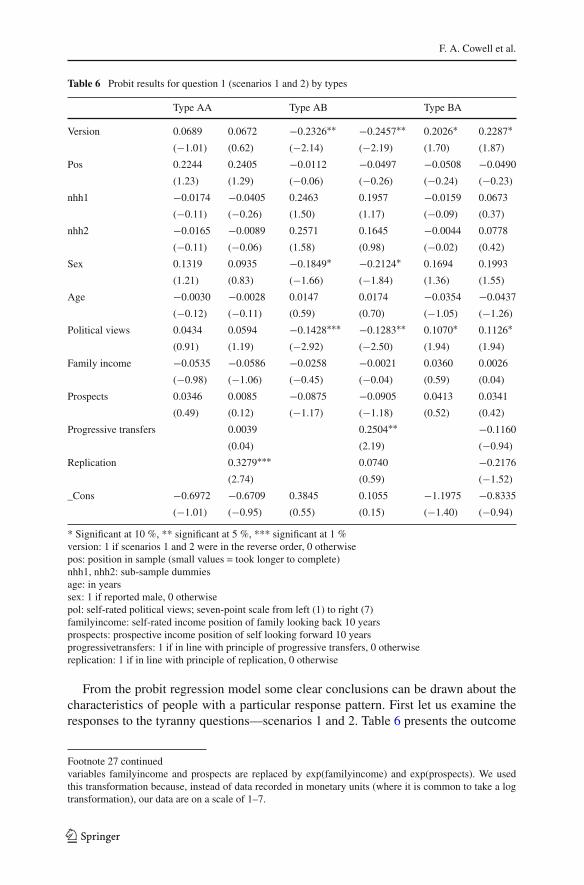
* Significant at 10 %, ** significant at 5 %, *** significant at 1 %version: 1 if scenarios 1 and 2 were in the reverse order, 0 otherwisepos: position in sample (small values = took longer to complete)nhh1, nhh2: sub-sample dummiesage: in yearssex: 1 if reported male, 0 otherwisepol: self-rated political views; seven-point scale from left (1) to right (7)familyincome: self-rated income position of family looking back 10 yearsprospects: prospective income position of self looking forward 10 yearsprogressivetransfers: 1 if in line with principle of progressive transfers, 0 otherwisereplication: 1 if in line with principle of replication, 0 otherwise
From the probit regression model some clear conclusions can be drawn about thecharacteristics of people with a particular response pattern. First let us examine theresponses to the tyranny questions—scenarios 1 and 2. Table 6 presents the outcome
Footnote 27 continuedvariables familyincome and prospects are replaced by exp(familyincome) and exp(prospects). We usedthis transformation because, instead of data recorded in monetary units (where it is common to take a logtransformation), our data are on a scale of 1–7.
123
The tyranny puzzle in social preferences
of applying the model (3) to the cases where π = Pr (pattern k) where k = AA,AB or BA; in each case we present the results for the standard list of explanatoryvariables and for an augmented model which incorporates the responses to the axiomsof Progressive Transfer and Replication Invariance as factors that may be associatedwith the responses to the tyranny scenarios.
As far as the four types in Table 1 are concerned, respecting Progressive Transfersincreases the probability of being of type AB. Violation of Replication Invariancereduces the probability that the person responds AA; it also increases the probabilitythat the person responds BB.28
More right-wing political views increase the probability of a type BA response (notconcerned about mob tyranny, concerned about individual tyranny) and decrease theprobability of a type AB response; males are more likely to have a BA type of responsepattern and less likely to be of AB type. Finally note that there is an ordering effect—putting scenario 2 first reduces the probability of an AB response and increases theprobability of a BA response. This priming effect means that thinking about a non-aggregation scenario first pushes respondents in the non-aggregation direction, makingthem less prone to accept aggregation later and vice versa.
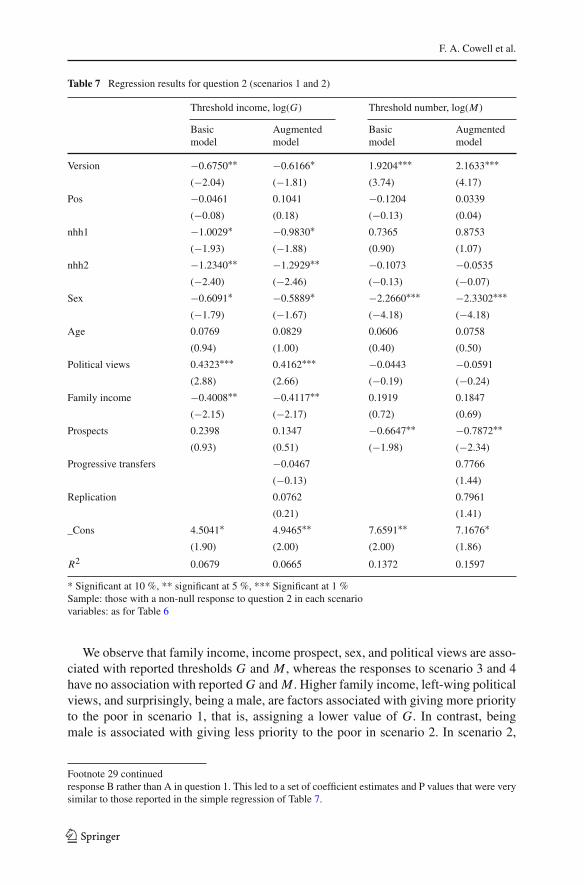
Now let us consider the “basic” distributional principles, respect for ProgressiveTransfers and for Replication Invariance, where π in (3) means “probability thatresponse conforms to the principle.” Table 8 shows that, once again, political viewsand sex of the respondent are important: being female or being more right wing isrelated to being more likely to reject the principle of progressive transfers (see theresults from scenario 3): the female effect is in line with findings in other contexts(Amiel and Cowell 2002, 2007). Being female means that you are also more likely toreject Replication Invariance. The conclusions remain unchanged if we use the trans-formed version of the model; it is also clear that the other personal characteristics,version of the questionnaire, the length of time the person took over the responses andthe sub-sample dummies play no role.
5.2 Reported thresholds—effects of background
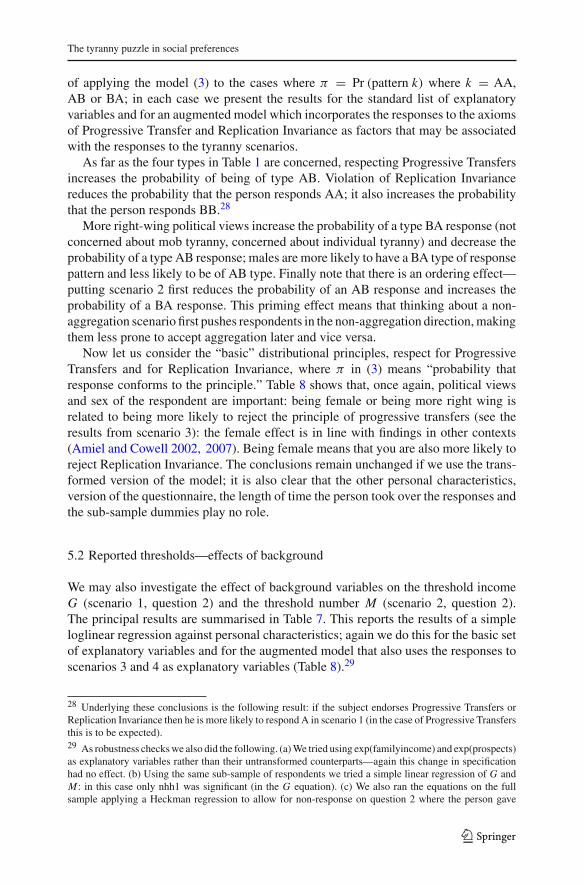
We may also investigate the effect of background variables on the threshold incomeG (scenario 1, question 2) and the threshold number M (scenario 2, question 2).The principal results are summarised in Table 7. This reports the results of a simpleloglinear regression against personal characteristics; again we do this for the basic setof explanatory variables and for the augmented model that also uses the responses toscenarios 3 and 4 as explanatory variables (Table 8).29
28 Underlying these conclusions is the following result: if the subject endorses Progressive Transfers orReplication Invariance then he is more likely to respond A in scenario 1 (in the case of Progressive Transfersthis is to be expected).29 As robustness checks we also did the following. (a) We tried using exp(familyincome) and exp(prospects)as explanatory variables rather than their untransformed counterparts—again this change in specificationhad no effect. (b) Using the same sub-sample of respondents we tried a simple linear regression of G andM : in this case only nhh1 was significant (in the G equation). (c) We also ran the equations on the fullsample applying a Heckman regression to allow for non-response on question 2 where the person gave
123
F. A. Cowell et al.
Table 7 Regression results for question 2 (scenarios 1 and 2)
Threshold income, log(G) Threshold number, log(M)
Basic Augmented Basic Augmentedmodel model model model
Version −0.6750∗∗ −0.6166∗ 1.9204∗∗∗ 2.1633∗∗∗(−2.04) (−1.81) (3.74) (4.17)
Pos −0.0461 0.1041 −0.1204 0.0339
(−0.08) (0.18) (−0.13) (0.04)
nhh1 −1.0029∗ −0.9830∗ 0.7365 0.8753
(−1.93) (−1.88) (0.90) (1.07)
nhh2 −1.2340∗∗ −1.2929∗∗ −0.1073 −0.0535
(−2.40) (−2.46) (−0.13) (−0.07)
Sex −0.6091∗ −0.5889∗ −2.2660∗∗∗ −2.3302∗∗∗(−1.79) (−1.67) (−4.18) (−4.18)
Age 0.0769 0.0829 0.0606 0.0758
(0.94) (1.00) (0.40) (0.50)
Political views 0.4323∗∗∗ 0.4162∗∗∗ −0.0443 −0.0591
(2.88) (2.66) (−0.19) (−0.24)
Family income −0.4008∗∗ −0.4117∗∗ 0.1919 0.1847
(−2.15) (−2.17) (0.72) (0.69)
Prospects 0.2398 0.1347 −0.6647∗∗ −0.7872∗∗(0.93) (0.51) (−1.98) (−2.34)
Progressive transfers −0.0467 0.7766
(−0.13) (1.44)
Replication 0.0762 0.7961
(0.21) (1.41)
_Cons 4.5041∗ 4.9465∗∗ 7.6591∗∗ 7.1676∗(1.90) (2.00) (2.00) (1.86)
R2 0.0679 0.0665 0.1372 0.1597
* Significant at 10 %, ** significant at 5 %, *** Significant at 1 %Sample: those with a non-null response to question 2 in each scenariovariables: as for Table 6
We observe that family income, income prospect, sex, and political views are asso-ciated with reported thresholds G and M , whereas the responses to scenario 3 and 4have no association with reported G and M . Higher family income, left-wing politicalviews, and surprisingly, being a male, are factors associated with giving more priorityto the poor in scenario 1, that is, assigning a lower value of G. In contrast, beingmale is associated with giving less priority to the poor in scenario 2. In scenario 2,
Footnote 29 continuedresponse B rather than A in question 1. This led to a set of coefficient estimates and P values that were verysimilar to those reported in the simple regression of Table 7.
123
The tyranny puzzle in social preferences
Table 8 Probit results for scenario 3 (progressive transfers) and Scenario 4 (Replication Invariance)
Progressive transfers Replication invariance
Untransformed Transformed Untransformed Transformed
Version −0.0202 −0.0092 −0.0100 −0.0009
(−0.20) (−0.09) (−0.09) (−0.01)
Pos 0.0412 0.0498 −0.0408 −0.0199
(0.23) (0.28) (−0.21) (−0.10)
nhh1 0.0719 0.0457 0.0433 0.0310
(0.46) (0.30) (0.27) (0.19)
nhh2 0.1502 0.1306 −0.2211 −0.2328
(0.98) (0.86) (−1.35) (−1.43)
Sex 0.1894∗ 0.2028∗ 0.1907 0.2163∗(1.77) (1.90) (1.64) (1.87)
Age −0.0027 −0.0013 −0.0115 −0.0071
(−0.11) (−0.06) (−0.43) (−0.27)
Political views −0.2156∗∗∗ −0.2158∗∗∗ −0.0743 −0.0689
(−4.55) (−4.54) (−1.48) (−1.37)
Family income −0.0411 0.0000 −0.0273 −0.0001
(−0.77) (0.00) (−0.48) (−0.34)
Prospects −0.0043 −0.0002 0.1154 0.0002
(−0.06) (−0.68) (1.51) (0.92)
_Cons 1.0210 0.8231 −0.5064 −0.2053
(1.52) (1.48) (−0.69) (−0.34)
* Significant at 10 %, ** significant at 5 %, *** Significant at 1 %version: 1 if scenarios 1 and 2 were in the reverse order, 0 otherwise.pos: position in sample (small values = took longer to complete)nhh1, nhh2: sub-sample dummiessex: 1 if reported male, 0 otherwisepol: self-rated political views; seven-point scale from left (1) to right (7)familyincome: self-rated income position of family looking back 10 yearsprospects: prospective income position of self looking forward 10 years
there is no significant association with family income and political views, but higherincome prospects are associated with giving less priority to the poor in these situations.Finally, we note that the ordering of scenarios also matter for threshold responses. Aparticipant who is first presented with the individual tyranny scenario, assigns lesspriority to the poor in both scenarios.
6 Discussion: comments by respondents
The comments provided by the participants may reveal something about what ourrespondents thought they were doing and something about why the tyranny puzzleemerges.
123
F. A. Cowell et al.
Table 9 Participation in comments
N Scenario 1 Scenario 2 Scenario 3 Scenario 4 Any
LSE 118 42 42 35 19 56
NHH1 225 22 34 27 6 53
NHH2 299 78 68 61 35 122
All 642 142 144 123 60 231
N is the number of participants, Columns “Scenario 1”,..., “Scenario 4” give number of participants offeringa comment on each scenario. “Any” gives numbers commenting on any of the scenarios
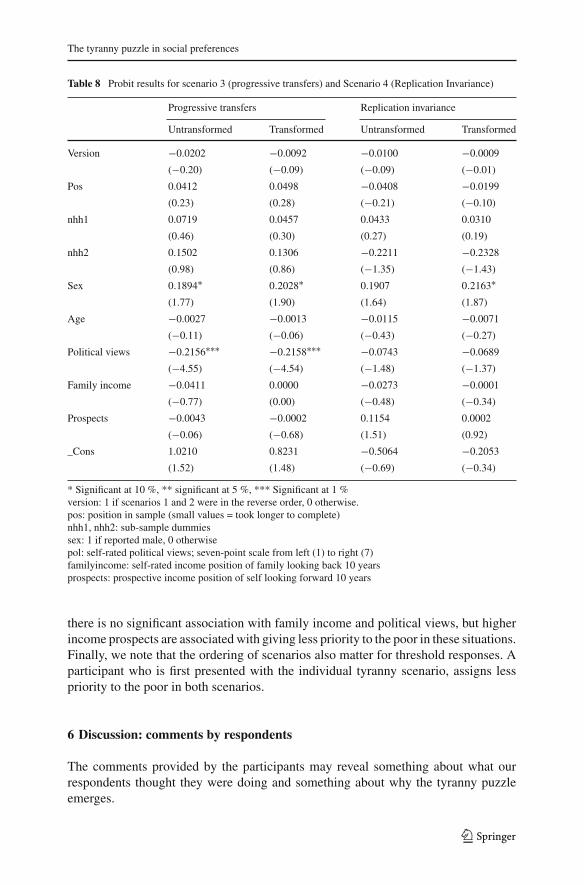
Table 9 shows the breakdown across the four scenarios and across the three sub-groups. 36 percent of the student-respondents were motivated to comment (231 out of642) on at least one of the scenarios. It is clear that far fewer found something to sayabout Scenario 4 than the others.
6.1 What predisposes respondents to provide a written comment?
At first glance it seems that being from the LSE (where 47 % of the respondentscommented) rather than NHH (where 33 % commented) is an important factor. Butthis is to overlook the heterogeneity in the NHH combined sample. The proportion ofthe NHH2 sub-sample that commented (43 %) is not significantly different from thatof the LSE, but of course there is a big difference between the NHH1 proportion andeither of the other subgroups. Both LSE and NHH2 are typically second-year students,so it may be that longer experience of university makes one more willing to comment.However, there is no significant difference in the overall mean age of commentersand non-commenters. In fact the only personal characteristic which does show up asimportant in understanding the difference between commenters and non-comments isthe respondent’s political views, which is not surprising since we saw in Sect. 5 thatpolitical views were highly significant in terms of response pattern (those reporting asright-wing were more likely to be more concerned about individual tyranny and lessabout mob-tyranny). We also find that the individual is more likely to comment if hisor her political views are to the left (the proportion of those with politicalviews< 4is significantly higher in the “commenters” sub-sample).
6.2 What type of comments?
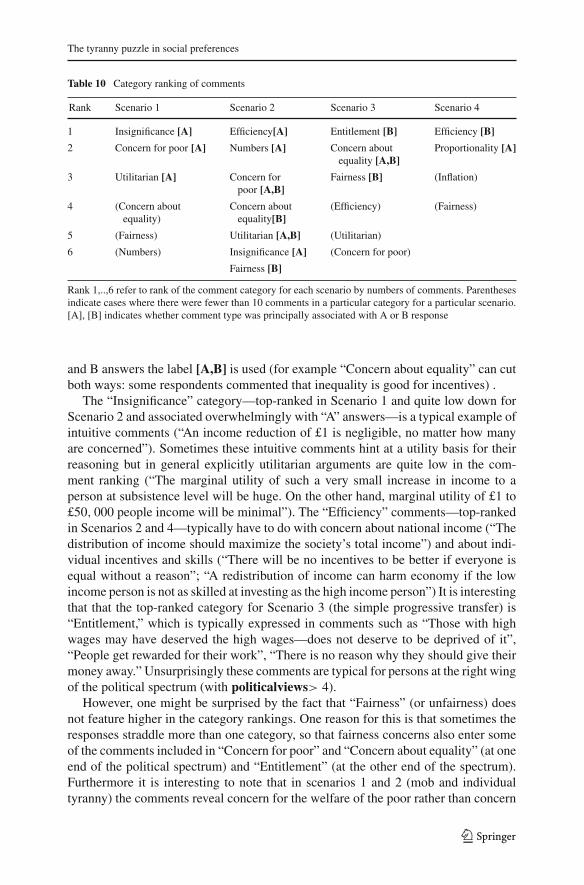
Of course, in all three sub-samples, there was considerable variation in the type ofcomment made: some provided an ethical or economic argument; some gave a reactionbased on intuition; some just wanted to hedge their response to the scenario witha request for more information. Table 10 gives a snapshot view of the categoriesof comments, scenario by scenario. Where a particular comment type is stronglyassociated with a specific A or B answer within a scenario this has been indicated byan [A] or [B] label as appropriate; where a comment type was associated with both A
123
The tyranny puzzle in social preferences
Table 10 Category ranking of comments
Rank Scenario 1 Scenario 2 Scenario 3 Scenario 4
1 Insignificance [A] Efficiency[A] Entitlement [B] Efficiency [B]
2 Concern for poor [A] Numbers [A] Concern aboutequality [A,B]
Proportionality [A]
3 Utilitarian [A] Concern forpoor [A,B]
Fairness [B] (Inflation)
4 (Concern aboutequality)
Concern aboutequality[B]
(Efficiency) (Fairness)
5 (Fairness) Utilitarian [A,B] (Utilitarian)
6 (Numbers) Insignificance [A] (Concern for poor)
Fairness [B]
Rank 1,..,6 refer to rank of the comment category for each scenario by numbers of comments. Parenthesesindicate cases where there were fewer than 10 comments in a particular category for a particular scenario.[A], [B] indicates whether comment type was principally associated with A or B response
and B answers the label [A,B] is used (for example “Concern about equality” can cutboth ways: some respondents commented that inequality is good for incentives) .
The “Insignificance” category—top-ranked in Scenario 1 and quite low down forScenario 2 and associated overwhelmingly with “A” answers—is a typical example ofintuitive comments (“An income reduction of £1 is negligible, no matter how manyare concerned”). Sometimes these intuitive comments hint at a utility basis for theirreasoning but in general explicitly utilitarian arguments are quite low in the com-ment ranking (“The marginal utility of such a very small increase in income to aperson at subsistence level will be huge. On the other hand, marginal utility of £1 to£50, 000 people income will be minimal”). The “Efficiency” comments—top-rankedin Scenarios 2 and 4—typically have to do with concern about national income (“Thedistribution of income should maximize the society’s total income”) and about indi-vidual incentives and skills (“There will be no incentives to be better if everyone isequal without a reason”; “A redistribution of income can harm economy if the lowincome person is not as skilled at investing as the high income person”) It is interestingthat that the top-ranked category for Scenario 3 (the simple progressive transfer) is“Entitlement,” which is typically expressed in comments such as “Those with highwages may have deserved the high wages—does not deserve to be deprived of it”,“People get rewarded for their work”, “There is no reason why they should give theirmoney away.” Unsurprisingly these comments are typical for persons at the right wingof the political spectrum (with politicalviews> 4).
However, one might be surprised by the fact that “Fairness” (or unfairness) doesnot feature higher in the category rankings. One reason for this is that sometimes theresponses straddle more than one category, so that fairness concerns also enter someof the comments included in “Concern for poor” and “Concern about equality” (at oneend of the political spectrum) and “Entitlement” (at the other end of the spectrum).Furthermore it is interesting to note that in scenarios 1 and 2 (mob and individualtyranny) the comments reveal concern for the welfare of the poor rather than concern
123
F. A. Cowell et al.
for equality per se, whereas in scenario 3 the comments can largely be characterised as asimple dichotomy between the right-wing “Entitlement” view30 and the more left-wing“Concern for equality.” Fairness may also have been implicit in the comments of thosewho stated some version of a proportionality argument in commenting on scenario 4.
The “Numbers” category is the major example of an implicit request for moreinformation. Typically this expressed the thought the person would need to know moreprecisely the numbers involved before committing to one or other of the propositionsin the scenario.
Three lessons can be drawn from the written comments. First, the comments donot undermine the validity of the questions asked or the ability of the respondentsto understand them. Second, in evaluating ethical propositions people may rely onsimple intuition rather than the niceties of a formal welfare-economic argument; thispragmatic approach plays an important role in understanding the “A”-responses inScenario 1. Third, some apparently basic principles—such as the principle of progres-sive transfers—are not accepted by respondents, either because they demand morecontextual information, or because they see it as being in conflict with other basicprinciples such as that which we have characterised as “Entitlement”.
7 Conclusion
We have shown that the tyranny puzzle represents a real dilemma for people in practicalreasoning. Among the students in the present study, there was a majority againstboth individual tyranny and mob tyranny. Indeed, in the four categories of possibleresponses in our “tyranny” scenarios, the “Anti-Anti” case is a clear winner. This fact isin the context of mainly coherent views from our respondents on all four principles (thetwo tyrannies plus progressive transfers and replication), backed by a large number ofcomments explaining their reasoning.
We have also shown that the population size does not have to be all that large to makethis dilemma a practical problem. To summarize, whether there is a dilemma facingAnti-Anti people in practice depends on the size of the population under consideration,as we explained in Sect. 2: think of this as the potential size of a reference group. Wecan compute the required critical size from the questionnaire responses and it is notnecessarily astronomical: the reference group does not need to be all that large topresent a problem. To summarise roughly, three quarters of our respondents wouldface a dilemma if the reference group were as huge as China; but (more surprisinglyperhaps) about a quarter of our respondents would still face a dilemma if the referencegroup were as tiny as Luxembourg.
The respondents’ backgrounds are associated with their responses to these dilem-mas. In particular, we note that right-wingers and males are more willing to toleratemob tyranny and less willing to tolerate individual tyranny.
30 For experimental studies on the role of entitlements see, for example Cappelen et al. (2007, 2013) andKonow (2000).
123
The tyranny puzzle in social preferences
Acknowledgments We are grateful to Yinfei Dong for research assistance. The survey in Norway wasadministered by The Choice Lab, Norwegian School of Economics. We are grateful to audiences in London,Leuven and Louvain-la-Neuve for comments.
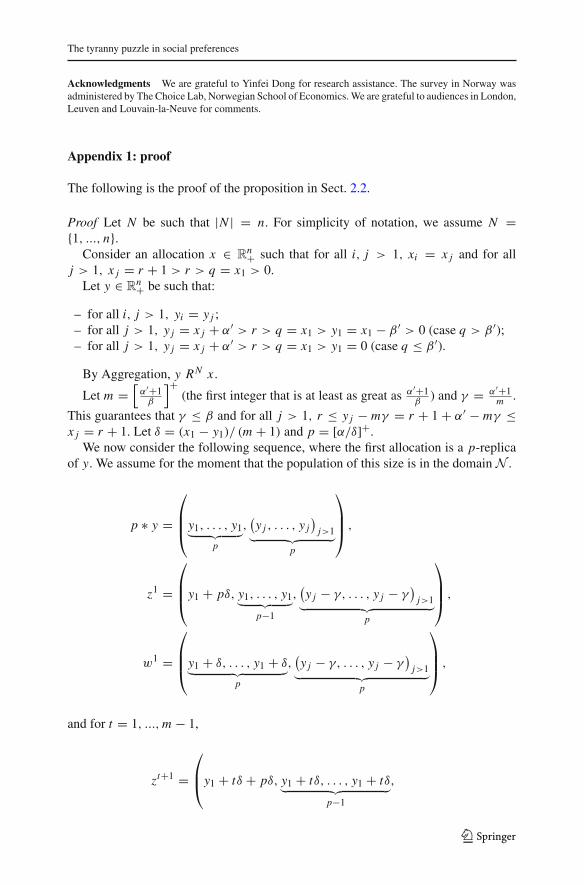
Appendix 1: proof
The following is the proof of the proposition in Sect. 2.2.
Proof Let N be such that |N | = n. For simplicity of notation, we assume N ={1, ..., n}.
Consider an allocation x ∈ Rn+ such that for all i, j > 1, xi = x j and for all
j > 1, x j = r + 1 > r > q = x1 > 0.Let y ∈ R
n+ be such that:
– for all i, j > 1, yi = y j ;– for all j > 1, y j = x j + α′ > r > q = x1 > y1 = x1 − β ′ > 0 (case q > β ′);– for all j > 1, y j = x j + α′ > r > q = x1 > y1 = 0 (case q ≤ β ′).
By Aggregation, y RN x .
Let m =[
α′+1β
]+(the first integer that is at least as great as α′+1
β) and γ = α′+1
m .
This guarantees that γ ≤ β and for all j > 1, r ≤ y j − mγ = r + 1 + α′ − mγ ≤x j = r + 1. Let δ = (x1 − y1)/ (m + 1) and p = [α/δ]+.
We now consider the following sequence, where the first allocation is a p-replicaof y. We assume for the moment that the population of this size is in the domain N .
p ∗ y =
⎛
⎜⎜⎝y1, . . . , y1︸ ︷︷ ︸
p
,(y j , . . . , y j
)j>1
︸ ︷︷ ︸p
⎞
⎟⎟⎠ ,
z1 =
⎛
⎜⎜⎝y1 + pδ, y1, . . . , y1︸ ︷︷ ︸
p−1
,(y j − γ, . . . , y j − γ
)j>1
︸ ︷︷ ︸p
⎞
⎟⎟⎠ ,
w1 =
⎛
⎜⎜⎝y1 + δ, . . . , y1 + δ
︸ ︷︷ ︸p
,(y j − γ, . . . , y j − γ
)j>1
︸ ︷︷ ︸p
⎞
⎟⎟⎠ ,
and for t = 1, ..., m − 1,
zt+1 =⎛
⎜⎝y1 + tδ + pδ, y1 + tδ, . . . , y1 + tδ
︸ ︷︷ ︸p−1
,
123
F. A. Cowell et al.
× (y j − (t + 1)γ, . . . , y j − (t + 1)γ
)j>1
︸ ︷︷ ︸p
⎞
⎟⎟⎠ ,
wt+1 =⎛
⎜⎝y1 + (t + 1)δ, . . . , y1 + (t + 1)δ
︸ ︷︷ ︸p
,
×(y j − (t + 1)γ, . . . , y j − (t + 1)γ
)j>1
︸ ︷︷ ︸p
⎞
⎟⎟⎠ .
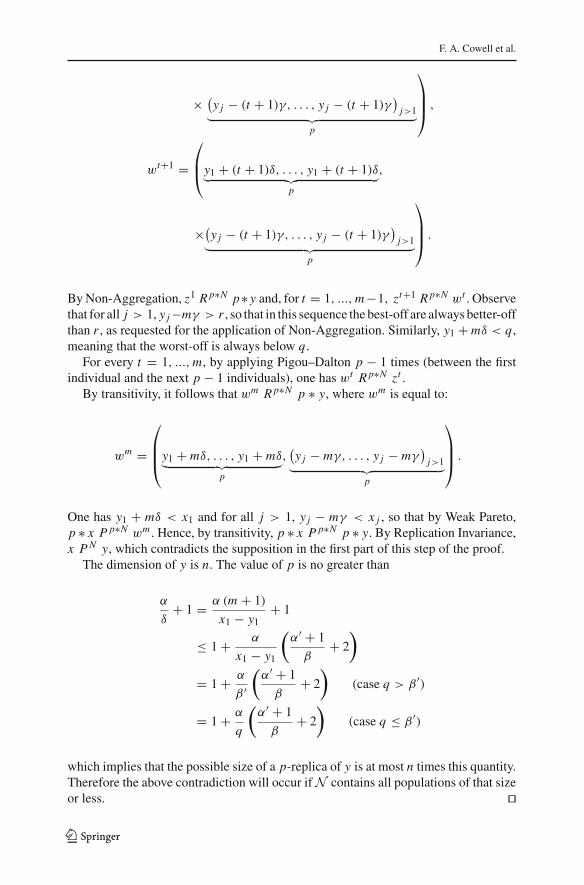
By Non-Aggregation, z1 R p∗N p∗ y and, for t = 1, ..., m−1, zt+1 R p∗N wt . Observethat for all j > 1, y j −mγ > r , so that in this sequence the best-off are always better-offthan r , as requested for the application of Non-Aggregation. Similarly, y1 + mδ < q,meaning that the worst-off is always below q.
For every t = 1, ..., m, by applying Pigou–Dalton p − 1 times (between the firstindividual and the next p − 1 individuals), one has wt R p∗N zt .
By transitivity, it follows that wm R p∗N p ∗ y, where wm is equal to:
wm =
⎛
⎜⎜⎝y1 + mδ, . . . , y1 + mδ
︸ ︷︷ ︸p
,(y j − mγ, . . . , y j − mγ
)j>1
︸ ︷︷ ︸p
⎞
⎟⎟⎠ .
One has y1 + mδ < x1 and for all j > 1, y j − mγ < x j , so that by Weak Pareto,p ∗ x P p∗N wm . Hence, by transitivity, p ∗ x P p∗N p ∗ y. By Replication Invariance,x P N y, which contradicts the supposition in the first part of this step of the proof.
The dimension of y is n. The value of p is no greater than
α
δ+ 1 = α (m + 1)
x1 − y1+ 1
≤ 1 + α
x1 − y1
(α′ + 1
β+ 2
)
= 1 + α
β ′
(α′ + 1
β+ 2
)
(case q > β ′)
= 1 + α
q
(α′ + 1
β+ 2
)
(case q ≤ β ′)
which implies that the possible size of a p-replica of y is at most n times this quantity.Therefore the above contradiction will occur if N contains all populations of that sizeor less.
123
The tyranny puzzle in social preferences
Appendix 2: questionnaire
The following is the standard version of the questionnaire used in this study. Abouthalf of the respondents received an alternate version that presented the second scenariobefore the first.
Questionnaire
Ethical views on the distribution of income
Thank you for participating in this survey. We are interested in your opinion on ethical issues related to the distribution of income in society. Your response will be most important for our research project, so we ask you carefully to consider the questions that we pose below. We are not looking for the “right” answers to the questions, so please feel free to express your views on these issues. The questionnaire is anonymous, so we will not at any point ask you to reveal your identity.
The questions are stated with reference to a society where the average annual income of an individual is £20,000 and the lowest annual income is £10,000, and where all individuals work equally hard and have the same needs. In this society, an annual income of £10,000 ensures a living standard slightly above the subsistence level, whereas an annual income of £20,000 ensures a decent living standard. In each of the scenarios we ask you to consider, there is an unforeseen event which happens this year. Its effects on people’s living standards are limited to this year only and differ across income groups. So this means that in all the following years everybody’s living standard are unaffected by this event.
Please note that this is not a test of logic. Each of the questions is a “stand alone”, so it can be answered independently of any of the other questions.
Scenario 1: o everyone with income over £50,000 experiences a £1 reduction in income; o one person with income of £10,000 experiences an increase in income; o no-one else is affected.
▪ Which of the following views do you agree with?A: “if the gain for the person with £10,000 is sufficiently large, this is a good thing no matter how many people have incomes over £50,000” B: “even if the person with £10,000 gains a huge amount, this is not a good thing if there are very many people with incomes over £50,000”
▪ If you selected A, how large must the gain be for the person with £10,000 to ensure that this is a good thing?
▪ Please feel free to explain your answer: …………………………………………………………………………………………………………………………………………………………………………………………………………………………………………………………………………
123
F. A. Cowell et al.
Scenario 3: o one person with income of £10,000 experiences an increase in income; o one person with income of £50,000 experiences a corresponding decrease of exactly the
same amount; o no-one else is affected.
▪ Which of the following views do you agree with?A: “this is a good thing, as long as the person who starts out with £10,000 does not end up richer than the person who starts out with £50,000” B: “even if the person who starts out with £10,000 does not end up richer than the person who starts out with £50,000, this is not necessarily a good thing”
▪ Please feel free to explain your answer: ………………………………………………………………………………………………………
Scenario 2: o one person with income of £10,000 experiences a £1 reduction in income; o all persons with income over £50,000 experience a £100 increase in income; o no-one else is affected.
▪ Which of the following views do you agree with?A: “if the number of persons with income over £50,000 is sufficiently large, this is a good thing” B: “even if the number of persons with income over £50,000 is very large, this is not a good thing”
▪ If you selected A, how many people must have an income over £50,000 to ensure that this is a good thing?
▪ Please feel free to explain your answer: …………………………………………………………………………………………………………………………………………………………………
123
The tyranny puzzle in social preferences
Scenario 4: o everyone with income of £10,000 experience an increase in income; o everyone with income of £50,000 experience a decrease in income; o no-one else is affected.
▪ Which of the following views do you agree with?A: “if this were a good thing, then it would also be a good thing if the number of persons at all income levels in society were doubled (i.e., a doubling of the number of persons with £10,000, £50,000, and so on)” B: “even if this were a good thing, it would not necessarily be a good thing if the number of persons at all income levels in society were doubled (i.e., a doubling of the number of persons with £10,000, £50,000, and so on)”
▪ Please feel free to explain your answer: ………………………………………………………………………………………………………
Background information • sraey_____?egaruoysitahW••• __________?dleifruoysitahW)stnedutsroF(• (For employed non-students) What is your profession? __________
• How would you rate your political views? Please put a √ on this scale.
• “How would you rate your family's income ten years ago (relative to average income in the country where you lived then)?”
• “How would you rate your own income prospects ten years from now (relative to average income in the country where you plan to live)?”
“poor” “rich”
“poor” “rich”
“left” “right”
References
Amiel Y, Cowell FA (1999) Thinking about Inequality. Cambridge University Press, CambridgeAmiel Y, Cowell FA (2002) Attitudes towards risk and inequality: a questionnaire-experimental approach.
In: Andersson F, Holm HJ (eds) Experimental economics: financial markets, auctions, and decisionmaking, chapter 9. Kluwer, Dewenter, pp 85–115
Amiel Y, Cowell FA (2007) Social welfare and individual preferences under uncertainty: a questionnaire-experimental approach. Res Econ Inequal 14:345–362
Amiel Y, Cowell FA, Gaertner W (2009) To be or not to be involved: a questionnaire-experimental view onHarsanyi’s utilitarian ethics. Soc Choice Welf 32:299–316
Amiel Y, Cowell FA, Gaertner W (2012) Distributional orderings: an approach with seven flavors. TheorDecis 73:381–399
Andreoni J, Miller J (2002) Giving according to GARP: an experimental test of the consistency of preferencesfor altruism. Econometrica 70:737–753
Asheim G (2010) Intergenerational equity. Ann Rev Econ 2:197–222Bellemare C, Kröger S, van Soest A (2008) Measuring inequity aversion in a heterogeneous population
using experimental decisions and subjective probabilities. Econometrica 76:815–839
123
F. A. Cowell et al.
Cappelen AW, Hole AD, Sørensen EØ, Tungodden B (2007) The pluralism of fairness ideals: an experi-mental approach. Am Econ Rev 97:818–827
Cappelen AW, Hole AD, Sørensen EØ, Tungodden B (2011) The importance of moral reflection and self-reported data in a dictator game with production. Soc Choice Welf 36:105–120
Cappelen AW, Konow J, Sørensen EØ, Tungodden B (2013) Just luck: an experimental study of risk takingand fairness. Am Econ Rev 103:1398–1413
Cappelen AW, Moene KO, Sørensen EØ, Tungodden B (2013) Needs versus entitlements—an internationalfairness experiment. J Eur Econ Assoc 11:574–598
Charness G, Rabin M (2002) Understanding social preferences with simple tests. Q J Econ 117:817–869Dalton H (1920) Measurement of the inequality of incomes. Econ J 30:348–361Engel C (2011) Dictator games: a meta study. Exp Econ 14:583–610Engelmann D, Strobel M (2004) Inequality aversion, efficiency, and maximin preferences in simple distri-
bution experiments. Am Econ Rev 94:857–869Fehr E, Fischbacher U (2002) Why social preferences matter—the impact of non-selfish motives on com-
petition, cooperation and incentives. Econ J 112:C1–C33Fisman R, Kariv S, Markovits D (2007) Individual preferences for giving. Am Econ Rev 97:1858–1876Fleurbaey M, Tungodden B (2010) The tyranny of non-aggregation versus the tyranny of aggregation in
social choices: a real dilemma. Econ Theor 44:399–414Fleurbaey M, Tungodden B, Vallentyne P (2009) On the possibility of non-aggregative priority for the worst
off. Soc Philos Polic 26:258–285Frohlich N, Oppenheimer JA, Eavey C (1987a) Choices of principles of distributive justice in experimental
groups. Am J Polit Sci 31:606–636Frohlich N, Oppenheimer JA, Eavey C (1987b) Laboratory results on Rawls’ principle of distributive justice.
Br J Polit Sci 17:1–21Gaertner W (1994) Distributive justice: theoretical foundations and empirical findings. Eur Econ Rev
38:711–720Gaertner W, Schokkaert E (2012) Empirical social choice: questionnaire-experimental studies on distributive
justice. Cambridge University Press, CambridgeGaertner W, Schwettmann L (2007) Equity, responsibility and the cultural dimension. Economica
74(296):627–649Henrich J, Boyd R, Bowles S, Camerer C, Fehr E, Gintis H, McElreath R (2001) In search of homo
economicus: behavioral experiments in 15 small-scale societies. Am Econ Rev 91:73–78Konow J (2000) Fair shares: accountability and cognitive dissonance in allocation decisions. Am Econ Rev
90:1072–1091Pigou AC (1912) Wealth and welfare, chapter 2. Macmillan, London
123
Related Documents