HAL Id: hal-00328261 https://hal.archives-ouvertes.fr/hal-00328261 Submitted on 10 Oct 2008 HAL is a multi-disciplinary open access archive for the deposit and dissemination of sci- entific research documents, whether they are pub- lished or not. The documents may come from teaching and research institutions in France or abroad, or from public or private research centers. L’archive ouverte pluridisciplinaire HAL, est destinée au dépôt et à la diffusion de documents scientifiques de niveau recherche, publiés ou non, émanant des établissements d’enseignement et de recherche français ou étrangers, des laboratoires publics ou privés. The Tropical Tropopause Layer 1960–2100 A. Gettelman, T. Birner, V. Eyring, H. Akiyoshi, D. A. Plummer, M. Dameris, Slimane Bekki, Franck Lefèvre, F. Lott, C. Brühl, et al. To cite this version: A. Gettelman, T. Birner, V. Eyring, H. Akiyoshi, D. A. Plummer, et al.. The Tropical Tropopause Layer 1960–2100. Atmospheric Chemistry and Physics Discussions, European Geosciences Union, 2008, 8 (1), pp.1367-1413. <hal-00328261>

Welcome message from author
This document is posted to help you gain knowledge. Please leave a comment to let me know what you think about it! Share it to your friends and learn new things together.
Transcript
HAL Id: hal-00328261https://hal.archives-ouvertes.fr/hal-00328261
Submitted on 10 Oct 2008
HAL is a multi-disciplinary open accessarchive for the deposit and dissemination of sci-entific research documents, whether they are pub-lished or not. The documents may come fromteaching and research institutions in France orabroad, or from public or private research centers.
L’archive ouverte pluridisciplinaire HAL, estdestinée au dépôt et à la diffusion de documentsscientifiques de niveau recherche, publiés ou non,émanant des établissements d’enseignement et derecherche français ou étrangers, des laboratoirespublics ou privés.
The Tropical Tropopause Layer 1960–2100A. Gettelman, T. Birner, V. Eyring, H. Akiyoshi, D. A. Plummer, M.
Dameris, Slimane Bekki, Franck Lefèvre, F. Lott, C. Brühl, et al.
To cite this version:A. Gettelman, T. Birner, V. Eyring, H. Akiyoshi, D. A. Plummer, et al.. The Tropical TropopauseLayer 1960–2100. Atmospheric Chemistry and Physics Discussions, European Geosciences Union,2008, 8 (1), pp.1367-1413. <hal-00328261>
ACPD
8, 1367–1413, 2008
TTL Trends
A. Gettelman et al.
Title Page
Abstract Introduction
Conclusions References
Tables Figures
◭ ◮
◭ ◮
Back Close
Full Screen / Esc
Printer-friendly Version
Interactive Discussion
EGU
Atmos. Chem. Phys. Discuss., 8, 1367–1413, 2008
www.atmos-chem-phys-discuss.net/8/1367/2008/
© Author(s) 2008. This work is licensed
under a Creative Commons License.
AtmosphericChemistry
and PhysicsDiscussions
The Tropical Tropopause Layer 1960–2100
A. Gettelman1, T. Birner
2, V. Eyring
3, H. Akiyoshi
4, D. A. Plummer
5, M. Dameris
3,
S. Bekki6, F. Lefevre
6, F. Lott
7, C. Bruhl
8, K. Shibata
9, E. Rozanov
10,
E. Mancini11
, G. Pitari11
, H. Struthers12
, W. Tian13
, and D. E. Kinnison1
1National Center for Atmospheric Research, Boulder, CO, USA
2University of Toronto, Toronto, ON, Canada
3Deutsches Zentrum fur Luft- und Raumfahrt, Oberpfaffenhofen, Germany
4National Institute for Environmental Studies, Tsukuba, Japan
5Canadian Centre for Climate Modeling and Analysis, Victoria,BC, Canada
6Universite Pierre and Marie Curie, Service d’Aeronomie, Paris, France
7L’Institut Pierre-Simon Laplace, Ecole Normale Superieur, Paris, France
8Max Planck Institut fur Chemie, Mainz, Germany
9Meteorological Research Institute, Tsukuba, Japan
10Physikalisch-Meteorologisches Observatorium Davos, Davos, Switzerland
11Universita degli Studi de L’Aquila, L’Aquila, Italy
12National Institute for Water and Atmosphere, New Zealand
13University of Leeds, Leeds, UK
Received: 4 December 2007 – Accepted: 20 December 2007 – Published: 29 January 2008
Correspondence to: A. Gettelman ([email protected])
1367
ACPD
8, 1367–1413, 2008
TTL Trends
A. Gettelman et al.
Title Page
Abstract Introduction
Conclusions References
Tables Figures
◭ ◮
◭ ◮
Back Close
Full Screen / Esc
Printer-friendly Version
Interactive Discussion
EGU
Abstract
The representation of the Tropical Tropopause Layer in 13 different Chemistry Climate
Models designed to represent the stratosphere is analyzed. Simulations for 1960–
present and 1980–2100 are analyzed and compared to reanalysis model output. Re-
sults indicate that the models are able to reproduce the basic structure of the TTL.5
There is a large spread in cold point tropopause temperatures that may be linked to
variation in TTL ozone values. The models are generally able to reproduce historical
trends in tropopause pressure obtained from reanalysis products. Simulated histori-
cal trends in cold point tropopause temperatures and in the meridional extent of the
TTL are not consistent across models. The pressure of both the tropical tropopause10
and the level of main convective outflow appear to be decreasing (increasing altitude)
in historical runs. Similar trends are seen in the future. Models consistently predict
decreasing tropopause and convective outflow pressure, by several hPa/decade. Trop-
ical cold point temperatures increase by 0.2 K/decade. This indicates that tropospheric
warming dominates stratospheric cooling at the tropical tropopause. Stratospheric wa-15
ter vapor at 100 hPa increases by up to 0.5–1 ppmv by 2100. This is less than im-
plied directly by the temperature and methane increases, highlighting the correlation of
tropopause temperatures with stratospheric water vapor, but also the complex nature
of TTL transport.
1 Introduction20
The Tropical Tropopause Layer (TTL), the region in the tropics within which air has
characteristics of both the troposphere and the stratosphere, is a critical region of the
atmosphere. The TTL is the region in the tropics between the level of main convective
outflow and the cold point, about 10–18 km (Gettelman and Forster, 2002). The TTL
is maintained by the interaction of convective transport, convectively generated waves,25
radiation, cloud microphysics and the large scale stratospheric circulation. The TTL
1368
ACPD
8, 1367–1413, 2008
TTL Trends
A. Gettelman et al.
Title Page
Abstract Introduction
Conclusions References
Tables Figures
◭ ◮
◭ ◮
Back Close
Full Screen / Esc
Printer-friendly Version
Interactive Discussion
EGU
is the source region for most air entering the stratosphere, and therefore the chemical
boundary conditions of the stratosphere are set in the TTL. Clouds in the TTL, both thin
cirrus clouds and convective anvils, have a significant impact on the radiation balance
and hence tropospheric climate (Stephens, 2005).
Changes to the tropopause and TTL may occur over long periods of time in response5
to anthropogenic forcing of the climate system. These trends are in addition to natural
variability, which includes interannual variations such as the Quasi Biennial Oscillation
(QBO, ∼2 years), the El Nino Southern Oscillation (ENSO, 3–5 years) or the solar
cycle (11 years). Changes in the thermal structure of the TTL may alter TTL clouds,
affecting global climate through water vapor and cloud feedbacks (Bony et al., 2006) in10
the TTL. Changes to TTL structure may alter TTL transport and TTL water vapor. TTL
water vapor in turn may affect stratospheric chemistry, ozone (Gettelman and Kinnison,
2007) and water vapor, as well as surface climate (Forster and Shine, 2002). Changes
in the Hadley circulation and the stratospheric Brewer-Dobson circulation (Butchart
et al., 2006) may affect the meridional extent of the TTL. The changes may be manifest15
as changes to the mid-latitude storm tracks (Yin, 2005).
Several studies have attempted to look at changes to the tropopause and TTL over
time. Seidel et al. (2001) found decreases in tropopause pressure (increasing height)
trends in tropical radiosonde records. Gettelman and Forster (2002) described a clima-
tology of the TTL, and looked at changes over the observed record from radiosondes,20
finding similar decreases in tropopause pressure (increasing height) with little signif-
icant change in the bottom of the TTL (see below). Santer et al. (2003) examined
simulated changes in thermal tropopause height and found that they could only explain
observations if anthropogenic forcings were included. Dameris et al. (2005) looked at
simulations from 1960–1996 in a global model and found no consistent trend in thermal25
tropopause pressure or water vapor. Son et al. (2008)1
looked at changes to the global
1Son, S. W., Polvani, L. M., Waugh, D. W., Birner, T., Garcia, R. R., Gettelman, A., and
Plummer, D. A.: The tropopause in the 21st century as simulated by stratosphere-resolving
Chemistry-Climate Models, J. Climate, submitted, 2008.
1369

ACPD
8, 1367–1413, 2008
TTL Trends
A. Gettelman et al.
Title Page
Abstract Introduction
Conclusions References
Tables Figures
◭ ◮
◭ ◮
Back Close
Full Screen / Esc
Printer-friendly Version
Interactive Discussion
EGU
thermal tropopause pressure in global models and found a decrease (height increase)
through the 21st century, less in models with ozone recovery. Fu et al. (2006) and Hu
and Fu (2007) found that the Hadley circulation was expanding poleward resulting in
widening of tropical dynamics.
Recently, Gettelman and Birner (2007), hereafter GB2007, have shown that two Cou-5
pled Chemistry Climate Models (CCMs), which are General Circulation Models (GCMs)
with a chemistry package coupled to the radiation (so chemical changes affect radiation
and climate), can reproduce key structural features of the TTL and their variability in
space and time. GB2007 found that 2 models, the Canadian Middle Atmosphere Model
(CMAM) and the Whole Atmosphere Community Climate Model (WACCM), were able10
to reproduce the structure of TTL temperatures, ozone and clouds. Variability from the
annual cycle down to planetary wave time and space scales (days and 100 s km) was
well reproduced. There were significant differences in the treatment of TTL clouds and
convection between the two models, but this did not seem to alter the structure of the
TTL. GB2007 conclude that CMAM and WACCM are able to reproduce important fea-15
tures of the TTL, and that these features must be largely regulated by the large scale
structure, since changes to sub-grid scale processes (like convection) did not alter TTL
structure or variability.
In this work, we will look at changes to the TTL over the recent past (1960–2005)
and potential changes over the 21st century. We apply a similar set of diagnostics as20
GB2007 to WACCM, CMAM and 11 other CCMs that are part of a multi-model en-
semble run with forcings for the historical record from 1960–2005, and using scenarios
for the future from 1980–2100. We will compare the models to observations over the
observed record, and then examine model predictions for the evolution of the TTL in
the 21st Century. These simulations have been used to assess future trends in strato-25
spheric ozone in Eyring et al. (2007) and World Meteorological Organization (2007),
chapter 6.
The methodology, models, data and diagnostics are described in Sect. 2. The model
climatologies are discussed in Sect. 3. Past and future trends from models and analysis
1370
ACPD
8, 1367–1413, 2008
TTL Trends
A. Gettelman et al.
Title Page
Abstract Introduction
Conclusions References
Tables Figures
◭ ◮
◭ ◮
Back Close
Full Screen / Esc
Printer-friendly Version
Interactive Discussion
EGU
systems are in Sect. 4. Discussion of some key issues is in Sect. 5 and Conclusions
are in Sect. 6.
2 Methodology
In this section we first describe the definition and diagnostics for the TTL (Sect. 2.1).
We then briefly describe the models used and where further details, information and5
output can be obtained (Sect. 2.2). Finally we verify that using zonal monthly mean
data provides a correct picture of the climatology and trends (Sect. 2.3).
2.1 Diagnostics
To define the TTL we focus on the vertical temperature structure, and we adopt the TTL
definition of Gettelman and Forster (2002) as the layer between the level of maximum10
convective outflow and the cold point tropopause. The maximum convective outflow
level is diagnosed from the minimum potential temperature lapse rate (dθ/dz). This
definition is not the only possible one, but conceptually marks the boundary between
which air is generally tropospheric (below) and stratospheric (above). The definition is
convenient because the TTL can be diagnosed locally from a temperature sounding,15
and facilitates comparisons with observations.
We use diagnostics previously defined by GB2007. The top of the TTL is the Cold
Point Tropopause (CPT). We also calculate the Lapse Rate Tropopause (LRT) for
comparison and for analysis of the subtropics. The LRT is defined using the stan-
dard definition of the lowest point where the lapse rate is less than 2 K km−1
for 2 km20
(−dT/dz<2 Kkm−1
). The bottom of the TTL is defined as the level of maximum con-
vective outflow. Practically, as shown by Gettelman and Forster (2002) this is where the
potential temperature Lapse Rate Minimum (LRM) is located (the minimum in dθ/dz),
and it is near the Minimum Ozone level (minO3).
We also introduce 2 new diagnostics. First, a meridional boundary of tropics, or25
1371

ACPD
8, 1367–1413, 2008
TTL Trends
A. Gettelman et al.
Title Page
Abstract Introduction
Conclusions References
Tables Figures
◭ ◮
◭ ◮
Back Close
Full Screen / Esc
Printer-friendly Version
Interactive Discussion
EGU
“TTL edge”. One of the key features of the TTL is the level of zero radiative heating
(LZH). Below the LZH air in clear-sky descends due to radiative cooling, and above the
LZH air rises due to radiative heating. If we require that the TTL has the level of zero
radiative heating (LZH) below the tropopause altitude, then the TTL edge is where the
tropopause intersects the LZH. The LZH lies at about 135–150 hPa, or about 35 hPa5
below the tropical tropopause. We thus define the edge of the tropics as where the LRT
pressure is less than the mean tropical LRTP+∆P , where ∆P=35 hPa, since we do not
have heating rates archived from most models. The edge defines the region where the
thermal tropopause drops off rapidly in pressure coordinates, and it is focused on the
upper boundary of the TTL. The goal is not so much to determine an exact latitude as10
a trend over time. The estimated trends are not sensitive to the exact value of ∆P over
the range 25–60 hPa.
Second, we examine the Zero Lapse Rate level (ZLR). This is similar to the lapse rate
tropopause, except stating that instead of the threshold of −2◦Kkm
−1, it is 0
◦Kkm
−1. For
the zonal monthly mean data available for this study the ZLR can capture changes to15
the thermal structure not seen in CPT or LRT levels. The CPT is defined to be a model
level, while the ZLR can be interpolated like the LRT. It also serves as a check on the
CPT. Table 1 provides a list of these abbreviations.
2.2 Models
This work uses model simulations developed for the Chemistry Climate Model Vali-20
dation (CCMVal) activity for the Stratospheric Processes and Their Role in Climate
(SPARC) project of the World Meteorological Organization (WMO) and the World Cli-
mate Research Program (WCRP). The work draws upon simulations defined by CCM-
Val in support of the Scientific Assessment of Ozone Depletion: 2006 (World Meteo-
rological Organization, 2007). There are two sets of simulations used. The historical25
simulation REF1 is a transient run from 1960 or 1980 to the present and was designed
to reproduce the well-observed period of the last 25 years. An assessment of tempera-
ture, trace species and ozone in the simulations of the thirteen CCMs participating here
1372
ACPD
8, 1367–1413, 2008
TTL Trends
A. Gettelman et al.
Title Page
Abstract Introduction
Conclusions References
Tables Figures
◭ ◮
◭ ◮
Back Close
Full Screen / Esc
Printer-friendly Version
Interactive Discussion
EGU
was presented in Eyring et al. (2006). Scenarios for the future are denoted “REF2” and
are analyzed from 1960 or 1980 into the future. These simulations are described in
more detail by Eyring et al. (2006), who projected the future evolution of stratospheric
ozone in the 21st century from the same CCMs used here. Table 2 lists the model
names, horizontal resolution and references, while details on the CCMs can be found5
in Eyring et al. (2006, 2007) and references therein. For the MRI and ULAQ CCMs
the simulations used in Eyring et al. (2006, 2007) have been replaced with simulations
from updated model configurations as the previous runs included weaknesses in the
TTL.
Our purpose is not so much to evaluate individual models, but to look for consistent10
climatology and trends across the models. Details of individual model performance
are contained in Eyring et al. (2006). We first will analyze model representation of
the recent past to see if the models reproduce TTL diagnostics from observations.
This provides some insight into the confidence we might place in future projections.
We will have more confidence of future projections for those diagnostics that (1) have15
consistent trends between models and (2) trends which match observations for the
past.
Model output was archived at the British Atmospheric Data Center (BADC), and
is used under the CCMVal data protocol. For more information obtaining the data,
consult the CCMVal project (http://www.pa.op.dlr.de/CCMVal). The analysis from 1120
models is conducted on monthly zonal mean output. In Sect. 2.3 below we describe
the implications of using monthly zonal means for calculating diagnostics rather than
full 3-D fields.
For comparison with model output for the historical “REF1” runs, we use model out-
put from the National Centers for Environmental Prediction/National Center for Atmo-25
spheric Research (NCEP/NCAR) Reanalysis Project (Kalnay et al., 1996), and the
European Center for Medium rage Weather Forecasting (ECMWF) 40 year reanalysis
“ERA40” (Uppala et al., 2005). Because of significant uncertainties in trend calcula-
tions due to changes in input data records, we restrict our use of the NCEP/NCAR and
1373
ACPD
8, 1367–1413, 2008
TTL Trends
A. Gettelman et al.
Title Page
Abstract Introduction
Conclusions References
Tables Figures
◭ ◮
◭ ◮
Back Close
Full Screen / Esc
Printer-friendly Version
Interactive Discussion
EGU
ERA40 reanalysis data to the period from 1979–2005, when satellite temperature data
is available for the reanalysis.
Trends are calculated from annual diagnostic values using a bootstrap fit (Efron and
Tibshirani, 1993). The bootstrap fitting procedure yields a standard deviation (σ) of
the linear trend slope, which can be used to estimate the uncertainty. For calculations5
here we report the 2σ (95%) confidence interval. For multimodel ensembles we use
a mean of the trend slopes and mean of the 2σ uncertainty to estimate a 95% confi-
dence interval for significance of the multi-model mean. We have chosen simple linear
regression for trend analysis. Multiple regression, including other climate forcings could
be included in the REF1 (historical) calculation, but different models include different10
forcings (e.g. some models do not have volcanic eruptions), and this might complicate
multi-model analysis.
2.3 Analysis
Zonal monthly mean output on a standard set of levels is available from most models.
In this section we show that use of zonal monthly mean temperatures and ozone on15
these standard levels to calculate TTL diagnostics has only minor affects on the results
of the analysis to be presented in Sects. 3 and 4 below.
In general a diagnostic calculated from an average of individual profiles is not equal
to the average of the diagnostic calculated for each profile. In the case of LRT inter-
polation to standard levels and monthly and zonal averaging of a model temperature20
field is involved. However, the LRT definition is mainly based on the (linear) vertical
temperature gradient. Therefore averaging is not expected to greatly affect the results
in this case. The same holds for ZLR, however for the CPT the situation is not as clear.
However, we do have 3-D instantaneous model output available from WACCM and
CMAM for comparison to verify that the averaging does not affect the results. This has25
also been discussed by Son et al. (2008)1
for global tropopause height trends using a
subset of model runs in this study.
Figure 1 shows WACCM January zonal mean Cold Point Tropopause Temperature
1374
ACPD
8, 1367–1413, 2008
TTL Trends
A. Gettelman et al.
Title Page
Abstract Introduction
Conclusions References
Tables Figures
◭ ◮
◭ ◮
Back Close
Full Screen / Esc
Printer-friendly Version
Interactive Discussion
EGU
(CPTT-top), Lapse Rate Tropopause Pressure (LRTP- middle) and Lapse Rate Mini-
mum pressure (LRMP) from 3-D instantaneous profiles (black) and from monthly zonal
mean output (gray) for 60 S–60 N latitude. The monthly zonal mean cold point and
lapse rate minimum are well reproduced, within 1 K and 10 hPa respectively in the
tropics. The LRMP is also reproduced in the tropics, but since it is a level and not inter-5
polated, a single monthly mean has a coarse distribution depending on model pressure
levels. A plot of LRMP like Fig. 1 for CMAM also shows agreement between zonally
averaged and 3-D output. Results for other months are similar for WACCM and CMAM.
We have also performed an analysis like that in Fig. 1 using the tropopause edge
definition, which produces a consistent value and trend regardless of whether 3-D or10
zonal monthly mean temperatures are used for input. This is not surprising as the
definition is based on Lapse Rate Tropopause pressure.
Note that the level of the ozone minimum is often not well defined in zonal mean data
because the mid-tropospheric gradients are small. Thus we refrain from showing these
diagnostics for zonal mean output.15
Trends calculated using WACCM and CMAM 3-D monthly mean fields on model
pressure levels are used to estimate the diagnostics at each point, and compared
this to trends estimated using zonal mean temperature and ozone interpolated to a
standard set of levels to estimate the diagnostics for each models. Zonal monthly
means are available for all models from the BADC archive. For the diagnostics in20
Sect. 4, the individual annual tropical means in WACCM have a linear correlation of
∼0.96 between 2-D and 3-D output. The trends in WACCM and CMAM differ by only
a few percent, and are not statistically different. We expect this result to be valid for
models which performed interpolation only once when data was put into the archive,
as discussed by Son et al. (2008)1
for a subset of these models. The GEOSCCM25
model has undergone a double interpolation for tracer fields, which may effect trends.
GEOSGCM is not reported in the multi-model ensemble trend numbers, but is shown
on the plots.
1375
ACPD
8, 1367–1413, 2008
TTL Trends
A. Gettelman et al.
Title Page
Abstract Introduction
Conclusions References
Tables Figures
◭ ◮
◭ ◮
Back Close
Full Screen / Esc
Printer-friendly Version
Interactive Discussion
EGU
3 Multi-model climatology
First we show a few examples of the climatology from the multi-model ensemble from
the historical scenarios to verify that models beyond WACCM and CMAM analyzed by
GB2007 do reproduce the basic structure of the TTL.
Figure 2 illustrates the annual cycle of tropical (±15deg latitude) cold point5
tropopause temperature (CPTT) for 1980–2000. The full field is shown in Fig. 2a and
anomalies about the annual mean (highlighting the annual cycle) are shown in Fig. 2b.
Models are shown with solid (S) or dashed (D) lines as indicated in the legend for
Fig. 2a.
Results are similar (but not identical) to the 100 hPa Temperatures shown in Fig. 710
of Eyring et al. (2006). The amplitude of the annual cycle is larger (6 K CPTT v. 4 K
100 hPa amplitude for ERA40), but the seasonality is similar.
All models have a similar annual cycle of CPTT (Fig. 2b). This is also true for the
Lapse Rate Tropopause Temperature (not shown). Tropical mean CPTT is lowest in
January–March, and highest in August–September. There are some models in which15
the annual cycle is shifted by 1–2 months relative to the reanalysis (red lines in Fig. 2).
The amplitude of annual cycle is similar in most models (4–5 K) (Fig. 2b), but the ab-
solute value varies by 10 K (Fig. 2a). The reasons for the differences in CPTT are
complex, having to do both with model formulation and possibly with 2-D output. Note
that this CPTT analyzed from monthly mean output on standard levels and may not be20
relevant for water vapor, since 3-D transport plays a role (see Sect. 5). The difference
in CPTT is partially due to slight differences in the pressure of the minimum tempera-
ture, which varies similarly to the LRTP (see Fig. 5 below). Variations are due to model
vertical resolution and vertical interpolation to standard pressure levels.
Differences between 3-D WACCM or 3-D CMAM (calculated on model levels using25
3-D monthly means) and 2-D WACCM or CMAM indicate about 1–2 K temperature
differences, and make it somewhat difficult to relate this variation to differences in water
vapor noted by Eyring et al. (2006). It also makes it difficult to know how much the
1376
ACPD
8, 1367–1413, 2008
TTL Trends
A. Gettelman et al.
Title Page
Abstract Introduction
Conclusions References
Tables Figures
◭ ◮
◭ ◮
Back Close
Full Screen / Esc
Printer-friendly Version
Interactive Discussion
EGU
CPTT is affected by output and analysis, though for CMAM and WACCM the effect is
small. The reanalysis systems have warmer CPTT than most models, which may be
a bias in the analysis (Pawson and Fiorino, 1999), or due to coarse vertical resolution
(Birner et al., 2006). The inter-annual variability, shown as a 2 standard deviation (σ)
confidence interval for the reanalysis in Fig. 2a, is about 2 K.5
Figure 3a illustrates the annual zonal mean Lapse Rate Tropopause Pressure
(LRTP). The lapse rate tropopause pressure is a better metric than the cold point
tropopause pressure for trends, because in many cases the cold point is ALWAYS
the same level. This occurs when variability is less than the model vertical grid spac-
ing. The seasonal cycle is not shown, but the LRTP is lowest (highest altitude) in10
February–April (flat in winter), and maximum, (lowest altitude) in July–October. There
is more variation seasonally between models, but models are generally clustered with
an annual tropical mean of between 92–102 hPa and an annual cycle amplitude of
about 10hPa. There is more variation between models poleward of 30deg latitude.
The Lapse Rate Minimum (LRM) pressure is illustrated in Fig. 3b. The LRM is gen-15
erally around 250 hPa in the deep tropics (15 S–15 N latitude), with 2 models near
200 hPa, and scatter below this. There is little annual cycle in most models (not shown).
The LRM is well defined in convective regions (see GB2007 for more details) within ∼20
degrees of the equator. It is not well defined outside of the tropics and is not a useful
diagnostic there.20
Tropical edge latitudes (Fig. 3-dashed vertical lines) defined by looking at the merid-
ional gradient of LRTP (see Sect. 2.1) are similar for all models, with a spread of less
than 10 degrees latitude. The annual cycle is basically identical for all models, and is
also about 10 degrees latitude (not shown), with the tropics extending more into sum-
mer hemisphere. Models are in good agreement with observations of the tropical edge25
from NCEP/NCAR and ERA40 analyses.
1377

ACPD
8, 1367–1413, 2008
TTL Trends
A. Gettelman et al.
Title Page
Abstract Introduction
Conclusions References
Tables Figures
◭ ◮
◭ ◮
Back Close
Full Screen / Esc
Printer-friendly Version
Interactive Discussion
EGU
4 Long term trends
As noted in Sect. 2.3 we have analyzed trends from WACCM and CMAM with both 3-D
and zonal monthly mean data, and found no significant differences in LRTP, CPTT or
LRMP. For WACCM the correlation correlation between 3-D and 2-D annual means is
∼0.96. So for estimating trends, we use the zonal monthly mean data available from5
all the models. We start with historical trends (REF1: 1960–2005) in Sect. 4.1 and
then discuss scenarios for the future in Sect. 4.2. Table 3 summarizes multi-model
and observed trends for various quantities, with statistical significance based on the
2σ (95%) confidence intervals from a bootstrap fit. For the last two columns, not all
models provide output over the entire time period (see for example, Fig. 4). 13 models10
are included in statistics for REF1 and 10 for REF2. E39C and UMETRAC REF2
runs were not available, and the GEOSCCM values were not included due to double
interpolation.
4.1 Historical trends
Little change is evidenced from 1960–2005 in simulated CPTT (Fig. 4). It is hard to15
find any trends which are significantly different from zero in the simulations (Table 3).
Some models appear to cool, some to warm, but these do not appear to be significant
trends. However, many models and the reanalysis systems do indicate cooling from
1991–2004. This analysis is consistent with Fig. 2 of Eyring et al. (2007) that shows the
vertical structure of tropical temperature trends. There is little positive trend in CPTT20
estimated from ERA40. However, NCEP has a large cooling trend not seen in ERA40.
This may be due to inconsistencies in the NCEP analysis system (Randel et al., 2006)
resulting from changes in input data over time. Thus there is also significant uncertainty
in CPTT trends in the reanalysis data.
The Lapse Rate Tropopause Pressure (LRTP) does appear to decrease in the simu-25
lations and analyses (Fig. 5), indicating a lower pressure (higher altitude) to the tropical
tropopause of −1 to −1.5 hPa/decade (Table 3). Quantitatively the reanalysis trends
1378

ACPD
8, 1367–1413, 2008
TTL Trends
A. Gettelman et al.
Title Page
Abstract Introduction
Conclusions References
Tables Figures
◭ ◮
◭ ◮
Back Close
Full Screen / Esc
Printer-friendly Version
Interactive Discussion
EGU
are 50% larger than model trends. The LRTP decrease in the tropics is consistent with
other work with models (Santer et al., 2003; Son et al., 20081) and observations (Seidel
et al., 2001; Gettelman and Forster, 2002). LRTP trends are smaller than ZLRP trends.
The trend in LRTP can also be seen in CPTP. In general the trend from the models is
consistent across models in Fig. 5. Variability in models is generally less than in the5
analyses. As noted, CPTT is correlated with CPT pressure. This can be seen in the
LRTP as well in Fig. 5: models with lower pressure LRTP have colder CPTT (Fig. 4).
These changes represent the “top” of the TTL. The “bottom” of the TTL is repre-
sented by the Lapse Rate Minimum pressure (LRMP), which is related to the main
convective outflow, and thus a measure of where convection impacts the thermody-10
namic profile in the TTL. Trends in LRM pressure are shown in Fig. 6. There are few
significant trends in simulated LRM pressure in most models. Large variability in ULAQ
is likely due to coarse (2500 m) vertical and horizontal resolution (10◦×22.5
◦).
The multi-model trend is larger for the shorter (1979–2001) period, with a significant
LRMP decrease of ∼−2 hPa/decade. ERA40 shows a large (−3.5 hPa/decade) de-15
crease in LRMP, mostly from 1990–2001. However, NCEP shows virtually no change
in LRM Pressure. The reason for this discrepancy in the analysis systems is not known.
It might be due to missing the vertical correlation structure in NCEP seen by Son et
al. (2008)1. The LRM diagnostic is not tightly constrained and can vary with model
formulation. However, the LRTP in Fig. 5 is much more tightly constrained, with both20
analysis systems highly correlated, and many of the models also having correlated in-
terannual variability, most likely forced by Sea Surface Temperature patterns (ENSO).
To better understand the above trends, we have analyzed CPTT (Fig. 7a), LRTP
(Fig. 7b) and LRMP (Fig. 7c) trends at each point in the REF1 WACCM simulations
using 3-D monthly mean output. The trends are indicated in Fig. 7, along with trends in25
cloud top pressure by location (Fig. 7d). Shaded trends more than one contour interval
from zero in Fig. 7 are almost always significant at the 95% (2σ) level. The figure
represents an average of trends from all 3 WACCM REF1 realizations, which all have
similar patterns. WACCM has moderate correlations with reanalysis LRTP (Fig. 5), but
1379

ACPD
8, 1367–1413, 2008
TTL Trends
A. Gettelman et al.
Title Page
Abstract Introduction
Conclusions References
Tables Figures
◭ ◮
◭ ◮
Back Close
Full Screen / Esc
Printer-friendly Version
Interactive Discussion
EGU
with less interannual variability.
In Fig. 7a CPTT decreases slightly throughout the tropics in WACCM and increases
in the subtropics. WACCM CPTT changes are largest centered over the Western Pa-
cific, but CPTT actually increases over Tropical Africa. Thus the zonal mean trend is
not significant. These changes are somewhat coherent with the pattern of changes in5
cloud top pressure (Fig. 7d), with decreasing pressure (higher clouds) in the W. Pa-
cific. This appears to be a shift in clouds towards the equator from the South Pacific
Convergence Zone (SPCZ), which would cool the tropopause by enhancing tropical
wave modes (Kelvin and equatorial Rossby waves), noted by Kerr-Munslow and Nor-
ton (2006). Note that increases in the subtropical stratocumulus regions west of Africa10
and S. America in Fig. 7d should be discounted since clouds are at high pressure and
the change represents a small height change.
Figure 7b shows that the LRTP decreases almost everywhere in the tropics and sub-
tropics. The largest values are in the East Pacific where the LRTP is slightly higher
pressure. The LRM pressure (Fig. 7c) does not have a coherent trend in WACCM,15
consistent with Fig. 6.
There are very large differences in mean 300 hPa ozone in the tropical troposphere
in the models (Fig. 8b). 300 hPa is a level near the ozone minimum. This result is not
unexpected since tropospheric ozone boundary conditions were not specified, and the
models have different representations of tropospheric chemistry. The spread of ozone20
at 300 hPa is 10–80 ppbv with most models clustered around the observed value of
30 ppbv (from SHADOZ Ozonezondes). The model which is significantly lower (CMAM)
is lower due to a lack of tropospheric ozone sources or chemistry which may impact
CPTT.
Even at 100hPa near the tropopause there are variations in ozone between25
75–300 ppbv (Fig. 8a). These differences are much larger at the high end than
the ∼120 ppbv observed from SHADOZ. Most models have a low bias relative to
SHADOZ. Several models are not clustered with the others in Fig. 8a, including LMDZ,
MAECHAM, MRI, SOCOL and ULAQ. For MAECHAM this is related to ascent rates in
1380

ACPD
8, 1367–1413, 2008
TTL Trends
A. Gettelman et al.
Title Page
Abstract Introduction
Conclusions References
Tables Figures
◭ ◮
◭ ◮
Back Close
Full Screen / Esc
Printer-friendly Version
Interactive Discussion
EGU
the lower stratosphere (Steil et al., 2003). There is also a correlation (linear correlation
coefficient ∼0.6) between Cold Point Temperature and ozone around the tropopause
(150–70 hPa). Models with higher ozone have higher tropopause temperatures in
Fig. 2, consistent with an important role for ozone in the radiative heating of the TTL.
Thus the ozone climatology in models varies and is a source of spread in tropopause5
temperatures. We discuss this further in Sect. 5.
Figure 9 takes the tropical edge latitudes to define a “width” of the tropics. This
width is generally about 65 degrees latitude. The spread of model mean values is
about 6 degrees, consistent with Fig. 3. Models do not seem to capture the increase
in tropical width clearly evident in the reanalyses. The reanalyses indicate that the10
tropics has been getting wider, significantly in the NCEP/NCAR analyses (Table 3).
This is consistent with recent work (Seidel and Randel, 2007). While some models
show slight trends in Fig. 9, these trends for most models and the multi-model mean
are not significantly different than zero due to large inter-annual variability.
4.2 Future scenarios15
We now examine the evolution of the TTL for the future scenario (REF2). As dis-
cussed in Eyring et al. (2007), the future scenario uses near common forcing for all
models. Models were run from 1960 or 1980 to 2050 or 2100. Surface concentrations
of greenhouse gases (CO2, CH4, N2O) are specified from the Intergovernmental Panel
on Climate Change (IPCC) Special Report on Emissions Scenarios (SRES) GHG sce-20
nario A1B (medium) (IPCC, 2000). Surface halogens (chlorofluorocarbons (CFCs), hy-
drochlorofluorocarbons (HCFCs), and halons) are prescribed according to the Ab sce-
nario of World Meteorological Organization (2003). Sea surface temperatures (SSTs)
and sea ice distributions are derived from IPCC 4th Assessment Report simulations
with the coupled ocean-atmosphere models upon which the CCMs are based. Oth-25
erwise, SSTs and sea ice distributions are from a simulation with the UK Met Office
Hadley Centre coupled ocean-atmosphere model HadGEM1 (Johns et al., 2006). See
Eyring et al. (2007) for details. Trends in Table 3 are calculated from available data for
1381
ACPD
8, 1367–1413, 2008
TTL Trends
A. Gettelman et al.
Title Page
Abstract Introduction
Conclusions References
Tables Figures
◭ ◮
◭ ◮
Back Close
Full Screen / Esc
Printer-friendly Version
Interactive Discussion
EGU
each model from 1980 to the end of the run (mostly 2050 or 2100). Since trends are
broadly linear, mixing periods does not quantitatively change the multi-model ensemble
trend.
Figure 10 illustrates changes in CPTT, similar to Fig. 4 but for the future (REF2)
scenario. Models generally project cold point or lapse rate tropopause temperatures5
to increase. The rate of temperature increase is only 0.1–0.2 deg/decade (Table 3),
but is significant. For AMTRAC, the increase is almost 0.3 deg/decade, which may
be coupled to the low ozone at the tropopause (Son et al., 20081). The analysis is
consistent with Fig. 2 of Eyring et al. (2007) that shows the vertical structure of tropical
temperature trends.10
In addition to the small temperature increase, the pressure (height) of either lapse
rate or cold point tropopause decreases as well (altitude increase), seen in Fig. 11.
The rate of decrease is ∼−0.5 hPa/decade, which is less than observed during the
historical record in REF1 scenarios or observed in the reanalyses. (Table 3). However,
there is very good consistency among the model trends (though with some spread in15
magnitude), which is clear in Fig. 11. The ∼15hPa spread in pressure is likely due to
different model formulations and vertical resolution.
Figure 12 indicates that the Lapse Rate Minimum pressure (LRMP) decreases sig-
nificantly in some simulations (CMAM, WACCM, AMTRAC, MAECHAM), and does not
change in others (SOCOL). In some simulations (MRI), the LRMP is not well defined,20
and it’s pressure is indeterminate. In other simulations (CMAM) there are apparent
differences in trend before and after 2000. Since the LRMP represents the impact of
convection on thermodynamics, differences are likely due to different convective pa-
rameterizations in the simulations. For the multi-model ensemble, the change is nearly
−2 hPa/decade, and is significant. The LRMP is linked to convection, and thus changes25
in the LRMP indicate changes in the outflow of convection in the upper troposphere.
Figure 13 illustrates the map of trends for WACCM from the REF2 runs from 1975–
2050. As with Fig. 7, this is one of 3 runs with similar patterns. WACCM trends in CPTT
are smaller than some models (Fig. 10). WACCM LRTP trends are very similar to other
1382
ACPD
8, 1367–1413, 2008
TTL Trends
A. Gettelman et al.
Title Page
Abstract Introduction
Conclusions References
Tables Figures
◭ ◮
◭ ◮
Back Close
Full Screen / Esc
Printer-friendly Version
Interactive Discussion
EGU
models (Fig. 11). Figure 13a indicates that CPTT increases in most regions of the trop-
ics. CPTT trends are largest (0.2 K/decade) over 0–120 E (Africa–Indonesia). There
are slight Temperature decreases in the subtropical Pacific. These decreases are con-
sistent with an upper level wave response to enhanced convection (or decreased cloud
top pressure) over the Central Pacific in WACCM (Fig. 13d). Clouds go up to higher al-5
titudes, trends up to −12 hPa/decade, over the C. Pacific, extending into the W. Pacific.
This might be interpreted as an extension of the convective region eastward.
The Lapse Rate Tropopause Pressure appears to decrease everywhere in the trop-
ics (Fig. 13b). There is not much structure to the decrease, though it is larger over
the Central Pacific where clouds are going higher in WACCM (Fig. 13d). The LRMP10
(Fig. 13c) also goes up in most regions of the tropics. The pattern does not have much
structure, and appears moderately correlated with cloud changes in (Fig. 13d). There
are larger changes near the coast of S. America, but this appears to be associated
with an increase in cloud pressure (lower cloud). It may be that another variable would
be better suited to looking at coupling between cloud detrainment and the LRMP, but15
only limited diagnostics are available. These diagnostics do not indicate as direct a
connection between clouds and LRMP changes as seen in REF1 runs (Fig. 7).
The Zero Lapse Rate (ZLR) pressure (ZLRP) and temperature (ZRLT) are another
way to examine the thermal structure around the tropopause. The ZLR is defined
identically to the Lapse Rate Tropopause, but for a lapse rate of 0 K/km not −2 K/km.20
It is similar to the cold point, but can be interpolated from coarse temperature profiles.
The ZLRT and ZLRP trends are indicated in Table 3, and are basically identical to
CPTT and LRTP trends. Figures look very similar to trends from the REF1 scenarios
and reanalyses (Fig. 4 and Fig. 5) as well as similar to the REF2 scenarios (Fig. 10
and Fig. 11). This serves as a consistency check on the derived tropopause trends.25
Changes in the projected width of the tropics are shown in Fig. 14, as for Fig. 9. 3
simulations (ULAQ, MRI, GEOSCCM) show significant positive trends (a broadening of
the tropics) one simulation (CCSRNIES) has a significant negative trend and the rest
are not significant. The multi-model ensemble indicates no significant trend. No signif-
1383

ACPD
8, 1367–1413, 2008
TTL Trends
A. Gettelman et al.
Title Page
Abstract Introduction
Conclusions References
Tables Figures
◭ ◮
◭ ◮
Back Close
Full Screen / Esc
Printer-friendly Version
Interactive Discussion
EGU
icant trends are seen in either the Northern or Southern edge. The lack of consistent
trend in tropical edges may be due to the relatively coarse horizontal resolution of many
of the models. An investigation of trends with a higher horizontal resolution version of
WACCM (2×2.5 degrees instead of 4×5 degrees) indicates trends in edge latitude
which are slightly larger and significant at higher resolution, but only 0.1 deg/decade.5
Across models there is no correlation between edge trends and horizontal resolution.
Thus the model simulations do not show significant changes at 200–400 km horizontal
resolution.
5 Discussion
Finally we address three derived questions that result from these simulations. First, we10
try to use the spread of model ozone values to ask if ozone matters for the TTL struc-
ture. Second, we look at why Cold Point Temperatures increase but the tropopause
rises (decreases in pressure). Third, we look at the implications of tropopause temper-
ature changes on stratospheric water vapor.
5.1 Ozone impacts on Tropopause15
Given the wide variation and differences in ozone (Fig. 8), this is a natural experiment
to see if ozone matters for the structure of the TTL, as discussed by Thuburn and Craig
(2002). It does appear that tropopause level ozone is correlated with temperature:
those models with colder CPTT (Fig. 4) do appear to have less ozone at tropopause
levels (Fig. 8), but the correlation is not perfect (0.6). It is not clear whether ozone dif-20
ferences are due to transport or chemistry. For some models (i.e. CMAM) low ozone is
due to missing chemical processes (i.e. lightning NOx production for CMAM). For other
models, transport may bring high ozone from the stratosphere (MAECHAM). In addi-
tion, models with a colder tropopause have a higher tropopause, but higher (altitudes)
should have more ozone and more heating, indicating this may not be the dominant25
1384
ACPD
8, 1367–1413, 2008
TTL Trends
A. Gettelman et al.
Title Page
Abstract Introduction
Conclusions References
Tables Figures
◭ ◮
◭ ◮
Back Close
Full Screen / Esc
Printer-friendly Version
Interactive Discussion
EGU
contributor to observed variability.
We have also looked at the trends in LRT and CPT pressure and temperature as a
function of mean 100 hPa O3. There does not seem to be a correlation in the trends,
though as noted there is a correlation in the absolute temperature. This is not surprising
given the small TTL ozone trends in these simulations but highlights that ozone may5
matter for TTL structure.
5.2 Tropopause changes
It is useful to consider the geometric picture of tropopause trends for an analysis of
changes in tropopause temperature given changes in tropopause height (or pressure)
and changes in tropospheric and stratospheric temperature, respectively. Assume that10
the temperature profile is piecewise linear and continuous in height with distinct tropo-
spheric and stratospheric temperature gradients Γt and Γs, respectively: T=Γtz+Tsfc
for z≤zTP and T=Γsz+T0s for z≥zTP. Here, zTP refers to tropopause height, Tsfc refers
to surface temperature and its changes represent tropospheric temperature trends,
and T0s is the temperature at which the stratospheric profile would intersect the ground15
and its changes represent stratospheric temperature trends. It is straight forward to
combine both tropospheric and stratospheric temperature profiles to yield tropopause
temperature:
TTP =Γt + Γs
2zTP +
Tsfc + T0s
2.
In the tropics a first order approximation is Γt≈−Γs, i.e. tropopause temperature is20
approximately independent of tropopause height. Trends in tropopause height in the
tropics therefore do not necessarily imply trends in tropopause temperature. Poten-
tial trends in tropical tropopause temperature rather result directly from the combined
trends in tropospheric and stratospheric temperature.
A back of the envelope analysis of changes to the TTL given greenhouse gas forcing25
indicates that the tropical tropopause pressure should decrease, but it is not clear what
1385

ACPD
8, 1367–1413, 2008
TTL Trends
A. Gettelman et al.
Title Page
Abstract Introduction
Conclusions References
Tables Figures
◭ ◮
◭ ◮
Back Close
Full Screen / Esc
Printer-friendly Version
Interactive Discussion
EGU
should happen to tropopause temperature. If the troposphere warms, the upper tropo-
sphere may warm by a larger amount than the surface (Santer et al., 2005). Assuming
no change to stratospheric temperatures, this would push the tropopause to higher al-
titudes (lower pressures) and warmer temperatures. If the stratosphere cools and the
troposphere stays constant, this would push the tropopause to higher altitudes (lower5
pressures) and colder temperatures.
In reality, radiative forcing by anthropogenic greenhouse gases both warms the tro-
posphere (increasing Tsfc) and cools the stratosphere (which will change T0s, depend-
ing on the structure and magnitude of the temperature change). This is illustrated in
the vertical profile of temperature trends from these simulations, Fig. 2 of Eyring et al.10
(2007). The change from warming to cooling is right around the tropopause.
Thus we expect tropopause rises, but what will happen to its temperature? Fig-
ure 15 illustrates 1980 (solid) and 2050 (dashed) profiles from WACCM (orange-red)
and CMAM (purple) realizations. Here it is clear that the troposphere is warming, and
the stratosphere is cooling, but the result is a slight warming of the tropopause temper-15
ature. This response seems consistent across all model simulations (Fig. 10). As noted
by Son et al. (2008)1
this is dependent upon ozone recovery, and may be different for
those models without interactive ozone chemistry.
5.3 Stratospheric water vapor
Tropical tropopause temperatures control stratospheric water vapor (Holton and Gettel-20
man, 2001; Randel et al., 2006). Analysis indicates that the variation in CPTT among
the models does strongly affect stratospheric water vapor. Figure 16 shows a scatter-
plot of the mean annual saturation vapor mixing ratio (Qsat) at the CPTT for all the
models, plotted as a function of mean annual 90hPa water vapor. Also included are
points representing analysis CPTT from NCEP or ERA40 and Halogen Occultation Ex-25
periment (HALOE) annual mean 100 hPa water vapor (HALOE data was not available
at 90 hPa). HALOE/NCEP is an outlier because of the warm bias of NCEP tempera-
tures at the cold point tropopause. The plot indicates that all models and the analy-
1386

ACPD
8, 1367–1413, 2008
TTL Trends
A. Gettelman et al.
Title Page
Abstract Introduction
Conclusions References
Tables Figures
◭ ◮
◭ ◮
Back Close
Full Screen / Esc
Printer-friendly Version
Interactive Discussion
EGU
sis systems over the historical record fall below a 1:1 line (100% relative humidity at
90 hPa if limited by the CPTT), close to a 1:0.6 (60% at 90 hPa), and that there is a
correlation between CPTT and tropical 90 hPa water vapor, indicating that CPTT limits
stratospheric water vapor. This is a tropical mean, so reflects transport processes as
well. Two models (MRI, CCSRNIES) lie above this line, which may indicate differences5
in transport, such that airs has bypassed the tropical tropopause.
The projected increase in tropopause temperature would be expected to increase
stratospheric water vapor. The magnitude of the warming to 2100 is only ∼1.8 K. For a
tropopause at 191 K and 90 hPa, this warming would change the Saturation Vapor Mix-
ing Ratio (SVMR) of water vapor by 1.5 ppmv (4.4 to 5.9 ppmv), a 35% increase Eyring10
et al. (2007) show that the mean 50 hPa tropical (25 S–25 N) water vapor increase in
the models is 0.5–1 ppmv by 2100, slightly less than this (but still a ∼25% increase).
The increase also includes some effect from increasing methane (though this should
not be large at 50 hPa in the tropics).
It is not surprising that the increase in water vapor is less than the SVMR increase,15
as the latter is a mean annual value based on average CPTT temperatures, and may
not be exactly relevant for water vapor as the tropical tropopause temperatures vary in
space and time, and water vapor is transported three dimensionally in the TTL.
6 Conclusions
We have analyzed the representation of the Tropical Tropopause Layer in 13 differ-20
ent Coupled Climate Models designed to represent the stratosphere. Results indicate
that the models are able to reproduce the basic structure of the TTL. The models are
generally able to reproduce past trends observed by reanalyses.
There are not consistent historical trends in Cold Point Tropopause Temperatures.
NCEP/NCAR reanalyses show decreases in cold point temperatures, but ERA40 has25
a slight increase. Some of these differences are related to the fundamental clima-
tologies: while model tropopause pressures are in close agreement, there are large
1387
ACPD
8, 1367–1413, 2008
TTL Trends
A. Gettelman et al.
Title Page
Abstract Introduction
Conclusions References
Tables Figures
◭ ◮
◭ ◮
Back Close
Full Screen / Esc
Printer-friendly Version
Interactive Discussion
EGU
(10K) variations in tropopause temperatures. Some of this appears to be related to the
wide spread of ozone at tropopause levels in the simulations and to different altitudes
of the tropopause. Differences in CPTT are correlated with differences in simulated
stratospheric water vapor.
Models and reanalyses indicate decreases in tropopause pressure in the observed5
record of similar magnitude, a result also found in other studies of radiosonde tempera-
tures. Differences are correlated and consistent, indicating higher confidence in these
trends.
Over the observed record there are significant changes in the minimum lapse rate
level. The changes seen in WACCM are coherent with changes in convection.10
The reanalyses indicate that the TTL is getting “wider”, as the TTL edges move pole-
ward by 0.5–1 deg/decade. The change is only significant in NCEP/NCAR reanalyses.
The tropics does not seem to get any wider in the historical simulations, due to large
variability.
What does this mean for the future trends, and what do we have confidence in?15
1. Models consistently show continued decreases in tropopause pressure into the
future. Trends are of lower magnitude than historical trends. This result is consistent
with the global results of Son et al. (2008)1
from a subset of these models (AMTRAC,
CMAM, GEOSCCM, WACCM). They also show modest increases in cold point tem-
perature. This “raising and warming” is broadly consistent with theory, but also illus-20
trates that projected tropospheric warming may dominate stratospheric cooling at the
tropopause in the 21st century.
2. There are also significant decreases in the Lapse Rate Minimum Pressure,
amounting to a change of −17 hPa over the 21st century, which indicates a signifi-
cant increase in the mean convective outflow level on the order of 250 m. This change25
is dependent on a sub-grid scale process (convection) but is likely driven by surface
changes (warmer temperatures). As a result there is spread to the model trends. His-
torical trends in the LRMP are hard to ascertain.
3. There does not appear to be a significant change in the models in the width of the
1388

ACPD
8, 1367–1413, 2008
TTL Trends
A. Gettelman et al.
Title Page
Abstract Introduction
Conclusions References
Tables Figures
◭ ◮
◭ ◮
Back Close
Full Screen / Esc
Printer-friendly Version
Interactive Discussion
EGU
tropics over the observed record or in the future. This disagrees with the analyses and
with previous work, and may be related to the coarse horizontal resolution of the mod-
els, as observed changes are less than a model grid box. Changes are not correlated
with model horizontal resolution.
Thus models are able to represent the TTL structure, and reproduce observed5
tropopause height trends. If tropopause height and particularly temperature trends
are to be believed, it may have significant impacts on stratospheric water vapor due to
warmer temperatures.
Furthermore, it is desirable that future modeling efforts pay closer attention to TTL
ozone, which seems to be correlated with the absolute value of tropopause temper-10
ature, and may be important for affecting trends, though no explicit correlation was
found.
Acknowledgements. Co-ordination of this study was supported by the Chemistry-Climate
Model Validation Activity (CCMVal) for WCRP’s (World Climate Research Programme) SPARC
(Stratospheric Processes and their Role in Climate) project. Thanks to all the CCM groups15
for their comments on this paper specifically, and generally for their hard work in developing
and producing model output. We especially thank those model developers who are not co-
authors: J. Austin, T. Nagashima, T. G. Shepherd, S. Pawson, R. S. Stolarski, M. A. Giorgetta,
E. Manzini, M. Deushi, N. Butchart, M. P. Chipperfield and R. R. Garcia. Thanks to K. Rosenlof
for discussions. Thanks to the British Atmospheric Data Center for assistance with the CCMVal20
Archive. The National Center for Atmospheric Research is sponsored by the U.S. National Sci-
ence Foundation. CCSRNIES research was supported by the Global Environmental Research
Fund (GERF) of the Ministry of the Environment (MOE) of Japan (A-071).
References
Akiyoshi, H., Sugita, T., Kanzawa, H., and Kawamoto, N.: Ozone perturbations in the Arc-25
tic summer lower stratosphere as a reflection of NOx chemistry and planetary scale wave
activity, J. Geophys. Res., 109, D03304, doi:10.1029/2003JD003632, 2004. 1396
1389
ACPD
8, 1367–1413, 2008
TTL Trends
A. Gettelman et al.
Title Page
Abstract Introduction
Conclusions References
Tables Figures
◭ ◮
◭ ◮
Back Close
Full Screen / Esc
Printer-friendly Version
Interactive Discussion
EGU
Austin, J.: A three-dimensional coupled chemistry-climate model simulation of past strato-
spheric trends, J. Atmos. Sci., 59, 218–232, 2002. 1396
Austin, J. and Butchart, N.: Coupled chemistry-climate model simulation for the period 1980
to 2020: ozone depletion and the start of ozone recovery, Q. J. R. Meteorol. Soc., 129,
3225–3249, 2003. 13965
Austin, J. and Wilson, R. J.: Ensemble simulations of the decline and recovery of stratospheric
ozone, J. Geophys. Res., 111, D16314, doi:10.1029/2005JD006907, 2006. 1396
Austin, J., Wilson, R. J., Li, F., and Vomel, H.: Evolution of water vapor concentrations and
stratospheric age of air in coupled chemistry-climate model simulations, J. Atmos. Sci., 64,
905–921, 2007. 139610
Beagley, S. R., de Grandpre, J., Koshyk, J., McFarlane, N. A., and Shepherd, T. G.: Radiative–
dynamical climatology of the first–generation Canadian Middle Atmosphere Model, Atmos–
Ocean, 35, 293–331, 1997. 1396
Birner, T., Sankey, D., and Shepherd, T. G.: The tropopause inversion layer in models and
analyses, Geophys. Res. Lett., 33, L14804, doi:10.1029/2006GL026549, 2006. 137715
Bloom, S., da Silva, A., Dee, D., et al.: Documentation and Validation of the Goddard Earth
Observing System (GEOS) Data Assimilation System – Version 4, Tech. Rep. Technical
Report Series on Global Modeling and Data Assimilation 104606, NASA, 2005. 1396
Bony, S., Colman, R., Kattsov, V. M., et al.: How Well Do We Understand and Evaluate Climate
Change Feedback Processes, J. Climate, 19, 3445–3482, 2006. 136920
Butchart, N., Scaife, A. A., Bourqui, M., de Grandpre, J., Hare, S. H. E., Kettleborough, J.,
Langematz, U., Manzini, E., Sassi, F., Shibata, K., Shindell, D., and Sigmond, M.: Sim-
ulations of anthropogenic change in the strength of the Brewer-Dobson circulation, Clim.
Dynam., 27, 727–741, doi:10.1007/s00382-006-0162-4, 2006. 1369
Dameris, M., Grewe, V., Ponater, M., et al.: Long-term changes and variability in a transient25
simulation with a chemistry-climate model employing realistic forcings, Atmos. Chem. Phys.,
5, 2121–2145, 2005,
http://www.atmos-chem-phys.net/5/2121/2005/. 1369, 1396
Dameris, M., Matthes, S., Deckert, R., Grewe, V., and Ponater, M.: Solar cycle effect delays on-
set of ozone recovery, Geophys. Res. Lett., 33, L03806, doi10.1029/2005GL024741, 2006.30
1396
de Grandpre, J., Beagley, S. R., Fomichev, V. I., Griffioen, E., McConnell, J. C., Medvedev,
A. S., and Shepherd, T. G.: Ozone climatology using interactive chemistry: results from the
1390

ACPD
8, 1367–1413, 2008
TTL Trends
A. Gettelman et al.
Title Page
Abstract Introduction
Conclusions References
Tables Figures
◭ ◮
◭ ◮
Back Close
Full Screen / Esc
Printer-friendly Version
Interactive Discussion
EGU
Canadian Middle Atmosphere Model, J. Geophys. Res., 105, 26 475–26 491, 2000. 1396
Efron, B. and Tibshirani, R. J.: An introduction to the Bootstrap, vol. 57 of Monographs on
Statistics and Applied Probability , Chapman and Hall, New York, 436 pp., 1993. 1374
Egorova, T., Rozanov, E., Zubov, V., Manzini, E., Schmutz, W., and Peter, T.: Chemistry-climate
model SOCOL: a validation of the present-day climatology, Atmos. Chem. Phys., 5, 1557–5
1576, 2005,
http://www.atmos-chem-phys.net/5/1557/2005/. 1396
Eyring, V., Butchart, N., Waugh, D. W., et al.: Assessment of temperature, trace species, and
ozone in chemistry-climate model simulations of the recent past, J. Geophys. Res., 111,
D22308, doi:10.1029/2006JD007327, 2006. 1373, 137610
Eyring, V., Waugh, D. W., Bodeker, G. E., et al.: Multi-model projections of stratospheric ozone
in the 21st century, J. Geophys. Res., 112, D16303, doi:10.1029/2006JD008332, 2007.
1370, 1373, 1378, 1381, 1382, 1386, 1387
Forster, P. M. d. F. and Shine, K. P.: Assessing the climate impact of trends in stratospheric
water vapor, Geophys. Res. Lett., 29, 1086, doi:10.1029/2001GL013909, 2002. 136915
Fu, Q., Johanson, C. M., Wallace, J. M., and Reichler, T.: Enhanced Mid-Latitude Tropospheric
Warming in Satellite Measurements, Science, 312, 1179, 2006. 1370
Garcia, R. R., Marsh, D., Kinnison, D., Boville, B. A., and Sassi, F.: Simulations of sec-
ular trends in the middle atmosphere, 1950–2003, J. Geophys. Res., 112, D09301,
doi:10.1029/2006JD007485, 2007. 139620
Gettelman, A. and Forster, P. M. F.: A Climatology of the Tropical Tropopause Layer, J. Met.
Soc. Japan, 80, 911–924, 2002. 1368, 1369, 1371, 1379
Gettelman, A. and Kinnison, D. E.: The impact of supersaturation in a coupled model, Atmos.
Chem. Phys., 6, 1629–1643, 2007,
http://www.atmos-chem-phys.net/6/1629/2007/. 136925
Gettelman, A. and Birner, T.: Insights on Tropical Tropopause Layer Processes using Global
Models, J. Geophys. Res., 112, D23104, doi:10.1029/2007JDS008945, 2007. 1370
Holton, J. R. and Gettelman, A.: Horizontal transport and dehydration in the stratosphere,
Geophys. Res. Lett., 28, 2799–2802, 2001. 1386
Hu, Y. and Fu, Q.: Observed poleward expansion of the Hadley circulation since 1979, Atmos.30
Chem. Phys. Discuss., 7, 5229–5236, 2007,
http://www.atmos-chem-phys-discuss.net/7/5229/2007/. 1370
IPCC: Special Report on Emission Scenarios, Cambridge University Press, New York, 2000.
1391
ACPD
8, 1367–1413, 2008
TTL Trends
A. Gettelman et al.
Title Page
Abstract Introduction
Conclusions References
Tables Figures
◭ ◮
◭ ◮
Back Close
Full Screen / Esc
Printer-friendly Version
Interactive Discussion
EGU
1381
Johns, T. C., Durman, C. F., Banks, H. T., et al.: The new Hadley Centre climate model Had-
GEM1: Evaluation of coupled simulations, J. Climate, 19, 1327–1353, 2006. 1381
Kalnay, E., Kanamitsu, M., Kistler, R., Collins, W., Deaven, D., Gandin, L., Iredell, M., Saha, S.,
White, C., Woollen, J., Zhu, Y., Chelliah, M., Ebisuzaki, W., Higgins, W., Janowiak, J., Mo,5
K. C., Ropelewski, C., Wang, J., Leetmaa, A., Reynolds, R., Jenne, P., and Joseph, D.: The
NCEP/NCAR 40-year reanalysis project, B. Am. Meteorol. Soc., 77, 437–471, 1996. 1373
Kerr-Munslow, A. M. and Norton, W. A.: Tropical Wave Driving of the Annual Cycle in Tropical
Tropopause Temperatures. Part I: ECMWF Analyses, J. Atmos. Sci., 63, 1410–1419, 2006.
138010
Kurokawa, J., Akiyoshi, H., Nagashima, T., Masunaga, H., Nakajima, T., Takahashi, M., and
Nakane, H.: Effects of atmospheric sphericity on stratospheric chemistry and dynamics over
Antarctica, J. Geophys. Res., 110, D21305, doi:10.1029/2005JD005798, 2005. 1396
Lott, F. L., Hourdin, F., and Levan, P.: The stratospheric version of LMDz: Dynamical Clima-
tologies, Arctic Oscillation and Impact on the Surface Climate, Clim. Dynam., 25, 851–868,15
doi:10.1007/s00382-005-0064-x, 2005. 1396
Manzini, E., Steil, B., Bruhl, C., Giorgetta, M. A., and Kruger, K.: A new interactive chemistry
climate model. 2: Sensitivity of the middle atmosphere to ozone depletion and increase in
greenhouse gases: implications for recent stratospheric cooling,, J. Geophys. Res., 108,
4429, doi:10.1029/2002JD002977, 2003. 139620
Pawson, S. and Fiorino, M.: A comparison of reanalyses in the tropical stratosphere, Part 3,
Inclusion of the pre-satellite data era, Clim. Dynam., 15, 241–250, 1999. 1377
Pitari, G., Mancini, E., Rizzi, V., and Shindell, D.: Impact of future climate and emission changes
on stratospheric aerosols and ozone, J. Atmos. Sci., 59, 414–440, 2002. 1396
Randel, W. J., Wu, F., Vomel, H., Nedoluha, G. E., and Forster, P. F.: Decreases in stratospheric25
water vapor since 2001: links to changes in the tropical tropopause and the Brewer-Dobson
Circulation, J. Geophys. Res., 111, D12312, doi:10.1029/2005JD006744, 2006. 1378, 1386
Rozanov, E., Schraner, M., Schnadt, C., Egorova, T., Wild, M., Ohmura, A., Zubov, V., Schmutz,
W., and Peter, T.: Assessment of the ozone and temperature variability during 1979–1993
with the chemistry-climate model SOCOL, Adv. Space. Res., 35, 1375–1384, 2005. 139630
Santer, B. D., Wehner, M. F., Wigley, T. M. L., Sausen, R., Meehl, G. A., Taylor, K. E., Ammann,
C., Arblaster, J., Washington, W. M., Boyle, J. S., and Bruggemann, W.: Contributions of
Anthropogenic and Natural Forcing to Recent Tropopause Height Changes, Science, 301,
1392
ACPD
8, 1367–1413, 2008
TTL Trends
A. Gettelman et al.
Title Page
Abstract Introduction
Conclusions References
Tables Figures
◭ ◮
◭ ◮
Back Close
Full Screen / Esc
Printer-friendly Version
Interactive Discussion
EGU
479–483, doi:10.1126/science.1084123, 2003. 1369, 1379
Santer, B. D. et al.: Amplification of Surface Temperature Trends and Variability in the Tropical
Atmosphere, Science, 309, 1551–1556, doi:10.1126/science.1114867, 2005. 1386
Seidel, D. J. and Randel, W. J.: Recent Widening of the Tropical Belt: Evidence from
Tropopause Observations, in Press, J. Geophys. Res., 2007. 13815
Seidel, D. J., Ross, R. J., Angell, J. K., and Reid, G. C.: Climatological characteristics of the
tropical tropopause as revealed by Radiosondes, J. Geophys. Res., 106, 7857–7878, 2001.
1369, 1379
Shibata, K. and Deushi, M.: Partitioning between resolved wave forcing and unresolved gravity
wave forcing to the quasi-biennial oscillation as revealed with a coupled chemistry-climate10
model, Geophys. Res. Lett., 32, L12820, doi:10.1029/2005GL022885, 2005. 1396
Shibata, K., Deushi, M., Sekiyama, T. T., and Yoshimura, H.: Development of an MRI chemical
transport model for the study of stratospheric chemistry, Papers in Met. and Geophys., 55,
75–119, 2005. 1396
Steil, B., Bruhl, C., Manzini, E., Crutzen, P. J., Lelieveld, J., Rasch, P. J., Roeckner, E., and15
Kruger, K.: A new interactive chemistry climate model. 1: Present day climatology and inter-
annual variability of the middle atmosphere using the model and 9 years of HALOE/UARS
data, J. Geophys. Res., 108, 4290, doi:10.1029/2002JD002971, 2003. 1381, 1396
Stephens, G. L.: Cloud Feedbacks in the Climate System: A Critical Review, J. Climate, 18,
237–273, 2005. 136920
Stolarski, R. S., Douglass, A. R., Steenrod, S., and Pawson, S.: Trends in Stratospheric Ozone:
Lessons Learned from a 3D Chemical Transport Model, J. Atmos. Sci., 63, 1028–1041, 2006.
1396
Struthers, H., Kreher, K., Austin, J., Schofield, R., Bodeker, G. E., Johnston, P. V., Shiona,
H., and Thomas, A.: Past and future simulations of NO2 from a coupled chemistry-climate25
model in comparison with observations, Atmos. Chem. Phys., 4, 2227–2239, 2004,
http://www.atmos-chem-phys.net/4/2227/2004/. 1396
Thuburn, J. and Craig, G. C.: On the temperature structure of the tropical substratosphere, J.
Geophys. Res., 107, 10.1029/2001JD000448, 2002. 1384
Tian, W. and Chipperfield, M. P.: A new coupled chemistryclimate model for the stratosphere:30
The importance of coupling for future O3-climate predictions, Q. J. R. Meteorol. Soc., 131,
281–304, 2005. 1396
Uppala, S., Kallberg, P., Simmons, A., Andrae, U., da Costa Bechtold, V., Fiorino, M., Gibson,
1393
ACPD
8, 1367–1413, 2008
TTL Trends
A. Gettelman et al.
Title Page
Abstract Introduction
Conclusions References
Tables Figures
◭ ◮
◭ ◮
Back Close
Full Screen / Esc
Printer-friendly Version
Interactive Discussion
EGU
J., Haseler, J., Hernandez, A., Kelly, G., Li, X., Onogi, K., Saarinen, S., Sokka, N., Allan, R.,
Andersson, E., Arpe, K., Balmaseda, M., Beljaars, A., van de Berg, L., Bidlot, J., Bormann,
N., Caires, S., Chevallier, F., Dethof, A., Dragosavac, M., Fisher, M., Fuentes, M., Hagemann,
S., Holm, E., Hoskins, B., Isaksen, L., Janssen, P., Jenne, R., McNally, A., Mahfouf, J.-F.,
Morcrette, J.-J., Rayner, N., Saunders, R., Simon, P., Sterl, A., Trenberth, K., Untch, A.,5
Vasiljevic, D., Viterbo, P., and Woollen, J.: The ERA-40 re-analysis, Q. J. R. Meteorol. Soc.,
131, 2961–3012, 2005. 1373
World Meteorological Organization: Scientific Assessment of Ozone Depletion: 2002, WMO
Report 47, World Meteorological Organization, Geneva, 2003. 1381
World Meteorological Organization: Scientific Assessment of Ozone Depletion: 2006, WMO10
Report 50, World Meteorological Organization, Geneva, 2007. 1370, 1372
Yin, J. H.: A consistent poleward shift of the storm tracks in simulations of 21st century climate,
Geophys. Res. Lett., 32, L18701, doi:10.1029/2005GL023684, 2005. 1369
1394
ACPD
8, 1367–1413, 2008
TTL Trends
A. Gettelman et al.
Title Page
Abstract Introduction
Conclusions References
Tables Figures
◭ ◮
◭ ◮
Back Close
Full Screen / Esc
Printer-friendly Version
Interactive Discussion
EGU
Table 1. Diagnostic Abbreviations used in the text.
Abbreviation Name
CPT[T/P] Cold Point Tropopause [Temperature/Pressure]
ZLR[T/P] Zero Lapse Rate [Temperature/Pressure]
LRT[T/P] Lapse Rate Tropopause [Temperature/Pressure]
LRMP Lapse Rate Minimum Pressure
LZH Level of Zero Heating
1395
ACPD
8, 1367–1413, 2008
TTL Trends
A. Gettelman et al.
Title Page
Abstract Introduction
Conclusions References
Tables Figures
◭ ◮
◭ ◮
Back Close
Full Screen / Esc
Printer-friendly Version
Interactive Discussion
EGU
Table 2. CCMs Used in this study. Abbreviations for Institutions: Geophysical Fluid Dynamics
Laboratory (GFDL), National Institute for Environmental Studies (NIES), Deutsches Zentrum fur
Luft- und Raumfhart (DLR), National Aeronautics and Space Administration – Goddard Space
Flight Center (NASA-GSFC), L’Institut Pierre-Simon Laplace (IPSL), Max Planck Institute (MPI),
Meteorological Research Institute (MRI), Physikalisch-Meteorologisches Observatorium Davos
(PMOD), Eidgenossische Technische Hochschule Zurich (ETHZ), National Center for Atmo-
spheric Research (NCAR).
Model Resolution Institution Reference
AMTRAC 2◦×2.5
◦GFDL, USA Austin and Wilson (2006); Austin et al. (2007)
CCSRNIES 2.8◦×2.8
◦NIES, Japan Akiyoshi et al. (2004); Kurokawa et al. (2005)
CMAM 3.75◦×3.75
◦Univ. Toronto, York Univ., Beagley et al. (1997); de Grandpre et al. (2000)
Canada
E39C 3.75◦×3.75
◦DLR, Germany Dameris et al. (2005, 2006)
GEOSCCM 2◦×2.5
◦NASA/GSFC, USA Bloom et al. (2005); Stolarski et al. (2006)
LMDZrepro 2◦×2.5
◦IPSL, France Lott et al. (2005); Jourdain et al. (2008)
2
MAECHAM4 3.75◦×3.75
◦MPI Met & MPI Chem, Manzini et al. (2003); Steil et al. (2003)
Germany
MRI 2.8◦×2.8
◦MRI, Japan Shibata and Deushi (2005); Shibata et al. (2005)
SOCOL 3.75◦××3.75
◦PMOD & ETHZ, Switzerland Egorova et al. (2005); Rozanov et al. (2005)
ULAQ 10◦×22.5
◦Univ. L’Aquila, Italy Pitari et al. (2002)
UMETRAC 2.5◦×3.75
◦Met Office, UK Austin (2002); Austin and Butchart (2003)
Struthers et al. (2004)
UMSLIMCAT 2.5◦×3.75
◦Univ. Leeds, UK Tian and Chipperfield (2005)
WACCM 4◦×5
◦NCAR, USA Garcia et al. (2007)
2Jourdain, L., Bekki, S., Lott, F., and Lefevre, F.: The coupled chemistry model LMDz Reprobus: description of a
transient simulation of the period 1980–1999, Ann. Geophys., submitted, 2008.
1396

ACPD
8, 1367–1413, 2008
TTL Trends
A. Gettelman et al.
Title Page
Abstract Introduction
Conclusions References
Tables Figures
◭ ◮
◭ ◮
Back Close
Full Screen / Esc
Printer-friendly Version
Interactive Discussion
EGU
Table 3. Trends (per decade “d”) in Key TTL quantities from analysis systems (NCEP/NCAR
and ERA40) and model simulations. Trends significantly different from zero (based on 2σconfidence intervals, or 95% level) indicated with an asterix. 13 models are included in statistics
for REF1 and 10 for REF2.
Diagnostic Units NCEP/NCAR ERA40 Sim REF1 Sim REF1 Sim REF2
1979-2005 1979-2001 1979-2001 1960-2004 1960-2100
CPTT K/d −1.1* 0.54* −0.04 −0.07 0.18*
ZLRT K/d −1.1* 0.53* −0.04 −0.06 0.18*
ZLRP hPa/d −0.28 −0.86* −0.70* −0.74* −0.49*
LRTP hPa/d −1.4* −1.3* −0.83* −0.91* −0.54*
LRMP hPa/d −3.5* −1.5* −2.0* −1.1 −1.7*
Edge deg/d 0.89* 0.63 0.35 0.19 −0.0
1397
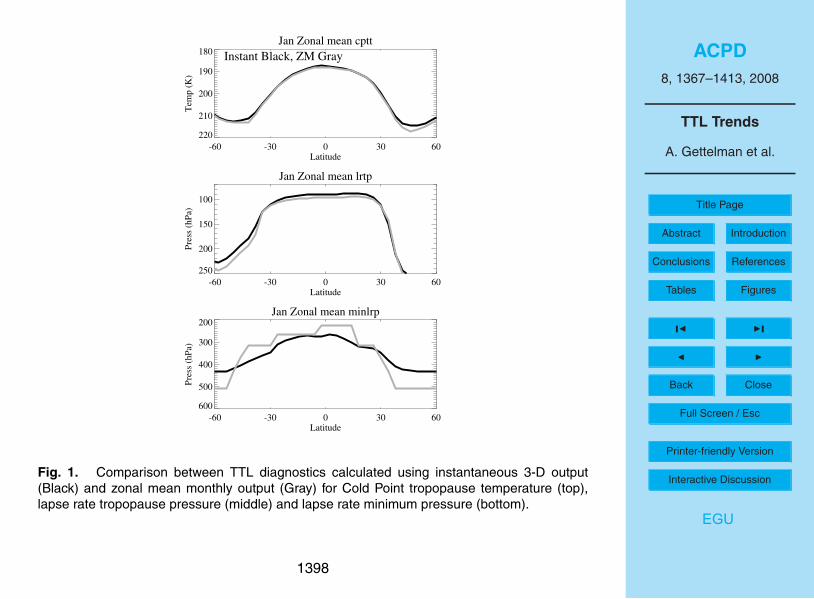
ACPD
8, 1367–1413, 2008
TTL Trends
A. Gettelman et al.
Title Page
Abstract Introduction
Conclusions References
Tables Figures
◭ ◮
◭ ◮
Back Close
Full Screen / Esc
Printer-friendly Version
Interactive Discussion
EGU
Jan Zonal mean cptt
-60 -30 0 30 60Latitude
220
210
200
190
180
Tem
p (
K)
Instant Black, ZM Gray
Jan Zonal mean minlrp
-60 -30 0 30 60Latitude
600
500
400
300
200
Pre
ss (
hP
a)Jan Zonal mean lrtp
-60 -30 0 30 60Latitude
250
200
150
100
Pre
ss (
hP
a)
Fig. 1. Comparison between TTL diagnostics calculated using instantaneous 3-D output
(Black) and zonal mean monthly output (Gray) for Cold Point tropopause temperature (top),
lapse rate tropopause pressure (middle) and lapse rate minimum pressure (bottom).
1398
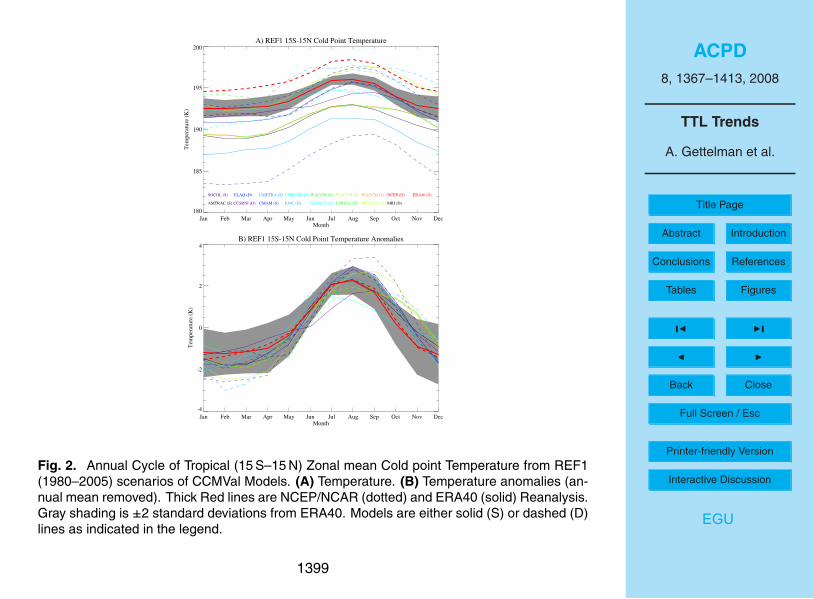
ACPD
8, 1367–1413, 2008
TTL Trends
A. Gettelman et al.
Title Page
Abstract Introduction
Conclusions References
Tables Figures
◭ ◮
◭ ◮
Back Close
Full Screen / Esc
Printer-friendly Version
Interactive Discussion
EGU
A) REF1 15S-15N Cold Point Temperature
Jan Feb Mar Apr May Jun Jul Aug Sep Oct Nov DecMonth
180
185
190
195
200
Tem
per
atu
re (
K)
AMTRAC (S) CCSRNI (D) CMAM (S) E39C (D) GEOSCC (S) LMDZre (D) MAECHA (S) MRI (D)
SOCOL (S) ULAQ (D) UMETRA (S) UMSLIM (D) WACCM (S) WACCM (D) WACCM (S) NCEP (D) ERA40 (S)
B) REF1 15S-15N Cold Point Temperature Anomalies
Jan Feb Mar Apr May Jun Jul Aug Sep Oct Nov DecMonth
-4
-2
0
2
4
Tem
per
atu
re (
K)
Fig. 2. Annual Cycle of Tropical (15 S–15 N) Zonal mean Cold point Temperature from REF1
(1980–2005) scenarios of CCMVal Models. (A) Temperature. (B) Temperature anomalies (an-
nual mean removed). Thick Red lines are NCEP/NCAR (dotted) and ERA40 (solid) Reanalysis.
Gray shading is ±2 standard deviations from ERA40. Models are either solid (S) or dashed (D)
lines as indicated in the legend.
1399
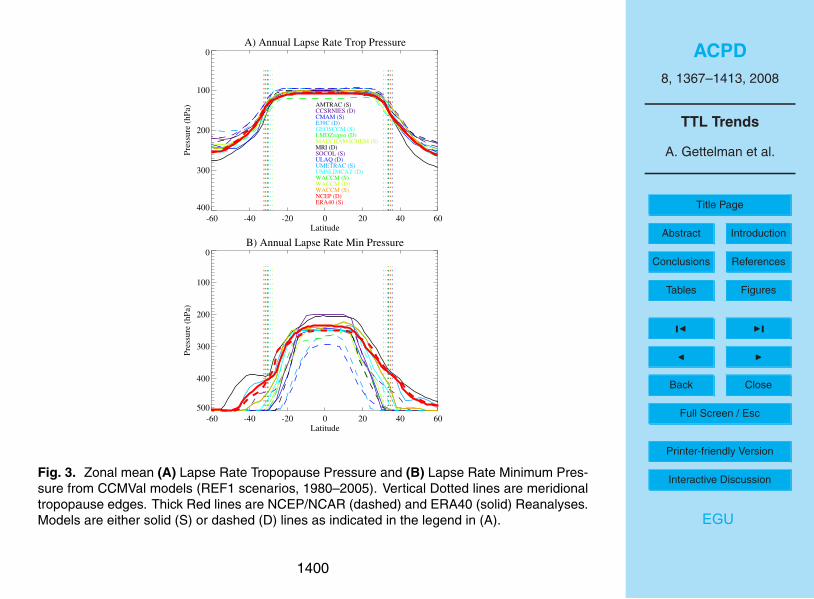
ACPD
8, 1367–1413, 2008
TTL Trends
A. Gettelman et al.
Title Page
Abstract Introduction
Conclusions References
Tables Figures
◭ ◮
◭ ◮
Back Close
Full Screen / Esc
Printer-friendly Version
Interactive Discussion
EGU
A) Annual Lapse Rate Trop Pressure
-60 -40 -20 0 20 40 60Latitude
400
300
200
100
0
Pre
ssu
re (
hP
a)
AMTRAC (S)CCSRNIES (D)CMAM (S)E39C (D)GEOSCCM (S)LMDZrepro (D)MAECHAM4CHEM (S)MRI (D)SOCOL (S)ULAQ (D)UMETRAC (S)UMSLIMCAT (D)WACCM (S)WACCM (D)WACCM (S)NCEP (D)ERA40 (S)
B) Annual Lapse Rate Min Pressure
-60 -40 -20 0 20 40 60Latitude
500
400
300
200
100
0
Pre
ssu
re (
hP
a)
Fig. 3. Zonal mean (A) Lapse Rate Tropopause Pressure and (B) Lapse Rate Minimum Pres-
sure from CCMVal models (REF1 scenarios, 1980–2005). Vertical Dotted lines are meridional
tropopause edges. Thick Red lines are NCEP/NCAR (dashed) and ERA40 (solid) Reanalyses.
Models are either solid (S) or dashed (D) lines as indicated in the legend in (A).
1400
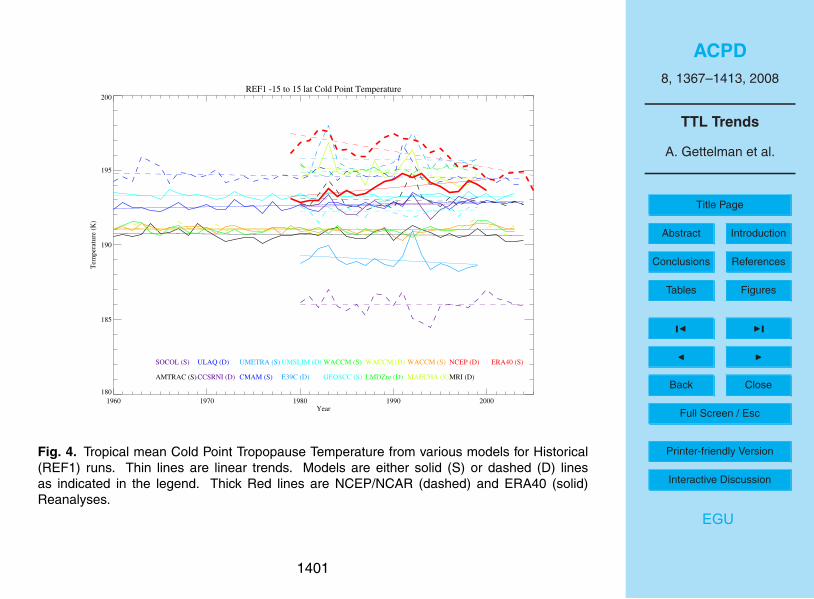
ACPD
8, 1367–1413, 2008
TTL Trends
A. Gettelman et al.
Title Page
Abstract Introduction
Conclusions References
Tables Figures
◭ ◮
◭ ◮
Back Close
Full Screen / Esc
Printer-friendly Version
Interactive Discussion
EGU
REF1 -15 to 15 lat Cold Point Temperature
1960 1970 1980 1990 2000Year
180
185
190
195
200T
emp
erat
ure
(K
)
AMTRAC (S) CCSRNI (D) CMAM (S) E39C (D) GEOSCC (S) LMDZre (D) MAECHA (S)MRI (D)
SOCOL (S) ULAQ (D) UMETRA (S) UMSLIM (D) WACCM (S) WACCM (D) WACCM (S) NCEP (D) ERA40 (S)
Fig. 4. Tropical mean Cold Point Tropopause Temperature from various models for Historical
(REF1) runs. Thin lines are linear trends. Models are either solid (S) or dashed (D) lines
as indicated in the legend. Thick Red lines are NCEP/NCAR (dashed) and ERA40 (solid)
Reanalyses.
1401
ACPD
8, 1367–1413, 2008
TTL Trends
A. Gettelman et al.
Title Page
Abstract Introduction
Conclusions References
Tables Figures
◭ ◮
◭ ◮
Back Close
Full Screen / Esc
Printer-friendly Version
Interactive Discussion
EGU
REF1 -15 to 15 lat Lapse Rate Trop Pressure
1960 1970 1980 1990 2000Year
130
120
110
100
90P
ress
ure
(h
Pa)
AMTRAC (S) CCSRNI (D) CMAM (S) E39C (D) GEOSCC (S) LMDZre (D) MAECHA (S)MRI (D)
SOCOL (S) ULAQ (D) UMETRA (S) UMSLIM (D) WACCM (S) WACCM (D) WACCM (S) NCEP (D) ERA40 (S)
Fig. 5. Tropical mean Lapse Rate Tropopause Pressure from various models for Historical
(REF1) runs. Thin lines are linear trends. Models are either solid (S) or dashed (D) lines
as indicated in the legend. Thick Red lines are NCEP/NCAR (dashed) and ERA40 (solid)
Reanalyses.
1402

ACPD
8, 1367–1413, 2008
TTL Trends
A. Gettelman et al.
Title Page
Abstract Introduction
Conclusions References
Tables Figures
◭ ◮
◭ ◮
Back Close
Full Screen / Esc
Printer-friendly Version
Interactive Discussion
EGU
REF1 -15 to 15 lat Lapse Rate Min Pressure
1960 1970 1980 1990 2000Year
350
300
250
200
Pre
ssu
re (
hP
a)
AMTRAC (S) CCSRNI (D) CMAM (S) E39C (D) GEOSCC (S) LMDZre (D) MAECHA (S)MRI (D)
SOCOL (S) ULAQ (D) UMETRA (S) UMSLIM (D) WACCM (S) WACCM (D) WACCM (S) NCEP (D) ERA40 (S)
Fig. 6. Tropical mean Lapse Rate Minimum Pressure from various models for Historical (REF1)
runs. Thin lines are linear trends. Models are either solid (S) or dashed (D) lines as indicated
in the legend. Thick Red lines are NCEP/NCAR (dashed) and ERA40 (solid) Reanalyses.
1403

ACPD
8, 1367–1413, 2008
TTL Trends
A. Gettelman et al.
Title Page
Abstract Introduction
Conclusions References
Tables Figures
◭ ◮
◭ ◮
Back Close
Full Screen / Esc
Printer-friendly Version
Interactive Discussion
EGU
A) 1950-2005 CP Trop Temp (K/decade)
-0.0
5-0.05
0.10
0.10
B) 1950-2005 LR Trop Press (hPa/decade)
-0.5
-0.5
-0.5
-0.5
-0.5
C) 1950-2005 LR Min Press (hPa/decade)
-2
-2
-2
D) 1950-2005 Cld Top Press (hPa/decade)
-7
-7 -7
-7 -7
-7 14
0 90 180 270 0 0 90 180 270 0
30N
30S
15N
15S
0
30N
30S
15N
15S
0
Fig. 7. Map of trends from historical (REF1) WACCM simulations. (A) Cold Point Tropopause
Temperature trends, contour interval 0.05 K/decade. (B) Lapse Rate Tropopause pressure
trends, contour interval 0.5 hPa/decade (C) Lapse Rate Minimum Pressure trends, contour
interval 2 hPa/decade. (D) Cloud Top Pressure trends, contour interval 7hPa/decade. Dashed
lines are negative trends, no zero line.
1404

ACPD
8, 1367–1413, 2008
TTL Trends
A. Gettelman et al.
Title Page
Abstract Introduction
Conclusions References
Tables Figures
◭ ◮
◭ ◮
Back Close
Full Screen / Esc
Printer-friendly Version
Interactive Discussion
EGU
A) REF1 -15 to 15 lat 100 hPa Ozone
1960 1970 1980 1990 2000Year
50
100
150
200
250
300
350
400
Ozo
ne
(pp
bv
)
AMTRAC (S) CCSRNI (D) CMAM (S) E39C (D) GEOSCC (S) LMDZre (D) MAECHA (S) MRI (D)
SOCOL (S) ULAQ (D) UMETRA (S) UMSLIM (D) WACCM (S) WACCM (D) WACCM (S)
B) REF1 -15 to 15 lat 300 hPa Ozone
1960 1970 1980 1990 2000Year
20
40
60
80
100
Ozo
ne
(pp
bv
)
Fig. 8. Tropical mean Ozone from various models at (A) 100 hPa and (B) 300 hPa. Thin lines
are linear trends. Thick black dashed lines are the SHADOZ observed mean from 1998–2005
at these levels. Models are either solid (S) or dashed (D) lines as indicated in the legend.
1405

ACPD
8, 1367–1413, 2008
TTL Trends
A. Gettelman et al.
Title Page
Abstract Introduction
Conclusions References
Tables Figures
◭ ◮
◭ ◮
Back Close
Full Screen / Esc
Printer-friendly Version
Interactive Discussion
EGU
REF1 Tropical Width
1960 1970 1980 1990 2000Year
58
60
62
64
66
68
70
72
Wid
th (
deg
Lat
itude)
Fig. 9. Tropical mean TTL width (in latitude) models for historical (REF1) scenarios. Thin lines
are linear trends. Models are either solid (S) or dashed (D) lines as indicated in the legend for
Fig. 8. Thick Red lines are NCEP/NCAR (dashed) and ERA40 (solid) Reanalyses.
1406
ACPD
8, 1367–1413, 2008
TTL Trends
A. Gettelman et al.
Title Page
Abstract Introduction
Conclusions References
Tables Figures
◭ ◮
◭ ◮
Back Close
Full Screen / Esc
Printer-friendly Version
Interactive Discussion
EGU
REF2 -15 to 15 lat Cold Point Temperature
1960 1980 2000 2020 2040 2060 2080 2100Year
180
185
190
195
200
Tem
per
ature
(K
)
AMTRAC (S) CCSRNI (D) CMAM (S) CMAM (D) CMAM (S) GEOSCC (D) MAECHA (S) MRI (D)
SOCOL (S) ULAQ (D) UMSLIM (S) WACCM (D) WACCM (S) WACCM (D)
Fig. 10. Tropical mean Cold Point Tropopause Temperature from various models showing
expected future scenarios (REF2). Thin lines are linear trends. Models are either solid (S) or
dashed (D) lines as indicated in the legend.
1407
ACPD
8, 1367–1413, 2008
TTL Trends
A. Gettelman et al.
Title Page
Abstract Introduction
Conclusions References
Tables Figures
◭ ◮
◭ ◮
Back Close
Full Screen / Esc
Printer-friendly Version
Interactive Discussion
EGU
REF2 -15 to 15 lat Lapse Rate Trop Pressure
1960 1980 2000 2020 2040 2060 2080 2100Year
120
115
110
105
100
95
90
Pre
ssure
(hP
a)
AMTRAC (S) CCSRNI (D) CMAM (S) CMAM (D) CMAM (S) GEOSCC (D) MAECHA (S) MRI (D)
SOCOL (S) ULAQ (D) UMSLIM (S) WACCM (D) WACCM (S) WACCM (D)
Fig. 11. Tropical mean Lapse Rate Tropopause Pressure from various models showing ex-
pected future scenarios (REF2). Thin lines are linear trends. Models are either solid (S) or
dashed (D) lines as indicated in the legend.
1408
ACPD
8, 1367–1413, 2008
TTL Trends
A. Gettelman et al.
Title Page
Abstract Introduction
Conclusions References
Tables Figures
◭ ◮
◭ ◮
Back Close
Full Screen / Esc
Printer-friendly Version
Interactive Discussion
EGU
REF2 -15 to 15 lat Lapse Rate Min Pressure
1960 1980 2000 2020 2040 2060 2080 2100Year
260
240
220
200
180
Pre
ssure
(hP
a)
AMTRAC (S) CCSRNI (D) CMAM (S) CMAM (D) CMAM (S) GEOSCC (D) MAECHA (S) MRI (D)
SOCOL (S) ULAQ (D) UMSLIM (S) WACCM (D) WACCM (S) WACCM (D)
Fig. 12. Tropical mean Lapse Rate Minimum Pressure from various models showing expected
future scenarios (REF2). Thin lines are linear trends. Models are either solid (S) or dashed (D)
lines as indicated in the legend. Note that ULAQ is off scale.
1409
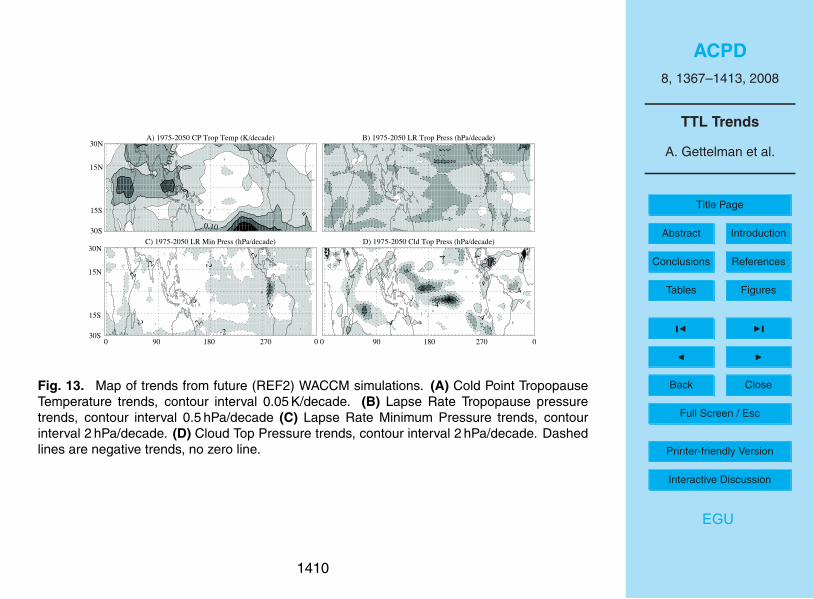
ACPD
8, 1367–1413, 2008
TTL Trends
A. Gettelman et al.
Title Page
Abstract Introduction
Conclusions References
Tables Figures
◭ ◮
◭ ◮
Back Close
Full Screen / Esc
Printer-friendly Version
Interactive Discussion
EGU
A) 1975-2050 CP Trop Temp (K/decade)
0.10
0.1
0
B) 1975-2050 LR Trop Press (hPa/decade)
C) 1975-2050 LR Min Press (hPa/decade)
-2
-2
-2
-2
-2
-2
-2
-2
-2
D) 1975-2050 Cld Top Press (hPa/decade)
-4
-4
-4
-4
-4
-4
-4
8
0 90 180 270 0 0 90 180 270 0
30N
30S
15N
15S
30N
30S
15N
15S
Fig. 13. Map of trends from future (REF2) WACCM simulations. (A) Cold Point Tropopause
Temperature trends, contour interval 0.05 K/decade. (B) Lapse Rate Tropopause pressure
trends, contour interval 0.5 hPa/decade (C) Lapse Rate Minimum Pressure trends, contour
interval 2 hPa/decade. (D) Cloud Top Pressure trends, contour interval 2 hPa/decade. Dashed
lines are negative trends, no zero line.
1410
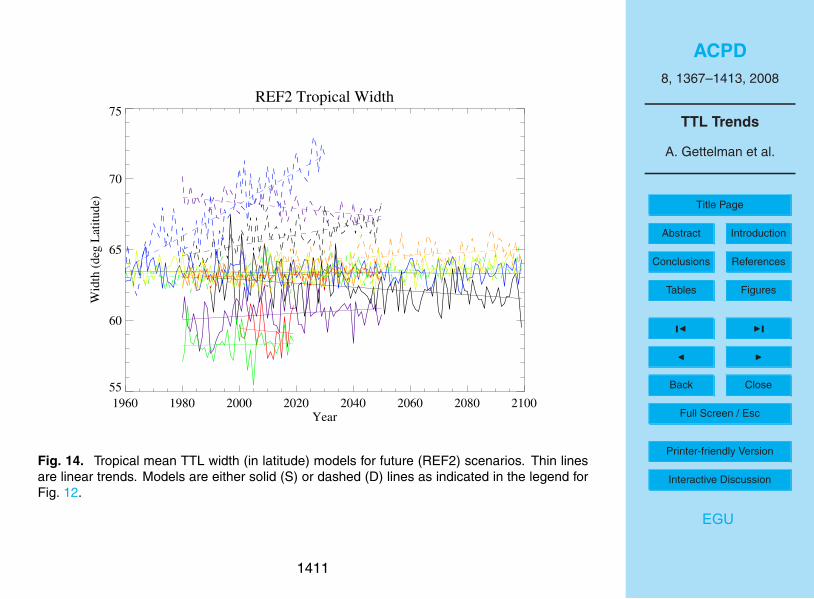
ACPD
8, 1367–1413, 2008
TTL Trends
A. Gettelman et al.
Title Page
Abstract Introduction
Conclusions References
Tables Figures
◭ ◮
◭ ◮
Back Close
Full Screen / Esc
Printer-friendly Version
Interactive Discussion
EGU
REF2 Tropical Width
1960 1980 2000 2020 2040 2060 2080 2100Year
55
60
65
70
75
Wid
th (
deg
Lat
itude)
Fig. 14. Tropical mean TTL width (in latitude) models for future (REF2) scenarios. Thin lines
are linear trends. Models are either solid (S) or dashed (D) lines as indicated in the legend for
Fig. 12.
1411
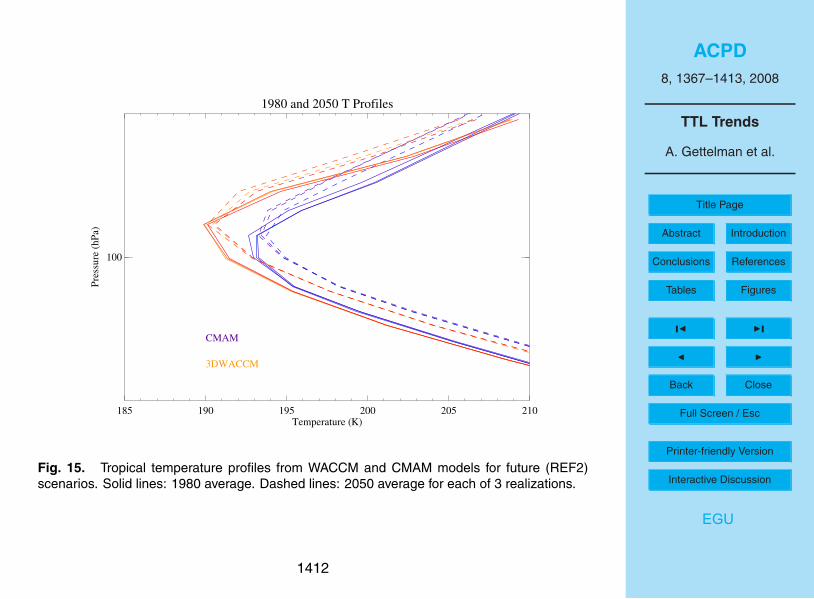
ACPD
8, 1367–1413, 2008
TTL Trends
A. Gettelman et al.
Title Page
Abstract Introduction
Conclusions References
Tables Figures
◭ ◮
◭ ◮
Back Close
Full Screen / Esc
Printer-friendly Version
Interactive Discussion
EGU
1980 and 2050 T Profiles
185 190 195 200 205 210Temperature (K)
100
Pre
ssure
(hP
a)
CMAM
3DWACCM
Fig. 15. Tropical temperature profiles from WACCM and CMAM models for future (REF2)
scenarios. Solid lines: 1980 average. Dashed lines: 2050 average for each of 3 realizations.
1412

ACPD
8, 1367–1413, 2008
TTL Trends
A. Gettelman et al.
Title Page
Abstract Introduction
Conclusions References
Tables Figures
◭ ◮
◭ ◮
Back Close
Full Screen / Esc
Printer-friendly Version
Interactive Discussion
EGU
REF1 Qsat(CPTT) v. 90hPa H2O
0 2 4 6 8 10Qsat(CPTT) (ppmv)
0
2
4
6
8H
2O
(ppm
v)
1:1 (RH=100%)
AMTRAC
CCSRNIES
CMAM
E39C
GEOSCCM
LMDZrepro
MAECHAM4CHEM
MRI
SOCOL
ULAQ
UMETRAC
UMSLIMCAT
WACCM
HALOE/ERA40
1:0.6 (RH=60%)
Fig. 16. Scatterplot of Saturation Vapor Mixing Ratio of the Cold Point Tropopause Temper-
ature, Qsat(CPTT) and the 90 hPa tropical water vapor mixing ratio fore each historical (REF1)
run, as well as using ERA40 temperatures and HALOE 100hPa water vapor (ERA40/HALOE).
Gray dashed line is 1:1 line (100% RH), Black solid line is 1:0.6 (60% RH).
1413
Related Documents