Top Banner
25

the traveling wave - University of Washingtondepts.washington.edu/sphsc461/traveling/the traveling wave.pdfThe curve that shows the amplitude of the traveling wave at each point along

Mar 19, 2020

Download

Documents

dariahiddleston
Welcome message from author
This document is posted to help you gain knowledge. Please leave a comment to let me know what you think about it! Share it to your friends and learn new things together.
Transcript
Page 1: the traveling wave - University of Washingtondepts.washington.edu/sphsc461/traveling/the traveling wave.pdfThe curve that shows the amplitude of the traveling wave at each point along
Page 2: the traveling wave - University of Washingtondepts.washington.edu/sphsc461/traveling/the traveling wave.pdfThe curve that shows the amplitude of the traveling wave at each point along
Page 3: the traveling wave - University of Washingtondepts.washington.edu/sphsc461/traveling/the traveling wave.pdfThe curve that shows the amplitude of the traveling wave at each point along
Page 4: the traveling wave - University of Washingtondepts.washington.edu/sphsc461/traveling/the traveling wave.pdfThe curve that shows the amplitude of the traveling wave at each point along

Auditory nerve fibers tend to respond at the same phase of a tone when they respond. The tendency to respond at the same phase of a tone is called phase-locking. This could be a code for frequency, but individual nerve fibers donʼt respond on every cycle of the tone.

Page 5: the traveling wave - University of Washingtondepts.washington.edu/sphsc461/traveling/the traveling wave.pdfThe curve that shows the amplitude of the traveling wave at each point along

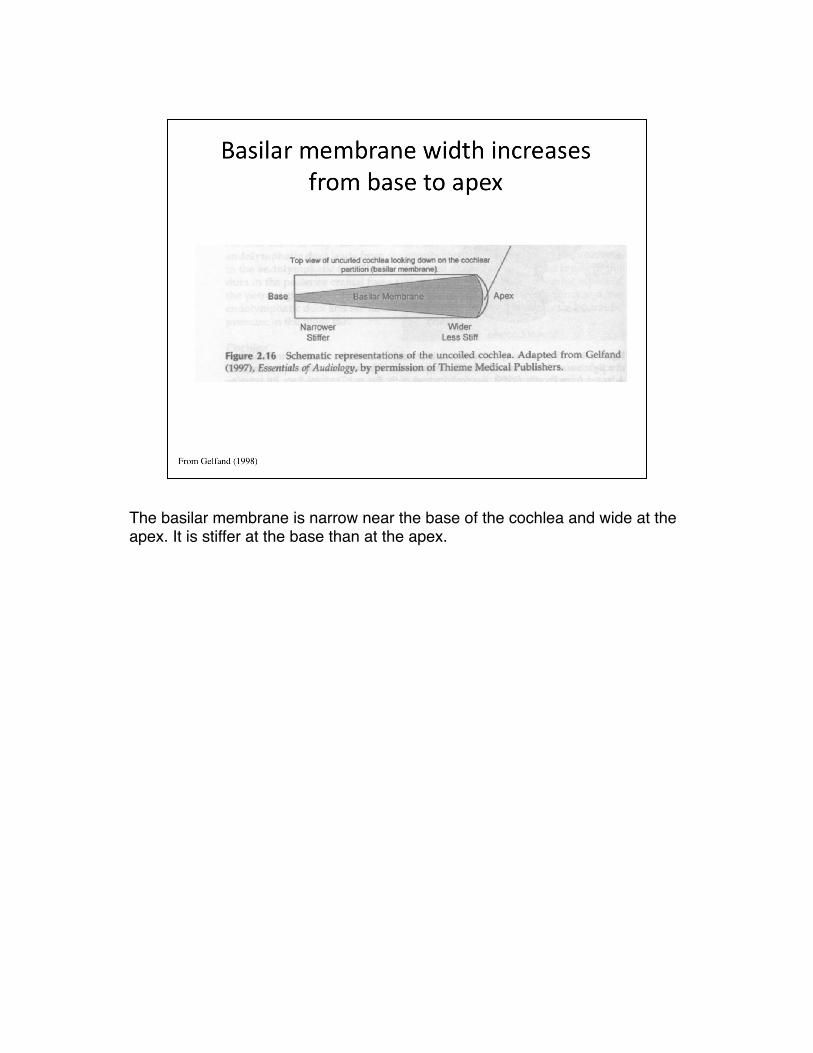
The basilar membrane is narrow near the base of the cochlea and wide at the apex. It is stiffer at the base than at the apex.

Page 6: the traveling wave - University of Washingtondepts.washington.edu/sphsc461/traveling/the traveling wave.pdfThe curve that shows the amplitude of the traveling wave at each point along

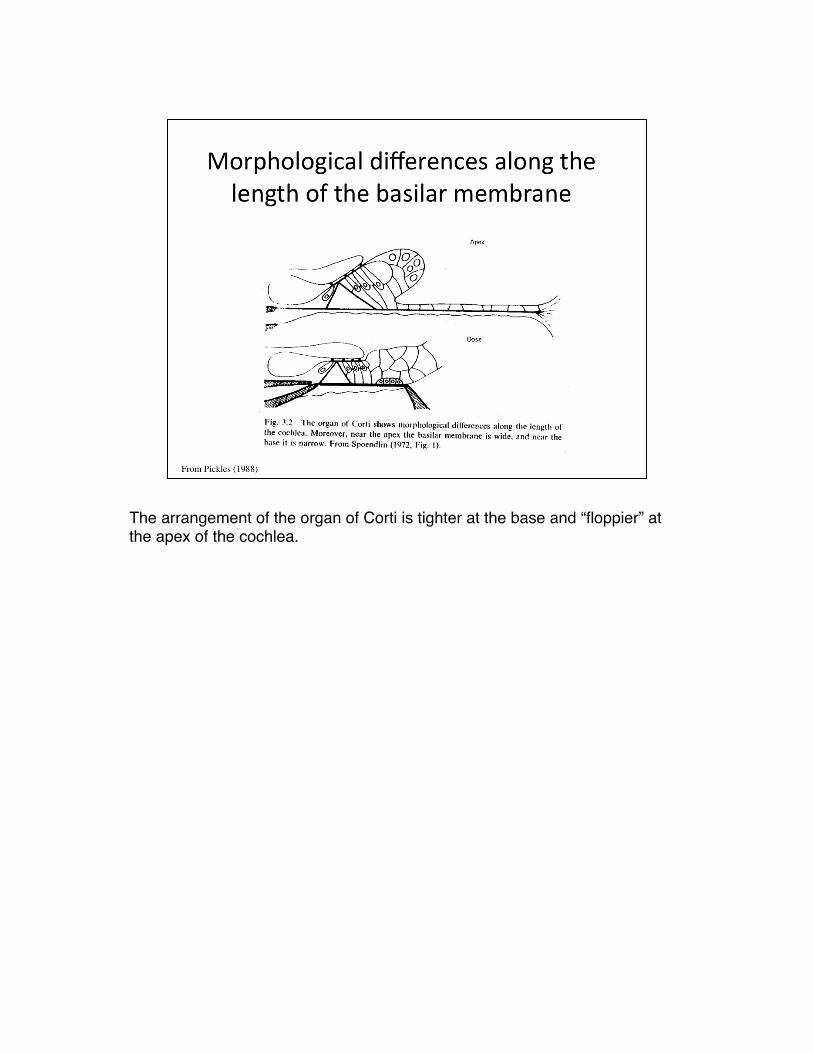
The arrangement of the organ of Corti is tighter at the base and “floppier” at the apex of the cochlea.

Page 7: the traveling wave - University of Washingtondepts.washington.edu/sphsc461/traveling/the traveling wave.pdfThe curve that shows the amplitude of the traveling wave at each point along

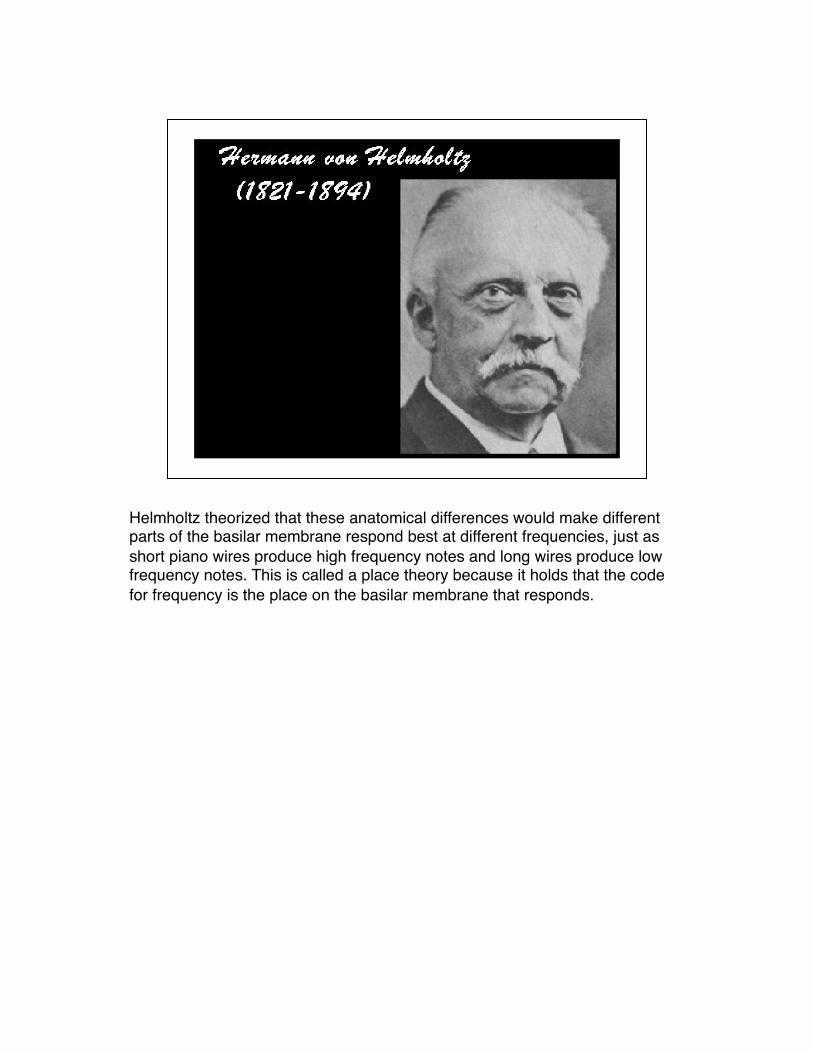
Helmholtz theorized that these anatomical differences would make different parts of the basilar membrane respond best at different frequencies, just as short piano wires produce high frequency notes and long wires produce low frequency notes. This is called a place theory because it holds that the code for frequency is the place on the basilar membrane that responds.

Page 8: the traveling wave - University of Washingtondepts.washington.edu/sphsc461/traveling/the traveling wave.pdfThe curve that shows the amplitude of the traveling wave at each point along

von Bekesy was the first to directly observe the motion of the basilar membrane. He received the Nobel prize for his work in this area.

Page 9: the traveling wave - University of Washingtondepts.washington.edu/sphsc461/traveling/the traveling wave.pdfThe curve that shows the amplitude of the traveling wave at each point along
Page 10: the traveling wave - University of Washingtondepts.washington.edu/sphsc461/traveling/the traveling wave.pdfThe curve that shows the amplitude of the traveling wave at each point along

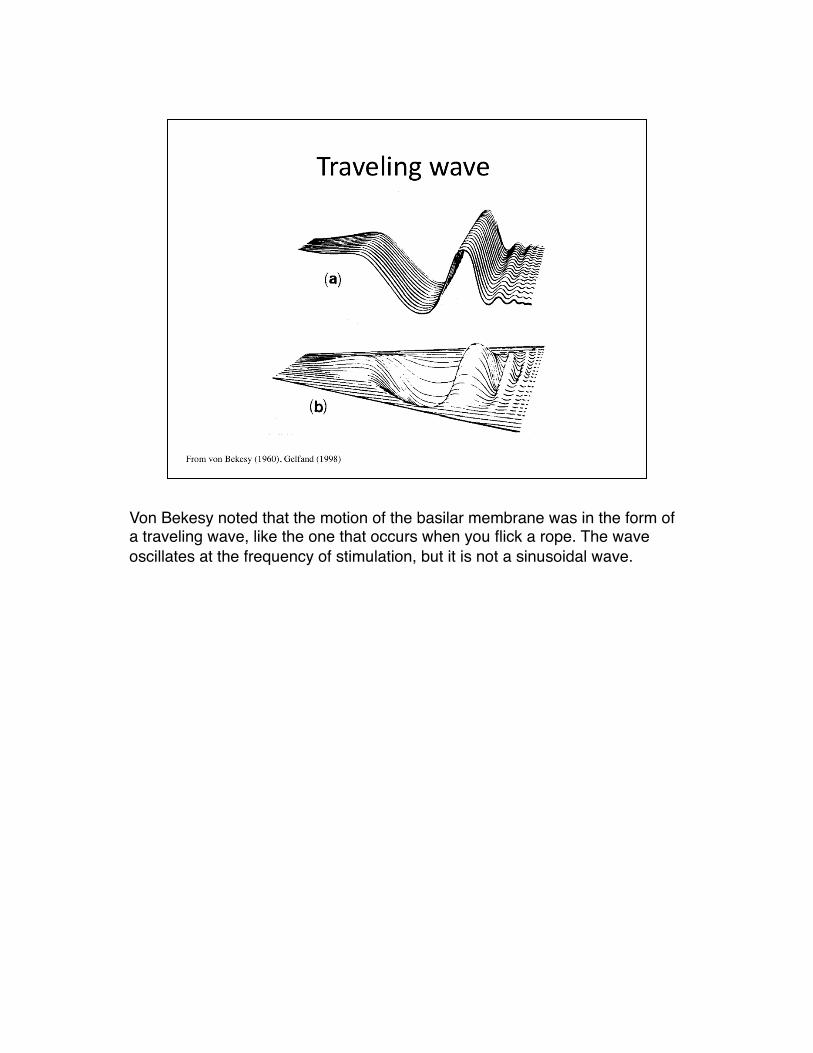
Von Bekesy noted that the motion of the basilar membrane was in the form of a traveling wave, like the one that occurs when you flick a rope. The wave oscillates at the frequency of stimulation, but it is not a sinusoidal wave.

Page 11: the traveling wave - University of Washingtondepts.washington.edu/sphsc461/traveling/the traveling wave.pdfThe curve that shows the amplitude of the traveling wave at each point along

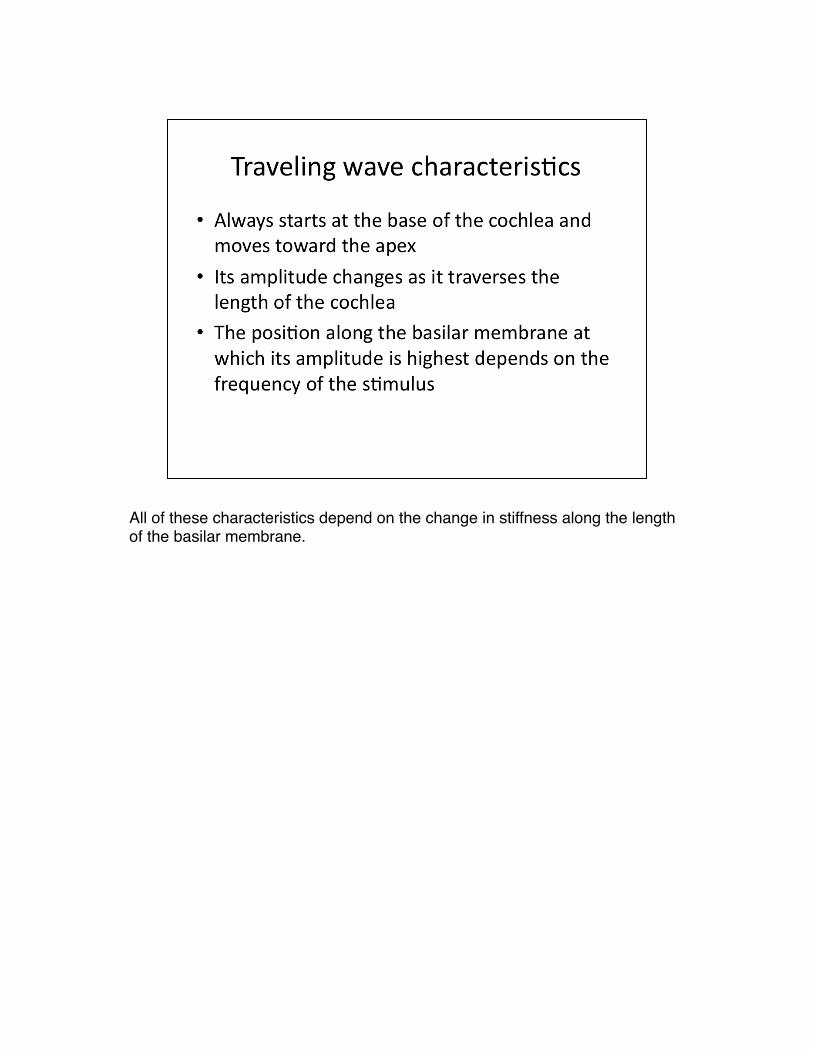
All of these characteristics depend on the change in stiffness along the length of the basilar membrane.

Page 12: the traveling wave - University of Washingtondepts.washington.edu/sphsc461/traveling/the traveling wave.pdfThe curve that shows the amplitude of the traveling wave at each point along

A low-frequency tone, like 1000 Hz, would produce the highest traveling wave amplitude near the apex of the cochlea.

Page 13: the traveling wave - University of Washingtondepts.washington.edu/sphsc461/traveling/the traveling wave.pdfThe curve that shows the amplitude of the traveling wave at each point along

A high-frequency tone, like 8000 Hz, would produce the largest traveling wave amplitude near the base of the cochlea.

Page 14: the traveling wave - University of Washingtondepts.washington.edu/sphsc461/traveling/the traveling wave.pdfThe curve that shows the amplitude of the traveling wave at each point along
Page 15: the traveling wave - University of Washingtondepts.washington.edu/sphsc461/traveling/the traveling wave.pdfThe curve that shows the amplitude of the traveling wave at each point along
Page 16: the traveling wave - University of Washingtondepts.washington.edu/sphsc461/traveling/the traveling wave.pdfThe curve that shows the amplitude of the traveling wave at each point along

If you put in two tones, you get a traveling wave that is high in amplitude in two places.

Page 17: the traveling wave - University of Washingtondepts.washington.edu/sphsc461/traveling/the traveling wave.pdfThe curve that shows the amplitude of the traveling wave at each point along
Page 18: the traveling wave - University of Washingtondepts.washington.edu/sphsc461/traveling/the traveling wave.pdfThe curve that shows the amplitude of the traveling wave at each point along
Page 19: the traveling wave - University of Washingtondepts.washington.edu/sphsc461/traveling/the traveling wave.pdfThe curve that shows the amplitude of the traveling wave at each point along

The higher the intensity of the sound, the higher the amplitude of the traveling wave.

Page 20: the traveling wave - University of Washingtondepts.washington.edu/sphsc461/traveling/the traveling wave.pdfThe curve that shows the amplitude of the traveling wave at each point along

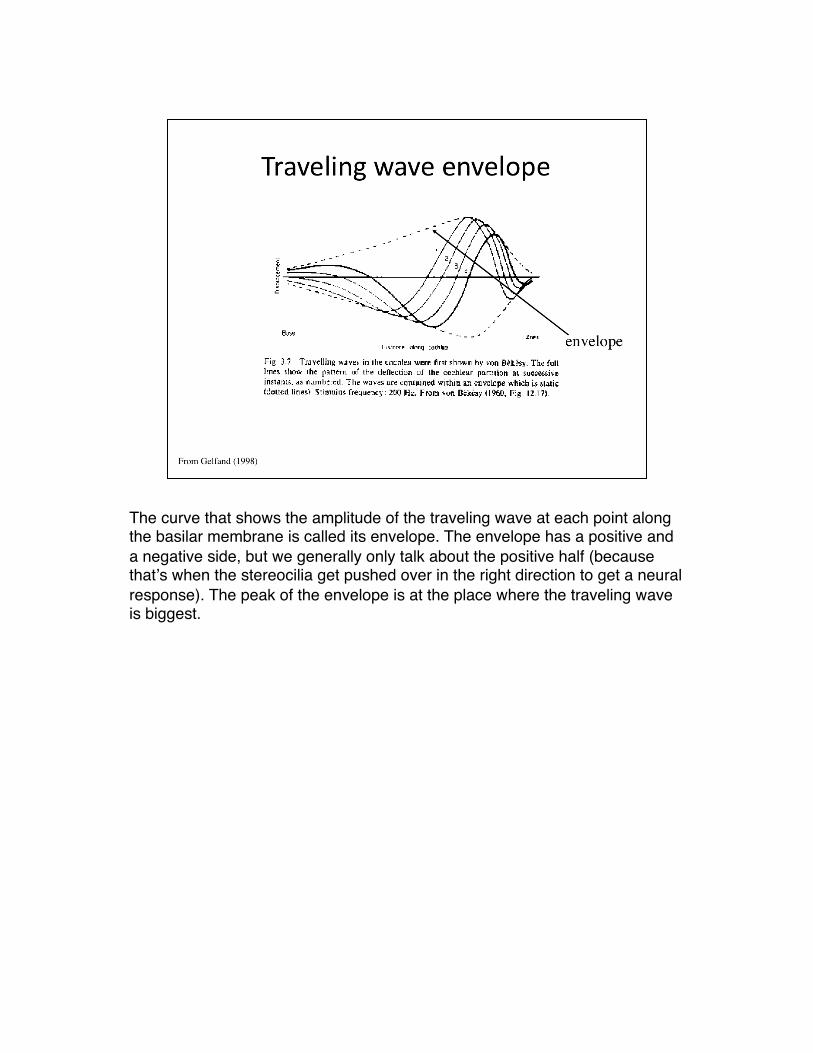
The curve that shows the amplitude of the traveling wave at each point along the basilar membrane is called its envelope. The envelope has a positive and a negative side, but we generally only talk about the positive half (because thatʼs when the stereocilia get pushed over in the right direction to get a neural response). The peak of the envelope is at the place where the traveling wave is biggest.

Page 21: the traveling wave - University of Washingtondepts.washington.edu/sphsc461/traveling/the traveling wave.pdfThe curve that shows the amplitude of the traveling wave at each point along

So if you plotted the traveling wave envelopes for different tone frequencies, theyʼd look something like this-- high frequencies have peak amplitudes at the base, and lower frequencies have peak amplitudes at progressively more apical positions.

Page 22: the traveling wave - University of Washingtondepts.washington.edu/sphsc461/traveling/the traveling wave.pdfThe curve that shows the amplitude of the traveling wave at each point along

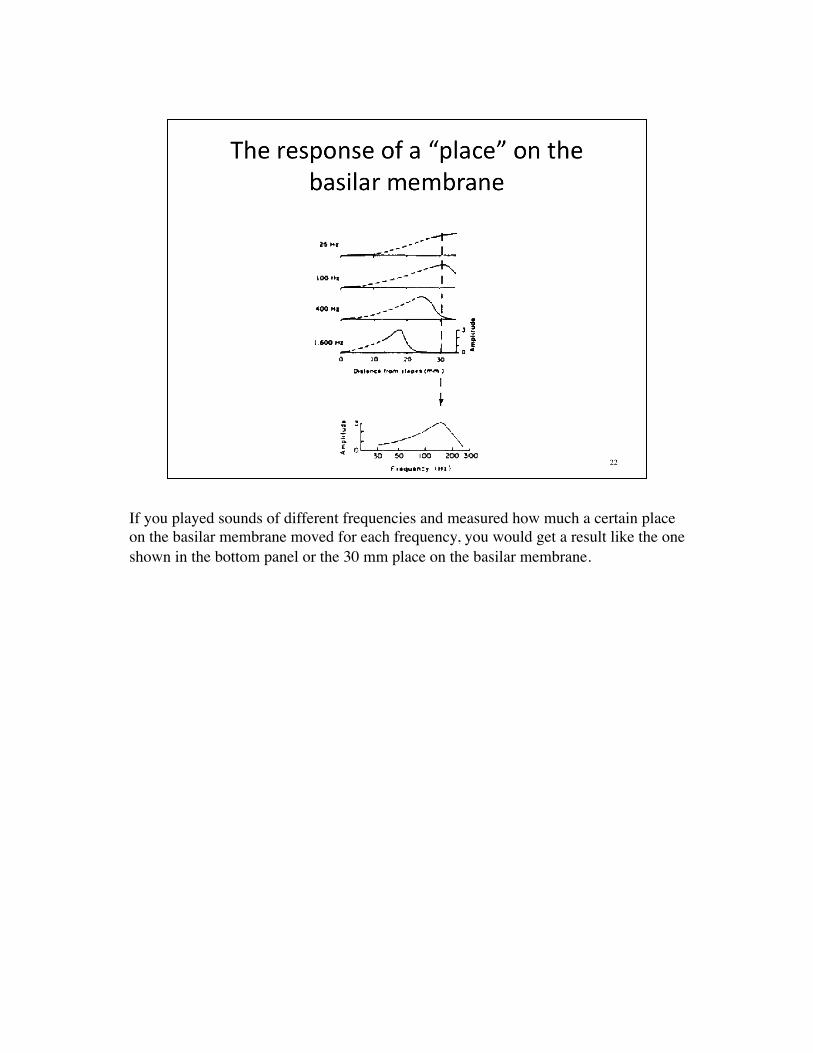
If you played sounds of different frequencies and measured how much a certain place on the basilar membrane moved for each frequency, you would get a result like the one shown in the bottom panel or the 30 mm place on the basilar membrane.

Page 23: the traveling wave - University of Washingtondepts.washington.edu/sphsc461/traveling/the traveling wave.pdfThe curve that shows the amplitude of the traveling wave at each point along
Page 24: the traveling wave - University of Washingtondepts.washington.edu/sphsc461/traveling/the traveling wave.pdfThe curve that shows the amplitude of the traveling wave at each point along
Page 25: the traveling wave - University of Washingtondepts.washington.edu/sphsc461/traveling/the traveling wave.pdfThe curve that shows the amplitude of the traveling wave at each point along