This PDF is a selection from a published volume from the National Bureau of Economic Research Volume Title: International Trade in East Asia, NBER-East Asia Seminar on Economics, Volume 14 Volume Author/Editor: Takatoshi Ito and Andrew K. Rose, editors Volume Publisher: University of Chicago Press Volume ISBN: 0-226-37896-9 Volume URL: http://www.nber.org/books/ito_05-1 Conference Date: September 5-7, 2003 Publication Date: August 2005 Title: The Trade and Investment Effects of Preferential Trading Arrangements Author: Philippa Dee, Jyothi Gali URL: http://www.nber.org/chapters/c0193

Welcome message from author
This document is posted to help you gain knowledge. Please leave a comment to let me know what you think about it! Share it to your friends and learn new things together.
Transcript

This PDF is a selection from a published volume from theNational Bureau of Economic Research
Volume Title: International Trade in East Asia, NBER-EastAsia Seminar on Economics, Volume 14
Volume Author/Editor: Takatoshi Ito and Andrew K. Rose,editors
Volume Publisher: University of Chicago Press
Volume ISBN: 0-226-37896-9
Volume URL: http://www.nber.org/books/ito_05-1
Conference Date: September 5-7, 2003
Publication Date: August 2005
Title: The Trade and Investment Effects of Preferential TradingArrangements
Author: Philippa Dee, Jyothi Gali
URL: http://www.nber.org/chapters/c0193
133
The number of preferential trading arrangements (PTAs) has grown dra-matically over the last decade or so. By the end of March 2002, there were250 agreements in force that had been notified to the World Trade Organi-zation (WTO), compared with 40 in 1990 (WTO 2002).
The coverage of preferential trading arrangements has also tended toexpand over time. The preferential liberalization of tariffs and other mea-sures governing merchandise trade remains important in many agreements.But they increasingly cover a range of other issues—services, investment,competition policy, government procurement, e-commerce, labor, and en-vironmental standards.
This paper examines, both theoretically and empirically, the effects ofthe trade and nontrade provisions of PTAs on the trade and foreign directinvestment (FDI) flows of member and nonmember countries.
5.1 Theoretical Review
The first wave of PTAs in the 1950s to 1970s were generally limited inscope, with preferential liberalization of merchandise trade playing a cen-tral role (the European Union [EU] was an important early exception). Inpart, this was because general tariff levels were higher to start with.
The static analysis of first-wave PTAs challenged the presumption that
5The Trade and Investment Effects ofPreferential Trading Arrangements
Philippa Dee and Jyothi Gali
Philippa Dee is visiting fellow at the Asia-Pacific School of Economics and Government atAustralian National University and formerly an assistant commissioner at the AustralianProductivity Commission. Jyothi Gali is a senior research economist at the Australian Pro-ductivity Commission.
The views are those of the authors and do not necessarily reflect those of any institutionwith which they have been affiliated.

these were a step in the right direction.1 It concluded that although PTAseased one economic distortion, namely, the average tariff on imports ingeneral, they exacerbated another, namely, the geographical disparity inimport tariffs. This was a classic situation of second best, with no clear pre-sumption in favor of gains to either PTA members or the world as a whole.The answer “depends,” and the devil is in the detail. The analysis is sum-marized in the appendix, using a diagrammatic exposition similar to thatfirst developed by Johnson (1960).
The literature also recognized that if the answer depends, then the ques-tion is an empirical one. Various analysts examined the trade effects ofvarious PTAs, trying to determine whether they have encouraged importsin general—trade creation—more than they have pushed the geographicsource of imports in the wrong direction—trade diversion. There is a de-gree of apparent consensus (summarized later) about which PTAs havebeen beneficial and which have been harmful to members. There have alsobeen recent generalizations that PTAs are relatively benign.
Interest in PTAs revived early in the 1980s as the United States reactedfirst to EU expansionism and the loss of EU markets and then to the un-certain prospects for launching the Uruguay Round, by selecting partnersfor bilateral and regional trade arrangements. The second-wave agree-ments were predominantly free trade agreements, where members retainedtheir own external tariffs, as opposed to customs unions, which adopt acommon external tariff. Hence rules of origin became important to preventtrade deflection, whereby imports would enter through the country withthe lowest external tariff. The second wave of PTAs also saw the inclusionof nontariff barriers and other nontraditional areas, such as dispute reso-lution and competition policy. However, the sectoral focus remained ongoods markets.
With the second wave, the focus of theoretical work shifted to the dy-namic question of whether PTAs were “building blocks” or “stumblingblocks” to multilateral free trade. Bhagwati, Krishna, and Panagariya(1999) identified two distinct approaches. First, suppose a PTA expands itsmembership. Will that reduce or increase welfare? If expansion increaseswelfare, then PTAs are seen as building blocks. Second, will a PTA expandits membership? And if so, is there an incentive for expansion to eventuallycover the entire world, with nondiscriminatory free trade for all, or will itstop short? This approach uses political economy considerations.
Some partial answers to these questions were provided by Krugman(1993), Deardorff and Stern (1994), Baldwin, (1996), Levy (1997), and
134 Philippa Dee and Jyothi Gali
1. The seminal work is Viner (1950). Other early contributions came from Gehrels (1957),Lipsey (1957, 1958), Johnson (1960), Mundell (1964), Corden (1972), and Riezman (1979).Comprehensive surveys of the literature are available in Baldwin and Venables (1995), Pom-fret (1997), Bhagwati, Krishna, and Panagariya (1999), and Panagariya (2000), among oth-ers. Two recent policy-oriented reviews are by the WTO (1995) and the World Bank (2000).

Krishna (1998). The most recent, comprehensive analyses by Zissimos andVines (2000) and Andriamananjara (2002) acknowledge that joining aPTA is the best safe-haven strategy when other countries are doing so. Butthey find that because PTA membership confers a terms of trade gain tomembers at the expense of nonmembers, at least some members will bebetter off limiting PTA membership than allowing expansion to cover theworld as a whole.2 Any redesign of the WTO rules disciplining the forma-tion of PTAs would need to recognize that reality.
During the 1990s the number of PTAs expanded dramatically. In addi-tion to new preferential initiatives by the EU and the United States, thethird wave now includes players such as Japan. Until 2002 Japan was oneof only four WTO members not to participate in any PTA (although it wasa member of nondiscriminatory Asia-Pacific Economic Cooperation[APEC]). Its first agreement, the Japan-Singapore Economic Agreementfor a New Age Partnership, typifies many new age agreements. The provi-sions governing merchandise trade are very limited. Both countries alreadyhave zero or very low tariffs on imports of nonagricultural products, andtrade in agricultural products between them is minimal, but because of thesensitivity of the trade in cut flowers and goldfish, agricultural and fisheryproducts (along with some petrochemical and petroleum goods) have beenexcluded from the bilateral agreement altogether. Instead, the agreementfocuses on new age issues—especially e-commerce and services. Othersuch agreements include FDI, competition policy, government procure-ment, labor, and environmental standards.
Despite the evolution of third-wave or new age agreements, there hasbeen little literature dealing with the effects of preferential nontariff provi-sions. Two exceptions are Pomfret (1997, chapter 10) and Ethier (1998a,b,1999, 2001), who deal primarily with effects on investment.
Pomfret (1997) does not discuss in detail the economic welfare effectsof discriminatory provisions governing foreign direct investment, but hisdiscussion of the welfare effects of preferential nontariff barriers to tradeis suggestive. Pomfret (1997) notes that the critical distinction is whethernontariff barriers are rent generating—allowing a markup of price overcost—or whether they are cost escalating—increasing the real resourcecosts of doing business.
The analogy with preferential liberalization of investment provisions is asfollows:
• If investment barriers are of the sort to generate rents, then preferen-tial liberalization will generate gains from investment creation as pro-duction is moved from a high-cost domestically-owned producer to a
The Trade and Investment Effects of Preferential Trading Arrangements 135
2. These are further developments of the arguments about the negative externalities fromterms of trade changes developed by Bond and Syropoulos (1996) and Bagwell and Staiger(1998, 1999), among others.

lower-cost member’s affiliate. But it will also generate losses from in-vestment diversion as production is moved from a low-cost nonmem-ber affiliate (located somewhere in the world) to a higher-cost memberaffiliate.
• If investment barriers are of the sort to escalate costs, then preferen-tial liberalization will unambiguously save real resources and increasewelfare, irrespective of whether the partner is the least-cost location(see also Baldwin 1994).
Thus the welfare implications of preferentially liberalizing investment pro-visions are more positive than they were for preferential tariff liberalizationbecause of the possibility of saving real resources. But the potential forlosses from investment diversion also remains.
In a series of papers, Ethier (1998a,b, 1999, 2001) develops variants of amodel in which investment responds in “beachhead” fashion to the prefer-ential trade provisions of PTAs.
This model is an explicit attempt to capture some of the salient featuresof third-wave PTAs. Many third-wave agreements are between small andlarger countries. The small countries want to reform their internal econ-omies so that they can be accepted as members of the global trading sys-tem. The sign of successful reform is whether these countries attract FDI.The small countries use (often asymmetrical) trade concessions to largecountries as a way of signaling a credible commitment to reform.
There is no presumption in Ethier’s (1998b) framework that the invest-ment they attract comes from the large PTA partner. The aim of these smallreforming countries is often to divert investment from nonmember coun-tries. Ethier (2001) also examines in detail the incentives for the larger coun-try to accede to such an arrangement, even in preference to pursuing fur-ther multilateral reform. Finally, he shows that a world equilibrium in whichsmall countries compete for investment in this fashion is beneficial becauseit internalizes an externality associated with agglomeration economies.
Ethier’s (1998a,b, 1999, 2001) positive outlook on PTA formation comesfrom this benign view of competition for investment, rather than from thecharacteristics of PTAs per se. As he acknowledges, his model of PTA for-mation is consistent with massive amounts of investment diversion to takeadvantage of trade beachheads and subsequent trade diversion from thosebeachhead positions. But in his model, there is sufficient symmetry be-tween countries for this trade and investment diversion to have no adversewelfare consequences—every country is the lowest-cost source of importsand the best host for FDI. With more diversity, this massive diversion is nolonger benign.
Ethier’s (1998a,b, 1999, 2001) positive view also depends on the compe-tition for investment occurring through reform, which is seen as a goodthing. If it were to occur through the competitive granting of investment in-centives, or if reform involved inappropriate concessions forced by a larger
136 Philippa Dee and Jyothi Gali
hegemon (as Bhagwati [1999] fears), the competition for investment mayitself be less benign.
At first sight, the focus of third-wave agreements on nontariff issues maysuggest that traditional concerns about trade diversion are outmoded. Butthe theoretical literature suggests otherwise. Investment barriers can beused as a protective device, and preferential liberalization of investmentprovisions can generate investment diversion, with adverse consequences,as well as beneficial investment creation. Even where investment is at-tracted in beachhead fashion in response to trade liberalization provisions,both the investment and subsequent trade from the beachhead positionmay be diversionary. Thus the nontariff focus of third-wave agreementscannot shake the first-wave concerns about the adverse second-best effectsof preferential liberalization.
The second section of this paper summarizes the trade and nontrade pro-visions included in a number of recent PTAs. The third section empiricallyestimates the effects of recent trade and nontrade provisions on bilateraltrade and investment flows. The fourth section recapitulates the key findings.
5.2 Breadth of Coverage of PTAs
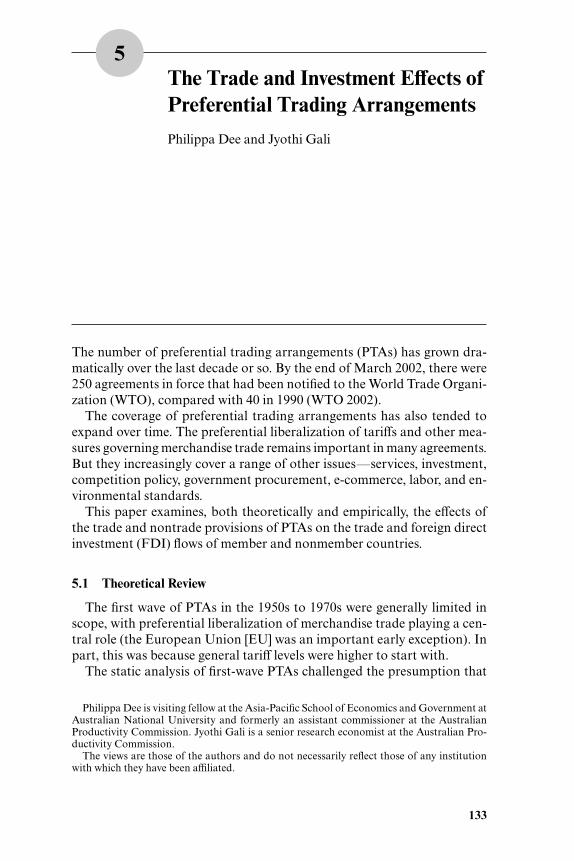
Figure 5.1 shows the discernible upward trend in the breadth of cover-age of PTAs over recent times. On the vertical axis is an index measure of
The Trade and Investment Effects of Preferential Trading Arrangements 137
Fig. 5.1 Member Liberalization Index (MLI) for selected PTAs, index scoreranges between zero and oneSource: Adams et al. (2003).

breadth of coverage, with provisions governing merchandise and nonmer-chandise trade scored separately. The Member Liberalization Index (MLI)is described in detail in Adams et al. (2003). On the horizontal axis is thedate of establishment. Coverage has clearly tended to increase in the morerecently established or expanded PTAs, and this has generally been be-cause of an expansion in the coverage of nonmerchandise trade issues.
The index includes provisions covering the following:
• Agricultural products—including domestic support measures, tariffquotas, sanitary and phytosanitary measures, tax exceptions, exportincentives, and technical barriers to trade, among others
• Industrial products—including coverage and restrictiveness of rulesof origin, safeguards, antidumping, coverage and timing of tariff pref-erences, among others
• Services—including provisions governing market access and nationaltreatment in services
• General measures—general national treatment provisions, invest-ment rules, domestic competition policy, government procurement,intellectual property rights, and general provisions covering the tem-porary and permanent movement of people
These provisions are classified into two subindexes for quantitative anal-ysis. The merchandise MLI includes the provisions covering agricultureand industrial products—an index of traditional provisions. The nonmer-chandise MLI, covering third-wave issues, includes the services provisions,plus the general measures covering all trade.
The coverage varies from one PTA to another. Some involve only a fewproducts or sectors, while others stretch well beyond the traditional tariffelimination. Note that the scores are based on how the language of theagreements is written, not on whether or how the provisions are used. Ahigh index for nonmerchandise trade indicates that a PTA is more liberalto members in its services trade, investment, and related provisions. Thisindex takes a high value for Singapore-New Zealand (NZ), followed byCloser Economic Relations (CER) (between Australia and New Zealand),the North American Free Trade Agreement (NAFTA) and the EU.
The provisions indexed in the MLI are treated as additive to and in-dependent of each other. In reality some provisions might interact tostrengthen or weaken other provisions. For example, the time schedule forpreferential tariff liberalization is closely related to the restrictiveness ofrules of origin. The impact of interaction effects among the provisions invarious PTAs is potentially an empirical question, but interaction effectshave not been allowed for specifically in the construction of this index norin the subsequent econometric analysis. For this reason, the econometricsmay understate (where interaction effects reinforce) or overstate (where in-teraction effects cancel) the overall effects of PTAs.
138 Philippa Dee and Jyothi Gali

The estimated relationship between these provisions and the level oftrade (or investment) provides an indication of whether provisions in-cluded in PTAs have any effect collectively on trade (or investment) flowswith member or nonmember countries. Because PTAs are by definition ex-clusive and discriminatory against nonmembers, trade and nontrade pro-visions that are favorable to the intra-PTA trade (or investment) may be-come barriers to nonmember countries.
5.3 Empirical Analyses
The key empirical task is to disentangle the effects of PTA formation orexpansion from all other influences on trade and investment flows. Thereare two main approaches available in the literature.
First, ex ante studies have used counterfactual analyses based on partialor general equilibrium models. These models assume a certain modelstructure, with specific functional forms and parameter values to representthe countries in a base year prior to the formation of the PTA. Those mod-els with a sufficiently tight theoretical structure can also be used to draw di-rect inferences about welfare. The model is then subjected to the preferen-tial removal of tariffs alone, and the welfare effects are calculated. Surveysof assessments of PTAs using general equilibrium models can be foundin De Rosa (1998) and Robinson and Thierfelder (2002). Scollay and Gil-bert (2000) survey computable general equilibrium (CGE) assessmentsof APEC. Most of these studies find that PTAs create additional trade forboth members and nonmembers. Most also find that PTAs improve wel-fare, at least among member countries.
However, these CGE analyses suffer from a number of theoretical andpractical difficulties. Some (in particular, many of those covered by theRobinson and Thierfelder [2002] survey) assume fixed terms of trade. Asnoted by Panagariya and Duttagupta (2002), this is inconsistent with oneof their other key assumptions, namely, product differentiation at the na-tional level. Deardorff and Stern (1994) note how the assumption of na-tional product differentiation can itself leave an “idiosyncratic stamp” onexaminations of PTAs, in particular helping to explain Krugman’s (1993)finding of welfare losses in a world of three trading blocs, a result that doesnot appear to carry over to empirical CGE analyses. But in addition, theassumption of fixed terms of trade rules out one of the key effects of PTAs,namely, terms of trade changes.
Further, the CGE studies typically use a very simple characterization ofPTAs. Most assume comprehensive across-the-board elimination of tariffs(and sometimes nontariff barriers) among members, although most real-world PTAs have complex patterns of exemptions. In addition, the studiestypically ignore many of the potentially trade-restrictive nontariff mea-sures, such as rules of origin or local content requirements, that typically
The Trade and Investment Effects of Preferential Trading Arrangements 139

accompany the merchandise trade measures. Finally, they typically ignoreprovisions affecting nonmerchandise trade (although a notable exceptionis Hertel, Walmsley, and Itakura 2001).
This is not to deny that particular CGE models, when used with appro-priate assumptions (such as variable terms of trade), can give valuable in-sights into the possible effects of important tariff provisions of PTAs. Butconclusions drawn from surveys of CGE studies should be treated cau-tiously. And the results from CGE studies should not be generalized todraw conclusions about the effects of nonmerchandise trade provisions ofPTAs.
By contrast, ex post studies of PTAs measure their trade creation andtrade diversion effects by using econometric methods to establish a linkbetween actual PTA formation and actual trade outcomes, controlling forthe effects of all other influences. Because welfare is unobservable, theseeconometric studies cannot establish welfare effects directly. And as notedin the appendix, the link between trade outcomes and welfare is weak. Butthe studies do examine actual PTAs, in all their complexity, including non-merchandise trade provisions. The present study is an ex post evaluation ofthe effects of PTAs.
5.3.1 Gravity Model
The gravity model is the key ex post econometric technique used to ex-amine the determinants of bilateral trade flows. It is a model of trade flowsbased on an analogy with the law of gravity in physics. Trade between twocountries is positively related to their size and inversely related to the dis-tance between them. A number of other explanatory variables are addedto this model to analyze various bilateral trade policy issues. In the aug-mented gravity model, trade between two countries is determined bysupply conditions at the origin, demand conditions at the destination, andvarious stimulating or restraining forces. This specification has recentlybeen shown to be consistent with a number of theoretical models of inter-national trade.3
The standard way of assessing the impact of PTAs is to add PTA-specificbinary dummy variables to the augmented gravity model to capture effectsnot captured through normal bilateral trade determinants. Studies addingPTA-specific dummy variables to capture the trade creation and diversioneffects of PTAs date back to the 1970s. Aitken (1973) initially added one
140 Philippa Dee and Jyothi Gali
3. The gravity model can be derived theoretically as a reduced form from a general equi-librium model of international trade in goods. Baier and Bergstrand (2001) derived it from amodel of monopolistic competition. Feenstra, Markusen, and Rose (2001) derived it from areciprocal dumping model of trade with homogeneous goods. Deardorff (1998) derived itfrom a model with perfectly competitive markets. Evenett and Keller (2002) showed empiri-cally that the monopolistic-competition-based theory of trade fits the trade flows amongindustrialized countries well. Anderson and van Wincoop (2003) nevertheless showed thatmany empirical implementations have strayed from the theoretically derived reduced form.
dummy variable to his gravity model to capture the intrabloc effect of aPTA—“a gross trade effect” of Balassa (1967). Bayoumi and Eichengreen(1995) and Frankel (1997) added two dummy variables for each PTA tocapture the separate effects on intrabloc and extrabloc trade. The firstdummy variable takes a value of one when the two countries are membersof the same PTA. The second dummy variable is one if either country in aparticular pair belongs to the PTA. If a positive coefficient on the firstdummy exceeds a negative coefficient on the second, then trade creationmay be said to outweigh trade diversion.
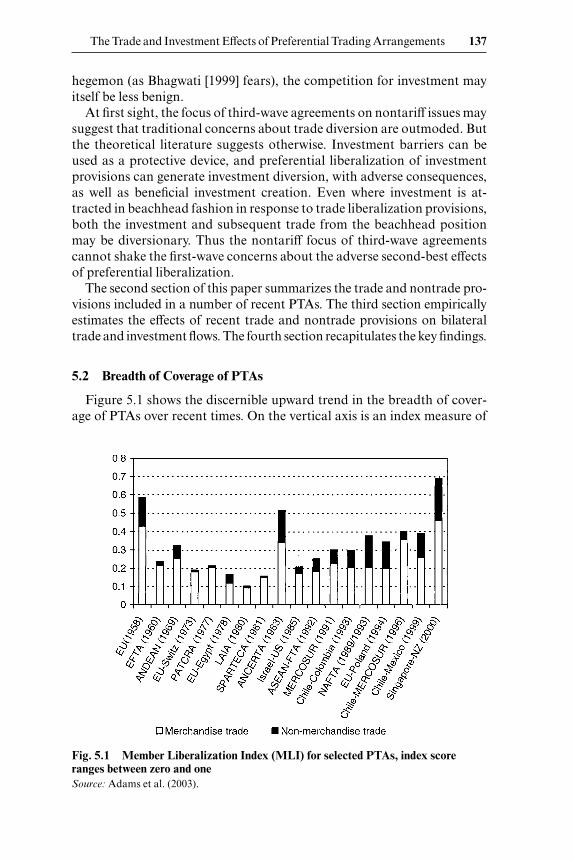
Soloaga and Winters (2001) added three dummy variables for each PTAto distinguish an intrabloc effect, an extrabloc effect on imports, and anextrabloc effect on exports (see figure 5.2). The second and third dummyvariables in their study measure the extent of import diversion and exportdiversion, respectively. They argued that both are needed because blocmembers’ imports and exports could follow different patterns after the for-mation of a PTA.
The current analysis also uses three dummy variables for each PTA. Butinstead of taking simple zero-one values, irrespective of the scope or cov-erage of the PTA provisions, the dummies take the value of the MLI index(or subindex) whenever the PTA is in force.
Because the gravity model is estimated using panel data, the PTA-specific dummy variables are introduced in one of two ways. Firstly, dy-namic PTA-specific indexes are defined to take a nonzero value only for theyears in which a PTA between the two countries is in force and to take avalue of zero otherwise. These indexes capture the effect of the formation,
The Trade and Investment Effects of Preferential Trading Arrangements 141
Fig. 5.2 Use of PTA-specific dummy variables in a gravity model—the example of NAFTANotes: D1 captures the effects of NAFTA on intrabloc trade. D2 captures the effects ofNAFTA on members’ imports from nonmembers—import diversion if the coefficient is neg-ative. D3 captures the effects of NAFTA on members’ exports to nonmembers—export di-version if the coefficient is negative.

expansion, and contraction of a PTA on trade and investment only after itoccurs. In contrast, antimonde PTA-specific indexes take a nonzero valuefor all the years in the sample, irrespective of when the PTA was formed.These antimonde indexes are used as the panel analogue to the nondy-namic indexes of previous cross-sectional gravity model studies. They havethe same disadvantage as these studies of allowing the formation, expan-sion, and contraction of a PTA to affect trade and investment before theevent.
5.3.2 Model Specification
Effects on Trade
The panel data includes information on all potential trading partners,even when a country has no exports to some partners in some years. Be-cause the nature of trade relations in many countries in the World TradeFlows (1997, 2000) database is such that each country trades with a rela-tively small number of partners, the dependent variable contains a signifi-cant number of zero observations as well as many positive observations.4
As a result, a Tobit estimation procedure is used to appropriately accountfor the censored nature of the dependent variable—the natural log of ex-ports between country i and country j in year t.5 Adams et al. (2003) de-scribe the data sources in detail. The panel has a relatively long time di-mension, covering 1970–1997 for the estimation of trade effects (1988–1997 for the estimation of investment effects). While this risks the problemof subsample instability, it has the advantage that it helps to overcome theproblem of nuisance parameters in the estimation of fixed effects in a Tobitcontext (Greene 2002).
The gravity model estimated here allows for product differentiation at thecountry level. Much of the recent literature on PTAs has focused on im-perfectly competitive behavior. Recognizing this is important for two rea-sons:
• Some economic integration has occurred among economies with al-most similar structures and large volumes of intraindustry trade.
• There is a positive interaction between market structure and the gainsfrom integration, often called the procompetitive effects of PTAs,which the new age agreements aim to capture.
142 Philippa Dee and Jyothi Gali
4. For the full sample trade model, the number of observations is 116 countries � 115 part-ners � 28 years � 373,520, with about 44 percent having zero values.
5. There are a variety of alternate approaches to this problem. The zero values can be simplyomitted as in the case of Frankel (1997), which leads to the possibility of selectivity bias. Ar-bitrarily small numbers can be used in place of zeros. Eichengreen and Irwin (1995) expressedthe dependent variable as Ln (1 � Yij ). Clark and Tavares (2000) and Soloaga and Winters(2001) used a Tobit specification for their cross-sectional gravity model.

The product differentiation model of Helpman and Krugman (1985)and Helpman (1987) is integrated into the current gravity model specifica-tion. In their models, one of the two goods is differentiated and the other ishomogenous. The bilateral trade of each country is the sum of interindus-try and intraindustry trade flows, with the latter being trade in the differ-entiated product.
The corresponding reduced form of gravity model for trade is
(1) Ln Y∗ijt � a � �i � �j � �t � �1 Ln SGDPijt � �2 Ln RLFAijt
� �3 Ln Similarijt � �4 Ln Disij � �5 Ln RERijt � �6 Ln TARijt
� �7Linij � �8Borij � �9Colij � �10Curij � �11Isi � �12Isj
� �13locki � �14lockj � �153waveij � ∑ij
MRTAij
� ∑�j
MRTAi�j � ∑�i
MRTAj�i � Ln εijt
where
Ln is natural logarithmic transformation;Y ∗
ijt is the value of exports from country i to j in year t; using exportsas a dependent variable rather than total bilateral trade allowsthe identification of export and import diversion separately;
�i is unobserved specific effects in exporting country i;�j is unobserved specific effects in importing country j;�t is unobserved specific effects in time period t;SGDPijt is the sum of bilateral gross domestic products (GDPs) of i and j
in year t;RLFAijt is the absolute differences in GDP per capita of i and j in year t;Similarijt is similarity in country size between i and j in year t in terms of
aggregate GDP;Disij is distance between the two largest or capital cities of countries i
and j;RERijt is the bilateral real exchange rate between i and j in year t;Tarijt is an average tariff rate in importing country j on goods from
country i in year t;Linij is a measure of linguistic similarity between i and j;Borij is a dummy that takes a value 1 if i and j share a land border and
0 otherwise;Colij is a dummy that takes a value 1 if i and j have colonial linkages
and 0 otherwise;Curij is a dummy that takes a value 1 if i and j have the same currency
and 0 otherwise;Isi is a dummy that takes a value 1 when i is island nations and 0 oth-
erwise;
The Trade and Investment Effects of Preferential Trading Arrangements 143
Locki is a dummy that takes a value 1 when i is a landlocked nation and0 otherwise;
3waveij is an index capturing the third wave provisions of a PTA, thattakes a value of the nonmerchandise MLI index if the i and j areparticipants of a specific PTA in the sample and 0 otherwise; italso has a time dimension when defined in dynamic rather thanantimonde form;
MRTAij is an index capturing the merchandise trade provisions of a PTA,that takes the value of the merchandise MLI if both countries iand j belong to the same PTA and 0 otherwise; it also has a timedimension when defined in dynamic rather than antimonde form;
MRTAi–j is an index that takes the value of the merchandise MLI when theimporting country j belongs to that particular PTA and 0 other-wise; it also has a time dimension when defined in dynamic ratherthan antimonde form;
MRTAj–i is an index that takes the value of the merchandise MLI when theexporting country i belongs to that particular PTA and 0 other-wise; it also has time dimension when defined in dynamic ratherthan antimonde form; and
εijt is an error term.
From an econometric point of view, the �i , �j and �t specific effects aretreated as fixed unknown parameters. The use of three separate fixed effectsis advocated by Matyas (1997, 1998) and avoids the omitted variable biasidentified by Haveman and Hummels (1998) and Anderson and van Win-coop (2003).
The expected relationship of the observed explanatory variables with bi-lateral exports is discussed in detail in Adams et al. (2003). In a model ofproduct differentiation, countries similar in size will trade more, and thetrade will be of an intraindustry nature. The index of size similarity (Simi-lar) captures this effect. By contrast, traditional trade theory says thatcountries with dissimilar levels of per capita GDP will trade more than thecountries with similar levels. The absolute difference in the per capita GDPbetween exporting and importing countries (RLFA) is included as an ex-planatory variable in the gravity model as a way of distinguishing the tra-ditional from the differentiated product approaches.6
The preceding gravity model specification includes the real exchangerate (RER) as a relevant price variable in order to control for fluctuationsin relative prices among trading partners.
The average bilateral tariff rate (Tar) is expected to show a negative rela-
144 Philippa Dee and Jyothi Gali
6. The specification based on product differentiation in the preceding also differs from tra-ditional gravity model specifications by including the sum of importing and exporting coun-try GDPs, rather than including each separately. This small loss of generality means that theproduct differentiation version does not encompass the traditional model fully.
tionship with trade. The PTA-specific indexes capture the extent of tradi-tional and new age provisions of a PTA but not the size of the tariff prefer-ences thereby created. Because the bilateral tariff variable includes prefer-ential tariffs,7 the overall measured effect of PTAs on trade will be splitbetween the tariff variable and the PTA-specific indexes in specificationswhere both occur. To test whether the coefficients of the PTA-specific in-dexes are sensitive to the inclusion of the tariff variable, the gravity modelis estimated initially without the tariff variable. It is then reestimated withthe tariff variable for that subset of countries and time periods for which bi-lateral tariff data are available.
Effects on Investment
The product differentiation specification also provides a rationale forapplying the gravity model to investment flows (Egger 2001).
The raw FDI data for this analysis are sourced from the United NationsConference on Trade and Development (UNCTAD) and the Organizationfor Economic Cooperation and Development (OECD) for the period be-tween 1988 and 1997 for about seventy-seven countries (see Adams et al.2003). As there are some deficiencies in this data, the qualitative aspects ofthe analytical results rather than the precise magnitude of the investmentestimates are of main interest.
The dependent variable in the gravity model is the natural logarithm ofthe stock of outward investment from home country to host country. Thestock of outward investment is used as the dependent variable, rather thanoutflows, for two reasons. First, more outward stock than outflow data areavailable in the source documents. For many countries in the late 1980s andfor some Latin American countries in early 1990s, the bilateral FDI flowdata are not fully reported in the UNCTAD investment directories. Sec-ond, statistical tests suggested that a gravity model based on the stock ofoutward investment was preferred to a model based on outflows.
Apart from the more limited number of years and countries analyzed,the investment model is similar to the trade model. In particular, the key bi-lateral determinants are the same for trade and investment (see also Egger2001), although the sign and magnitude of the impact of some of these ex-planatory variables differs.
For each PTA, three merchandise MLIs and three indexes of third-waveprovisions are included in the investment gravity model to test how theinvestment to members, and to and from nonmembers, responds to thetraditional and third-wave provisions embedded in each PTA. Three mer-chandise MLIs and only one (intrabloc) nonmerchandise MLI were in-cluded in the trade gravity model. Because of model convergence prob-
The Trade and Investment Effects of Preferential Trading Arrangements 145
7. The bilateral tariff data are applied rates obtained from UNCTAD’s Trade Analysis andInformation System (TRAINS) database. As such they incorporate tariff preferences.

lems, the effects of new age provisions on exports to nonmembers andimports from nonmembers could not be analyzed separately in the trademodel.
Two additional variables are added to the investment model because inaddition to the investment provisions of PTAs, countries also negotiate bi-lateral investment treaties (BITs). About 191 PTAs were in force in 2000,with only a few covering investment provisions, while 1,941 BITs were inplace then. The specification controls for whether an investment treaty iseither signed or enacted between a pair of countries.
There are clearly some interdependencies between the trade equationand the investment equation, but in the absence of the remaining elementsof the balance of payments, there is an insufficiently tight link to warrantseemingly unrelated regression or some other systems-estimation tech-nique. Similarly, there are no obvious cross-equation restrictions thatwould improve the efficiency of estimation. One option would have been toinclude trade flows in the investment equation and investment flows in thetrade equation, but this would have created a severe simultaneity problem.In the current PTA context, it was felt that including trade PTA dummiesin the investment equation and vice versa was a minimalist approach tocapturing the interdependencies.
The expected effects of traditional and new age provisions on investmentare not straightforward.
If trade liberalization makes exporting from the home country relativelymore attractive than FDI as a way to serve the regional market, then thetrade provisions of a PTA could cause a reduction in intrabloc investment.But the trade provisions could also enable transnational corporations to op-erate vertically in a PTA area, stimulating intra-FDI flows among the rele-vant partners. The structure and motivation of investment will determinethe net impact of trade provisions of PTAs on intra-PTA investment. So toowill the structure and motivation of intrabloc trade (Markusen 1983).
According to Ethier (1998b, 2001), the inflows of FDI from nonmembercountries into the PTA region are likely to go up in response to the tradeprovisions of PTAs, as nonmembers establish beachhead positions in onePTA member country in order to serve the market of the others. Alterna-tively, if multinationals are initially operating in member countries to servethe protected local market (the tariff jumping motivation for investment),then these multinationals may rationalize their network of affiliates afterthe formation of the PTA, and, as a result, some member countries couldlose investment to nonmember countries.
Thus, the response of investment to the merchandise trade provisions ofa PTA is an empirical question. The various possibilities can be tested inthe following way.
If investment responds in beachhead fashion to the trade provisions ofPTAs and in turn stimulates intrabloc trade, this can be identified by thecombination of a positive and significant effect of trade provisions on intra-
146 Philippa Dee and Jyothi Gali

bloc trade and a positive and significant effect of trade provisions on invest-ment from nonmember countries.
Alternatively, a reversal of tariff-jumping investment can be identified bya positive and significant effect of trade provisions on investment to non-member countries.
Investment may also respond to the nontrade provisions of PTAs. If, asa result, production is moved from a high-cost domestically owned pro-ducer to a lower-cost member’s affiliate, this investment creation is likely tobenefit members of the PTA. But if production is moved from a low-costnonmember affiliate to a higher-cost member affiliate, this investment di-version may not benefit members.
Measures of net investment creation or diversion can be obtained bysumming the significant coefficients of the three separate nonmerchandiseMLI variables in parallel fashion to the trade equation. One further quali-fication to the welfare implications of investment is that if the initial non-trade restrictions are of the sort to raise costs rather than generate rents,then any investment relocation in response to their preferential removalwill unambiguously benefit members.
5.3.3 New Evidence on Trade Creation and Diversion
The observable effects—normal bilateral trade determinants and tradeprovisions of PTAs—and unobservable country- and time-specific effectsall significantly influence the bilateral trade flows. The signs and signifi-cance of the coefficients on the observable effects are generally as expected(see table 5.1). Interestingly, they support both traditional and product di-fferentiation theories of trade because similarity in size and differences inincome per head are both associated with higher bilateral exports. In thepreferred specification with dynamic PTA variables and fixed effects, thecoefficient on the sum of GDPs is about 2, as expected.
The new estimates of trade creation and diversion tend to be differentfrom past estimates for most PTAs. Past estimates showed most PTAs to betrade creating in net terms. By contrast, the results here suggest most PTAsdo not create additional trade, either for members or for nonmembers ofthe agreement. The net trade effects of preferential agreements found inthis study are compared with past estimates in table 5.2, which showswhether the net effects are positive or negative.
Nearly all PTAs are found to have caused net trade diversion in the newassessment. The PTAs found to have inconclusive effects in past analysisdrifted either way in the new assessment, but the Southern Common Mar-ket (MERCOSUR) was found here to have caused net trade diversion.8
The Trade and Investment Effects of Preferential Trading Arrangements 147
8. The assessment of net trade effects is based on the marginal effects of PTAs reported inAdams et al. (2003), rather than the raw maximum likelihood Tobit estimates in table 5.1, forthe preferred specification with dynamic PTA variables and fixed effects. Although the mar-ginal effects and raw Tobit estimates are not equal (as explained in Adams et al. 2003), in prac-tice the assessment of the direction of net trade effects is the same, whichever is used.

Table 5.1 Gravity model of trade: Econometric results from full sample
Dynamic PTA indexes Antimonde PTA indexes
Without With Without With Variable name fixed fixeda fixed fixeda,b
Ln sum of exporting and importing countries GDP (SUM) 2.841∗∗∗ 2.008∗∗∗ 2.185∗∗∗ 2.066∗∗∗
Similarity in exporting and importing country’s GDPs 1.245∗∗∗ 0.637∗∗∗ 0.965∗∗∗ 0.665∗∗∗
Ln of absolute differences in per capita GDPs of exporting and importing country 0.361∗∗∗ 0.310∗∗∗ 0.217∗∗∗ 0.251∗∗∗
Ln distance –1.729∗∗∗ –2.193∗∗∗ –2.292∗∗∗ –2.306∗∗∗Ln bilateral real exchange rate 0.162∗∗∗ 0.054∗∗∗ 0.023∗∗ 0.049∗∗∗Linguistic similarity 0.000∗∗∗ 0.000∗∗∗ 0.000∗∗∗ 0.000∗∗∗Colonial 1.167∗∗∗ 1.759∗∗∗ 1.628∗∗∗ 1.575∗∗∗Border –0.088 –0.571∗∗∗ –0.529∗∗∗ –0.626∗∗∗Currency union 1.201∗∗∗ 3.136∗∗∗ 1.148∗∗∗ 3.025∗∗∗Exporting country is an island 0.684∗∗∗ –2.250∗∗∗ 0.670∗∗∗ 0.289Importing country is an island 1.070∗∗∗ –3.369∗∗∗ 1.163∗∗∗ –3.268∗∗∗Exporting country is landlocked –2.292∗∗∗ –3.456∗∗∗ –1.869∗∗∗ –0.648∗Importing country is landlocked –2.052∗∗∗ 3.276∗∗∗ –1.929∗∗∗ 4.515∗∗∗Third-wave provisions of PTAs 20.074∗∗∗ 13.899∗∗∗ –10.760∗∗∗ –8.748∗∗∗Andean1 3.135∗ 4.544∗∗∗ 3.871∗∗∗ 2.774∗∗∗Andean2 2.496∗∗∗ –0.600 11.257∗∗∗Andean3 –0.943∗∗∗ –3.088∗∗∗ 13.716∗∗∗APEC1c –2.081∗∗∗ –2.727∗∗∗ –0.052 0.091∗APEC2c –0.240∗∗∗ 0.583∗∗∗ 2.118∗∗∗ –0.666∗∗∗APEC3c 1.245∗∗∗ 0.486∗∗∗ 4.404∗∗∗ 1.941∗∗∗EFTA1 –6.252∗∗∗ –7.023∗∗∗ –1.972 –0.690EFTA2 12.322∗∗∗ 0.252 9.111∗∗∗EFTA3 17.195∗∗∗ 3.141∗∗∗ 15.189∗∗∗EC/EU1 –16.129∗∗∗ –16.022∗∗∗ 8.763∗∗∗ 9.608∗∗∗EC/EU2 5.344∗∗∗ –1.209∗∗∗ –8.208∗∗∗ 10.632∗∗∗EC/EU3 6.343∗∗∗ –0.486∗ –7.920∗∗∗ 18.188∗∗∗GCC1c –0.400 –1.782∗∗∗ –0.135 –0.341∗GCC2c –0.498∗∗∗ 0.139∗ 0.950∗∗∗ 0.855∗∗∗GCC3c –2.098∗∗∗ –0.600∗∗∗ 0.118∗∗∗ 2.379∗∗∗LAFTA/LAIA1 30.591∗∗∗ 17.419∗∗∗ 28.057∗∗∗ 26.432∗∗∗LAFTA/LAIA2 –20.659∗∗∗ –6.517∗∗∗ –22.841∗∗∗LAFTA/LAIA3 –5.267∗∗∗ –0.635 –32.910∗∗∗MERCOSUR1 –6.894∗∗ –9.376∗∗∗ 0.800 1.075MERCOSUR2 1.451∗∗∗ 1.929∗∗∗ –5.002∗∗∗MERCOSUR3 2.917∗∗∗ –1.306∗∗∗ 23.916∗∗∗NAFTA1 –17.152∗∗∗ –14.970∗∗∗ –2.072 –0.966NAFTA2 5.195∗∗∗ 1.166∗∗ 7.310∗∗∗NAFTA3 –2.720∗∗∗ –0.790 –1.938∗∗∗SPARTECA1 42.499∗∗∗ 35.093∗∗∗ 31.956∗∗∗ 31.573∗∗∗SPARTECA2 –9.865∗∗∗ –0.402 –12.250∗∗∗SPARTECA3 –13.312∗∗∗ 0.557 –18.496∗∗∗CER1 –28.857∗∗∗ –24.283∗∗∗ –16.504∗∗∗ –17.251∗∗∗CER2 3.329∗∗∗ –2.229∗∗∗ 2.285∗∗∗CER3 8.040∗∗∗ –2.073∗∗∗ 7.650∗∗∗EU-Switzerland1 –24.872∗∗∗ –32.320∗∗∗ –28.599∗∗∗ –27.680∗∗∗
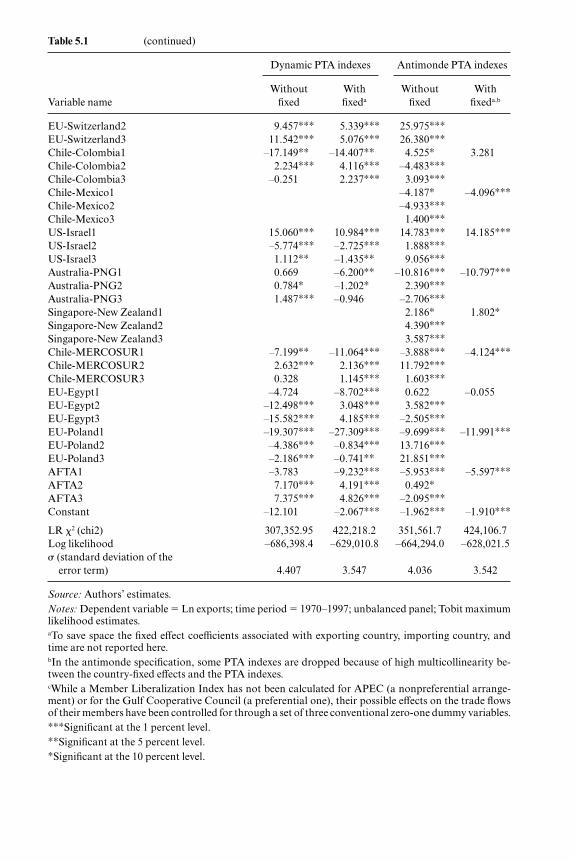
Table 5.1 (continued)
Dynamic PTA indexes Antimonde PTA indexes
Without With Without With Variable name fixed fixeda fixed fixeda,b
EU-Switzerland2 9.457∗∗∗ 5.339∗∗∗ 25.975∗∗∗EU-Switzerland3 11.542∗∗∗ 5.076∗∗∗ 26.380∗∗∗Chile-Colombia1 –17.149∗∗ –14.407∗∗ 4.525∗ 3.281Chile-Colombia2 2.234∗∗∗ 4.116∗∗∗ –4.483∗∗∗Chile-Colombia3 –0.251 2.237∗∗∗ 3.093∗∗∗Chile-Mexico1 –4.187∗ –4.096∗∗∗Chile-Mexico2 –4.933∗∗∗Chile-Mexico3 1.400∗∗∗US-Israel1 15.060∗∗∗ 10.984∗∗∗ 14.783∗∗∗ 14.185∗∗∗US-Israel2 –5.774∗∗∗ –2.725∗∗∗ 1.888∗∗∗US-Israel3 1.112∗∗ –1.435∗∗ 9.056∗∗∗Australia-PNG1 0.669 –6.200∗∗ –10.816∗∗∗ –10.797∗∗∗Australia-PNG2 0.784∗ –1.202∗ 2.390∗∗∗Australia-PNG3 1.487∗∗∗ –0.946 –2.706∗∗∗Singapore-New Zealand1 2.186∗ 1.802∗Singapore-New Zealand2 4.390∗∗∗Singapore-New Zealand3 3.587∗∗∗Chile-MERCOSUR1 –7.199∗∗ –11.064∗∗∗ –3.888∗∗∗ –4.124∗∗∗Chile-MERCOSUR2 2.632∗∗∗ 2.136∗∗∗ 11.792∗∗∗Chile-MERCOSUR3 0.328 1.145∗∗∗ 1.603∗∗∗EU-Egypt1 –4.724 –8.702∗∗∗ 0.622 –0.055EU-Egypt2 –12.498∗∗∗ 3.048∗∗∗ 3.582∗∗∗EU-Egypt3 –15.582∗∗∗ 4.185∗∗∗ –2.505∗∗∗EU-Poland1 –19.307∗∗∗ –27.309∗∗∗ –9.699∗∗∗ –11.991∗∗∗EU-Poland2 –4.386∗∗∗ –0.834∗∗∗ 13.716∗∗∗EU-Poland3 –2.186∗∗∗ –0.741∗∗ 21.851∗∗∗AFTA1 –3.783 –9.232∗∗∗ –5.953∗∗∗ –5.597∗∗∗AFTA2 7.170∗∗∗ 4.191∗∗∗ 0.492∗AFTA3 7.375∗∗∗ 4.826∗∗∗ –2.095∗∗∗Constant –12.101 –2.067∗∗∗ –1.962∗∗∗ –1.910∗∗∗
LR 2 (chi2) 307,352.95 422,218.2 351,561.7 424,106.7Log likelihood –686,398.4 –629,010.8 –664,294.0 –628,021.5 (standard deviation of the
error term) 4.407 3.547 4.036 3.542
Source: Authors’ estimates.Notes: Dependent variable � Ln exports; time period � 1970–1997; unbalanced panel; Tobit maximumlikelihood estimates.aTo save space the fixed effect coefficients associated with exporting country, importing country, andtime are not reported here.bIn the antimonde specification, some PTA indexes are dropped because of high multicollinearity be-tween the country-fixed effects and the PTA indexes.cWhile a Member Liberalization Index has not been calculated for APEC (a nonpreferential arrange-ment) or for the Gulf Cooperative Council (a preferential one), their possible effects on the trade flowsof their members have been controlled for through a set of three conventional zero-one dummy variables.∗∗∗Significant at the 1 percent level.∗∗Significant at the 5 percent level.∗Significant at the 10 percent level.

Overall, the main PTAs—NAFTA, the European Community (EC/EU), MERCOSUR, and CER—as well as many bilateral agreements notconsidered previously, are found here to have created negative net tradeeffects. However, there is a qualification to this finding. In agreements witha small number of members, the intra-PTA effect is estimated imprecisely,with a large standard error, while the extra-PTA effect can be estimatedmore accurately.9 Thus, the findings for those PTAs, such as CER, with asmall number of members are less robust than those for larger PTAs. In ad-dition, the measures of distance used in this study are unlikely to capturefully the ways in which changes in trading patterns and reductions in trans-port costs have raised the attractiveness of extrabloc as opposed to intra-bloc trade for CER members over time.
As noted, the net trade effect criterion has limitations in assessing theeffects on economic welfare. Nonetheless the new evidence suggests nega-tive net trade effects for many PTAs, controlling for other factors.
A number of factors have contributed to the more negative findings inthis study. These are now considered in turn.
All the past gravity model studies surveyed here estimated the PTAeffects using PTA dummies defined in antimonde form.10 The comparable
150 Philippa Dee and Jyothi Gali
9. For example, the intra-CER dummy has positive values only for 14 � 15 � 210 observa-tions and zero for remaining observations.
10. A more recent study with panel data and dynamic dummies is by Fukao, Okubo, andStern (2003).
Table 5.2 New evidence on PTAs as causing net trade creation or diversion
Past estimates New estimates
Net trade Net trade Net trade Net trade creation Inconclusive diversion creation diversion
Andean LAIA NAFTA Andean AFTACER MERCOSUR LAFTA/LAIA EFTA
AFTA United States-Israel EC/EUEEC/EU? SPARTECA MERCOSUR
EFTA? NAFTACER
EU-SwitzerlandChile-ColombiaAustralia-PNG
Chile-MERCOSUREU-EgyptEU-Poland
Sources: Past estimates assessment based on the findings from a majority of the followingstudies: Bayoumi and Eichengreen (1995), Frankel, Stein, and Wei (1995), Boisso and Fer-rantino (1997), Frankel (1997), Fink and Primo Braga (1999), Krueger (1999b), Li (2000),Clark and Tavares (2000), Freund (2000), Gilbert, Scollay, and Bora (2001), and Soloaga andWinters (2001); table 5.1 source.

dynamic and antimonde estimates in this analysis are reported in table 5.1.They show that when PTA dummies are defined in antimonde form, the nettrade effects are mainly positive, in contrast to the negative effects obtainedfor dynamic PTA variables.
In essence, when dummies are defined in dynamic form, the test for sig-nificance of their coefficients is a statistical test for whether the trade effectsthey capture are stronger after the formation or expansion of the PTA thanbefore. In the past, this question has been assessed, at best, only by refer-ence to the point estimates from various cross sections. Defining PTA dum-mies in dynamic form provides a more stringent statistical test of whetherit was PTA formation, rather than some other set of factors specific to thebilateral country pair, accounting for the observed trade effects. The powerof the test is further strengthened by the fact that individual country- andtime-specific effects are controlled for separately, through the fixed effects.The more stringent test of the before and after effects of PTAs is the majorfactor accounting for the more negative findings of this study.
The differences are more prominent for the EC/EU and MERCOSURagreements, where membership dynamics play an important role in theirtrade creation and diversion effects. For example, a significant negativeintra-EU effect is found when using dynamic PTA specific indexes, com-pared to a significant positive effect found using antimonde indexes. Thedynamic dummies account for individual countries switching from the Eu-ropean Free Trade Agreement (EFTA) to the EU.
Another reason for the more negative findings in this study is the use ofpanel analysis, which allows unobservable heterogeneity to be controlledfor. Without allowing for country-specific effects, the coefficients on boththe PTA variables and the other explanatory variables tend to be upwardbiased as are the test statistics for the significance of these variables. Thelikelihood-ratio test confirms the joint significance of the fixed effects.11
This suggests that inferences based on past gravity model estimates with-out fixed effects suffer from omitted variable bias. Controlling for unob-servable heterogeneity is another reason for the more negative findings inthis study.12
A model with the average bilateral tariff variable as an additional deter-minant of trade is estimated on a restricted data set,13 and the results areshown in table 5.3. The average tariff rate in the importing country has a
The Trade and Investment Effects of Preferential Trading Arrangements 151
11. The calculated test statistic of 114,775.3 clearly rejects the null hypothesis, as is expectedgiven the individual significance of most of the country- and time-specific fixed effects in themodel.
12. The findings here are also more negative than those in a recent panel study by Clarete,Edmonds, and Wallack (2003). However, their study uses antimonde dummies and fails tocontrol for unobserved country- and time-specific heterogeneity. It also controls for fewer ob-servable factors than here.
13. The data set is restricted because of the lack of bilateral tariff data for a number of coun-tries and for a number of years.

Table 5.3 Gravity model of trade: Results from limited sample with tariff variable included
Dynamic PTA specific Antimonde PTA specific variables—fixed effectsa variables—fixed effectsa,b
Without With Without With Variable name tariff tariff tariff tariff
Ln sum of exporting and importing countries GDP (SUM) 2.063∗∗∗ 2.036∗∗∗ 2.838∗∗∗ 2.869∗∗∗
Similarity in exporting and importing country’s GDPs 0.562∗∗∗ 0.542∗∗∗ 1.534∗∗∗ 1.557∗∗∗
Ln of absolute differences in per capita GDPs of exporting and importing country –0.154∗∗∗ –0.086∗∗∗ –0.100∗∗∗ –0.031
Ln distance –1.404∗∗∗ –1.393∗∗∗ –1.458∗∗∗ –1.469∗∗∗Ln bilateral real exchange rate 0.494∗∗∗ 0.513∗∗∗ 0.448∗∗∗ 0.454∗∗∗Ln tariff –0.134∗∗∗ –0.142∗∗∗Linguistic similarity 0.000∗∗∗ 0.000∗∗∗ 0.000∗∗∗ 0.000∗∗∗Colonial 1.141∗∗∗ 1.087∗∗∗ 1.170∗∗∗ 1.113∗∗∗Border –0.099 –0.052 –0.138 –0.079Currency union 0.230 0.425 0.203 0.421Exporting country is an island –0.718∗∗∗ –0.746∗∗∗ –0.472∗∗∗ –0.492∗∗∗Importing country is an island 1.177∗∗∗ 1.338∗∗∗ 4.027∗∗∗ 4.380∗∗∗Exporting country is landlocked –1.402∗∗∗ –1.315∗∗∗ –1.251∗∗∗ –1.166∗∗∗Importing country is landlocked –0.236 –0.300 0.421∗∗ 0.429∗∗Third-wave provisions of PTAs 1.222 1.748 –1.328 –2.067Andean1 5.702∗∗∗ 5.545∗∗∗ 5.123∗∗∗ 5.123∗∗∗Andean2 –8.696∗∗∗ –8.485∗∗∗ 2.428∗∗ 3.014∗∗∗Andean3 –1.503∗∗∗ –1.461∗∗∗ 9.368∗∗∗ 9.130∗∗∗APEC1c 0.929∗∗∗ 1.032∗∗∗ 0.931∗∗∗ 1.029∗∗∗APEC2c –0.839∗∗∗ –0.817∗∗∗ –6.988∗∗∗ –7.133∗∗∗APEC3c 3.062∗∗∗ 2.994∗∗∗ 3.500∗∗∗ 3.414∗∗∗EFTA1 0.203 0.796 3.117 2.963EFTA2 12.657∗∗∗ 14.513∗∗∗EFTA3 11.631∗∗∗ 11.115∗∗∗ 8.552∗∗∗ 8.364∗∗∗EU1 –3.231∗∗∗ 3.626∗∗∗ 5.341∗∗∗EU2 5.184∗∗∗ 6.189∗∗∗ 1.118∗∗ 2.207∗∗∗EU3 –0.572 –0.289 –5.442∗∗∗ –5.031∗∗∗GCC1c 2.348 2.406 2.210 2.217GCC2c –0.537 0.173 –1.452GCC3c –0.186∗∗ –0.267∗∗∗ 0.051 –0.026LAIA1 16.159∗∗∗ 16.046∗∗∗ 17.917∗∗∗ 17.605∗∗∗LAIA2 23.259∗∗∗ 24.735∗∗∗LAIA3 15.478∗∗∗ 14.820∗∗∗ –16.838∗∗∗ –16.752∗∗∗MERCOSUR1 –1.432 –1.132 3.227 3.169MERCOSUR2 –8.512∗∗∗ –8.380∗∗∗MERCOSUR3 1.793∗∗∗ 1.969∗∗∗ 18.830∗∗∗ 18.874∗∗∗NAFTA1 –2.800 –2.692 2.551 3.315NAFTA2 13.591∗∗∗ 14.416∗∗∗ 29.870∗∗∗ 31.170∗∗∗NAFTA3 –8.453∗∗∗ –8.562∗∗∗ –8.137∗∗∗ –8.385∗∗∗SPARTECA1 17.033∗∗∗ 18.523∗∗∗ 17.702∗∗∗ 19.271∗∗∗SPARTECA3 –11.930∗∗∗ –12.128∗∗∗ –14.163∗∗∗ –14.880∗∗∗CER1 –8.356∗∗ –8.976 –6.959∗∗ –7.056∗∗

Table 5.3 (continued)
Dynamic PTA specific Antimonde PTA specific variables—fixed effectsa variables—fixed effectsa,b
Without With Without With Variable name tariff tariff tariff tariff
CER2 4.704∗∗∗ 5.267∗∗ 9.138∗∗∗ 9.382∗∗∗CER3 8.616∗∗∗ 8.523∗∗∗ 7.378∗∗∗ 7.396∗∗∗EU-Switzerland1 –15.405∗∗∗ –14.934∗∗∗ –15.718∗∗∗ –15.541∗∗∗EU-Switzerland3 17.254∗∗∗ 16.723∗∗∗ 21.229∗∗∗ 20.401∗∗∗Chile-Colombia1 0.079 0.416 –1.304 –0.673Chile-Colombia2 3.275∗∗∗ 3.013∗∗∗ –18.101∗∗∗ –18.457∗∗∗Chile-Colombia3 –0.705 –0.545 4.641∗∗∗ 4.742∗∗∗Chile-Mexico1 –4.612 –4.405Chile-Mexico2 49.545∗∗∗ 50.383∗∗∗Chile-Mexico3 4.116∗∗∗ 4.243∗∗∗US-Israel1 7.763 10.386∗ 10.255∗ 13.218∗∗US-Israel3 11.120∗∗∗ 10.649∗∗∗ 10.811∗∗∗ 10.341∗∗∗Australia-PNG1 –1.166 –2.097 –3.080 –5.104Australia-PNG3 –1.492∗ –1.382 –3.609∗∗∗ –3.157∗∗∗Singapore-NZ1 –0.235 1.892Singapore-NZ3 1.307∗∗∗ 1.455∗∗∗Chile-MERCOSUR1 –3.654∗ –3.440 –3.682∗∗∗ –3.478∗∗∗Chile-MERCOSUR2 1.403∗∗∗ 1.321∗∗∗ –4.953∗∗∗ –4.780∗∗∗Chile-MERCOSUR3 –1.171∗∗ –1.148∗∗ –2.080∗∗ –2.222∗∗EU-Egypt1 5.573 5.454 5.688∗∗ 4.870∗EU-Egypt3 0.682 0.144 0.336 0.006EU-Poland1 2.517 1.837 –3.763∗∗ –4.049∗∗EU-Poland2 –1.457∗∗∗ –0.600∗EU-Poland3 2.099∗∗∗ 1.956∗∗∗ 10.075∗∗∗ 9.820∗∗∗AFTA1 –9.693∗∗∗ –8.204∗ –9.629∗∗∗ –8.946∗∗∗AFTA2 –0.484 0.354AFTA3 3.060∗∗∗ 2.827∗∗∗ 0.572 0.222
LR 2 (chi2) 32,088.3 28,186.5 33,800.9 29,892.8Log likelihood –77,034.8 –71,010.6 –76,178.6 –70,157.4 (standard deviation of the error term) 2.859 2.855 2.776 2.766
Source: Authors’ estimates.Notes: Dependent variable � Ln exports; time period � 1998–1997; unbalanced panel; Tobit maximumlikelihood estimates.aTo save space, the fixed effect coefficients associated with exporting country, importing country, andtime are not reported here.bIn the antimonde specification, some PTA indexes are dropped because of high multicollinearity be-tween country-fixed effects and PTA indexes.cWhile a Member Liberalization Index has not been calculated for APEC (a nonpreferential arrange-ment) or for the Gulf Cooperative Council (a preferential one), their possible effects on the trade flowsof their members have been controlled for through a set of three conventional zero-one dummy variables.∗∗∗Significant at the 1 percent level.∗∗Significant at the 5 percent level.∗Significant at the 10 percent level.

significant and negative effect on its imports, as expected. The PTA-specific indexes also show a significant effect. This is because they capturenot only the existence of tariff preferences (as also captured in the tariffvariable) but also the effects of nontariff measures affecting merchandisetrade, such as rules of origin.
The coefficients on the PTA-specific indexes are generally not sensitiveto the inclusion or exclusion of the tariff variable. So the inclusion of a tariffvariable makes little difference to the main findings of this study. But insome cases, negative intrabloc trade effects in the full sample become pos-itive in the smaller sample. And perhaps not surprisingly, while the com-parative advantage motivation for trade showed as significant in the fullsample (with a positive and significant coefficient on the difference in percapita GDP), this is not the case in the restricted sample. These differencesalso show that what constitutes “normal” trade is conditioned by howmany countries and years are in the sample—those studies with restrictedtime and country coverage, particularly where it is restricted to high-income developed countries, are likely to have results biased accordingly.
The nonmerchandise provisions show a positive (complementary) rela-tionship with trade when PTA indexes are defined dynamically. Thus fa-vorable investment and services trade provisions in PTAs can enhancemerchandise trade between member countries once the agreement is in op-eration.
In summary, the main result is that PTAs are not as relatively benign asprevious studies have indicated. After controlling for country- and time-specific effects and the degree of liberalization of merchandise trade provi-sions in an unrestricted sample and testing explicitly for whether the tradeeffects are significantly different after PTA formation than before, mostPTAs were estimated to have negative trade creation. Other recent empiri-cal assessments have shown a more optimistic outlook for trade in prefer-ential agreements by ignoring these analytical issues.
One potential puzzle is that the intrabloc effect is found to be negative forapparently more comprehensive and liberal PTAs—EU, CER, NAFTA,MERCOSUR and some of the recent bilateral agreements. One possiblereason is that total elimination of tariffs among members, as required bythe General Agreement on Tariffs and Trade (GATT) Article XXIV, maynot be optimal for members. For example, Frankel, Stein, and Wei (1995)found that a 22 percent reduction in tariffs below multilateral tariff levelsmay instead be optimal. However, this finding is driven by welfare effects,not by trade volume effects.
A more likely explanation is that, although the merchandise MLI usedin this study has attempted to capture the potentially trade-restrictive ef-fects of the nontariff merchandise trade provisions embodied in PTAs, ithas not always captured them adequately. For example, as noted earlier, themerchandise MLI has treated the trade restrictive effects of rules of origin
154 Philippa Dee and Jyothi Gali

as being additive to and independent from the other provisions of PTAs. Inreality, not only are rules of origin restrictive, they are also likely to neu-tralize or even reverse the trade effects of other provisions that are appar-ently quite liberal.14
The way in which rules of origin can operate in practice to counter theeffects of other provisions that are apparently quite liberal can be seenmost clearly in the case of NAFTA. There, the rules of origin are relativelycomplex—the specification of requirements for minimum change in tariffheading vary product by product and take up several hundred pages. Fur-ther, they are strictly enforced. The domestic content rules applied in theEU are also relatively complex. Even if the tariffs on each product are elim-inated entirely (an apparently quite liberal provision), the complex rules oforigin governing the sourcing of inputs to qualify for the tariff concessionon output can undo the liberal effect of the tariff concession on output.This is not recognized in the MLI, which treats tariff provisions and rulesof origin additively, not interactively. Thus, the MLI may overstate theeffective amount of liberalization in agreements with complex rules of ori-gin, explaining why it was that the apparently more comprehensive and lib-eralized PTAs were found to have a negative intrabloc effect, relative to av-erage trade patterns in the sample.
Sensitivity Analysis
The preceding model specification differs from standard specificationsin several respects. One is the inclusion of the sum of importing and ex-porting country GDPs, rather than each country’s GDP separately. Asnoted, this comes from a model of product differentiation originating withHelpman and Krugman (1985) and Helpman (1987). But in the originalmodel, the dependent variable was total bilateral trade—the sum of ex-ports in both directions—rather than bilateral exports. This paper has fol-lowed Egger (2001) and others by using bilateral exports as the dependentvariable to allow a more refined examination of the trade diversion issue.And the resulting estimate of the coefficient on the sum of GDPs is verysimilar to that of Egger (2001). But the question arises whether the resultsare sensitive to this treatment of GDPs, especially given the redefinition ofthe dependent variable. To test this, the preceding model was reestimatedwith (the log of) GDPs of importing and exporting country entered sepa-rately. The coefficient on the exporting country’s GDP was 1.118, and thecoefficient on the importing country’s GDP was 0.766, with the sum beingclose to the result in table 5.1. In all other respects, the results were similarto those shown in table 5.1. The results are available on request from theauthors.
The Trade and Investment Effects of Preferential Trading Arrangements 155
14. For analyses of the welfare effects of rules of origin, see Duttagupta and Panagariya(2003), Krueger (1999a), Ju and Krishna (1998), and Krishna and Krueger (1995).

The specification also differs from some others by using triple-indexedfixed effects, controlling separately for importing country, exporting coun-try, and time-related unobservable effects. This is in contrast to specifica-tions that use a single country-pair fixed effect as well as a time effect. Asnoted, the triple-indexed approach was advocated by Matyas (1997, 1998)for econometric reasons. It is also the approach needed to control for themisspecifications identified by Haveman and Hummels (1998) and Ander-son and van Wincoop (2003). Haveman and Hummels note that total ex-ports are likely to be a better measure of “economic mass” than GDP.Gravity models are likely to be misspecified when bilateral exports growfaster than GDP simply because total exports grow faster than GDP, notbecause of some PTA effect. The extent to which total exports grow fasterthan GDP is an individual country effect, not a country-pair effect. Simi-larly, Anderson and van Wincoop (2003) note that in the correct theoreti-cal specification, bilateral trade flows should depend on three measures oftrade barriers—the bilateral trade barrier between the two countries andeach country’s resistance to trade with all regions. Again, the two latter re-sistance effects are country effects, not country-pair effects.
It was not possible to test the sensitivity of the preceding Tobit specifi-cation to the inclusion of a country-pair fixed effects because there weretoo many country-pair groups, preventing estimation. The approach alsorisks overspecification, with the country-pair effects duplicating much ofthe work of the PTA dummies.
A final piece of sensitivity analysis is the inclusion of a lagged depend-ent variable. Appropriate econometric estimation of such a specification ina Tobit context with fixed effects is unlikely to have been possible on a dataset of this size. In many other contexts, ordinary least squares (OLS) wouldbe an acceptable alternative to Tobit estimation in practice, with the resultsnot differing greatly between the two estimation methods. Were this thecase here, it would have been possible to test sensitivity to the inclusion ofa lagged dependent variable in an OLS context. However, Tobit estimationmatters greatly here, as would be expected with 44 percent of the observa-tions on the dependent variable being zero. The OLS estimation of theoriginal triple indexed specification on the full sample (with zero exportvalues replaced by small positive numbers) led to results with a coefficienton the sum of GDPs being unreasonably low, at 0.555, and similar down-ward bias in other coefficients, including those on distance, currencyunion, and the PTA dummies. Thus the results of further sensitivity anal-ysis on the OLS specification were judged unreliable. For what it is worth,adding a lagged dependent variable produced short-run coefficients evenlower than the already low OLS estimates, while the value of the coefficienton the lagged dependent variable itself implied long-run coefficients some-what higher than the OLS estimates. In all other respects, the results wereunchanged.
156 Philippa Dee and Jyothi Gali

5.3.4 New Evidence on Investment Creation and Diversion
The observable effects—normal bilateral investment determinants andtraditional and third-wave provisions of PTAs—and unobservable coun-try- and time-specific effects all significantly influence the bilateral stock ofoutward investment (see table 5.4).15
The signs of coefficients on the normal bilateral investment determi-nants are generally as expected. Larger absolute differences in per capitaGDP are associated with outward FDI being lower than otherwise. Be-cause absolute differences in per capita GDP also boost bilateral exports,the results lend some support to the idea that trade and FDI are substituteswhen trade is motivated by differences in factor endowments (Markusen1983). Only if investment treaties are enacted between countries do theyhave a significant positive effect on outward investment. When they aresigned but not enacted, they tend to suppress outward investment. Thepresence of a currency union has no significant effect on outward FDI, al-though it had a significant and positive effect on bilateral exports.
PTAs have been categorized in table 5.5 according to whether invest-ment responds in either tariff-jumping or beachhead fashion to the tradeprovisions or whether it responds instead primarily to the nonmerchandisetrade provisions. A single PTA can fall into more than one category.
Only the South Pacific Regional Trade and Economic CooperationAgreement (SPARTECA) and Andean agreements showed weak evidenceof investment behavior responding in beachhead fashion to the trade pro-visions of the agreement. SPARTECA is a nonreciprocal agreement be-tween Australia, New Zealand, and selected South Pacific Island countrieswith few nontrade provisions and with trade provisions only for selectedproducts. But the nonreciprocal tariff preferences may have allowed thePacific island countries to attract investment, not only from Australia andNew Zealand, but also from other countries, to gain preferential access tothe CER market.
Empirical evidence is weak for Ethier’s more general view that PTAmembers can attract investment from nonmember countries, once otherobservable and unobservable factors are controlled for. In four agreementsthe trade provisions appear to have encouraged inward FDI from thirdparties—the Andean Pact, SPARTECA, ASEAN Free Trade Agreement(AFTA) and NAFTA—but in no case was the effect significant, and onlyin the first two agreements was the effect also associated with an increasein intrabloc trade (defining beachhead investment). In three agreements,it was the nontrade provisions that encouraged inward FDI from thirdparties—NAFTA, EU, and SPARTECA—but only in the first case was theeffect significant. Thus when a PTA had a significant effect on inward FDI
The Trade and Investment Effects of Preferential Trading Arrangements 157
15. The results in table 5.4 differ slightly from those in earlier versions of this paper.

Table 5.4 Gravity model of investment
Dynamic PTA indexes
Variable namec Without fixedb With fixeda,b
Ln sum of exporting and importing countries GDP (SUM) 1.496∗∗∗ 1.152∗∗∗Similarity in exporting and importing country’s GDPs 0.086 –0.058Ln of absolute differences in per capita GDPs of exporting
and importing country –0.487∗∗ –0.603∗∗∗Ln distance –0.682∗∗∗ –0.572∗∗∗Ln bilateral real exchange rate 0.335∗∗ –0.242∗Ln tariff 0.013 0.001Linguistic similarity 0.000∗∗∗ 0.000∗∗∗Colonial 1.601∗∗∗ 1.285∗∗∗Border 0.615∗∗ 0.595∗∗Currency union –0.716 –1.162Home country is an island –3.577∗∗∗ –3.212∗∗∗Host country is an island –1.004∗∗∗ –1.174∗∗∗Home country is landlocked –2.842∗∗∗ –3.122∗∗∗Host country is landlocked 0.396 0.583∗∗Investment treaties signed –1.525∗∗∗ –1.782∗∗∗Investment treaties enacted 1.029∗∗ 1.055∗∗M-ANDEAN1 –4.664 –6.121M-ANDEAN2 0.410M-ANDEAN3 0.557M-APEC1d –0.117 –0.179M-APEC2d –0.555∗∗ –0.259M-APEC3d –1.339∗∗∗ –2.255∗∗∗M-EFTA1 3.090 1.433M-EFTA2 1.139M-EFTA3 1.837∗M-EU1 0.537 1.662M-EU2 –0.559 –2.172M-EU3 0.111M-NAFTA2 2.277M-NAFTA3 2.995M-SPARTECA1 11.279 10.430M-SPARTECA2 3.309M-SPARTECA3 –8.729∗∗∗M-CER1 –1.720 –0.026M-CER2 –2.385M-CER3 10.641∗∗∗M-US-Israel2 –6.742∗∗M-US-Israel3 –5.725F-ANDEAN1 1.234 5.590F-ANDEAN2 –11.326∗∗ –10.022∗∗F-ANDEAN3 –8.575 –19.530∗F-APEC1d 0.095 0.003F-APEC2d 0.813∗∗∗ 0.976∗∗∗F-APEC3d 0.553∗ 1.820∗∗∗F-EFTA1 14.308 –12.698F-EFTA2 –16.474 –39.673∗∗∗F-EFTA3 138.905∗∗∗ 170.216∗∗∗F-EU1 1.812 2.471F-EU2 2.136 0.795

Table 5.4 (continued)
Dynamic PTA indexes
Variable namec Without fixedb With fixeda,b
F-EU3 12.840∗∗∗ 17.634∗∗∗F-NAFTA1 –9.503∗ –5.457F-NAFTA2 5.802∗∗∗ 3.147∗F-NAFTA3 13.650∗∗∗ 10.317∗∗∗F-SPARTECA2 126.591 148.125F-CER1 –0.647 3.999F-CER2 1.617 –2.509F-CER3 31.455∗∗∗ 23.847∗∗∗F-United States-Israel1 6.865 –8.098F-United States-Israel2 –0.754 8.118F-United States-Israel3 21.867∗ 54.425∗∗∗
LR 2 (chi2) 1,113.8 1,444.7Log likelihood –2,192.9 –2,027.5 (standard deviation of the error term) 1.875 1.609
Source: Authors’ estimates.Notes: Dependent variable � Ln stock of outward investment; time period � 1988–1997; unbalancedpanel; Tobit maximum likelihood estimates.aTo save space, the fixed effect coefficients associated with home country, host country, and time are notreported here.bSome PTA indexes are dropped because of high multicollinearity among explanatory variables.c“M” before each PTA name denotes index of traditional merchandise trade provisions, and “F” beforeeach PTA name denotes index of new age provisions.dWhile a Member Liberalization Index has not been calculated for APEC (a nonpreferential arrange-ment), its possible effects on the trade flows of its members has been controlled for through a set of threeconventional zero-one dummy variables.∗∗∗Significant at the 1 percent level.∗∗Significant at the 5 percent level.∗Significant at the 10 percent level.
Table 5.5 Main drivers of investment in PTAs
No measurable Tariff-jumping effects Beachhead effects Nontrade impact of trade provision of trade provisions provisions
MERCOSURa EFTA SPARTECAb AndeanAFTAa CER Andeanb EFTA
EUNAFTA
CERUnited States-Israel
Source: Table 5.4.aPTA indexes for these agreements were dropped because of high multicollinearity among theexplanatory variables.bOnly weak evidence for this characterization because the coefficients are not significant.

from third parties, it was in response to the nontrade rather than the tradeprovisions. It appears that Ethier’s beachhead investment is not an impor-tant phenomenon empirically.
The EFTA and CER agreements showed evidence of investment behav-ior consistent with an unwinding of tariff-jumping behavior. But both ofthese agreements also showed significant evidence of investment respond-ing to the nontrade provisions of the agreement. A total of five of the ninePTAs examined for investment effects showed significant evidence of in-vestment responding to the nontrade provisions of the agreements.
While table 5.5 indicates investment responses to the traditional andthird-wave provisions of PTAs, it does not indicate whether PTAs causedinvestment creation or investment diversion per se. A summary of the signsof the significant coefficients is reported in table 5.6.
As noted, the trade provisions of PTAs did not result in a significant in-crease in investment from nonmembers in any PTA. Trade provisionscaused a reduction in outward investment (investment diversion) inSPARTECA but an increase in outward investment in EFTA and CERconsistent with the unwinding of tariff-jumping investment.
The new age provisions in various PTAs have had a more widespread im-pact on investment than the trade provisions. The NAFTA agreement wasestimated to have reduced investment among members. All other agree-ments considered had no significant effects on investment among mem-bers.
While NAFTA attracted investment from nonmembers, particularlyinto Mexico, the new age provisions in the Andean Pact and EFTA wereunable to attract investment from nonmembers. For EFTA, the loss ofmembership to EU made it a less attractive place for foreign direct invest-ment. This is similar to the findings of Baldwin, Forslid, and Haaland(1995), who found that EC caused a diversion of third-country capital
160 Philippa Dee and Jyothi Gali
Table 5.6 New evidence on investment creation and diversion
Trade provisions Third-wave provisions
Extra-PTA Extra-PTA Extra-PTA Extra-PTA (inward) (outward) Intra-PTA (inward) (outward)
United States-Israel(–) EFTA(�) NAFTA(–) Andean(–) Andean(–)CER(�) EFTA(–) EFTA(�)
SPARTECA(–) NAFTA(�) EU(�)NAFTA(�)
CER(�)United States-Israel(�)
Source: Table 5.4, significant coefficients.Note: Positive (�) symbol denotes investment creation, and negative (–) symbol denotes investment di-version.

from EFTA to the EU. The Andean Pact was similarly affected by the lossof Peru, although the findings for Latin American countries are also af-fected by incompleteness of the FDI outstock data.
The sum of significant coefficients on the indexes of third-wave provi-sions for each PTA can provide an indicative measure of the impact ofthese new age provisions on net investment creation (see table 5.7). Of thenine PTAs examined for investment effects, five showed positive net invest-ment effects. Only the Andean Pact caused net investment diversion. Thisagreement apparently caused a reduction in both inward and outward in-vestment with third parties, without succeeding in causing a significantboost in intrabloc investment. As noted, this result may in part reflect in-completeness in the FDI outstock data for Latin America.
The North American Free Trade Agreement, EU, EFTA, CER, and theUS-Israel agreement caused net investment creation, not because theystimulated investment among members, but primarily because they appearto have stimulated outward investment from member to nonmember coun-tries. This is consistent with some of the nontrade provisions of theseagreements being nonpreferential in nature. It is also consistent with someof these regions being major sources of FDI, but this suggests that the es-timated effects may well reflect the influence of causal factors not con-trolled for in the analysis that make these countries net capital exporters,rather than the effects of PTA formation and expansion per se. One ex-ample is financial deregulation and the growth of superannuation fundsthat have encouraged Australia to become a much more important capitalexporter recently (Battellino 2002).
The South Pacific Regional Trade and Economic Cooperation Agree-ment had no significant impact on net investment creation, while theeffects of MERCOSUR and AFTA on investment could not be distin-guished because of problems of multicollinearity.
Though the investment results appear to be more positive than the re-sults reported for trade, there are number of qualifications that need to beconsidered. Winters (1997) argued that new FDI from any source could go
The Trade and Investment Effects of Preferential Trading Arrangements 161
Table 5.7 Net impact of PTAs’ third-wave provisions on investment
Net investment creation Net investment diversion No measurable impact
EFTA Andean MERCOSURa
EU AFTAa
NAFTA SPARTECACER
United States-Israel
Source: Table 5.4, fixed effects estimates, significant coefficients.aPTA indexes for these agreements were dropped because of high multicollinearity among theexplanatory variables.

into the production of goods for trade diversion and thus worsen the PTA’swelfare overall. In similar tone, McLaren (2002) argued that
A regional trade regime can plausibly be interpreted as a coordinationfailure, in which the anticipation that the world will break into regionaltrade blocs induces sunk private sector investments that then lead to ademand for regionalism. Under this argument, regionalism can bePareto-worsening even though once sunk investments have been made itis, ex post, a relatively efficient compromise: hence, regionalism is “in-sidious,” the damage it does to efficiency is hidden in the distortion of exante investments. (McLaren 2002, 572)
The gravity model estimates provide indications of the positive net in-vestment effects of PTAs but do not consider whether the resulting invest-ment contributes to trade diversion.
Further, as noted before, a finding of net investment creation is a weakindicator of whether the welfare gains from investment creation outweighthe costs of investment diversion. Investment diversion may dominate cre-ation in welfare terms, even if it does not in “volume of investment” terms.On the other hand, if the nontrade provisions reduce restrictions that raisecosts, member countries can gain in welfare terms, despite investment di-version. But in either case, members could well gain even more frommultilateral liberalization of nontrade restrictions.
5.4 Summary
Theoretical work has always highlighted that while the merchandisetrade provisions of PTAs can boost trade among members, this is often atthe expense of nonmembers. So whether it benefits a country to join a PTAdepends on the cost structures in partner countries, compared with the coststructures in third parties. If a preferential trade arrangement diverts acountry’s imports from a low-cost third party to a higher-cost preferentialtrade partner, it can be made worse off. Conversely, the opportunity forbenefits is greater where the PTA partner is at world-best competitivenessand where liberalization under the PTA encourages imports from thatsource.
The new empirical work outlined in this paper suggests that of the eight-een recent PTAs examined in detail, twelve have diverted more trade fromnonmembers than they have created among members. What is more, someof the apparently quite liberal PTAs—including EU, NAFTA andMERCOSUR—have failed to create significant additional trade amongmembers (relative to the average trade changes registered among coun-tries in the sample).
Part of the reason for this more negative finding than in previous studiesis the rigorous statistical test that has been applied to ascertain whether
162 Philippa Dee and Jyothi Gali
intrabloc trade is significantly greater after bloc formation (or expansion)than before. In the past, this was assessed, at best, only by reference to thepoint estimates from various cross sections. But the finding is also consis-tent with the observation that many of the provisions needed in preferen-tial arrangements to underpin and enforce their preferential nature—suchas rules of origin—are in practice quite trade restricting.
While the increasing focus of PTAs on nontrade provisions may suggestthat conventional concerns about trade diversion are outmoded, some the-oretical literature suggests this conclusion would be premature.
On the one hand, in an increasingly integrated world economy, even mi-nor trade concessions can have a significant impact on investment flows.And if investment is attracted into one PTA partner in order to serve themarkets of the others, then the trade from such beachhead positions canconstitute traditional trade diversion.
On the other, the nontrade provisions of PTAs, particularly those relatedto investment and services, can also have a significant impact on investmentflows. But the preferential nature of the PTA provisions may mean that in-vestment is diverted from a low-cost to a higher-cost host country, andsuch investment diversion can also be harmful.
The empirical work in this paper finds little evidence of beachhead in-vestment, or an unwinding of tariff-jumping investment, in response to thetrade provisions of PTAs. Only for SPARTECA and the Andean Pact, forexample, is there (weak) evidence of FDI responding in beachhead fashionto trade provisions. And only for EFTA and CER is there some evidenceof an unwinding of tariff-jumping investment.
There is evidence that FDI responds significantly to the nontrade pro-visions of PTAs. And in five of the nine PTAs examined for investmenteffects, the nontrade provisions led to net investment creation.
Although it is a weak test, this suggests that on balance, the nontradeprovisions of these PTAs have created an efficient geographic distributionof FDI. This is consistent with the fact that at least some of the nontradeprovisions (e.g., commitments to more strongly enforce intellectual prop-erty rights) are not strongly preferential in their nature.
Further, the theoretical literature has stressed that if the nontrade barri-ers are of the sort to raise the real resource costs of doing business, ratherthan simply to create rents that raise prices above costs, then preferentialliberalization will be beneficial, even in the absence of net investment cre-ation.
However, the trade that may be generated from the new FDI positionsmay still be diverted in the wrong direction in response to the trade provi-sions of PTAs and may therefore contribute to the net trade diversion alsofound here.
Thus the results of this paper suggest that there may be economic gainsfrom the nontrade provisions of third-wave PTAs, but they also suggest
The Trade and Investment Effects of Preferential Trading Arrangements 163

that there are still economic costs associated with the preferential nature ofthe trade provisions. And these costs could be magnified in a world of in-creasing capital mobility.
Thus the findings of this research on the effects of the nontrade provi-sions of PTAs are more positive than those on the trade provisions. Thissuggests there could be real benefits if countries could use regional negoti-ations to persuade trading partners to make progress in reforming suchthings as investment, services, competition policy, and government pro-curement, especially if this is done on a nonpreferential basis.
Appendix
The Static Welfare Effects of PTAs
In figure 5A.1, Sa and Da are the domestic supply and demand curves incountry A. Sb is the supply curve of imports from the PTA partner country,showing that any quantity can be supplied from there at the price Pb. Sw isthe supply curve of imports from the rest of the world, showing that anyquantity can be supplied from there at price Pw . P∗
a is the initial, tariff-inflated price in country A, with the tariff t equal to P∗
a – Pw . Initially all im-ports Qc – Qp come from the rest of the world, as with the same tariff tplaced on imports from B, the local price in country A would exceed P∗
a.The tariff revenue on the imports from the rest of the world is AEJF. Thequantity produced domestically is Qp , and domestic consumption is Qc .
Now suppose that country A eliminates its tariff on imports from B but
164 Philippa Dee and Jyothi Gali
Fig. 5A.1 An illustration of trade creation and diversion effects of a PTA

retains it on imports from the rest of the world. With imports now availablefrom B at Pb , the import quantity expands to Q�c – Q�p , with country B ratherthan the rest of the world becoming the source. Tariff revenue shrinks tozero. Domestic production shrinks to Q�p , and domestic consumption ex-pands to Q�c.
The net effect of PTA formation on economic well-being in country A isgiven by ABC � FGH – BEJG. The first effect, the gain of ABC � FGH, isthe net benefit to consumers and the net resource saving in productionfrom having domestic production shrink from Qp to Q�p and consumptionexpand from Qc to Q�c. This is the trade creation gain from shifting high-cost domestic production to a lower-cost partner.16 The second effect, theloss of BEJG, is that portion of the tariff revenue lost by shifting importsfrom the rest of the world to the higher-cost partner that is not recouped inlower domestic prices to consumers. It is the welfare loss from trade diver-sion and arises essentially because forgone domestic tariff revenue accruesinstead as profit to producers in the partner country. The effect on countryA is ambiguous a priori. Strictly speaking, only if the partner country is al-ready at world-best production cost is a welfare gain to country A assured.But then A’s economic motive for preferential rather than nondiscrimina-tory trade liberalization is unclear.
What about the welfare effects on the country receiving the preferentialtariff concession and the effects on the rest of the world? Both face a changein demand for their product from country A, but because of the assump-tion of constant costs, there is no induced change in unit costs that can flowon to benefit domestic consumers or drive an improvement in resourceallocation in those countries.17 Thus, the effect on country A, the countrygranting the tariff preference, is the same as the welfare effect on the PTAand the world as a whole. This highlights one of the key weaknesses of thesimple analysis—its assumption of constant costs of production in thepartner country and in the rest of the world.
The simple analysis is nevertheless useful for outlining the nature ofempirical tests for trade creation and trade diversion. Typically, these testsmeasure the amount by which the volume (or more often, the value) oftrade increases with partner countries—Q�c – Q�p in the preceding ex-ample—and compare it with the amount by which trade with the rest of theworld is reduced—Qc – Qp in the preceding example. If the net effect is pos-itive, it is still only a weak test of whether the gains from trade creationoutweigh the costs of trade diversion. It establishes that there is some pos-
The Trade and Investment Effects of Preferential Trading Arrangements 165
16. Viner’s (1950) original analysis omitted the consumption gain FGH. Johnson (1960)was the first to include it as part of the gains from trade creation, thereby ending unproduc-tive debates about the possibility of welfare-increasing trade diversion (Gehrels 1957; Lipsey1957; Michaely 1976).
17. If there is a preexisting distortion in the exporting sector of the exporting country, thenan expansion of that sector could worsen the allocation of resources.

itive width to the triangles ABC and FGH, but it does not establish thattheir areas exceed that of BEJG. This also depends on the reduction incosts per unit of newly created trade and the increase in costs per unit of di-verted trade. What can be concluded in this model is that if the empiricaltests establish net trade creation in a volume or value sense, then the PTAmay still have generated welfare losses, but if the empirical tests establishnet trade diversion, then the PTA cannot have created welfare gains.
The assumption of constant costs in the partner country and in the restof the world is consistent with perfect competition in those two markets.There has been a great deal of analysis examining the welfare effects of al-lowing unit production costs to vary in those two markets (see Panagariya[2000] for a summary), although the analysis has not always been explicitabout the nature or source of the less-than-perfect competition in thosemarkets.
The easiest way to see the dramatic effects that less-than-perfect compe-tition can have is to imagine in figure 5A.1 that the producers in country Bform a cartel and price up to the world price plus external tariff after theyare granted the tariff preference. Their price would remain at P∗
a , the lossesto country A from trade diversion would expand to AEJF, and the gains toA from trade creation would disappear completely! On the other hand,country B would now have a net gain in rent of ABGF that was previouslytariff revenue accruing to A. The net loss to the PTA and the world as awhole would be BEGJ. Thus, less-than-perfect competition can preservethe losses from trade diversion but destroy the gains from trade creation.
One of the most general treatments of less-than-perfect competition isby Mundell (1964). He draws the following conclusions on the effects of acustoms union, assuming that all goods are gross substitutes and initialtariffs are low:
(1) The discriminatory tariff reduction by a member country improvesthe terms of trade of the partner country with respect to both the tariffreducing country and the rest of the world, but the terms of trade of thetariff-reducing country might rise or fall with respect to third countries.
(2) The degree of improvement in the terms of trade of the partnercountry is likely to be larger the greater is the member’s tariff reduction;this establishes the presumption that a member’s gain from a free-tradearea will be larger the higher are initial tariffs of partner countries.(Mundell 1964, 8)
A key to this result is the revenue transfer effect that can arise with less-than-perfect competition. It is also the basis for Panagariya’s (1999) con-clusion, for example, that the United States is likely to gain, but that Mex-ico could lose, from NAFTA.
166 Philippa Dee and Jyothi Gali

References
Adams, R., P. Dee, J. Gali, and G. McGuire. 2003. The trade and investment effectsof preferential trading arrangements—Old and new evidence. ProductivityCommission Staff Working Paper. Canberra, Australia: Australian Govern-ment, Productivity Commission, May.
Aitken, N. 1973. The effect of the EEC and EFTA on European trade: A temporalcross-section analysis. American Economic Review 63 (5): 881–92.
Anderson, J., and E. van Wincoop. 2003. Gravity with gravitas: A solution to theborder puzzle. American Economic Review 93 (1): 170–92.
Andriamananjara, S. 2002. On the size and number of preferential trading ar-rangements. Journal of International Trade and Economic Development 11 (3):279–95.
Bagwell, K., and R. Staiger. 1998. Will preferential arrangements undermine themultilateral trading system? Economic Journal 108 (449): 1162–82.
———. 1999. An economic theory of the GATT. American Economic Review 89 (1):215–48.
Baier, S. L., and J. H. Bergstrand. 2001. The growth of world trade: Tariffs, trans-port costs and income similarity. Journal of International Economics 53 (1): 1–27.
Balassa, B. 1967. Trade creation and trade diversion in the European common mar-ket. Economic Journal 77 (1): 1–21.
Baldwin, R. 1994. Towards an integrated Europe. London: Centre for EconomicPolicy Research.
———. 1996. A domino theory of regionalism. In Expanding European regional-ism: The EU’s new members, ed. R. E. Baldwin, P. Haapranta, and J. Kiander, 25–48. Cambridge, UK: Cambridge University Press.
Baldwin, R. E., R. Forslid, and J. Haaland. 1995. Investment creation and invest-ment diversion: Simulation analysis of the single market program. CEPR Dis-cussion Paper no. 1308. London: Centre for Economic Policy Research.
Baldwin, R. E., and A. J. Venables. 1995. Regional economic integration. In Hand-book of international economics. Vol. 3, ed. G. Grossman and K. Rogoff, 1597–1644. Amsterdam: Elsevier.
Battellino, R. 2002. Australia as a capital exporter. Paper presented at conference,The Impact of an Australian–US Free Trade Agreement: Foreign Policy Chal-lenges and Economic Opportunities. 29–30 August, Canberra, Australia.
Bayoumi, T., and B. Eichengreen. 1995. Is regionalism simply a diversion? Evi-dence from the evolution of the EC and EFTA. CEPR Discussion Paper no.1294. London: Centre for Economic Policy Research.
Bhagwati, J. 1999. Regionalism and multilateralism: An overview. In Trading blocs:Alternative approaches to analyzing preferential trade agreements, ed. J. Bhagwati,P. Krishna, and A. Panagariya, 3–32. Cambridge, MA: MIT Press.
Bhagwati, J., P. Krishna, and A. Panagariya. 1999. Trading blocs: Alternativeapproaches to analyzing preferential trade agreements. Cambridge, MA: MITPress.
Boisso, D., and M. Ferrantino. 1997. Economic distance, cultural distance, andopenness in international trade: Empirical puzzles. Journal of Economic Integra-tion 12 (4): 456–84.
Bond, E., and C. Syropoulos. 1996. The size of trading blocks, market power andworld welfare effects. Journal of International Economics 40 (3–4): 411–37.
Clarete, R., C. Edmonds, and J. Wallack. 2003. Asian regionalism and its effects ontrade in the 1980s and 1990s. Journal of Asian Economics 14 (1): 91–129.
Clark, X., and J. Tavares. 2000. A quantitative approach using the gravity equation.
The Trade and Investment Effects of Preferential Trading Arrangements 167

Development Discussion Paper no. 748. Cambridge, MA: Harvard Institute forInternational Development, Harvard University.
Corden, M. 1972. Economies of scale and customs union theory. Journal of Politi-cal Economy 80 (3): 465–75.
Deardorff, A. V., and R. Stern. 1994. Multilateral trade negotiations and preferen-tial trading arrangements. In Analytical and negotiating issues in the global trad-ing system, ed. A. V. Deardorff and R. Stern, 53–85. Ann Arbor: University ofMichigan Press.
Deardorff, A. V. 1998. Determinants of bilateral trade flows: Does gravity work ina neoclassical world. In The regionalization of the world economy, ed. J. A.Frankel, 23–28. Chicago: University of Chicago Press.
De Rosa, D. A. 1998. Regional integration arrangements: Static economic theory,quantitative findings and policy guidelines. World Bank. Mimeograph. http://www.worldbank.org/research/projects/regional.htm.
Duttagupta, R., and A. Panagariya. 2003. Free trade areas and rules of origin: Eco-nomics and politics. IMF Working Paper no. WP/03/229. Washington, DC: In-ternational Monetary Fund.
Egger, P. 2001. European exports and outward foreign direct investment: A dy-namic panel data approach. Weltwirtschaftliches Archiv 137 (3): 427–49.
Eichengreen, B., and D. A. Irwin. 1995. Trade blocs, currency blocs and the reori-entation of world trade in the 1930s. Journal of International Economics 38 (1–2):1–24.
Ethier, W. 1998a. The new regionalism. Economic Journal 108 (449): 1149–61.———. 1998b. Regionalism in a multilateral world. Journal of Political Economy
106 (6): 1214–45.———. 1999. Multilateral roads to regionalism. In International trade policy and
the Pacific Rim, ed. J. Piggott and A. Woodland, 131–52. New York: St. Martin’s.———. 2001. The new regionalism in the Americas: A theoretical framework.
North American Journal of Economics and Finance 12 (2): 159–72.Evenett, S. J., and W. Keller. 1998. On theories explaining the success of the grav-
ity equation. Journal of Political Economy 110 (2): 281–316.Feenstra, R. C., J. R. Markusen, and A. K. Rose. 2001. Using the gravity equation
to differentiate among alternative theories of trade. Canadian Journal of Eco-nomics 34 (2): 430–47.
Fink, C., and C. A. Primo Braga. 1999. How stronger protection of intellectualproperty rights affects international trade flows. World Bank Working Paperno. 2051. Washington, DC: World Bank. http://www.worldbank.org/html/dec/Publications/Workpapers/wps2000series/wps2051/wps2051.pdf.
Frankel, J. 1997. Regional trading blocs in the world economic system. Washington,DC: Institute for International Economics.
Frankel, J., E. Stein, and S. Wei. 1995. Trading blocs and the Americas: The natu-ral, the unnatural, and the super-natural. Journal of Development Economics 47(1): 61–95.
Freund, C. 2000. Different paths to free trade: The gains from regionalism. Quar-terly Journal of Economics 115 (4): 1317–41.
Fukao, K., T. Okubo, and R. M. Stern. 2003. An econometric analysis of trade di-version under NAFTA. North American Journal of Economics and Finance 14:3–24.
Gehrels, F. 1957. Customs union from a single-country viewpoint. Review of Eco-nomic Studies 24 (1): 61–64.
Gilbert, J., R. Scollay, and B. Bora. 2001. Assessing regional trading arrangements
168 Philippa Dee and Jyothi Gali

in the Asia-Pacific. Policy Issues in International Trade and Commodities StudySeries no. 15. Geneva: United Nations Conference on Trade and Development.
Greene, W. 2002. The behaviour of fixed effects estimator in non-linear models.New York University, Department of Economics, Stern School of Business.Mimeograph.
Haveman, J., and D. Hummels. 1998. Trade creation and trade diversion: New em-pirical results. Journal of Transnational Management Development 3 (2): 47–72.
Helpman, E. 1987. Imperfect competition and international trade: Evidence fromfourteen industrial countries. Journal of the Japanese and International Econ-omies 1 (1): 62–81.
Helpman, E., and P. Krugman. 1985. Market structure and international trade.Cambridge, MA: MIT Press.
Hertel, T., T. Walmsley, and K. Itakura. 2001. Dynamic effects of the “new age”free trade agreement between Japan and Singapore. Journal of Economic Inte-gration 16 (4): 446–84.
Johnson, H. 1960. The economic theory of customs union. Pakistan EconomicJournal 10 (1): 14–32.
Ju, J., and K. Krishna. 1998. Firm behaviour and market access in a free trade areawith rules of origin. NBER Working Paper no. 6857. Cambridge, MA: NationalBureau of Economic Research, December.
Krishna, K., and A. O. Krueger. 1995. Implementing free trade areas: Rules of ori-gin and hidden protection. NBER Working Paper no. 4983. Cambridge, MA:National Bureau of Economic Research.
Krishna, P. 1998. Regionalism and multilateralism: A political economy approach.Quarterly Journal of Economics 113 (1): 227–51.
Krueger, A. 1999a. Free trade agreements as protectionist devices: Rules of origin.In Trade theory and econometrics: Essays in honour of John S. Chipman, ed. R. M.James, C. M. James, and R. Raymond, 91–102. New York: Routledge.
———. 1999b. Trade creation and trade diversion under NAFTA. NBER WorkingPaper no. 7429. Cambridge, MA: National Bureau of Economic Research, De-cember.
Krugman, P. 1993. Regionalism versus multilateralism: Analytical notes. In Newdimensions in regional integration, ed. J. de Melo and A. Panagariya, 58–79. Cam-bridge, UK: Cambridge University Press.
Levy, P. 1997. A political-economic analysis of free-trade agreements. AmericanEconomic Review 87 (4): 506–19.
Li, Q. 2000. Institutional rules of regional trade blocs and their impact on interna-tional trade. In The political consequences of regional trade blocks, ed. R. Switkyand B. Kerremans, 85–118. London: Ashgate.
Lipsey, R. 1957. Mr. Gehrels on customs unions. Review of Economic Studies 24 (2):211–14.
———. 1958. The theory of customs unions: A general equilibrium analysis. PhDdiss., University of London.
Markusen, J. R. 1983. Factor movements and commodity trade as complements.Journal of International Economics 14 (3–4): 341–56.
Matyas, L. 1997. Proper econometric specification of the gravity model. WorldEconomy 21 (3): 363–68.
———. 1998. The gravity model: Some econometric consideration. World Econ-omy 20 (3): 397–401.
McLaren, J. 2002. A theory of insidious regionalism. Quarterly Journal of Eco-nomics 117 (2): 571–608.
The Trade and Investment Effects of Preferential Trading Arrangements 169

Michaely, M. 1976. The assumptions of Jacob Viner’s theory of customs unions.Journal of International Economics 6 (1): 75–93.
Mundell, R. 1964. Tariff preferences and the terms of trade. Manchester School ofEconomic and Social Studies 32:1–13.
Panagariya, A. 1999. The regionalism debate: An overview. World Economy 22 (4):477–511.
———. 2000. Preferential trade liberalization: The traditional theory and new de-velopments. Journal of Economic Literature 38 (2): 287–331.
Panagariya, A., and R. Duttagupta. 2002. The “gains” from preferential tradeliberalisation in the CGE models: Where do they come from? University ofMaryland. Mimeograph. http://www.bsos.umd.edu/econ/panagariya/apecon/techpaper.htm.
Pomfret, R. 1997. The economics of regional trading arrangements. Oxford, UK:Clarendon Press.
Riezman, R. 1979. A 3 � 3 model of customs unions. Journal of International Eco-nomics 9 (3): 341–54.
Robinson, S., and K. Thierfelder. 2002. Trade liberalisation and regional integra-tion: The search for large numbers. Australian Journal of Agricultural and Re-source Economics 46 (4): 585–604.
Scollay, R., and J. Gilbert. 2000. Measuring the gains from APEC trade liberalisa-tion: An overview of CGE assessments. World Economy 23 (3): 175–97.
Soloaga, I., and L. A. Winters. 2001. Regionalism in the nineties: What effect ontrade? North American Journal of Economics and Finance 12 (1): 1–29.
Viner, J. 1950. The customs union issue. New York: Carnegie Endowment for Inter-national Peace.
Winters, L. 1997. Assessing regional integration arrangements. Washington, DC:World Bank, Development Research Group.
World Bank. 2000. Trade blocs. Washington, DC: World Bank.World Trade Flows (WTF). 1997. World trade flows database 1970–1992. Cam-
bridge, MA: National Bureau of Economic Research.———. 2000. World trade flows 1980–1997 database. Davis: Institute of Govern-
mental Affairs, University of California.World Trade Organization (WTO). 1995. Regional trading arrangements and the
world trading system. Geneva: WTO.———. 2002. Work of the Committee on Regional Trade Agreements. http://www
.wto.org/english/tratop_e/region_e/regcom_e.htm.Zissimos, B., and D. Vines. 2000. Is the WTO’s Article XXIV a free trade barrier?
CSGR Working Paper no. 49/00. Warwick, UK: Centre for the Study of Global-isation and Regionalisation, University of Warwick.
Comment Bih Jane Liu
The number of preferential trading arrangements (PTAs) has grown dra-matically over the last decade or so. How PTAs affect the trade and invest-ment among member countries and between member and nonmembercountries thus becomes a very important issue nowadays. This paper, focus-
170 Philippa Dee and Jyothi Gali
Bih Jane Liu is professor of economics at National Taiwan University.

ing on this important issue, is very comprehensive and well written. It notonly surveys the related theoretical and empirical literature thoroughly, butit also has done a great job in collecting the data and doing the econometricanalysis. By using a gravity model to examine eighteen PTAs over the periodof 1970–1997, this paper shows that most of the PTAs, including the Euro-pean Union (EU), the North American Free Trade Agreement (NAFTA),and the Southern Common Market (MERCOSUR), have diverted moretrade from nonmember countries than they have created among membercountries. In addition, it shows that for most of the agreements where non-trade provisions have affected foreign direct investment (FDI), the PTAseffects have been investment creation rather than diversion.
Although I agree with most of the points that the authors made in thispaper, as a discussant I would like to raise some questions.
The first question is related to model specification. This paper uses PTAvariables and many country-specific variables to capture the trade rela-tionship among countries. Thus the usual problem of omitted-variable biasin gravity models could be avoided to a certain degree. However, the com-plicated heterogeneity relationship among member countries and betweenmember and nonmember countries still could not be completely capturedby these two kinds of variables, for example, if there are three countries, A,B, and C, in the same trading bloc. A and B are natural partners, but A andC are not. Apparently, the trade creation and diversion effects between Aand B would be different from that between A and C. In this case the PTAvariables could not be used to differentiate the different trade effect be-tween A and B and A and C. The question then is whether the features ofheterogeneity can be captured by the variables such as GDP, real exchangerate, distance, country dummies, linguistic similarity, and so on? To me, theanswer seems unclear. Moreover, to derive trade creation or trade diversioneffects, the inclusion of PTA dummies in the gravity equation may not besufficient. This is because PTA dummies reveal little about cost of produc-tion across different countries. Some variables related to wage or cost ofproduction and/or the cross terms of these variables with PTA dummiesmay be needed to understand whether trade from lower-cost PTA memberscan be created and whether trade is diverted from lower-cost PTA non-members to higher-cost PTA members after a trading bloc is formed.
The second question has something to do with the endogeneity problem.We all know that GDP, GDP per capita, and the real exchange rate areendogeneous variables that should be determined simultaneously with ex-ports (the dependent variable) within the model. However, in this paperthese endogeneous variables are used as the right-hand-side variables inthe gravity equation (1). As a result, the error term in equation (1) will becorrelated with them, and hence the estimators will be biased. To avoid theendogeneity problem, I would suggest that the authors use lag variables orto run simultaneous equations.
The Trade and Investment Effects of Preferential Trading Arrangements 171

This paper utilizes the panel data for the period of 1970–1997 to exam-ine eighteen PTAs. While it achieves maximum degree of freedom, I amwondering whether the results thus obtained will suffer from subsample in-stability and heteroskedasticity. This is because the relationship betweenexports and country-specific factors may vary across different tradingblocs. A sensitivity analysis may serve to make sure that the results are ro-bust even for subsamples or subperiod samples.
Past studies showed that most PTAs are trade creating in net terms. Bycontrast, the results from this paper suggest that most PTAs do not createadditional trade, either for members or for nonmembers of the agreements.I suspect that it has something to do with the induced investment effect. IfPTAs have significant investment creation effect as shown in this paper,then this new investment may be either a substitute for or a complement oftrade and will hence affect trade flows indirectly. In the case where invest-ment creation does substitute for intraregional trade, we may observe neg-ative trade creation as shown in this paper. To show whether negative tradeeffect is indeed caused by investment, I would suggest that the authors runtrade and investment equations simultaneously with each variable appear-ing in the other equation. By doing so, we are able to better understand theinterrelationship between trade and investment under PTAs.
One last point is that the wave of globalization together with a reductionin transport costs and an improvement in communication and technol-ogies all make outward direct investment and foreign outsourcing becomemore prevalent in the 1990s. This in turn changes the nature of interna-tional trade from trade in final goods to trade in intermediate inputs. Be-cause the empirical data in this paper cover the time period from 1970through 1997, how this change in trade structure should be taken into ac-count in the study of the impacts of PTAs will also deserve special atten-tion.
Comment Erlinda Medalla
First of all, let me say that I really enjoyed reading Philippa Dee and JyothiGali’s paper. The primary reason I chose to discuss this paper is because Iwanted to get reacquainted with the topic and get on track with the litera-ture. And on this, the paper does an excellent job.
The paper is very provocative.I cannot fault the logic (how arguments are developed).
172 Philippa Dee and Jyothi Gali
Erlinda Medalla is a senior research fellow of the Philippine Institute for DevelopmentStudies.

But to me, there are some jarring notes and conclusions. And I admitthere is still a lot I don’t completely understand.
My comments come from these two reactions I had, which could beinterrelated. Conclusions jar in my mind because I probably did not com-pletely understand the matter.
Hopefully, my comments will help the paper become more understand-able to people less technical in orientation and to people who have notdone work and are not familiar with the intricacies of the topic.
The Member Liberalization Index
I am not clear on how is it actually estimated. My understanding is thatit reflects the coverage of the provisions of the preferential trading ar-rangement (PTA) (whether or not they are used).
The paper mentions that a high index indicates that the PTA is more lib-eral to members in the particular area covered by the provisions of thePTA. In nonmerchandise trade, if this is among the provisions of the PTAand its share in total trade is x percent, then I take it that this is the value ittakes. (If this is close enough, then my subsequent reading and under-standing of the analysis would not be too erroneous.) Nonetheless, I thinkthe authors need to explain this further.
The Gravity Model
I appreciate the distinction made between ex ante CGE analysis and theex post technique of the gravity model. I think both have merits.
The merit of the gravity model, as mentioned, is that it is ex post and ex-amines actual PTA. The shortcoming is that it only looks at links betweenthe PTA formation and trade outcomes.
My own bias is that simply looking at trade outcomes is very limiting.Judging the benefits merely based on trade effects (whether trade creatingor trade diverting) is not enough. As the paper says, there is weak linkagebetween trade and welfare. And this is precisely what we want to look atwhen we want to assess if a PTA is beneficial or not.
This is one of the jarring notes I was referring to earlier. Looking at tradediversion and trade creation is based mainly on a static model explained inthe appendix. It is not only static, it is also just a (very) partial analysis.
When domestic production contracts because of the PTA, the gain is notonly the reduction in the former deadweight loss. The additional gain is theresources this releases (maybe not all because of sunk costs) to relativelymore profitable activities. The resulting less-distorted relative prices (as, ineffect, the relative prices facing producers with the higher tariff for all trad-ing partners result in higher relative domestic prices of importables) withPTA would mean a better resource allocation, at least from the point ofview of the individual member country.
The Trade and Investment Effects of Preferential Trading Arrangements 173

Nonetheless, it is always good to look at a number of approaches butkeep in mind their particular limitations.
The Specifications of the Model
It was a bit difficult to figure out. I had to read it several times to under-stand why it is that the dependent variable is exports from country i to j.Was there another specification that uses imports of country i from coun-try j ? If not, I thought the authors also wanted to measure import diver-sion? Or are they all mixed together ( y is really either export or import).Then I figure that we are dealing with a comprehensive set of data, suchthat a bilateral export to one is bilateral imports of another? It would helpif there is more explanation of this at the outset.
In the explanatory variables, why use the sum of GDP and then the ab-solute difference rather than use directly separate GDPs of the partnercountries? Connected to this, should there be an overall activity level vari-able, for example, world GDP (or GDP of the ROW)?
The three dummy variables used for each PTA have not been easy tofollow and visualize because of the large sample of countries. The firstdummy is easier to understand. It takes on the value of the MLI for exportswhere the bilateral flow is between countries with a PTA, say for exportsfrom Australia to New Zealand, with Closer Economic Relations (CER).Hence, CER1 is the corresponding MLI. In addition, I understand CER2and CER3 are zero. (Am I right?) For exports involving two countries out-side this particular PTA (say exports from Thailand to the Philippines, notmembers of CER), the three dummies are zero (all CER dummies arezero), but if they have their own PTA (e.g., AFTA), there needs to be an ad-ditional three dummies, the first of which will be MLI (AFTA1 dummyvalue is MLI). Furthermore, for exports from Australia (of CER) to, say,Thailand (of AFTA), then AFTA2 is MLI related to AFTA. And finally,for exports from Thailand to Australia, CER3 is MLI related to CER. (DidI understand it correctly?) This is really complicated, and I congratulatethe effort there must have been in dealing with such a huge amount of ob-servations involving numerous variables.
I needed to understand this clearly in order to understand the meaningof the coefficients of the three dummies and why they capture intrabloctrade and import and export diversion, which brings me to my next com-ment. What is the impact of using MLI rather than zeroes and ones? Andin separating exports and imports, does this not introduce an upward biason trade diversion? (Because standard deviation for the sum adds up.) Inthe first place, is this the interpretation, simply summing up the coefficientsto get the net trade effects? I deduced this from the explanation in the caseof Frankel (1997), who uses only two dummies. Is my interpretation cor-rect?
The paper made, toward the end, a qualification on the results about the
174 Philippa Dee and Jyothi Gali

intra-PTA effect having large standard error, compared to the extra-PTAeffect, which is estimated more accurately. Doesn’t this pose a serious lim-itation? How robust will the estimate be on the net?
Finally, the paper later mentioned (when discussing investments) thatbecause of model convergence problems, the effects of new age provisionson exports to and imports from nonmembers could not be analyzed sepa-rately. Does the author have some a priori notions about the direction ofeffects?
On Investments
I have similar misgivings on this as in the previous analysis on trade out-comes.
Instead of exports, it uses stock of outward investment. Isn’t flow themore appropriate variable? (I thought flow is easier to measure than stock.)Accepting this, why outward, not inward, FDI? I would think that for amember country, this is what is important to find out. Again, I may just bemissing something here. They are just two sides of the same coin. But us-ing inward FDI would have had more intuitive appeal. It would help if theauthors explain why (even in a footnote), as it was not readily obvious tome and possibly to other readers as well (especially nontechnical ones whoI think this paper is important to reach).
I tend to share Ethier’s (2001) arguments that there is likely “beachhead”response from nonmember countries on FDI. I also agree that some in-vestments could be lost from tariff-jumping-motivated investments. How-ever, in this age of reduced trade barriers, how much of these are left?
Finally, whether there is investment diversion or not, I think the receiv-ing country would always gain (although there may be a reduction inglobal welfare).
On the whole, I would like to congratulate the authors for such an excel-lent paper. I learned a lot from it, and it has inspired me to study it more.It was well thought out and well written.
References
Ethier, W. 2001. The new regionalism in the Americas: A theoretical framework.North American Journal of Economics and Finance 12 (2): 159–72.
Frankel, J. 1997. Regional trading blocs in the world economic system. Washington,DC: Institute for International Economics.
The Trade and Investment Effects of Preferential Trading Arrangements 175

Related Documents