A Forrester Total Economic Impact™ Study Commissioned By Cisco Project Director: Anish Shah November 2016 The Total Economic Impact™ Of Cisco’s Integrated Security Architecture Improved Efficiency, Productivity, And Cost Savings Compared with Disparate Security Solutions

Welcome message from author
This document is posted to help you gain knowledge. Please leave a comment to let me know what you think about it! Share it to your friends and learn new things together.
Transcript
A Forrester Total Economic
Impact™ Study
Commissioned By
Cisco
Project Director:
Anish Shah
November 2016
The Total Economic
Impact™ Of Cisco’s
Integrated Security
Architecture Improved Efficiency, Productivity, And Cost Savings Compared with Disparate Security Solutions
Table Of Contents
Executive Summary .................................................................................... 3
Disclosures .................................................................................................. 6
TEI Framework And Methodology ............................................................ 7
Analysis ........................................................................................................ 8
Financial Summary ................................................................................... 21
Cisco’s Integrated Security Architecture: Overview ............................ 22
TBD – Required From Cisco ..................... Error! Bookmark not defined.
Appendix A: Total Economic Impact™ Overview ................................. 23
Appendix B: Glossary ............................................................................... 24
ABOUT FORRESTER CONSULTING
Forrester Consulting provides independent and objective research-based
consulting to help leaders succeed in their organizations. Ranging in scope from
a short strategy session to custom projects, Forrester’s Consulting services
connect you directly with research analysts who apply expert insight to your
specific business challenges. For more information, visit
forrester.com/consulting.
© 2016, Forrester Research, Inc. All rights reserved. Unauthorized reproduction is strictly prohibited.
Information is based on best available resources. Opinions reflect judgment at the time and are subject to
change. Forrester®, Technographics®, Forrester Wave, RoleView, TechRadar, and Total Economic Impact
are trademarks of Forrester Research, Inc. All other trademarks are the property of their respective
companies. For additional information, go to www.forrester.com.
3
Executive Summary
Cisco commissioned Forrester Consulting to conduct a Total
Economic Impact™ (TEI) study and examine the potential return on
investment (ROI) enterprises may realize by deploying Cisco’s
integrated security architecture to protect the organization’s network,
data, and applications. The purpose of this study is to provide
readers with a framework to evaluate the potential financial impact
of this solution within their organizations.
To better understand the benefits, costs, and risks associated with
investing in Cisco’s integrated security architecture, Forrester
interviewed four existing customers who all decided to consolidate
from multiple security vendors to Cisco. The customers noted that
having a fragmented security environment increased the burden on
their internal resources to develop new skill sets, took more man-
hours to integrate solutions, and added complexity without being
able to reduce security threats and malware attacks. Cisco offers
organizations a comprehensive set of security solutions that include
advanced malware protection, policy and access products and next-
generation firewalls. In addition, customers get the benefit of
TALOS, Cisco’s central threat intelligence organization, which proactively works to detect and correlate threats and provide
defenses across all of Cisco’s security products in real time.
For the organizations interviewed, the primary drivers for investing in Cisco’s integrated security architecture were: 1)
decreasing complexity due to disparate solutions; 2) reducing capex and opex due to required hardware costs and ongoing
software license costs; 3) increasing internal IT and security resource productivity; and 4) reducing the threat of security
breaches across the organization’s network, data, and applications.
CISCO’S INTEGRATED SECURITY ARCHITECTURE IMPROVES SECURITY EFFICACY, DRIVES SAVINGS, AND
BOOSTS PRODUCTIVITY
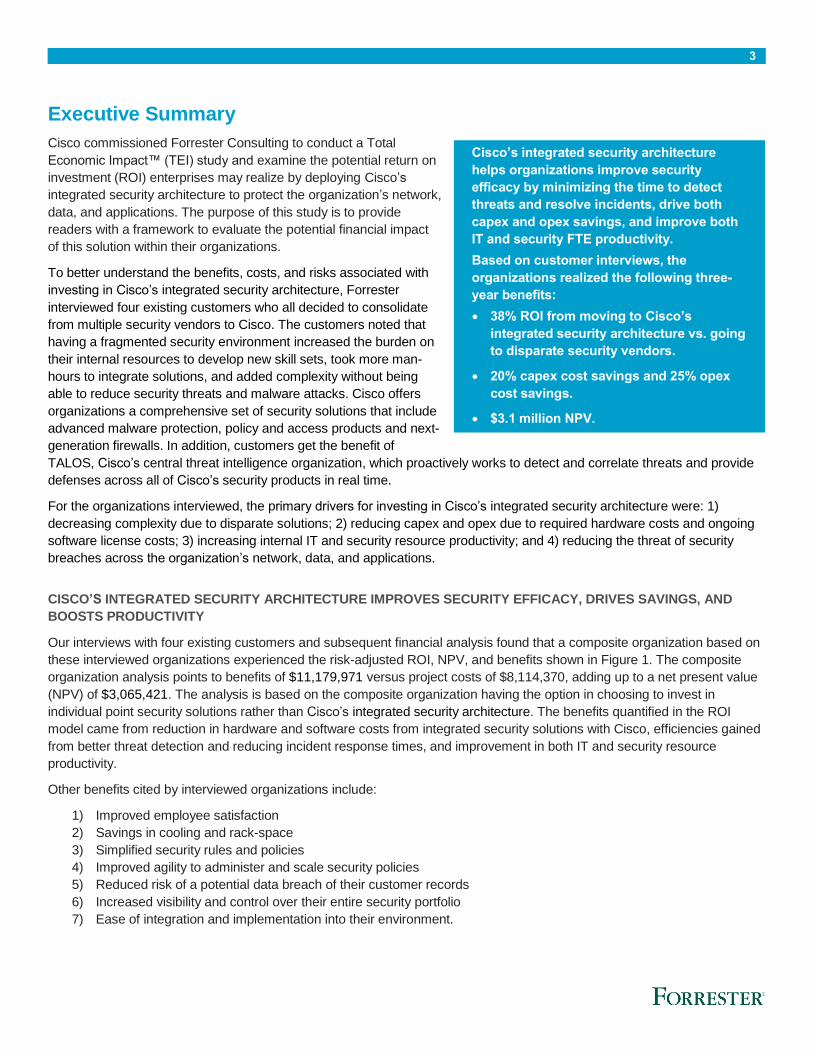
Our interviews with four existing customers and subsequent financial analysis found that a composite organization based on
these interviewed organizations experienced the risk-adjusted ROI, NPV, and benefits shown in Figure 1. The composite
organization analysis points to benefits of $11,179,971 versus project costs of $8,114,370, adding up to a net present value
(NPV) of $3,065,421. The analysis is based on the composite organization having the option in choosing to invest in
individual point security solutions rather than Cisco’s integrated security architecture. The benefits quantified in the ROI
model came from reduction in hardware and software costs from integrated security solutions with Cisco, efficiencies gained
from better threat detection and reducing incident response times, and improvement in both IT and security resource
productivity.
Other benefits cited by interviewed organizations include:
1) Improved employee satisfaction
2) Savings in cooling and rack-space
3) Simplified security rules and policies
4) Improved agility to administer and scale security policies
5) Reduced risk of a potential data breach of their customer records
6) Increased visibility and control over their entire security portfolio
7) Ease of integration and implementation into their environment.
Cisco’s integrated security architecture
helps organizations improve security
efficacy by minimizing the time to detect
threats and resolve incidents, drive both
capex and opex savings, and improve both
IT and security FTE productivity.
Based on customer interviews, the
organizations realized the following three-
year benefits:
38% ROI from moving to Cisco’s
integrated security architecture vs. going
to disparate security vendors.
20% capex cost savings and 25% opex
cost savings.
$3.1 million NPV.
4
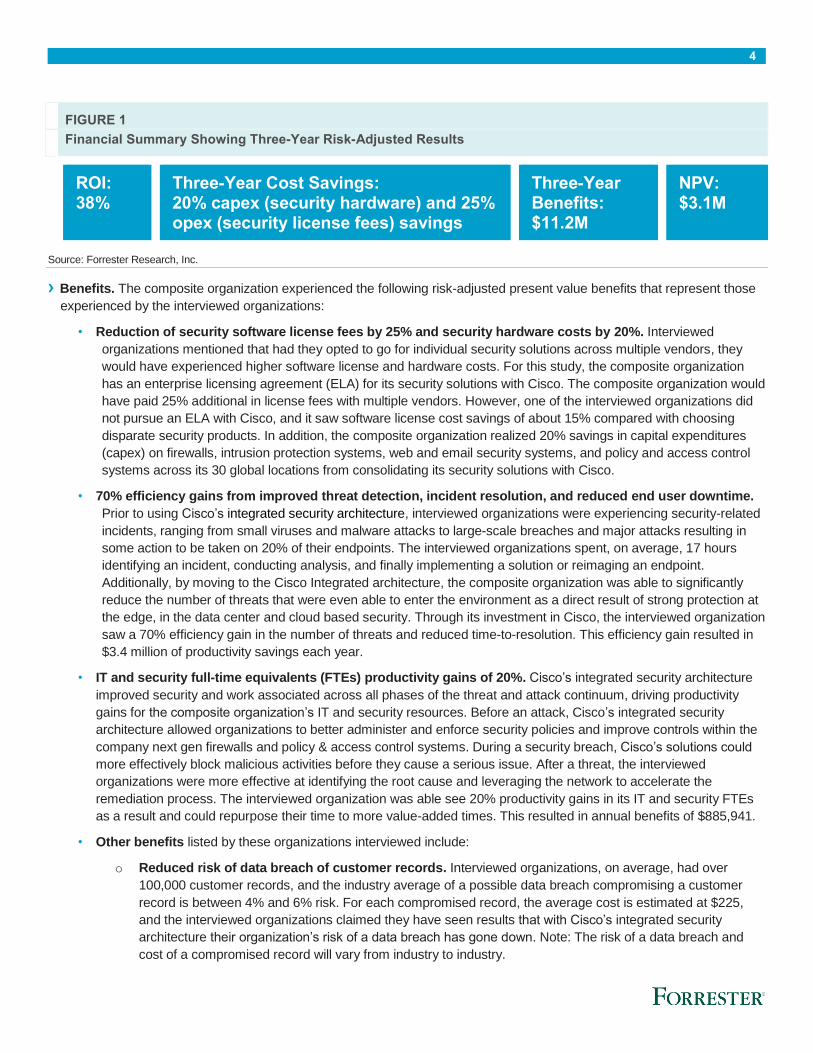
FIGURE 1
Financial Summary Showing Three-Year Risk-Adjusted Results
ROI: 38%
Three-Year Cost Savings: 20% capex (security hardware) and 25% opex (security license fees) savings
Three-Year Benefits: $11.2M
NPV: $3.1M
Source: Forrester Research, Inc.
› Benefits. The composite organization experienced the following risk-adjusted present value benefits that represent those
experienced by the interviewed organizations:
• Reduction of security software license fees by 25% and security hardware costs by 20%. Interviewed
organizations mentioned that had they opted to go for individual security solutions across multiple vendors, they
would have experienced higher software license and hardware costs. For this study, the composite organization
has an enterprise licensing agreement (ELA) for its security solutions with Cisco. The composite organization would
have paid 25% additional in license fees with multiple vendors. However, one of the interviewed organizations did
not pursue an ELA with Cisco, and it saw software license cost savings of about 15% compared with choosing
disparate security products. In addition, the composite organization realized 20% savings in capital expenditures
(capex) on firewalls, intrusion protection systems, web and email security systems, and policy and access control
systems across its 30 global locations from consolidating its security solutions with Cisco.
• 70% efficiency gains from improved threat detection, incident resolution, and reduced end user downtime.
Prior to using Cisco’s integrated security architecture, interviewed organizations were experiencing security-related
incidents, ranging from small viruses and malware attacks to large-scale breaches and major attacks resulting in
some action to be taken on 20% of their endpoints. The interviewed organizations spent, on average, 17 hours
identifying an incident, conducting analysis, and finally implementing a solution or reimaging an endpoint.
Additionally, by moving to the Cisco Integrated architecture, the composite organization was able to significantly
reduce the number of threats that were even able to enter the environment as a direct result of strong protection at
the edge, in the data center and cloud based security. Through its investment in Cisco, the interviewed organization
saw a 70% efficiency gain in the number of threats and reduced time-to-resolution. This efficiency gain resulted in
$3.4 million of productivity savings each year.
• IT and security full-time equivalents (FTEs) productivity gains of 20%. Cisco’s integrated security architecture
improved security and work associated across all phases of the threat and attack continuum, driving productivity
gains for the composite organization’s IT and security resources. Before an attack, Cisco’s integrated security
architecture allowed organizations to better administer and enforce security policies and improve controls within the
company next gen firewalls and policy & access control systems. During a security breach, Cisco’s solutions could
more effectively block malicious activities before they cause a serious issue. After a threat, the interviewed
organizations were more effective at identifying the root cause and leveraging the network to accelerate the
remediation process. The interviewed organization was able see 20% productivity gains in its IT and security FTEs
as a result and could repurpose their time to more value-added times. This resulted in annual benefits of $885,941.
• Other benefits listed by these organizations interviewed include:
o Reduced risk of data breach of customer records. Interviewed organizations, on average, had over
100,000 customer records, and the industry average of a possible data breach compromising a customer
record is between 4% and 6% risk. For each compromised record, the average cost is estimated at $225,
and the interviewed organizations claimed they have seen results that with Cisco’s integrated security
architecture their organization’s risk of a data breach has gone down. Note: The risk of a data breach and
cost of a compromised record will vary from industry to industry.
5
o Simplified and automated policy management, breach and threat detection, plus associated operational
savings.
o Improved regulatory compliance.
o Improved agility and ability to scale security policies.
o Ease of implementation and use. Organizations minimized customization and integration issues with
Cisco’s integrated security architecture versus implementing disparate security solutions.
› Costs. The composite organization experienced the following risk-adjusted costs:
• Cisco security solutions: hardware and software licensing fees. The composite organization paid $4.1 million in
hardware requirements associated with its investment in Cisco’s integrated security architecture. This included Next
Gen firewalls, Advanced Malware Protection, VPN and other security appliances that were needed as a result of
investing in the following Cisco security solutions:
o Network security.
o Advanced malware protection — cloud, network, and endpoint.
o Remote access.
o Network policy and access.
o Web security.
o Email security.
In addition, the composite organization has an enterprise licensing agreement with Cisco for the above solutions that
costs $1,125,000 per year.
• Ongoing labor charges: The composite organization dedicates two security FTEs to manage its Cisco security
environment. This is part of the roader resource pool focused on security governance, compliance, Infosec and IT
security operations.
• Implementation costs — The composite organization also dedicated 20% of four FTEs across the six-month
implementation of Cisco’s integrated security architecture in its environment. And they augmented that with external
professional services
“I would 100% recommend Cisco’s security architecture. Its security
appliances easily integrate with other network appliances, deployment
was fast, and we were able to see results very quickly.”
~ Sr. Security Architect, large aerospace company
6
Disclosures
The reader should be aware of the following:
› The study is commissioned by Cisco and delivered by Forrester Consulting. It is not meant to be used as a competitive
analysis.
› Forrester makes no assumptions as to the potential ROI that other organizations will receive. Forrester strongly advises
that readers use their own estimates within the framework provided in the report to determine the appropriateness of an
investment in Cisco’s integrated security architecture.
› Cisco reviewed and provided feedback to Forrester, but Forrester maintains editorial control over the study and its findings
and does not accept changes to the study that contradict Forrester’s findings or obscure the meaning of the study.
› Cisco provided the customer names for the interviews but did not participate in the interviews.
7
TEI Framework And Methodology
INTRODUCTION
From the information provided in the interviews and survey, Forrester has constructed a Total Economic Impact (TEI)
framework for those organizations considering implementing Cisco’s integrated security architecture. The objective of the
framework is to identify the cost, benefit, flexibility, and risk factors that affect the investment decision, to help organizations
understand how to take advantage of specific benefits, reduce costs, and improve the overall business goals of winning,
serving, and retaining customers.
APPROACH AND METHODOLOGY
Forrester took a multistep approach to evaluate the impact that Cisco’s integrated security architecture can have on an
organization (see Figure 2). Specifically, we:
› Interviewed Cisco marketing, sales, and consulting personnel, along with Forrester analysts, to gather data relative to
Cisco’s integrated security architecture and the marketplace for Cisco’s integrated security architecture.
› Interviewed four organizations currently using Cisco’s integrated security architecture and surveyed an additional 30
customers to obtain data with respect to costs, benefits, and risks.
› Designed a composite organization based on characteristics of the interviewed organizations.
› Constructed a financial model representative of the interviews and surveys using the TEI methodology. The financial
model is populated with the cost and benefit data obtained from the interviews and surveys as applied to the composite
organization.
› Risk-adjusted the financial model based on issues and concerns the interviewed organizations highlighted in interviews.
Risk adjustment is a key part of the TEI methodology. While interviewed and surveyed organizations provided cost and
benefit estimates, some categories included a broad range of responses or had a number of outside forces that might
have affected the results. For that reason, some cost and benefit totals have been risk-adjusted and are detailed in each
relevant section.
Forrester employed four fundamental elements of TEI in modeling Cisco’s integrated security architecture: benefits, costs,
flexibility, and risks.
Given the increasing sophistication that enterprises have regarding ROI analyses related to IT investments, Forrester’s TEI
methodology serves to provide a complete picture of the total economic impact of purchase decisions. Please see Appendix
A for additional information on the TEI methodology.
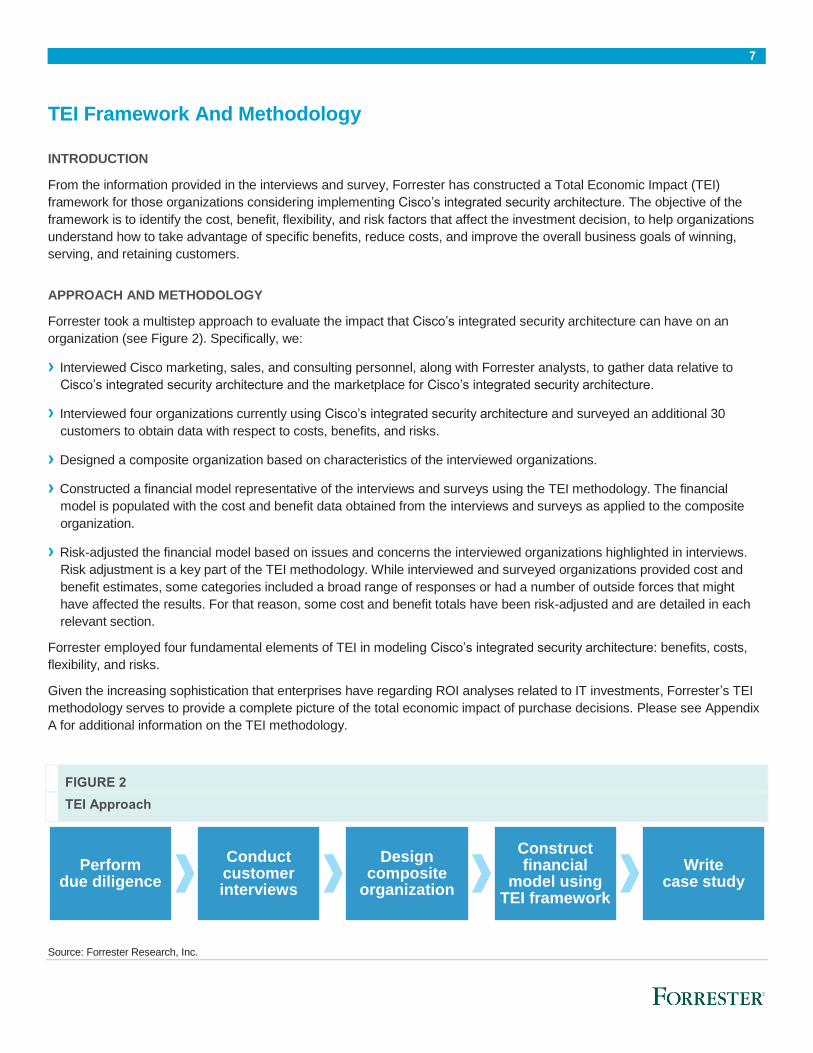
FIGURE 2
TEI Approach
Source: Forrester Research, Inc.
Perform due diligence
Conduct customer interviews
Design composite
organization
Construct financial
model using TEI framework
Write case study
8
Analysis
COMPOSITE ORGANIZATION
For this study, Forrester conducted a total of four interviews with
companies that varied in size from 1,500 employees to 60,000
employees, which are Cisco customers:
› A US-based technology company providing solutions to
scientific, commercial, and industrial customers. The company
has over 25 global locations, approximately $1 billion in annual
revenue, and 3,000 employees. The company has an ELA
with Cisco for advanced malware protection, email and web
security, next-generation firewalls, remote access, network
security, and next-generation intrusion protection solutions.
The company deployed Cisco’s integrated security
architecture because it wanted to expand its security portfolio
with a comprehensive tool set, get better time-to-value for new
layers of offerings, and improve visibility.
› A US-based full-service regional bank providing both
commercial and retail services. The bank has over 30 full-
service branches, 1,500 employees, and over 3,500
endpoints. The bank implemented Cisco’s next-generation
firewall, remote access, web security, and network security
solutions, with the primary goal of protecting its over 900,000
customer records from a possible security breach and
continuity in business operations.
› A large, publicly traded Australia-based manufacturing
company. The company has over $1.5 billion in revenue and
over 15,000 employee endpoints and 30,000 endpoints across
75 global sites. The organization had a mandate from its board
of directors to modernize its security infrastructure and
program. The organization did not want to piecemeal its
security solution and went with Cisco for its breadth of
portfolio; as a result, it saw a dramatic increase in the number
of threats it was able to neutralize in the first year. The
organization has an ELA with Cisco for the advanced malware
protection, email and web security, next-generation firewalls,
remote access, network security, and next-generation intrusion protection security solutions.
› A US-based organization with 60,000 employees, over 100,000 endpoints, and $30 billion in revenue. This organization
invested in Cisco’s integrated security architecture to reduce the threat of security, data, and network breaches and gain
faster response times to attacks in its envioronment. It also wanted to increase the efficiency of its IT and security
resources, who were stretched with managing multiple security vendors in their envioronment.
“I can say with confidence that
our investment in Cisco’s
integrated security solutions has
helped us neutralize tens of
thousands of threats already.”
~ Global infrastructure director, large manufacturing
company
9
Based on the interviews, Forrester constructed a TEI framework, a composite organization, and an associated ROI analysis
that illustrates the areas financially affected. The analysis shows the outcome of investing in both hardware and software for
the composite company’s security products through an enterprise license agreement with Cisco. The composite organization
that Forrester synthesized from these results has the following characteristics:
› A US-based Fortune 1000 organization with 10,000 employees globally across 30 locations.
› 20,000 endpoints spread across headquarters, global locations, and remote workers.
› 150-member IT staff (internal and contractors).
› 15-member security staff (security governance, compliance, policies, and administration).
› 10 IT FTEs responsible for security operations (incident resolution, reimaging machines, etc.).
› 100,000 records (average value per record is $225).
› Prior to choosing Cisco’s integrated security architecture, had five or more other security vendors in its environment.
› Has an ELA agreement with Cisco and has the following security products in its environment:
Network security.
Advanced malware protection — cloud, network, and endpoint.
Remote access.
Network policy and access.
Web security.
Email security.
INTERVIEW HIGHLIGHTS
The composite organization faced challenges and had results similar to the interviewed companies.
Situation
The composite organization realized that its current way of addressing enterprise wide security through point solutions was
not as effective and that it needed a comprehensive security solution that: 1) increased efficiency of managing and
containing threats 2) reduced the burden its current IT and security teams faced controlling and responding to malware and
other security attacks in its environment and 3) reduced the risks of breaches. The composite organization was looking for an
integrated architecture that was more strategic than tactical in its approach, allowed centralized control over its security
environment, and was proactive in mitigating threats through actionable intelligence. In addition, the composite organization
had too many manual processes aligned to the point products that they had deployed and lacked internal skills to efficiently
manage all the individual solutions that were implemented in its environment
The composite organization and the interviewed customers shared the following goals and objectives for an investment in
Cisco’s integrated security architecture:
› Reduce complexity within their organization’s security environment (move from point solutions to end-to-end security
management).
› Improve threat visibility and detection, and streamline integration across their network.
› Increase speed-to-containment and faster resolution.
› Reduce risk of data, network, and security breaches.
10
› Increase productivity of internal IT security FTEs.
› Reduce license and maintenance costs from having many point solutions to consolidating security solutions with Cisco.
› Increase savings with hardware, storage, and cooling costs by consolidating with Cisco.
Solution
The composite organization selected Cisco’s integrated security architecture, as it was the most complete end-to-end
security solution. The solution provided the composite organization with a way to minimize disparate security solutions with
overlapping features and controls and an effective way to address the volume and complexity of security attacks and threats
facing the organization.
“I can say with confidence that our investment in Cisco’s integrated security
architecture provides us with modern state-of-the-art security layers that are
well integrated into our Cisco products. Cisco’s comprehensive portfolio and
bundled offering helps us increase visibility and become more efficient in
securing our environment.”
~ CIO, global supplier of technology products and solutions
11
BENEFITS
The composite organization experienced a number of quantifiable benefits in this case study:
› Security software license and hardware cost savings.
› Reduced end user downtime by improving efficiencies in identifying threats, response rates, and reimaging devices.
› IT and security FTE productivity gains.
Security Software License And Hardware Cost Savings
The composite organization indicated that a key benefit from its investment in Cisco’s integrated security
architecture was the ability to get more effective software licensing pricing compared with having multiple security
vendors in its environment. For this study, the composite organization has an ELA with Cisco for consolidating its
security architecture under one company. The organization also was to see security hardware savings for the
secure routers, firewalls, servers, and other hardware requirements to deploy advanced malware protection,
network security, remote access, network policy and access controls, web and email security within its
environment.
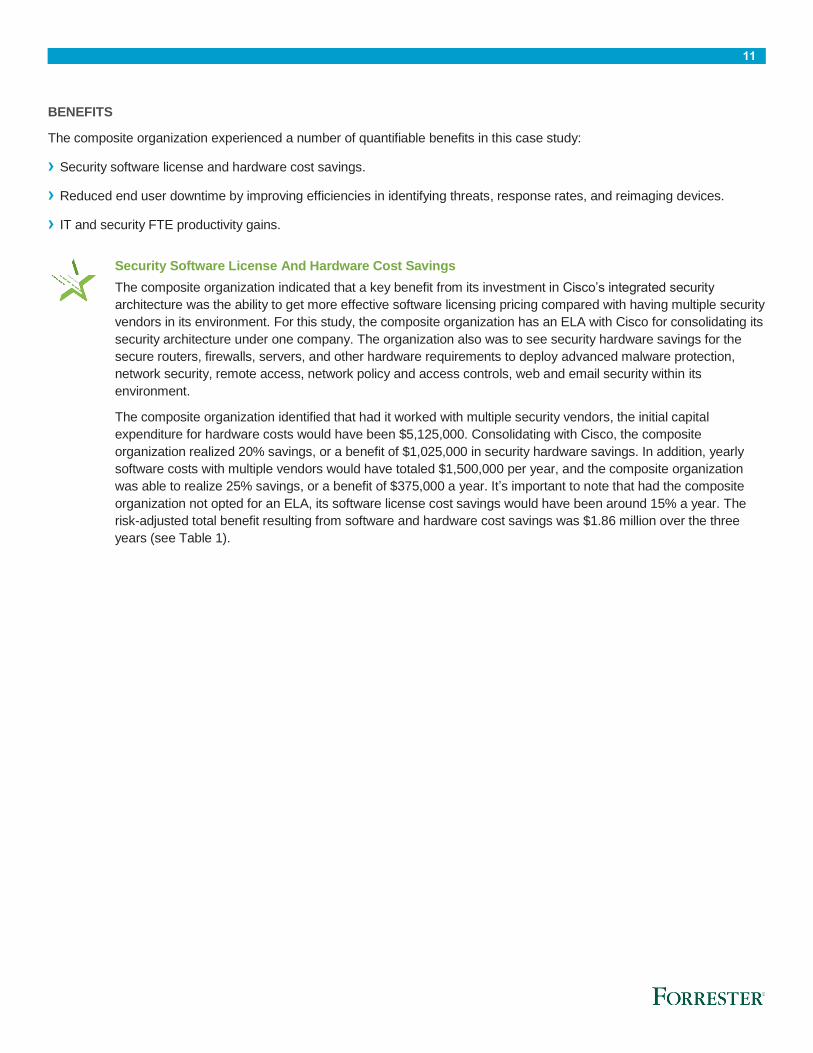
The composite organization identified that had it worked with multiple security vendors, the initial capital
expenditure for hardware costs would have been $5,125,000. Consolidating with Cisco, the composite
organization realized 20% savings, or a benefit of $1,025,000 in security hardware savings. In addition, yearly
software costs with multiple vendors would have totaled $1,500,000 per year, and the composite organization
was able to realize 25% savings, or a benefit of $375,000 a year. It’s important to note that had the composite
organization not opted for an ELA, its software license cost savings would have been around 15% a year. The
risk-adjusted total benefit resulting from software and hardware cost savings was $1.86 million over the three
years (see Table 1).
12
TABLE 1
Security Software License And Hardware Cost Savings
Ref. Metric Calculation Initial Year 1 Year 2 Year 3
A1
Security hardware investment
(firewalls, routers, servers,
appliances) through point
solutions
Interviewed
organization $5,125,000
A2
License costs for security point
products for composite
organization
Interviewed
organization $1,500,000 $1,500,000 $1,500,000
A3
Security software license and
hardware cost savings from point
solutions to Cisco’s integrated
security architecture
Interviewed
organization 20% 25% 25% 25%
At
Security software license and
hardware cost savings: capital
and operating cost efficiency
gained
A1*A3 /
A2*A3 $1,025,000 $375,000 $375,000 $375,000
Risk adjustment ↓5%
Atr
Security software license and
hardware cost savings: capital
and operating cost efficiency
gained (risk-adjusted)
$973,750 $356,250 $356,250 $356,250
Source: Forrester Research, Inc.
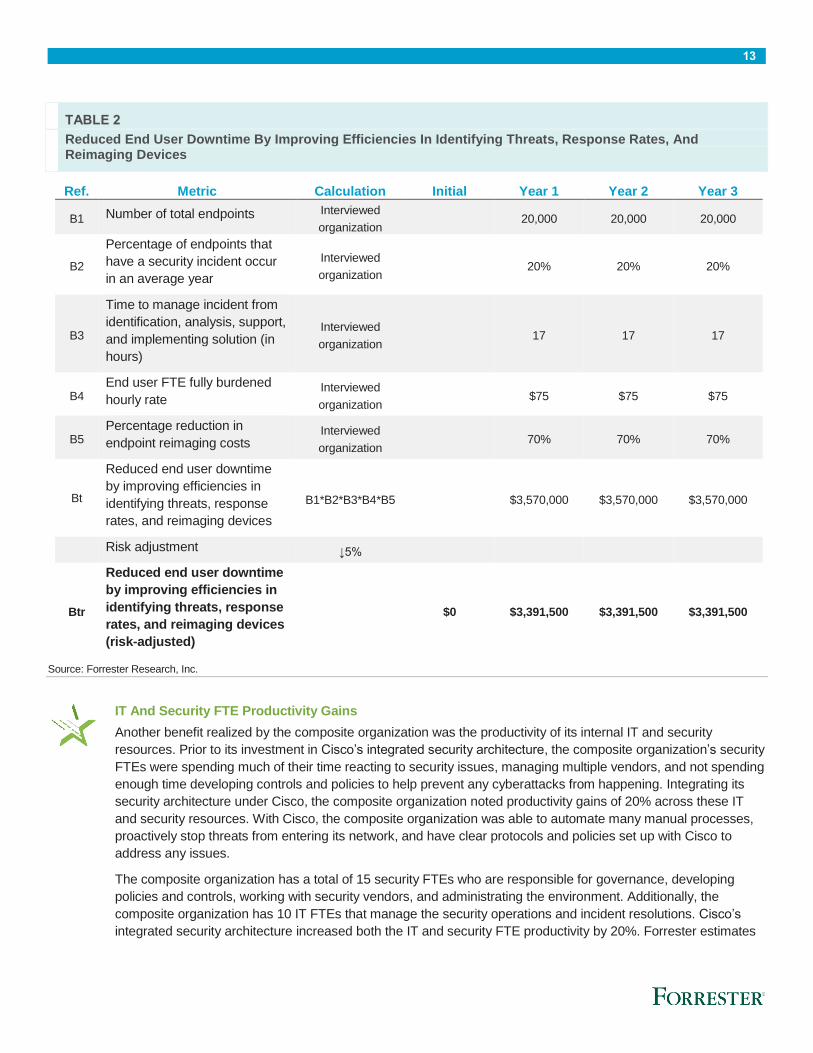
Reduced End User Downtime By Improving Efficiencies In Identifying Threats, Response Rates, And
Reimaging Devices
The composite organization also indicated that with Cisco’s integrated security architecture it was able to reduce
by 70% the downtime related to end user devices having a security issue. The composite organization was now
more effective at detecting, analyzing, and stopping malware and targeted attacks across all phases of a threat.
Prior to investing in Cisco’s integrated security architecture, the composite organization faced the challenge of a
security-related incident across 20% of its endpoints on a yearly basis. This put a considerable amount of
pressure on the internal teams to confirm the issue, research solutions/options, implement a solution, and
mitigate the threat to impact other users. The composite organization estimated that each security threat resulted
in about 17 hours of downtime for end users. The composite organization was also able to reduce the risk of
breaches by faster threat detection and incident resolution in their data centers and other critical infrastructure
environments.
The composite organization has a total of 20,000 endpoint devices, and at an average fully burdened rate for an
end user of $75 per hour, the benefit amounted to a yearly benefit of $3.4 million (see Table 2).
13
TABLE 2
Reduced End User Downtime By Improving Efficiencies In Identifying Threats, Response Rates, And Reimaging Devices
Ref. Metric Calculation Initial Year 1 Year 2 Year 3
B1 Number of total endpoints Interviewed
organization 20,000 20,000 20,000
B2
Percentage of endpoints that
have a security incident occur
in an average year
Interviewed
organization 20% 20% 20%
B3
Time to manage incident from
identification, analysis, support,
and implementing solution (in
hours)
Interviewed
organization 17 17 17
B4 End user FTE fully burdened
hourly rate Interviewed
organization $75 $75 $75
B5 Percentage reduction in
endpoint reimaging costs Interviewed
organization 70% 70% 70%
Bt
Reduced end user downtime
by improving efficiencies in
identifying threats, response
rates, and reimaging devices
B1*B2*B3*B4*B5 $3,570,000 $3,570,000 $3,570,000
Risk adjustment ↓5%
Btr
Reduced end user downtime
by improving efficiencies in
identifying threats, response
rates, and reimaging devices
(risk-adjusted)
$0 $3,391,500 $3,391,500 $3,391,500
Source: Forrester Research, Inc.
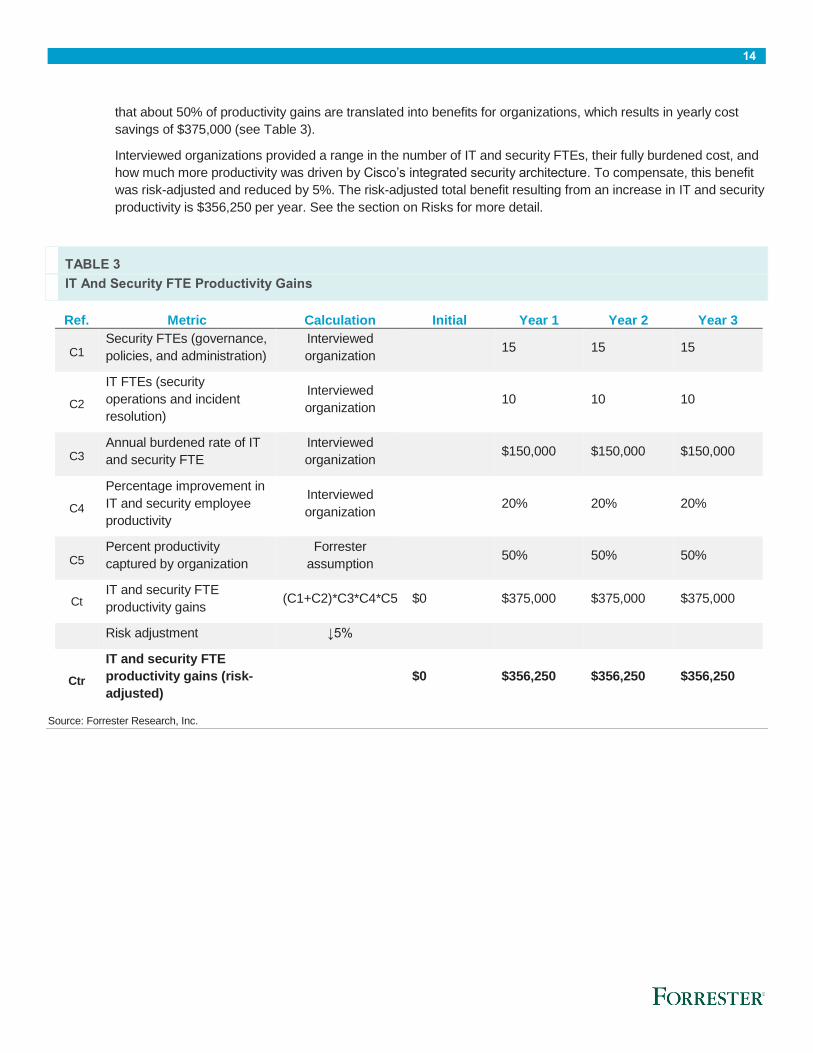
IT And Security FTE Productivity Gains
Another benefit realized by the composite organization was the productivity of its internal IT and security
resources. Prior to its investment in Cisco’s integrated security architecture, the composite organization’s security
FTEs were spending much of their time reacting to security issues, managing multiple vendors, and not spending
enough time developing controls and policies to help prevent any cyberattacks from happening. Integrating its
security architecture under Cisco, the composite organization noted productivity gains of 20% across these IT
and security resources. With Cisco, the composite organization was able to automate many manual processes,
proactively stop threats from entering its network, and have clear protocols and policies set up with Cisco to
address any issues.
The composite organization has a total of 15 security FTEs who are responsible for governance, developing
policies and controls, working with security vendors, and administrating the environment. Additionally, the
composite organization has 10 IT FTEs that manage the security operations and incident resolutions. Cisco’s
integrated security architecture increased both the IT and security FTE productivity by 20%. Forrester estimates
14
that about 50% of productivity gains are translated into benefits for organizations, which results in yearly cost
savings of $375,000 (see Table 3).
Interviewed organizations provided a range in the number of IT and security FTEs, their fully burdened cost, and
how much more productivity was driven by Cisco’s integrated security architecture. To compensate, this benefit
was risk-adjusted and reduced by 5%. The risk-adjusted total benefit resulting from an increase in IT and security
productivity is $356,250 per year. See the section on Risks for more detail.
TABLE 3
IT And Security FTE Productivity Gains
Ref. Metric Calculation Initial Year 1 Year 2 Year 3
C1 Security FTEs (governance,
policies, and administration)
Interviewed
organization 15 15 15
C2
IT FTEs (security
operations and incident
resolution)
Interviewed
organization 10 10 10
C3 Annual burdened rate of IT
and security FTE
Interviewed
organization $150,000 $150,000 $150,000
C4
Percentage improvement in
IT and security employee
productivity
Interviewed
organization 20% 20% 20%
C5 Percent productivity
captured by organization
Forrester
assumption 50% 50% 50%
Ct IT and security FTE
productivity gains (C1+C2)*C3*C4*C5 $0 $375,000 $375,000 $375,000
Risk adjustment ↓5%
Ctr
IT and security FTE
productivity gains (risk-
adjusted)
$0 $356,250 $356,250 $356,250
Source: Forrester Research, Inc.
15
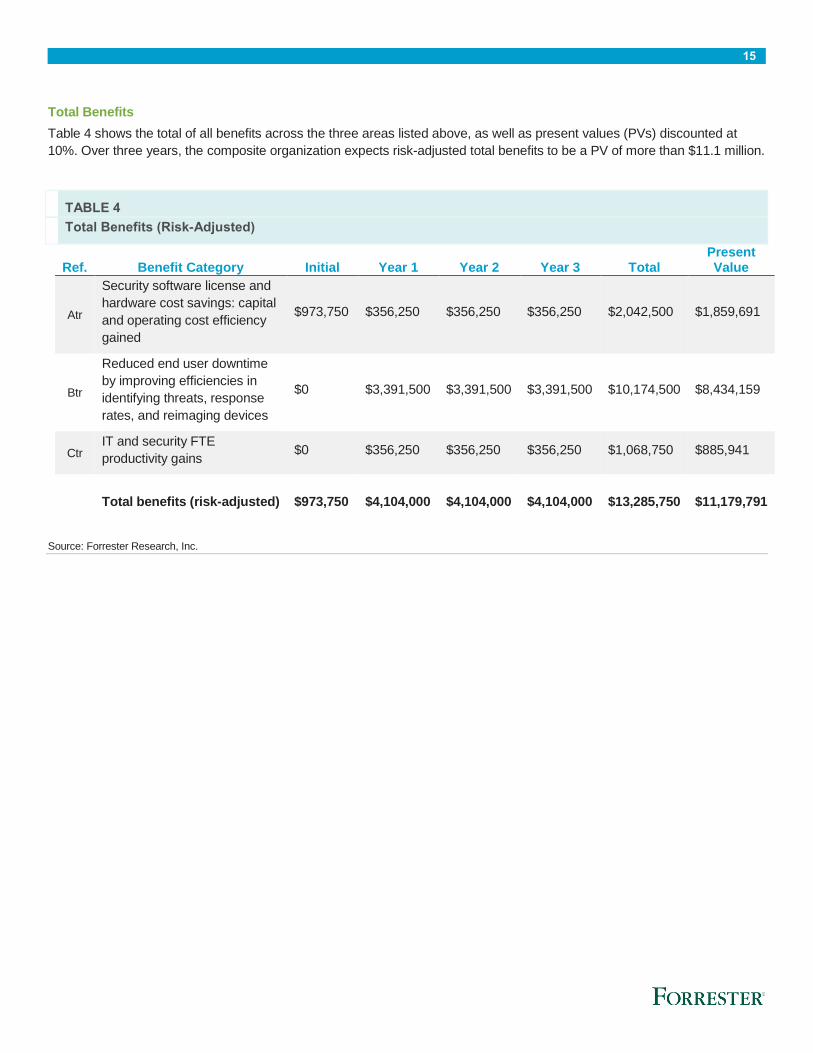
Total Benefits
Table 4 shows the total of all benefits across the three areas listed above, as well as present values (PVs) discounted at
10%. Over three years, the composite organization expects risk-adjusted total benefits to be a PV of more than $11.1 million.
TABLE 4
Total Benefits (Risk-Adjusted)
Ref. Benefit Category Initial Year 1 Year 2 Year 3 Total Present Value
Atr
Security software license and
hardware cost savings: capital
and operating cost efficiency
gained
$973,750 $356,250 $356,250 $356,250 $2,042,500 $1,859,691
Btr
Reduced end user downtime
by improving efficiencies in
identifying threats, response
rates, and reimaging devices
$0 $3,391,500 $3,391,500 $3,391,500 $10,174,500 $8,434,159
Ctr IT and security FTE
productivity gains $0 $356,250 $356,250 $356,250 $1,068,750 $885,941
Total benefits (risk-adjusted) $973,750 $4,104,000 $4,104,000 $4,104,000 $13,285,750 $11,179,791
Source: Forrester Research, Inc.
16
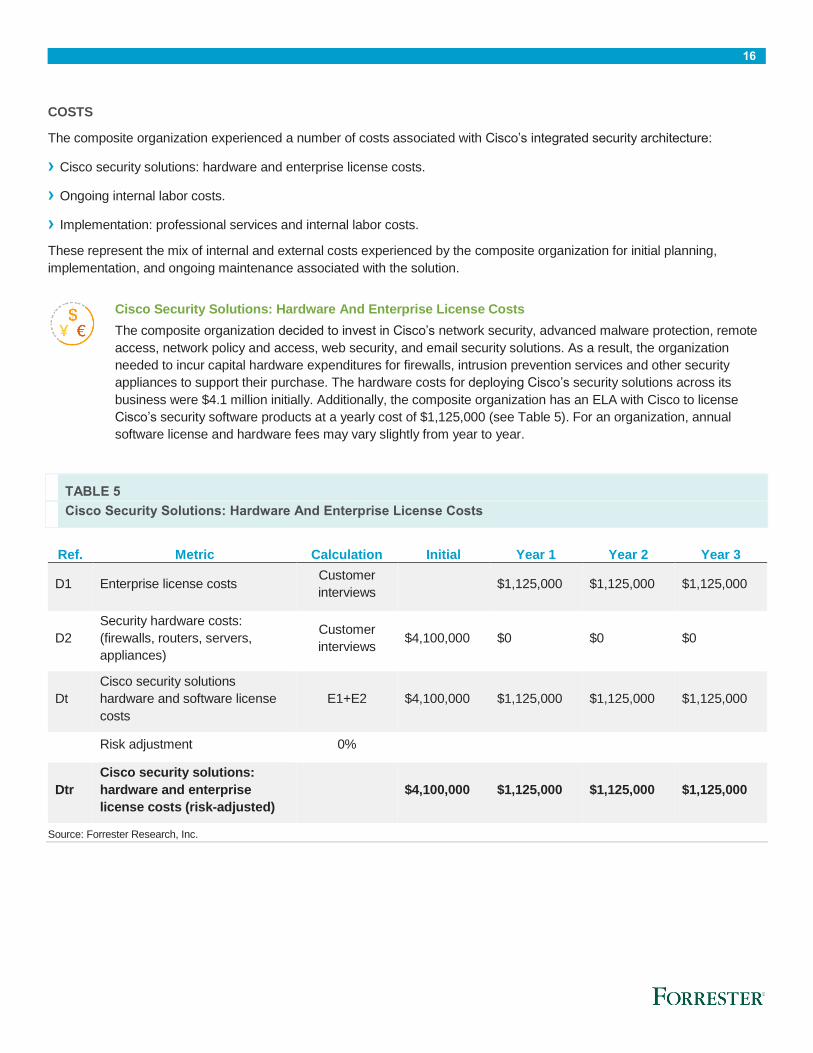
COSTS
The composite organization experienced a number of costs associated with Cisco’s integrated security architecture:
› Cisco security solutions: hardware and enterprise license costs.
› Ongoing internal labor costs.
› Implementation: professional services and internal labor costs.
These represent the mix of internal and external costs experienced by the composite organization for initial planning,
implementation, and ongoing maintenance associated with the solution.
Cisco Security Solutions: Hardware And Enterprise License Costs
The composite organization decided to invest in Cisco’s network security, advanced malware protection, remote
access, network policy and access, web security, and email security solutions. As a result, the organization
needed to incur capital hardware expenditures for firewalls, intrusion prevention services and other security
appliances to support their purchase. The hardware costs for deploying Cisco’s security solutions across its
business were $4.1 million initially. Additionally, the composite organization has an ELA with Cisco to license
Cisco’s security software products at a yearly cost of $1,125,000 (see Table 5). For an organization, annual
software license and hardware fees may vary slightly from year to year.
TABLE 5
Cisco Security Solutions: Hardware And Enterprise License Costs
Ref. Metric Calculation Initial Year 1 Year 2 Year 3
D1 Enterprise license costs Customer
interviews $1,125,000 $1,125,000 $1,125,000
D2
Security hardware costs:
(firewalls, routers, servers,
appliances)
Customer
interviews $4,100,000 $0 $0 $0
Dt
Cisco security solutions
hardware and software license
costs
E1+E2 $4,100,000 $1,125,000 $1,125,000 $1,125,000
Risk adjustment 0%
Dtr
Cisco security solutions:
hardware and enterprise
license costs (risk-adjusted)
$4,100,000 $1,125,000 $1,125,000 $1,125,000
Source: Forrester Research, Inc.
17
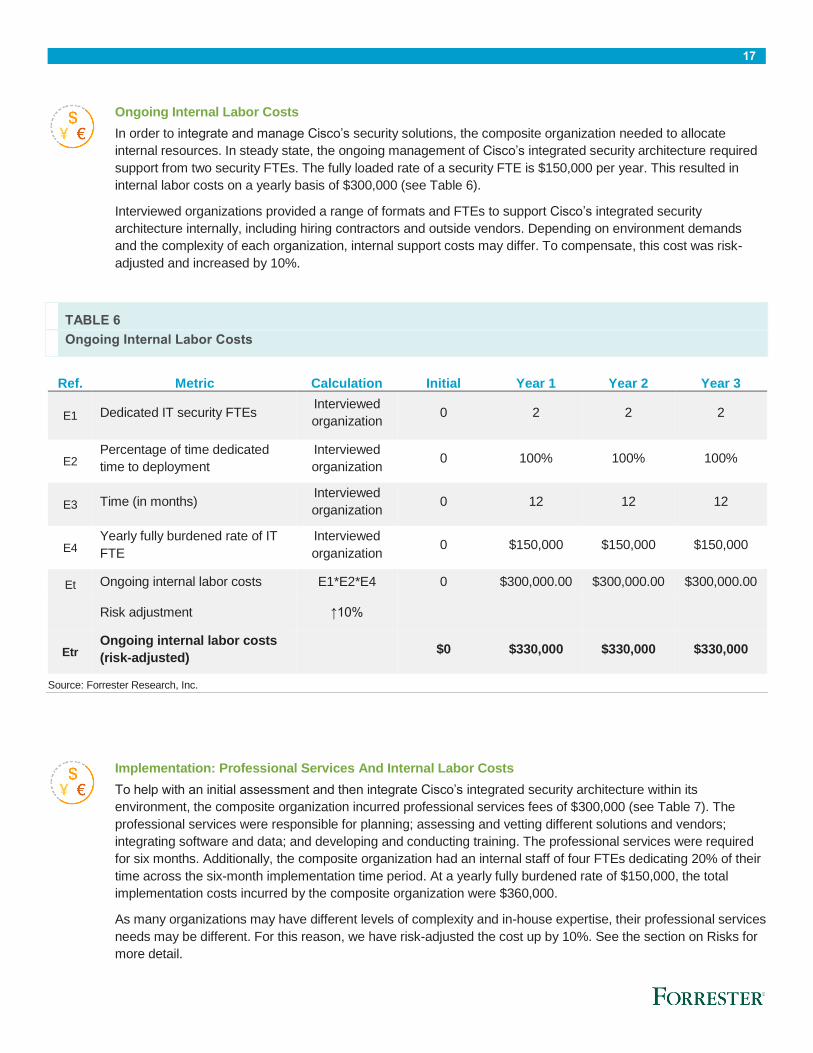
Ongoing Internal Labor Costs
In order to integrate and manage Cisco’s security solutions, the composite organization needed to allocate
internal resources. In steady state, the ongoing management of Cisco’s integrated security architecture required
support from two security FTEs. The fully loaded rate of a security FTE is $150,000 per year. This resulted in
internal labor costs on a yearly basis of $300,000 (see Table 6).
Interviewed organizations provided a range of formats and FTEs to support Cisco’s integrated security
architecture internally, including hiring contractors and outside vendors. Depending on environment demands
and the complexity of each organization, internal support costs may differ. To compensate, this cost was risk-
adjusted and increased by 10%.
TABLE 6
Ongoing Internal Labor Costs
Ref. Metric Calculation Initial Year 1 Year 2 Year 3
E1 Dedicated IT security FTEs Interviewed
organization 0 2 2 2
E2 Percentage of time dedicated
time to deployment
Interviewed
organization 0 100% 100% 100%
E3 Time (in months) Interviewed
organization 0 12 12 12
E4 Yearly fully burdened rate of IT
FTE
Interviewed
organization 0 $150,000 $150,000 $150,000
Et Ongoing internal labor costs E1*E2*E4 0 $300,000.00 $300,000.00 $300,000.00
Risk adjustment ↑10%
Etr Ongoing internal labor costs
(risk-adjusted) $0 $330,000 $330,000 $330,000
Source: Forrester Research, Inc.
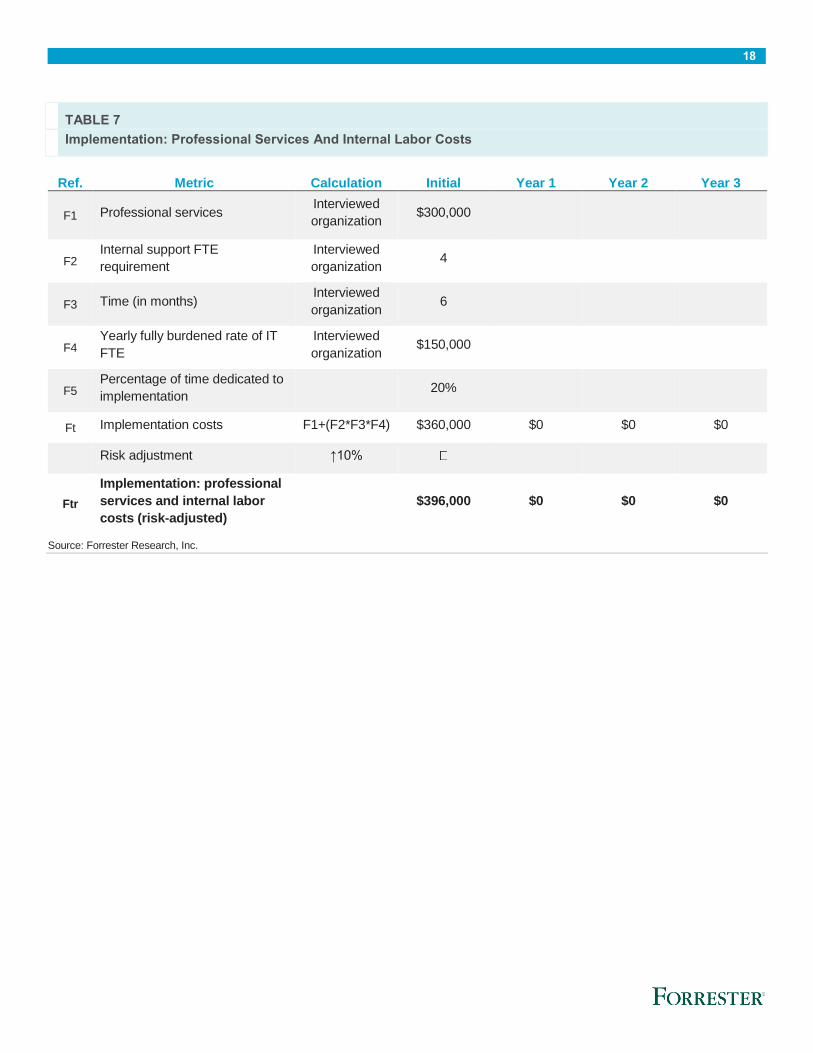
Implementation: Professional Services And Internal Labor Costs
To help with an initial assessment and then integrate Cisco’s integrated security architecture within its
environment, the composite organization incurred professional services fees of $300,000 (see Table 7). The
professional services were responsible for planning; assessing and vetting different solutions and vendors;
integrating software and data; and developing and conducting training. The professional services were required
for six months. Additionally, the composite organization had an internal staff of four FTEs dedicating 20% of their
time across the six-month implementation time period. At a yearly fully burdened rate of $150,000, the total
implementation costs incurred by the composite organization were $360,000.
As many organizations may have different levels of complexity and in-house expertise, their professional services
needs may be different. For this reason, we have risk-adjusted the cost up by 10%. See the section on Risks for
more detail.
18
TABLE 7
Implementation: Professional Services And Internal Labor Costs
Ref. Metric Calculation Initial Year 1 Year 2 Year 3
F1 Professional services Interviewed
organization $300,000
F2 Internal support FTE
requirement
Interviewed
organization 4
F3 Time (in months) Interviewed
organization 6
F4 Yearly fully burdened rate of IT
FTE
Interviewed
organization $150,000
F5 Percentage of time dedicated to
implementation 20%
Ft Implementation costs F1+(F2*F3*F4) $360,000 $0 $0 $0
Risk adjustment ↑10%
Ftr
Implementation: professional
services and internal labor
costs (risk-adjusted)
$396,000 $0 $0 $0
Source: Forrester Research, Inc.
19
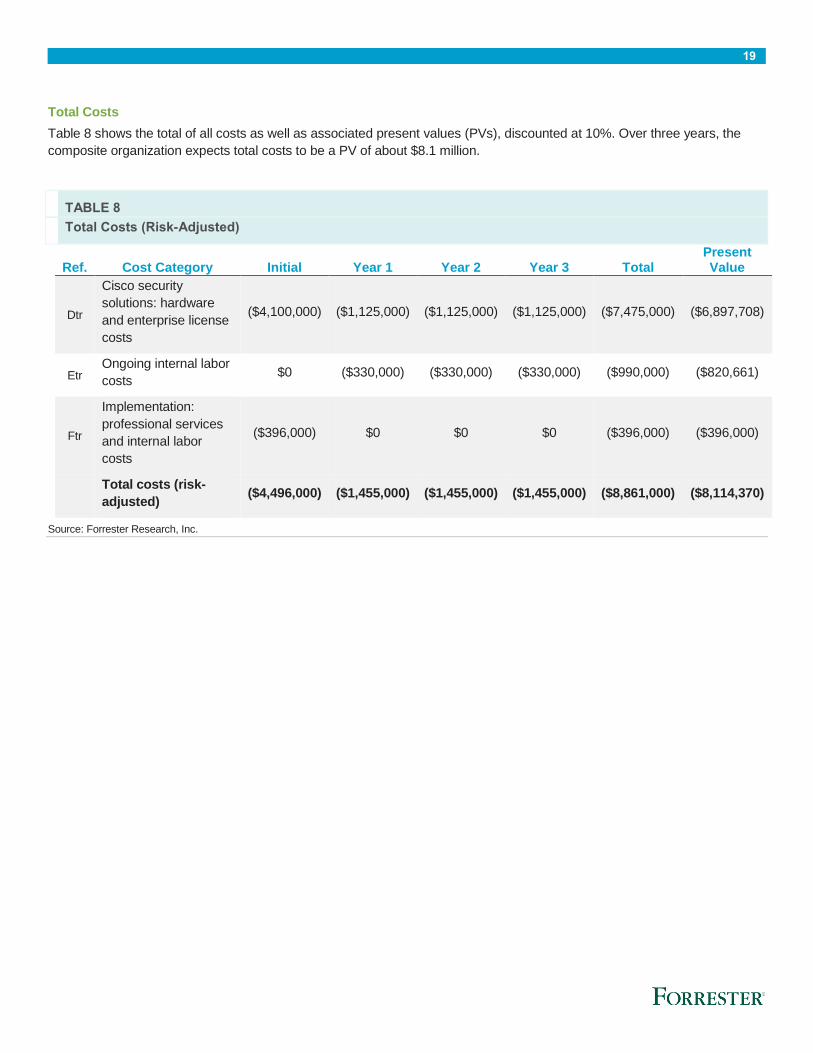
Total Costs
Table 8 shows the total of all costs as well as associated present values (PVs), discounted at 10%. Over three years, the
composite organization expects total costs to be a PV of about $8.1 million.
TABLE 8
Total Costs (Risk-Adjusted)
Ref. Cost Category Initial Year 1 Year 2 Year 3 Total Present Value
Dtr
Cisco security
solutions: hardware
and enterprise license
costs
($4,100,000) ($1,125,000) ($1,125,000) ($1,125,000) ($7,475,000) ($6,897,708)
Etr Ongoing internal labor
costs $0 ($330,000) ($330,000) ($330,000) ($990,000) ($820,661)
Ftr
Implementation:
professional services
and internal labor
costs
($396,000) $0 $0 $0 ($396,000) ($396,000)
Total costs (risk-
adjusted) ($4,496,000) ($1,455,000) ($1,455,000) ($1,455,000) ($8,861,000) ($8,114,370)
Source: Forrester Research, Inc.
20
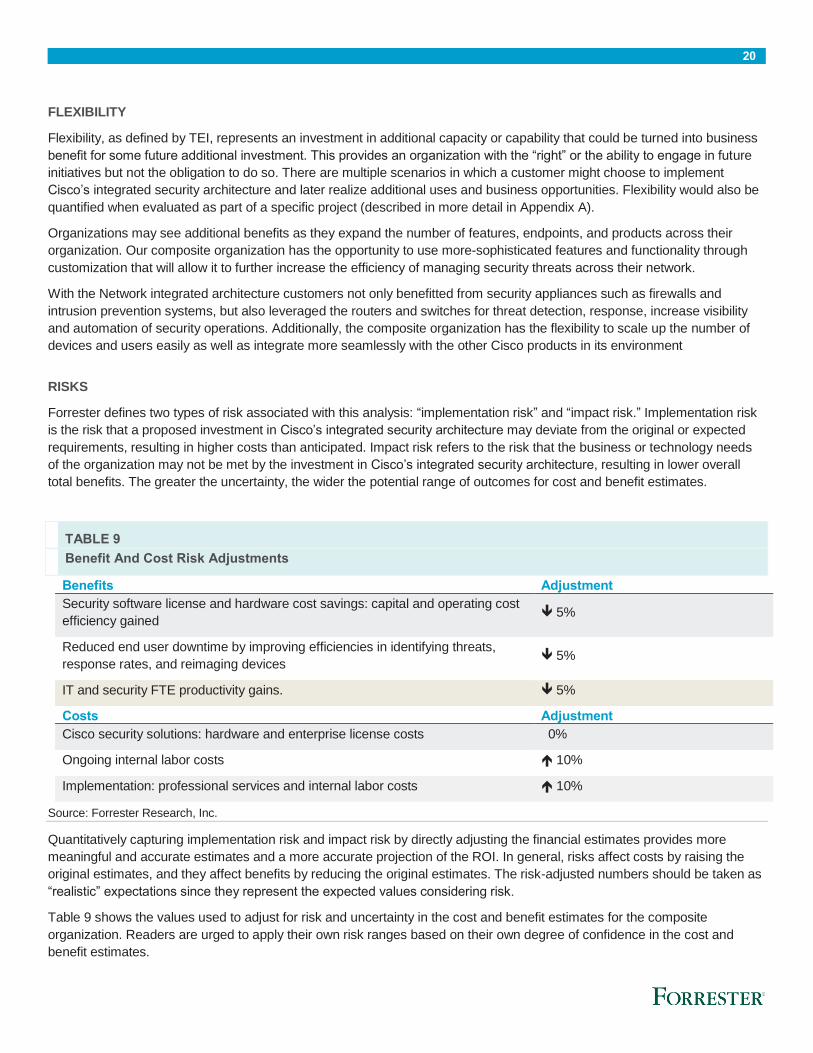
FLEXIBILITY
Flexibility, as defined by TEI, represents an investment in additional capacity or capability that could be turned into business
benefit for some future additional investment. This provides an organization with the “right” or the ability to engage in future
initiatives but not the obligation to do so. There are multiple scenarios in which a customer might choose to implement
Cisco’s integrated security architecture and later realize additional uses and business opportunities. Flexibility would also be
quantified when evaluated as part of a specific project (described in more detail in Appendix A).
Organizations may see additional benefits as they expand the number of features, endpoints, and products across their
organization. Our composite organization has the opportunity to use more-sophisticated features and functionality through
customization that will allow it to further increase the efficiency of managing security threats across their network.
With the Network integrated architecture customers not only benefitted from security appliances such as firewalls and
intrusion prevention systems, but also leveraged the routers and switches for threat detection, response, increase visibility
and automation of security operations. Additionally, the composite organization has the flexibility to scale up the number of
devices and users easily as well as integrate more seamlessly with the other Cisco products in its environment
RISKS
Forrester defines two types of risk associated with this analysis: “implementation risk” and “impact risk.” Implementation risk
is the risk that a proposed investment in Cisco’s integrated security architecture may deviate from the original or expected
requirements, resulting in higher costs than anticipated. Impact risk refers to the risk that the business or technology needs
of the organization may not be met by the investment in Cisco’s integrated security architecture, resulting in lower overall
total benefits. The greater the uncertainty, the wider the potential range of outcomes for cost and benefit estimates.
TABLE 9
Benefit And Cost Risk Adjustments
Benefits Adjustment
Security software license and hardware cost savings: capital and operating cost
efficiency gained 5%
Reduced end user downtime by improving efficiencies in identifying threats,
response rates, and reimaging devices 5%
IT and security FTE productivity gains. 5%
Costs Adjustment
Cisco security solutions: hardware and enterprise license costs 0%
Ongoing internal labor costs 10%
Implementation: professional services and internal labor costs 10%
Source: Forrester Research, Inc.
Quantitatively capturing implementation risk and impact risk by directly adjusting the financial estimates provides more
meaningful and accurate estimates and a more accurate projection of the ROI. In general, risks affect costs by raising the
original estimates, and they affect benefits by reducing the original estimates. The risk-adjusted numbers should be taken as
“realistic” expectations since they represent the expected values considering risk.
Table 9 shows the values used to adjust for risk and uncertainty in the cost and benefit estimates for the composite
organization. Readers are urged to apply their own risk ranges based on their own degree of confidence in the cost and
benefit estimates.
21
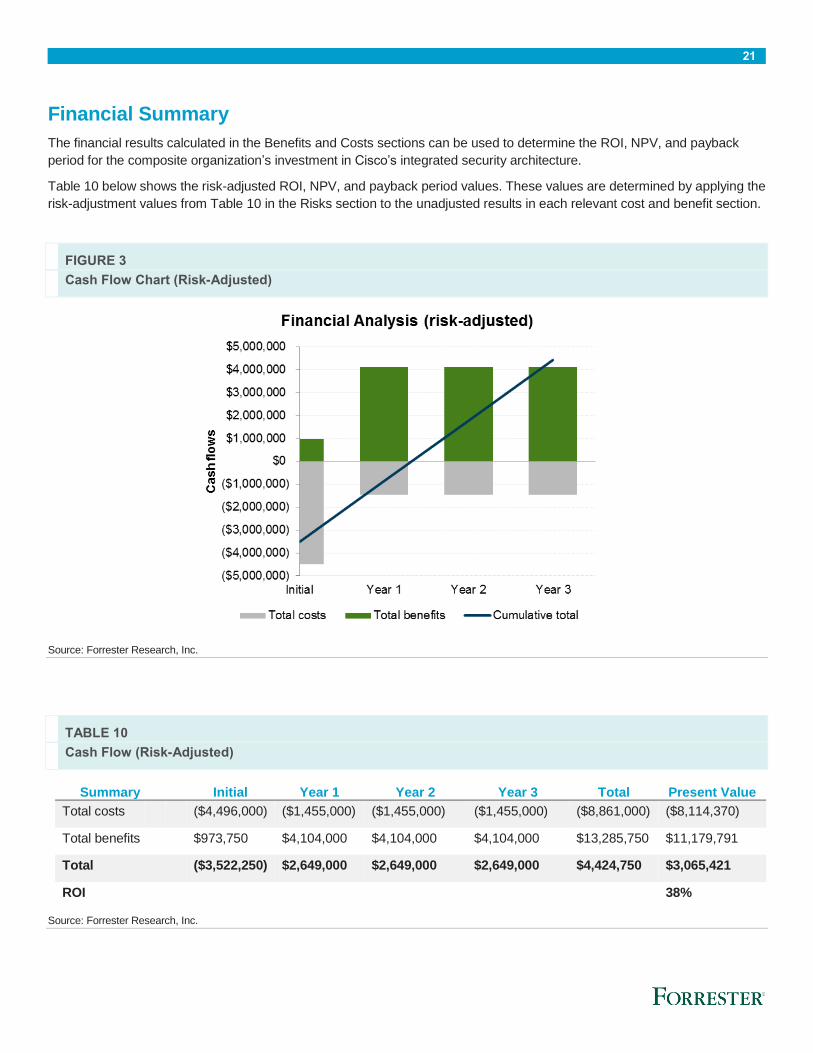
Financial Summary
The financial results calculated in the Benefits and Costs sections can be used to determine the ROI, NPV, and payback
period for the composite organization’s investment in Cisco’s integrated security architecture.
Table 10 below shows the risk-adjusted ROI, NPV, and payback period values. These values are determined by applying the
risk-adjustment values from Table 10 in the Risks section to the unadjusted results in each relevant cost and benefit section.
FIGURE 3
Cash Flow Chart (Risk-Adjusted)
Source: Forrester Research, Inc.
TABLE 10
Cash Flow (Risk-Adjusted)
Summary Initial Year 1 Year 2 Year 3 Total Present Value
Total costs ($4,496,000) ($1,455,000) ($1,455,000) ($1,455,000) ($8,861,000) ($8,114,370)
Total benefits $973,750 $4,104,000 $4,104,000 $4,104,000 $13,285,750 $11,179,791
Total ($3,522,250) $2,649,000 $2,649,000 $2,649,000 $4,424,750 $3,065,421
ROI 38%
Source: Forrester Research, Inc.
22
Cisco Security Overview
The following is provided by Cisco. Forrester has not validated any claims and does not endorse Cisco or its offerings.
Cisco Integrated Security Architecture
Cisco is building truly effective security and services that are simple, open and automated.
The Cisco security architecture, spanning the network, endpoint and cloud, delivers the ultimate security visibility and
responsiveness to detect more threats and remediate them faster.
Through a best of breed portfolio, world-class threat intelligence, leading services organization and an architectural
approach, Cisco delivers superior security solutions solving customers’ business and technical needs.
Cisco best of breed products come together into an architecture for more integrated threat defenses that detect and
remediate threats faster. This means greater security capability plus liberation from the challenges of complexity. It also
means a force-multiplier of effectiveness.
Why does this matter?
This matters because enterprises and government organizations have come to realize that an amalgamation of disparate point products is not offering the right outcomes. Most enterprises today manage dozens of point products that won’t work or operate together to provide the security enterprises require. This security environment undermines effectiveness and adds layers of complexity to a business.
Specifically, why would customers need solutions that are simple, open and automated because that is how effective
security can be achieved.
Cisco works to abstract what’s complex to make the most effective technologies simple. This is based on innovative and
technical products and solutions that make up the architecture. And Cisco has the unique ability to leverage the core
networks – Routers, Switches, Wireless, Data Center Infrastructure to play a critical role in security – Software defined
segmentation to set the right level of access control and policies, using the Network as a Sensor to detect threats faster and
leveraging the network to respond to threats.
The focus on Open drives integration across every level of the security stack, not only across our portfolio but also with
products provided by others. Open offerings set the stage for an ecosystem that integrates to become vastly more powerful
as products are used together.
This yields automation which is a force multiplier of effectiveness that removes the burden from teams and empowers
organizations with faster time to detect and respond.
Cisco understands that to protect it, you have to see it first. Whether it be our unparalleled presence in the network, unique
view into the cloud or the millions of end devices we secure, Cisco has the strongest visibility credentials in the industry.
Not only do we have the best global visibility into the threat landscape but we leverage the industry’s most robust
research capabilities thanks to Cisco Talos, our leading threat intelligence organization.
Cisco delivers measurable security success. There is a reason why 88% of the Fortune 100 currently leverage Cisco
Security for comprehensive protection. Because we reduce the time to detect threats from 100 days to 13 hours. And
of our course we give a 38% ROI advantage over competing point product approaches.
With Cisco Security’s technology and talent, companies are poised to securely take advantage of a new world of opportunity
that digital transformation enables.
Security organizations can finally have a better answer for the question, “Are we secure yet?”
23
Appendix A: Total Economic Impact™ Overview
Total Economic Impact is a methodology developed by Forrester Research that enhances a company’s technology decision-
making processes and assists vendors in communicating the value proposition of their products and services to clients. The
TEI methodology helps companies demonstrate, justify, and realize the tangible value of IT initiatives to both senior
management and other key business stakeholders. TEI assists technology vendors in winning, serving, and retaining
customers.
The TEI methodology consists of four components to evaluate investment value: benefits, costs, flexibility, and risks.
BENEFITS
Benefits represent the value delivered to the user organization — IT and/or business units — by the proposed product or
project. Often, product or project justification exercises focus just on IT cost and cost reduction, leaving little room to analyze
the effect of the technology on the entire organization. The TEI methodology and the resulting financial model place equal
weight on the measure of benefits and the measure of costs, allowing for a full examination of the effect of the technology on
the entire organization. Calculation of benefit estimates involves a clear dialogue with the user organization to understand
the specific value that is created. In addition, Forrester also requires that there be a clear line of accountability established
between the measurement and justification of benefit estimates after the project has been completed. This ensures that
benefit estimates tie back directly to the bottom line.
COSTS
Costs represent the investment necessary to capture the value, or benefits, of the proposed project. IT or the business units
may incur costs in the form of fully burdened labor, subcontractors, or materials. Costs consider all the investments and
expenses necessary to deliver the proposed value. In addition, the cost category within TEI captures any incremental costs
over the existing environment for ongoing costs associated with the solution. All costs must be tied to the benefits that are
created.
FLEXIBILITY
Within the TEI methodology, direct benefits represent one part of the investment value. While direct benefits can typically be
the primary way to justify a project, Forrester believes that organizations should be able to measure the strategic value of an
investment. Flexibility represents the value that can be obtained for some future additional investment building on top of the
initial investment already made. For instance, an investment in an enterprisewide upgrade of an office productivity suite can
potentially increase standardization (to increase efficiency) and reduce licensing costs. However, an embedded collaboration
feature may translate to greater worker productivity if activated. The collaboration can only be used with additional
investment in training at some future point. However, having the ability to capture that benefit has a PV that can be
estimated. The flexibility component of TEI captures that value.
RISKS
Risks measure the uncertainty of benefit and cost estimates contained within the investment. Uncertainty is measured in two
ways: 1) the likelihood that the cost and benefit estimates will meet the original projections and 2) the likelihood that the
estimates will be measured and tracked over time. TEI risk factors are based on a probability density function known as
“triangular distribution” to the values entered. At a minimum, three values are calculated to estimate the risk factor around
each cost and benefit.
24
Appendix B: Glossary
Discount rate: The interest rate used in cash flow analysis to take into account the time value of money. Companies set
their own discount rate based on their business and investment environment. Forrester assumes a yearly discount rate of
10% for this analysis. Organizations typically use discount rates between 8% and 16% based on their current environment.
Readers are urged to consult their respective organizations to determine the most appropriate discount rate to use in their
own environment.
Net present value (NPV): The present or current value of (discounted) future net cash flows given an interest rate (the
discount rate). A positive project NPV normally indicates that the investment should be made, unless other projects have
higher NPVs.
Present value (PV): The present or current value of (discounted) cost and benefit estimates given at an interest rate (the
discount rate). The PV of costs and benefits feed into the total NPV of cash flows.
Payback period: The breakeven point for an investment. This is the point in time at which net benefits (benefits minus costs)
equal initial investment or cost.
Return on investment (ROI): A measure of a project’s expected return in percentage terms. ROI is calculated by dividing
net benefits (benefits minus costs) by costs.
A NOTE ON CASH FLOW TABLES
The following is a note on the cash flow tables used in this study (see the example table below). The initial investment
column contains costs incurred at “time 0” or at the beginning of Year 1. Those costs are not discounted. All other cash flows
in years 1 through 3 are discounted using the discount rate of 10% at the end of the year. PV calculations are calculated for
each total cost and benefit estimate. NPV calculations are not calculated until the summary tables are the sum of the initial
investment and the discounted cash flows in each year.
Sums and present value calculations of the Total Benefits, Total Costs, and Cash Flow tables may not exactly add up, as
some rounding may occur.
TABLE [EXAMPLE]
Example Table
Ref. Metric Calculation Year 1 Year 2 Year 3
Source: Forrester Research, Inc.
Related Documents


