The Top 6 Canadian Banks: Selected Indicators of Q2 and 1 st Half 2014 Results

The Top 6 Canadian Banks - Selected Indicators of Q2 and YTD 2014 Results - DPershad
Dec 27, 2015
A brief review of the business performance of the top 6 Canadian banks, in terms of key indicators, for Q2 and 1st Half FY2014
Welcome message from author
This document is posted to help you gain knowledge. Please leave a comment to let me know what you think about it! Share it to your friends and learn new things together.
Transcript

The Top 6 Canadian Banks: Selected Indicators of Q2 and 1st Half 2014 Results

Canada's Top 6 Banks – Growth for Some in the 1st Half of 2014
The top 6 Canadian banks reported 1st Half FY 2014 collective net income of $16.2 billion, or an increase of 7.6% vs. the year before.
While 4 of the 6 top Canadian banks improved their net income vs. the 1st half of 2013 led by TD and RBC, both CIBC* and National Bank registered declines of -64.5% and -13.2% respectively
2
* CIBC results for the second quarter of 2014 were affected by (among other things) $543 million ($543 million after-tax, or $1.34 per share) of charges relating to First Caribbean International Bank Limited (CIBC First Caribbean), comprising a non-cash goodwill impairment charge of $420 million ($420 million after-tax) and loan losses of $123 million

Key Performance Indicators
Among the key performance indicators for the top 6 banks are:
• Total Revenue
• Net Income
• ROE (Return on Equity)
• EPS (Earnings per Share)
The following charts show how each bank performed in a universe of top 6 bank results.(Sources: Reported Top 6 Banks’ Q2 and YTD 2014 results)
3

Top 6 Banks – Q2 2014 % Share of Top 6 Revenue
• TD showed the greatest % increase in total revenue for Q2 VYA, while RBC continued to lead in absolute dollars
• National Bank showed a -7.7% decline in total revenue VYA
4
Total Revenue $MM - Q2 2014 $MM - Q2 2013 % Change VYA Total Revenue % Share of Top 6
RBC 8,270.0 7,717.0 7.2 RBC 28
TD 7,435.0 6,607.0 12.5 TD 25
Scotia 5,725.0 5,213.0 9.8 Scotia 19
BMO 4,041.0 3,893.0 3.8 BMO 14
CIBC 3,167.0 3,124.0 1.4 CIBC 11
National Bank 1,276.0 1,383.0 -7.7 National Bank 4
TOTAL 29,914.0 27,937.0 7.1

Top 6 Banks – 1st Half 2014 % Share of Top 6 Revenue
• Similarly, while RBC continued to lead in absolute top 6 share of total revenue for the 1st half of FY 2014, TD showed the greatest % growth VYA, followed by Scotiabank
5
Total Revenue $MM - 1st half 2014 $MM - 1st half 2013 % Change VYA Total Revenue % Share of Top 6
RBC 16,724.0 15,575.0 7.4 RBC 28
TD 15,000.0 13,174.0 13.9 TD 25
Scotia 11,370.0 10,384.0 9.5 Scotia 19
BMO 8,163.0 7,925.0 3.0 BMO 13
CIBC 6,801.0 6,289.0 8.1 CIBC 11
National Bank 2,640.0 2,615.0 1.0 National Bank 4
60,698.0 55,962.0 8.5 0

Top 6 Banks – Q2 2014 % Share of Top 6 Net Income
6
• Not unexpectedly, RBC led in share of total net income for Q2, while TD showed the greatest % growth, albeit just a little ahead of RBC
• Both CIBS and National Bank showed notable declines in net income VYA
Reported Net
Income $ - Q2 2014 $ - Q2 2013 % Change VYA
Reported Net
Income % Share of Top 6
RBC 2,201.0 1,909.0 15.3 RBC 28
TD 1,988.0 1,717.0 15.8 TD 26
Scotia 1,800.0 1,582.0 13.8 Scotia 23
BMO 1,076.0 962.0 11.9 BMO 14
CIBC 306.0 862.0 -64.5 CIBC 4
National Bank 362.0 417.0 -13.2 National Bank 5
7,733.0 7,449.0 3.8

Top 6 Banks – 1st Half 2014 % Share of Top 6 Net Income
7
• On a YTD basis, TD showed the greatest growth in net income for the first half of FY 2014, while RBC led slightly in terms of net income share of the top 6 banks
• Both CIBS and National Bank showed declines in net income VYA
Reported Net
Income $ -1st half 2014 $ - 1st half 2013 % Change VYA
Reported Net
Income % Share of Top 6
RBC 4,293.0 3,956.0 8.5 RBC 26
TD 4,030.0 3,501.0 15.1 TD 25
Scotia 3,509.0 3,187.0 10.1 Scotia 22
BMO 2,137.0 1,998.0 7.0 BMO 13
CIBC 1,483.0 1,647.0 -10.0 CIBC 9
National Bank 767.0 790.0 -2.9 National Bank 5
16,219.0 15,079.0 7.6
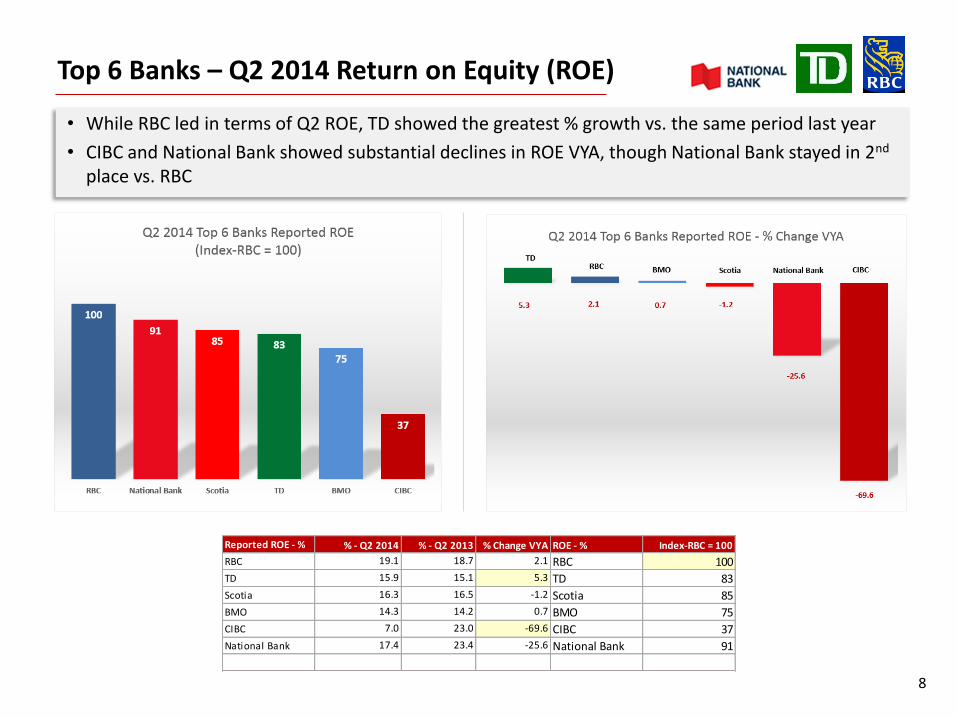
Top 6 Banks – Q2 2014 Return on Equity (ROE)
8
• While RBC led in terms of Q2 ROE, TD showed the greatest % growth vs. the same period last year
• CIBC and National Bank showed substantial declines in ROE VYA, though National Bank stayed in 2nd
place vs. RBC
Reported ROE - % % - Q2 2014 % - Q2 2013 % Change VYA ROE - % Index-RBC = 100
RBC 19.1 18.7 2.1 RBC 100
TD 15.9 15.1 5.3 TD 83
Scotia 16.3 16.5 -1.2 Scotia 85
BMO 14.3 14.2 0.7 BMO 75
CIBC 7.0 23.0 -69.6 CIBC 37
National Bank 17.4 23.4 -25.6 National Bank 91

Top 6 Banks – 1st Half 2014 Return on Equity (ROE)
9
• Only TD showed an increase in ROE for the 1st half of FY 2014, while RBC led in % ROE
• Despite a decline, National Bank stayed 2nd to RBC in reported ROE
Reported ROE - % % - 1st half 2014 % - 1st half 2013 % Change VYA ROE - % Index-RBC = 100
RBC 18.6 19.4 -4.1 RBC 100
TD 16.2 15.3 5.9 TD 87
Scotia 15.9 16.7 -4.8 Scotia 85
BMO 14.3 14.6 -2.1 BMO 77
CIBC 17.2 21.7 -20.7 CIBC 92
National Bank 18.4 19.3 -4.7 National Bank 99
0.0 0.0

Top 6 Banks Q2 2014 Earnings Per Share (EPS)
• Preventing a clean sweep by RBC, National Bank led in Earnings per Share (EPS)
• Both CIBC and RBC however posted significant improvements vs. Q3 2011
10
• While RBC led in the greatest % change in Q2 EPS VYA, BMO led in terms of EPS, indexing at 109 vs. RBC
• CIBC showed a substantial decline in EPS for Q2 VYA
Reported EPS
(diluted) $ - Q2 2014 $ - Q2 2013 % Change VYA EPS Index-RBC = 100
RBC 1.47 1.25 17.6 RBC 100
TD 1.04 0.89 16.9 TD 71
Scotia 1.39 1.22 13.9 Scotia 95
BMO 1.60 1.40 14.3 BMO 109
CIBC 0.73 2.09 -65.1 CIBC 50
National Bank 1.05 1.00 5.0 National Bank 71

Top 6 Banks 1st Half 2014 Earnings Per Share (EPS)
• Preventing a clean sweep by RBC, National Bank led in Earnings per Share (EPS)
• Both CIBC and RBC however posted significant improvements vs. Q3 2011
11
• While showing declines on other indicators, CIBC led in reported EPS for the 1st half of 2014
• Even though TD led in its % growth in EPS VYA, it ranked last among the top 6 banks
Reported EPS
(diluted) $ - 1st half 2014 $ - 1st half 2013 % Change VYA EPS Index-RBC = 100
RBC 2.85 2.59 10.0 RBC 100
TD 2.11 1.82 15.9 TD 74
Scotia 2.71 2.46 10.2 Scotia 95
BMO 3.18 2.91 9.3 BMO 112
CIBC 3.61 3.96 -8.8 CIBC 127
National Bank 2.14 1.97 8.6 National Bank 75


Related Documents