The Tohoku Tsunami An Event That Should Have Been Expected and Could Have Been Worse Philip Watts Woody Epstein

Welcome message from author
This document is posted to help you gain knowledge. Please leave a comment to let me know what you think about it! Share it to your friends and learn new things together.
Transcript
The Tohoku Tsunami
An Event That Should Have BeenExpected and Could Have Been Worse
Philip WattsWoody Epstein
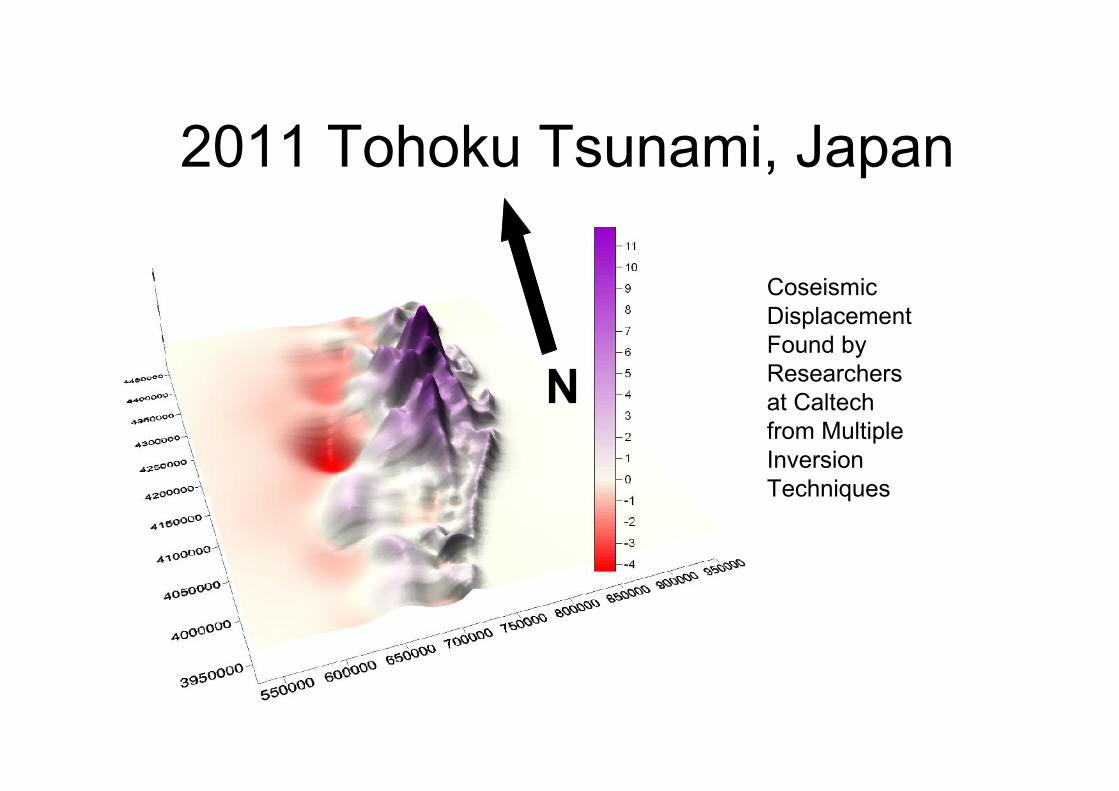
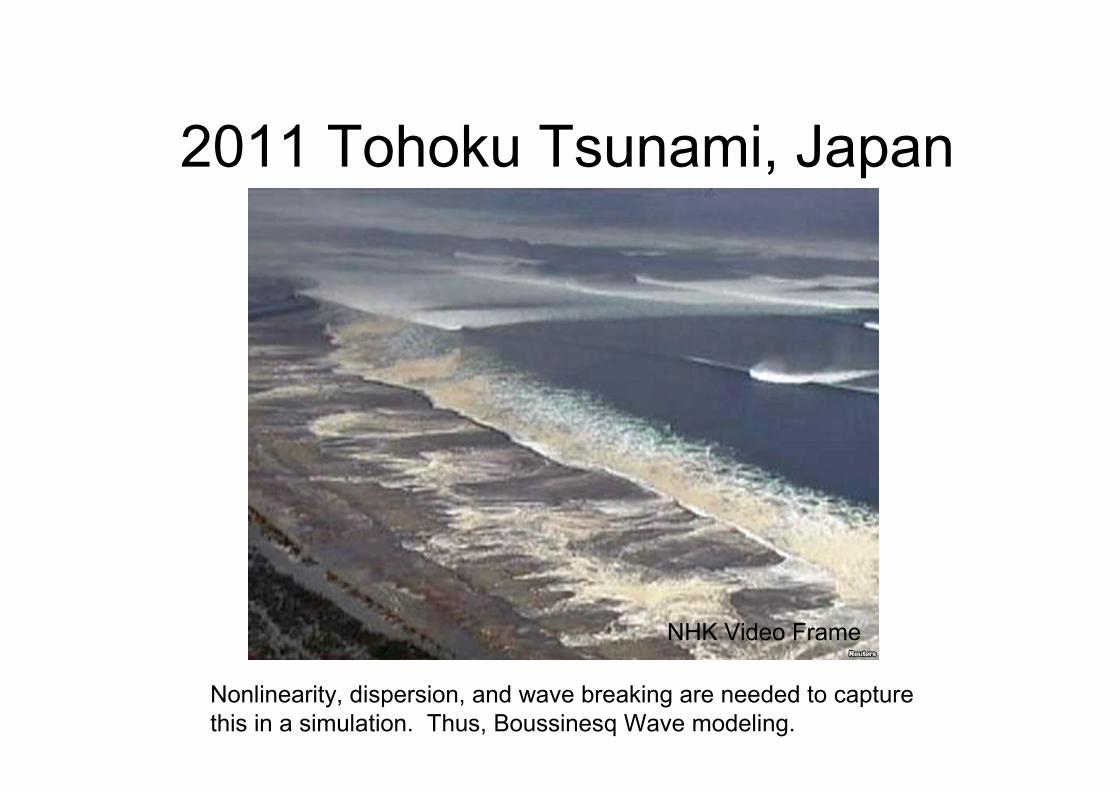
2011 Tohoku Tsunami, Japan
CoseismicDisplacementFound byResearchersat Caltechfrom MultipleInversionTechniques
N
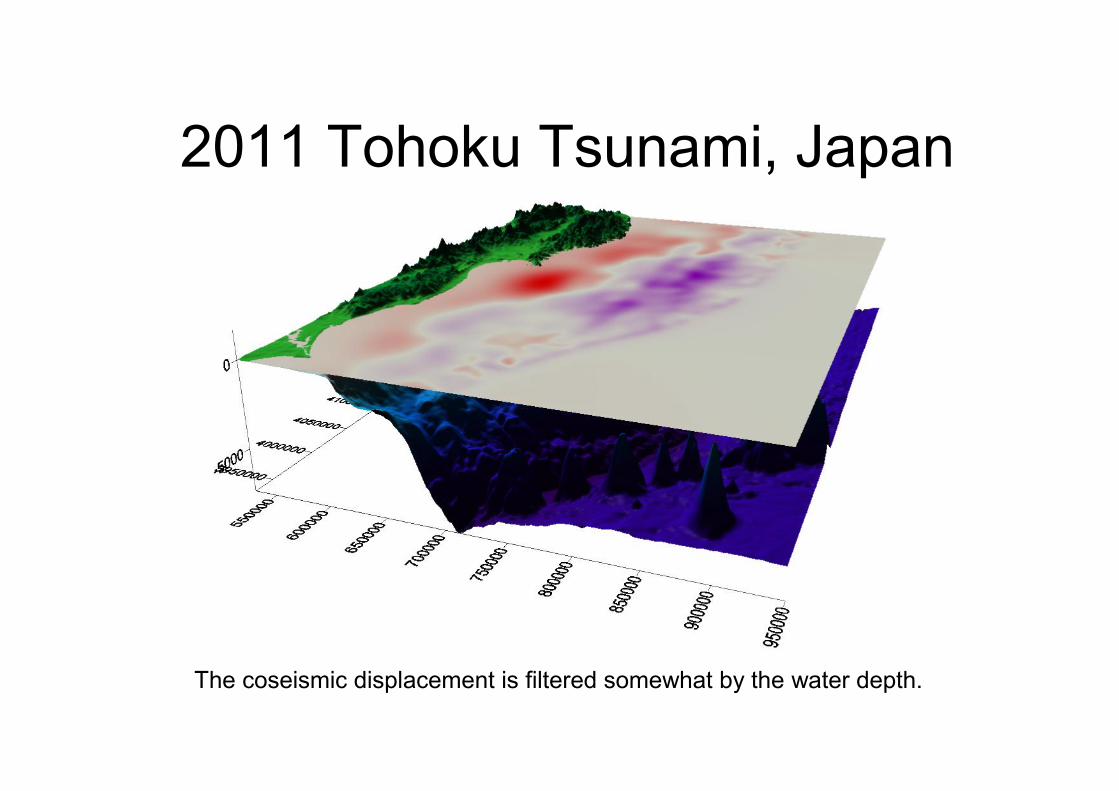
2011 Tohoku Tsunami, Japan
The coseismic displacement is filtered somewhat by the water depth.
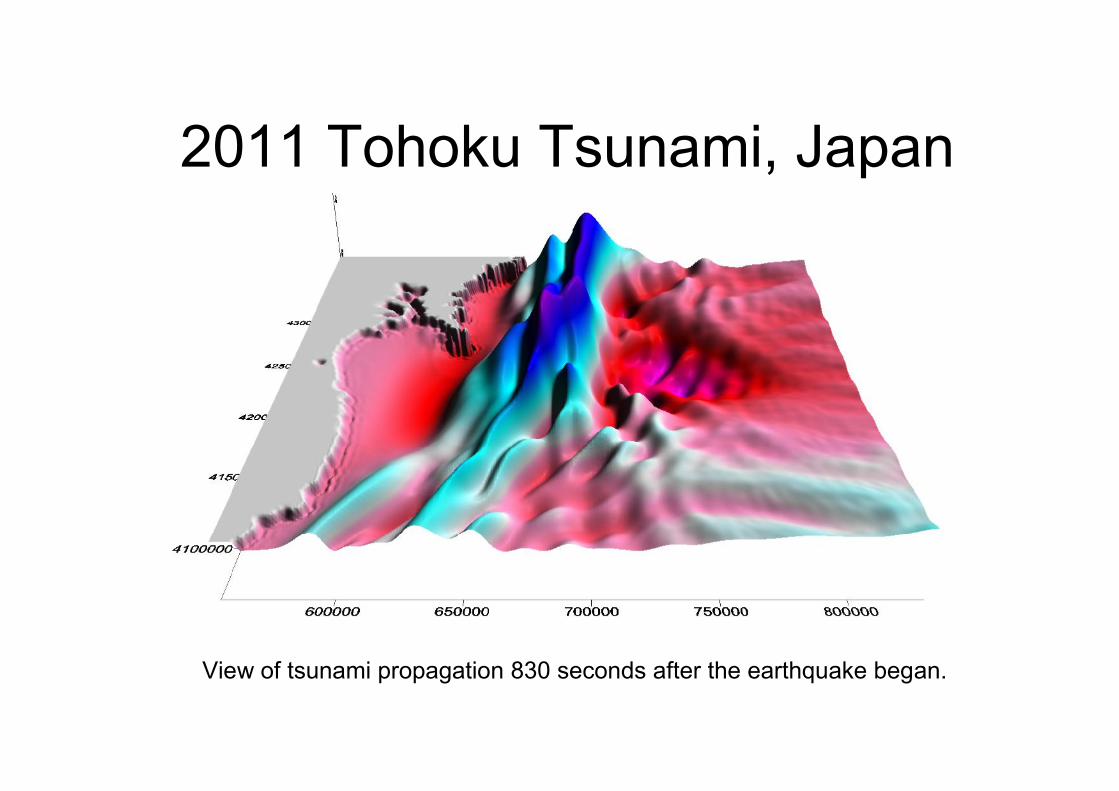
2011 Tohoku Tsunami, Japan
View of tsunami propagation 830 seconds after the earthquake began.
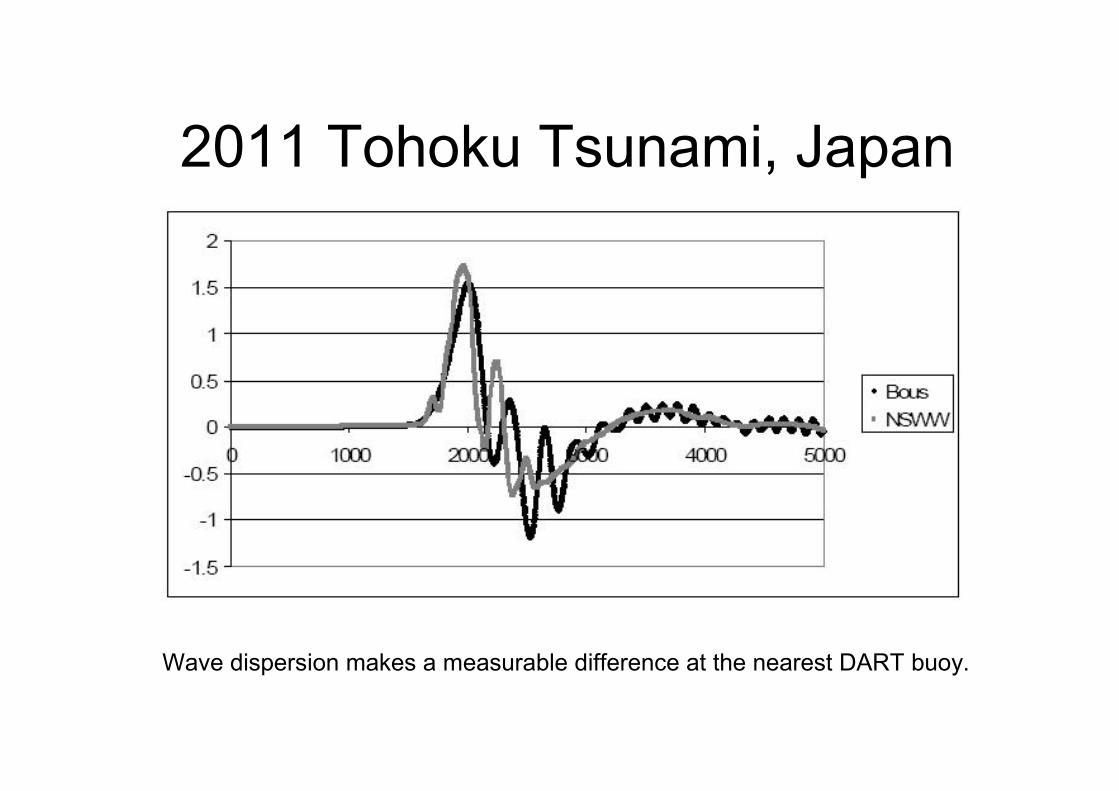
2011 Tohoku Tsunami, Japan
Wave dispersion makes a measurable difference at the nearest DART buoy.
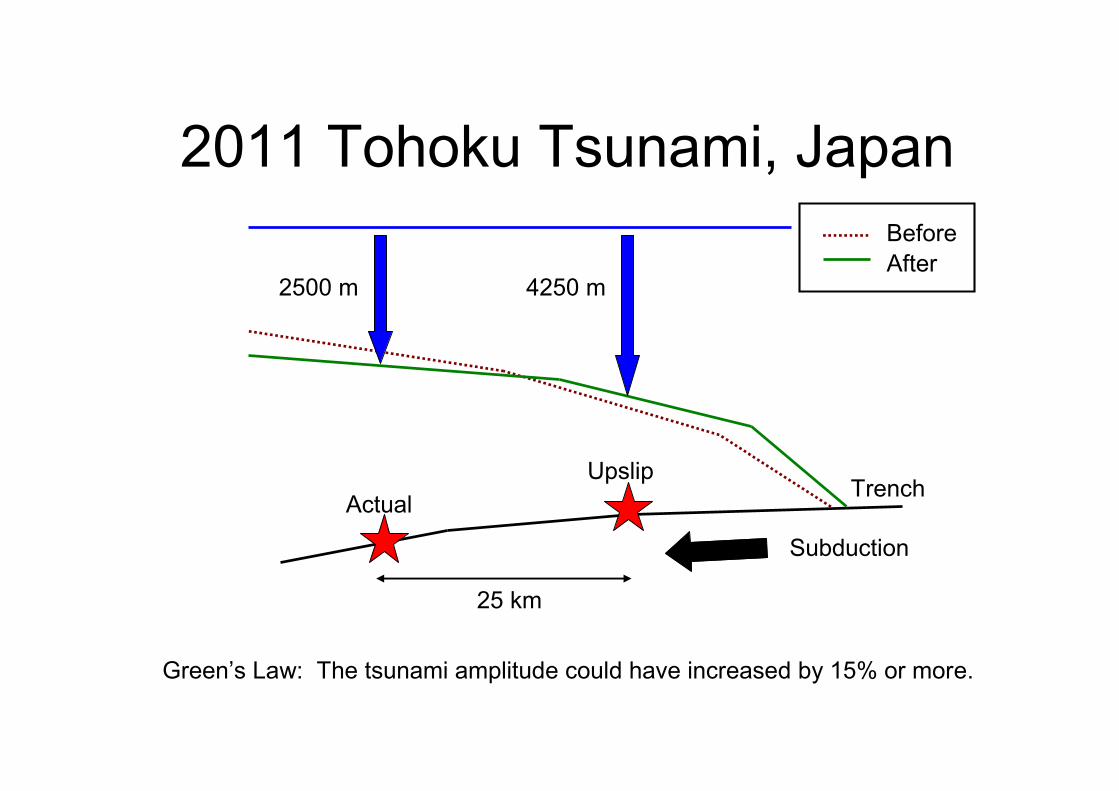
2011 Tohoku Tsunami, Japan
Subduction
4250 m
Green’s Law: The tsunami amplitude could have increased by 15% or more.
Trench
BeforeAfter
2500 m
ActualUpslip
25 km
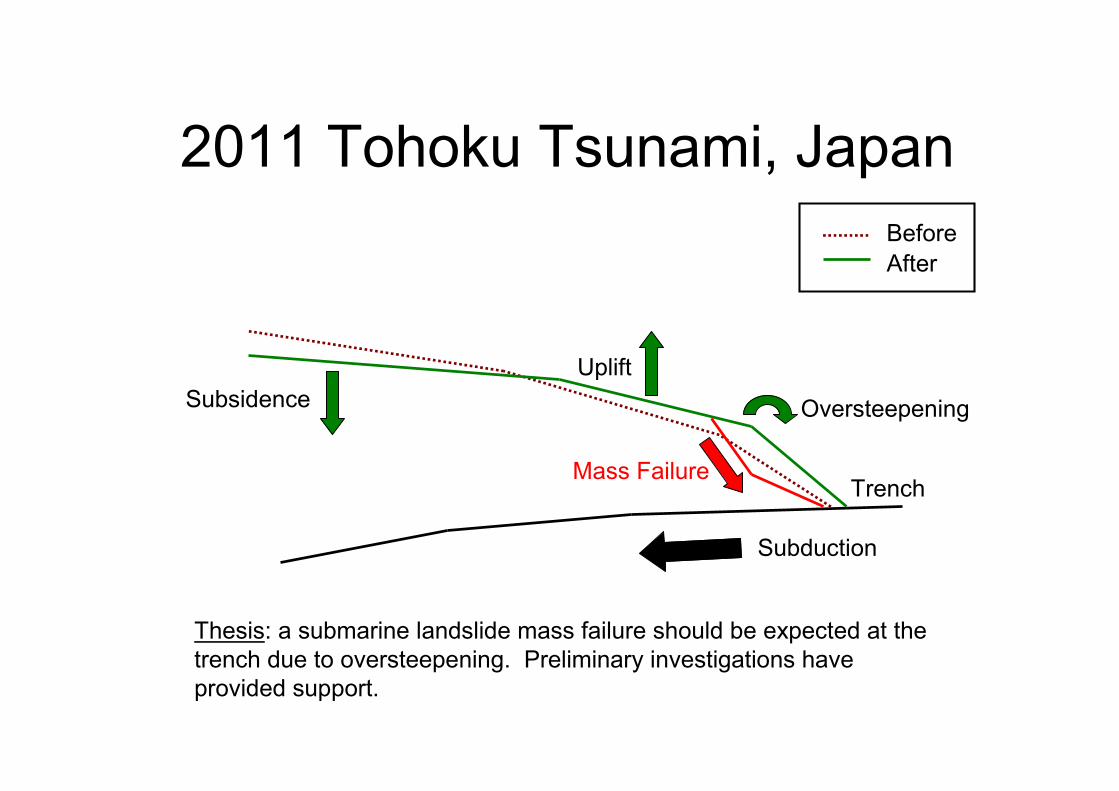
2011 Tohoku Tsunami, Japan
Subduction
Subsidence
Thesis: a submarine landslide mass failure should be expected at thetrench due to oversteepening. Preliminary investigations haveprovided support.
Trench
Uplift
BeforeAfter
Oversteepening
Mass Failure
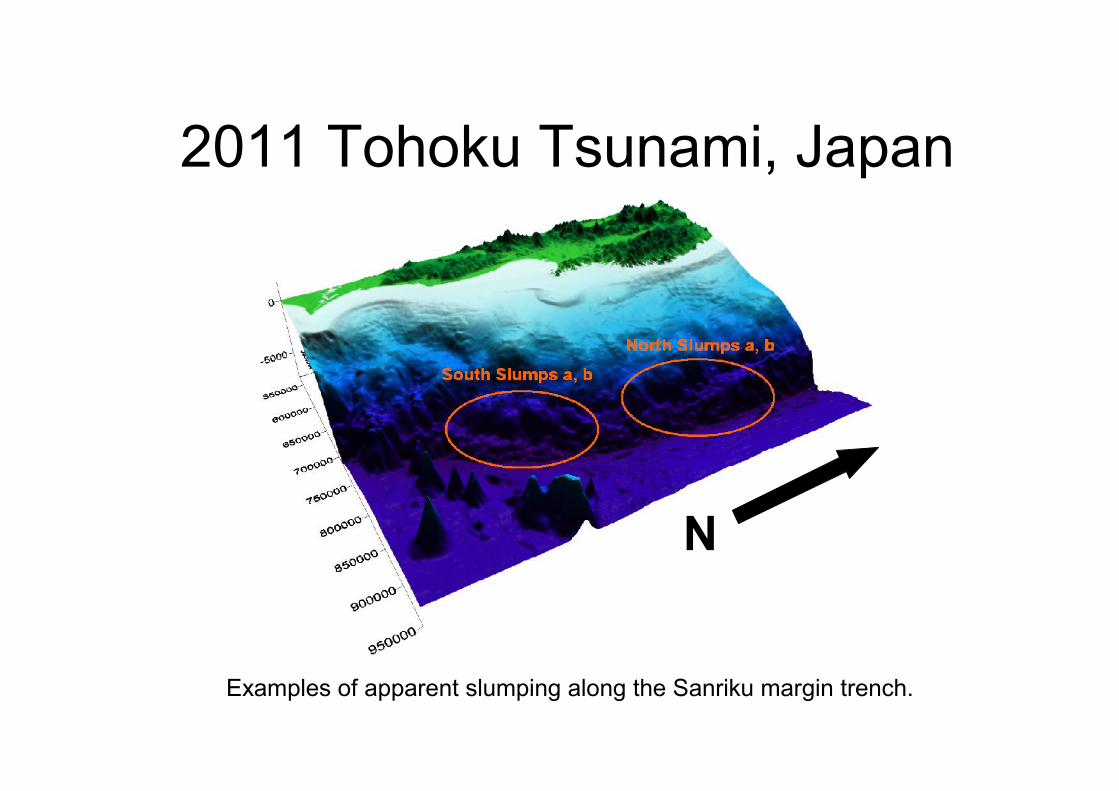
2011 Tohoku Tsunami, Japan
Examples of apparent slumping along the Sanriku margin trench.
N
2011 Tohoku Tsunami, Japan
Nonlinearity, dispersion, and wave breaking are needed to capturethis in a simulation. Thus, Boussinesq Wave modeling.
NHK Video Frame
Probabilistic Tsunami HazardSimulation of Fukushima Daiichi
Using Geowave and PerfectWave
Philip WattsWoody Epstein
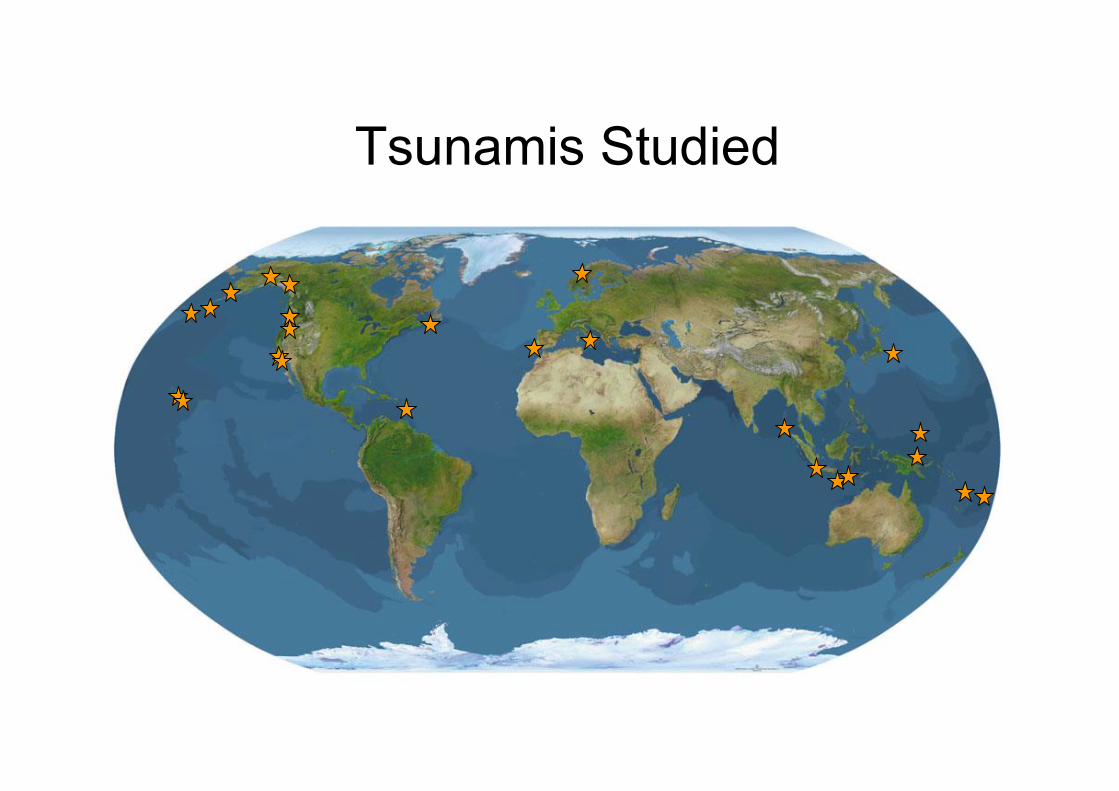
Tsunamis Studied
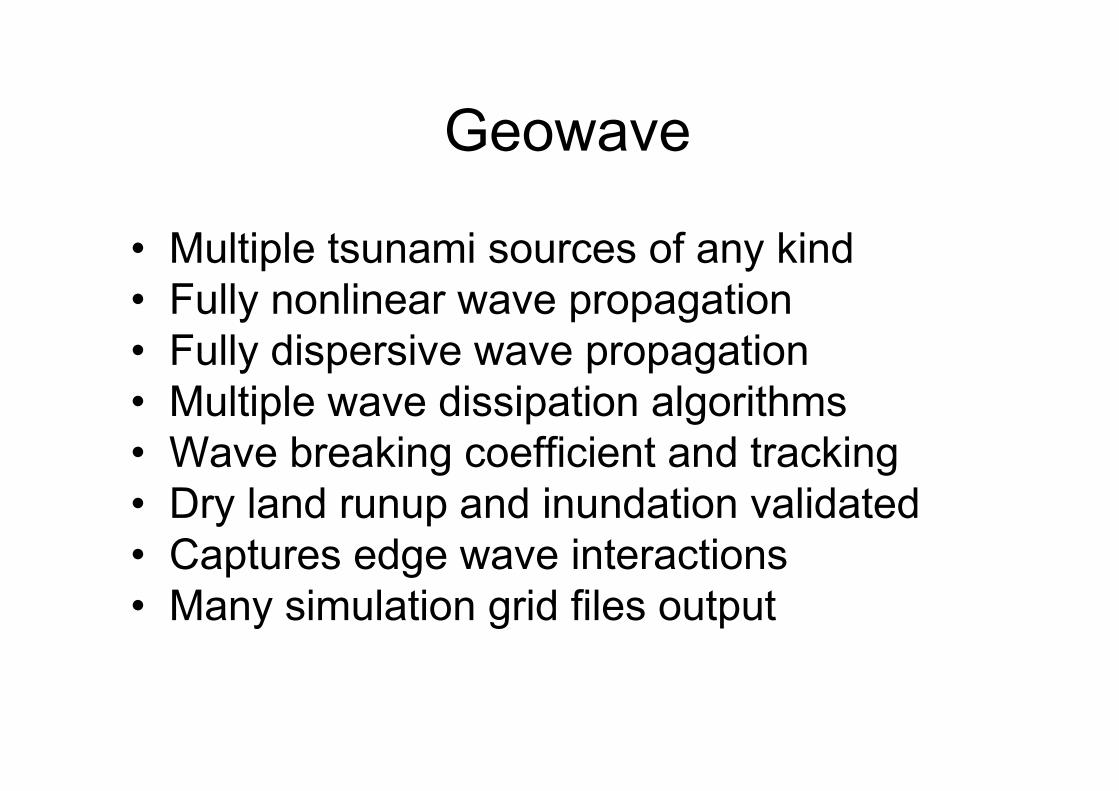
Geowave
• Multiple tsunami sources of any kind• Fully nonlinear wave propagation• Fully dispersive wave propagation• Multiple wave dissipation algorithms• Wave breaking coefficient and tracking• Dry land runup and inundation validated• Captures edge wave interactions• Many simulation grid files output
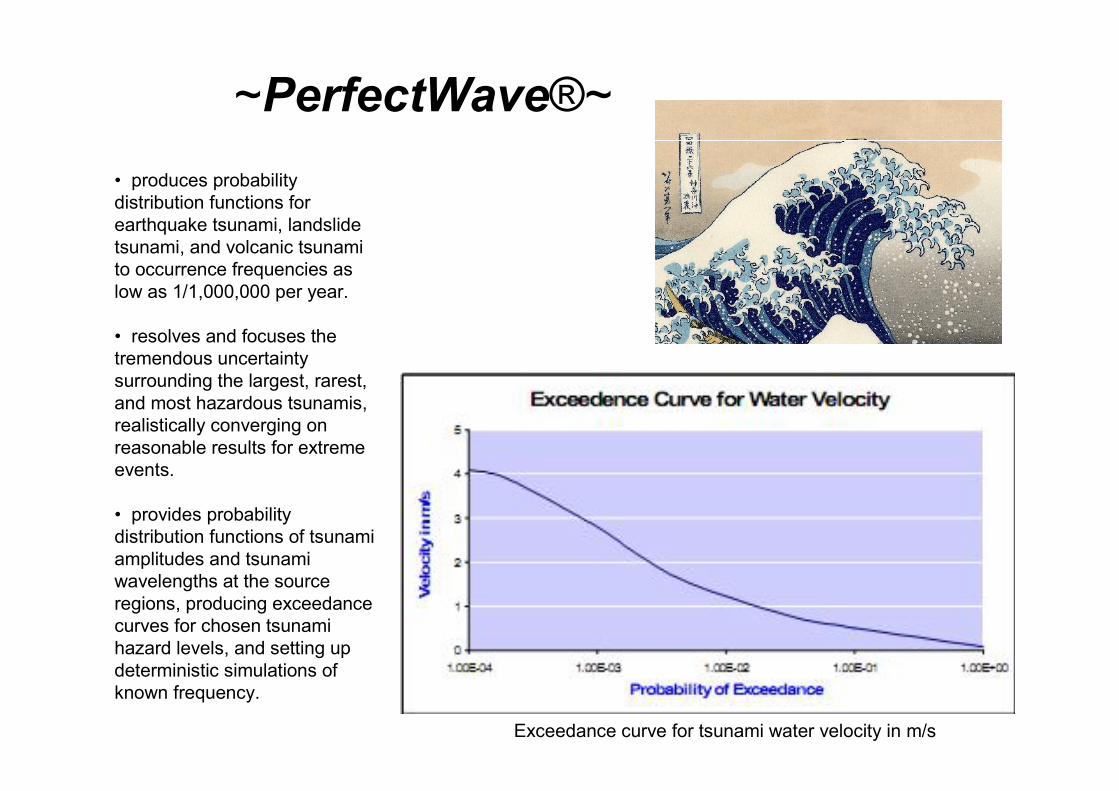
• produces probabilitydistribution functions forearthquake tsunami, landslidetsunami, and volcanic tsunamito occurrence frequencies aslow as 1/1,000,000 per year.
• resolves and focuses thetremendous uncertaintysurrounding the largest, rarest,and most hazardous tsunamis,realistically converging onreasonable results for extremeevents.
• provides probabilitydistribution functions of tsunamiamplitudes and tsunamiwavelengths at the sourceregions, producing exceedancecurves for chosen tsunamihazard levels, and setting updeterministic simulations ofknown frequency.
Exceedance curve for tsunami water velocity in m/s
~PerfectWave®~
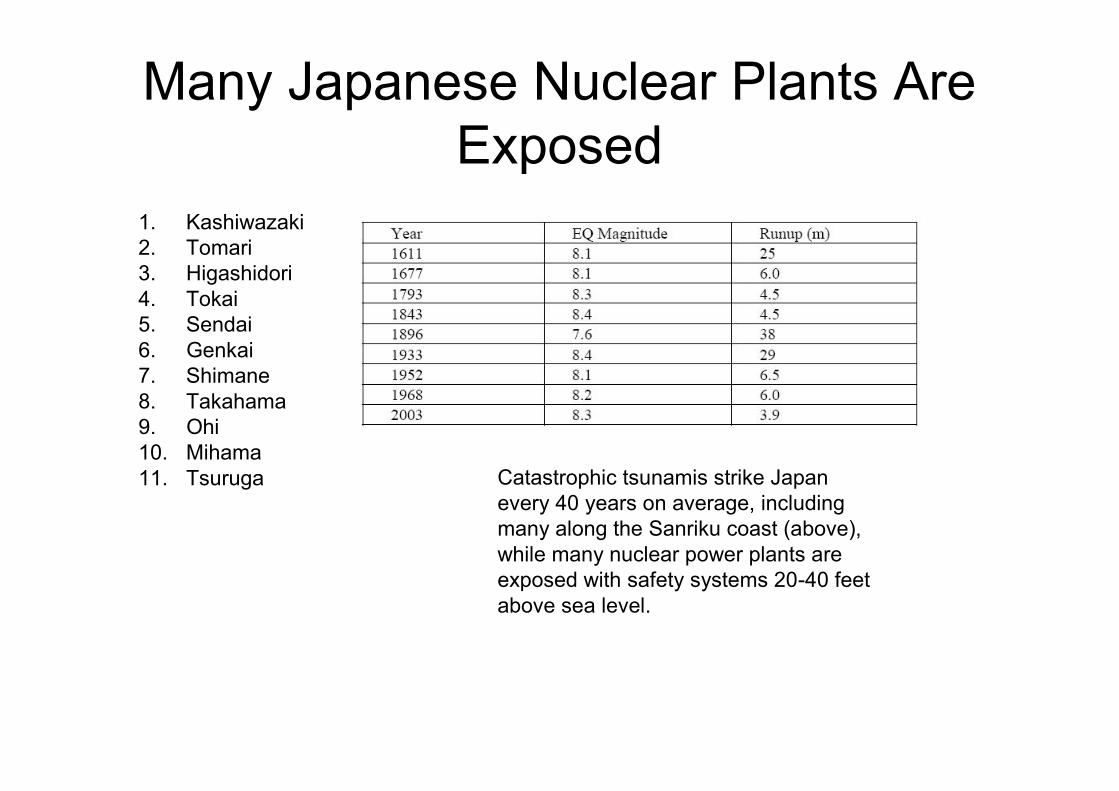
Many Japanese Nuclear Plants AreExposed
1. Kashiwazaki2. Tomari3. Higashidori4. Tokai5. Sendai6. Genkai7. Shimane8. Takahama9. Ohi10. Mihama11. Tsuruga Catastrophic tsunamis strike Japan
every 40 years on average, includingmany along the Sanriku coast (above),while many nuclear power plants areexposed with safety systems 20-40 feetabove sea level.
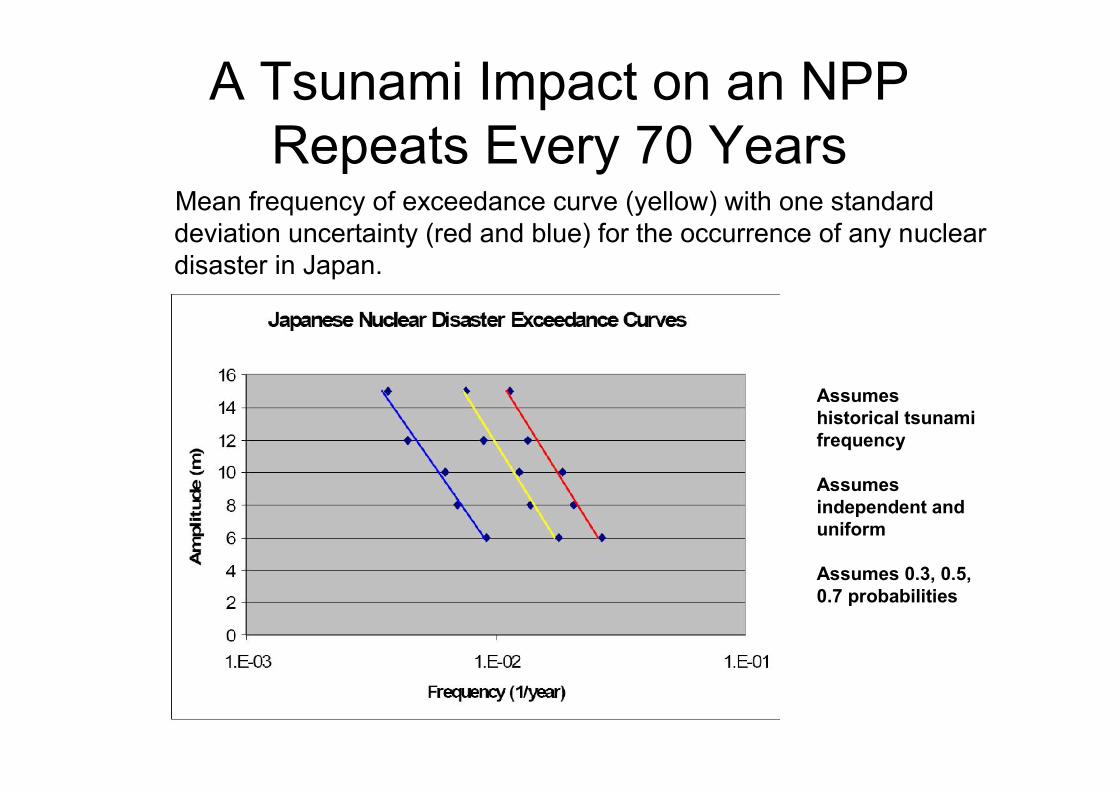
A Tsunami Impact on an NPPRepeats Every 70 Years
Mean frequency of exceedance curve (yellow) with one standarddeviation uncertainty (red and blue) for the occurrence of any nucleardisaster in Japan.
Assumeshistorical tsunamifrequency
Assumesindependent anduniform
Assumes 0.3, 0.5,0.7 probabilities
Tsunami Uncertainty is a ProfoundChallenge
• Is the location of the most hazardous local fault even known?• What is the largest possible earthquake magnitude on a fault?• What seismic coupling and slip patch can be expected here?• Does the earthquake depth and rake reproduce surface features?• How frequent are the most hazardous landslide tsunamis?• Are they frequent enough to exceed core damage frequency?• What is the most hazardous mode of submarine mass failure?• Will earthquake and landslide tsunamis combine amplitudes?• How can effective warnings be issued for landslide tsunamis?• Does a given landslide tsunami model reproduce known data?• Will volcano collapse create a large transoceanic tsunami?• When can the volcano collapse be expected to take place?• Is this a tsunami simulation that requires wave dispersion?• Does maximum run-up occur here because of edge waves?
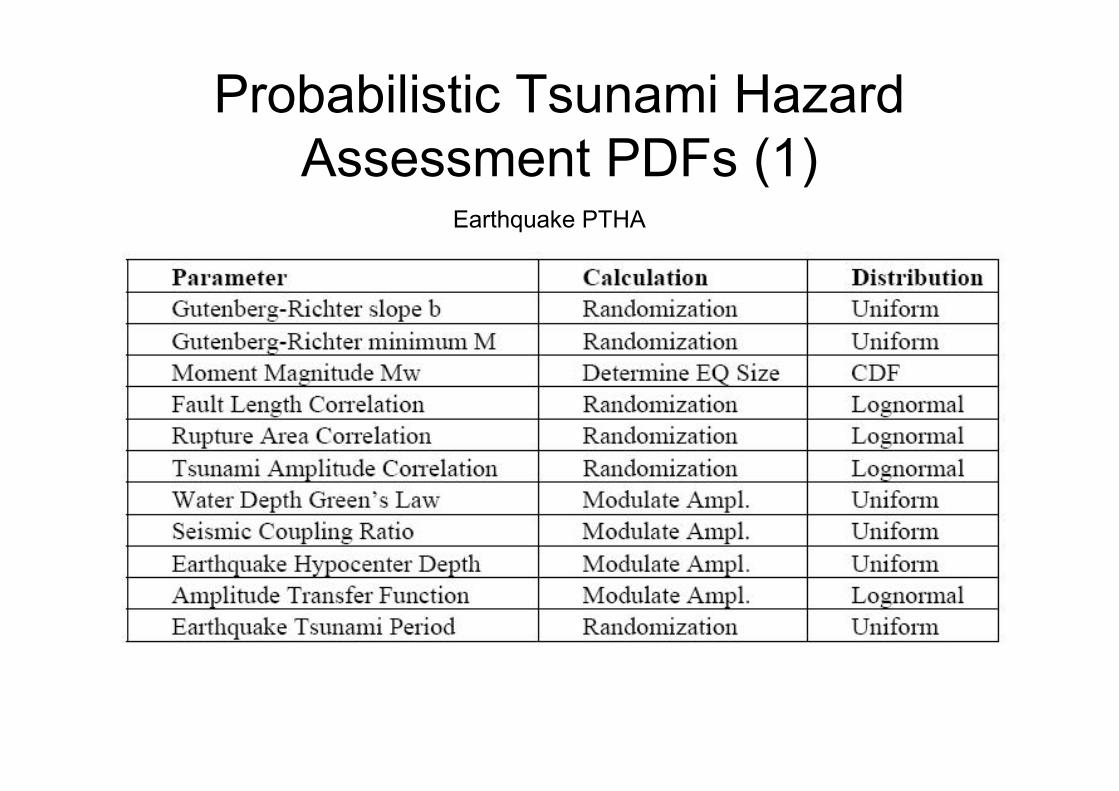
Probabilistic Tsunami HazardAssessment PDFs (1)
Earthquake PTHA
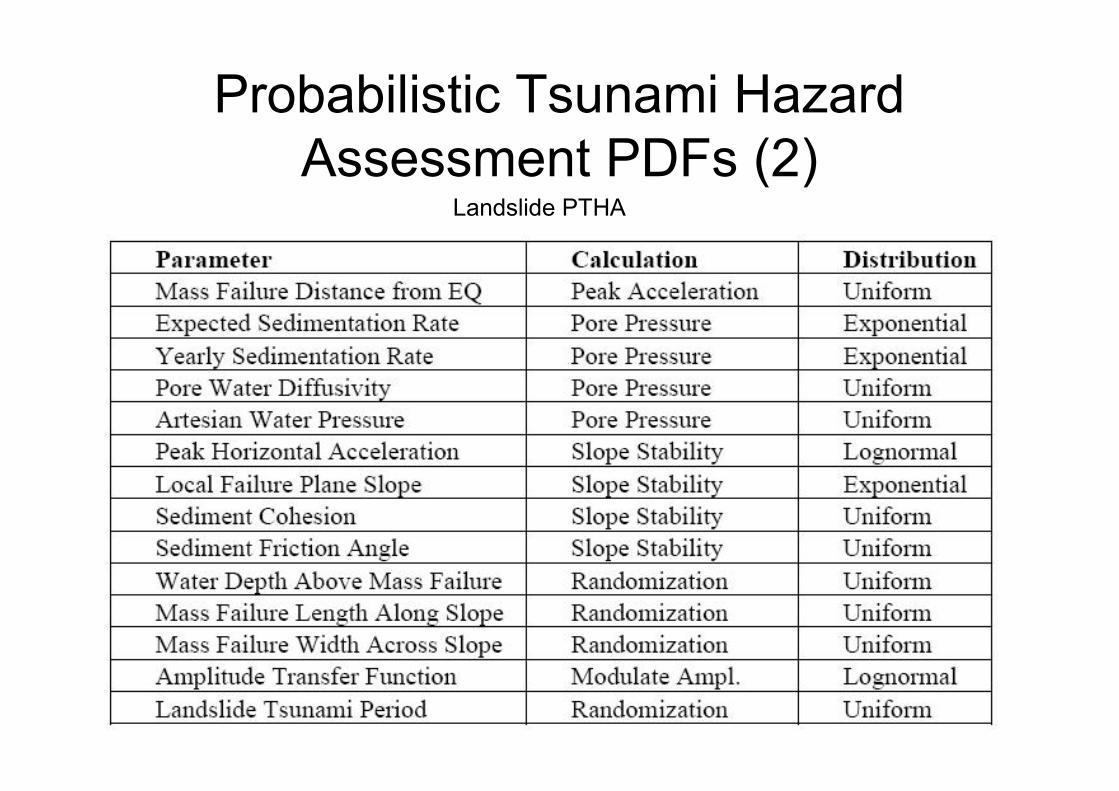
Probabilistic Tsunami HazardAssessment PDFs (2)
Landslide PTHA
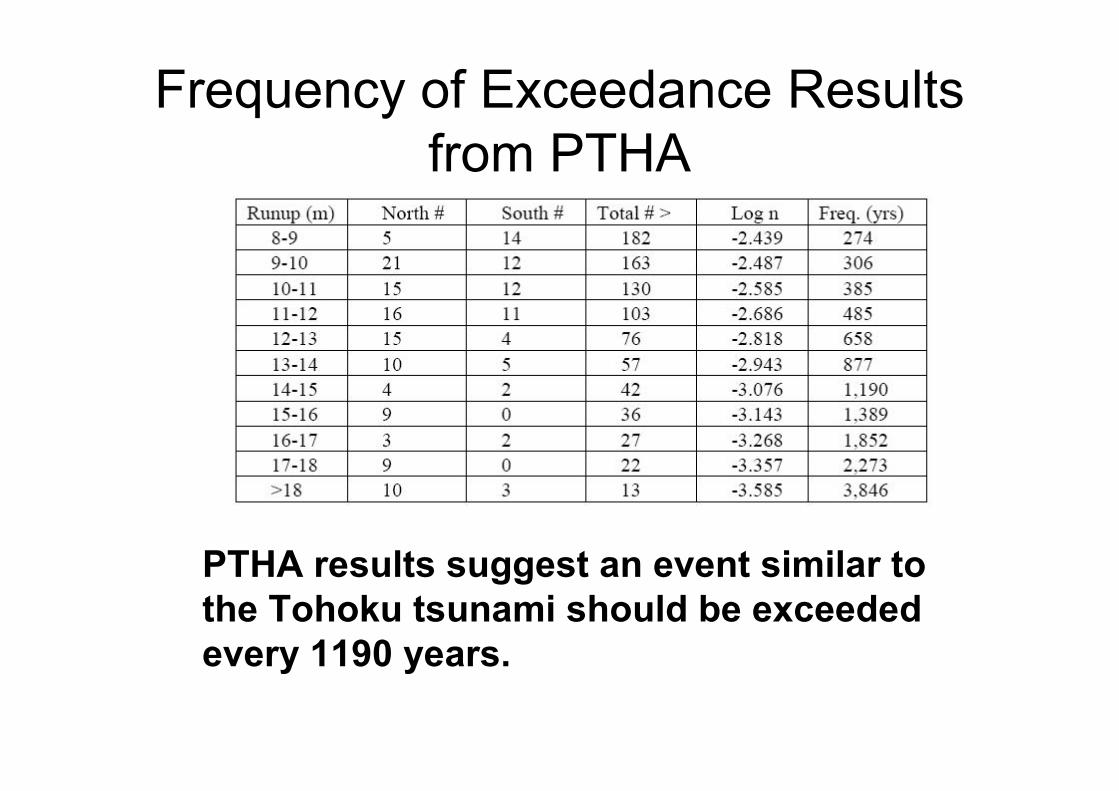
Frequency of Exceedance Resultsfrom PTHA
PTHA results suggest an event similar tothe Tohoku tsunami should be exceededevery 1190 years.
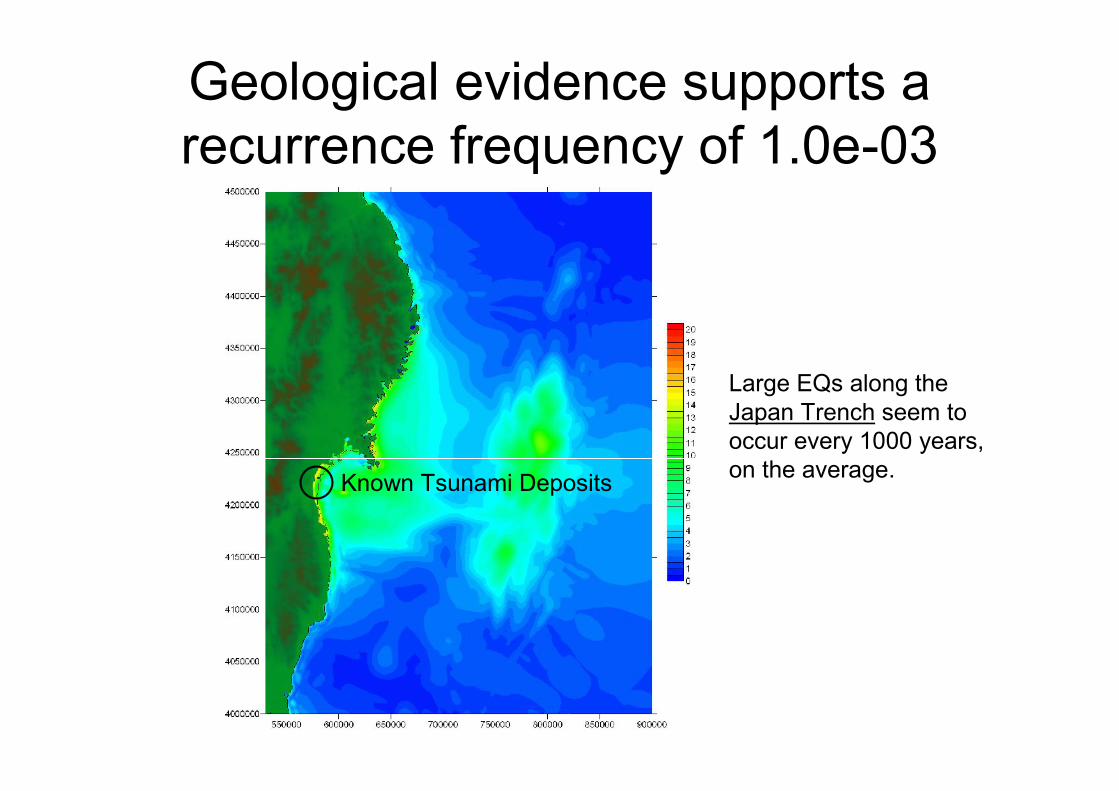
Large EQs along theJapan Trench seem tooccur every 1000 years,on the average.Known Tsunami Deposits
Geological evidence supports arecurrence frequency of 1.0e-03
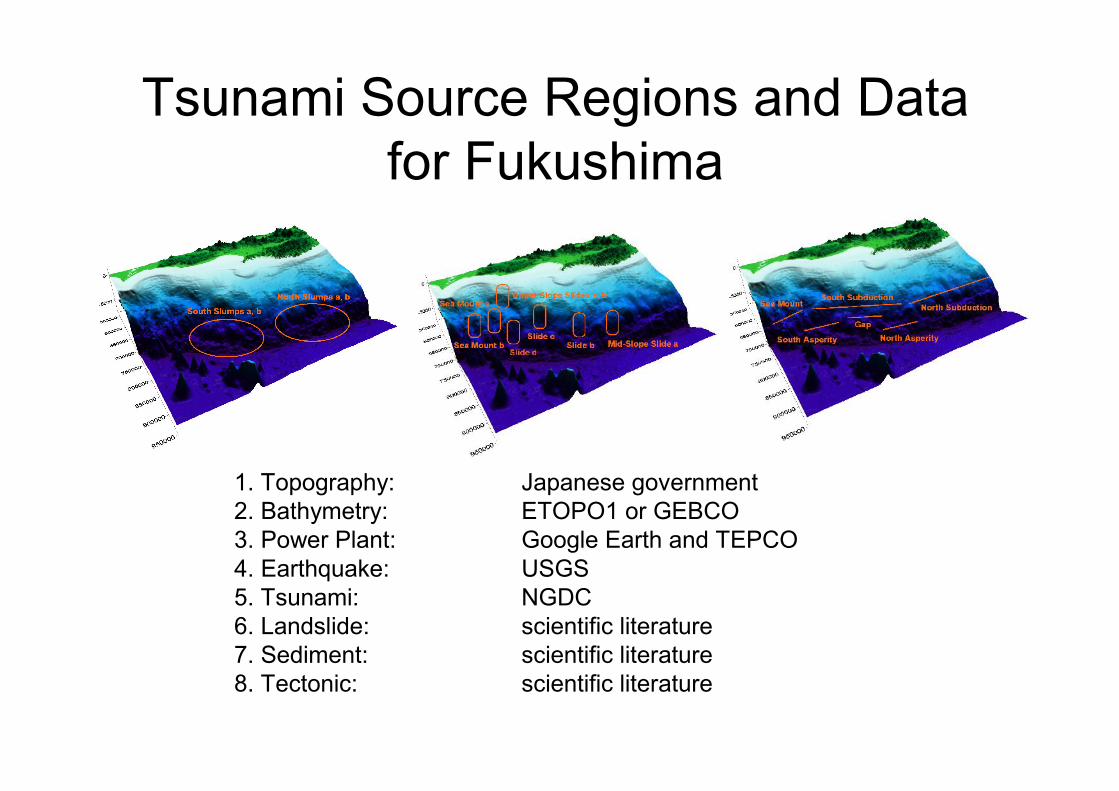
Tsunami Source Regions and Datafor Fukushima
1. Topography: Japanese government2. Bathymetry: ETOPO1 or GEBCO3. Power Plant: Google Earth and TEPCO4. Earthquake: USGS5. Tsunami: NGDC6. Landslide: scientific literature7. Sediment: scientific literature8. Tectonic: scientific literature
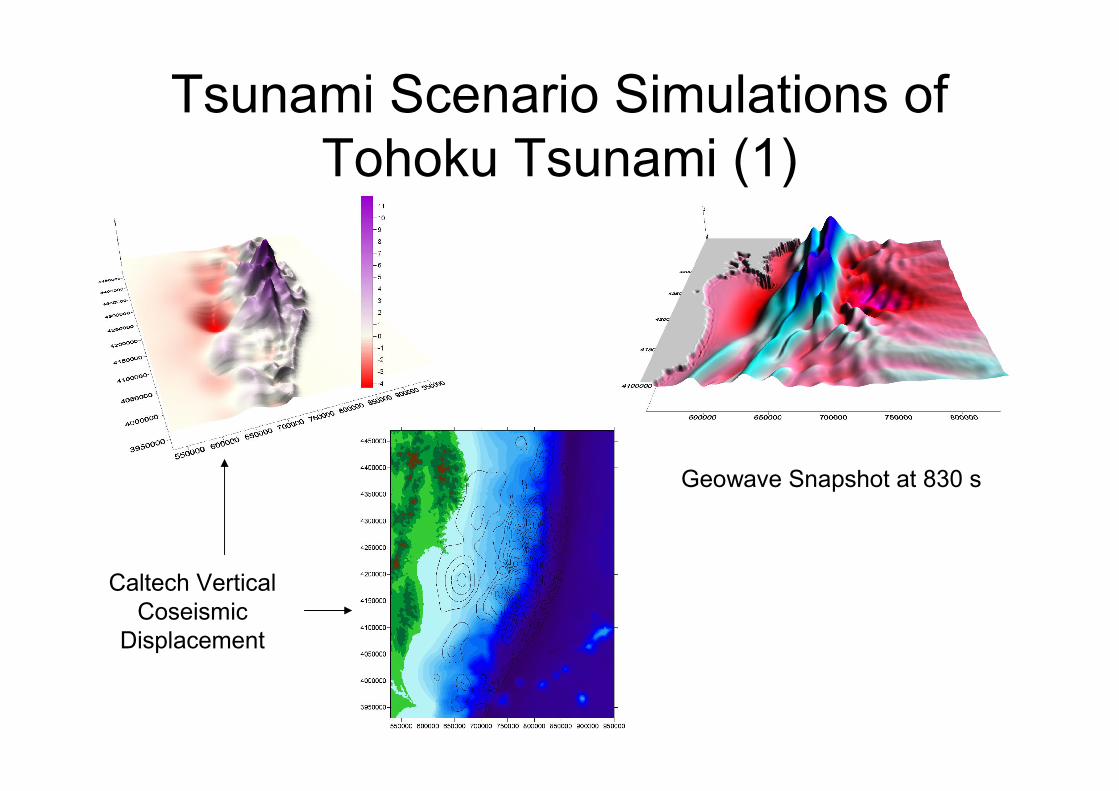
Tsunami Scenario Simulations ofTohoku Tsunami (1)
Caltech VerticalCoseismic
Displacement
Geowave Snapshot at 830 s
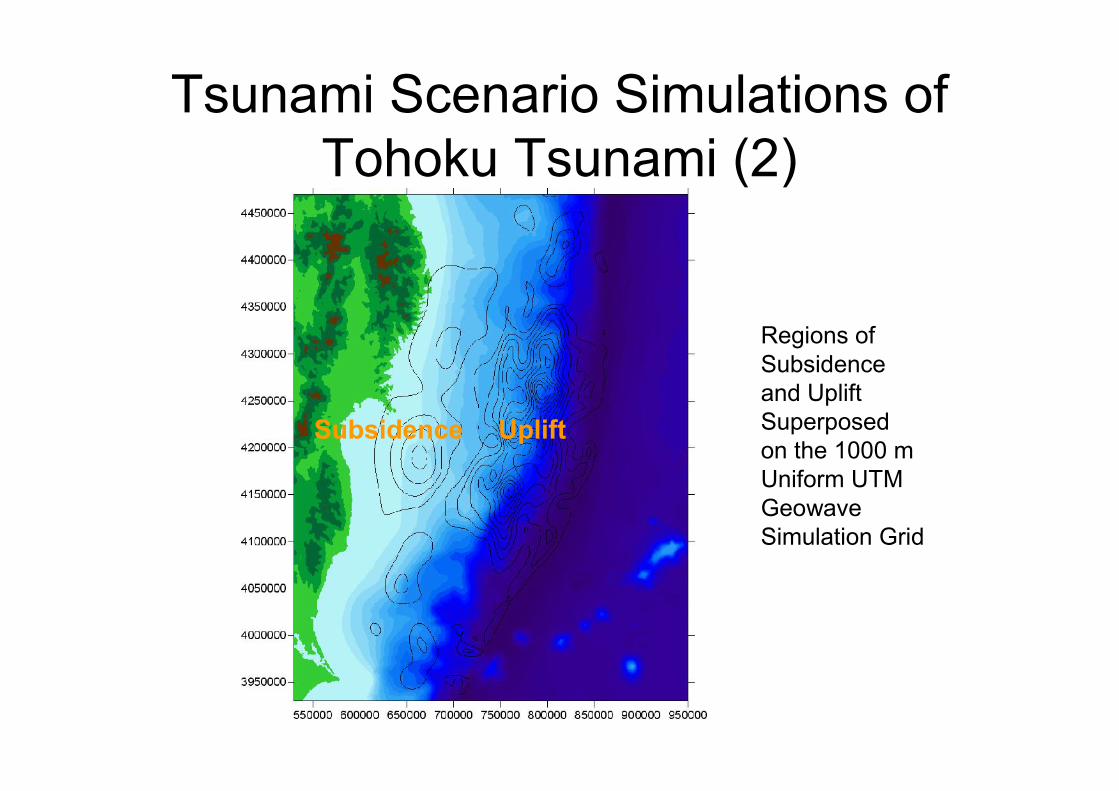
Regions ofSubsidenceand UpliftSuperposedon the 1000 mUniform UTMGeowaveSimulation Grid
UpliftSubsidence
Tsunami Scenario Simulations ofTohoku Tsunami (2)
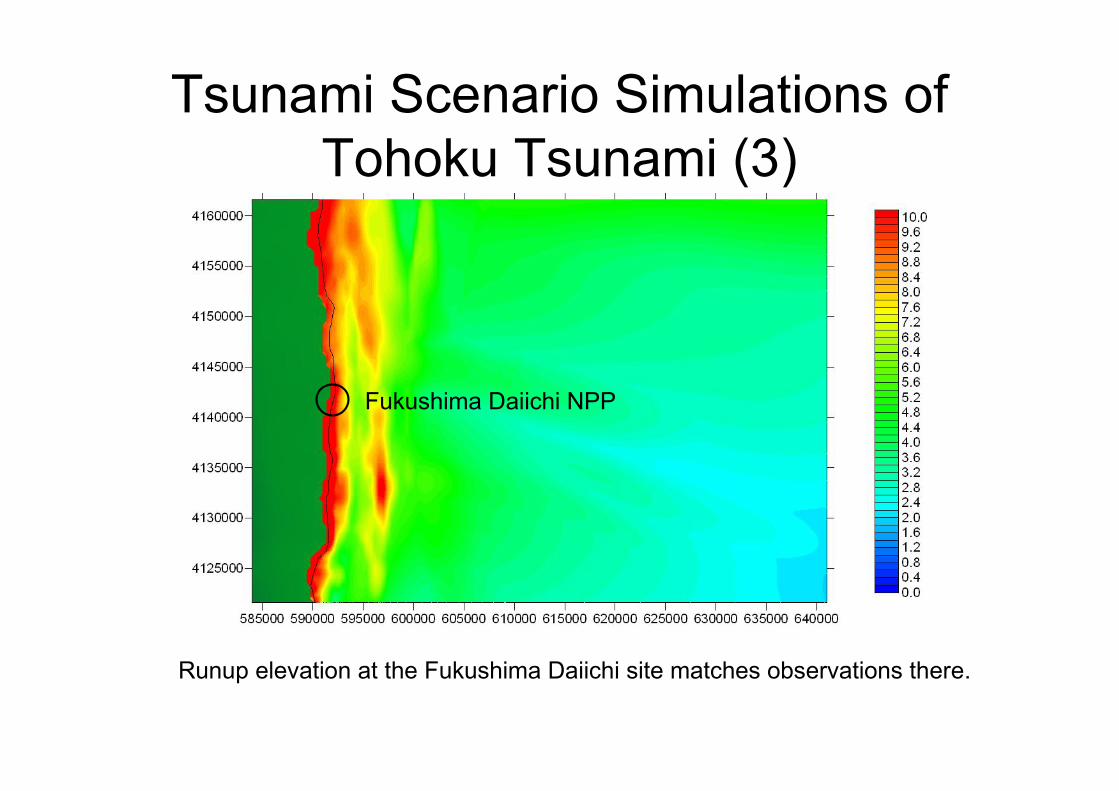
Runup elevation at the Fukushima Daiichi site matches observations there.
Fukushima Daiichi NPP
Tsunami Scenario Simulations ofTohoku Tsunami (3)
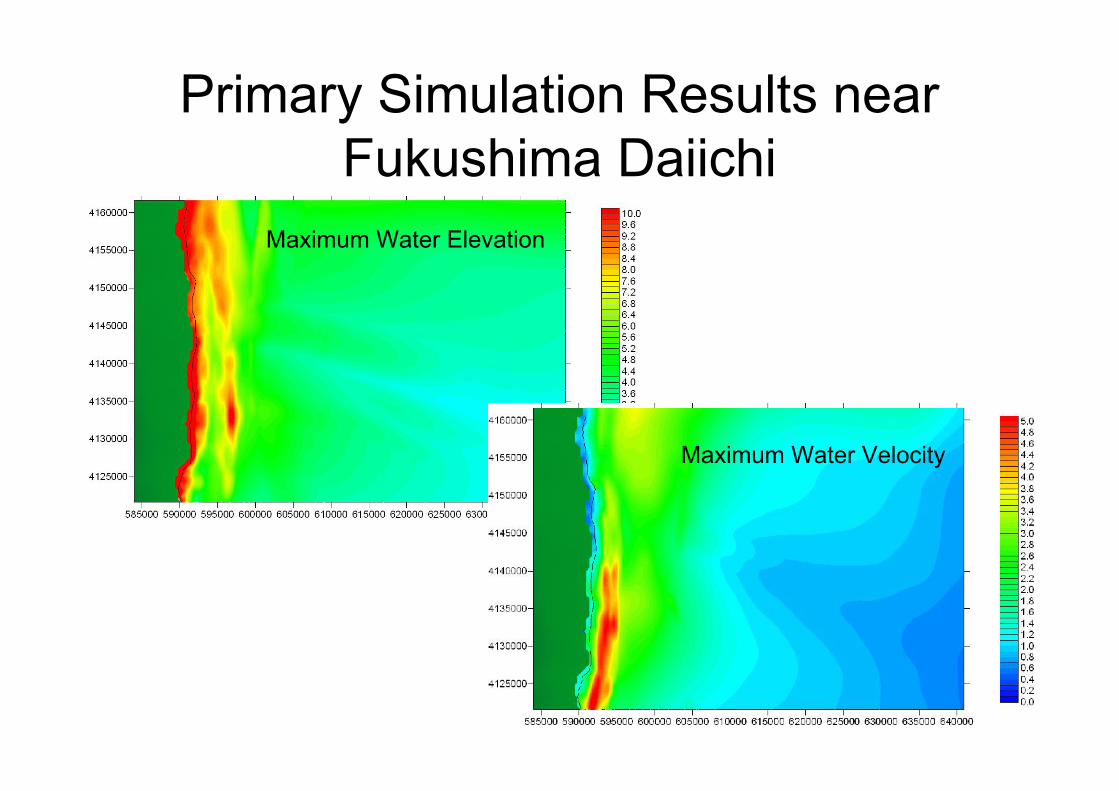
Primary Simulation Results nearFukushima Daiichi
Maximum Water Elevation
Maximum Water Velocity
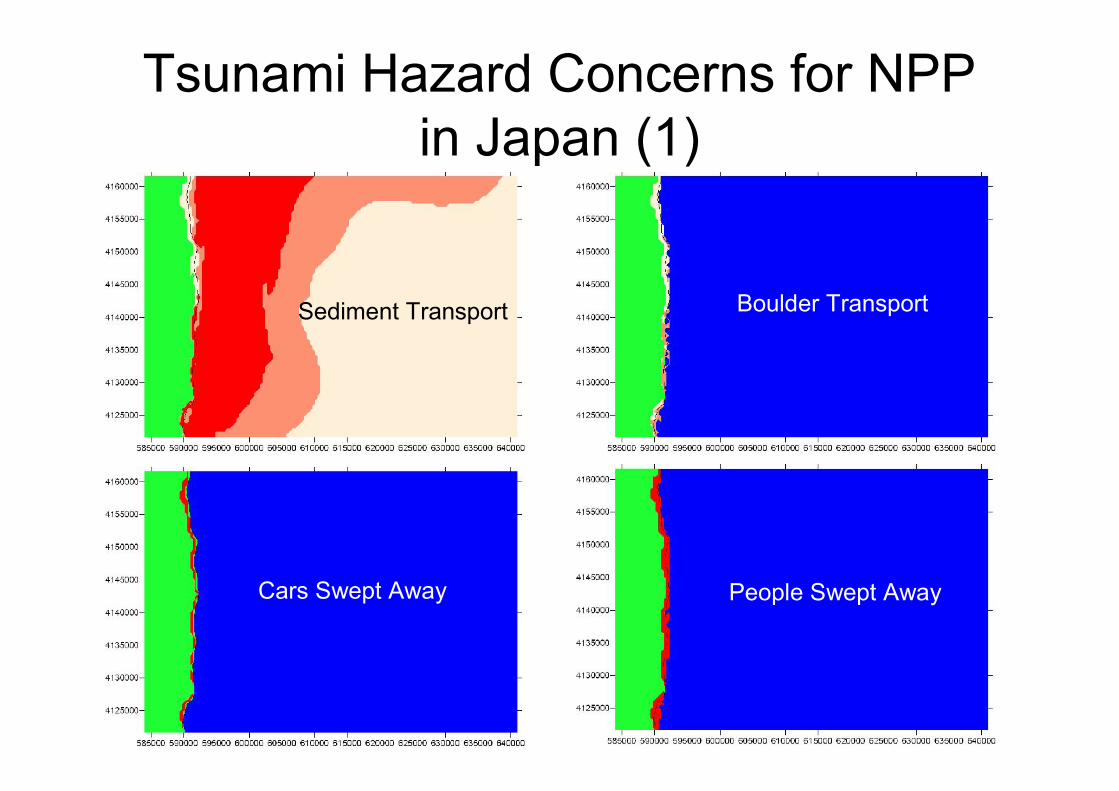
Tsunami Hazard Concerns for NPPin Japan (1)
Sediment Transport
Cars Swept Away
Boulder Transport
People Swept Away
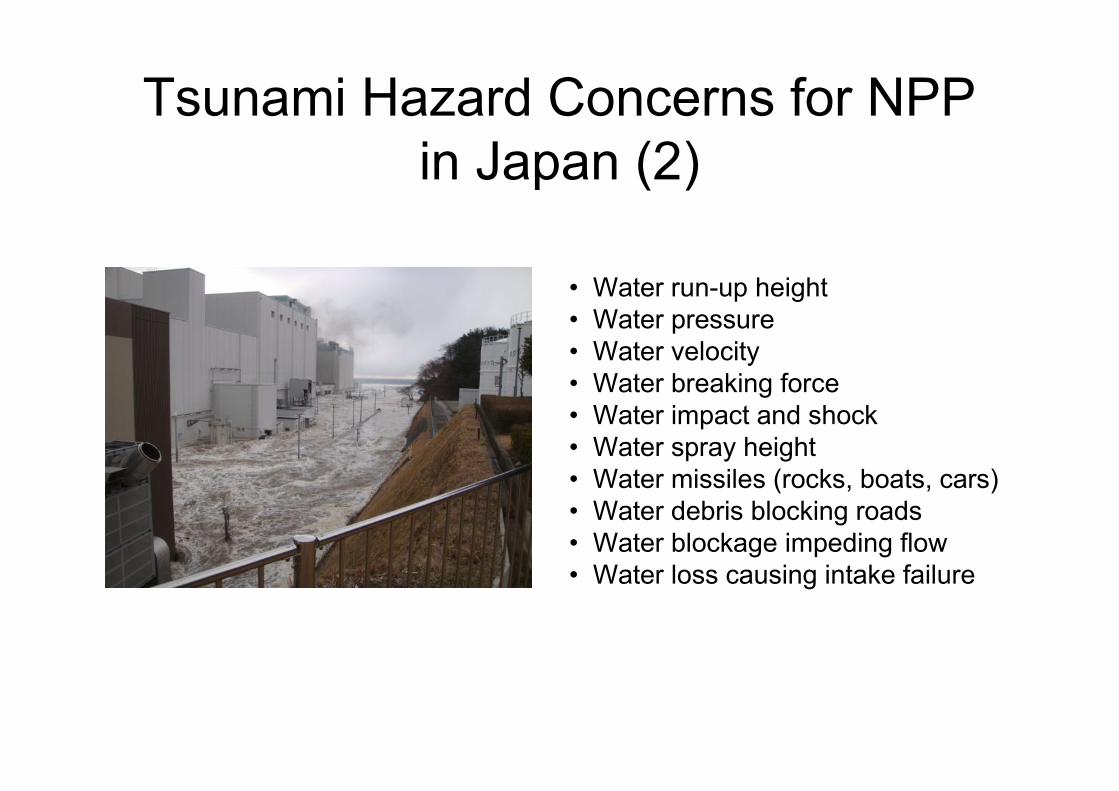
Tsunami Hazard Concerns for NPPin Japan (2)
Cars Swept Away
Boulder Transport
People Swept Away
• Water run-up height• Water pressure• Water velocity• Water breaking force• Water impact and shock• Water spray height• Water missiles (rocks, boats, cars)• Water debris blocking roads• Water blockage impeding flow• Water loss causing intake failure

The Steps for PTHA and PRAIntegration
Using Geowave and PerfectWave
Philip WattsWoody Epstein
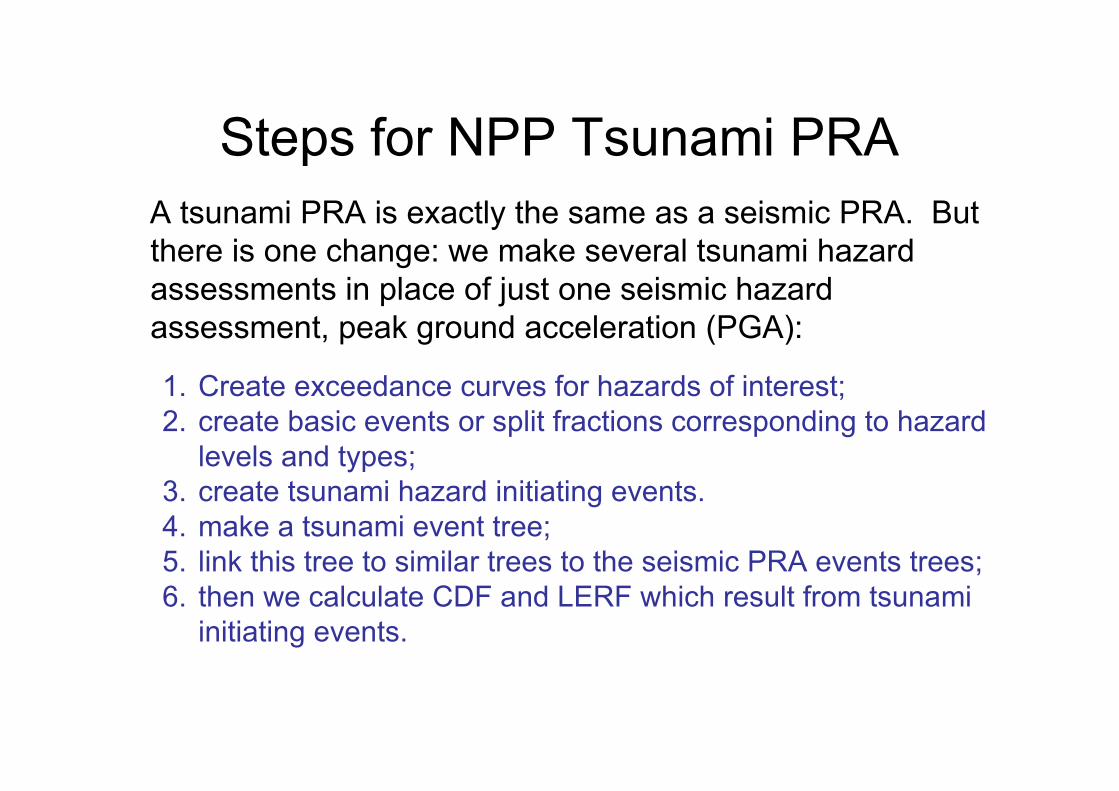
A tsunami PRA is exactly the same as a seismic PRA. Butthere is one change: we make several tsunami hazardassessments in place of just one seismic hazardassessment, peak ground acceleration (PGA):
1. Create exceedance curves for hazards of interest;2. create basic events or split fractions corresponding to hazard
levels and types;3. create tsunami hazard initiating events.4. make a tsunami event tree;5. link this tree to similar trees to the seismic PRA events trees;6. then we calculate CDF and LERF which result from tsunami
initiating events.
Steps for NPP Tsunami PRA
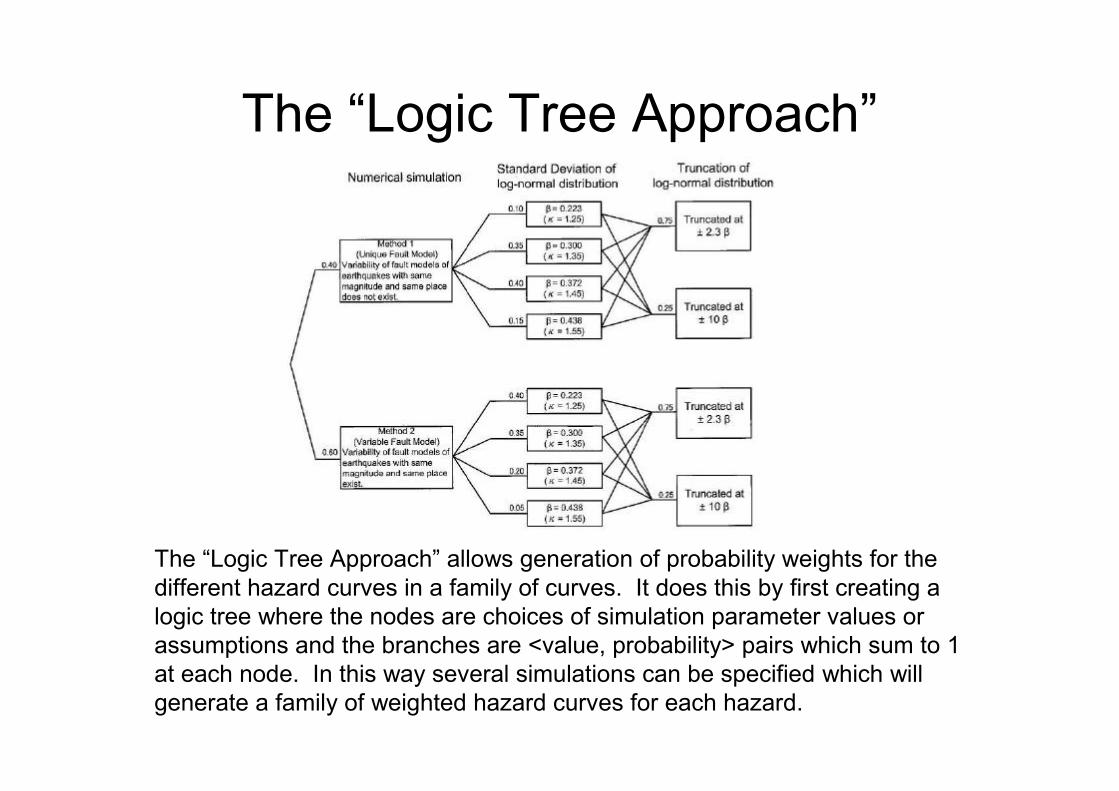
The “Logic Tree Approach”
The “Logic Tree Approach” allows generation of probability weights for thedifferent hazard curves in a family of curves. It does this by first creating alogic tree where the nodes are choices of simulation parameter values orassumptions and the branches are <value, probability> pairs which sum to 1at each node. In this way several simulations can be specified which willgenerate a family of weighted hazard curves for each hazard.
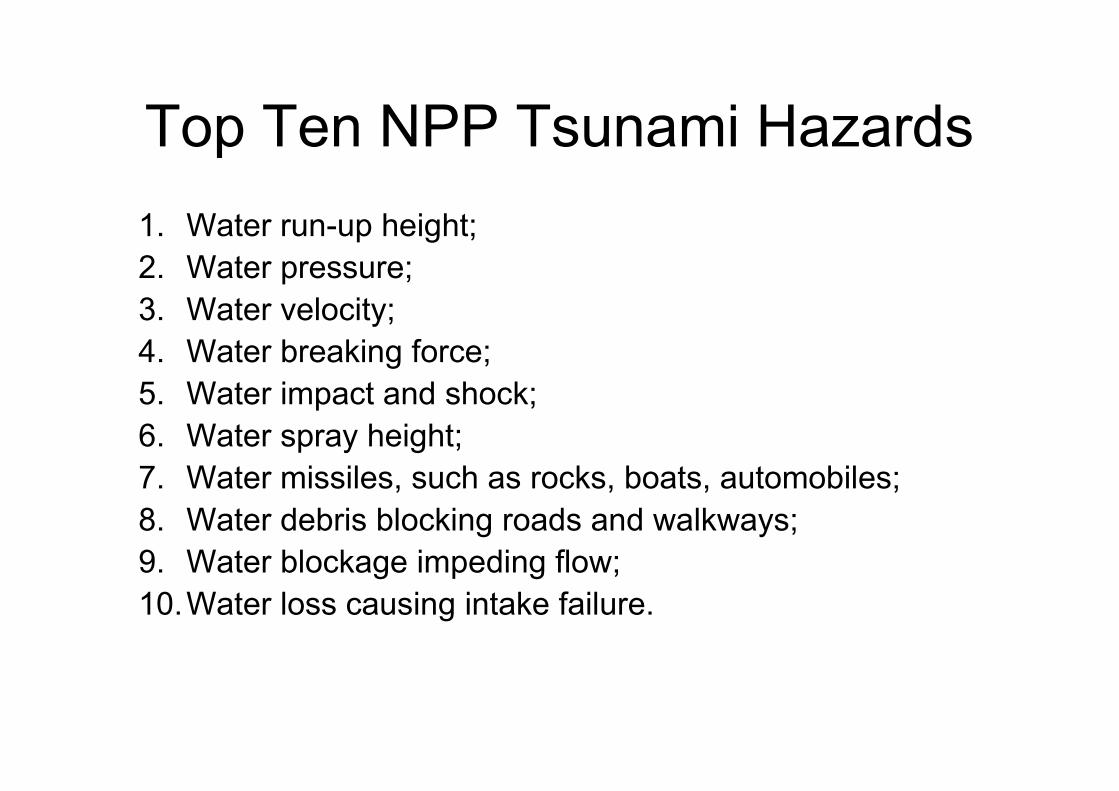
Top Ten NPP Tsunami Hazards1. Water run-up height;2. Water pressure;3. Water velocity;4. Water breaking force;5. Water impact and shock;6. Water spray height;7. Water missiles, such as rocks, boats, automobiles;8. Water debris blocking roads and walkways;9. Water blockage impeding flow;10.Water loss causing intake failure.
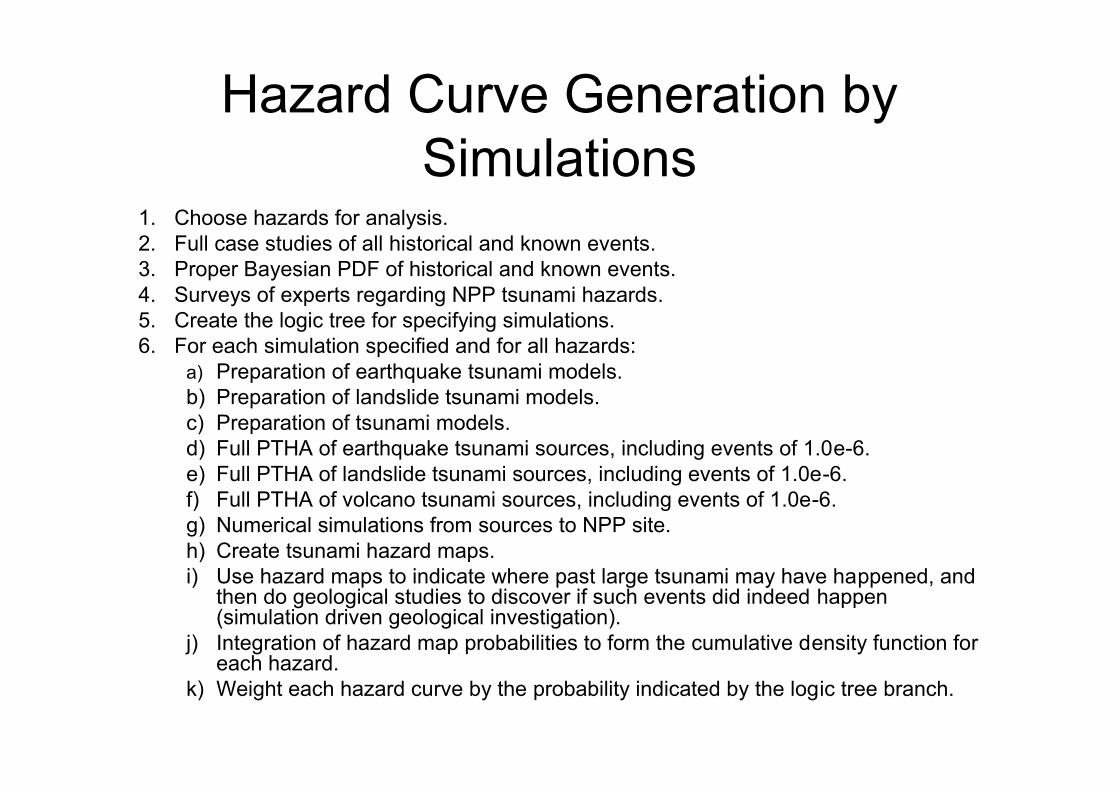
Hazard Curve Generation bySimulations
1. Choose hazards for analysis.2. Full case studies of all historical and known events.3. Proper Bayesian PDF of historical and known events.4. Surveys of experts regarding NPP tsunami hazards.5. Create the logic tree for specifying simulations.6. For each simulation specified and for all hazards:
a) Preparation of earthquake tsunami models.b) Preparation of landslide tsunami models.c) Preparation of tsunami models.d) Full PTHA of earthquake tsunami sources, including events of 1.0e-6.e) Full PTHA of landslide tsunami sources, including events of 1.0e-6.f) Full PTHA of volcano tsunami sources, including events of 1.0e-6.g) Numerical simulations from sources to NPP site.h) Create tsunami hazard maps.i) Use hazard maps to indicate where past large tsunami may have happened, and
then do geological studies to discover if such events did indeed happen(simulation driven geological investigation).
j) Integration of hazard map probabilities to form the cumulative density function foreach hazard.
k) Weight each hazard curve by the probability indicated by the logic tree branch.
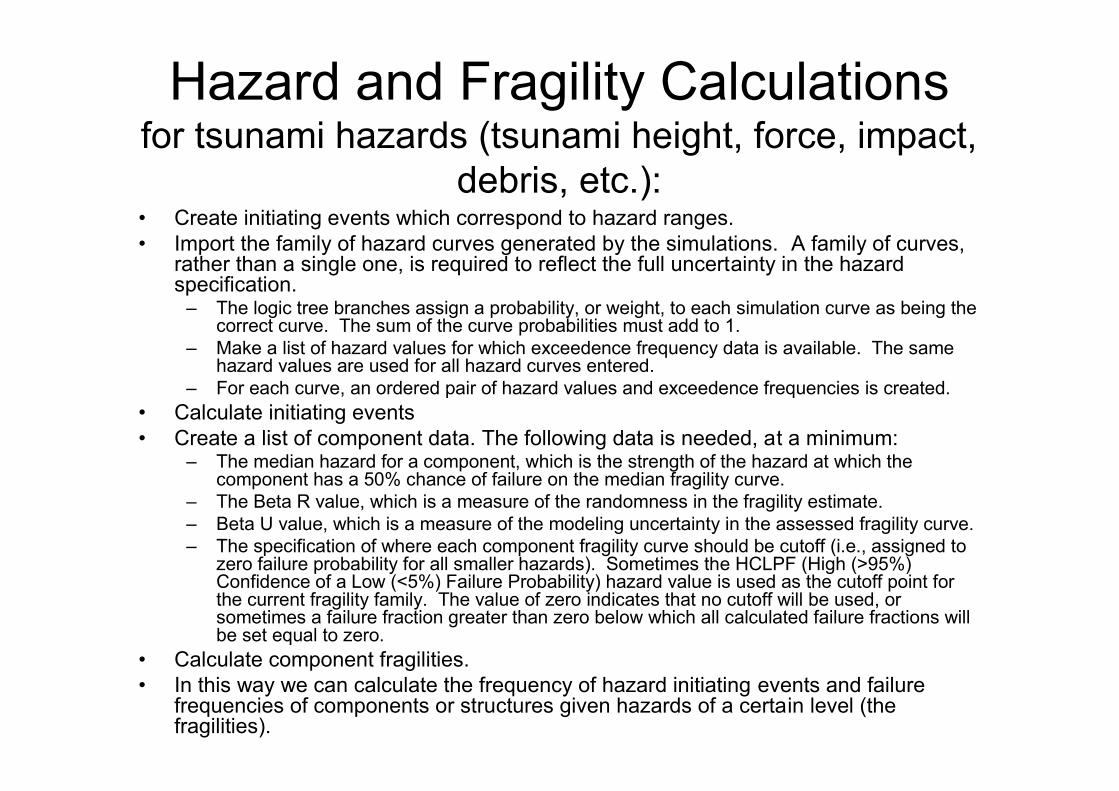
Hazard and Fragility Calculationsfor tsunami hazards (tsunami height, force, impact,
debris, etc.):• Create initiating events which correspond to hazard ranges.• Import the family of hazard curves generated by the simulations. A family of curves,
rather than a single one, is required to reflect the full uncertainty in the hazardspecification.
– The logic tree branches assign a probability, or weight, to each simulation curve as being thecorrect curve. The sum of the curve probabilities must add to 1.
– Make a list of hazard values for which exceedence frequency data is available. The samehazard values are used for all hazard curves entered.
– For each curve, an ordered pair of hazard values and exceedence frequencies is created.• Calculate initiating events• Create a list of component data. The following data is needed, at a minimum:
– The median hazard for a component, which is the strength of the hazard at which thecomponent has a 50% chance of failure on the median fragility curve.
– The Beta R value, which is a measure of the randomness in the fragility estimate.– Beta U value, which is a measure of the modeling uncertainty in the assessed fragility curve.– The specification of where each component fragility curve should be cutoff (i.e., assigned to
zero failure probability for all smaller hazards). Sometimes the HCLPF (High (>95%)Confidence of a Low (<5%) Failure Probability) hazard value is used as the cutoff point forthe current fragility family. The value of zero indicates that no cutoff will be used, orsometimes a failure fraction greater than zero below which all calculated failure fractions willbe set equal to zero.
• Calculate component fragilities.• In this way we can calculate the frequency of hazard initiating events and failure
frequencies of components or structures given hazards of a certain level (thefragilities).
Integration with the PRA (1)
We use these calculations to calculate theprobability for each important hazard. Forexample, for tsunami height we can say that theprobability of 15m is 1e-04, for 10m 1e-03, for 5m5.0e-03, and so on.
Then from the fragility analysis we know the failureof systems and components GIVEN the tsunamiheights. Then from the PRA model we generatenew values for core damage frequency (CDF),large early release frequency (LERF), etc
Integration with the PRA (2)1. Overlay NPP systems and structures onto the tsunami
hazard maps.2. Create damage models for systems and structures
from the fragility analysis.3. Using the same steps as in a seismic PRA, create the
tsunami PRA: initiating event frequencies, componentfailures and integrate into seismic PRA type of model.
4. Identify building location characteristics of the NPP sitewhich can amplify or mitigate actual tsunami run-upheight and possible flooding pathways and equipmentaffected and augment the PRA model.
5. Identify NPP outcomes and sequences which lead toCDF, LERF, etc..
6. Calculate the PRA model.
Related Documents