Year Ended March 31, 2014 2014 ANNUAL REPORT

Welcome message from author
This document is posted to help you gain knowledge. Please leave a comment to let me know what you think about it! Share it to your friends and learn new things together.
Transcript

Year Ended March 31, 2014
2014 ANNUAL REPORT
010_9422001372609.indd 1 2014/09/24 14:03:56

Profile
‘12 ’12‘12 ’12 ‘12‘13 ‘13 ’13’13 ‘13
TOTAL ASSETS
¥ Billions
DEPOSITS
¥ Billions
LOANS AND BILLS DISCOUNTED
¥ Billions
CAPITAL ADEQUACY RATIO(NON-CONSOLIDATED)
%
NET INCOME
¥ Millions
4,24
2.3 2,
425.
8
4,03
3.2
4,72
2
10.6
7
‘14 ‘14 ’14’14 ‘14
4,66
7.3
2,46
6.9
4,43
4.5
6,37
8
11.0
95,38
5.0
2,63
8.9
5,12
4.7
9,15
7
10.4
4
As the leading bank in Fukushima Prefecture, Toho Bank has contributed to the prosperity
of its local communities since being established in November 1941. In response to the trust
placed in us by our customers and the market region we serve, in April 2012 we initiated
our new medium-term management plan, “Toho step-by-step Plan,” as an action program.
Our goal is embodied as the slogan “Big, strong and tough–serving the region with passion,
serving customers with sincerity and caring for people” (our long-term vision). We are
aggressively addressing our customers’ increasingly diversified and sophisticated needs,
devoting our full efforts to strengthening previously executed risk management capabilities,
and providing active disclosure of our financial position. Toho Bank has received a long-term
credit rating of A– from Standard & Poor’s, the international credit rating firm, which we
have duly disclosed. Moreover, Japan Credit Rating Agency, Ltd. (JCR), one of Japan’s
representative rating agencies, assigned the bonds a senior long-term credit rating of “A.”
As of March 31, 2014, Toho Bank had total net assets of ¥167.8 billion (US$1,630
million) and total assets of ¥5,385.0 billion (US$52,322 million) (both figures on a
consolidated basis), 1,969 employees, and a business network composed of 114 branches.
Fukushima Prefecture
Fukushima City
Tokyo
Contents
Message from the President................................................................1Financial Statements...........................................................................3Board of Directors and Auditors/Organization/Network.........................20
010_9422001372609.indd 2 2014/09/24 14:03:56

1
Message from the President
Financial and Economic Environment The Japanese economy during the fiscal year ended March 31, 2014 remained on a recovery trend, with improved corporate earnings impelled mainly by the impacts of various monetary policies and the steady growth of economies overseas, and a clear rebound of capital expenditures.
With regard to economic conditions in Fukushima Prefecture, housing investment and public works spending related to recovery and reconstruction in the aftermath of the Great East Japan Earthquake substantially increased. Personal consumption progressed steadily, and the effective job offer ratio remained high overall, especially in the manufacturing and medical welfare sectors. Economic improvements thus continued to gain momentum.
Turning to the financial environment, fiscal conditions remained stable as a whole, with ample funding from the Bank of Japan. Lending at private banks increased year-on-year, backed by enduringly low market rates. The closing price of the Nikkei Stock Average at the end of the fiscal year increased by 2,429.92 yen from the end of the previous fiscal year, to 14,827.83 yen.
Business Development and Results Under these circumstances, Toho Bank has taken initiatives based on the “Toho Step-by-Step Plan,” a medium-term management plan for the three-year period which commenced in fiscal 2012, to realize the “Be Large, Strong, and Powerful” image the Bank is striving for.
The Bank made concerted efforts to achieve various measures throughout its ranks based on basic policy of “Contributing to Fukushima in moving toward Reconstruction,” “Steadily Implementing the Growth Strategy,” and “Further Reinforcing the Business Structure” in fiscal 2013.
[Contributing to Fukushima in moving toward Reconstruction]Toho Bank has made efforts towards reconstruction in the aftermath of the Great East Japan Earthquake, the revitalization of industry, and the provision of smooth funding sources, while proactively participating in businesses for assisting reconstruction.
In its drive to support the reconstruction of the regional economy and revitalization of industry, the Bank continues to operate the “Toho Next Generation Entrepreneurs Club,” a place where next-generation entrepreneurs can exchange ideas and study, for the purpose of firmly supporting the creation and growth of regional industry. The Bank has also established the “Toho Next Generation Start-up Support Fund” and the “Toho Next Generation Start-up Support Loan” in order to proactively meet the fund demands of customers working on first or second start-ups.
The Bank supplied funds and developed support systems for areas that are expected to grow, mainly by forming syndicate loans as a lead underwriter for solar energy power generation. The Bank also extended its progress in activities focused on assisting reconstruction for regional companies, mainly by offering proposals for use of the interest subsidy system set up for the special zone for reconstruction.
[Steadily Implementing the Growth Strategy]To support the reconstruction and development of the regional economy and to endeavor for further growth of the Bank, Toho
Bank has steadily implemented a growth strategy attuned to the changing markets.
As a support for individual customers, the Bank has been addressing the demographic shift to an aging society with fewer children in the region. As a measure for supporting children bearing the future Fukushima in financial terms, the Bank recently promoted the “Get together Vigorous Fukushima Children,” a new account-opening campaign tailored to customers aged 18 or younger. The Bank has also established the “Future Fukushima Children” account, an educational saving instrument for saving tax-exempt lump-sum gifts for education, and the “Toho Bridge of Hope” time deposit account for saving funds that account holders wish to pass on to their heirs.
With regard to the Saturday and Sunday over-the-counter services the Bank started for individual customers at the Yatsuyamada branch in Koriyama-city in November 2012, the Bank duplicated the services at the Kitafukushima and Iwakikashima branches in October 2013. The services have also been offered at the Koriyamahigashi branch starting from April 2014.
To support business customers in the region, Toho Bank has been strengthening relationships with customers by progressively expanding business promotion to offer proposals for solving business challenges in order to help customers deliberate and solve the business challenges they face, including business successions, mergers & acquisitions, and overseas operations.
The Bank has also aggressively striven to provide new fund supply means, for example, by utilizing asset based lending (ABL), funding methods structured to reduce real estate collaterals and personal guarantees.
[Further Reinforcing the Business Structure]To improve its net worth, Toho Bank implements swift and flexible capital policies and has established the “Shareholders’ complementary treatment: Gifts from Fukushima,” a preferential system under which shareholders can select “local specialties in Fukushima Prefecture,” in addition to the current “complementary tickets for accommodations in Fukushima Prefecture.”
To train human resources who will go on to support the perpetual growth of the Bank and regional economy, Toho Bank conducts in-house training and dispatches trainees to financial institutions, etc. within and outside Japan through the “Toho University,” the Bank’s original training system.
PresidentSeishi Kitamura
010_9422001372609.indd 1 2014/09/24 14:03:57

2
Main Corporate Investment To prov ide t imely informat ion and g ive courteous and straightforward explanations, Toho Bank introduced tablet terminals in July 2013 and delivered them to all personnel in charge of business promotion in February 2014.
The Bank introduced a new lineup of ATMs developed in accordance with universal design principles at the Head Office Business Promotion Department and other departments in March 2014 to improve convenience for customers by adding functions for depositing and dispensing coins, etc. The Bank will gradually expand the installation sites for these new ATMs.
Summary of Business Results Toho Bank made efforts to provide funds toward reconstruction in the region. Toho Bank also responded to drastic changes in the fund procurement environment resulting from the inflow of funds relating to reconstruction and strove to reinforce fund management.
As a result, the business results for the fiscal year ended March 31, 2014 are as described below.
[Deposits and negotiable certificate of deposits, etc.]Mainly thanks to our efforts to increase deposits, together with the inflow of funds relating to reconstruction, deposits increased by ¥656.2 billion during the fiscal year and the balance at the end of the fiscal year was ¥4,724.4 billion. Total deposits, including negotiable certificates of deposits, increased by ¥690.1 billion during the fiscal year and the balance at the end of the fiscal year was ¥5,125.0 billion.
[Loans and bills discounted]Toho Bank widely met demand for funds, etc. related to recovery and reconstruction in the aftermath of the Great East Japan Earthquake. As a result, loans and bills discounted increased by ¥171.9 billion during the fiscal year to ¥2,638.9 billion.
[Income/loss]Income from the management of shares, etc. increased thanks to the effective management of securities, and net fees and commissions increased thanks to a favorable increase in sales of deposited assets. As a result, ordinary income increased by ¥714 million from the previous fiscal year to ¥61,496 million.
In addition, mainly as a consequence of the decreased amount of nonperforming loans attributable to the reinforcement of efforts to support customers’ management, ordinary profit increased by ¥3,347 million from the previous fiscal year to ¥14,441 million and net income increased by ¥2,797 million from the previous fiscal year to ¥9,058 million.
Our Efforts in CSR (Corporate Social Responsibility) Activities Toho Bank has promoted the following efforts in the areas of corporate social responsibility (CSR) as a member of regional society.
[Regional sports promotion]To contribute to sports promotion in the region, Toho Bank acquired the naming rights for the Prefectural Azuma Athletic Stadium and named the venue the “Toho Minna-no” Stadium.
Toho Bank sent the members of its track and field club to open athletic sports classes and held the Toho Cup “The Second Fukushima Relays,” a relay contest designed for elementary school, junior high school, and senior high school students in the Fukushima Prefecture.
[Fostering children bearing the future]As an effort to assist financial education, the Bank held a Fukushima prefectural tournament for “Economics Koshien,” a quiz tournament in financial economics for senior high school students nationwide. This was the second Economic Koshien, after the inaugural tournament in the previous fiscal year.
The Bank established “Toho Kids Land,” an indoor playground, in July 2012, as a venue where children can play freely without worrying about the impact of the nuclear power plant accident. The number of visitors reached 10,000 in November 2013.
[Environmental preservation activities]Toho Bank participated in the “Forest Creation by Business Entities” plan promoted by Fukushima Prefecture and took part in tree planting activities (“Toho Forest” Creation) at Kitashiobara-village, Yama-county, under the plan.
Matters to Address In Fukushima Prefecture, Toho Bank’s principal operational base, movement toward reconstruction has steadily progressed and further acceleration of these efforts are in need.
In keeping with Toho Bank’s concept of “All Serves the Region,” a corporate message, Toho Bank Group will make every effort to assist recovery throughout its ranks, in order to ensure that the regional economy may recover as soon as possible and that local residents may regain stable lives.
Fiscal 2014 is the last year of the “Toho Step-by-Step Plan,” a medium-term management plan. Based on a hard look at homeland Fukushima and the Bank, the Bank will make full-fledged efforts throughout its ranks to steadily progress, together with the region, and to meet the expectations of the Bank’s customers, shareholders, and regional society, and to achieve the planned target of the medium-term management plan.
August 2014
Seishi Kitamura
President
010_9422001372609.indd 2 2014/09/24 14:03:57

3
Consolidated Balance Sheet
As of March 31, 2014 and 2013 Millions of YenThousands of
U.S. Dollars (Note 3)
2014 2013 2014Assets:Cash and due from banks (Notes 14 and 19) ...................................................................... ¥ 1,093,424 ¥ 455,684 $ 10,624,018 Call loans and bills bought (Note 19) .................................................................................. 96,059 325,783 933,345 Monetary claims bought .................................................................................................... 10,426 6,110 101,303 Trading account securities (Notes 19 and 20) ..................................................................... 379 780 3,686 Money held in trust (Note 21) ............................................................................................. 10,379 30,825 100,848 Securities (Notes 6, 10, 19 and 20) .................................................................................... 1,492,213 1,341,651 14,498,769 Loans and bills discounted (Notes 4, 6, 7, 19 and 25) ......................................................... 2,638,929 2,466,952 25,640,592 Foreign exchanges ............................................................................................................ 1,744 1,440 16,947 Other assets (Note 6) ........................................................................................................ 8,053 9,321 78,253 Tangible fixed assets (Note 8) ............................................................................................ 35,766 36,215 347,512 Intangible fixed assets ....................................................................................................... 2,545 2,971 24,734 Deferred tax assets (Note 15) ............................................................................................ 4,862 4,342 47,245 Customers’ liabilities for acceptances and guarantees (Note 5) ............................................ 7,617 5,048 74,016 Allowance for loan losses .................................................................................................. (17,359) (19,781) (168,667)
Total assets ................................................................................................................ ¥ 5,385,042 ¥ 4,667,345 $ 52,322,607
Liabilities:Deposits (Notes 6 and 19) ................................................................................................. ¥ 5,124,757 ¥ 4,434,586 $ 49,793,601 Call money and bills sold ................................................................................................... 15,438 — 150,000 Borrowed money (Notes 6 and 9) ....................................................................................... 33,500 31,460 325,495 Foreign exchanges ............................................................................................................ 79 193 768 Other liabilities .................................................................................................................. 17,698 15,940 171,961 Provision for retirement benefits (Note 16) .......................................................................... — 10,984 —Net defined benefit liability (Note 16) .................................................................................. 13,192 — 128,186 Provision for directors’ retirement benefits .......................................................................... 403 453 3,921 Provision for reimbursement of deposits ............................................................................. 329 353 3,201 Provision for contingent loss .............................................................................................. 501 259 4,871 Provision for customer point program ................................................................................. 92 95 903 Deferred tax liabilities for land revaluation (Note 15) ............................................................ 3,611 3,698 35,089 Acceptances and guarantees (Note 5) ................................................................................ 7,617 5,048 74,016
Total liabilities ............................................................................................................ 5,217,222 4,503,072 50,692,016
Commitments and contingent liabilities (Note 7)
Net Assets:Capital stock ..................................................................................................................... 23,519 23,519 228,519 Capital surplus .................................................................................................................. 13,653 13,653 132,660 Retained earnings ............................................................................................................. 115,067 108,443 1,118,028 Treasury stock .................................................................................................................. (172) (190) (1,672)
Shareholders’ equity ..................................................................................................... 152,068 145,425 1,477,536 Valuation difference on available-for-sale securities (Note 20) .............................................. 16,448 17,965 159,819 Deferred gains or losses on hedges (Note 22) ..................................................................... 0 — 2 Revaluation reserve for land............................................................................................... 502 664 4,883 Remeasurements of defined benefit plans .......................................................................... (1,422) — (13,822)
Total accumulated other comprehensive income ............................................................. 15,528 18,629 150,882 Minority interests .............................................................................................................. 223 217 2,171
Total net assets (Note 17) .............................................................................................. 167,820 164,272 1,630,590 Total liabilities and net assets .................................................................................... ¥ 5,385,042 ¥ 4,667,345 $ 52,322,607
See notes to consolidated financial statements.
010_9422001372609.indd 3 2014/10/31 14:21:43

4
Consolidated Statements of Income
For the years ended March 31, 2014 and 2013 Millions of YenThousands of
U.S. Dollars (Note 3)
2014 2013 2014Income:Interest income:
Interest on loans and discounts ..................................................................................... ¥30,723 ¥33,023 $298,517 Interest and dividends on securities ............................................................................... 10,284 9,304 99,927 Other interest income ................................................................................................... 447 1 4,348
Fees and commissions income .......................................................................................... 12,790 11,020 124,272 Other operating income ..................................................................................................... 3,664 5,028 35,600 Other income (Note 11) ..................................................................................................... 4,173 2,620 40,549
Total income ............................................................................................................... 62,082 60,999 603,215
Expenses:Interest expenses:
Interest on deposits ...................................................................................................... 1,782 1,990 17,317 Interest on borrowings and rediscounts .......................................................................... 497 383 4,836 Other interest expenses ................................................................................................ 21 1 210
Fees and commissions expenses ....................................................................................... 5,251 5,395 51,025 Other operating expenses .................................................................................................. 774 1,145 7,526 General and administrative expenses ................................................................................. 37,338 36,800 362,796 Other expenses (Note 12) .................................................................................................. 1,990 4,544 19,338
Total expenses ............................................................................................................ 47,657 50,261 463,050 Income before income taxes and minority interests ...................................................... 14,425 10,737 140,165
Income taxes (Note 15):Current ........................................................................................................................ 4,241 4,491 41,214 Deferred ...................................................................................................................... 1,017 (139) 9,887
Total ................................................................................................................................ 5,259 4,352 51,101 Net income before minority interests ............................................................................. 9,166 6,385 89,063 Minority interests in income ........................................................................................... 9 6 87 Net income (Note 17) ....................................................................................................... ¥ 9,157 ¥ 6,378 $ 88,975
See notes to consolidated financial statements.
Consolidated Statements of Comprehensive Income
For the years ended March 31, 2014 and 2013 Millions of YenThousands of
U.S. Dollars (Note 3)
2014 2013 2014Net income before minority interests .................................................................................. ¥ 9,166 ¥ 6,385 $ 89,063 Other comprehensive income (Note 23): .............................................................................
Valuation difference on available-for-sale securities ........................................................ (1,520) 12,177 (14,777)Deferred gains or losses on hedges ............................................................................... 0 — 2 Revaluation reserve for land ............................................................................................. (1) — (10)Share of other comprehensive income in affiliates accounted for by the equity method ............ 4 4 41 Total other comprehensive income ................................................................................. (1,517) 12,182 (14,743)Comprehensive income .............................................................................................. ¥ 7,648 ¥18,567 $ 74,319
Total comprehensive income attributable to:
Shareholders of the parent ............................................................................................ ¥ 7,639 ¥18,561 $ 74,231 Minority interests .......................................................................................................... 9 6 87
¥ 7,648 ¥18,567 $ 74,319
See notes to consolidated financial statements.
010_9422001372609.indd 4 2014/09/24 14:03:57

5
Consolidated Statements of Changes in Net Assets
For the years ended March 31, 2014 and 2013 Millions of YenShareholders’ equity
Capital stock Capital surplus Retained earnings Treasury stock Shareholders’ equity
Balance, April 1, 2012 ............................................................ ¥23,519 ¥13,653 ¥103,825 ¥(536) ¥140,461 Changes of items during the year
Dividends from retained earnings ........................................ (1,779) (1,779)Net income ........................................................................ 6,378 6,378 Acquisition of treasury stock ............................................... (3) (3)Disposal of treasury stock .................................................. (0) 349 349 Reversal of land revaluation excess, net of tax ..................... 19 19 Net changes of items other than shareholders’ equity ..........
Total changes of items during the year .................................... — — 4,618 346 4,964 Balance, April 1, 2013 ............................................................ ¥23,519 ¥13,653 ¥108,443 ¥(190) ¥145,425 Changes of items during the year
Dividends from retained earnings ........................................ (1,711) (1,711)Net income ........................................................................ 9,157 9,157 Acquisition of treasury stock ............................................... (965) (965)Disposal of treasury stock .................................................. (0) 1 1 Retirement of treasury stock ............................................... (982) 982 —Reversal of land revaluation excess, net of tax ..................... 160 160 Net changes of items other than shareholders’ equity ..........
Total changes of items during the year .................................... — — 6,623 18 6,642 Balance, March 31, 2014 ....................................................... ¥23,519 ¥13,653 ¥115,067 ¥(172) ¥152,068
Millions of YenAccumulated other comprehensive income
Minority interests Total net assets
Valuation difference on available-for-
sale securities
Deferred gains or
losses on hedges
Revaluation reserve for
land
Remeasurements of defined benefit
plans
Total accumulated
other comprehensive
incomeBalance, April 1, 2012 ............................................................ ¥ 5,782 ¥— ¥684 ¥ — ¥ 6,466 ¥213 ¥147,141 Changes of items during the year
Dividends from retained earnings ........................................ (1,779)Net income ........................................................................ 6,378 Acquisition of treasury stock ............................................... (3)Disposal of treasury stock .................................................. 349 Reversal of land revaluation excess, net of tax ..................... 19 Net changes of items other than shareholders’ equity .......... 12,182 — (19) — 12,162 3 12,166
Total changes of items during the year .................................... 12,182 — (19) — 12,162 3 17,131 Balance, April 1, 2013 ............................................................ ¥17,965 ¥— ¥664 ¥ — ¥18,629 ¥217 ¥164,272 Changes of items during the year
Dividends from retained earnings ........................................ (1,711)Net income ........................................................................ 9,157 Acquisition of treasury stock ............................................... (965)Disposal of treasury stock .................................................. 1 Retirement of treasury stock ............................................... —Reversal of land revaluation excess, net of tax ..................... 160 Net changes of items other than shareholders’ equity .......... (1,516) 0 (161) (1,422) (3,100) 6 (3,094)
Total changes of items during the year .................................... (1,516) 0 (161) (1,422) (3,100) 6 3,547 Balance, March 31, 2014 ....................................................... ¥16,448 ¥ 0 ¥502 ¥(1,422) ¥15,528 ¥223 ¥167,820
010_9422001372609.indd 5 2014/09/24 14:03:57
6
Thousands of U.S. Dollars (Note 3)Shareholders’ equity
Capital stock Capital surplus Retained earnings Treasury stock Shareholders’ equity
Balance, April 1, 2013 ............................................................ $228,519 $132,660 $1,053,668 $(1,851) $1,412,997 Changes of items during the year
Dividends from retained earnings ........................................ (16,629) (16,629)Net income ........................................................................ 88,975 88,975 Acquisition of treasury stock ............................................... (9,385) (9,385)Disposal of treasury stock .................................................. (1) 18 16 Retirement of treasury stock ............................................... (9,546) 9,546 —Reversal of land revaluation excess, net of tax ..................... 1,561 1,561 Net changes of items other than shareholders’ equity ..........
Total changes of items during the year .................................... — — 64,360 178 64,538 Balance, March 31, 2014 ....................................................... $228,519 $132,660 $1,118,028 $(1,672) $1,477,536
Thousands of U.S. Dollars (Note 3)Accumulated other comprehensive income
Minority interests Total net assets
Valuation difference on available-for-
sale securities
Deferred gains or
losses on hedges
Revaluation reserve for
land
Remeasurements of defined benefit
plans
Total accumulated
other comprehensive
incomeBalance, April 1, 2013 ............................................................ $174,554 $— $6,455 $ — $181,010 $2,111 $1,596,119 Changes of items during the year
Dividends from retained earnings ........................................ (16,629)Net income ........................................................................ 88,975 Acquisition of treasury stock ............................................... (9,385)Disposal of treasury stock .................................................. 16 Retirement of treasury stock ............................................... —Reversal of land revaluation excess, net of tax ..................... 1,561 Net changes of items other than shareholders’ equity .......... (14,735) 2 (1,571) (13,822) (30,128) 60 (30,067)
Total changes of items during the year .................................... (14,735) 2 (1,571) (13,822) (30,128) 60 34,470 Balance, March 31, 2014 ....................................................... $159,819 $ 2 $4,883 $(13,822) $150,882 $2,171 $1,630,590
See notes to consolidated financial statements.
010_9422001372609.indd 6 2014/09/24 14:03:57

7
Consolidated Statements of Cash Flows
For the years ended March 31, 2014 and 2013 Millions of YenThousands of
U.S. Dollars (Note 3)
2014 2013 2014Cash flows from operating activities
Income before income taxes and minority interests ......................................................... ¥ 14,425 ¥ 10,737 $ 140,165 Depreciation expense .................................................................................................... 2,777 2,743 26,985 Impairment loss ............................................................................................................ 214 217 2,088 Equity in earnings of affiliates ........................................................................................ (96) (116) (935)Net decrease in allowance for loan losses ...................................................................... (2,422) (3,784) (23,537)Increase in provision for retirement benefits ................................................................... — 402 —Increase in net defined benefit liability ............................................................................ 18 — 180 Increase (decrease) in provision for directors’ retirement benefits .................................... (49) 51 (481)Increase (decrease) in provision for reimbursement of deposits........................................ (23) 91 (232)Increase (decrease) in provision for contingent loss ......................................................... 241 (32) 2,346 Increase (decrease) in provision for customer point program ........................................... (2) 15 (23)Interest income ............................................................................................................. (41,455) (42,329) (402,792)Interest expenses ......................................................................................................... 2,301 2,375 22,364 Net gain on securities ................................................................................................... (3,779) (1,199) (36,727)Net (gain) loss on money held in trust ............................................................................ 328 (390) 3,196 Net gain on foreign exchange ....................................................................................... (10) (11) (102)Net loss on sale of fixed assets ...................................................................................... 68 126 663 (Increase) decrease in trading account securities ............................................................ 401 (89) 3,897 Increase in loans and bills discounted ............................................................................ (171,977) (41,072) (1,670,977)Increase in deposits ...................................................................................................... 656,352 266,336 6,377,310 Increase in negotiable certificates of deposit ................................................................... 33,818 135,013 328,589 Increase (decrease) in borrowed money (excluding subordinated borrowings) ................... 240 (746) 2,331 (Increase) decrease in due from banks other than BOJ .................................................... 52 (75) 513 Decrease in call loans ................................................................................................... 225,407 244,057 2,190,127 Increase (decrease) in call money .................................................................................. 15,438 (3,698) 150,000 Increase in foreign exchange assets .............................................................................. (303) (355) (2,953)Increase (decrease) in foreign exchange liabilities ........................................................... (113) 10 (1,107)Interest received ........................................................................................................... 43,799 43,816 425,572 Interest paid ................................................................................................................. (2,785) (2,939) (27,068)All other operating activities........................................................................................... (328) (2,200) (3,191)Sub-total ...................................................................................................................... 772,538 606,952 7,506,202 Income taxes refund (paid) ............................................................................................ (4,882) (4,896) (47,436)Net cash provided by operating activities .................................................................. 767,656 602,055 7,458,766
Cash flows from investing activitiesPurchase of equity and other securities .......................................................................... (669,690) (450,361) (6,506,905)Proceeds from sales of equity and other securities .......................................................... 394,367 163,954 3,831,789 Proceeds from maturities of securities ........................................................................... 128,612 83,879 1,249,634 Increase in money held in trust ...................................................................................... (1,691) (1,000) (16,430)Decrease in money held in trust..................................................................................... 21,777 — 211,600 Expenditures for tangible fixed assets ............................................................................ (1,776) (3,031) (17,258)Proceeds from sales of tangible fixed assets .................................................................. 248 108 2,419 Expenditures for intangible fixed assets .......................................................................... (410) (430) (3,992)Net cash used in investing activities .......................................................................... (128,561) (206,881) (1,249,142)
Cash flows from financing activitiesProceeds from subordinated borrowings ........................................................................ 16,800 9,800 163,233 Repayments of subordinated borrowings ........................................................................ (15,000) — (145,744)Dividends paid .............................................................................................................. (1,711) (1,779) (16,629)Dividends paid to minority interests ................................................................................ (2) (2) (27)Repayments of lease obligations .................................................................................... (433) (404) (4,213)Purchase of treasury stock ............................................................................................ (965) (4) (9,385)Proceeds from sales of treasury stock ............................................................................ 1 310 16 Net cash provided by (used in) financing activities .................................................... (1,312) 7,919 (12,750)
Effect of exchange rate changes in cash and cash equivalents ..................................... 10 11 102 Net increase in cash and cash equivalents .................................................................... 637,792 403,105 6,196,976 Cash and cash equivalents at beginning of fiscal year .................................................. 455,261 52,156 4,423,455 Cash and cash equivalents at end of fiscal year (Note 14) ............................................. ¥1,093,054 ¥455,261 $10,620,431
See notes to consolidated financial statements.
010_9422001372609.indd 7 2014/09/24 14:03:58

8
1. Basis of PresentationThe accompanying consolidated financial statements of The Toho Bank, Ltd. (the “Bank”) and its consolidated subsidiaries (collectively the “Group”) have been prepared from the accounts and records maintained by them in accordance with accounting principles generally accepted in Japan which are different in certain material respects as to the application and disclosure requirements of International Financial Reporting Standards. The accompanying consolidated financial statements have been compiled from the consolidated financial statements filed with the Prime Minister as required by the Financial Instruments and Exchange Law of Japan and the Banking Law of Japan.
For the convenience of readers outside Japan, certain items presented in the original financial statements have been reclassified and rearranged.
The amounts indicated in millions of yen are rounded down by omitting amounts of less than one million. As a result, the totals shown in the accompanying financial statements do not necessarily agree with the sums of the individual amounts.
2. Summary of Significant Accounting Policies(a) Principles of consolidationUnder the control or influence concept, those companies in which the Bank, directly or indirectly, is able to exercise control over operations are fully consolidated, and those companies (affiliates) over which the Group has the ability to exercise significant influence are accounted for by the equity method.(1) Scope of consolidation The number of consolidated subsidiaries and unconsolidated subsidiary at March
31, 2014 and 2013 is as follows:
2014 2013Number of consolidated subsidiaries: ........................................... 2 2Number of unconsolidated subsidiaries: ........................................ 1 —
The unconsolidated subsidiary is excluded from the scope of consolidation since its exclusion does not preclude reasonable judgment on the Group’s financial position and financial performance in terms of its assets, ordinary income, net income (equal to the equity share), retained earnings (equal to the equity share) and accumulated other comprehensive income (equal to the equity share).
(2) Application of the equity method The number of affiliates accounted for by the equity method and unconsolidated
subsidiary not accounted for by the equity method at March 31, 2014 and 2013 is as follows:
2014 2013Number of affiliates accounted for by the equity method ................ 5 5Number of unconsolidated subsidiary not accounted for by the
equity method ............................................................................. 1 —
The unconsolidated subsidiary not accounted for by the equity method is excluded from the scope of equity method since its exclusion does not have a material effect on the consolidated financial statements in terms of its net income (equal to the equity share), retained earnings (equal to the equity share) and accumulated other comprehensive income (equal to the equity share).
(3) Closing date of the consolidated subsidiaries The closing date of the consolidated subsidiaries is the same as the consolidated
closing date.
(b) Trading account securitiesTrading account securities are stated at fair value at the end of the year.
The moving average cost method is used to determine the cost of securities sold.
(c) Securities Held-to-maturity debt securities are stated at amortized cost using the moving average cost method.
Available-for-sale securities are, in principle stated at fair value at the end of the year or, if the fair value is considered to be extremely difficult to obtain, at cost using the moving average cost method.
Valuation difference on available-for-sale securities is presented as a separate component of net assets, net of related tax effect.
Securities included in “Money held in trust” are also classified and accounted for in the same method as stated above.
(d) DerivativesThe Bank’s derivatives are stated at fair value.
(e) Depreciation of fixed assets(1) Depreciation of tangible fixed assets of the Bank (except lease assets) is
computed under the declining-balance method. The estimated useful lives of assets are as follows:
Buildings: 2–40 yearsOthers: 2–20 years
Depreciation at the consolidated subsidiaries is computed principally using the declining-balance method over the estimated useful lives of assets.
(2) Depreciation of intangible fixed assets (except lease assets) is computed under the straight-line method. Development costs for internally used software are capitalized and depreciated under the straight-line method over the estimated useful lives of primarily 5 years.
(3) Depreciation of lease assets pertaining to finance lease transactions other than those in which the lease is deemed to transfer ownership of leased property to the lessee, included in “Tangible fixed assets” and “Intangible fixed assets,” is computed by the straight-line method based on the assumptions that the lease term is equal to the useful life and that there is no residual value except where residual value guarantees are stipulated in lease contracts.
(f) Revaluation of landIn accordance with the Law concerning Revaluation of Land enacted on March 31, 1998 (the “Law”), the land used for business owned by the Bank was revalued at March 31, 2000, and the unrealized gains, net of related tax effect, are reported as “Revaluation reserve for land” in the Net Assets section, and the deferred tax is included in the Liabilities section as “Deferred tax liabilities for land revaluation”.
The amount of excess of the revalued carrying amount over the fair value of the lands revalued at March 31, 2014 and 2013 pursuant to the Article 10 of the Law was ¥11,387 million and ¥11,906 million, respectively.
(g) Allowance for loan lossesThe allowance for loan losses of the Bank is made in accordance with the Bank’s internal rules for self-assessment of asset quality and for providing reserve for possible credit losses. Pursuant to the rules, the allowance for loan losses has been provided for as described below.
For loans to borrowers which are classified as substantially bankrupt or which are bankrupt in the formal legal sense, a reserve is provided based on the amount remaining after deduction of the collateral considered to be disposable and an estimate of amounts recoverable under guarantees.
For loans to borrowers which, although not actually bankrupt in the legal sense, have experienced serious financial difficulties and whose failure is highly possible, a reserve is provided for the estimated unrecoverable amount based on the amount remaining after deduction of the collateral considered to be disposable and an estimate of amounts recoverable under guarantees.
For other loans, a reserve is provided based on the Bank’s historical loan loss experience.
The above procedures for providing reserves follow the Bank’s internally established rules for self-assessment of the quality of all the Bank’s loan assets, which have been audited by the Audit Department.
The allowance for loan losses of the consolidated subsidiaries is provided for necessary amount, which is based on historical loan loss experience and estimated collectibility of specific claims.
(h) Provision for directors’ retirement benefitsThe provision for directors’ retirement benefits is provided at the amount that would be required to be paid based on internally established standards if directors retired at the end of the year.
Notes to Consolidated Financial Statements
010_9422001372609.indd 8 2014/09/24 14:03:58
9
(i) Provision for reimbursement of depositsThe provision for reimbursement of deposits is provided for the future reimbursement of dormant deposits which were recognized as income to depositors, based on the estimated reimbursement loss in accordance with the past reimbursement records.
(j) Provision for contingent lossThe provision for contingent loss is provided for possible losses from contingencies, which are not covered by other specific provisions.
(k) Provision for customer point programThe provision for customer point program is provided based on a reasonable estimate for expected future purchases to be made by customers with reward point which are granted when they use co-branded credit cards issued by the Bank.
(l) Method for accounting for retirement benefitsThe retirement benefit obligation is attributed to each period by the straight-line method. Amortization of prior service cost and actuarial gain or loss is computed as follows:
Prior service cost is amortized using the straight-line method over a period of 3 years within the average remaining service period of active employees when incurred.
Actuarial gain or loss is amortized from the succeeding year using the straight-line method over a period of 10 years within the average remaining service period of active employees in the year of the incurrence.
Consolidated subsidiaries adopt the simplified method for calculating net defined benefit liability and net pension cost.
(Additional information)On April 1, 2014 (the Date of Enforcement), the Bank has revised its retirement
benefit plans whereby a part of the future payments of defined benefit plans transferred to defined contribution plans, and accounted for the transfer in accordance with the “Guidance on Accounting for Transfer between Retirement Benefit Plans” (the Accounting Standards Board of Japan (hereinafter “ASBJ”) Guidance No. 1). The prior service cost incurred in the amount of ¥1,005 million due to this revision is amortized using the straight-line method over 3 years within the average remaining service period from the date of the revision (i.e. the date of the revision is informed to employees).
(m) Translation of foreign currency assets and liabilitiesAssets and liabilities are translated into Japanese yen mainly at the exchange rates prevailing at the consolidated balance sheet date.
(n) LeasesFinance lease transactions, commenced prior to April 1, 2008, other than those in which the lease is deemed to transfer ownership of leased property to lessees are accounted for as operating lease transactions.
(o) Method of hedge accounting(1) Interest rate risks The Bank applies special treatment of hedge accounting for interest rate swaps
for interest rate risk arising from certain financial assets and liabilities whereby interest is recognized on an accrual basis.
(2) Currency risks Deferred hedge accounting is adopted for hedges carried out to control the risk
of currency fluctuations arising from foreign currency-denominated assets and liabilities, as stipulated in the “Treatment of Accounting and Auditing Concerning Accounting for Foreign Currency Transactions in Banking Industry” (JICPA Industry Audit Committee Report No. 25). Currency swap transactions are carried out for the purpose of offsetting the risk of currency fluctuations arising from foreign currency-denominated monetary claims. The effectiveness of the hedge is evaluated by confirming the availability of an amount equivalent to the foreign currency position used to hedge the foreign currency-denominated monetary claims.
(p) Statements of cash flowsIn preparing the consolidated statements of cash flows, cash and due from the Bank of Japan are considered to be cash and cash equivalents.
(q) Consumption taxesNational and local consumption taxes of the Bank and its consolidated subsidiaries are accounted for using the tax-excluded method.
(r) Changes in accounting policiesThe Bank has adopted “Accounting Standard for Retirement Benefit” (ASBJ Statement No. 26, May 17, 2012, hereinafter the “Retirement Benefit Standard”) and “Guidance on Accounting Standard for Retirement Benefits” (ASBJ Guidance No. 25, May 17, 2012, hereinafter the “Retirement Benefit Guidance”), (except for certain provisions set forth in the main clause of Paragraph 35 of Retirement Benefit Standard and Paragraph 67 of Retirement Benefit Guidance) effective from the end of the year ended March 31, 2014, and the Bank recognized the difference between retirement benefit obligation and plan assets as net defined benefit liability.
The Retirement Benefit Standard, etc., were applied in accordance with the transitional provisions set forth in Paragraph 37 of the Retirement Benefit Standard whereby unrecognized actuarial gain or loss and unrecognized prior service cost, net of tax, were recognized as remeasurements of defined benefit plans under accumulated other comprehensive income as of March 31, 2014.
As a result, net defined benefit liability of ¥13,192 million was recognized as of March 31, 2014. In addition, deferred tax asset increased by ¥767 million and accumulated other comprehensive income decreased by ¥1,422 million.
The effect on per share information is noted in Note 17.
(s) Accounting standard issued but not yet adoptedAccounting Standards for Retirement Benefits (May 17, 2012)
(1) Overview Accounting standards for retirement benefits has been revised from the
viewpoint of improvements to financial reporting and international convergence, mainly focusing on (a) how unrecognized actuarial gain or loss and prior service cost should be accounted for, (b) how retirement benefit obligation and service cost should be determined and (c) enhancement of disclosures.
(2) Scheduled date of adoption The Bank will adopt the amendments to the method for calculating retirement
benefit obligation and service cost effective from the beginning of the year ending March 31, 2015.
(3) The effect of adopting this accounting standard The effect of adopting these accounting standards is an increase in retained
earnings by ¥220 million at the beginning of the year ending March 31, 2015.
3. U.S. Dollar AmountsThe translation of yen amounts into U.S. dollar amounts is included solely for convenience, as a matter of arithmetic computation only, at the rate of ¥102.92 = U.S. $1.00, the exchange rate prevailing on March 31, 2014. This translation should not be construed as a representation that yen amounts have been, could have been, or could in the future be, converted into U.S. dollars at the above or any other rate.
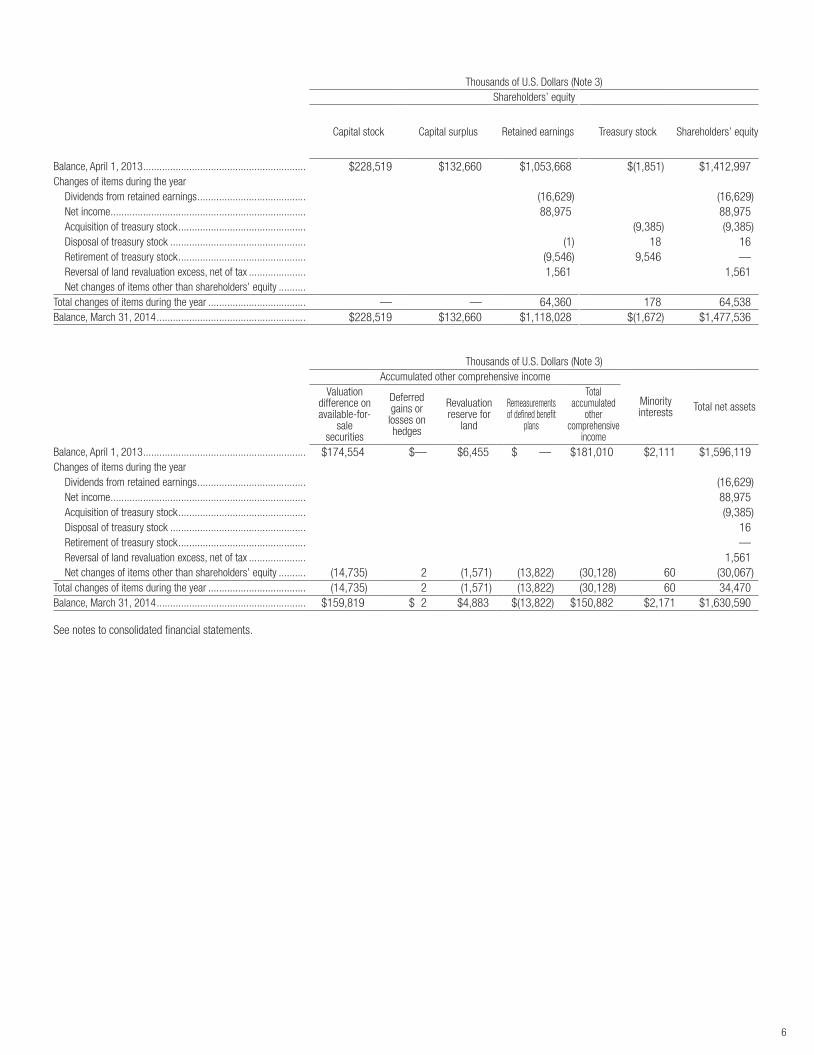
4. Loans and Bills DiscountedLoans and bills discounted at March 31, 2014 and 2013 included the following loans:
Millions of Yen
March 31 2014 2013
Loans to borrowers in bankruptcy .................................... ¥ 1,154 ¥ 3,800
Delinquent loans ............................................................ 40,504 47,658
Loans past due 3 months or more ................................... 105 877
Restructured loans ......................................................... 931 1,308
Total .............................................................................. ¥42,696 ¥53,645
010_9422001372609.indd 9 2014/09/24 14:03:58

10
Loans to borrowers in bankruptcy represent non-accrual loans, after the write-offs of loans deemed uncollectable to borrowers who are legally bankrupt, as defined in Article 96, Paragraph 1, Subparagraphs 3 and 4 of the Enforcement Ordinance of the Corporation Tax Law.
Delinquent loans are non-accrual loans other than loans to borrowers in bankruptcy or loans on which interest payments have been deferred in order to assist the restructuring of the borrowers.
Loans past due 3 months or more are loans on which interest or principal payments are 3 months or more past due, but which are not included in loans to borrowers in bankruptcy or delinquent loans.
Restructured loans are loans, other than loans to borrowers in bankruptcy, delinquent loans or loans past due 3 months or more, on which the Bank has granted certain concessions such as a reduction of the contractual interest rates or principal or a deferral of payments of interest/principal, in order to assist the restructuring of the borrowers.
Bills discounted are accounted for as finance transactions in accordance with “Treatments in Accounting and Audit for Banks on Application of Accounting Standards for Financial Instruments for Banks” (JICPA Industry Audit Committee Report No. 24). The Bank has rights to sell or pledge commercial bills discounted and foreign exchange bought without restrictions, and their total face amount was ¥8,028 million and ¥8,232 million at March 31, 2014 and 2013, respectively.
5. Acceptances and GuaranteesAll contingent liabilities arising from acceptances and guarantees are included in the account “Customers’ liabilities for acceptances and guarantees,” which represents the Bank’s right of indemnity from the applicants, and is presented as a contra-account on the assets side of the consolidated balance sheets.
6. Pledged AssetsAssets pledged as collateral at March 31, 2014 and 2013 were as follows:
Millions of YenMarch 31 2014 2013Pledged assets:
Securities .................................................................. ¥162,579 ¥ 66,309Loans and bills discounted .......................................... — 85,916
Total pledged assets ....................................................... ¥162,579 ¥152,225Liabilities covered by pledged assets:
Deposits .................................................................... ¥ 32,752 ¥ 20,268Borrowed money ........................................................ 6,900 6,660
Total liabilities covered by pledged assets ........................ ¥ 39,652 ¥ 26,928
In addition to the above, Securities in the amount of ¥96,953 million and ¥94,688 million, and Other assets in the amount of ¥292 million and ¥295 million were pledged as collateral in connection with exchange settlements as of March 31, 2014 and 2013, respectively.
Security deposit in the amount of ¥854 million and ¥864 million were included in Other assets as of March 31, 2014 and 2013, respectively.
7. Commitments and Contingent LiabilitiesOverdraft facilities and line-of-credit contracts are agreements under which, unless there is no breach of contract by the counterparty, the Bank or its consolidated subsidiary is required to provide clients with funds up to a fixed limit upon submission of a loan application to the Bank or its consolidated subsidiary. The unused amount related to such facilities/contracts stood at ¥689,868 million and ¥666,575 million at March 31, 2014 and 2013, respectively. Of this amount, facilities/contracts which expire within one year at inception or which are unconditionally cancelable at any time, totaled ¥650,173 million and ¥645,065 million at March 31, 2014 and 2013, respectively.
Most of these agreements expire without the clients’ having utilized the financial resources available under the facilities/contracts, and the unused amount does not necessarily impact the Bank or its consolidated subsidiary’s future cash flows. Most of these facilities/contracts contain a clause which allows the Bank or its subsidiary
to reject a loan application or to reduce the upper limit requested in view of changing financial conditions, credit maintenance and other reasonable concerns.
When necessary, the Bank or its consolidated subsidiary demands collateral such as real estate or marketable securities at the date on which the aforementioned agreement is entered into. In addition, after facilities/contracts are set forth, the Bank or its consolidated subsidiary regularly assesses the business status of the clients, based on predetermined internal procedures and, when prudent, revises the agreements or reformulates policies to maintain creditworthiness.
8. Accumulated Depreciation of Tangible Fixed AssetsAccumulated depreciation of Tangible fixed assets amount was ¥47,954 million and ¥47,233 million, and advanced depreciation on Tangible fixed assets amount was ¥1,022 million and ¥1,022 million at March 31, 2014 and 2013, respectively.
9. Borrowed MoneyBorrowed money includes borrowings made under special conditions under which repayment is subordinate to other classes of debt. The amount of the subordinate borrowings totaled ¥26,600 million and ¥24,800 million at March 31, 2014 and 2013, respectively.
10. Guarantees for Corporate BondsThe amount of the guarantees for privately placed bonds in corporate bonds in accordance with Paragraph 3 of Article 2 of the Financial Instruments and Exchange Law totaled ¥30,419 million and ¥26,756 million at March 31, 2014 and 2013, respectively.
11. Other Income Other income for the years ended March 31, 2014 and 2013 were principally consisted of the following:
Millions of YenMarch 31 2014 2013Gain on sales of stocks and other securities ..................... ¥1,435 ¥571Compensation income ..................................................... 263 —Reversal of allowance for loans losses .............................. 24 —Gain on bad debt recovered ............................................. — 16Gain on disposal of fixed assets ....................................... 1 0
Compensation income was the compensation for damage from Tokyo Electric Power Co., Inc. since the value of depreciable assets and residential land reduced due to the accident at Fukushima Daiichi Nuclear Power Station and Fukushima Daini Nuclear Power Station.
12. Other ExpensesOther expenses for the years ended March 31, 2014 and 2013 were principally consisted of the following:
Millions of YenMarch 31 2014 2013Loss on impairment of fixed assets .................................. ¥214 ¥ 217Loss on disposal of fixed assets ....................................... 180 270Loss on sales of stocks and other securities ..................... 58 949Loss on devaluation of stocks and other securities ............ 16 2,184Write-off of loans ............................................................ 9 —Provision for possible loan losses ..................................... — 24
The differences between the recoverable amount and the book value of the following assets were recognized as loss on impairment of fixed assets during the years ended March 31, 2014 and 2013:
010_9422001372609.indd 10 2014/09/24 14:03:58

11
(Millions of Yen)
Area Purpose of use TypeLosses
2014 2013
Fukushima Area
Branch premisesLand ¥ 38 ¥ —
Building 39 149
Company housingLand 19 —
Building — 3
Idle assetsLand 64 29
Building — 11
OtherIdle assets Land 52 —
Branch premises Building — 23
Total ¥214 ¥217
The Bank recognizes the estimated unrecoverable amount in its branch premises and idle assets as loss on impairment. For the purposes of identifying impaired assets, the assets of an individual branch are grouped as a unit.
As for idle assets, the individual asset is assessed as a unit for the purposes of identification.
The recoverable amount is calculated based on net realizable value. Net realizable value is calculated based on the valuation by road rating and on the appraisal value, etc., less estimated cost of disposal.
13. Notes to Consolidated Statements of Changes in Net Assets
Changes in outstanding shares and treasury stock during the years ended March 31, 2014 and 2013 are summarized as follows:
(Thousand Shares)
Number ofShares as of April 1, 2013
Number ofShares
Increased
Number ofShares
Decreased
Number ofShares as of
March 31, 2014
Outstanding Shares
Common Stock (*1) 255,500 — 3,000 252,500Treasury Stock
Common Stock (*2) 470 3,045 3,005 510
(*1) Decrease in the number of Common stock by 3,000 thousand shares was composed of 3,000 thousand shares of retirement of treasury stock.
(*2) Increase in the number of Treasury stock by 3,045 thousand shares was composed of 3,000 thousand shares of repurchase of Treasury stock and 45 thousand shares of acquisition of odd-lot shares.
Decrease in the number of Treasury stock of 3,005 thousand shares was composed of 3,000 thousand shares of retirement of Treasury stock and 5 thousand shares of disposition of odd-lot shares.
(Thousand Shares)
Number ofShares as of April 1, 2012
Number ofShares
Increased
Number ofShares
Decreased
Number ofShares as of
March 31, 2013
Outstanding Shares
Common Stock 255,500 — — 255,500Treasury Stock
Common Stock (*1&2) 1,701 14 1,246 470
(*1) Major component of an increase in the number of Treasury stock by 14 thousand shares was 14 thousand shares of acquisition of odd-lot shares. Decrease in the number of Treasury stock of 1,246 thousand shares was composed of 1,244 thousand shares of disposition by an employee stock ownership plan (ESOP) trust, 0 thousand shares of disposal of Treasury stock and 1 thousand shares of disposition of odd-lot shares.
(*2) The number of Treasury stock includes stock owned by ESOP trust. However, the number of Treasury stock at March 31, 2013 did not include stock owned by ESOP trust since ESOP trust terminated in the year ended March 31, 2013.
Detailed information about cash dividends paid during the year ended March 31, 2014 was as follows:
Date of ApprovalType of Shares
Total Dividends(¥ million)
Dividend Per Share
DividendRecord Date
EffectiveDate
General Meeting of Shareholders on June 24, 2013
Common
Stock829 ¥3.25
March 31,
2013
June 25,
2013
Board of Directors onNovember 11, 2013
Common
Stock882 ¥3.50
September
30, 2013
December
5, 2013
Detailed information about cash dividends paid during the year ended March 31, 2013 was as follows:
Date of ApprovalType of Shares
Total Dividends(¥ million)
Dividend Per Share
DividendRecord Date
EffectiveDate
General Meeting of Shareholders on June 26, 2012
Common
Stock952 ¥3.75
March 31,
2012
June 27,
2012
Board of Directors onNovember 12, 2012
Common
Stock827 ¥3.25
September
30, 2012
December
5, 2012
Notes: 1. The total dividends resolved by the General Meeting of Shareholders on June 26, 2012 do not include the dividends paid to the ESOP trust of ¥4 million, since the Bank’s shares owned by ESOP trust is treated as treasury stock.
2. The total dividends resolved by the Board of Directors meeting on November 12, 2012 do not include the dividends paid to the ESOP trust of ¥1 million, since the Bank’s shares owned by ESOP trust is treated as Treasury stock.
Dividends with record dates on or before March 31, 2014 and effective dates after April 1, 2014 were as follows:
Date of ApprovalType of Shares
Total Dividends(¥ million)
Source of Dividends
DividendPer Share
DividendRecord Date
EffectiveDate
General Meeting of Shareholders on June 23, 2014
Common
Stock1,008
Other Retained Earnings
¥4.00March
31, 2014
June
24, 2014
Dividends with record dates on or before March 31, 2013 and effective dates after April 1, 2013 were as follows:
Date of ApprovalType of Shares
Total Dividends(¥ million)
Source of Dividends
DividendPer Share
DividendRecord Date
EffectiveDate
General Meeting of Shareholders on June 24, 2013
Common
Stock829
Other Retained Earnings
¥3.25March
31, 2013
June
25, 2013
14. Cash and Cash EquivalentsA reconciliation between Cash and due from banks in the consolidated balance sheets at March 31, 2014 and 2013, and Cash and cash equivalents in the consolidated statements of cash flows for the years then ended was as follows:
Millions of YenMarch 31 2014 2013Cash and due from banks ............................................... ¥1,093,424 ¥455,684Ordinary due from banks ................................................ (119) (198)Other ............................................................................. (249) (223)Cash and cash equivalents ............................................. ¥1,093,054 ¥455,261
010_9422001372609.indd 11 2014/09/24 14:03:58
12
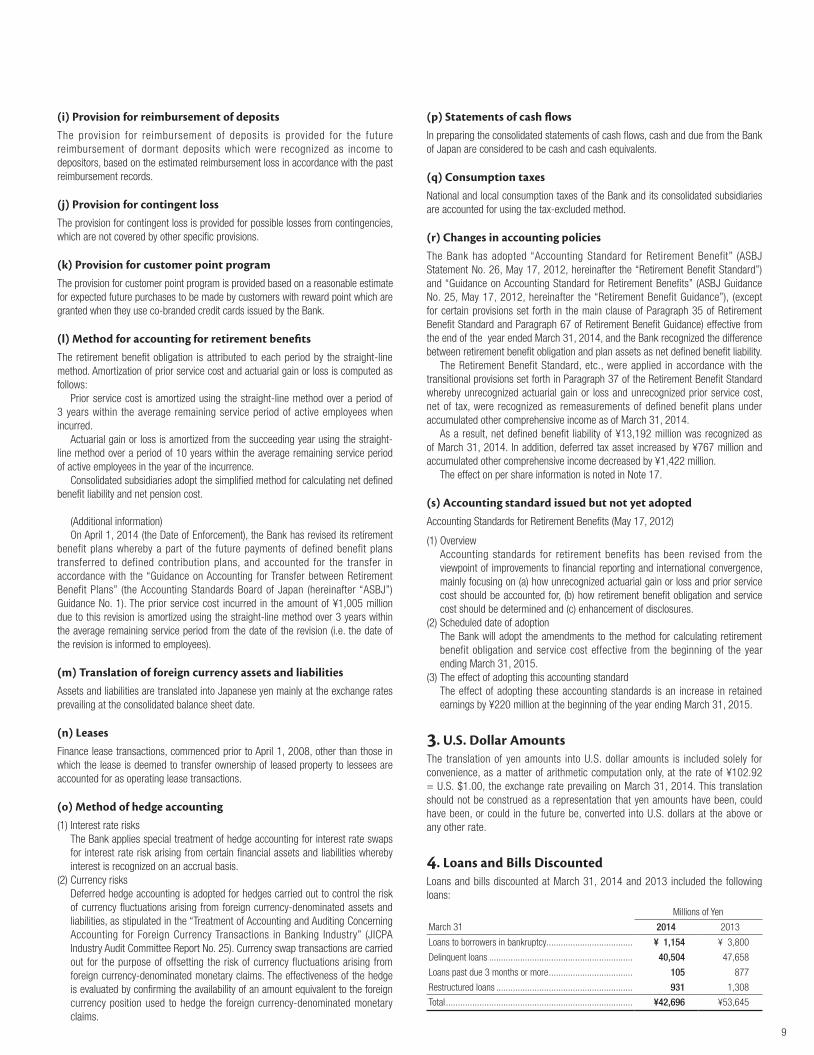
15. Deferred Income TaxesThe major components of deferred tax assets and liabilities at March 31, 2014 and 2013 were summarized as follows:
Millions of YenMarch 31 2014 2013Deferred tax assets:
Allowance for loan losses ............................................ ¥ 5,312 ¥ 6,030Provision for retirement benefits .................................. — 3,905Net defined benefit liability .......................................... 4,624 —Depreciation .............................................................. 1,315 1,364Revaluation reserve for land ........................................ 2,169 2,169Others ....................................................................... 3,883 4,754Valuation allowance .................................................... (3,750) (4,330)
Total deferred tax assets ................................................. 13,554 13,892
Deferred tax liabilities:Revaluation reserve for land ........................................ (3,611) (3,698)Valuation difference on available-for-sale securities ...... (8,673) (9,531)Others ....................................................................... (18) (18)
Total deferred tax liabilities .............................................. (12,303) (13,248)Net deferred tax assets ................................................... ¥ 1,251 ¥ 643
The following summarized the significant differences between the statutory tax rate and the Bank’s effective tax rate for the years ended March 31, 2014 and 2013:
Year ended March 31 2014 2013Statutory tax rate............................................................ —% 37.4%Non-deductible expenses................................................ — 0.7Non-taxable dividend income .......................................... — (1.2)Per capita inhabitant taxes .............................................. — 0.3Valuation allowance ........................................................ — 2.6Others ........................................................................... — 0.5Effective tax rate ............................................................ —% 40.5%
The note for the year ended March 31, 2014 was omitted, because the difference between the statutory tax rate and the Bank’s effective tax rate in the consolidated statement of income was less than or equal to 5% of the statutory tax rate.
(Revisions to amounts of deferred tax assets and deferred tax liabilities due to change in rate of income taxes)The “Act for Partial Amendment to the Income Tax Act” was promulgated on March 31, 2014 and, as a result, the Bank is no longer subject to the Special Reconstruction Corporation Tax effective for year beginning on and after April 1, 2014. Accordingly, the effective statutory tax rate used to measure the Bank’s deferred tax assets and liabilities was changed from 37.4% to 35.0% for the temporary differences to be settled from year beginning April 1, 2014.
As a result of this change, deferred tax assets decreased by ¥323 million and income taxes-deferred increased by ¥323 million.
16. Retirement BenefitsThe Bank and its consolidated subsidiaries have a corporate pension fund plan and a lump-sum retirement payment plan (transferred from the welfare pension fund system on October 1, 2004) as defined benefit plans.
The Bank’s consolidated subsidiaries adopt the simplified method for calculating net defined benefit liability and net pension cost.
On April 1, 2014 (the Date of Enforcement), the Bank has revised its retirement benefit plans whereby a part of the future payments of defined benefit plans transferred to defined contribution plans, and accounted for the transfer in accordance with the “Guidance on Accounting for Transfer between Retirement Benefit Plans” (ASBJ Guidance No. 1).
Year ended March 31, 2014
A. Defined benefit plans (included the companies that apply simplified method)
(i) Change in retirement benefit obligation Millions of Yen
Balance at beginning of the year ................................................................ ¥35,367Service cost .............................................................................................. 1,056Interest cost .............................................................................................. 352Actuarial gain ............................................................................................ (13)Benefit paid .............................................................................................. (1,484)Prior service cost ...................................................................................... (1,005)Others ...................................................................................................... —Balance at end of year ............................................................................... ¥34,272
(ii) Change in plan assets Millions of Yen
Balance at beginning of the year ................................................................ ¥19,885Expected return on plan assets .................................................................. 396Actuarial gain ............................................................................................ 918Employer contributions .............................................................................. 691Benefit paid .............................................................................................. (811)Others ...................................................................................................... —Balance at end of year ............................................................................... ¥21,080
(iii) Retirement benefit obligation and plan assets at end of the year and reconciliation of net defined benefit liability and net defined benefit asset recognized in the consolidated balance sheet
Millions of YenFunded retirement benefit obligation .......................................................... ¥ 25,001Plan assets ............................................................................................... (21,080)
3,921Unfunded retirement benefit obligation ....................................................... 9,271Amount of liability, net of asset, recognized in consolidated balance sheet .... 13,192
Net defined benefit liability ......................................................................... 13,192Net defined benefit asset ........................................................................... —Amount of liability, net of asset, recognized in consolidated balance sheet .... ¥ 13,192
(iv) Net pension cost and its breakdownMillions of Yen
Service cost .............................................................................................. ¥1,056Interest cost ............................................................................................. 352Expected return on plan assets .................................................................. (396)Amortization of actuarial loss ..................................................................... 398Amortization of prior service cost ............................................................... (27)Others ...................................................................................................... —Net pension cost ....................................................................................... ¥1,383
(v) Remeasurements of defined benefit plans The components of items recognized in remeasurements of defined benefit
plans (before tax effect) were as follows:Millions of Yen
Unrecognized prior service cost .................................................................. ¥ (977)Unrecognized actuarial gain ....................................................................... 3,167Total ......................................................................................................... ¥2,190
(vi) Plan assets(a) Percentage by major category of plans assets was as follows:
General account of life insurance companies .............................................. 44%Equities ................................................................................................... 28%Bonds ...................................................................................................... 23%Others ...................................................................................................... 5%Total ......................................................................................................... 100%
010_9422001372609.indd 12 2014/09/24 14:03:58

13
(b) Basis of long-term expected rate of return on plan assets In determining long-term expected rate of return on plan assets, the Group
considers the current and projected plan asset allocations, as well as current and future long-term rate of returns expected from various categories of the plan assets.
(vii) Actuarial assumptionsActuarial assumptions as of March 31, 2014 was as follows:
Discount rate 1.0%Long-term expected rate of return on plan assets 2.0%
B. Defined contribution pension plansNone
On April 1, 2014 (the Date of Enforcement), the Bank has transferred part of the future payments of defined benefit pension plans to defined contribution plans.
Year ended March 31, 2013
(a) Retirement benefit obligationMillions of Yen
Year ended March 31 2013Retirement benefit obligation...................................................................... ¥(35,367)Plan assets at fair value ............................................................................. 19,885Unfunded retirement benefit obligation ....................................................... (15,481)Unrecognized actuarial loss........................................................................ 4,497Net retirement benefit obligation ................................................................ (10,984)Prepaid pension cost ................................................................................. —Provision for retirement benefits ................................................................. ¥(10,984)
(b) Net pension costMillions of Yen
Year ended March 31 2013Service cost .............................................................................................. ¥ 912Interest cost .............................................................................................. 623Expected return on plan assets .................................................................. (369)Amortization of prior service cost ............................................................... —Amortization of actuarial loss ..................................................................... 296Net pension cost ....................................................................................... ¥1,463
(c) Actuarial assumptions and basis of calculation to determine costs and benefit obligation
Year ended March 31 2013(i) Assumed discount rate 1.0%(ii) Expected rate of return on plan assets 2.0%(iii) Method of attributing expected retirement benefits to periods: Straight-line
basis
(iv) Amortization of prior service cost
Prior service cost is amortized using the straight-line method over a period of 3
years within the average remaining service period of active employees when
incurred.
(v) Amortization of actuarial loss
Actuarial loss is amortized from the succeeding year using the straight-line
method over a period of 10 years within the average remaining service period of
active employees at year of the occurrence.
17. Per Share InformationNet assets per share as of March 31, 2014 and 2013 and net income per share for the years ended March 31, 2014 and 2013 were as follows:
YenAs of March 31 2014 2013Net assets per share ¥665.09 ¥643.28Net income per share 36.26 25.06
Note 1: The bases for the computation of net assets per share are set out below.
Millions of Yen / Thousands of SharesAs of or year ended March 31 2014 2013Total net assets .............................................................. ¥167,820 ¥164,272Deduction from total net assets: ...................................... 223 217Minority interests ........................................................... 223 217Net assets related to common stock ................................ 167,596 164,055Number of common stock used to calculate net assets per share ...................................................................... 251,989 255,029
As described in “Changes in accounting policies”, the Bank and certain consolidated subsidiaries have adopted the Retirement Benefit Standard, etc. and the transitional provisions set forth in Paragraph 37 of the Retirement Benefit Standard is applied.
As a result, net assets per share decreased by ¥5.65 at March 31, 2014.
Note 2: The bases for the computation of net income per share are set out below.
Millions of Yen / Thousands of SharesYear ended March 31 2014 2013Net income .................................................................... ¥ 9,157 ¥ 6,378Amounts not attributable to common shareholders ........... — —Net income related to common stock............................... 9,157 6,378Weighted average number of common stock during the year............................................................................... 252,495 254,502
18. LeasesLessee:Finance lease transactions other than those in which the lease is deemed to transfer ownership of the leased property to the lessee are accounted for as operating lease transactions at March 31, 2014 and 2013 were summarized as follows:
Millions of YenMarch 31 2014 2013Amounts equivalent to acquisition costs:
Tangible fixed assets ¥35 ¥80Amounts equivalent to accumulated depreciation:
Tangible fixed assets ¥34 ¥71Amounts equivalent to net carrying amount:
Tangible fixed assets ¥ 0 ¥ 8
Lease payment relating to finance leases accounted for as operating leases amounted to ¥9 million and ¥22 million for the years ended March 31, 2014 and 2013, respectively.
The amount equivalent to depreciation related to leased assets has been computed using the straight-line method over the lease terms and amounted to ¥7 million and ¥19 million for the years ended March 31, 2014 and 2013, respectively.
The amount equivalent to interest expense related to leased assets amounted to ¥0 million and ¥1 million for the years ended March 31, 2014 and 2013, respectively.
The amount of anticipated finance lease payments at March 31, 2014 and 2013 are as follows:
At March 31, 2014 Millions of Yen2015 .......................................................................................... ¥ 12016 and Thereafter ................................................................... —Total ........................................................................................... ¥ 1
At March 31, 2013 Millions of Yen2014 .......................................................................................... ¥82015 and Thereafter ................................................................... 1Total ........................................................................................... ¥9
010_9422001372609.indd 13 2014/09/24 14:03:58

14
19. Financial Instruments and Related Disclosure(a) Overall situation concerning financial instruments(1) Policy for financial instruments The Group provides banking and other financial operations including lease
business. Funds raised from these operations are used primarily to offer commercial and mortgage loans and to invest in marketable securities. The Group’s primary funding sources are deposits, but it may also borrow funds in the financial markets to meet day-to-day, short-term funding needs. As a result, it holds financial assets and liabilities whose economic values fluctuate with interest rate changes. To minimize adverse effects of interest rate fluctuations, an asset-liability management (ALM) system is in place to ensure comprehensive management of assets and liabilities with various durations under different market conditions. In addition, the Group engages in interest rate-, currency-, and bond- related transactions as derivative transactions which include transactions for the purpose of hedging and transactions for the purpose other than hedging.
(2) Nature and extent of risks arising from financial instruments Financial assets held by the Group consist mainly of loans extended to business
entities and individuals in Japan, which entail credit risk, where difficulty occurs in recovering the principal amounts of loans and interests thereon due to borrowers’ bankruptcy or deteriorating business. General economic conditions in Fukushima Prefecture, the Group’s primary geographical area of operations, may also exert adverse impact on borrowers’ businesses and values of collaterals pledged. Marketable securities in which the Group invests are primarily bonds and equity shares, which subject the Group to credit risk (deterioration of financial conditions of issuers) and market risk (fluctuations in interest rates and prices).
The Group also faces liquidity risk in connection with borrowed funds and call money, that is, the Group might find it difficult to honor promises of payment on due dates if it cannot tap into financial markets to raise needed funds under certain environments. Moreover, the Group’s borrowings are based on variable rates, which expose the Group to risks associated with interest rate fluctuations.
Aside from derivative instruments (i.e., interest rate and currency swaps) distributed directly to customers, the Group may enter into interest rate swaps as a part of its ALM operations to hedge its borrowings. Derivative transactions qualified for hedge accounting are accounted for separately using the hedge accounting standards. To secure foreign-currency denominated funds for currency-related services, the Group may utilize foreign exchange forward contracts and bond options trading at over-the-counter to increase interest income, which come with inherent market risk (risk of losses by the Group if interest rates and foreign exchange make adverse movements) and credit risk (risk of losses by the Group in the event of default by the counterparty). The Group is not engaged in leveraged derivative transactions with large volatility of the contract’s fair value out of proportion to the price fluctuation of the underlying asset.
(3) Risk management system for financial instruments (i) To manage credit risk, the Group has established credit risk management
rules and a framework governing credit review required for each loan, credit limits, internal credit ratings, guarantees and collaterals in addition to procedures to deal with problem loans. The state of such risk and risk management is periodically reported to the Board of Directors upon examination by the ALM Committee.
Credit risk associated with issuers of marketable securities and counterparty risk relating to derivative transactions are managed by periodic monitoring of credit ratings and fair value.
(ii) The Group manages market risk (interest rate risk, price fluctuation risk and foreign exchange risk) as part of its ALM operations, which, among others, calls for quantification of various risks, risk limits to be set within a manageable scope in line with the Group’s financial strength, and proper risk distribution to secure optimized profits. Risk management techniques and procedures used by the Group for the market risks are stipulated in the Group’s market risk management rules. They include Value at Risk (VaR), asset-liability analyses by maturity, interest rate sensitivity analyses, and simulated risk analyses to assess potential impact of interest rate fluctuations from various angles. To reduce price fluctuation risk, the rules
require a limit on the amount of securities to be held and a stop-loss level to be set up for each type of securities. In addition, ALM guidelines are prepared every six months, and the ALM Committee conducts reviews and examinations. The status of exposure to risks and the results of risk management activities are reported periodically to the Board of Directors upon examination by the ALM Committee.
To calculate VaR for the market risk, the variance-covariance method (holding period varies from one month to one year, depending on risk categories such as interest rates and shares, confidence level of 99%, observation period of combination of both 1 and 5 years) has been adopted. At March 31, 2014, the Group’s market risk quantity (estimated loss) in total is ¥53,139 million. This measure is for the Bank alone, since outstanding balance and sensitivity of the consolidated subsidiaries’ financial assets and liabilities are considered insignificant.
The Group conducts back test to compare the actual income to VaR calculated by the model in order to verify the model. As a result of back test conducted, the Group concludes the model captures the market risk with sufficient accuracy. However, VaR is a statistic measure of market risk quantity based on the past fluctuations of market and certain probability of occurrence. It may not be possible to capture the risk if the market fluctuates rapidly, under extraordinary circumstances.
For derivative transactions, an internal control framework is in place by separating the execution team, the team responsible for assessing effectiveness of transactions as hedging instruments and the back office from one another. The quantified risks, aggregate size of derivative transactions and the results of profit/loss revaluation are reported to the ALM Committee on a monthly basis. The state of risk and risk management is reported periodically to the Board of Directors upon examination by the ALM Committee.
(iii) To control liquidity risk, the Group, having formulated its liquidity risk management rules, conducts daily analyses of the status of funding and the results of fund management activities, in addition to periodic funding tolerance checks under diverse scenarios. The status of exposure to risks and the results of risk management activities are reported periodically to the Board of Directors upon examination by the ALM Committee.
(4) Supplemental explanation for fair value of financial instruments Financial instruments are stated at amounts based on market prices or
reasonably computed amounts in the case of the absence of observable market prices. The computation of the amounts thereof is based on certain assumptions. Therefore, the amounts derived may differ if other assumptions are used.
(b) Fair value of financial instruments The amount shown on the consolidated balance sheets, the corresponding fair
value and their difference as of March 31, 2014 and 2013 for each financial instrument category are provided below. It should be noted that non-listed shares for which fair value is extremely difficult to obtain are not included in the following tables (see Note 2). Also items whose account balance on the consolidated balance sheets are immaterial are not included in the following disclosure.
Millions of YenMarch 31, 2014 Book value Fair value Difference(1) Cash and due from banks ......................... ¥ 1,093,424 ¥ 1,093,424 ¥ —(2) Call loans and bills bought ........................ 96,059 96,059 —(3) Trading account securities ........................ 379 379 —(4) Securities:
Held-to-maturity securities ........................ — — —Available-for-sale securities ...................... 1,489,648 1,489,648 —
(5) Loans and bills discounted ........................ 2,638,929Allowance for loan losses (*1) ................... (17,272)
2,621,657 2,654,552 32,894Total assets .................................................. ¥ 5,301,169 ¥ 5,334,064 ¥ 32,894(1) Deposits .................................................. ¥ 4,724,430 ¥ 4,724,646 ¥ 215(2) Negotiable certificates of deposits ............. 400,326 400,326 —Total liabilities ............................................... ¥ 5,124,757 ¥ 5,124,973 ¥ 215Derivative transactions (*2):
Hedge accounting is not applied ................ ¥ (124) ¥ (124) ¥ —Hedge accounting is applied ..................... 32 32 —
Total derivative transactions ........................... ¥ (92) ¥ (92) ¥ —
010_9422001372609.indd 14 2014/09/24 14:03:58

15
Millions of YenMarch 31, 2013 Book value Fair value Difference(1) Cash and due from banks ......................... ¥ 455,684 ¥ 455,684 ¥ —(2) Call loans and bills bought ........................ 325,783 325,783 —(3) Trading account securities ........................ 780 780 —(4) Securities:
Held-to-maturity securities ........................ 10,299 10,444 144Available-for-sale securities ...................... 1,329,117 1,329,117 —
(5) Loans and bills discounted ........................ 2,466,952Allowance for loan losses (*1) ................... (19,702)
2,447,249 2,482,213 34,963Total assets .................................................. ¥ 4,568,915 ¥ 4,604,023 ¥ 35,108(1) Deposits .................................................. ¥ 4,068,077 ¥ 4,068,449 ¥ 371(2) Negotiable certificates of deposits ............. 366,508 366,508 0Total liabilities ............................................... ¥ 4,434,586 ¥ 4,434,957 ¥ 371Derivative transactions (*2):
Hedge accounting is not applied ................ ¥ (440) ¥ (440) ¥ —Hedge accounting is applied ..................... — — —
Total derivative transactions ........................... ¥ (440) ¥ (440) ¥ —
(*1) Allowance for loan losses (general reserve) and allowance for loan losses (case-specific reserve) provided for loans are deducted to compare with the corresponding fair value.
(*2) The derivative transactions reported under “Other assets” and “Other liabilities” in the consolidated balance sheets are stated on a net basis in the above table.
Net credit/debit arising from derivative transactions is stated on a net basis, and accounts with net debits in the aggregate are indicated by parentheses.
(Note 1) Valuation method of financial instrumentsAssets(1) Cash and due from banks Cash and due from banks with no maturities is stated at the book value, since the book
value approximates fair value. Cash and due from banks with set maturities is carried at the present value of future cash flows estimated by maturity category that are discounted at the assumed interest rate applicable to new deposits at the balance sheet date.
(2) Call loans and bills bought They are due within one year and are stated at the book value, which approximates fair
value.(3) Trading account securities The bonds and other securities, including government and municipal/public bonds held
as sales agents thereof, are stated at the value announced by Japan Securities Dealers Association or quoted by financial institutions with which the Bank transacts business.
(4) Securities Equity shares are stated at prices quoted in applicable stock exchanges, and bonds are
stated at the value announced by Japan Securities Dealers Association. Investment trusts are stated at the publicized base prices or the base prices quoted by financial institutions with which the Bank transacts business. Investments in associations, if the fair value of assets held by such associations is obtainable, are stated at fair value on a pro rata basis in proportion of the Group’s interests held in such associations’ net assets. The fair value of privately placed bonds guaranteed by the Bank is computed in a manner similar to the loans described below.
(5) Loans and bills discounted Loans are grouped by type and internal credit rating, and the fair value of a group of loans
is computed by discounting the aggregate principal/interest amount by the theoretical value of an interest rate that reflects the expected loss rate of each borrower’s category. For loans due within one year, the book value is stated as the fair value, since the book value is presumed to approximate the fair value.
The fair value of the loans to which the special accounting treatment of hedge accounting for interest rate swaps is applied is evaluated together with their hedging instruments (i.e., interest rate swaps). For loans extended to bankrupt, effectively bankrupt and potentially bankrupt borrowers, estimated loss given default are computed based on expected recoverable amounts through the disposal of the collaterals and execution of guarantees. Therefore, their fair values are stated at the amounts derived by subtracting the estimated loss given default from the carrying amounts of loans as of the consolidated balance sheet date, since the book value is presumed to approximate the fair value.
Loans with no stated maturities, such as loan facilities where loans are provided within a certain limit determined by pledged collateral value, are stated at their book values, as the book value is presumed to approximate fair value, based on the expected repayment periods, interest rate conditions and other terms and conditions.
Liabilities(1) Deposits and (2) Negotiable certificates of depositsDemand deposits are stated at amounts payable (i.e., book value if demanded on the consolidated balance sheet date). To arrive at the fair value of time deposits and others,
deposits are grouped by deposit type, and the present value of expected future cash flows for each such group is computed by discounting the total of principals and interests. Discount rates applied are those applicable to new deposits accepted by the Bank at the balance sheet date. For deposits and certificates of deposits due within one year, they are stated at their book values, which are presumed to approximate the fair values.
Derivative transactionsDerivative transactions include interest rate swaps, currency swaps and foreign exchange forward contracts. They are stated at the prices at exchanges or at prices computed from their discounted present values, among others.
(Note 2) The fair values of the following financial products are extremely difficult to determine and, therefore, are not included in “Assets (4) Available-for-sale securities.”
Millions of YenMarch 31 2014 2013(i) Non-listed shares(*1)(*2) ............................................. ¥2,530 ¥2,198(ii) Investments in associations(*3) ................................... 34 34Total .............................................................................. ¥2,564 ¥2,233
(*1) The fair values of non-listed shares, which have no readily available market prices, are extremely difficult to determine. Therefore, they are excluded from fair-value disclosure.
(*2) Impairment loss on non-listed shares in the amount of ¥16 million and ¥2 million was posted for the years ended March 31, 2014 and 2013, respectively.
(*3) For investments in associations, assets included in the asset portfolios of such associations are excluded from fair-value disclosure, if the fair values of such assets, including real estate, are extremely difficult to determine.
(Note 3) Maturity analysis for claims and securities with contractual maturities subsequent to March 31, 2014 and 2013
Millions of Yen
March 31, 2014
Due in 1 Year or
Less
Due in 1 to 3Years
Due in 3 to 5Years
Due in 5 to 7Years
Due in 7 to 10Years
Due after10 Years
Due from banks ........................ ¥ 1,045,818 ¥ — ¥ — ¥ — ¥ — ¥ —Call loans.................................. 96,059 — — — — —Securities:................................. 202,565 422,413 515,679 41,764 248,814 202
Held-to-maturity securities ...... — — — — — —National government bonds in them .................................... — — — — — —
Available-for-sale securities with maturity .......................... 202,565 422,413 515,679 41,764 248,814 202
National government bonds in them .................................... 71,232 187,167 162,712 — 201,786 —
Local government bonds in them .................................... 21,915 61,780 136,678 21,636 10,190 —
Corporate bonds in them ....... 54,781 120,818 171,747 20,127 14,500 201Loans(*) .................................... 665,203 553,216 408,319 232,897 295,157 376,803Total ......................................... ¥ 2,009,647 ¥ 975,630 ¥ 923,998 ¥ 274,661 ¥ 543,972 ¥ 377,005
(*) Loans that are unlikely to be redeemed, such as to bankrupt, effectively bankrupt, and potentially bankrupt of ¥41,658 million, loans with no stated maturities of ¥65,672 million are not included.
Millions of Yen
March 31, 2013
Due in 1 Year or
Less
Due in 1 to 3Years
Due in 3 to 5Years
Due in 5 to 7Years
Due in 7 to 10Years
Due after10 Years
Due from banks ........................ ¥ 413,051 ¥ — ¥ — ¥ — ¥ — ¥ —Call loans.................................. 325,783 — — — — —Securities:................................. 116,314 381,954 425,528 106,143 259,728 137
Held-to-maturity securities ...... 10,299 — — — — —National government bonds in them .................................... 10,299 — — — — —
Available-for-sale securities with maturity .......................... 106,014 381,954 425,528 106,143 259,728 137
National government bonds in them .................................... 50,201 168,622 150,527 57,624 227,240 —
Local government bonds in them .................................... 12,404 60,909 84,416 20,681 21,470 —
Corporate bonds in them ....... 31,444 104,164 144,470 27,837 9,945 —Loans(*) .................................... 664,833 511,665 383,178 209,061 241,856 342,228Total ......................................... ¥ 1,519,982 ¥ 893,619 ¥ 808,706 ¥ 315,204 ¥ 501,585 ¥ 342,366
(*) Loans that are unlikely to be redeemed, such as to bankrupt, effectively bankrupt, and potentially bankrupt of ¥51,459 million, loans with no stated maturities of ¥62,668 million are not included.
010_9422001372609.indd 15 2014/09/24 14:03:59

16
(Note 4) Maturity analysis for interest bearing liabilities subsequent to March 31, 2014 and 2013
Millions of Yen
March 31, 2014
Due in 1 Year or
Less
Due in 1 to 3Years
Due in 3 to 5Years
Due in 5 to 7Years
Due in 7 to 10Years
Due after10 Years
Deposits(*). ............................... ¥4,512,778 ¥177,173 ¥34,449 ¥15 ¥13 ¥—Negotiable certificates of deposit ..................................... 400,326 — — — — —Total ......................................... ¥4,913,105 ¥177,173 ¥34,449 ¥15 ¥13 ¥—
(*) Demand deposits are disclosed under “Due in 1 year or Less”.
Millions of Yen
March 31, 2013
Due in 1 Year or
Less
Due in 1 to 3Years
Due in 3 to 5Years
Due in 5 to 7Years
Due in 7 to 10Years
Due after10 Years
Deposits(*) ................................ ¥3,869,942 ¥167,623 ¥30,479 ¥17 ¥14 ¥—
Negotiable certificates of deposit ..................................... 366,469 39 — — — —
Total ......................................... ¥4,236,411 ¥167,663 ¥30,479 ¥17 ¥14 ¥—
(*) Demand deposits are disclosed under “Due in 1 year or Less”.
20. Fair Value InformationThe tables below represent the securities and trading account securities:
(a) Trading account securities
Millions of Yen
March 31 2014 2013
Realized gain included in earnings ................................... ¥0 ¥0
(b) Held-to-maturity securities
Millions of Yen
March 31 2014 2013
National government bondsCarrying amount .......................................................... ¥— ¥10,299Fair value .................................................................... — 10,444Net unrealized gain/(loss) ............................................. — 144Gross unrealized gain ................................................... — 144Gross unrealized loss ................................................... — —
(c) Available-for-sale securities
Millions of Yen
March 31, 2014
CarryingAmount
AcquisitionCost
NetUnrealizedGain/(Loss)
Securities with their carrying amount over their acquisition cost:Corporate stock .......................................... ¥ 30,095 ¥ 18,658 ¥11,437Bonds: ....................................................... 1,134,446 1,122,948 11,497
National government ................................. 612,937 606,124 6,813Local government ..................................... 201,892 200,045 1,847Corporate ................................................. 319,616 316,779 2,837
Other ............................................................ 135,740 132,033 3,707Sub-total ...................................................... 1,300,283 1,273,640 26,642Securities with their carrying amount below their acquisition cost:
Corporate stock .......................................... 8,726 9,875 (1,149)Bonds: ....................................................... 122,832 123,018 (186)
National government ................................. 9,962 9,968 (6)Local government ..................................... 50,309 50,362 (53)Corporate ................................................. 62,560 62,686 (125)
Other ............................................................ 57,806 58,008 (201)Sub-total ...................................................... 189,365 190,902 (1,537)Total ............................................................. ¥1,489,648 ¥1,464,543 ¥25,105
Millions of Yen
March 31, 2013
CarryingAmount
AcquisitionCost
Net UnrealizedGain/(Loss)
Securities with their carrying amount over their acquisition cost:Corporate stock .......................................... ¥ 30,690 ¥ 21,723 ¥ 8,966Bonds: ....................................................... 1,075,110 1,058,698 16,412
National government ................................. 610,505 600,141 10,364Local government ..................................... 186,163 183,747 2,416Corporate ................................................. 278,441 274,809 3,632
Other ............................................................ 103,215 99,206 4,008Sub-total ...................................................... 1,209,016 1,179,628 29,387Securities with their carrying amount below their acquisition cost:
Corporate stock .......................................... 4,715 5,512 (796)Bonds: ....................................................... 96,849 97,483 (633)
National government ................................. 43,711 44,154 (443)Local government ..................................... 13,718 13,740 (22)Corporate ................................................. 39,420 39,588 (167)
Other ............................................................ 18,535 19,008 (472)Sub-total ...................................................... 120,101 122,004 (1,902)Total ............................................................. ¥ 1,329,117 ¥ 1,301,632 ¥27,484
(d) Available-for-sale securities sold
Millions of Yen
March 31, 2014Proceeds from
SalesRealized Gain Realized Loss
Corporate stock............................................. ¥ 4,235 ¥ 924 ¥ 58Bonds: .......................................................... 384,467 2,993 600
National government ................................... 384,387 2,993 600Local government ....................................... — — —Corporate ................................................... 80 — —
Other ............................................................ 5,609 516 0Total ............................................................. ¥ 394,313 ¥ 4,434 ¥659
Millions of Yen
March 31, 2013Proceeds from
SalesRealized Gain Realized Loss
Corporate stock............................................. ¥ 3,222 ¥ 571 ¥ 949Bonds: .......................................................... 159,430 4,699 529
National government ................................... 159,153 4,699 161Local government ....................................... — — —Corporate ................................................... 277 0 367
Other ............................................................ 1,183 — 0Total ............................................................. ¥ 163,836 ¥ 5,271 ¥ 1,478
(e) Securities with their classification changed to othersNone
(f) Loss on impairment Certain “Available-for-sale securities” with fair value are stated at fair value on the consolidated balance sheets, and the difference between the acquisition cost and the fair value is recognized as a loss (“impairment loss”) for the consolidated year, if the fair value has significantly deteriorated compared with the acquisition cost and if it is further concluded that there would be little possibility of the recovery in fair value to the acquisition cost. There was no loss on impairment for the year ended March 31, 2014. The loss on impairment in the amount of ¥2,741 million was recognized in corporate stocks for the year ended March 31, 2013. The criteria for determining whether the decline in the fair value is “significantly deteriorated” are as follows: Individual securities whose fair values are 50% or less of the acquisition cost at the end of the consolidated year (or interim period), or securities whose fair values exceed 50% but are 70% or less of the acquisition prices and whose past share price movements for certain set periods, and the issuers’ business conditions indicate little prospect of recovery in their fair value.
010_9422001372609.indd 16 2014/09/24 14:03:59

17
(g) Valuation difference on available-for-sale securities
March 31, 2014 Millions of Yen
Unrealized gain before income tax effect and minority interests adjustments ... ¥25,105Available-for-sale securities .................................................................. 25,105Less: deferred tax liabilities .................................................................. 8,673
Unrealized gain before minority interests adjustment ................................... 16,431Less: minority interests ........................................................................ —
Equity of unrealized gain on available-for-sale securities: Owned by affiliates that are accounted for under the equity method .. 16
Valuation difference on available-for-sale securities ..................................... ¥16,448
March 31, 2013 Millions of Yen
Unrealized gain before income tax effect and minority interests adjustments ... ¥27,484Available-for-sale securities .................................................................. 27,484Less: deferred tax liabilities .................................................................. 9,531
Unrealized gain before minority interests adjustment ................................... 17,952Less: minority interests ........................................................................ —
Equity of unrealized gain on available-for-sale securities:Owned by affiliates that are accounted for under the equity method .. 12
Valuation difference on available-for-sale securities ..................................... ¥17,965
(h) Investments in affiliatesSecurities in the Assets section included investments in affiliates of ¥1,054 million of ¥763 million at March 31, 2014 and 2013, respectively.
(i) Unsecured loaned securitiesUnsecured loaned securities, which borrowers have the right to sell or pledge in the amount of ¥30,181 million and of ¥20,107 million at March 31, 2014 and 2013, respectively, were included in National government bonds.
21. Money held in trustMoney held in trust at March 31, 2014 and 2013 consisted of the following:
(a) Money held in trust for trading purpose
Millions of Yen
March 31 2014 2013
Carrying amount ............................................................ ¥5,006 ¥26,706
Realized gain included in earnings ................................... — —
(b) Money held in trust owned for other purposes
Millions of Yen
March 31 2014 2013
Carrying amount ............................................................ ¥5,373 ¥4,118
Acquisition cost .............................................................. 5,373 4,118
Net unrealized gain/(loss) ................................................ — —
Gross unrealized gain ..................................................... — —
Gross unrealized loss...................................................... — —
22. Derivatives(a) Derivatives transactions to which hedge accounting is not
appliedThe contract amount at the consolidated balance sheet date or the notional amount as stipulated in contracts for each transaction type as well as fair value, net gains or losses, and methods used for deriving the fair value are indicated below. It should be noted that the size of the contract amount or any other monetary amount does not, by and in itself, serve as an indicator of market risks associated with derivative transactions.
(1) Currency derivatives
March 31 Millions of Yen
2014 2013
ContractAmounts
Fair Value Contract Amounts
Fair Value
Total Over 1 Year Total Over
1 Year
Over-the-counter transactions:
Currency swap ............................... ¥10,796 ¥9,226 ¥ 4 ¥11,002 ¥10,299 ¥ 6
Forward exchange contracts:
Sold .......................................... 33,232 — (131) 30,867 — (446)
Bought ....................................... 321 — 1 171 — (0)
¥(124) ¥(440)
(b) Derivatives transactions to which hedge accounting is appliedThe contract amount or the contractual notional amount by transaction type and method of hedge accounting, fair value, net gains or losses at the balance sheet date as well as the methods used for deriving the fair value are summarized below. It should be noted that the size of the contract amount or any other monetary amount does not, by and in itself, serve as an indicator of market risks associated with derivative transactions.
(1) Interest-rate derivativesMillions of Yen
Contract Amounts Fair Value
March 31, 2014Main objective
for hedge Total Over1 Year
Special treatment for interest rate swaps:Interest-rate swaps:
Receivable floating/payable fixed ........ Loans to borrowers
¥51,755 ¥36,359 (*)
(*) As interest swaps subject to special treatment are accounted for synthetic products of swaps and hedged loans, their fair values are included in the fair values of the hedged loans in “19. Financial Instruments and Related Disclosure”.
Millions of Yen
Contract Amounts Fair Value
March 31, 2013Main objective
for hedge Total Over1 Year
Special treatment for interest rate swaps:Interest-rate swaps:
Receivable floating/payable fixed ........ Loans to borrowers
¥55,713 ¥51,755 (*)
(*) As interest swaps subject to special treatment are accounted for synthetic products of swaps and hedged loans, their fair values are included in the fair values of the hedged loans in “19. Financial Instruments and Related Disclosure”.
(2) Currency derivativesMillions of Yen
Contract Amounts Fair Value
March 31, 2014Main objective
for hedge Total Over1 Year
Principle method:Foreign exchange contracts: ............... foreign currency-
denominated monetary claims, etc.
¥20,605 ¥— ¥32
Note: In principle, deferred hedges are adopted in accordance with “Treatment of Accounting and Auditing Concerning Accounting for Foreign Currency Transactions in the Banking Industry” (JICPA Industry Audit Committee Report No. 25).
There were no currency derivatives transactions for the year ended March 31, 2013.
010_9422001372609.indd 17 2014/09/24 14:03:59
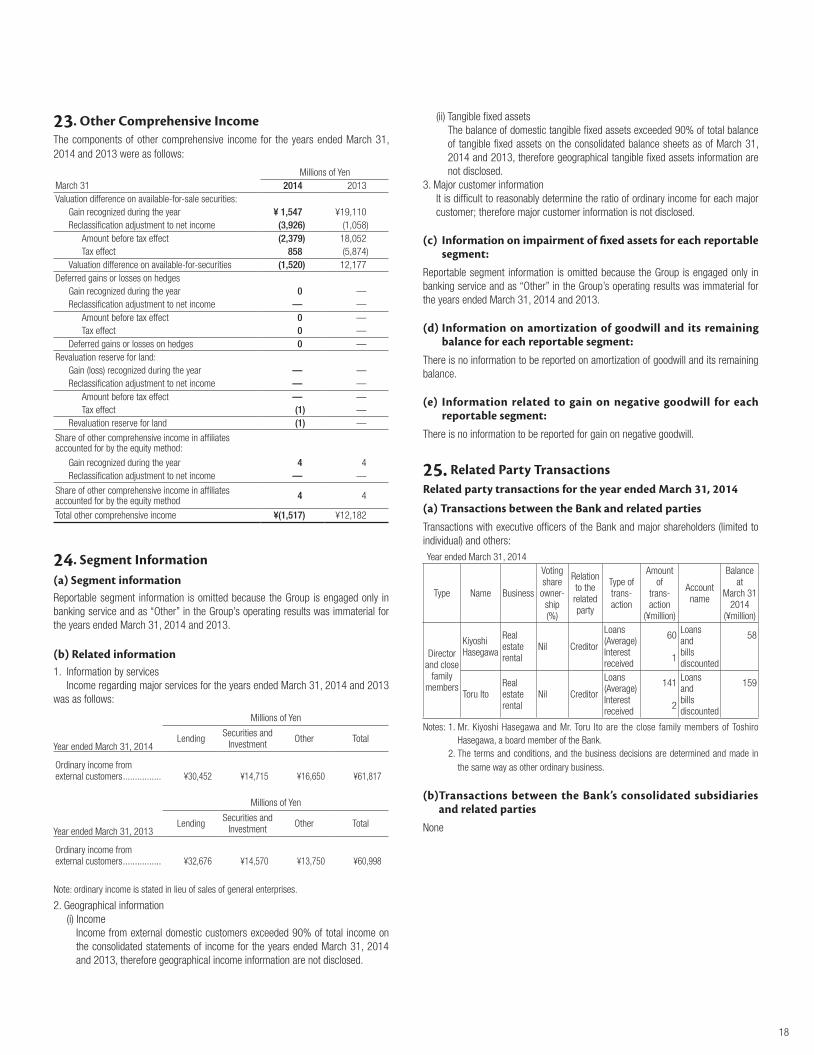
18
23. Other Comprehensive IncomeThe components of other comprehensive income for the years ended March 31, 2014 and 2013 were as follows:
Millions of YenMarch 31 2014 2013Valuation difference on available-for-sale securities:
Gain recognized during the year ¥ 1,547 ¥19,110Reclassification adjustment to net income (3,926) (1,058)
Amount before tax effect (2,379) 18,052Tax effect 858 (5,874)
Valuation difference on available-for-securities (1,520) 12,177Deferred gains or losses on hedges
Gain recognized during the year 0 —Reclassification adjustment to net income — —
Amount before tax effect 0 —Tax effect 0 —
Deferred gains or losses on hedges 0 —Revaluation reserve for land:
Gain (loss) recognized during the year — —Reclassification adjustment to net income — —
Amount before tax effect — —Tax effect (1) —
Revaluation reserve for land (1) —
Share of other comprehensive income in affiliates accounted for by the equity method:
Gain recognized during the year 4 4Reclassification adjustment to net income — —
Share of other comprehensive income in affiliates accounted for by the equity method 4 4
Total other comprehensive income ¥(1,517) ¥12,182
24. Segment Information(a) Segment informationReportable segment information is omitted because the Group is engaged only in banking service and as “Other” in the Group’s operating results was immaterial for the years ended March 31, 2014 and 2013.
(b) Related information1. Information by services Income regarding major services for the years ended March 31, 2014 and 2013 was as follows:
Millions of Yen
Year ended March 31, 2014Lending
Securities and Investment
Other Total
Ordinary income from external customers ................ ¥30,452 ¥14,715 ¥16,650 ¥61,817
Millions of Yen
Year ended March 31, 2013Lending
Securities and Investment
Other Total
Ordinary income from external customers ................ ¥32,676 ¥14,570 ¥13,750 ¥60,998
Note: ordinary income is stated in lieu of sales of general enterprises.
2. Geographical information (i) Income
Income from external domestic customers exceeded 90% of total income on the consolidated statements of income for the years ended March 31, 2014 and 2013, therefore geographical income information are not disclosed.
(ii) Tangible fixed assets The balance of domestic tangible fixed assets exceeded 90% of total balance of tangible fixed assets on the consolidated balance sheets as of March 31, 2014 and 2013, therefore geographical tangible fixed assets information are not disclosed.
3. Major customer information It is difficult to reasonably determine the ratio of ordinary income for each major
customer; therefore major customer information is not disclosed.
(c) Information on impairment of fixed assets for each reportable segment:
Reportable segment information is omitted because the Group is engaged only in banking service and as “Other” in the Group’s operating results was immaterial for the years ended March 31, 2014 and 2013.
(d) Information on amortization of goodwill and its remaining balance for each reportable segment:
There is no information to be reported on amortization of goodwill and its remaining balance.
(e) Information related to gain on negative goodwill for each reportable segment:
There is no information to be reported for gain on negative goodwill.
25. Related Party TransactionsRelated party transactions for the year ended March 31, 2014
(a) Transactions between the Bank and related partiesTransactions with executive officers of the Bank and major shareholders (limited to individual) and others:Year ended March 31, 2014
Type Name Business
Voting share
owner-ship(%)
Relationto therelatedparty
Type of trans-action
Amountof
trans-action
(¥million)
Accountname
Balance at
March 312014
(¥million)
Director and close
family members
KiyoshiHasegawa
Real estate rental
Nil Creditor
Loans(Average)Interestreceived
60
1
Loansandbillsdiscounted
58
Toru ItoReal estate rental
Nil Creditor
Loans(Average)Interestreceived
141
2
Loansandbillsdiscounted
159
Notes: 1. Mr. Kiyoshi Hasegawa and Mr. Toru Ito are the close family members of Toshiro Hasegawa, a board member of the Bank.
2. The terms and conditions, and the business decisions are determined and made in the same way as other ordinary business.
(b) Transactions between the Bank’s consolidated subsidiaries and related parties
None
010_9422001372609.indd 18 2014/09/24 14:03:59

19
Related party transactions for the year ended March 31, 2013(a) Transactions between the Bank and related partiesTransactions with executive officers of the Bank and major shareholders (limited to individual) and others:Year ended March 31, 2013
Type Name Business
Voting share
owner-ship(%)
Relationto therelatedparty
Type of trans-action
Amountof
trans-action
(¥million)
Accountname
Balance at
March 312013
(¥million)
Director and close
family members
KiyoshiHasegawa
Real estate rental
Nil Creditor
Loans(Average)Interestreceived
63
1
Loansandbillsdiscounted
61
Toru ItoReal estate rental
Nil Creditor
Loans(Average)Interestreceived
139
2
Loansandbillsdiscounted
137
Notes: 3. Mr. Kiyoshi Hasegawa and Mr. Toru Ito are the close family members of Toshiro Hasegawa, a board member of the Bank.
4. The terms and conditions, and the business decisions are determined and made in the same way as other ordinary business.
(b) Transactions between the Bank’s consolidated subsidiaries and related parties
None
26. Subsequent EventsBusiness combination of subsidiaryToho Information System Co., Ltd., which is the Bank’s consolidated subsidiary, and the Toho Computer Service Co., Ltd., which is the Bank’s affiliate accounted for by the equity method, have merged on April 1, 2014 (New company name: Toho Information System Co., Ltd.). The new company will continue to be the Bank’s affiliate accounted for by the equity method.(1) Outline of the business combination (a) Designation and business of the business combination (i) Surviving company Company name: Toho Computer Service Co., Ltd. (the Bank’s affiliate
accounted for by the equity method) Business: Computer operations (ii) Merged company Company name: Toho Information System Co., Ltd. (the Bank’s
consolidated subsidiary) Business: Software development for electronic computers (b) Major reason for the business combination The merger between Toho Computer Service Co., Ltd., which specializes
in computer data entry, and Toho Information System Co., Ltd., which specializes in system development, was conducted in view of a significant synergy between the two companies and effective use of management resources within the Group.
(c) Date of the business combination April 1, 2014 (d) Legal form of the business combination (i) The merger was an absorption-type merger where Toho Computer
Service Co., Ltd. was the surviving company and Toho Information System Co., Ltd. was the dissolving company. Toho Computer Service Co., Ltd. changed its trade name to Toho Information System Co., Ltd.
(ii) For each share of Toho Information System Co., Ltd. common stock, 0.1 shares of Toho Computer Service Co., Ltd. common stock was allotted.
(iii) There was no cash payment upon the merger.
(2) Outline of accounting The Bank accounted for based on the accounting procedures stipulated by the
“Accounting Standard for Business Divestitures” (ASBJ Statement No. 7) and recognized ¥ 1 million of loss on change of equity.
(3) Name of the reportable segment which the subsidiary was included in the segment information
“Others”(4) Estimated amount of gain on this subsidiary which has been recognized in the
consolidated statements of income for the year ended March 31, 2014 (a) Ordinary income: ¥639 million (b) Net income: ¥10 million(5) Overview of the continuing involvement The Bank has excluded the former Toho Information System Co., Ltd., from the
scope of subsidiary, and the new Toho Information System Co., Ltd. is accounted for by the equity method as affiliate.
27. Supplementary schedule(a) Schedule of bondsNone
(b) Schedule of borrowing and similar instruments
CategoryBalance as ofApril 1, 2013
(Millions of Yen)
Balance as ofMarch 31, 2014(Millions of Yen)
Average interestrate (%)
Due date
Borrowed money: ¥31,460 ¥33,500 0.72 —
Loans payable 31,460 33,500 0.72
From June 2014
to March 2024
Lease obligation:
Due in one year or less 416 456 —
Due after one year 1,174 1,048 —
From June 2014
to November 2023
Notes: 1. Average interest rate is stated at weighted average interest rate on the interest rate and balance as of March 31, 2014.
2. Average interest rate is not stated for lease obligations, since the lease obligations are recorded inclusive of the interest portion in the consolidated balance sheets.
3. The repayment schedule of loans payable and lease obligations for five years subsequent to March 31, 2014, is summarized as follows:
Millions of Yen
Due in oneyear or less
Due after oneyear through
two years
Due after twoyears throughthree years
Due after threeyears through
four years
Due after fouryears through
five years
Loans payable ¥6,900 ¥ — ¥ — ¥ — ¥—Lease obligation 456 424 377 147 71
Since banking business includes such operations as deposit taking, and raising/use of funds from the call money and bills market, the schedule of borrowing and similar instruments includes only “Borrowed money” and lease obligation included in “Other liabilities” in “Liabilities” of the consolidated balance sheets.
(c) Schedule of asset retirement obligationsSchedule of asset retirement obligations is omitted because the amount of asset retirement obligations at the beginning and the end of the year ended March 31, 2014 are both less than one percent of the total of liabilities and net assets as of then.
010_9422001372609.indd 19 2014/09/24 14:03:59

20
Report of Independent Auditors
010_9422001372609.indd 20 2014/09/24 14:04:01

21
Board of Directors and Auditors
Organization
Network
President: Senior Managing Director: Managing Directors: Directors: Standing Auditors: Auditors:
Seishi Kitamura Takahiro KatoShinsuke Tanno
Masayuki SakajiSeiji TakeuchiKenichi KogureSatoshi AjiMinoru Sato
Atsushi TsuchidaKatsuo KatoMichio SakaiKazuaki IshiiHideho SutoShintaro Taguchi
Kunio EbataTakao Endo
Hiroshi FukudaHisako MuraseKazufumi Ioki
Name Line of Business Established in Capital(Millions of yen)
Bank’s Share inCapital (%)
Toho Smile, Co., Ltd. Printing and binding of business forms, etc. 2012 30 100
The Toho Lease Co., Ltd. Leasing 1985 60 5
The Toho Information System Co., Ltd. Calculation operations and Developing software 1983 60 7.8
The Toho Credit Guarantee Co., Ltd. Credit guaranteeing 1985 30 5
The Toho Card Co., Ltd. Credit card 1985 30 5
The Toho Credit Service Co., Ltd. Credit card 1990 30 5
(As of June 30, 2014)
3-25, Ohmachi, Fukushima 960-8633, JapanPhone: (024) 523-3131Facsimile: (024) 524-1583SWIFT: TOHOJPJT
General Meeting of Shareholders
Board of Auditors
Board of Directors
President
Senior Managing Director
Managing Directors
Board of Managing Directors
Business Promotion
Headquarters
Audit Department
General Planning Department
Personnel Department
General Affairs Department
General Management Department
Career Development Department
Financial Products Sales Department
Credit Card Business Department
Business Administration Department
Corporate Banking Department
Personal Loan Department
Loan Department
Loan Administration Department
Financial Markets Department
Operations Administration Department
Operations Support Department
System Department
Business Operations
Headquarters
Head Office
Domestic Branches
SUBSIDIARIES AND AFFILIATES
HEADQUARTERS
010_9422001372609.indd 21 2014/09/24 14:04:02

THE TOHO BANK, LTD.HEAD OFFICE
3-25, Ohmachi, Fukushima 960-8633, Japan Phone: (024) 523-3131
URL: http://www.tohobank.co.jp/
010_9422001372609.indd 22 2014/09/24 14:04:02
Related Documents