Copyright © 2010 by the McGraw-Hill Companies, Inc. All rights reserved. McGraw-Hill/Irwin Chapter 3 Population, Participation Rates, and Hours of Work

The Theory of Individual Labor Supply
Aug 17, 2015
Welcome message from author
This document is posted to help you gain knowledge. Please leave a comment to let me know what you think about it! Share it to your friends and learn new things together.
Transcript

Copyright © 2010 by the McGraw-Hill Companies, Inc. All rights reserved.McGraw-Hill/Irwin
Chapter 3
Population, Participation Rates, and Hours of Work

3-2
1. The Population Base
3-3
Population and Labor Force
o The size of the labor force depends on the size of the population and the percentage of the population participating in the labor market. • Most variations in population growth
come from changes in the birthrate and net immigration.
∞Death rates are less variable.
3-4
Population and Labor Force
050
100150200250300350
Mil
lion
s of
Per
son
s
Population Labor Force
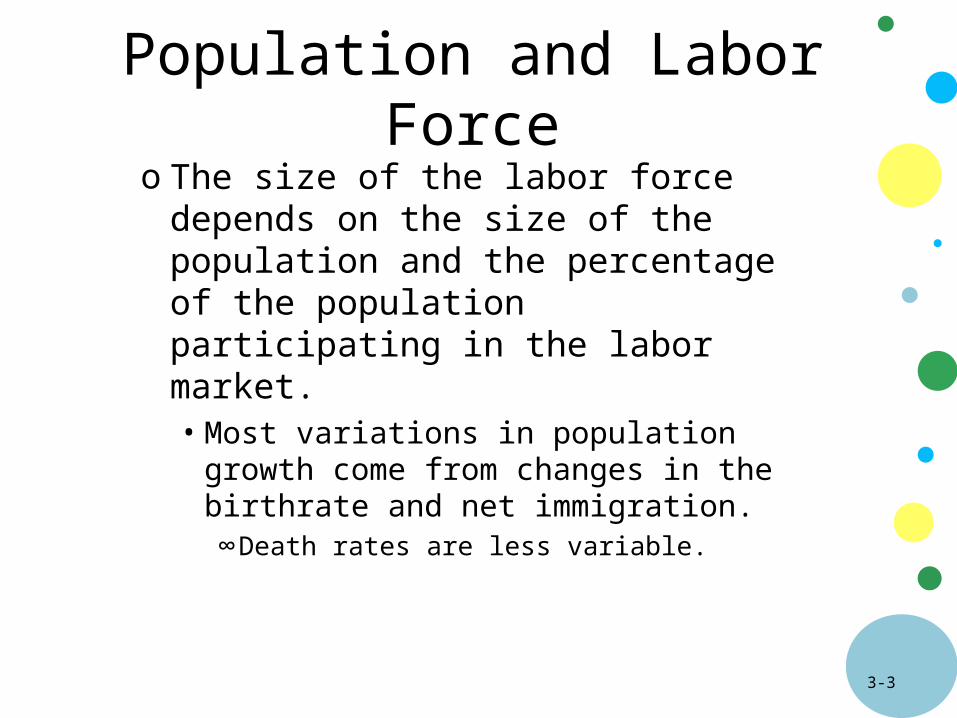
• The population and labor force have both grown substantially over time, but the rates of growth have changed over time.

3-5
2. Becker’s Model: The Allocation of Time

3-6
Changes to Work-Leisure Model
o Gary Becker has expanded the work-leisure model in two ways by using a household perspective and allowing for multiple uses of time.
3-7
Household Perspective
o He uses the household as the decision-making unit.
o Decision making is interrelated. • A wife’s decision to decision to work
may depend on whether her husband is employed.
3-8
Multiple Uses of Timeo Households produce utility-yielding
commodities with combinations of market goods and time.
o Three uses of time1. Labor market time (generates income to
acquire market goods)
2. Household production time
3. Consumption time
3-9
Multiple Uses of Time
o Meal example:• Meals combine goods acquired with
income from labor market time, household production time to make meal, and consumption time to consume the meal.
o Uses of time are competitive with each other.• If both spouses work, less time for
household production and consumption.

3-10
Commodity Characteristics
o Time-intensive commodities use a large amount of time and a small amount of goods.• Watching the sunset
o Goods-intensive commodities use a small amount of time and a large amount of goods.• Meal at fast-food restaurant

3-11
Commodity Characteristics
o As labor-market time becomes more valuable—substitute time-intensive commodities for goods-intensive ones.

3-12
Household Choices
o Household members should allocate their time in which they have a comparative advantage (i.e., greatest relative efficiency or productivity).• If one household member has a greater
productivity in the labor market rather than in non-market activities, that person should work in the labor market.

3-13
Household Choices
• Through socialization, females have developed a comparative advantage in household production.
• Because women have been discriminated against in the labor market, many husbands can earn more than their wives in the labor market.
• Historically, due to comparative advantage, husbands spent much of their time in the labor market and wives in non-market activities.
3-14
Income and Substitution Effects
o Becker income effect• A higher wage-rate increases
income, allowing the household to consume more goods.
∞Hours of work fall since these goods require time to consume.
∞Same result as work-leisure model, but different rationale.
3-15
Income and Substitution Effects
o Becker substitution effect• A higher wage increases hours of work
because households substitute. ∞Goods for time in production of commodities
~ Example: may buy more restaurant meals and fewer home-cooked meals
∞Goods-intensive commodities for time-intensive commodities in consumption
~ Fly to vacation rather than drive
3-16
1. In what specific ways does Becker’s model of the allocation of time differ from the simple work-leisure choice model? Compare the functioning of the income and substitution effects of the two models. Do the two effects have the same impact upon labor market in both models?
Question for Thought

3-17
3. Participation Rates: Measured and Defined
3-18
Participation Rates
o The labor force participation rate (LFPR) is determined by comparing the actual labor force with the potential labor force.• The potential labor force includes persons 16
years of age and older who are non-institutionalized (i.e., not prison, mental institution, etc.).
• The actual labor force includes those employed and unemployed actively looking for a job.

3-19
Participation Rates
LFPR =actual labor force
potential labor force
* 100
LFPR =noninstitutional population 16
years of older in the labor force
noninstitutional population* 100
or
For March 2009:
LFPR
= 154,048,000
235,086,000* 100 = 65.5%

3-20
1. Suppose that hypothetical country has a total population of 100 million. Of which 5 million are unemployed (but actively seeking work), 25 million are under 16 or institutionalized, 35 million are eligible to work but not in the labor force, and 45 million are employed. What is the LFPR?
Question for Thought
3-21
3-22

3-23
4. Secular Trend of Participation Rates
3-24

3-25

3-26
3-27
3-28
3-29

3-30

3-31

3-32

3-33
3-34
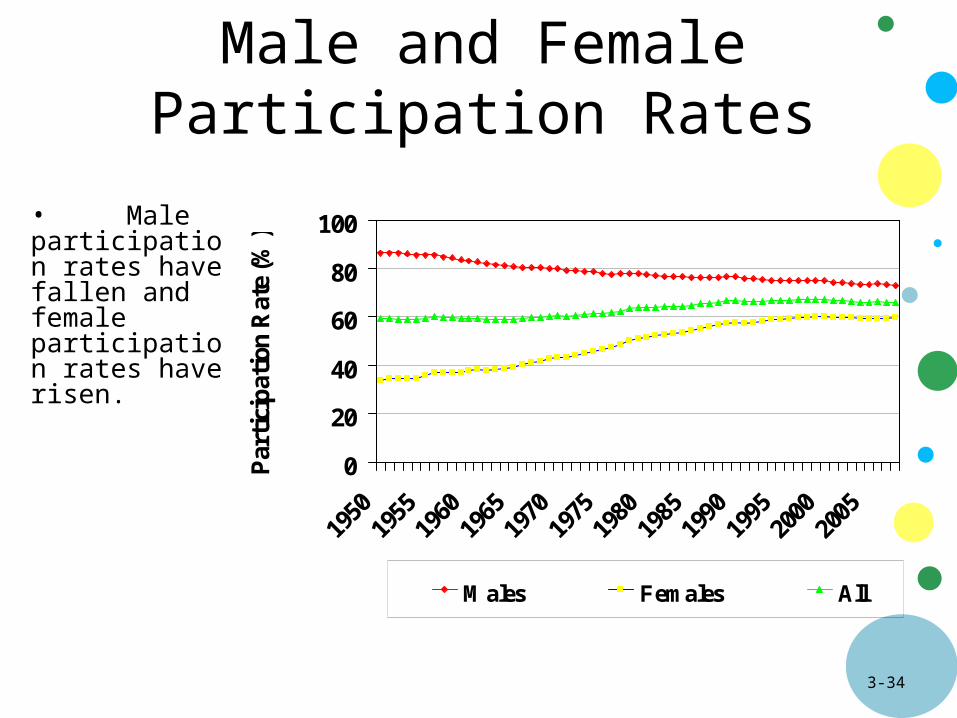
Male and Female Participation Rates
0
20
40
60
80
100
1950
1955
1960
1965
1970
1975
1980
1985
1990
1995
2000
2005
Par
tici
pat
ion
Rat
e (%
)
Males Females All
• Male participation rates have fallen and female participation rates have risen.
3-35
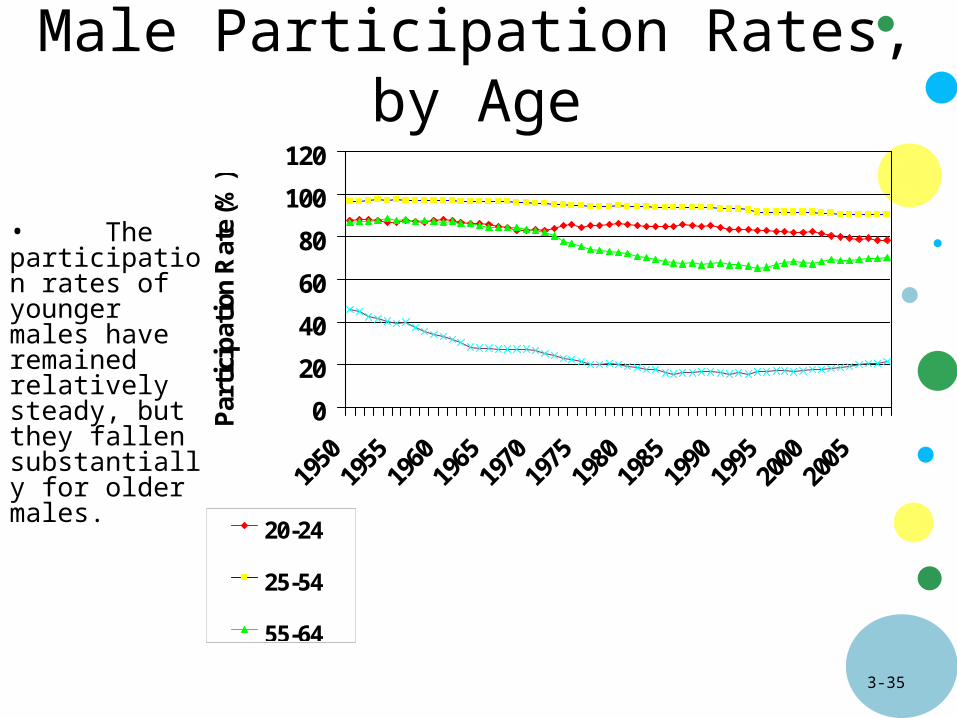
Male Participation Rates, by Age
0
20
40
60
80
100
120
1950
1955
1960
1965
1970
1975
1980
1985
1990
1995
2000
2005
Par
tici
pat
ion
Rat
e (%
)
20-24
25-54
55-64
65 andover
• The participation rates of younger males have remained relatively steady, but they fallen substantially for older males.
3-36
Why the Participation Rate of Older Males has Declined
o Rising real wages and earnings• Real earnings have risen since 1940 and since
the income effect dominates the substitution effect for older males, the participation rate has fallen.

3-37
Why the Participation Rate of Older Males has Declined
o Social Security and private pensions• Social Security benefits and coverage has
increased over time.∞This non-labor income has encouraged exit from the
labor force.
• Private pension coverage has expanded which is another source of non-labor income.
∞Pension rules have been changed to encourage early retirement.
3-38
Why the Participation Rate of Older Males has Declined
o Disability benefits• The Social Security disability program has become more
generous which encourages low wage workers to exit the labor force.
o Life-cycle considerations• Earnings of workers past their mid 50’s tend to grow slowly
or decline.∞ Their education and training become more obsolete as well as
declines in physical and mental capabilities.
∞ This lower wage growth encourages workers to substitute retirement for work.

3-39
Female Participation Rates, by Age
0
20
40
60
80
100
1950
1955
1960
1965
1970
1975
1980
1985
1990
1995
2000
2005
Par
tici
pat
ion
Rat
e (%
)
20-24 25-54
55-64 65 and over
• The participation rates of all females have risen, including the age 65 and over group.
• Most of the rise in participation rate is due to a rise in participation among married women.
• This is a surprising result since the rise in real wages of married men would have tended to decrease the participation rates of married women.
3-40
Why the Participation Rate of Females has Risen
o Rising real wage rates for women • The rise in real wages for women has both a
Becker income and substitution effect.∞Substitute towards goods in terms of both
consumption and production of commodities.
∞Small income effect since its effect depends on the number of hours already working.
~ It is 0 if not currently working.
3-41
Why the Participation Rate of Females has Risen
o Changing preferences and attitudes• Career objectives of women have changed over
time towards more market work.∞Changed indifference curves to make them flatter.
o Rising productivity in the household• Technological improvements have reduced the
time necessary for household production and freed time for market work.
∞Microwaves, vacuum cleaners
3-42
Why the Participation Rate of Females has Risen
o Declining birthrates• Presence of pre-school is associated with lower
participation rates and the one-half decline in the birth rate and has freed time for market work.
∞High wages tend to lower the birth rate since it raises the opportunity cost of children.
∞The impact of children on participation has declined over time.
3-43
Why the Participation Rate of Females has Risen
o Rising divorce rates• The rise in the divorce rate has increased the incentive
for women to participate in order to protect themselves against the impact of a potential divorce.
o Expanding job accessibility• There has been expansion in employment in jobs
traditionally held by women.
• The availability of part-time jobs has increased making it easier for women to work.
3-44
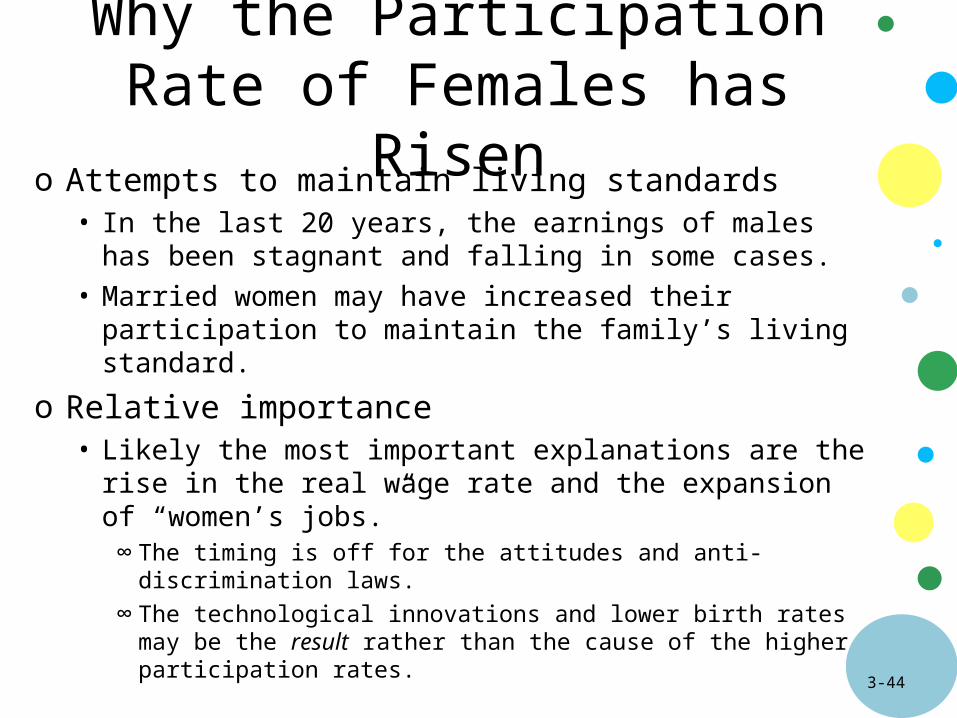
Why the Participation Rate of Females has Risen
o Attempts to maintain living standards• In the last 20 years, the earnings of males has been
stagnant and falling in some cases.
• Married women may have increased their participation to maintain the family’s living standard.
o Relative importance• Likely the most important explanations are the rise in the
real wage rate and the expansion of “women’s jobs.”∞ The timing is off for the attitudes and anti-discrimination laws.
∞ The technological innovations and lower birth rates may be the result rather than the cause of the higher participation rates.
3-45
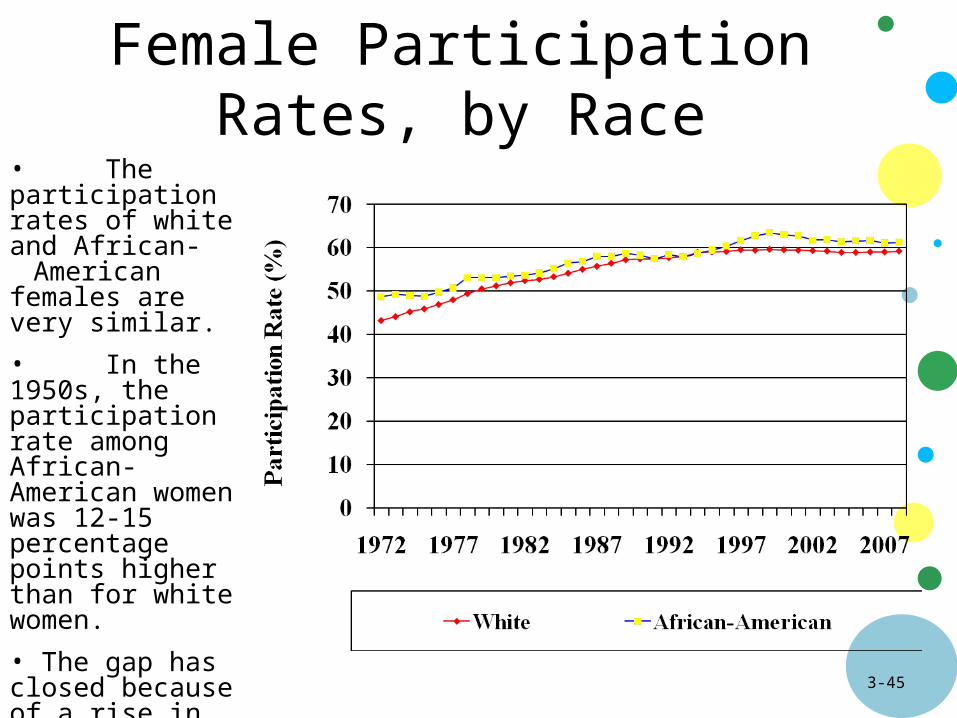
Female Participation Rates, by Race
• The participation rates of white and African- American females are very similar.
• In the 1950s, the participation rate among African-American women was 12-15 percentage points higher than for white women.
• The gap has closed because of a rise in participation among white women.
3-46
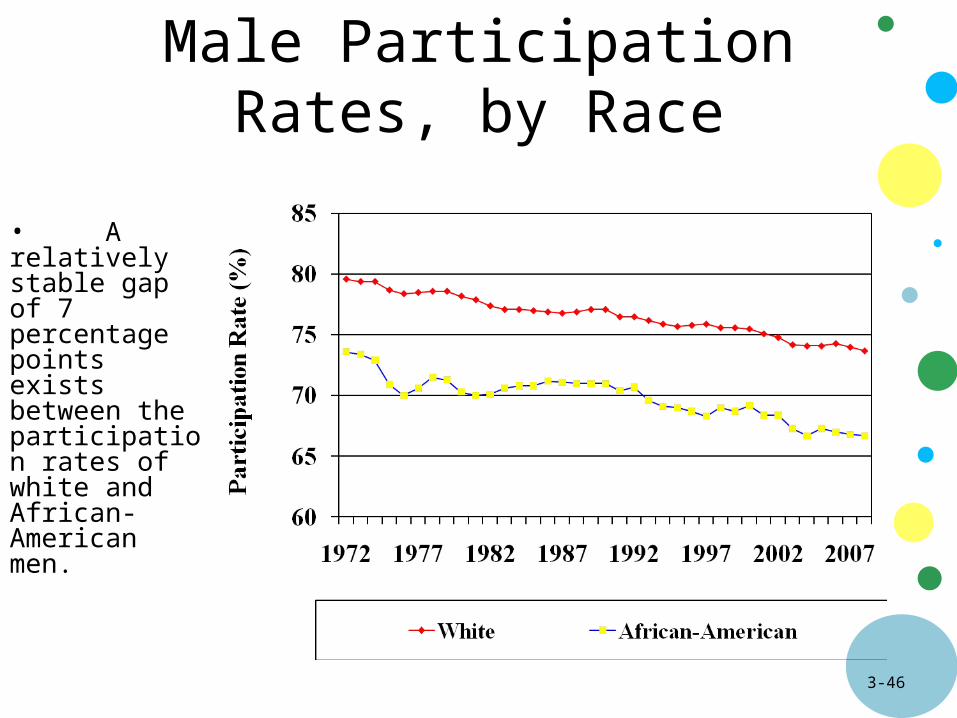
Male Participation Rates, by Race
• A relatively stable gap of 7 percentage points exists between the participation rates of white and African-American men.

3-47
Lower Participation Rate for African-American Males
o Demand-side factors• African-American males face worse labor market
conditions due to lower education levels, discrimination, and mismatch between location of jobs and residence.

3-48
Lower Participation Rate for African-American Males
o Supply Side • Non-market income sources such as Social
Security and public assistance are more appealing to African-American males because of lower wages.
• Illegal activities may offer higher rates of compensation than available positions.

3-49
Lower Participation Rate of African-American Males
o The health of older African-American males tends to be worse than for older white males.
o High participation rate of African-American wives may lower the participation rate of African-American husbands.
3-50

3-51
5. Cyclical Changes in Participation Rates

3-52
Cyclical Changes in Participation
o The business cycle has two offsetting impacts on participation. • The added-worker effect occurs when the primary earner
loses his or her job and other family members look for a job to offset the decline in family income.
∞This because the other family members suffer a decrease in their non-labor income.
• The discouraged -worker effect occurs when a person stops looking for work because they become very pessimistic about finding a job.
∞Recessions lower wages and thus the “price” of leisure and so some workers substitute leisure for job search.
3-53
Cyclical Changes in Participation
o The discouraged worker effect outweighs the added worker effect and so the labor force shrinks in recessions.• The added worker effect applies only to families
where the primary earner is unemployed, while the discouraged worker effect may impact all workers.
• Some married women are only marginally attached to the labor force.

3-54
6. Hours of Work
3-55
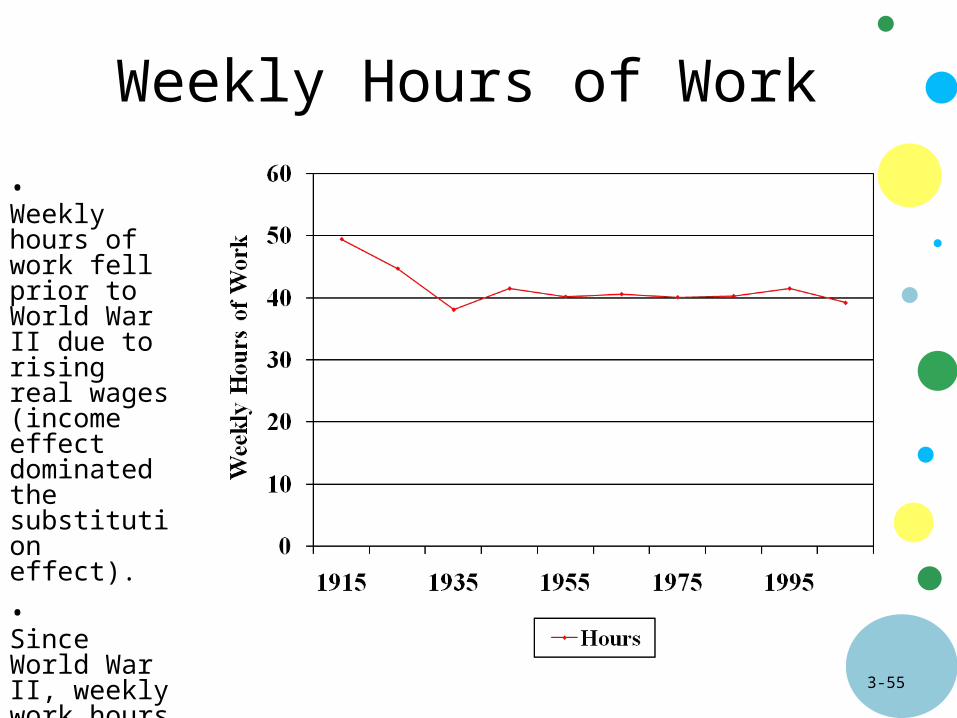
Weekly Hours of Work
• Weekly hours of work fell prior to World War II due to rising real wages (income effect dominated the substitution effect).
• Since World War II, weekly work hours have been stable.
3-56
Why Have Hours of Work Remained Stable since 1945
o The rise in real wages since 1945 should have decreased the weekly hours due to the income effect.
o A leading explanation is the rise in education levels has offset the impact the rise in real wages.• More education may reflect more job commitment.
• Educated workers have nicer working conditions and thus less desire to reduce hours.
• Educated workers have more fixed costs per worker (e.g. training) and thus firms resist reductions in hours per week (costs per hour rise).
o Other factors include higher tax rates, and overtime pay premiums.
3-57
Are Americans Overworked?
o Conventional wisdom is that American workers are “overworked” and face a “time squeeze” since total hours worked per person has risen.• Partly due to rise in share of prime-age workers who
work more hours.• Much of the rise has been voluntary since highest
paid jobs have had biggest rise.• Time diaries indicate hours of leisure have risen not
fallen.∞Household production time has fallen.
3-58
1. What factors account for the declining participation of older males?
Questions for Thought
2. Use a work-leisure diagram to demonstrate that (a) if African-Americans have labor market opportunities that are inferior to those of whites and (b) non-labor income is available in the form of, say, disability benefits, African-Americans will have lower participation rates even though the work-leisure preferences (indifference curves) of African-Americans and whites are identical.
Related Documents