The Temporal Morphology of Infrasound Propagation DOUGLAS P. DROB, 1 MILTON GARCE ´ S, 2 MICHAEL HEDLIN, 3 and NICOLAS BRACHET 4 Abstract—Expert knowledge suggests that the performance of automated infrasound event association and source location algo- rithms could be greatly improved by the ability to continually update station travel-time curves to properly account for the hourly, daily, and seasonal changes of the atmospheric state. With the goal of reducing false alarm rates and improving network detection capability we endeavor to develop, validate, and integrate this capability into infrasound processing operations at the International Data Centre of the Comprehensive Nuclear Test-Ban Treaty Organization. Numerous studies have demonstrated that incorpo- ration of hybrid ground-to-space (G2S) enviromental specifications in numerical calculations of infrasound signal travel time and azimuth deviation yields significantly improved results over that of climatological atmospheric specifications, specifically for tropo- spheric and stratospheric modes. A robust infrastructure currently exists to generate hybrid G2S vector spherical harmonic coeffi- cients, based on existing operational and emperical models on a real-time basis (every 3- to 6-hours) (DROB et al., 2003). Thus the next requirement in this endeavor is to refine numerical procedures to calculate infrasound propagation characteristics for robust automatic infrasound arrival identification and network detection, location, and characterization algorithms. We present results from a new code that integrates the local (range-independent) sp ray equations to provide travel time, range, turning point, and azimuth deviation for any location on the globe given a G2S vector spherical harmonic coefficient set. The code employs an accurate numerical technique capable of handling square-root singularities. We investigate the seasonal variability of propagation character- istics over a five-year time series for two different stations within the International Monitoring System with the aim of understanding the capabilities of current working knowledge of the atmosphere and infrasound propagation models. The statistical behaviors or occurrence frequency of various propagation configurations are discussed. Representative examples of some of these propagation configuration states are also shown. Key words: Infrasound, atmospheric variability, climatology, automated event detection, source location, CTBTO, IDC, IMS. 1. Background The purpose of the automated infrasound pro- cessing developed at the IDC is to detect coherent signals measured on individual IMS sensors (CHRISTIE et al., 2001), highlight the most significant detections as ‘‘phases’’ (as opposed to ‘‘noise’’), and subse- quently group these phases to form and locate hypocenters, so-called ‘‘events’’. The phases are determined using the progressive multi-channel cor- relation (PMCC) method (CANSI, 1995) which distinguishes the coherent signals produced by natu- ral and man-made sources from incoherent ambient background noise which may also be of natural, cultural, or instrumental origin. A wide variety of sources are regularly recorded worldwide by the IMS network; ocean activity, mountain associated waves, volcanic eruptions, earthquakes, thunderstorms, meteors, avalanches, auroras, rocket launches and re- entries, aircraft, mine-blasts, accidental explosions, and industrial noise. It is important for the IDC to detect, locate, and categorize these sources to contrast with nuclear explosions; the task of the organization. The detection, location, and characterization algorithms (henceforth DLC) described by BROWN et al.,(2002a) may be used to locate the terminal burst point of exploding meteors, the origin time of volcanic eruptions, and the location of avalanches and rock slides, as well other null sources relevant to CTBTO operations (LE PICHON et al., 2008b;HEDLIN et al., 2002). Although the various natural events represent false alarms for the CTBTO, they also provide valuable ground-truth information that can be 1 Space Science Division, Naval Research Laboratory, Washington, DC, USA. E-mail: [email protected] 2 Infrasound Laboratory, University of Hawaii, Manoa, USA. E-mail: [email protected] 3 Laboratory for Atmospheric Acoustics, University of California, San Diego, USA. 4 International Data Centre, Provisional Technical Secretariat, CTBTO, Vienna, Austria. Pure Appl. Geophys. 167 (2010), 437–453 Ó 2010 US Government DOI 10.1007/s00024-010-0080-6 Pure and Applied Geophysics

Welcome message from author
This document is posted to help you gain knowledge. Please leave a comment to let me know what you think about it! Share it to your friends and learn new things together.
Transcript
The Temporal Morphology of Infrasound Propagation
DOUGLAS P. DROB,1 MILTON GARCES,2 MICHAEL HEDLIN,3 and NICOLAS BRACHET4
Abstract—Expert knowledge suggests that the performance of
automated infrasound event association and source location algo-
rithms could be greatly improved by the ability to continually
update station travel-time curves to properly account for the hourly,
daily, and seasonal changes of the atmospheric state. With the goal
of reducing false alarm rates and improving network detection
capability we endeavor to develop, validate, and integrate this
capability into infrasound processing operations at the International
Data Centre of the Comprehensive Nuclear Test-Ban Treaty
Organization. Numerous studies have demonstrated that incorpo-
ration of hybrid ground-to-space (G2S) enviromental specifications
in numerical calculations of infrasound signal travel time and
azimuth deviation yields significantly improved results over that of
climatological atmospheric specifications, specifically for tropo-
spheric and stratospheric modes. A robust infrastructure currently
exists to generate hybrid G2S vector spherical harmonic coeffi-
cients, based on existing operational and emperical models on a
real-time basis (every 3- to 6-hours) (DROB et al., 2003). Thus the
next requirement in this endeavor is to refine numerical procedures
to calculate infrasound propagation characteristics for robust
automatic infrasound arrival identification and network detection,
location, and characterization algorithms. We present results from a
new code that integrates the local (range-independent) sp ray
equations to provide travel time, range, turning point, and azimuth
deviation for any location on the globe given a G2S vector
spherical harmonic coefficient set. The code employs an accurate
numerical technique capable of handling square-root singularities.
We investigate the seasonal variability of propagation character-
istics over a five-year time series for two different stations within
the International Monitoring System with the aim of understanding
the capabilities of current working knowledge of the atmosphere
and infrasound propagation models. The statistical behaviors or
occurrence frequency of various propagation configurations are
discussed. Representative examples of some of these propagation
configuration states are also shown.
Key words: Infrasound, atmospheric variability, climatology,
automated event detection, source location, CTBTO, IDC, IMS.
1. Background
The purpose of the automated infrasound pro-
cessing developed at the IDC is to detect coherent
signals measured on individual IMS sensors (CHRISTIE
et al., 2001), highlight the most significant detections
as ‘‘phases’’ (as opposed to ‘‘noise’’), and subse-
quently group these phases to form and locate
hypocenters, so-called ‘‘events’’. The phases are
determined using the progressive multi-channel cor-
relation (PMCC) method (CANSI, 1995) which
distinguishes the coherent signals produced by natu-
ral and man-made sources from incoherent ambient
background noise which may also be of natural,
cultural, or instrumental origin. A wide variety of
sources are regularly recorded worldwide by the IMS
network; ocean activity, mountain associated waves,
volcanic eruptions, earthquakes, thunderstorms,
meteors, avalanches, auroras, rocket launches and re-
entries, aircraft, mine-blasts, accidental explosions,
and industrial noise. It is important for the IDC to
detect, locate, and categorize these sources to contrast
with nuclear explosions; the task of the organization.
The detection, location, and characterization
algorithms (henceforth DLC) described by BROWN
et al., (2002a) may be used to locate the terminal
burst point of exploding meteors, the origin time of
volcanic eruptions, and the location of avalanches
and rock slides, as well other null sources relevant to
CTBTO operations (LE PICHON et al., 2008b; HEDLIN
et al., 2002). Although the various natural events
represent false alarms for the CTBTO, they also
provide valuable ground-truth information that can be
1 Space Science Division, Naval Research Laboratory,
Washington, DC, USA. E-mail: [email protected] Infrasound Laboratory, University of Hawaii, Manoa, USA.
E-mail: [email protected] Laboratory for Atmospheric Acoustics, University of
California, San Diego, USA.4 International Data Centre, Provisional Technical
Secretariat, CTBTO, Vienna, Austria.
Pure Appl. Geophys. 167 (2010), 437–453
� 2010 US Government
DOI 10.1007/s00024-010-0080-6 Pure and Applied Geophysics
used to constantly fine-tune and check the integrity of
the system, insuring verifiability of the treaty. For
example, terminal bursts of meteors with an average
yield of one kiloton occur in the earth’s atmosphere
several times per year (NEMTCHINOV et al., 1997;
BROWN et al., 2002b).
To facilitate rapid computation, today’s automated
DLC algorithms rely upon precompiled station travel-
time information (BROWN et al., 2002a). The precom-
piled information, which is typically average
propagation velocity and azimuth deviation, describes
how an observed signal was affected by the back-
ground environment on its way from source to receiver.
The application of this knowledge provides improved
source location and signal association estimates.
Our objective is to reduce IDC false alarm rates
and improve detection capability by reducing the
sources of uncertainty in the existing model physics
and DLC methodologies. Analyses of ground-truth
events have shown that observationally constrained
atmospheric specifications are superior to average
climatology (LE PICHON et al., 2002, 2005; HERRIN
et al., 2006). This is particularly true for tropospheric
and stratospheric propagation for which there are
several global operational numerical weather predic-
tion systems such as the NOAA Global Forecast
System (KALNAY et al., 1990) and ECMWF (COURTIER
et al., 1998; BECHTOLD et al., 2008). Unfortunately,
these systems are currently limited in their altitude
extent due to the unavailability of routine operational
satellite observations above approximately 80 km.
The ground-to-space (G2S) environmental specifica-
tion system was therefore developed to provide a
compact numerical weather prediction post-processor
and infrasound propagation calculation preprocessor
(DROB et al., 2003) to account for all altitudes perti-
nent to infrasound propagation. The system serves as
a placeholder until operational numerical weather
prediction models and data sets include the lower
thermosphere.
In addition to requiring up-to-date knowledge
about the atmospheric state for improving DLC
algorithms, an acoustic wave propagation model is
required to compute how observed infrasound signals
relate back to their source. In discrete inverse theory
(MENKE, 1989) this is known as a forward model.
There are a number of propagation modeling
techniques available such as ray tracing (GOSSARD and
HOOKE, 1975), parabolic equations (LINGEVITCH et al.,
2002), and normal modes (PIERCE, 1967). Unfortu-
nately with detailed physics comes greater
complexity. The approach must not be so primitive
that any value added from near-real-time atmospheric
specification has no meaningful influence; in turn, the
technique must not be so complicated that imple-
mentation is impractical in automated DLC
algorithms. The data and procedures must be readily
available and simple enough to integrate into opera-
tional monitoring systems.
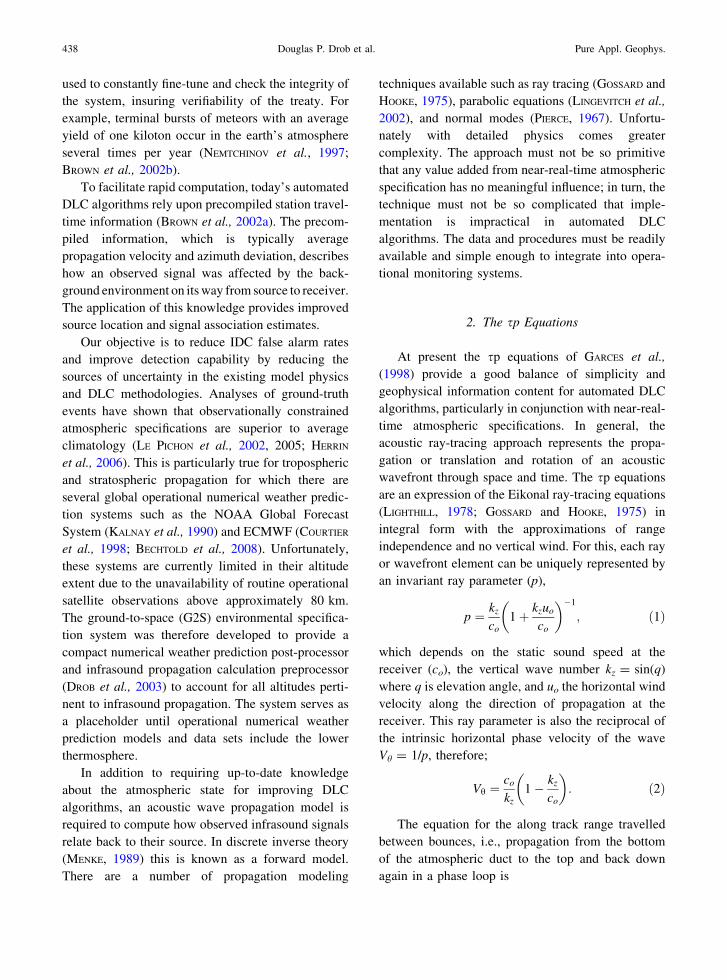
2. The sp Equations
At present the sp equations of GARCES et al.,
(1998) provide a good balance of simplicity and
geophysical information content for automated DLC
algorithms, particularly in conjunction with near-real-
time atmospheric specifications. In general, the
acoustic ray-tracing approach represents the propa-
gation or translation and rotation of an acoustic
wavefront through space and time. The sp equations
are an expression of the Eikonal ray-tracing equations
(LIGHTHILL, 1978; GOSSARD and HOOKE, 1975) in
integral form with the approximations of range
independence and no vertical wind. For this, each ray
or wavefront element can be uniquely represented by
an invariant ray parameter (p),
p ¼ kz
co1þ kzuo
co
� ��1
; ð1Þ
which depends on the static sound speed at the
receiver (co), the vertical wave number kz = sin(q)
where q is elevation angle, and uo the horizontal wind
velocity along the direction of propagation at the
receiver. This ray parameter is also the reciprocal of
the intrinsic horizontal phase velocity of the wave
Vh = 1/p, therefore;
Vh ¼co
kz1� kz
co
� �: ð2Þ
The equation for the along track range travelled
between bounces, i.e., propagation from the bottom
of the atmospheric duct to the top and back down
again in a phase loop is
438 Douglas P. Drob et al. Pure Appl. Geophys.
R z; pð Þ ¼ 2
Zz pð Þ
zo
w z; pð Þ p
1� uðzÞpð Þ þ u zð Þf zð Þ� �
dz;
ð3Þ
where zo is the lower limit of integration (typically
zero or the surface altitude) and z(p) is the upper
limit, which is the first root above zo of the charac-
teristic function.
w z; pð Þ ¼ f zð Þ � p2
1� uðzÞpð Þ2
" #�1=2
: ð4Þ
This root represents the turning point of the ray
following from classical WKB ray theory which
states that a ray will turn when its horizontal phase
velocity (Vh) matches that of the background effec-
tive sound speed, c(z) ? u(z) where these are the
adiabatic sound velocity and horizontal wind speed
along the direction of propagation, respectively. The
infrasound propagation characteristics in Eqs. 3 and 4
are a function of the local vertical profiles of
f(z) = 1/c2(z) and u(z) as well. The corresponding
travel time (T) for a phase loop is similarly
T z; pð Þ ¼ 2
Zz pð Þ
zo
w z; pð Þf zð Þdz: ð5Þ
The celerity (V), or average group velocity from
the source to the receiver is simply V = R/T. Lastly,
the apparent azimuth deviation is computed as
X = arctan-1(Q/R) where the transverse offset (Q)
for a phase loop is
Q z; pð Þ ¼Zz pð Þ
zo
w z; pð Þf zð Þv zð Þdz; ð6Þ
where v(z) is the horizontal wind component trans-
verse to the direction of propagation. Throughout this
paper, all of the results are computed in the frame of
reference of the receiver as opposed to the source by
simply reversing the sign of the wind fields. It can be
shown that this is also equivalent to integrating the
Eikonal ray equations in differential form with a
negative time step.
A discussion of the methodology for the estima-
tion of the eigenrays associating a received signal
with a given source is beyond the scope of the present
work. Relevant, however, is the fact that for a specific
eigenray the measured azimuth deviation is an
apparent effect similar to that of an airplane yawing
in a crosswind in order to maintain a constant bear-
ing. The acoustic wavefront must be skewed at some
angle X with respect to the great circle path in order
to offset the net lateral advection from transverse
wind components; in other words so that the net
transverse offset at the top and bottom of the phase
loop are zero. Although the total path does not
deviate from the true great circle path between source
and receiver, in the presence of transverse winds the
wavefront can depart from the great circle path any-
where else in the phase loop. Over one range of
altitudes a crosswind may push the ray off the great
circle path, while at other altitudes a crosswind in the
opposite direction may push the ray back onto the
great circle path. Furthermore, the ray may deviate to
one side of the path on the up leg and the other side of
the path on the down leg. This is also an important
factor that needs to be considered when signals are
observed from a source at altitude such as a bolide.
Care must be taken in automated and interactive DLC
algorithms when applying calculated values of X to
correct the array observations for apparent azimuth
deviation. If topography and atmospheric range
variations are included then the actual path can be
even more complicated, however the overall charac-
teristics remain the same.
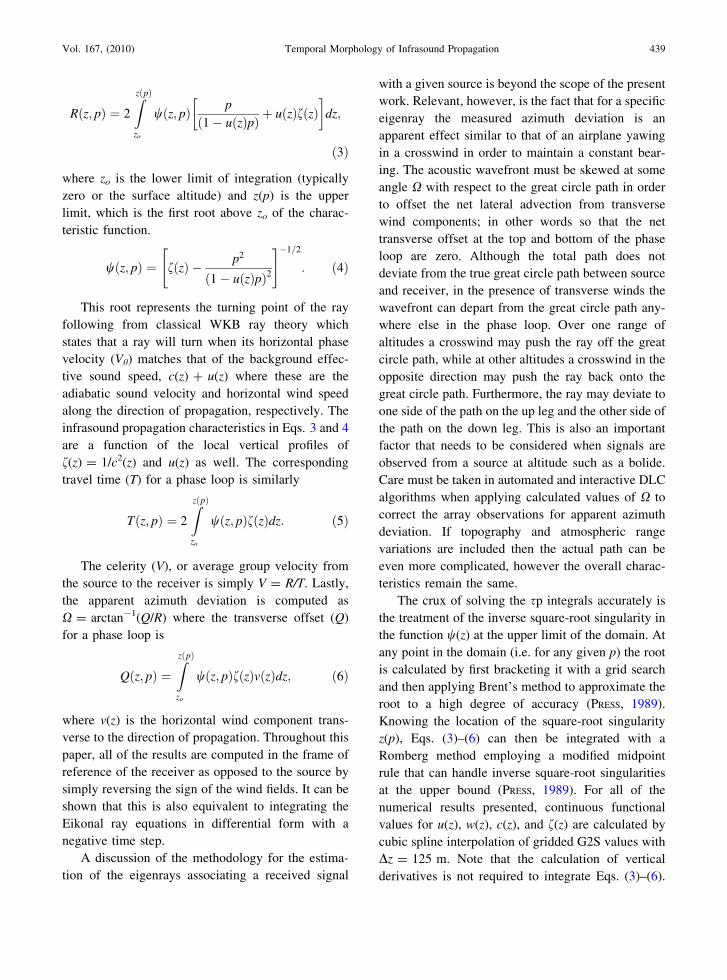
The crux of solving the sp integrals accurately is
the treatment of the inverse square-root singularity in
the function w(z) at the upper limit of the domain. At
any point in the domain (i.e. for any given p) the root
is calculated by first bracketing it with a grid search
and then applying Brent’s method to approximate the
root to a high degree of accuracy (PRESS, 1989).
Knowing the location of the square-root singularity
z(p), Eqs. (3)–(6) can then be integrated with a
Romberg method employing a modified midpoint
rule that can handle inverse square-root singularities
at the upper bound (PRESS, 1989). For all of the
numerical results presented, continuous functional
values for u(z), w(z), c(z), and f(z) are calculated by
cubic spline interpolation of gridded G2S values with
Dz = 125 m. Note that the calculation of vertical
derivatives is not required to integrate Eqs. (3)–(6).
Vol. 167, (2010) Temporal Morphology of Infrasound Propagation 439
These integrals may also be evaluated for sources at
altitude such as bolides by including a second term
for the fractional part of the propagation phase loop
where the limits of integration have been adjusted
accordingly.
Two factors are relevant to current IDC DLC
processing with respect to signals generated by
sources well above the ground where the expected
number of detectable phases can double at distant
recording stations owing to the fact that a source will
have both upward and downward directed acoustic
components. First, current automated procedures
focus on picking the onset time of the fastest infra-
sound arrival, and when and where closely spaced
multiple arrivals exist, they tend to be averaged into a
single characteristic by the parameters of the auto-
mated PMCC feature extraction algorithms.
Secondly, progress has been made to demonstrate
that it is possible to estimate hypocenter altitude at
the level of interactive IDC analyst expert review,
where manual identification of tropospheric, strato-
spheric, and thermospheric phases is possible; and in
particular in conjunction with additional information
from detections by the seismic, and auxiliary seismic
components of the IMS network (EDWARDS and
HILDEBRAND, 2004; ARROWSMITH et al., 2007; LE
PICHON et al., 2008a). As experience progresses, it
will eventually be possible to implement these con-
siderations into automated IDC processing, however
as is the case in seismology, hypocenters depths are
difficult to compute without a dense local network or
specific depth phases. Automated hypocenter height
estimates via infrasound will thus likely only be
approximate until an IDC analyst can refine them.
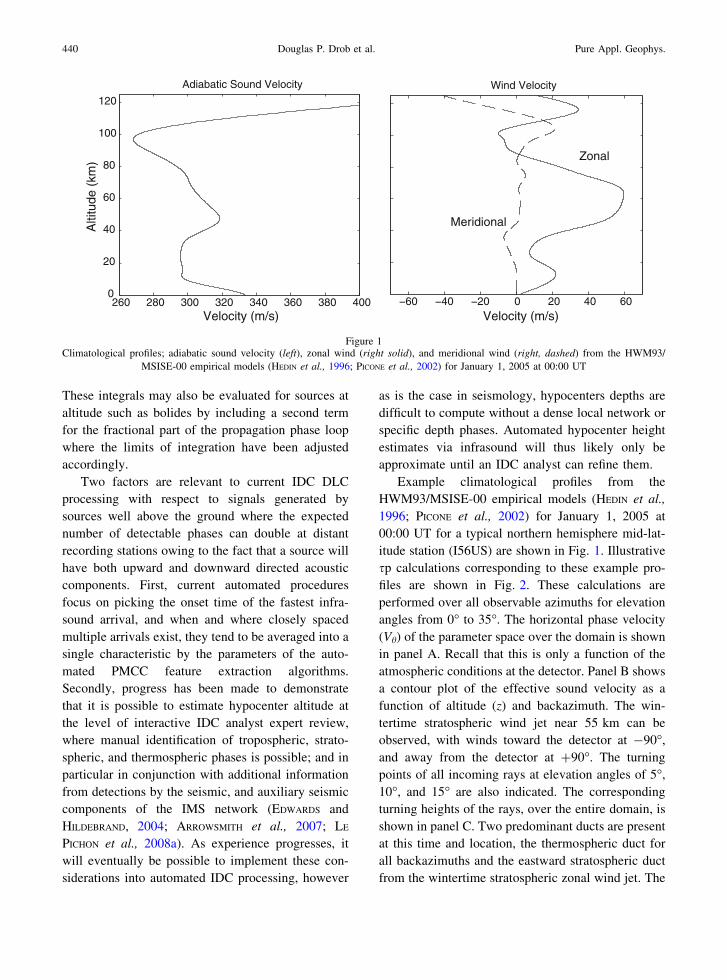
Example climatological profiles from the
HWM93/MSISE-00 empirical models (HEDIN et al.,
1996; PICONE et al., 2002) for January 1, 2005 at
00:00 UT for a typical northern hemisphere mid-lat-
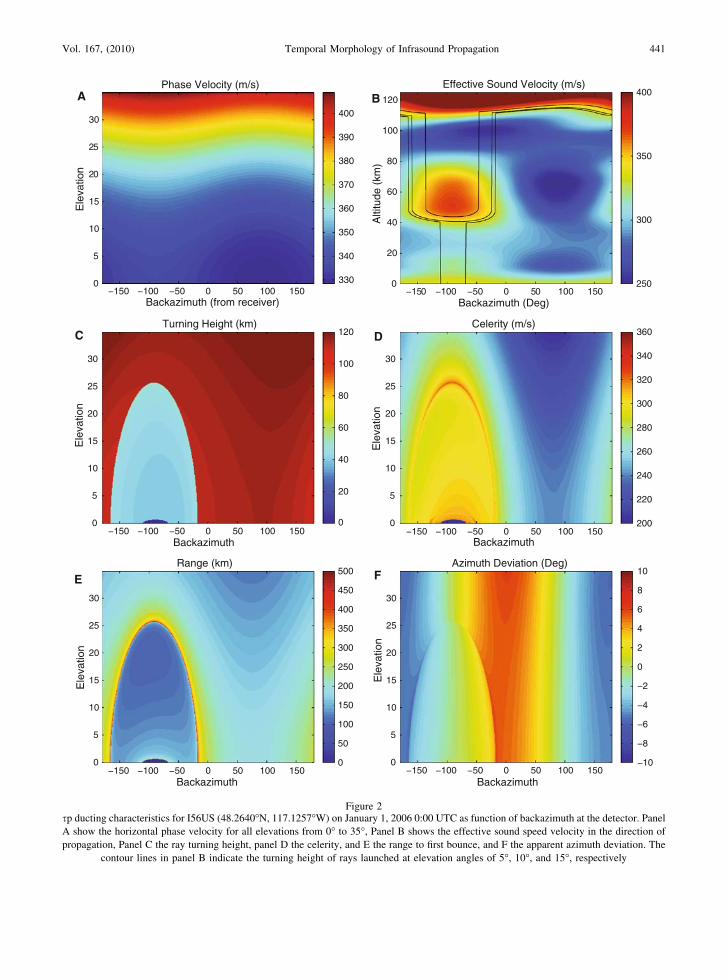
itude station (I56US) are shown in Fig. 1. Illustrative
sp calculations corresponding to these example pro-
files are shown in Fig. 2. These calculations are
performed over all observable azimuths for elevation
angles from 0� to 35�. The horizontal phase velocity
(Vh) of the parameter space over the domain is shown
in panel A. Recall that this is only a function of the
atmospheric conditions at the detector. Panel B shows
a contour plot of the effective sound velocity as a
function of altitude (z) and backazimuth. The win-
tertime stratospheric wind jet near 55 km can be
observed, with winds toward the detector at -90�,
and away from the detector at ?90�. The turning
points of all incoming rays at elevation angles of 5�,
10�, and 15� are also indicated. The corresponding
turning heights of the rays, over the entire domain, is
shown in panel C. Two predominant ducts are present
at this time and location, the thermospheric duct for
all backazimuths and the eastward stratospheric duct
from the wintertime stratospheric zonal wind jet. The
260 280 300 320 340 360 380 4000
20
40
60
80
100
120
Adiabatic Sound Velocity
Velocity (m/s)
Alti
tude
(km
)
−60 −40 −20 0 20 40 60
Wind Velocity
Velocity (m/s)
Zonal
Meridional
Figure 1Climatological profiles; adiabatic sound velocity (left), zonal wind (right solid), and meridional wind (right, dashed) from the HWM93/
MSISE-00 empirical models (HEDIN et al., 1996; PICONE et al., 2002) for January 1, 2005 at 00:00 UT
440 Douglas P. Drob et al. Pure Appl. Geophys.
Phase Velocity (m/s)
Backazimuth (from receiver)
Ele
vatio
n
−150 −100 −50 0 50 100 1500
5
10
15
20
25
30
330
340
350
360
370
380
390
400
Effective Sound Velocity (m/s)
Backazimuth (Deg)
Alti
tude
(km
)
−150 −100 −50 0 50 100 1500
20
40
60
80
100
120
250
300
350
400
Turning Height (km)
Backazimuth
Ele
vatio
n
−150 −100 −50 0 50 100 1500
5
10
15
20
25
30
0
20
40
60
80
100
120Celerity (m/s)
Backazimuth
Ele
vatio
n
−150 −100 −50 0 50 100 1500
5
10
15
20
25
30
200
220
240
260
280
300
320
340
360
Range (km)
Backazimuth
Ele
vatio
n
−150 −100 −50 0 50 100 1500
5
10
15
20
25
30
0
50
100
150
200
250
300
350
400
450
500Azimuth Deviation (Deg)
Backazimuth
Ele
vatio
n
−150 −100 −50 0 50 100 1500
5
10
15
20
25
30
−10
−8
−6
−4
−2
0
2
4
6
8
10
A B
C D
E F
Figure 2sp ducting characteristics for I56US (48.2640�N, 117.1257�W) on January 1, 2006 0:00 UTC as function of backazimuth at the detector. Panel
A show the horizontal phase velocity for all elevations from 0� to 35�, Panel B shows the effective sound speed velocity in the direction of
propagation, Panel C the ray turning height, panel D the celerity, and E the range to first bounce, and F the apparent azimuth deviation. The
contour lines in panel B indicate the turning height of rays launched at elevation angles of 5�, 10�, and 15�, respectively
Vol. 167, (2010) Temporal Morphology of Infrasound Propagation 441

dark blue area represents a region where the acoustic
energy is immediately refracted downward toward
the earth’s surface by the ambient atmospheric con-
ditions. Panels D, E, and F show the celerity (V),
range (R), and apparent azimuth deviation (X) over
the computational domain, respectively. A very sta-
ble and accurate result can be obtained over the entire
domain, including in the vicinity of the cusp regions
where fast propagation modes exist (EVERS and HAAK,
2007). These fast modes can be seen near the tran-
sition from the stratospheric to the thermospheric
ducts for look directions to the west.
Several limitations resulting from the various
approximations in the sp method such as the short-
comings of linear ray-tracing theory (MILLET et al.,
2007), the lack of explicit range dependence (DROB
et al., 2003), and the influence of internal scattering
by internal gravity waves (CHUNCHUZOV, 2004;
OSTASHEV et al., 2005) are noteworthy but beyond the
scope of the present discussion. With the doubling of
processing capacities every few years following
Moore’s Law, more complex calculations that
account for range-dependent variations in the back-
ground atmosphere should be investigated and
eventually implemented in automated DLC algo-
rithms. The objective at hand is to provide
geophysical insight to demonstrate that the utilization
of climatological travel times in DLC algorithms is at
best outdated in comparison to the possibility of
calculating them in real time following from recent
progress in atmospheric specification and infrasound
propagation codes.
3. Results
Classic pioneering work by GEORGES and BEASLEY,
(1977) and others, which relied on limited knowledge
of the atmosphere, developed an appreciation for how
infrasound ducting characteristics vary with latitude
over the year. With more recent information from
thirty-five years of satellite and ground-based atmo-
spheric wind and temperature measurements, DROB
et al., (2003) investigated how infrasound propaga-
tion characteristics varied over the globe at a given
universal time; in particular, how acoustic energy is
partitioned between the troposphere, stratospheric,
and thermosphere ducts. To provide some context,
Fig. 3 shows the global distribution of infrasound
ducting characteristics for an arbitrary time of 05/24/
2006 00:00 UT. For a particular altitude level, each
global map represents the fraction of acoustic energy
from an isotropically radiating acoustic point source
on the ground, summed over all possible propagation
directions (see DROB et al., 2003).
The regions where tropospheric ducting occurs are
shown in the top panel. Ducting along the tropo-
spheric jet stream can also be seen in the Southern
Hemisphere. Marine inversion layers also occurred
off the west coast of California and Africa, as well as
near the Korean Peninsula. Stratospheric ducting
(middle panel) is seen in the Northern And Southern
Hemisphere mid-latitude regions but is absent in the
equatorial regions. The lower panel shows the
remaining thermospheric ducting fractions. Interest-
ing correlations in the thermospheric ducting fractions
with continental landmasses and lower atmospheric
ducting fractions can also be seen. The inverse cor-
relations between the upper and lower atmospheric
ducting fractions are due to the fact that what was not
ducted in the lower atmosphere can be ducted in the
upper mesosphere and lower thermosphere.
Following the work of DROB et al., (2003), we
now present several case studies based on the cal-
culation of a multiyear time series of infrasound
propagation characteristics for two of the IMS in-
frasound stations; I56US a mid-latitude Northern
Hemisphere station at (48.26�N, 117.13�W), and
I55US a polar latitude Southern Hemisphere station
at (77.74�S, 167.58�E). We compare and contrast the
results calculated from both climatology (HWM93/
MSISE-00) and hybrid G2S specifications. For these
two IMS stations, we present a five-year long-time
series from September 13, 2002 to April 30, 2007 at
6 h intervals (49 daily) of the infrasound ducting
characteristics of ray turning heights z(p), celerity (V)
and backazimuth (X). The later two have direct
application in infrasound DLC algorithms.
In the detection algorithms described by BROWN
et al., (2002a) currently in use at the IDC, backazi-
muths receive a slightly greater statistical emphasis
(1.0) as compared to travel times (0.8) in the calcu-
lation of a metric (R) for the trigging of an automatic
event (R[ 3.55) and Reviewed Event Bulletin
442 Douglas P. Drob et al. Pure Appl. Geophys.
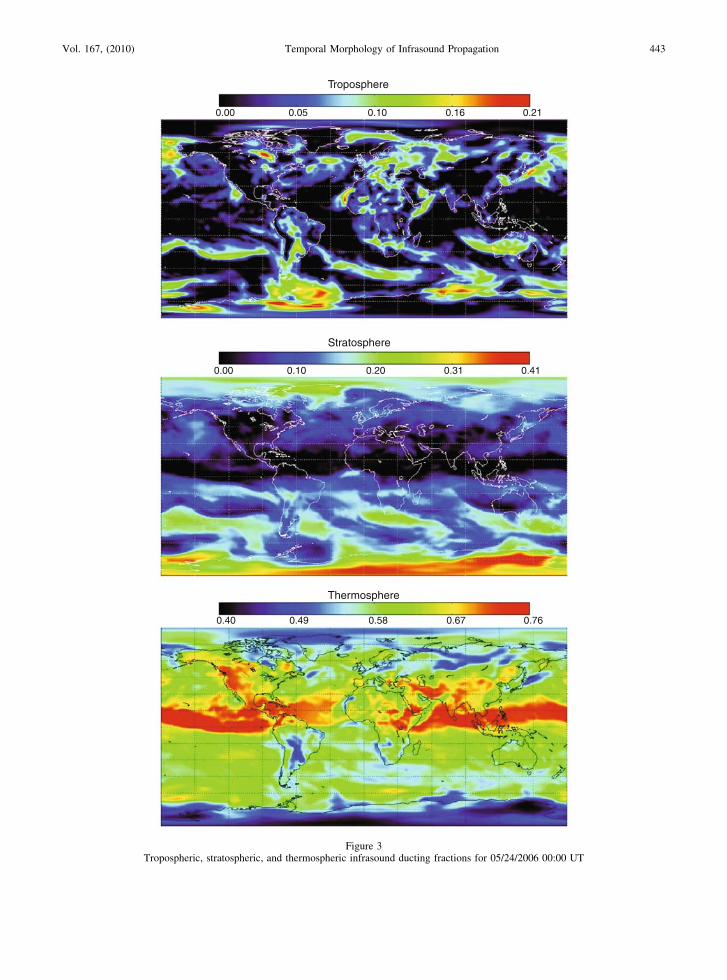
Troposphere
0.00 0.05 0.10 0.16 0.21
Stratosphere
0.00 0.10 0.20 0.31 0.41
Thermosphere
0.40 0.49 0.58 0.67 0.76
Figure 3Tropospheric, stratospheric, and thermospheric infrasound ducting fractions for 05/24/2006 00:00 UT
Vol. 167, (2010) Temporal Morphology of Infrasound Propagation 443

(REB) (R[ 4.6). This detection criteria effectively
defines a significant event as one that can be estab-
lished by at least two well-defined and intersecting
back azimuths for which the associated travel times
do not also violate causality (BROWN et al., 2002a).
More recently, a novel detection scheme was devel-
oped by ARROWSMITH et al., (2008) that dynamically
adjusts network detection thresholds in real time to
account for the presence of correlated and varying
background noise. Furthermore, ARROWSMITH et al.,
(2008) demonstrated that the new algorithm has
excellent performance characteristics in the presence
of clutter, suggesting the approach provides a viable
means to reduce the number of false alarms that need
to be reviewed by a human analysis. Neither
approach currently accounts for the hourly, daily, or
seasonal changes of the travel time or azimuth devi-
ation resulting from the corresponding changes in the
atmospheric conditions; the inclusion of which would
further allow for a more accurate calculation of the Rmetric thus improving the network sensitivity and
reducing the number of false alarms.
4. I56US
Figure 4 shows the computed turning points of
infrasound for arrivals at I56US for an elevation of
5�. The top panel shows the results calculated from
the climatology and the lower panel the results cal-
culated with the hybrid G2S specification. The
alternating seasonal pattern, where eastward strato-
spheric propagation is observed in the wintertime and
westward stratospheric propagation is observed in the
summer time, is evident. Ducting caused by the tro-
pospheric jet stream for predominantly eastward
propagating arrivals, as well as occasionally for
northward and southward directions, can also be seen.
Furthermore, occasional stratospheric ducting in both
the westward and eastward directions, related to
global-scale dynamical instabilities in the strato-
sphere, can sometimes occur during the winter
months. As would be expected but not shown here,
the corresponding results for lower elevation angles
exhibit more tropospheric and stratospheric ducting
for lower incoming elevations and less for large
elevation angles (more thermospheric ducting).
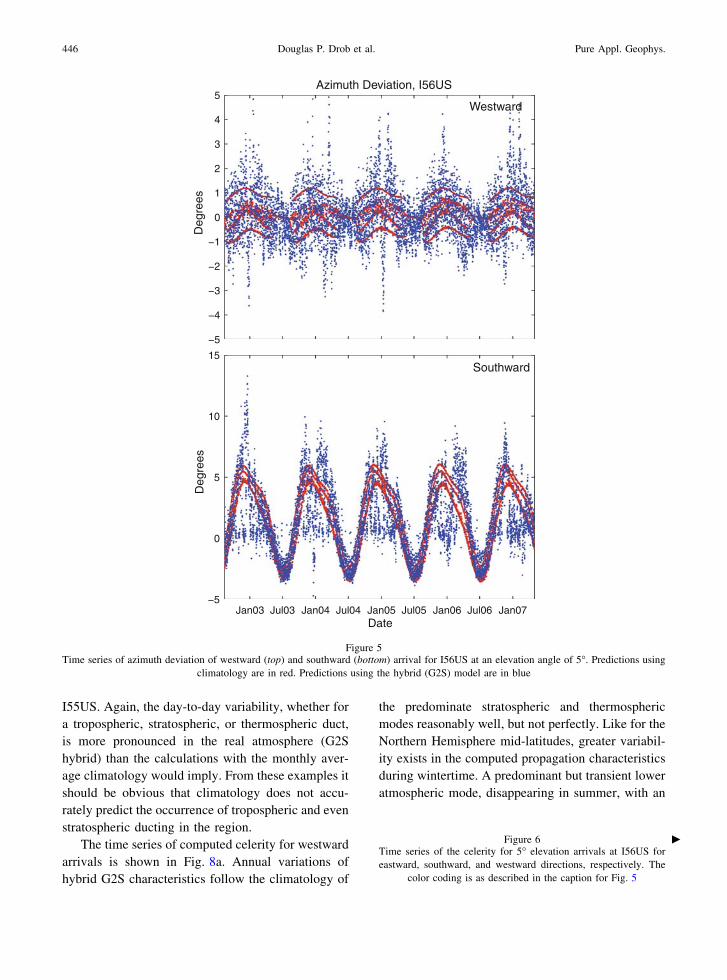
Figure 5a shows the azimuth deviation for west-
ward arrivals from the five-year time series at I56US;
climatological values are indicated in red and results
from the hybrid specifications in blue. There is an
average scatter in the hybrid specifications of about
±2�, on par with the climatological predictions, plus
occasional excursions of up to ±4� during the winter
months. The four interleaved bands in the climato-
logically predicted variations result from the different
local times under the influence of the solar migrating
tides as described by GARCES et al., (1998). Figure 5b
shows the azimuth deviation for southward arrivals
with excursions up to 10� in January 2003, and on
average up to 7.5� during wintertime. In addition, there
is an asymmetry with respect to the summer months
with deviations of up to -3�, which tend to be more
stable. These wide ranging azimuth deviations result
from the annual variations of the stratospheric wind jet
which is predominantly eastward, lower, stronger, and
variable in the wintertime, as compared to the sum-
mertime jet which is westward, higher, and stable.
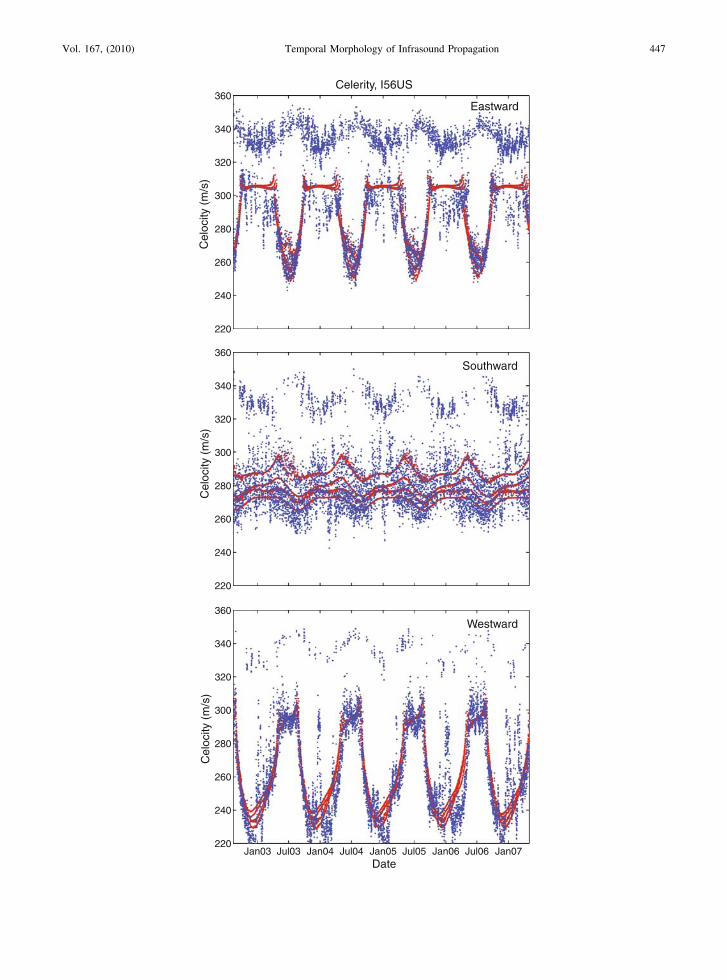
Figure 6a shows a time series of celerity for
I56US for eastward arrivals again at 5� elevation,
calculated with hybrid G2S and empirical atmo-
spheric specifications. A band of arrivals at 340 m/s,
which are comprised of both lower tropospheric,
upper tropospheric, and even stratospheric modes, is
evident. Random departures of up to 30 m/s from
climatological estimates and seasonal variations
occur during wintertime for the other branch of
arrivals between 250 and 320 m/s.
Figure 6b presents the comparison of celerity for
all southward arrivals at 5� elevation. Note the
occasional tropospheric modes (330 m/s) with a half-
width of 20 m/s, including seasonal oscillations. The
predicted tidal oscillations are also more significant.
With respect to the climatology, lower atmospheric
ducting to the north and south are generally not
expected as the meridional wind fields average to
zero over the globe.
Figure 6c shows the results for westward arrivals.
Of note is the presence of occasional tropospheric
arrivals (340 m/s) with clear seasonal variability. If
not properly accounted for (i.e. given the appropriate
statistical weighting) these could result in spurious
associations and poor source localizations. The results
also show that there is pronounced annual variability
444 Douglas P. Drob et al. Pure Appl. Geophys.
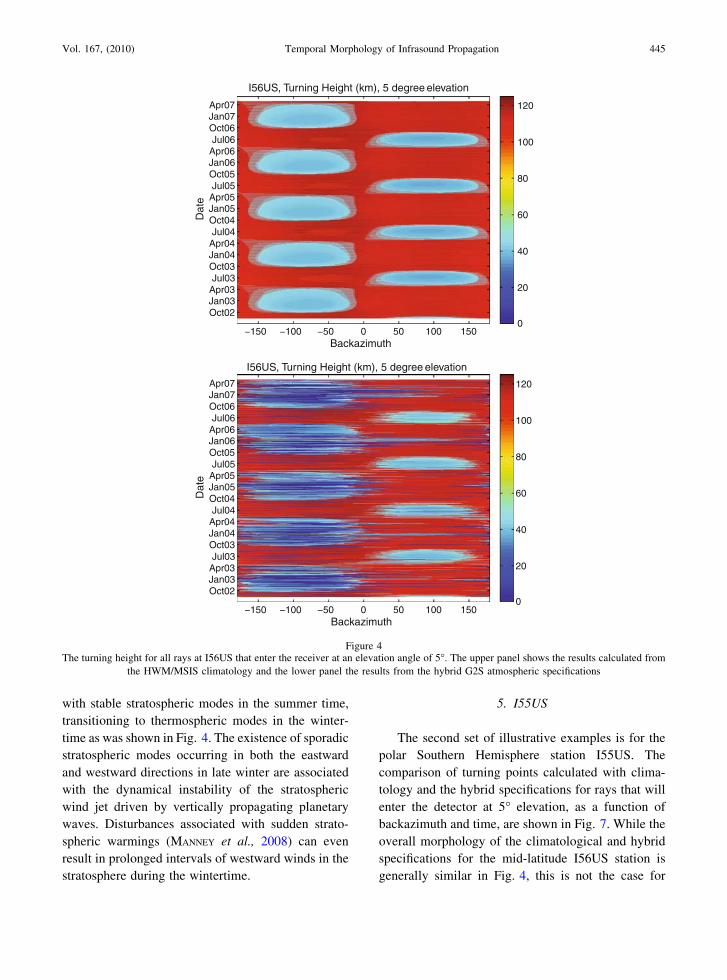
with stable stratospheric modes in the summer time,
transitioning to thermospheric modes in the winter-
time as was shown in Fig. 4. The existence of sporadic
stratospheric modes occurring in both the eastward
and westward directions in late winter are associated
with the dynamical instability of the stratospheric
wind jet driven by vertically propagating planetary
waves. Disturbances associated with sudden strato-
spheric warmings (MANNEY et al., 2008) can even
result in prolonged intervals of westward winds in the
stratosphere during the wintertime.
5. I55US
The second set of illustrative examples is for the
polar Southern Hemisphere station I55US. The
comparison of turning points calculated with clima-
tology and the hybrid specifications for rays that will
enter the detector at 5� elevation, as a function of
backazimuth and time, are shown in Fig. 7. While the
overall morphology of the climatological and hybrid
specifications for the mid-latitude I56US station is
generally similar in Fig. 4, this is not the case for
Backazimuth
Dat
e
−150 −100 −50 0 50 100 150
Oct02Jan03Apr03Jul03
Oct03Jan04Apr04Jul04
Oct04Jan05Apr05Jul05
Oct05Jan06Apr06Jul06
Oct06Jan07Apr07
0
20
40
60
80
100
120
Backazimuth
Dat
e
−150 −100 −50 0 50 100 150
Oct02Jan03Apr03Jul03
Oct03Jan04Apr04Jul04
Oct04Jan05Apr05Jul05
Oct05Jan06Apr06Jul06
Oct06Jan07Apr07
0
20
40
60
80
100
120
I56US, Turning Height (km), 5 degree elevation
I56US, Turning Height (km), 5 degree elevation
Figure 4The turning height for all rays at I56US that enter the receiver at an elevation angle of 5�. The upper panel shows the results calculated from
the HWM/MSIS climatology and the lower panel the results from the hybrid G2S atmospheric specifications
Vol. 167, (2010) Temporal Morphology of Infrasound Propagation 445
I55US. Again, the day-to-day variability, whether for
a tropospheric, stratospheric, or thermospheric duct,
is more pronounced in the real atmosphere (G2S
hybrid) than the calculations with the monthly aver-
age climatology would imply. From these examples it
should be obvious that climatology does not accu-
rately predict the occurrence of tropospheric and even
stratospheric ducting in the region.
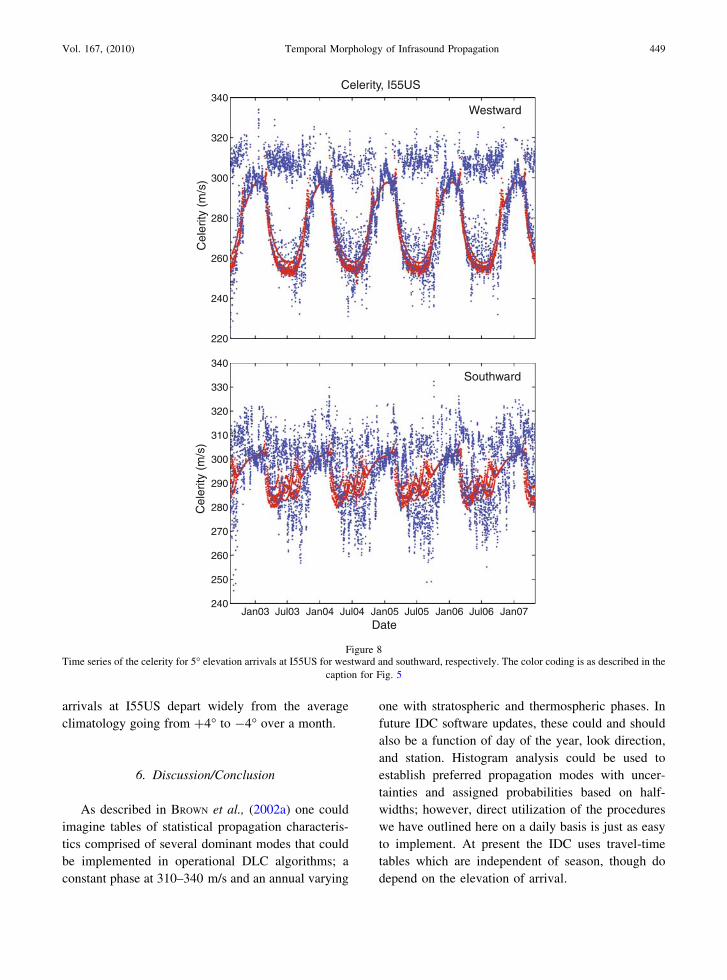
The time series of computed celerity for westward
arrivals is shown in Fig. 8a. Annual variations of
hybrid G2S characteristics follow the climatology of
the predominate stratospheric and thermospheric
modes reasonably well, but not perfectly. Like for the
Northern Hemisphere mid-latitudes, greater variabil-
ity exists in the computed propagation characteristics
during wintertime. A predominant but transient lower
atmospheric mode, disappearing in summer, with an
−5
−4
−3
−2
−1
0
1
2
3
4
5
Deg
rees
Jan03 Jul03 Jan04 Jul04 Jan05 Jul05 Jan06 Jul06 Jan07−5
0
5
10
15
Date
Westward
Southward
Azimuth Deviation, I56US
Deg
rees
Figure 5Time series of azimuth deviation of westward (top) and southward (bottom) arrival for I56US at an elevation angle of 5�. Predictions using
climatology are in red. Predictions using the hybrid (G2S) model are in blue
Figure 6Time series of the celerity for 5� elevation arrivals at I56US for
eastward, southward, and westward directions, respectively. The
color coding is as described in the caption for Fig. 5
c
446 Douglas P. Drob et al. Pure Appl. Geophys.
220
240
260
280
300
320
340
360
Cel
ocity
(m
/s)
Southward
220
240
260
280
300
320
340
360
Cel
ocity
(m
/s)
Eastward
Jan03 Jul03 Jan04 Jul04 Jan05 Jul05 Jan06 Jul06 Jan07220
240
260
280
300
320
340
360
Date
Cel
ocity
(m
/s)
Westward
Celerity, I56US
Vol. 167, (2010) Temporal Morphology of Infrasound Propagation 447

average celerity of about 310 m/s is also present. The
340 m/s celerities observed at I56US (Fig. 6) are
generally not be observed at I55US as the polar tro-
posphere is colder and the station is too far poleward
to be influenced by the tropospheric jet stream.
Figure 8b shows the results for southward arrivals,
which vary from 260 to 325 m/s, again exhibiting
significant departures from climatological predictions.
Lastly, we consider the azimuth deviations for
IMS station I55US. The time series of southward
arrivals is shown in Fig. 9a, for which there are
asymmetric seasonal variations with occasional spo-
radic excursions of over 10�, and up to 7.5� on
average. Significant local-time (tidal) variations of the
thermospheric modes are again present in the clima-
tology. The results shown in Fig. 9b for the westward
Backazimuth
Dat
e
−150 −100 −50 0 50 100 150
Oct02Jan03Apr03Jul03
Oct03Jan04Apr04Jul04
Oct04Jan05Apr05Jul05
Oct05Jan06Apr06Jul06
Oct06Jan07Apr07
0
20
40
60
80
100
120
Backazimuth
Dat
e
−150 −100 −50 0 50 100 150
Oct02Jan03Apr03Jul03
Oct03Jan04Apr04Jul04
Oct04Jan05Apr05Jul05
Oct05Jan06Apr06Jul06
Oct06Jan07Apr07
0
20
40
60
80
100
120
I55US, Turning Height (km), 5 degree elevation
I55US, Turning Height (km), 5 degree elevation
Figure 7The turning height for all rays at I55US that enter the receiver at an elevation angle of 5�. The upper panel shows the results calculated from
the HWM/MSIS climatology and the lower panel the results from the hybrid G2S atmospheric specifications
448 Douglas P. Drob et al. Pure Appl. Geophys.
arrivals at I55US depart widely from the average
climatology going from ?4� to -4� over a month.
6. Discussion/Conclusion
As described in BROWN et al., (2002a) one could
imagine tables of statistical propagation characteris-
tics comprised of several dominant modes that could
be implemented in operational DLC algorithms; a
constant phase at 310–340 m/s and an annual varying
one with stratospheric and thermospheric phases. In
future IDC software updates, these could and should
also be a function of day of the year, look direction,
and station. Histogram analysis could be used to
establish preferred propagation modes with uncer-
tainties and assigned probabilities based on half-
widths; however, direct utilization of the procedures
we have outlined here on a daily basis is just as easy
to implement. At present the IDC uses travel-time
tables which are independent of season, though do
depend on the elevation of arrival.
220
240
260
280
300
320
340
Cel
erity
(m
/s)
Jan03 Jul03 Jan04 Jul04 Jan05 Jul05 Jan06 Jul06 Jan07240
250
260
270
280
290
300
310
320
330
340
Date
Cel
erity
(m
/s)
Westward
Southward
Celerity, I55US
Figure 8Time series of the celerity for 5� elevation arrivals at I55US for westward and southward, respectively. The color coding is as described in the
caption for Fig. 5
Vol. 167, (2010) Temporal Morphology of Infrasound Propagation 449

Furthermore, from the consideration of the vari-
ability of backazimuth and celerity presented, it is
clear that the current seasonal averaged travel-time
tables provide a poor representation of the day-to-day
and month-to-month variations, and thus limit the full
potential of the CTBTO automated infrasound DLC
algorithms. The inherent variability is simply lost in
the histogram analysis. It should be noted that in
concert with the other monitoring technologies of the
CTBTO, the current infrasound algorithms are pass-
able, but improvable, as has been demonstrated by
numerous researchers and results. Additional work,
following examples such as ARROWSMITH et al.,
(2008); LE PICHON et al., (2008c) should be under-
taken in order to ascertain the value added to the
system in terms of false alarm rates and network
detection thresholds with careful consideration of the
computational complexity and burden introduced into
the existing operational system.
With respect to caveats for the calculations pre-
sented here, for certain locations and times the
dynamical variability of the upper mesospheric and
−5
0
5
10
15
Deg
rees
Jan03 Jul03 Jan04 Jul04 Jan05 Jul05 Jan06 Jul06 Jan07−5
−4
−3
−2
−1
0
1
2
3
4
5
Date
Deg
rees
Southward
Westward
Azimuth Deviation, I55US
Figure 9Time series of southward and westward arrivals for I55US at an elevation angle of 5�, respectively. The color coding is as described in the
caption for Fig. 5
450 Douglas P. Drob et al. Pure Appl. Geophys.

lower thermospheric modes may be even greater in
reality than calculated here after accounting for
observed and documented non-migrating tides
(FORBES et al., 2003), day-to-day and inter-seasonal
tidal variability (FRITTS and ISLER, 1994; LIEBERMAN
et al., 2007), and the existence of vertically propa-
gating and stationary mesosphere lower thermosphere
planetary waves (SMITH, 1996; MCLANDRESS et al.,
2006) above 55 km. These effects are not yet fully
included in either the empirical climatology or hybrid
G2S atmospheric specification. The HWM93 model
is also known to underestimate the magnitude of the
migrating tides for certain seasons and latitudes.
A recent update of HWM (HWM07) by DROB et al.,
(2008) resolves most of the issues related to the
amplitude and phases of the migrating solar tides in
the mesosphere and lower thermosphere. Given a
proper statistical treatment of the present uncertain-
ties, limitations of the present atmospheric
specifications above 55 km should not invalidate the
applicability of the work described here to DLC
algorithms. In particular, tropospheric and strato-
spheric modes, which have a much greater signal to
noise ratio are more likely to be detected and not
subject to these problems.
The sp and G2S software which produced the
results presented here are specifically designed to be
utilized at the IDC in batch mode via a shell script in
order to compute the local propagation characteristics
for all IMS infrasound stations in real time. These
codes can also be invoked interactively by an IDC
analysist. For a given station and time the sp calcu-
lations only require a few seconds to complete. The
process is relatively fast compared to the periodic
calculations of the global G2S coefficient set from
available atmospheric data sources, requiring several
minutes to downloading available global weather
fields and perform the vector spherical harmonic
transforms. With the addition or allocation of a single
dedicated compute node that is accessible to the
operational DLC system, the travel-time characteris-
tics for all sixty IMS infrasound stations could be
updated every 60 min. Compared to automated DLC
calculations from climatological travel-time tables
gains in system performance could thus be achieved.
Recent ground-truth events investigated by the
infrasound research community have clearly
demonstrated that accurate atmospheric specifications
are required to properly explain observed infrasound
signals. In tandem, the atmospheric science commu-
nity is continually improving and currently producing
reliable specifications of the atmospheric state that
can be utilized to improve automated DLC algo-
rithms. Given the advances and availability of low-
cost computing resources, and the reliable openly
available real-time atmospheric specifications such as
provided by NOAA and ECMWF there are no good
reasons, technical or otherwise, why near-real-time
travel-time tables should not be used in infrasound
propagation calculations. Of course when these sys-
tems are brought online it is important to continually
monitor and evaluate the performance with the many
naturally occurring geophysical, as well as coinci-
dental man-made, ground-truth events. One
possibility as already demonstrated by similar
research is the example of the analysis of the multi-
year time series of volcanic observations at I22FR
(LE PICHON et al., 2005). Lastly for robust event
location and screening of automated event bulletins
by human analysts (BROWN et al., 2002a), we rec-
ommend that detailed propagation modeling
techniques that account for range dependence
(GOSSARD and HOOKE, 1975), topography (ARROWSMITH
et al., 2007), and other effects such as interval gravity
waves (OSTASHEV et al., 2005; CHUNCHUZOV, 2004) be
utilized.
This paper has presented time series of infrasound
propagation characteristics. A number of physical
approximations where made to keep these calcula-
tions simple and robust. Through these calculations,
we have argued that precomputed monthly average
travel-time tables are poor for operational DLC
algorithms. To this end, we have advanced progress
toward the integration of real-time infrasound prop-
agation travel-time tables into automated IMS
processing.
Acknowledgments
The methodologies and tools presented here were
developed in part in an effort supported by the Office
of Naval Research to investigate whether signals
from infrasound ground-truth events could be
Vol. 167, (2010) Temporal Morphology of Infrasound Propagation 451
inverted to obtain information about the atmosphere,
i.e., ground-to-space infrasound acoustic tomogra-
phy, such as is currently in routine use in
oceanography and seismology.
REFERENCES
ARROWSMITH, S.J., DROB, D.P., HEDLIN, M.A.H., and EDWARDS, W.
(2007), A joint seismic and acoustic study of the Washington
State bolide: observations and modeling, J. Geophys.
Res.-Atmos 112.
ARROWSMITH, S.J., WHITAKER, R., TAYLOR, S.R., BURLACU, R.,
STUMP, B.W., HEDLIN, M.A.H., RANDALL, G., HAYWARD, C., and
REVELLE, D.O. (2008), Regional monitoring of infrasound events
using multiple arrays: application to Utah and Washington State,
Geophys. J. Int. 175, 291–300.
BECHTOLD, P., KOHLER, M., JUNG, T., DOBLAS-REYES, F., LEUTBE-
CHER, M., RODWELL, M.J., VITART, F., and BALSAMO, G. (2008),
Advances in simulating atmospheric variability with the ECMWF
model: from synoptic to decadal time-scales, Quart. J. Roy.
Meteorol. Soc. 134, 1337–1351.
BROWN, D.J., KATZ, C.N., LE BRAS, R., FLANAGAN, M.P., WANG, J.,
and GAULT, A.K. (2002a), Infrasonic signal detection and source
location at the Prototype International Data Centre, Pure Appl.
Geophys. 159, 1081–1125.
BROWN, P., SPALDING, R.E., REVELLE, D.O., TAGLIAFERRI, E., and
WORDEN, S.P. (2002b), The flux of small near-Earth objects
colliding with the Earth, Nature 420, 294–296.
CANSI, Y. (1995), An Automatic Seismic Event Processing for
Detection and Location––the PMCC Method, Geophys. Res. Lett
22, 1021–1024.
CHRISTIE, D.R., VELOSO, J.A.V., CAMPUS, P., BELL, M., HOFFMANN,
T., LANGLOIS, A., MARTYSEVICH, P., DEMIROVIC, E., and CARVALHO,
J. (2001), Detection of atmospheric nuclear explosions: the in-
frasound component of the International Monitoring System,
Kerntechnik 66, 96–101.
CHUNCHUZOV, I.P. (2004), Influence of internal gravity waves on
sound propagation in the lower atmosphere, Meteorol. Atmos.
Phys. 85, 61–76.
COURTIER, P., ANDERSSON, E., HECKLEY, W., PAILLEUX, J., VASILJEVIC,
D., HAMRUD, M., HOLLINGSWORTH, A., RABIER, E., and FISHER, M.
(1998), The ECMWF implementation of three-dimensional var-
iational assimilation (3D-Var). I: Formulation, Quart. J. Roy.
Meteorol. Soc. 124, 1783–1807.
DROB, D., EMMERT, J.T., CROWLEY, G., PICONE, J.M., SHEPHERD,
G.G., SKINNER, W., HAYS, P., NICIEJEWSKI, R.J., LARSEN, M., SHE,
C.Y., MERIWETHER, J.W., HERNANDEZ, G., JARVIS, M.J., D. P.
SIPLER, TEPLEY, C.A., O’BRIEN, M.S., BOWMAN, J.R., WU, Q.,
MURAYAMA, Y., KAWAMURA, S., REID, I.M., and VINCENT, R.A.
(2008), An Empirical Model of the Earth’s Horizontal Wind
Fields: HWM07, J. Geophys. Res.-Space Phys., in press.
DROB, D.P., PICONE, J.M., and GARCES, M. (2003), Global mor-
phology of infrasound propagation, J. Geophys. Res.-Atmos. 108.
EDWARDS, W.N. and HILDEBRAND, A.R. (2004), SUPRACENTER:
Locating fireball terminal bursts in the atmosphere using seismic
arrivals, Meteor. & Planet. Sci. 39, 1449–1460.
EVERS, L.G. and HAAK, H.W. (2007), Infrasonic forerunners:
Exceptionally fast acoustic phases, Geophys. Res. Lett. 34.
FORBES, J.M., ZHANG, X.L., TALAAT, E.R., and WARD, W. (2003),
Nonmigrating diurnal tides in the thermosphere, J. Geophys.
Res.-Space Phys. 108.
FRITTS, D.C. and ISLER, J.R. (1994), Mean motions and tidal and 2-
day structure and variability in the mesosphere and lower ther-
mosphere over Hawaii, J. Atmos. Sci. 51, 2145–2164.
GARCES, M.A., HANSEN, R.A., and LINDQUIST, K.G. (1998), Trav-
eltimes for infrasonic waves propagating in a stratified
atmosphere, Geophys. J. Internat. 135, 255–263.
GEORGES, T.M. and BEASLEY, W.H. (1977), Refraction of infrasound
by upper-atmospheric winds, J. Acoust. Soc. Am. 61, 28-34.
GOSSARD, E.E. and HOOKE, W.H. Waves in the Atmosphere:
Atmospheric Infrasound and Gravity Waves: Their Generation
and Propagation (Elsevier Scientific Pub. Co., Amsterdam; New
York 1975).
HEDIN, A.E., FLEMING, E.L., MANSON, A.H., SCHMIDLIN, F.J., AVERY,
S.K., CLARK, R.R., FRANKE, S.J., FRASER, G.J., TSUDA, T., VIAL, F.,
and VINCENT, R.A. (1996), Empirical wind model for the upper,
middle and lower atmosphere, J. Atmos. Terre. Phys. 58, 1421–
1447.
HEDLIN, M.A.H., GARCES, M., BASS, H.E., HAYWARD, HERRIN, G.,
OLSON, G., and WILSON, C. (2002), Listening to the secret sounds
of the earth’s atmosphere, Eos Trans. AGU 83, 564–565.
HERRIN, E.T., KIM, T.S., and STUMP, B.W. (2006), Evidence for an
infrasound waveguide, Geophys. Res. Lett. 33.
KALNAY, E., KANAMITSU, M., and BAKER, W.E. (1990), Global
Numerical Weather Prediction at the National-Meteorological-
Center, Bull. Am. Meteor. Soc. 71, 1410–1428.
LE PICHON, A., ANTIER, K., CANSI, Y., HERNANDEZ, B., MINAYA, E.,
BURGOA, B., DROB, D., EVERS, L.G., and VAUBAILLON, J. (2008a),
Evidence for a meteoritic origin of the September 15, 2007,
Carancas crater, Meteor. Planet. Sci. 43, 1797–1809.
LE PICHON, A., BLANC, E., DROB, D., LAMBOTTE, S., DESSA, J.X.,
LARDY, M., BANI, P., and VERGNIOLLE, S. (2005), Infrasound
monitoring of volcanoes to probe high-altitude winds, J. Geophy.
Res.-Atmos. 110.
LE PICHON, A., GARCES, M., BLANC, E., BARTHELEMY, M., and DROB,
D.P. (2002), Acoustic propagation and atmosphere characteris-
tics derived from infrasonic waves generated by the Concorde, J.
Acoust. Soc. Am. 111, 629–641.
LE PICHON, A., VERGOZ, J., HERRY, P., and CERANNA, L. (2008b),
Analyzing the detection capability of infrasound arrays in Cen-
tral Europe, J. Geophys. Res.-Atmos. 113, 9.
LE PICHON, A., VERGOZ, J., HERRY, P., and CERANNA, L. (2008c),
Analyzing the detection capability of infrasound arrays in Cen-
tral Europe, J. Geophys. Res.-Atmos. 113.
LIEBERMAN, R.S., RIGGIN, D.M., ORTLAND, D.A., NESBITT, S.W., and
VINCENT, R.A. (2007), Variability of mesospheric diurnal tides
and tropospheric diurnal heating during 1997-1998, J. Geophys.
Res.-Atmos. 112, 17.
LIGHTHILL, M.J. Waves in Fluids, (Cambridge University Press,
Cambridge [Eng.]; New York 1978).
LINGEVITCH, J.F., COLLINS, M.D., DACOL, D.K., DROB, D.P., ROGERS,
J.C.W., and SIEGMANN, W.L. (2002), A wide angle and high Mach
number parabolic equation, J. Acoust. Soc. Am. 111, 729–734.
MANNEY, G.L., KRUGER, K., PAWSON, S., MINSCHWANER, K.,
SCHWARTZ, M.J., DAFFER, W.H., LIVESEY, N.J., MLYNCZAK, M.G.,
REMSBERG, E.E., RUSSELL, J.M., and WATERS, J.W. (2008), The
evolution of the stratopause during the 2006 major warming:
Satellite data and assimilated meteorological analyses, J. Geo-
phys. Res.-Atmos. 113.
452 Douglas P. Drob et al. Pure Appl. Geophys.

MCLANDRESS, C., WARD, W.E., FOMICHEV, V.I., SEMENIUK, K.,
BEAGLEY, S.R., MCFARLANE, N.A., and SHEPHERD, T.G. (2006),
Large-scale dynamics of the mesosphere and lower thermo-
sphere: An analysis using the extended Canadian Middle
Atmosphere Model, J. Geophys. Res.-Atmos. 111.
MENKE, W. Geophysical Data Analysis: Discrete Inverse Theory,
Rev. edn. (Academic Press, San Diego 1989).
MILLET, C., ROBINET, J.C., and ROBLIN, C. (2007), On using com-
putational aeroacoustics for long-range propagation of
infrasounds in realistic atmospheres, Geophys. Res. Lett. 34.
NEMTCHINOV, I.V., SVETSOV, V.V., KOSAREV, I.B., GOLUB, A.P.,
POPOVA, O.P., SHUVALOV, V.V., SPALDING, R.E., JACOBS, C., and
TAGLIAFERRI, E. (1997), Assessment of kinetic energy of meteor-
oids detected by satellite-based light sensors, Icarus 130, 259–
274.
OSTASHEV, V.E., CHUNCHUZOV, I.P., and WILSON, D.K. (2005),
Sound propagation through and scattering by internal gravity
waves in a stably stratified atmosphere, J. Acoust. Soc. Am. 118,
3420–3429.
PICONE, J.M., HEDIN, A.E., DROB, D.P., and AIKIN, A.C. (2002),
NRLMSISE-00 empirical model of the atmosphere: Statistical
comparisons and scientific issues, J. Geophys. Res.-Space Phys.
107.
PIERCE, A.D. (1967), Guided infrasonic modes in a temperature-
and wind-stratified atmosphere, J. Acoust. Soc. Am. 41, 597.
PRESS, W.H. Numerical Recipes: The Art of Scientific Computing,
(Cambridge University Press, Cambridge; New York 1989).
SMITH, A.K. (1996), Longitudinal variations in mesospheric winds:
Evidence for gravity wave filtering by planetary waves, J. Atmos.
Sci. 53, 1156–1173.
(Received November 21, 2008, revised January 12, 2009, accepted April 21, 2009, Published online March 10, 2010)
Vol. 167, (2010) Temporal Morphology of Infrasound Propagation 453
Related Documents