APPROVED: Zhibing Hu, Major Professor Sushama Dandekar, Committee Member Ruthanne D. Thomas, Chair of the Department of Chemistry Sandra L. Terrell, Dean of the Robert B. Toulouse School of Graduate Studies THE SYNTHESIS AND STUDY OF POLY(N-ISOPROPYLACRYLAMIDE)/ POLY(ACRYLIC ACID) INTERPENETRATING POLYMER NETWORK NANOPARTICLE HYDROGELS Stephen Wallace Crouch, B.S. Thesis Prepared for the Degree of MASTER OF SCIENCE UNIVERSITY OF NORTH TEXAS August 2006

Welcome message from author
This document is posted to help you gain knowledge. Please leave a comment to let me know what you think about it! Share it to your friends and learn new things together.
Transcript

APPROVED:
Zhibing Hu, Major Professor Sushama Dandekar, Committee Member Ruthanne D. Thomas, Chair of the
Department of Chemistry Sandra L. Terrell, Dean of the Robert B.
Toulouse School of Graduate Studies
THE SYNTHESIS AND STUDY OF POLY(N-ISOPROPYLACRYLAMIDE)/
POLY(ACRYLIC ACID) INTERPENETRATING POLYMER
NETWORK NANOPARTICLE HYDROGELS
Stephen Wallace Crouch, B.S.
Thesis Prepared for the Degree of
MASTER OF SCIENCE
UNIVERSITY OF NORTH TEXAS
August 2006

Crouch, Stephen Wallace, The synthesis and study of poly(N-isopropylacrylamide)/
poly(acrylic acid) interpenetrating polymer network nanoparticle hydrogels. Master of
Science (Analytical Chemistry), August 2006, 32 pp., 2 tables, 11 illustrations, 6
references.
Homogeneous hydrogels made of an interpenetrating network of poly(N-
isopropylacrylamide) (PNIPAm) and poly(acrylic acid) (PAAc) are synthesized by a two-
step process; first making PNIPAm hydrogels and then interpenetrating acrylic acid
throughout the hydrogel through polymerization. The kinetic growth of the IPN is plotted
and an equation is fitted to the data.
When diluted to certain concentrations in water, the hydrogels show reversible,
inverse thermal gelation at about 34°C. This shows unique application to the medical field,
as the transition is just below body temperature. A drug release experiment is performed
using high molecular weight dyes, and a phase diagram is created through observation of
the purified, concentrated gel at varying concentrations and temperatures.

ii
Copyright 2006
by
Stephen Wallace Crouch
iii
ACKNOWLEDGMENTS
There are several people at the University of North Texas that I would like
to thank. Dr. Zhibing Hu, my graduate advisor, for his support and advice, Dr.
Sushama Dandekar, both for serving on my graduate committee, as well as
offering the class that first piqued my interest in hydrogels, and Dr. Xiaohu Xia for
his assistance and suggestions in the laboratory.
I would like to thank my parents for their constant love, as well as their
support of my education.
Finally, I would like to thank my beautiful wife and best friend, Corrie, for
her love, and for her encouragement of me in everything that I do.
iv
TABLE OF CONTENTS
Page
ACKNOWLEDGEMENTS...................................................................................iii LIST OF TABLES ............................................................................................... v LIST OF ILLUSTRATIONS.................................................................................vi LIST OF ABBREVIATIONS ...............................................................................vii Chapter
1. INTRODUCTION........................................................................... 1 2. BACKGROUND OF LASER LIGHT SCATTERING ...................... 5 3. SYNTHESIS AND LIGHT CHARACTERIZATION OF IPN
PARTICLES .................................................................................. 9 4. PHASE BEHAVIOR OF IPN NANOPARTICLES ........................ 23 5. SUMMARY.................................................................................. 27
REFERENCES................................................................................................. 32

v
LIST OF TABLES
Page
3.1 Exponential kinetic growth equation variables ....................................... 13 3.2 Beer’s law linear fit of various high molecular weight dyes .................... 17

vi
LIST OF ILLUSTRATIONS
Page
1.1 Chemical structures of NIPAm, acrylic acid, and a PNIPAm/PAAc IPN... 2
2.1 Laser light scattering................................................................................ 6
2.2 A commercial laser light scattering spectrophotometer............................ 7
3.1 Kinetic growth diagram of IPN synthesis................................................ 14
3.2 PNIPAm vs. IPN particle size weighting (early synthesis)...................... 15
3.3 PNIPAm vs. IPN particle size weighting (later synthesis) ...................... 16
3.4 Drug release curves (no control)............................................................ 18
3.5 Drug release curves (no control, 300 minutes) ...................................... 20
4.1 Dhase diagram of IPN solutions ............................................................ 24
4.2 Images of IPN solutions corresponding to phase diagram..................... 25
4.3 Plot of temperature-dependent particle size .......................................... 27

vii
LIST OF ABBREVIATIONS
APS Ammonium persulfate
BIS Methylene-bis-acrylamide
BSA Bovine serum albumin
DLS Dynamic light scattering
IPN Interpenetrating polymer networks
LLS Laser light scattering
NIPAm N-isopropylacrylamide
PAAc Poly(acrylic acid)
PBS Phosphate-buffer solution
PDI Polydispersity index
PNIPAm Poly(N-isopropylacrylamide)
Rh Hydrodynamic radius
SDS Sodium dodecyl sulfate
1
CHAPTER 1
INTRODUCTION
A gel consists of randomly crosslinked polymer chains and contains a
large amount of solvent filling interstitial spaces of the network. A commonly
recognizable gel is gelatin, where a protein is dispersed through water1. Any gel
where the medium is water can be further characterized as a hydrogel.
Hydrogels may go through reversible volume transitions based on certain
external stimuli, such as temperature and pH value2. Because of these changes,
and the compatibility of water with biological systems, hydrogels can be utilized
as sensors, for tissue replacement or engineering, separation, or drug delivery
systems3, 4.
Of specific interest are hydrogels which show reversible, inverse thermal
gelation. These are a flowable solution at a lower temperature, and above some
transition temperature, they gel. In this thesis, the synthesis and study of poly(N-
isopropylacrylamide)/ poly(acrylic acid) interpenetrating polymer network
(PNIPAm/PAAc IPN) hydrogel is discussed. The PNPAM/ PAAc IPN is
especially interesting because of its transition temperature and lower required
concentrations. At room temperature, it behaves like a liquid, but at about 33°C,
it gels. One advantage of this over commercial thermally-responsive gels is that
2
this can occur at concentrations as low as 2.5-3% (gels commercially used
currently for bio—medical applications require concentrations above 15-20%)4.
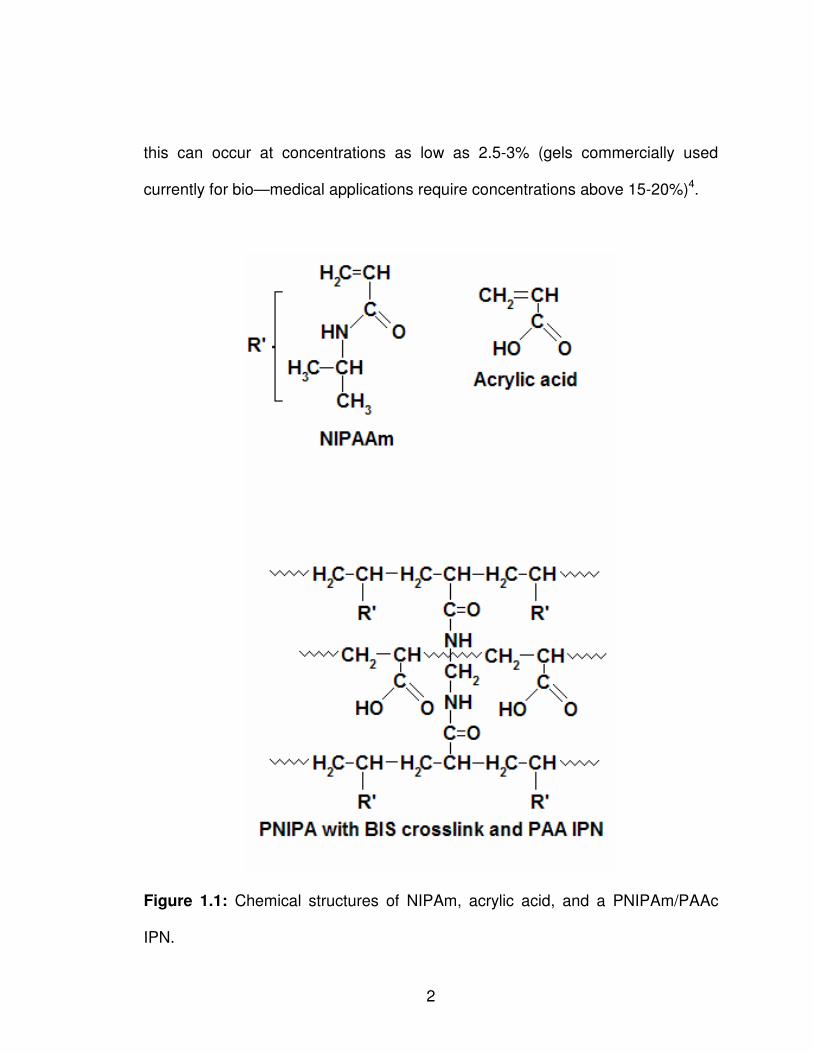
Figure 1.1: Chemical structures of NIPAm, acrylic acid, and a PNIPAm/PAAc
IPN.

3
This makes PNIPAm/PAAc IPN’s ideal for drug delivery systems, as it flows and
can be mixed with a drug and injected at room temperature, but at body
temperature, it gels and release a drug slowly through diffusion.
In this paper, I discuss my research in PNIPAm/PAAc IPNs. Chapter 2
discusses the theoretical background of dynamic laser light scattering (DLS), as
well as the instrumental setup in the laboratory. Chapter 3 discusses the
synthesis and light scattering study of the IPN nanoparticle hydrogels, as well as
drug release experiments. Chapter 4 covers the development of a concentration-
temperature phase diagram of the IPN particles. Chapter 5 summarizes the
results of the work.
4
Chapter References
1. Bunch, B.; Tesar, J. The Penguin Desk Encyclopedia of Science and
Mathematics; Penguin Putnam Reference, Inc.: New York, 2000; p. 129.
2. Tian, Q.; Zhao, X.; Tang, X.; Zhang, Y. J. Appl. Polym. Sci. 2003, 87,
2406-2413.
3. Hu, Z.; Xia, X. Adv. Mater. 2004, 16, 305-309.
4. Xia, X.; Hu, Z.; Marquez, M. J. Controlled Release. 2005, 103, 21-30.
5
CHAPTER 2
BACKGROUND OF LASER LIGHT SCATTERING
Many useful analytical techniques use some of the quantum properties of
electromagnetic radiation. It is well understood that the frequency of light can be
changed when it comes in contact with certain molecules. This frequency shift,
with the advent of monochromatic and variable light sources as well as more
advanced photo detectors, can be easily studied and valuable information can be
obtained from the molecules being studied.
When photons impinge on a molecule they can either impart energy to, or
gain energy from, the translational, rotational, vibrational, and electronic degrees
of freedom of the molecules1. This causes a frequency shift on the photons.
Therefore, the frequency spectrum of the scattered light exhibits resonances at
the frequencies corresponding to these transitions. Light scattering therefore
provides information about the energy spectra of molecules. In this paper, I
discuss only the real-time dynamics of the system, so only the translational and
rotational degrees of freedom need to be studied. This is called Rayleigh
scattering, or more commonly, dynamic light scattering.
From the semiclassical light scattering theory1, when light comes into
contact with any medium, the light’s electric field causes the electrons of the
medium being studied to polarize in an oscillating manner. This causes the
6
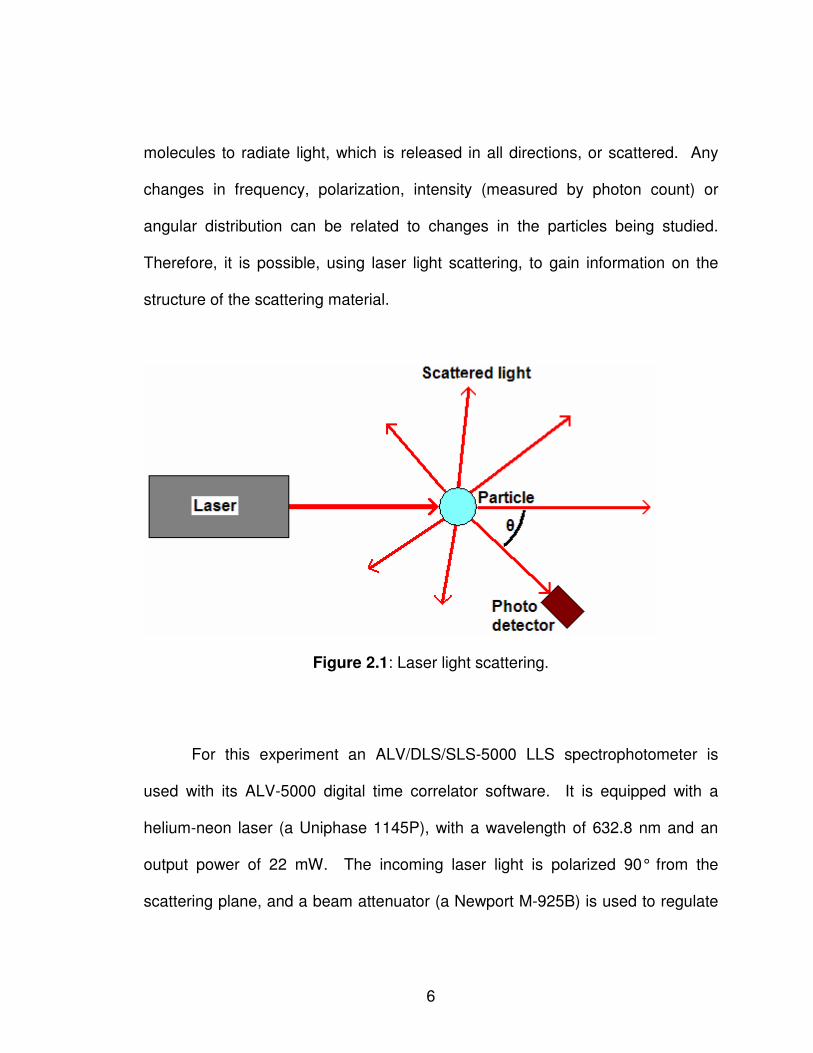
molecules to radiate light, which is released in all directions, or scattered. Any
changes in frequency, polarization, intensity (measured by photon count) or
angular distribution can be related to changes in the particles being studied.
Therefore, it is possible, using laser light scattering, to gain information on the
structure of the scattering material.
Figure 2.1: Laser light scattering.
For this experiment an ALV/DLS/SLS-5000 LLS spectrophotometer is
used with its ALV-5000 digital time correlator software. It is equipped with a
helium-neon laser (a Uniphase 1145P), with a wavelength of 632.8 nm and an
output power of 22 mW. The incoming laser light is polarized 90° from the
scattering plane, and a beam attenuator (a Newport M-925B) is used to regulate
7
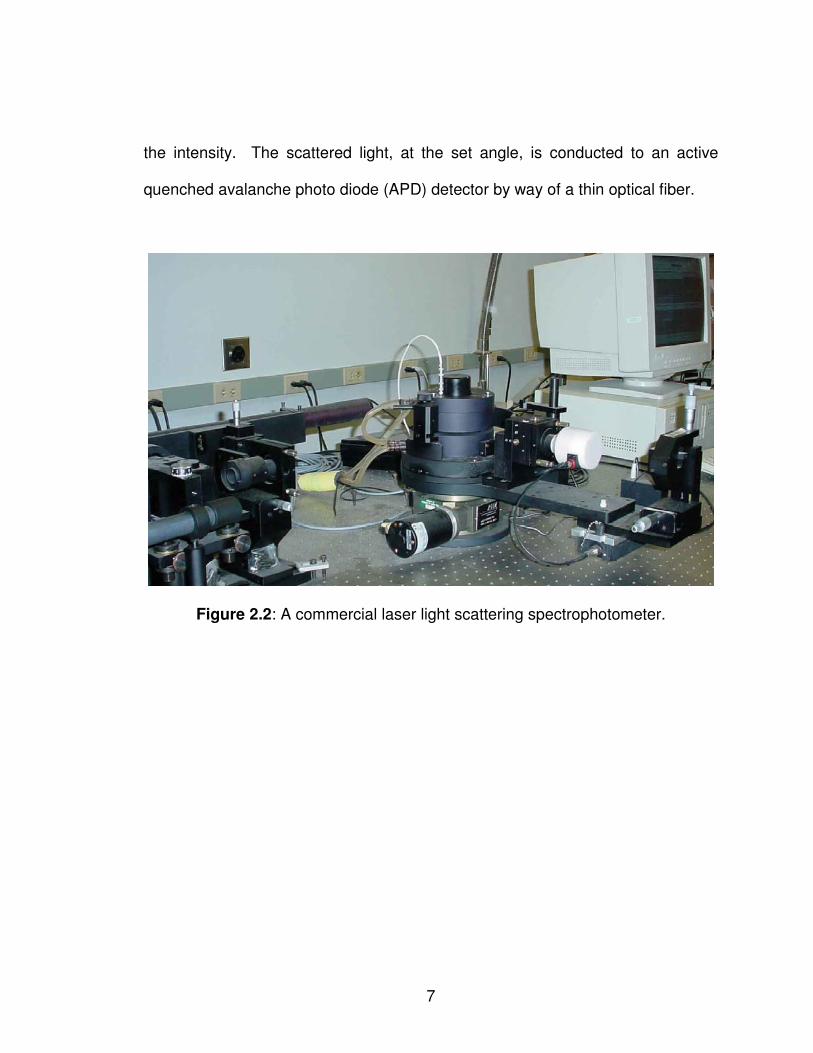
the intensity. The scattered light, at the set angle, is conducted to an active
quenched avalanche photo diode (APD) detector by way of a thin optical fiber.
Figure 2.2: A commercial laser light scattering spectrophotometer.
8
Chapter References:
1. Berne, B.J., Pecora, R. Dynamic Light Scattering; John Wiley & Sons, Inc:
New York, 1976, Reprinted and copyright now held by Dover Publications:
Mineola, NY, 2000

9
CHAPTER 3
SYNTHESIS AND LIGHT CHARACTERISTICS OF INTERPENETRATING
POLYMER NETWORKS (IPN) NANOPARTICLES
Introduction
Nanoparticles composed of poly (N-isopropylacrylamide) (PNIPAm) with
an interpenetrating network of poly (acrylic acid) (PAAc) were created in the
manner described below. These polymers were selected because their
combination showed desirable phase transitions at temperatures near normal
body temperatures. When created in solution, the particles are believed to be
almost homogeneous, leaving only small interparticle spacing. This is desirable
since larger spaces would not release a liquid in as controlled a manner as small
spaces. This is also why a final interpenetrating polymer network (IPN) particle
size of 75-85 nm is desired at a neutral pH; a smaller particle would release a
mixed drug more slowly than a particle size of 150 nm or more.
Experimental Details
Materials: N-isopropylacrylamide is purchased from Polysciences, Inc. N,N’-
methylenebisacrylamide is purchased from Bio-Rad Laboratories. Dodecyl
sulfate, sodium salt 98%, potassium persulfate 99+%, ammonium persulfate
98+%, acrylic acid 99%, N,N,N’,N’-Tetramethylethylenediamine 99%, Sodium

10
hydroxide 97+% were purchased from Sigma-Aldrich. Water for sample
preparation is distilled and deionized to a resistance of 18.2 MΩ by a MILLIPORE
system, and filtered through a 0.22µm filter to remove particulate matter.
PNIPAm microgel synthesis: The polymerization of PNIPAm is carried out in a
500 mL flask equipped with a magnetic stirrer and a nitrogen feed: 3.8 g N-
isopropylacrylamide (NIPA), 0.066 g N,N’-methylenebisacrylamide (BIS) and
0.15 g sodium dodecyl sulfate (SDS) were diluted to 240 g with distilled water
under continuous stirring for one hour. The solution is placed under nitrogen
purging for 40 min before being placed into 70°C hot bath. Potassium persulfate
(0.166 grams), which had been dissolved in 20 ml water, is then added to initiate
the emulsion polymerization. The reaction last for 4 hours under nitrogen
atmosphere, and temperature is kept at (70±0.5)°C throughout. Controlling the
amount of surfactant regulates the final PNIPAm microgel size: a smaller
nanoparticle size can be achieved by using larger amounts of the emulsifier SDS.
PNIPAm nanoparticles with a hydrodynamic radius (Rh) of 50 nm where prepared
for the next step, IPN synthesis.
All PNIPAm particles were purified via dialysis (Spectra/Por® 7 dialysis
membrane, MWCO 10’000, VWR) against frequent changes of H2O for 2 weeks
at room temperature. The final PNIPAm concentrations were determined using
the evaporation method.

11
IPN microgel synthesis: The preparation of IPN nanoparticles are based on the
above PNIPAm microgels: A PNIPAm microgel solution containing 0.297 g
polymer is diluted to 365 g with distilled water. 0.5 g N,N’-
methylenebisacrylamide (BIS) and 2.3 g acrylic acid were then added. The
solution is deaerated for 1 hour with nitrogen bubbling. The initiator (0.2 g
potassium persulfate) and accelerator (0.2 g TEMED) were separately dissolved
in water and added rapidly to the solution, making the final solution volume into
approximately 375 ml. The reaction continued for 29 min under nitrogen
atmosphere, and the temperature is well regulated at (21±0.5) °C with a water
bath. The reaction is halted by removing the N2 and placing the flask in an ice
bath, while stirring under a normal atmosphere. The ideal particle size had an Rh
of 75-85 nm. To determine kinetic information, this reaction is repeated at
(19±0.5)°C and (23±0.5)°C. 2 ml samples were taken from the flask at varying
times throughout the reaction for all three temperatures. These were then
neutralized with sodium hydroxide to a pH of 7, and the Rh is determined using
light scattering.
The IPN nanoparticle solution is purfied via dialysis (Spectra/Por® 7
dialysis membrane, MWCO 10’000, VWR) against frequent changes of distilled
water for 2 weeks at room temperature. Evaporation at 70°C is used to adjust
the concentration of the IPN solution. When the desired concentration is
reached, an aqueous sodium hydroxide solution is used to neutralize the IPN
solution.

12
A drug release experiment is also performed, using the following procedure:
Materials: 2 MDa Blue Dextran fluorescent dye is purchased from Sigma-Aldrich.
40 kDa Texas Red® dextran fluorescent dye and Bovine Serum Albumin (BSA)
were purchased from Molecular Probes. 500 kDa Fluorescein isothiocyanate
Dextran fluorescent dye is purchased from Fluka.
Procedure: 4 - 1.00 g samples of IPN solution at 8% wt were placed into 1 cm
diameter cuvettes. 0.025 g of drug analog dyes (40kDa, 500kDa, and 2MDa
Dextrans and BSA [67 kDa] ) at a 4000 ppm concentration were added. They
were well mixed, then placed into a 37°C water bath for 30 minutes. 4 resealable
20 mL vials were prepared with 10.00 g of phosphate-buffered saline (PBS)
solution in each vial. These were placed in a 37°C circulating refrigerated bath
for 30 minutes. The IPN samples were then forced out of the cuvettes using a
syringe and heated purified water. Each gel is collected and placed into a vial
containing the PBS. These were returned to the circulating refrigerated bath.
Absorbance measurements (from wavelengths of 200 to 1100 nm) were made
with an Agilent 8453 UV-Vis Spectrometer with a 1-cm optical path length quartz
cell. The measurements were made at regular intervals, measured in minutes
from when the gel is placed in solution for the samples, using the PBS solution
for the background subtraction. Using Beer’s law, one can determine the
concentration of the dye in solution after creating a calibration curve.
13
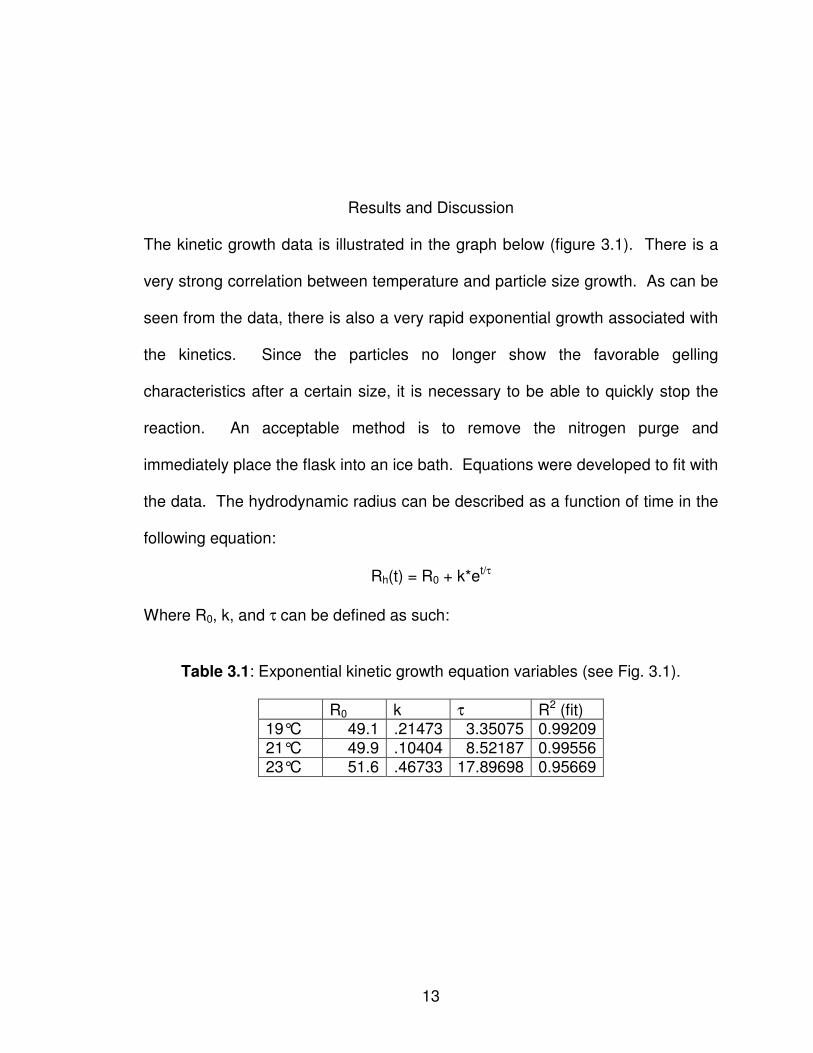
Results and Discussion
The kinetic growth data is illustrated in the graph below (figure 3.1). There is a
very strong correlation between temperature and particle size growth. As can be
seen from the data, there is also a very rapid exponential growth associated with
the kinetics. Since the particles no longer show the favorable gelling
characteristics after a certain size, it is necessary to be able to quickly stop the
reaction. An acceptable method is to remove the nitrogen purge and
immediately place the flask into an ice bath. Equations were developed to fit with
the data. The hydrodynamic radius can be described as a function of time in the
following equation:
Rh(t) = R0 + k*et/τ
Where R0, k, and τ can be defined as such:
Table 3.1: Exponential kinetic growth equation variables (see Fig. 3.1).
R0 k τ R2 (fit) 19°C 49.1 .21473 3.35075 0.99209 21°C 49.9 .10404 8.52187 0.99556 23°C 51.6 .46733 17.89698 0.95669

14
Figure 3.1: Kinetic growth diagram of IPN synthesis at 19°, 21°, and 23°C.
Dynamic light scattering is performed on the samples both between the
two reactions, as well as after the second. Figure 3.2 shows the DLS
hydrodynamic radii correlation diagram for both the 50 nm PNIPAm as well as
the 83 nm IPN.
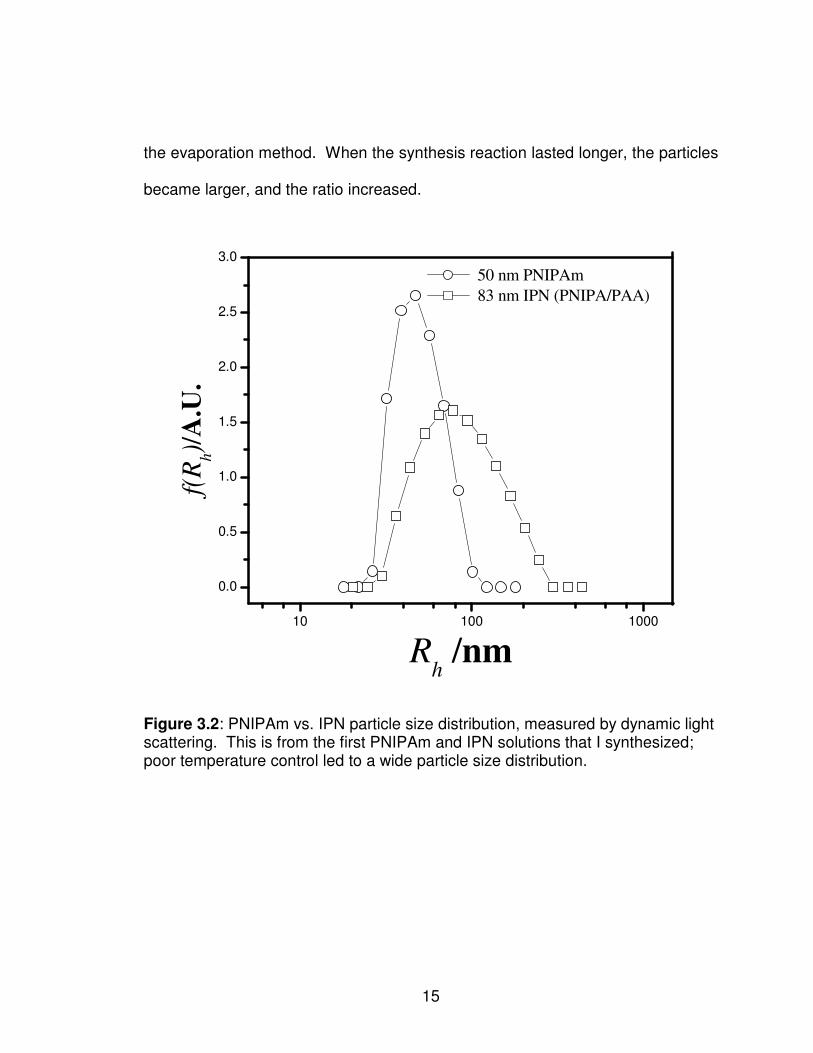
The weight ratio of PAAc to PNIPAm in the 75 nm IPN nanoparticle
solutions is determined to be 0.25:1. This measurement is performed through
15
the evaporation method. When the synthesis reaction lasted longer, the particles
became larger, and the ratio increased.
10 100 1000
0.0
0.5
1.0
1.5
2.0
2.5
3.0
f(R
h)/
A.U
.
Rh /nm
50 nm PNIPAm
83 nm IPN (PNIPA/PAA)
Figure 3.2: PNIPAm vs. IPN particle size distribution, measured by dynamic light scattering. This is from the first PNIPAm and IPN solutions that I synthesized; poor temperature control led to a wide particle size distribution.

16
10 100 1000
0.0
0.2
0.4
0.6
0.8
1.0
1.2
1.4
1.6
1.8
2.0
2.2
2.4
2.6
f(R
h)/
A.U
.
Rh/nm
63 nm PNIPAm
81 nm IPN
Figure 3.3: PNIPAm vs. IPN particle size distribution, measured by dynamic light scattering. These are some of the later synthesized gels, which had much better temperature control, leading to a narrow particle size distribution.
17
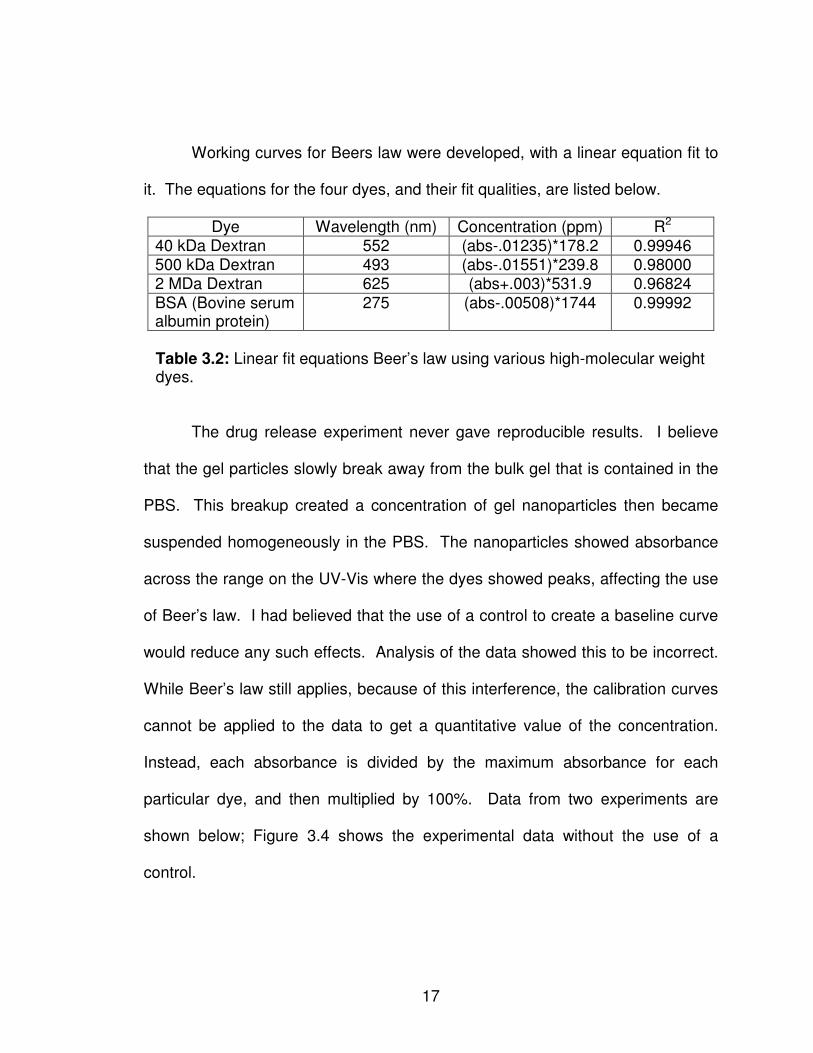
Working curves for Beers law were developed, with a linear equation fit to
it. The equations for the four dyes, and their fit qualities, are listed below.
Dye Wavelength (nm) Concentration (ppm) R2 40 kDa Dextran 552 (abs-.01235)*178.2 0.99946 500 kDa Dextran 493 (abs-.01551)*239.8 0.98000 2 MDa Dextran 625 (abs+.003)*531.9 0.96824 BSA (Bovine serum albumin protein)
275 (abs-.00508)*1744 0.99992
Table 3.2: Linear fit equations Beer’s law using various high-molecular weight
dyes.
The drug release experiment never gave reproducible results. I believe
that the gel particles slowly break away from the bulk gel that is contained in the
PBS. This breakup created a concentration of gel nanoparticles then became
suspended homogeneously in the PBS. The nanoparticles showed absorbance
across the range on the UV-Vis where the dyes showed peaks, affecting the use
of Beer’s law. I had believed that the use of a control to create a baseline curve
would reduce any such effects. Analysis of the data showed this to be incorrect.
While Beer’s law still applies, because of this interference, the calibration curves
cannot be applied to the data to get a quantitative value of the concentration.
Instead, each absorbance is divided by the maximum absorbance for each
particular dye, and then multiplied by 100%. Data from two experiments are
shown below; Figure 3.4 shows the experimental data without the use of a
control.
18
0 1440 2880 4320 5760 7200 8640 10080
20
40
60
80
100
2 MDa Dextran
Perc
en
t R
ele
ase
d (
% o
f m
axim
um
co
ncen
tra
tio
n)
Time (minutes)
0 1440 2880 4320 5760 7200 8640 10080
20
40
60
80
100
500 kDa Dextran
Pe
rce
nt R
ele
ase
d (
% o
f m
axim
um
co
nce
ntr
ation
)
Time (minutes)
0 1440 2880 4320 5760 7200 8640 10080
20
40
60
80
100
40 kDa Dextran
Pe
rce
nt R
ele
ase
d (
% o
f m
axim
um
co
nce
ntr
atio
n)
Time (minutes)
0 1440 2880 4320 5760 7200 8640 10080 11520
0
20
40
60
80
100
bSA Protein
Pe
rce
nt
Re
lea
se
d (
% o
f m
axim
um
co
nce
ntr
atio
n)
Time (minutes)
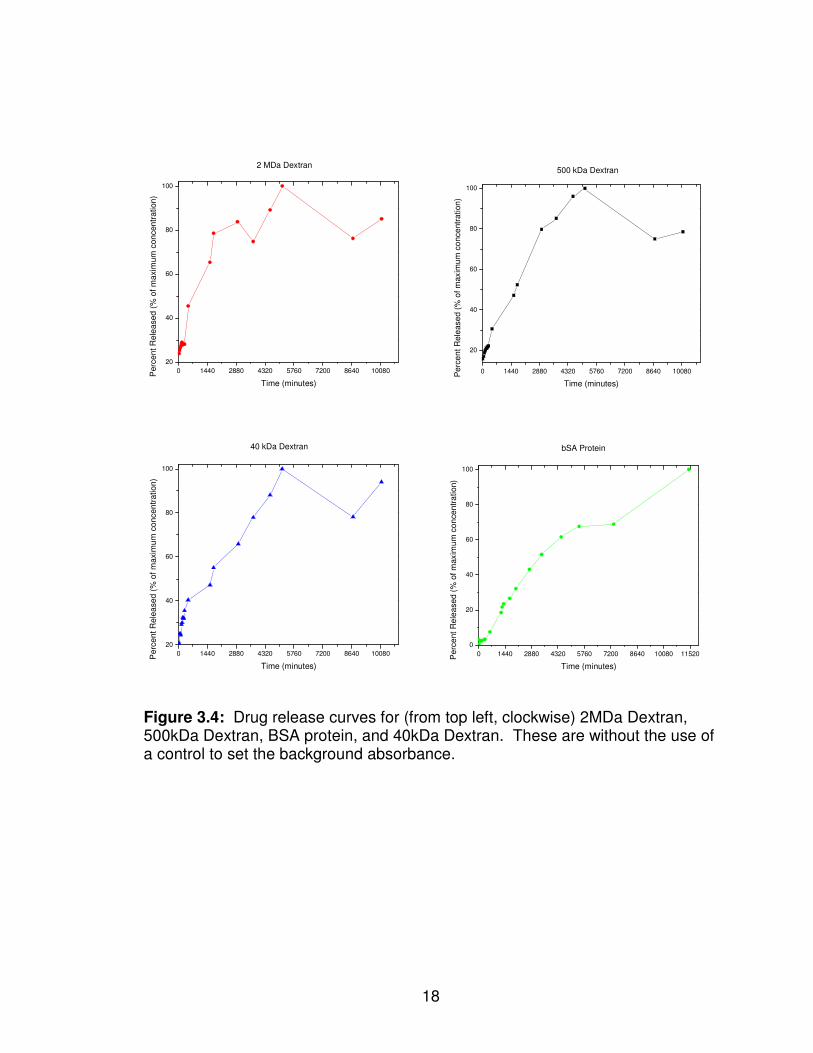
Figure 3.4: Drug release curves for (from top left, clockwise) 2MDa Dextran, 500kDa Dextran, BSA protein, and 40kDa Dextran. These are without the use of a control to set the background absorbance.
19
Conclusion
A final IPN particle size of 75-85 nm is desired at a neutral pH. The
PNIPAm size could be easily and reproducibly controlled by the concentration of
SDS in the synthesis solution. The challenge is controlling the size of the IPN.
This is found to be very dependent on both temperature and time. The growth of
the PAAc IPN is exponential with time and the time it took the reaction to show
growth is highly dependent on the temperature. The best results were at a
temperature of 21°C. At 19°C, it took too long to begin the reaction, and at 23°C,
the reaction occurred too rapidly, and it is difficult to control the final size. To get
the IPN final hydrodynamic radius to 75 nm, the reaction lasted 29 minutes.
The drug release experiment is not as successful as would have been
liked, but the original release experiment gave acceptable results compared to
the experiment using a control. I believe that the absorption interference from
the IPN nanoparticles is so much higher than that of the dye that good
quantitation measurements could not be collected. The release of nanoparticles
into the solution would also have been somewhat random, yielding absorbance
values that varied between the samples, especially at longer times.
From the experiment without a control, release profiles were not as
expected over the entire range (see figure 3.4). The largest Dextran (2 MDa) is
released the fastest, about 24 hours for 80% release. The next largest Dextran
(500 kDa) took about 48 hours to release about 80%, and the lightest Dextran

20
(40 kDa) took about 72 hours to release about 80%. BSA protein (with a
molecular weight of 67 kDa) indicated an even slower release, about 144 hours
for 80% release. However, looking closer (for the first 5 hours; figure 3.5), with
the equations for Beer’s law used, and adjusting the first concentration (at about
30 minutes) to zero yields data as expected, with the lower molecular weight
dextrans being released more rapidly:
0 50 100 150 200 250 300
0
1
2
3
4
5
Co
nce
ntr
ation
(pp
m)
Time (minutes)
2 MDa Dextran
500 kDa Dextran
40 kDa Dextran
Figure 3.5: Release of 2MDa, 500kDa, and 40kDa dextrans in the first 5 hours.
21
The data scattering of these experiments show that the procedure needs
to be modified to give more consistent results. Another experiment performed by
others in my research group found that drying the gel before placing it in the
buffer gave better results1.

22
Chapter References
1. Hu, Z.; Xia, X.; Marquez, M.; Weng, H.; Tang, L. Macromol. Symp.
2005, 227, 275-284.

23
CHAPTER 4
PHASE BEHAVIOR OF IPN NANOPARTICLES
The behavior of interpenetrating polymer network (IPN) nanoparticles with
respect to changes in temperature is of great interest to this thesis. An
experiment is performed to determine the phase behavior of aqueous IPN
solutions ranging from 1 wt % in water to 8 wt % in water, in 0.5 % intervals.
These were placed in an incubator at varying temperatures from 20°C to 45°C.
The samples were studied by visual inspection, and a phase diagram is
developed (figure 4.1). This shows that the phase transition from liquid to gelled
is around 32-35°C, depending on the IPN concentration. There is apparently
some interaction that takes place between the IPN particles at a concentration
between 2.5 and 3.0 wt %, to account from the loss of a slight blue color. One
possible explanation for this could be due to intramolecular interactions. At the
lower temperatures, the IPN is contracted, and, when at the lower concentration,
each particle has little contact with the neighboring particles. As the
concentration goes up, there are some intramolecular interactions that could lead
to the color loss. As the temperature rises, the particle size increases, which
would increase the interactions at higher temperatures. The ordered matrix that
had been in place before the temperature rose is disrupted as the particles grow.
This could explain the return of the blue color in the blue viscous liquid and

24
Figure 4.1: Phase diagram of IPN solutions. See Figure 4.2 for images related to diagram.
25
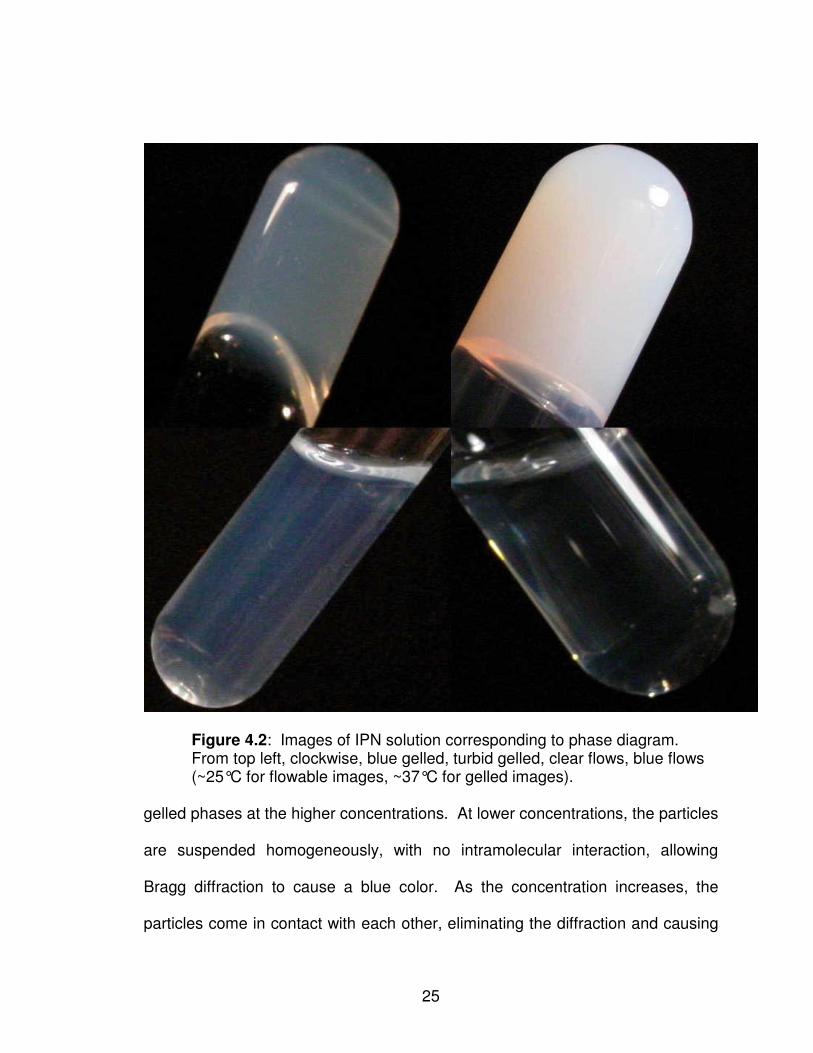
Figure 4.2: Images of IPN solution corresponding to phase diagram. From top left, clockwise, blue gelled, turbid gelled, clear flows, blue flows (~25°C for flowable images, ~37°C for gelled images).
gelled phases at the higher concentrations. At lower concentrations, the particles
are suspended homogeneously, with no intramolecular interaction, allowing
Bragg diffraction to cause a blue color. As the concentration increases, the
particles come in contact with each other, eliminating the diffraction and causing
26
the light to pass through uninhibited. At the higher temperatures and a higher
concentration, the particles have more interaction due to the interpenetrating
poly(acrylic acid) network, causing an absorption of light and the white color.
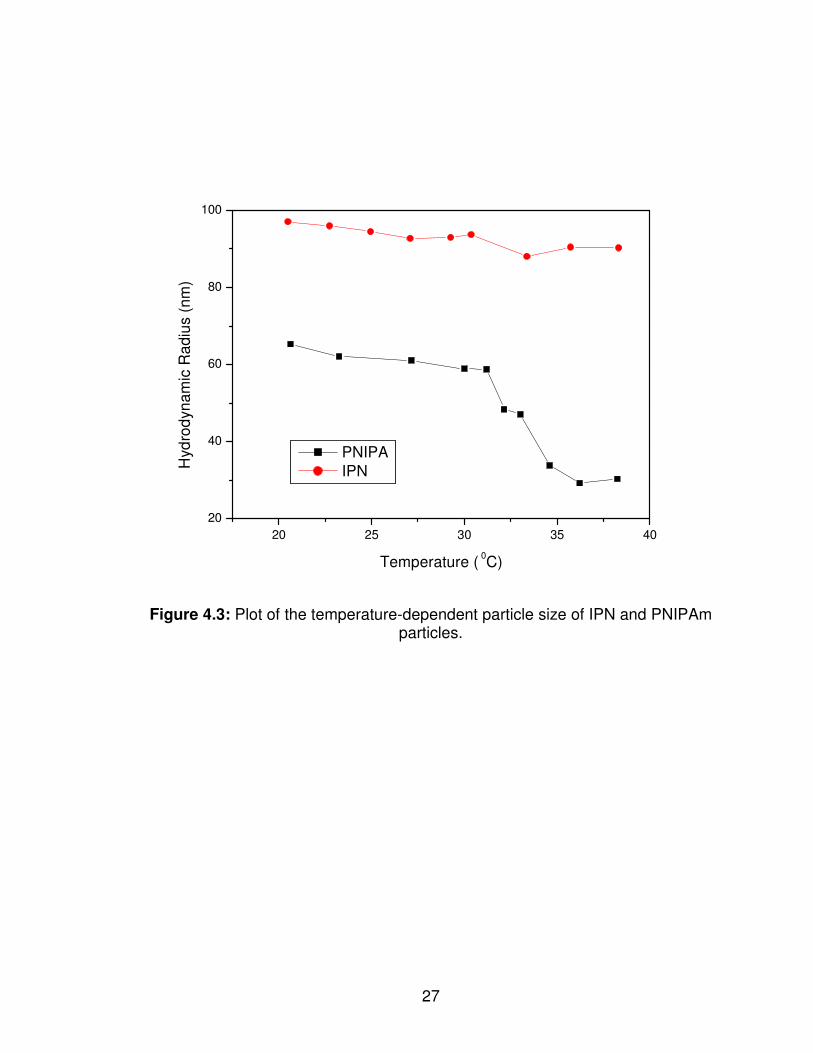
An experiment is performed to show the increase of the particle size with
temperature. Samples of poly (N-isopropylacrylamide) (PNIPAm) and IPN were
diluted in purified water and placed in a test tube, which, in turn, is placed into the
laser light scattering instrument. A circulating water bath is used to control the
temperature of the sample holder and the sample is allowed to stabilize at the
new temperature for 10 minutes. The particle size is then determined using
dynamic light scattering (DLS). The results can be seen in figure 4.3.
27
20 25 30 35 40
20
40
60
80
100
H
yd
rod
yn
am
ic R
ad
ius (
nm
)
Temperature ( 0C)
PNIPA
IPN
Figure 4.3: Plot of the temperature-dependent particle size of IPN and PNIPAm
particles.
28
CHAPTER 5
SUMMARY
Interpenetrating nanoparticle hydrogels that show inverse thermal gelation
have been developed with varying ranges of glass transition temperatures.
These have a wide range of novel applications, some of the most exciting being
in the medical field. They have shown promise as biomedical sensors, support
for tissue growth, and most applicable to this paper, drug delivery. Poly (N-
isopropylacrylamide) / poly (acrylic acid) interpenetrating polymer networks
(PNIPAm/PAAc IPNs) synthesized for this paper show transition temperatures
above room temperature and below body temperature, making them ideal for
these purposes. After the gel is synthesized, purified and concentrated, it can be
mixed with a drug, which would be suspended in between the nanoparticles of
the gel. It could then be inserted into the body, where the drug would slowly
diffuse out. Experiments summarized in this paper show that the IPN gels have
the ability to hold dyes with physical characteristics similar to some drugs, and
then release them in a controlled manner.
Additional studies have been performed and show that gels like this show
very little immune response, and give good release characteristics for high
molecular weight dyed dextrans in a water solution1. Products such as this could
be applied to diseases that need continuous treatment, such as diabetes,
Parkinson’s disease and Alzheimer’s disease. This is currently being used

29
commercially in the form of “triblocks,” triblock polymers composed of
poly(ethylene oxide)-poly(propylene oxide)-poly(ethylene oxide). These
solutions, however, require concentrations above 15-20%2.
PNIPAm/PAAc IPN particles were synthesized using the seed-and-feed
method. A solution of 50 nm PNIPAm particles is synthesized through
precipitation polymerization. This solution is then used as the ‘seeds’ in the
poly(acrylic acid) reaction. The advantage of this gel is that it shows inverse-
thermal gelation at body temperature at concentrations as low as 2.5% to 3%.
The kinetic growth of IPN particles based off of 50 nm PNIPAm particles is
studied and growth equations are determined; the most desirable reaction
temperature of 21°C give a particle size kinetic equation of
RH 49.9 nm⋅ 0.104nm e
t
8.522min⋅+
A phase diagram has also been developed that could assist in the
development of sensors using IPN gels. Additionally, it could help to give a
better understanding of the mechanism of the PNIPAm/PAAc IPN hydrogel. A
possible explanation of the color change properties has also been suggested,
and accompanied with a temperature-dependent particle size plot of PNIPAm
and IPN. With a better understanding of the mechanisms involved in the phase
transitions of the IPN gel, new synthesis methods could potentially be developed,
producing higher purity gels, insights into successful bulk manufacturing or

30
perhaps yielding an IPN gel with smaller particle sizes and higher crosslinking,
giving better drug release characteristics.
31
Chapter References
1. Hu, Z.; Xia, X.; Marquez, M.; Weng, H.; Tang, L. Macromol. Symp. 2005,
227, 275-284.
2. Xia, X.; Hu, Z.; Marquez, M. J. Controlled Release. 2005, 103, 21-30.

32
REFERENCES
Berne, B.J., Pecora, R. Dynamic Light Scattering; John Wiley & Sons, Inc: New
York, 1976, Reprinted and copyright now held by Dover Publications:
Mineola, NY, 2000
Bunch, B.; Tesar, J. The Penguin Desk Encyclopedia of Science and
Mathematics; Penguin Putnam Reference, Inc.: New York, 2000; p. 129.
Hu, Z.; Xia, X. Adv. Mater. 2004, 16, 305-309.
Hu, Z.; Xia, X.; Marquez, M.; Weng, H.; Tang, L. Macromol. Symp. 2005, 227,
275-284.
Tian, Q.; Zhao, X.; Tang, X.; Zhang, Y. J. Appl. Polym. Sci. 2003, 87, 2406-2413.
Xia, X.; Hu, Z.; Marquez, M. J. Controlled Release. 2005, 103, 21-30.
Related Documents


![Synthesis and Phase Behavior of Poly(N-isopropylacrylamide ... · for use in controlled drug delivery [1–3], cell-sheet engineering [4–7], as a biosensor [8–10] ... the reverse](https://static.cupdf.com/doc/110x72/5cdf0c6288c993d22e8b5942/synthesis-and-phase-behavior-of-polyn-isopropylacrylamide-for-use-in-controlled.jpg)

