The Synergistic Combination of the Farnesyl Transferase Inhibitor Lonafarnib and Paclitaxel Enhances Tubulin Acetylation and Requires a Functional Tubulin Deacetylase Adam I. Marcus, 1 Jun Zhou, 1 Aurora O’Brate, 1 Ernest Hamel, 2 Jason Wong, 3 Michael Nivens, 1 Adel El-Naggar, 4 Tso-Pang Yao, 5 Fadlo R. Khuri, 1 and Paraskevi Giannakakou 1 1 Winship Cancer Institute, Emory University School of Medicine, Atlanta, Georgia; 2 Screening Technologies Branch, Developmental Therapeutic Program, Division of Cancer Treatment and Diagnosis, National Cancer Institute, NIH, Frederick, Maryland; 3 Harvard University, Cambridge, Massachusetts; 4 The University of Texas M.D. Anderson Cancer Center, Houston, Texas; and 5 Department of Pharmacology and Cancer Biology, Duke University, Durham, North Carolina Abstract Farnesyl transferase (FT) inhibitors (FTI) are anticancer agents developed to target oncogenic Ras proteins by inhibiting Ras farnesylation. FTIs potently synergize with paclitaxel and other microtubule-stabilizing drugs; however, the mechanistic basis underlying this synergistic interaction remains elusive. Here we show that the FTI lonafarnib affects the microtubule cytoskeleton resulting in microtubule bundle formation, increased microtubule stabilization and acetyla- tion, and suppression of microtubule dynamics. Notably, treatment with the combination of low doses of lonafarnib with paclitaxel markedly enhanced tubulin acetylation (a marker of microtubule stability) as compared with either drug alone. This synergistic effect correlated with FT inhibition and was accompanied by a synergistic increase in mitotic arrest and cell death. Mechanistically, we show that the combination of lonafarnib and paclitaxel inhibits the in vitro deacetylating activity of the only known tubulin deacetylase, histone deacetylase 6 (HDAC6). In addition, the lonafarnib/taxane combination is synergistic only in cells lines expressing the wild-type HDAC6, but not a catalytic-mutant HDAC6, revealing that functional HDAC6 is required for the synergy of lonafarnib with taxanes. Furthermore, tubacin, a specific HDAC6 inhibitor, synergistically enhanced tubulin acetylation in combination with paclitaxel, similar to the combination of lonafarnib and paclitaxel. Taken together, these data suggest a relationship between FT inhibition, HDAC6 function, and cell death, providing insight into the putative molecular basis of the lonafarnib/taxane synergistic antiproliferative combination. (Cancer Res 2005; 65(9): 3883-93) Introduction Farnesyl transferase (FT) inhibitors (FTI) are a novel class of antineoplastic agents that have high antitumor activity and are currently in clinical trials (1–3). These agents inhibit the FT enzyme, which posttranslationally modifies proteins by the addition of a 15- carbon farnesyl group. The initial driving force behind FTI development was based on the finding that oncogenic Ras, a low molecular weight GTPase, induces malignant transformation upon addition of a farnesyl group to its COOH terminus by the FTase. This in turn allows it to localize to the plasma membrane and acts as a relay switch by transducing biological information from extracel- lular signals to the nucleus ( for review see ref. 4). Because Ras farnesylation is required for Ras membrane localization, FTase became an attractive target for new anticancer agents (5–7). Furthermore, based on the finding that oncogenic Ras mutations are found in 30% of all human cancers (8, 9), it was hypothesized that tumor growth could be inhibited by preventing Ras farnesylation. Thus, FTIs were developed as targeted agents against Ras and were shown to inhibit Ras function (10) as well as possess potent antitumor activity in multiple cancer cell lines and animal models. Despite the initial hypothesis that FTIs inhibit tumor growth by inhibiting Ras farnesylation, it was later shown that FTIs show antitumor activity independent of Ras status (11–13), suggesting that the mechanism of FTI activity extends beyond the inhibition of Ras farnesylation (14). To probe the molecular mechanisms of FTI action, some previous works have focused on the relationship between FTIs and microtubule-targeting agents. Microtubules are dynamic polymers composed of a- and h-tubulin subunits that elongate and shorten. In the cell, they function in a variety of processes including cell division, cell signaling, and intracellular trafficking (reviewed in ref. 15). Because microtubules are essential compo- nents of the cell division machinery, they are attractive and validated targets for anticancer therapy (16, 17) as evidenced by the clinical success of microtubule-targeting drugs such as taxanes (18–20). More recently, epothilones, a new class of microtubule- targeting drugs, are in clinical development and show very positive preliminary results (21). Notably, FTIs in combination with paclitaxel or epotholines act synergistically to inhibit cell growth in numerous human cancer cell lines and xenograft models (14, 22–24). In addition, a combination clinical study of the FTI lonafarnib (SCH66336 or sarasar) with paclitaxel yielded impressive preliminary results, with partial responses in 8 of 20 evaluable patients, including patients whose disease had previously pro- gressed while on taxanes alone (25). Despite these promising results, the molecular mechanism of the synergistic interaction of FTIs with taxanes is unknown. The synergy between taxanes and FTIs suggests that there may be a link between microtubules and the mechanism of FTI action. This is further supported by studies showing that FTI-2153 inhibited normal bipolar microtubule spindle formation, suggesting that spindle microtubules may have been affected by this treatment (26–28). These FTI-treated cells were arrested in early mitosis and this effect was independent of p53 and Ras status. Nevertheless, the effects of FTI treatment on interphase microtubules have not been examined. Note: Supplementary data for this article are available at Cancer Research Online (http://cancerres.aacrjournals.org/). Requests for reprints: Paraskevi Giannakakou Winship Cancer Institute, Emory University School of Medicine, Room D4054, 1365C Clifton Road, Atlanta, GA 30322. E-mail: [email protected]. I2005 American Association for Cancer Research. www.aacrjournals.org 3883 Cancer Res 2005; 65: (9). May 1, 2005 Research Article

Welcome message from author
This document is posted to help you gain knowledge. Please leave a comment to let me know what you think about it! Share it to your friends and learn new things together.
Transcript
The Synergistic Combination of the Farnesyl Transferase Inhibitor
Lonafarnib and Paclitaxel Enhances Tubulin Acetylation and
Requires a Functional Tubulin Deacetylase
Adam I. Marcus,1Jun Zhou,
1Aurora O’Brate,
1Ernest Hamel,
2Jason Wong,
3Michael Nivens,
1
Adel El-Naggar,4Tso-Pang Yao,
5Fadlo R. Khuri,
1and Paraskevi Giannakakou
1
1Winship Cancer Institute, Emory University School of Medicine, Atlanta, Georgia; 2Screening Technologies Branch, DevelopmentalTherapeutic Program, Division of Cancer Treatment and Diagnosis, National Cancer Institute, NIH, Frederick, Maryland; 3HarvardUniversity, Cambridge, Massachusetts; 4The University of Texas M.D. Anderson Cancer Center, Houston, Texas; and 5Department ofPharmacology and Cancer Biology, Duke University, Durham, North Carolina
Abstract
Farnesyl transferase (FT) inhibitors (FTI) are anticanceragents developed to target oncogenic Ras proteins byinhibiting Ras farnesylation. FTIs potently synergize withpaclitaxel and other microtubule-stabilizing drugs; however,the mechanistic basis underlying this synergistic interactionremains elusive. Here we show that the FTI lonafarnib affectsthe microtubule cytoskeleton resulting in microtubule bundleformation, increased microtubule stabilization and acetyla-tion, and suppression of microtubule dynamics. Notably,treatment with the combination of low doses of lonafarnibwith paclitaxel markedly enhanced tubulin acetylation (amarker of microtubule stability) as compared with either drugalone. This synergistic effect correlated with FT inhibition andwas accompanied by a synergistic increase in mitotic arrestand cell death. Mechanistically, we show that the combinationof lonafarnib and paclitaxel inhibits the in vitro deacetylatingactivity of the only known tubulin deacetylase, histonedeacetylase 6 (HDAC6). In addition, the lonafarnib/taxanecombination is synergistic only in cells lines expressing thewild-type HDAC6, but not a catalytic-mutant HDAC6, revealingthat functional HDAC6 is required for the synergy oflonafarnib with taxanes. Furthermore, tubacin, a specificHDAC6 inhibitor, synergistically enhanced tubulin acetylationin combination with paclitaxel, similar to the combination oflonafarnib and paclitaxel. Taken together, these data suggest arelationship between FT inhibition, HDAC6 function, and celldeath, providing insight into the putative molecular basis ofthe lonafarnib/taxane synergistic antiproliferative combination.(Cancer Res 2005; 65(9): 3883-93)
Introduction
Farnesyl transferase (FT) inhibitors (FTI) are a novel class ofantineoplastic agents that have high antitumor activity and arecurrently in clinical trials (1–3). These agents inhibit the FTenzyme,which posttranslationally modifies proteins by the addition of a 15-carbon farnesyl group. The initial driving force behind FTIdevelopment was based on the finding that oncogenic Ras, a lowmolecular weight GTPase, induces malignant transformation upon
addition of a farnesyl group to its COOH terminus by the FTase. Thisin turn allows it to localize to the plasma membrane and acts as arelay switch by transducing biological information from extracel-lular signals to the nucleus ( for review see ref. 4).Because Ras farnesylation is required for Ras membrane
localization, FTase became an attractive target for new anticanceragents (5–7). Furthermore, based on the finding that oncogenic Rasmutations are found in 30% of all human cancers (8, 9), it washypothesized that tumor growth could be inhibited by preventingRas farnesylation. Thus, FTIs were developed as targeted agentsagainst Ras and were shown to inhibit Ras function (10) as well aspossess potent antitumor activity in multiple cancer cell lines andanimal models. Despite the initial hypothesis that FTIs inhibittumor growth by inhibiting Ras farnesylation, it was later shownthat FTIs show antitumor activity independent of Ras status (11–13),suggesting that the mechanism of FTI activity extends beyond theinhibition of Ras farnesylation (14).To probe the molecular mechanisms of FTI action, some
previous works have focused on the relationship between FTIsand microtubule-targeting agents. Microtubules are dynamicpolymers composed of a- and h-tubulin subunits that elongateand shorten. In the cell, they function in a variety of processesincluding cell division, cell signaling, and intracellular trafficking(reviewed in ref. 15). Because microtubules are essential compo-nents of the cell division machinery, they are attractive andvalidated targets for anticancer therapy (16, 17) as evidenced by theclinical success of microtubule-targeting drugs such as taxanes(18–20). More recently, epothilones, a new class of microtubule-targeting drugs, are in clinical development and show very positivepreliminary results (21). Notably, FTIs in combination withpaclitaxel or epotholines act synergistically to inhibit cell growthin numerous human cancer cell lines and xenograft models(14, 22–24). In addition, a combination clinical study of the FTIlonafarnib (SCH66336 or sarasar) with paclitaxel yielded impressivepreliminary results, with partial responses in 8 of 20 evaluablepatients, including patients whose disease had previously pro-gressed while on taxanes alone (25). Despite these promisingresults, the molecular mechanism of the synergistic interaction ofFTIs with taxanes is unknown.The synergy between taxanes and FTIs suggests that there may be
a link between microtubules and the mechanism of FTI action. This isfurther supported by studies showing that FTI-2153 inhibited normalbipolar microtubule spindle formation, suggesting that spindlemicrotubules may have been affected by this treatment (26–28).These FTI-treated cells were arrested in early mitosis and this effectwas independent of p53 and Ras status. Nevertheless, the effects ofFTI treatment on interphase microtubules have not been examined.
Note: Supplementary data for this article are available at Cancer Research Online(http://cancerres.aacrjournals.org/).
Requests for reprints: Paraskevi Giannakakou Winship Cancer Institute, EmoryUniversity School of Medicine, Room D4054, 1365C Clifton Road, Atlanta, GA 30322.E-mail: [email protected].
I2005 American Association for Cancer Research.
www.aacrjournals.org 3883 Cancer Res 2005; 65: (9). May 1, 2005
Research Article

Here we investigated the effects of lonafarnib (29) on interphasemicrotubules in lung and breast cancer cells. Our results show thatexposure to lonafarnib resulted in microtubule bundle formation,stabilized interphase microtubules, and suppressed microtubuledynamics. Moreover, we show that the combination of lonafarniband paclitaxel for 16 hours synergistically enhanced tubulinacetylation, mitotic arrest, and cell death; furthermore, this effectcorrelated with FT inhibition. In addition, the combination oflonafarnib and paclitaxel inhibits the deacetylating activity ofhistone deacetylase 6 (HDAC6) in vitro , whereas either drug alonedoes not. Importantly, we show that the lonafarnib/taxanecombination is synergistic only in cells lines expressing the wild-type HDAC6, but not a catalytic-mutant HDAC6, revealing thatfunctional HDAC6 is required for the synergy of lonafarnib withtaxanes. Taken together, these data suggest a relationship betweenFT inhibition, HDAC6 function, enhanced tubulin acetylation, andcell death, providing a putative molecular basis for the lonafarnib/taxane antiproliferative combination.
Materials and Methods
Cell culture. The human non–small cell lung cancer cell lines A549 and
H1299 were maintained in RPMI 1640 supplemented with 5% FCS,
nonessential amino acids, and 0.1% penicillin/streptomycin at 37jC in 5%CO2. Live cell microscopy was done with MCF-7 breast cancer cells stably
transfected with green fluorescent protein (GFP):a-tubulin and maintained
in DMEM supplemented with 5% FCS, nonessential amino acids, and 0.1%
penicillin/streptomycin.. All lines were cultured at 37jC in a humidifiedatmosphere with 5% CO2. NIH-3T3 cells expressing various HDAC6
constructs were previously generated (30) and were cultured in DMEM
medium under the same conditions.Immunofluorescence analysis. Immunofluorescence microscopy was
done as previously described (31). Cells were fixed in PHEMO buffer (68
mmol/L PIPES, 25 mmol/L HEPES, 15 mmol/L EGTA, 3 mmol/L MgCl2,
10% DMSO) with 3.7% formaldehyde, 0.05% glutaraldehyde, and 0.5%Triton X-100. Cells were washed in PBS thrice for 5 minutes then blocked
in 10% goat serum for 15 minutes. The following primary antibodies were
used: a-tubulin (Chemicon International, Temecula, CA; 1:500 dilution) and
acetylated tubulin (Sigma, St. Louis, MO; 1:1,000 dilution) with incubationtime of 1 hour. The secondary antibodies used were Alexa 563–conjugated
goat anti-rat immunoglobulin G (IgG; 1:500) and Alexa 488–conjugated
goat anti-mouse IgG antibody (1:500), both from Molecular Probes(Eugene, OR). Cells were imaged using a Zeiss LSM 510 Meta (Thornwood,
NY) confocal microscope using a either a 63� [numerical aperture (NA) =
1.4] or 100� (NA = 1.4) Apochromat objective. To stain DNA for mitotic
cell counting, we fixed cells as described above, and added Sytox Green(Molecular Probes) to the Gel Mount mounting media (Biomeda Corp.,
Foster City, CA). All images were acquired using Zeiss LSM 510 software
and processed in Adobe Photoshop 7.0.
Cell tubulin polymerization assay. Quantitative drug-induced tubulinpolymerization was done as previously described (32, 33). The percent pellet
(%P) is calculated as the amount of polymerized tubulin (P) over the total
amount of polymerized and soluble tubulin (P + S) times 100 {%P = [P / (P +S)] � 100} based on densitometric analysis.
Electron microscopy. A549 cells were seeded on Thermanox coverslips
(Electron Microscopy Sciences, Hatfield, PA) in 24-well plates and grown
overnight to 60% confluency. Cells were then treated with 10 Amol/Llonafarnib for 48 hours and fixed using a protocol described in Vanier et al.
(34). Cells were then fixed in 2% glutaraldehyde for 4 hours at room
temperature, rinsed in distilled water twice, postfixed in 1% OsO4 in 0.1
mol/L sodium cacodylate buffer (pH 7.4) at 4 jC for 1 hour, and finallyrinsed in distilled water as above. Samples were then dehydrated through an
ethanol series (30%, 50%, 60%, 80%, 90%, 100%) followed by two changes of
propylene oxide (10 minutes each). Then samples were infiltrated with
Embed 812 (Electron Microscopy Science) for 3 days according to the
instructions of the manufacturer. Each block was cut at 1 � 1 mm using adiamond knife and RMC MT-7000 ultramicrotome, and thin sections were
made and collected onto 200 mesh copper grids. Grids were poststained
with 10% uranyl acetate in distilled water and then 2% lead citrate in
distilled water for 20 minutes in each treatment.Flow cytometry analysis. To determine acetylated tubulin levels, cells
were plated and on the following day treated with different concentrations
of the drugs for 16 hours. After drug treatment, cells were fixed with
PHEMO buffer for 10 minutes as previously described (31) and stained withan antibody against acetylated tubulin (Sigma; 1:500) followed by secondary
Alexa 488–conjugated goat anti-mouse IgG antibody (1:500). Finally, cells
were scraped into 1 mL of PBS, and flow cytometry analysis was done on a
Becton Dickinson flow cytometer.For cell cycle analysis, cells were scraped from plates, centrifuged at 1,000
rpm for 5 minutes, and propidium iodide buffer containing 0.1 mg/mL
propidium iodide and NP40 (0.6%) in water was used to resuspend cells.Cell were incubated in this buffer for 30 minutes at room temperature in
the dark, then passed through a filter to remove cell clumps, and finally read
in a Becton Dickinson flow cytometer.
Microtubule dynamics assays. Experiments were done using a MCF-7breast cancer cell line stably expressing a GFP-a-tubulin microtubule
reporter protein (kind gift of Dr. Mary Ann Jordan). Cells were plated and
analyzed as previously described (35). Images were taken using a Hamamatsu
Orca ER camera (Middlesex, NJ) every 4 seconds for 2 minutes (250-400seconds of exposure) on a Zeiss Axiovert epifluorescence microscope
equipped with 100� Apochromat (NA = 1.4) oil lens and adjustable mercury
arc lamp (set at 100% intensity). A stage heater as well as Zeiss heatingchamber was used to maintain the temperature at 37F 0.5jC. Microtubules
ends at the lamellar edge of interphase cells were imaged and subsequently
tracked using the ‘‘track points’’ feature on Metamorph image analysis
software (Universal Imaging, Downingtown, PA). The coordinates generatedfrom this tracking feature were used to determine the distance individual
microtubule ends changed from a fixed point. These values were transferred
to a Microsoft Excel spreadsheet and used to generate life history plots of
individual microtubules. From these graphs, the various variables shown inTable 1 were calculated. All P valueswere calculated using the Student’s t test.
Microtubule dynamicity is defined as the total length grown and
shortened during the life (measured in minutes) of an individualmicrotubule. A catastrophe is defined as a transition into microtubule
shortening whereas a rescue is a transition from shortening to growth or
pause. To calculate catastrophe frequency per unit time or per unit length,
the number of catastrophes was divided by the total time in growth andpause or the total distance grown, respectively. Conversely, the rescue
frequency was calculated by dividing the number of rescues by the total
time spent shortening or distance shortened.
In vitro acetylated tubulin assay. A549 cells were transiently trans-
fected with Flag-tagged pBJ5-HDAC6 expression plasmids using FuGene
(Roche, Basel, Switzerland) following the guidelines of the manufacturer.
Untransfected cells or cells transfected with an empty vector were used as
controls. In Fig. 5A , we used NIH-3T3 cells stably expressing FLAG-tagged
HDAC6-wt and HDAC6-mt proteins and therefore cells did not have to be
transfected. Cell lysates were prepared 48 hours after transfection and then
immunoprecipitated with anti-Flag M2 agarose beads (Sigma). Tubulin
acetylation assays were done by incubating the immunoprecipitates with
preformed mitogen-activated protein–stabilized microtubules at 37jC,along with the appropriate drug, for 2 hours as described previously (30).
Reactions were then placed on ice for 15 minutes and centrifuged briefly at
14,000 rpm to separate the supernatant from the agarose beads. The
supernatant was analyzed by Western blotting with antibodies against
acetylated a-tubulin and against a-tubulin (as described below) and the
beads were analyzed with an antibody against Flag M2 (Sigma; 1:1,000).Western blotting. Cells were plated in six-well plates at 50% confluency
and treated the next day with the appropriate drug and time interval. Cells
were lysed, centrifuged at 15,000 rpm for 15 minutes, and electrophoresed
on a 7.5% SDS-PAGE gel (bicinchoninic acid assay was used to determineprotein concentration in a spectrophotometer). Proteins were transferred to
a polyvinylidene difluoride membrane (100 V for 1 hour) using a Bio-Rad
Cancer Research
Cancer Res 2005; 65: (9). May 1, 2005 3884 www.aacrjournals.org
transfer apparatus and blotted with antibodies against acetylated tubulin(Sigma; 1:1,000), total tubulin (Sigma DM1a; 1:1,000), HDJ-2, acetylated
histone 3 (Cell Signaling, Beverly, MA; 1:1,000), actin, and HDAC6 (Cell
Signaling; 1:1,000).Cell survival and synergy assays (combination index analysis). Cells
were plated in a 96-well plate at 2,000 cells/well and allowed to attach
overnight. Cells were then treated with serial dilutions (1:3) of either
lonafarnib alone, paclitaxel alone, or the combination of lonafarnib andpaclitaxel for 72 hours. Cell were then fixed with 10% trichloroacetic acid for
30 minutes, washed thrice with water, dried, and stained with 0.4%
sulfurhodamine B (protein stain) for 30 minutes. Cells were then washed
with 0.1% acetic acid, air dried, and the bound sulfurhodamine B wasdissolved with 10 mmol/L unbuffered Tris-base (pH 10.5). The plates were
read in a microplate reader (A564) and synergy was determined using
CalcuSyn software, which calculates the combination index based on thepercent cell survival at varying doses of the drug treatments, both alone and
in combination. A combination index greater than 1 indicates antagonism,
equal to 1 is additivity, and less than 1 is synergism.
Results
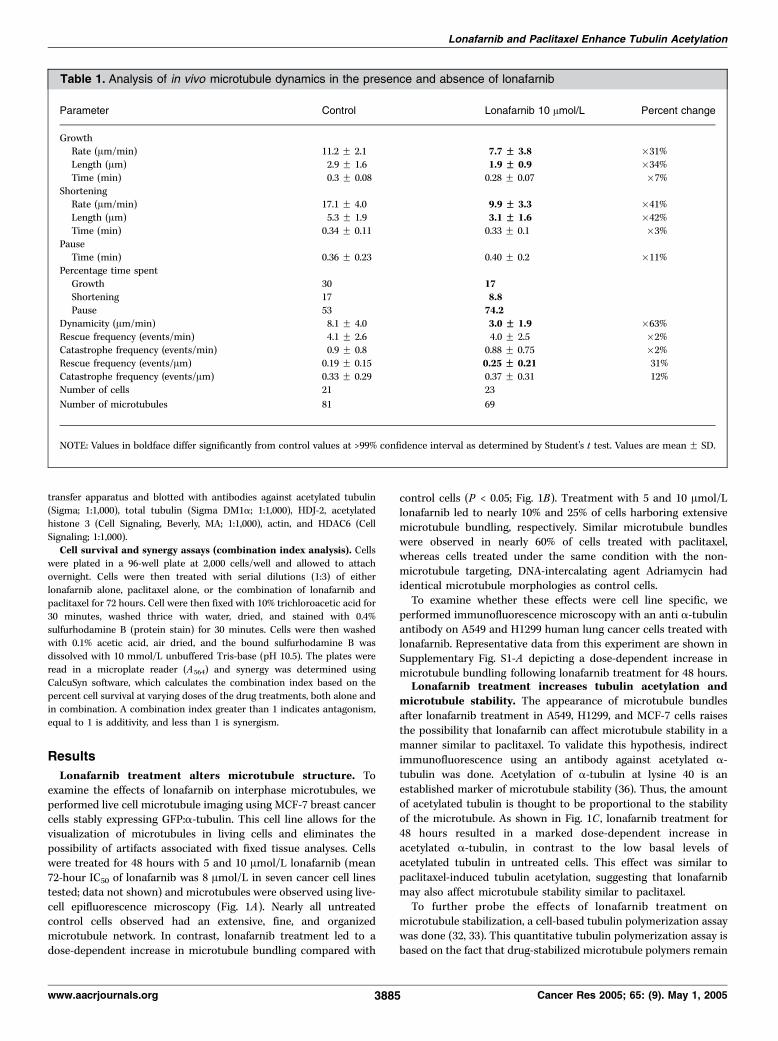
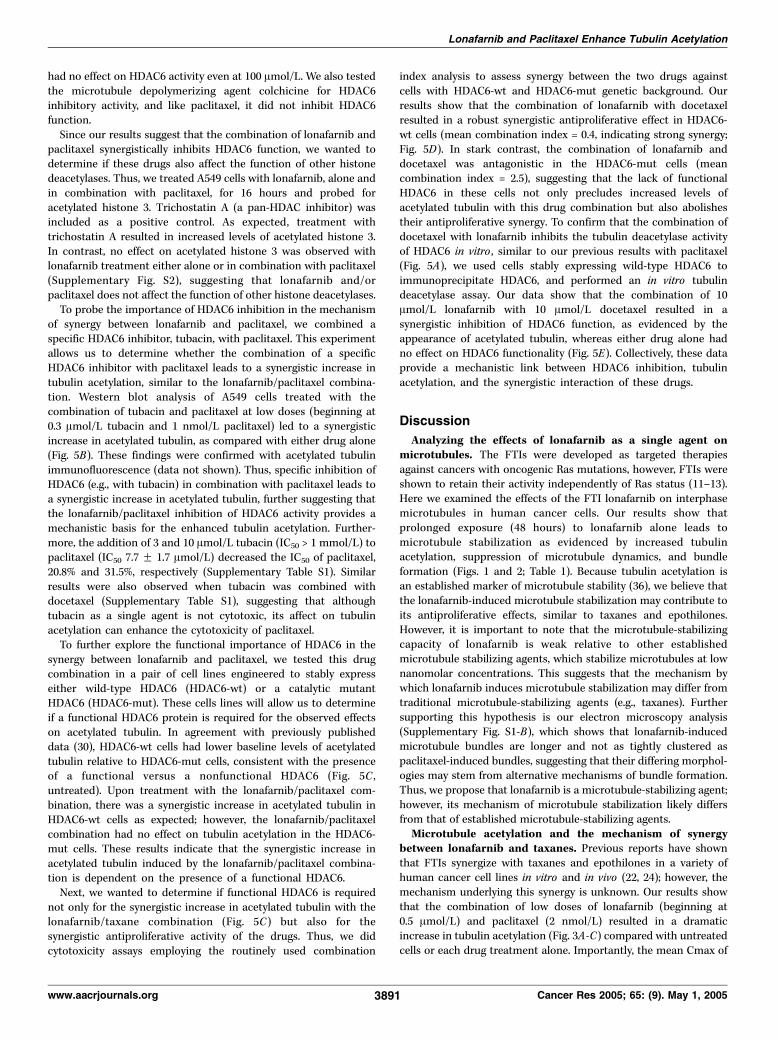
Lonafarnib treatment alters microtubule structure. Toexamine the effects of lonafarnib on interphase microtubules, weperformed live cell microtubule imaging using MCF-7 breast cancercells stably expressing GFP:a-tubulin. This cell line allows for thevisualization of microtubules in living cells and eliminates thepossibility of artifacts associated with fixed tissue analyses. Cellswere treated for 48 hours with 5 and 10 Amol/L lonafarnib (mean72-hour IC50 of lonafarnib was 8 Amol/L in seven cancer cell linestested; data not shown) and microtubules were observed using live-cell epifluorescence microscopy (Fig. 1A). Nearly all untreatedcontrol cells observed had an extensive, fine, and organizedmicrotubule network. In contrast, lonafarnib treatment led to adose-dependent increase in microtubule bundling compared with
control cells (P < 0.05; Fig. 1B). Treatment with 5 and 10 Amol/Llonafarnib led to nearly 10% and 25% of cells harboring extensivemicrotubule bundling, respectively. Similar microtubule bundleswere observed in nearly 60% of cells treated with paclitaxel,whereas cells treated under the same condition with the non-microtubule targeting, DNA-intercalating agent Adriamycin hadidentical microtubule morphologies as control cells.To examine whether these effects were cell line specific, we
performed immunofluorescence microscopy with an anti a-tubulinantibody on A549 and H1299 human lung cancer cells treated withlonafarnib. Representative data from this experiment are shown inSupplementary Fig. S1-A depicting a dose-dependent increase inmicrotubule bundling following lonafarnib treatment for 48 hours.Lonafarnib treatment increases tubulin acetylation and
microtubule stability. The appearance of microtubule bundlesafter lonafarnib treatment in A549, H1299, and MCF-7 cells raisesthe possibility that lonafarnib can affect microtubule stability in amanner similar to paclitaxel. To validate this hypothesis, indirectimmunofluorescence using an antibody against acetylated a-tubulin was done. Acetylation of a-tubulin at lysine 40 is anestablished marker of microtubule stability (36). Thus, the amountof acetylated tubulin is thought to be proportional to the stabilityof the microtubule. As shown in Fig. 1C , lonafarnib treatment for48 hours resulted in a marked dose-dependent increase inacetylated a-tubulin, in contrast to the low basal levels ofacetylated tubulin in untreated cells. This effect was similar topaclitaxel-induced tubulin acetylation, suggesting that lonafarnibmay also affect microtubule stability similar to paclitaxel.To further probe the effects of lonafarnib treatment on
microtubule stabilization, a cell-based tubulin polymerization assaywas done (32, 33). This quantitative tubulin polymerization assay isbased on the fact that drug-stabilized microtubule polymers remain
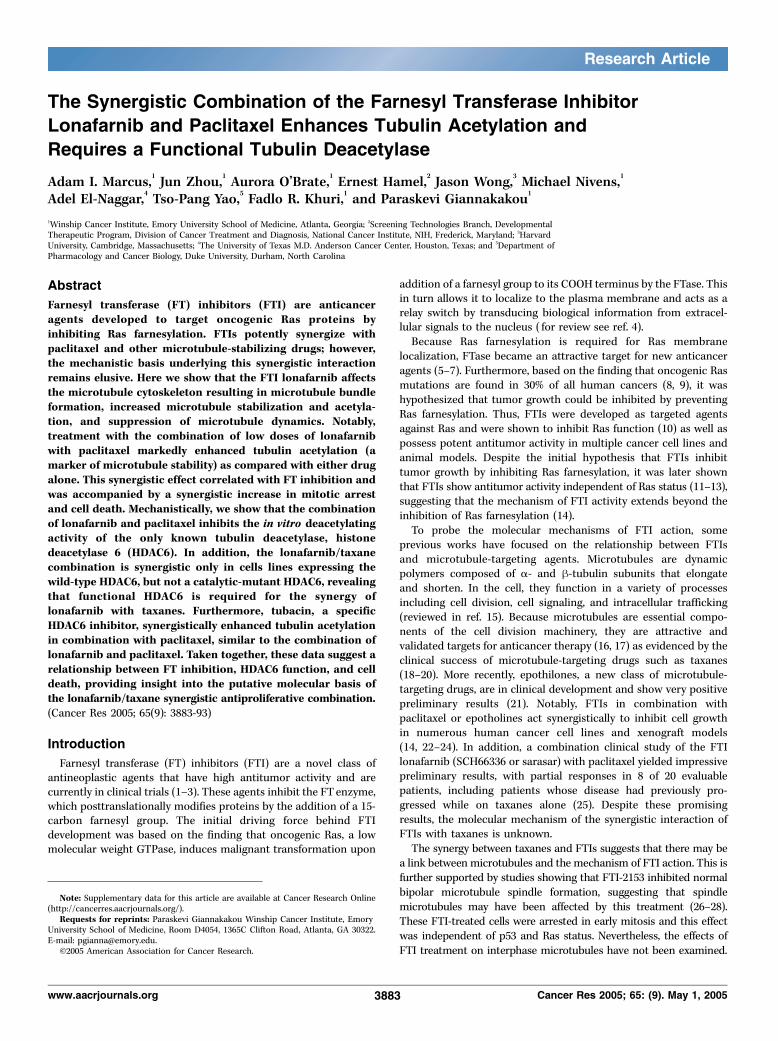
Table 1. Analysis of in vivo microtubule dynamics in the presence and absence of lonafarnib
Parameter Control Lonafarnib 10 Amol/L Percent change
GrowthRate (Am/min) 11.2 F 2.1 7.7 FF 3.8 �31%
Length (Am) 2.9 F 1.6 1.9 FF 0.9 �34%
Time (min) 0.3 F 0.08 0.28 F 0.07 �7%
ShorteningRate (Am/min) 17.1 F 4.0 9.9 FF 3.3 �41%
Length (Am) 5.3 F 1.9 3.1 FF 1.6 �42%
Time (min) 0.34 F 0.11 0.33 F 0.1 �3%
PauseTime (min) 0.36 F 0.23 0.40 F 0.2 �11%
Percentage time spent
Growth 30 17Shortening 17 8.8Pause 53 74.2
Dynamicity (Am/min) 8.1 F 4.0 3.0 FF 1.9 �63%
Rescue frequency (events/min) 4.1 F 2.6 4.0 F 2.5 �2%Catastrophe frequency (events/min) 0.9 F 0.8 0.88 F 0.75 �2%
Rescue frequency (events/Am) 0.19 F 0.15 0.25 FF 0.21 31%
Catastrophe frequency (events/Am) 0.33 F 0.29 0.37 F 0.31 12%
Number of cells 21 23
Number of microtubules 81 69
NOTE: Values in boldface differ significantly from control values at >99% confidence interval as determined by Student’s t test. Values are mean F SD.
Lonafarnib and Paclitaxel Enhance Tubulin Acetylation
www.aacrjournals.org 3885 Cancer Res 2005; 65: (9). May 1, 2005
detergent insoluble when extracted in a hypotonic buffer and,therefore, remain in the pellet after centrifugation. Conversely, thepool of soluble tubulin dimers remains in the supernatant.Lonafarnib treatment resulted in a dose-dependent increase intubulin polymerization, as shown by the increase in the percentageof tubulin found in the pellet fraction, as compared with untreatedcontrol cells (Fig. 1D). Specifically, untreated cells contain almost nostabilized tubulin (0% tubulin in the pellet) under our experimental
conditions, whereas lonafarnib treatment (5-20 Amol/L) led to adose-dependent increase in tubulin polymerization (25-60% of totaltubulin in the pellet fraction). Similarly, treatment with 5 nmol/Lpaclitaxel resulted in about 80% tubulin polymerization. The sameblot was reprobed with an antibody against acetylated a-tubulin. Asimilar dose-dependent increase in acetylated a-tubulin in the pelletwas observed on lonafarnib treatment and this shift of acetylated-tubulin towards the polymerized fraction was greater than total
Figure 1. Lonafarnib treatment alters microtubulestructure and increases tubulin acetylation. A,MCF-7 breast cancer cells stably expressing GFP:a-tubulin were observed using live-cellfluorescence microscopy following the indicateddrug treatments for 48 hours. Solid arrows,microtubule bundling. Bottom row displays highermagnification of microtubules shown in the top row.Bar, 10 Am. B, number of cells containingmicrotubule bundles following drug treatmentsshown in A . Asterisks denote a significantdifference in the percentage of cells havingmicrotubule bundles compared with control(P < 0.05). Bars, FSD. C, A549 cells weretreated with lonafarnib (LNF ) for 48 hoursand microtubules were visualized byimmunofluorescence labeling using an antibodyagainst acetylated a-tubulin. Treatment withpaclitaxel (PTX ) is included as a positive control.Bar, 10 Am. D, Western blot analysis against totala-tubulin (top ) and acetylated tubulin (bottom ) onthe polymerized (P) and soluble (S) fractionsof protein lysates from A549 cells treated withthe indicated drug concentrations for 48 hours.%P, relative percentage of polymerized tubulinfor each drug treatment.
Cancer Research
Cancer Res 2005; 65: (9). May 1, 2005 3886 www.aacrjournals.org
tubulin. Thus, the majority of tubulin polymers in the pellet fractionrepresent stabilized acetylated microtubules rather than randommicrotubules trapped in this fraction.Transmission electron microscopy confirms microtubule
bundles in lonafarnib-treated cells. To obtain high-resolutionanalysis of lonafarnib-induced changes of the microtubulearchitecture, we did transmission electron microscopy (34). Incontrast to control cells, which had individual microtubulesthroughout the cell cytoplasm, lonafarnib treatment induced theformation of microtubule bundles, similar to the bundles observedwith paclitaxel (Supplementary Fig. S2-B). Interestingly, lonafarnibtreatment mainly led to the formation of loose microtubuleclusters that were longer in length but not as tightly packed aspaclitaxel-induced microtubule bundles, suggesting that lonafar-nib-induced bundles may differ morphologically from paclitaxel-induced bundles (Supplementary Fig. S2-B , insets).Lonafarnib suppresses microtubule dynamics in MCF-7
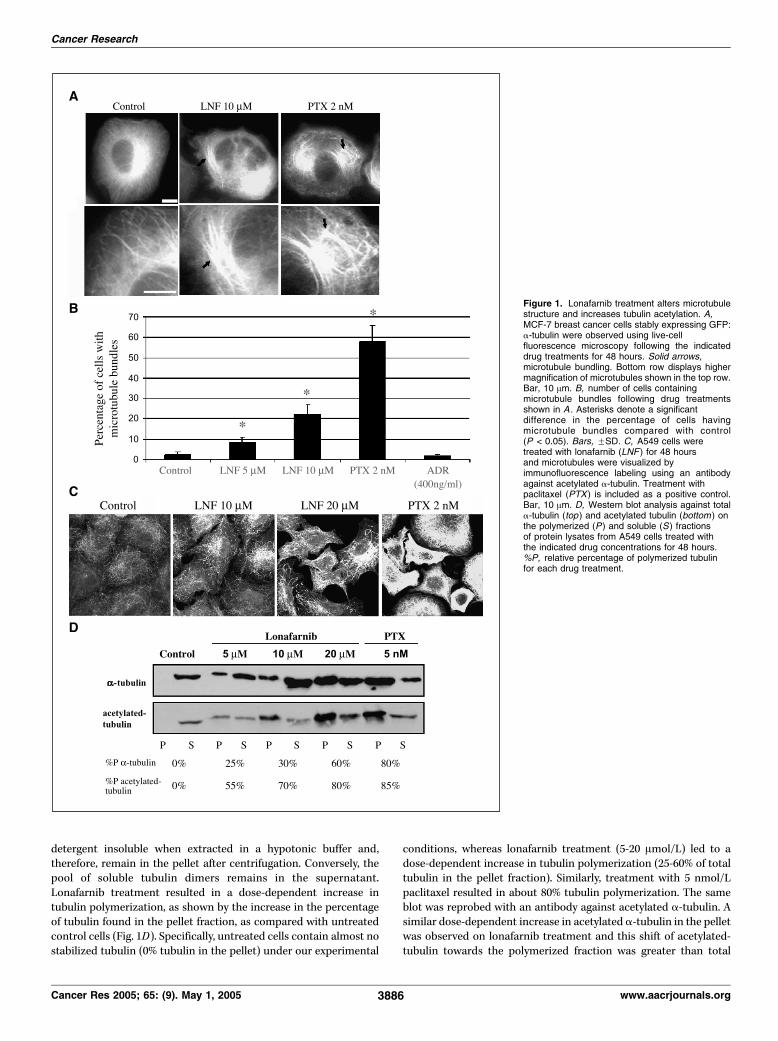
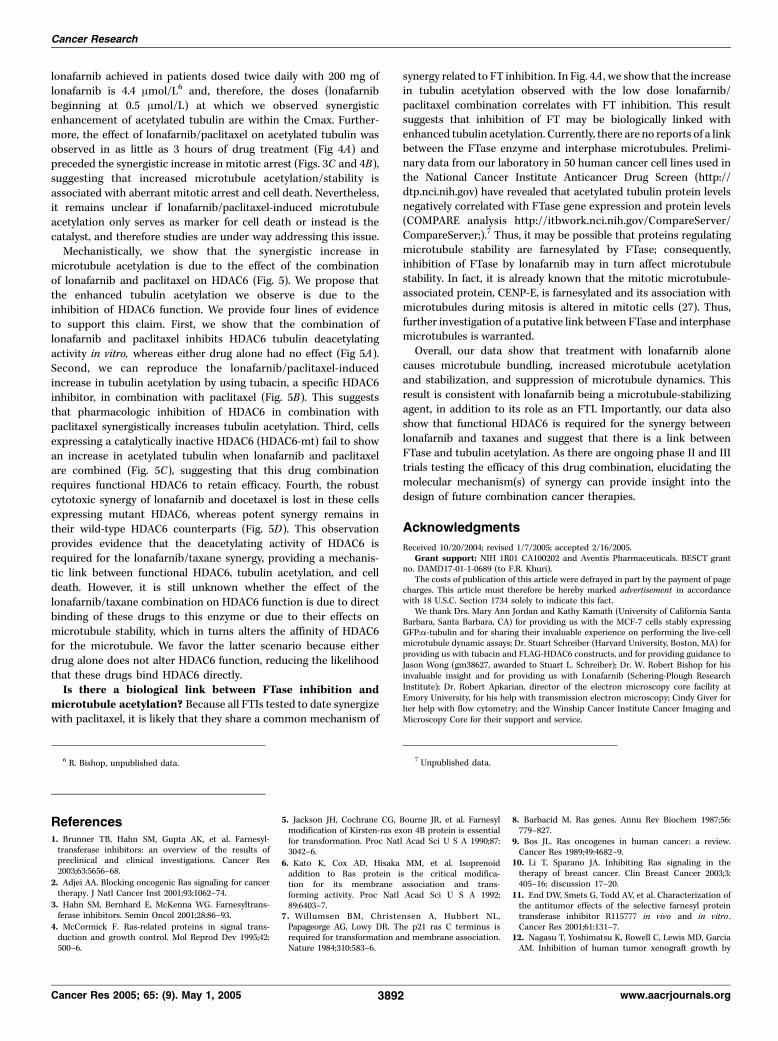
cells. Drugs that target microtubules potently suppress microtu-bule dynamics at relatively low concentrations (16, 34) and thisfunction is essential for their activity. Our results show lonafarnibtargets cellular microtubules; therefore, we investigated whetherlonafarnib also affects microtubule dynamics, similar to othermicrotubule-targeting drugs. To test this hypothesis, we measuredmicrotubule dynamics in living MCF7-GFP:tubulin breast cancercells using live-cell fluorescence microscopy. Time-lapse sequencesof microtubule movements were generated from untreated andlonafarnib-treated cells. Representative time frames show micro-tubule growth (white arrows), shortening (black arrows), and pause(white dashed arrows) in untreated control cells (Fig. 2A). Toquantitate the effects of lonafarnib on microtubule dynamics, wetracked microtubule movements in cells treated with 10 Amol/Llonafarnib and untreated control cells. Individual microtubule lifehistory plots, depicting changes in microtubule length over time,were generated (Fig. 2B).
From these life history plots various variables of microtubuledynamics were measured, comparing the dynamicity of micro-tubules in control cells and lonafarnib-treated cells (Table 1).These data show that there is a significant difference (P < 0.05) inthe mean rate (Am/min) of microtubule growth and shorteningwith a decrease of 31% and 41%, respectively, when lonafarnib-treated cells (10 Amol/L for 48 hours) are compared with controlcells. Consequently, mean growth and shortening length (Am) alsodecreased by 34% and 42%, respectively. When the percentage oftotal time that microtubules spent in growth, shortening, andpause states was determined, the growth time dropped from 30%to 17%, shortening time from 17% to 8.8%, and paused timeincreased from 53% to 74.2%; whereas the rescue and catastrophefrequencies per micrometer increased 31% and 12%, respectively(see Materials and Methods for definition). The overall dynamicityof microtubules, which represents the total tubulin length changeper minute after lonafarnib (10 Amol/L) treatment, decreased by63%. At 20 Amol/L lonafarnib, microtubules were almostcompletely stabilized and most cells had few, if any, dynamicmicrotubules.Combination of lonafarnib with paclitaxel synergistically
increases acetylated tubulin, mitotic arrest, and cell death.FTIs have been shown to synergize with microtubule stabilizingdrugs in numerous preclinical models as well as in a phase Iclinical trial (25). These observations were confirmed in ourlaboratory by performing combination index analysis assays of10 different human cancer cell lines treated with paclitaxel andlonafarnib. These assays revealed a marked synergy (combina-tion index = 0.2-0.7) between the two drugs (data not shown)and is consistent with previous findings. Our results, togetherwith the reported literature, prompted us to hypothesize thatthe synergy of lonafarnib with taxanes may in part be due totheir combined effects on cellular microtubule acetylation andstability.
Figure 2. Lonafarnib treatmentsuppresses microtubule dynamics in livingMCF-7 cells. A, time lapse sequencesof microtubules in untreated livingMCF-7 cells stably expressing GFP:a-tubulin. Arrows depict dynamicmicrotubules that change length over thecourse of 16 seconds: black arrows,microtubule shortening; white arrows,microtubule growth; dashed arrows,paused microtubules. Bar, 5 Am.B, individual microtubule life history plotsfrom control untreated cellsor cells treated with 10 Amol/L lonafarnibfor 48 hours. Growth events are seenas an increase in distance from a fixedpoint (y axis) over time (x axis ) andshortening events show a decrease indistance over time.
Lonafarnib and Paclitaxel Enhance Tubulin Acetylation
www.aacrjournals.org 3887 Cancer Res 2005; 65: (9). May 1, 2005

Figure 3. Lonafarnib and paclitaxelsynergistically increase acetylated tubulin,mitotic arrest, and apoptosis. A, flowcytometry was done with an acetylatedtubulin antibody in A549 cells treated withthe indicated drugs. Representation ofacetylated tubulin levels after 16 hoursof drug treatment. Columns, meanfluorescence for acetylated tubulin relativeto that of control untreated cells (FTI:lonafarnib). B, acetylated tubulinimmunofluorescence of cells treated withlonafarnib and paclitaxel, both alone and incombination, for 16 and 32 hours. C, cellcycle analysis for 16 and 32 hoursof treatment with the combination oflonafarnib and paclitaxel.
Cancer Research
Cancer Res 2005; 65: (9). May 1, 2005 3888 www.aacrjournals.org

To test this hypothesis, we quantitated acetylated tubulin levelsusing flow cytometry in cells treated for 16 hours (unlike the 48-hour treatment in Fig. 1B) with lonafarnib and paclitaxel, bothalone and in combination. As shown in Fig. 4A , there was not asignificant difference in acetylated tubulin levels between controluntreated cells and cells treated for only 16 hours with lonafarnib(1, 5, and 10 Amol/L) or paclitaxel (2, 5, and 10 nmol/L) alone. Incontrast, the combination of 1, 5, and 10 Amol/L lonafarnib with aslow as 2 nmol/L paclitaxel resulted in a marked increase ofacetylated tubulin similar to that observed with 100 nmol/L ofpaclitaxel alone (Fig. 3A). Notably, non-microtubule-targetingchemotherapy drugs, such as Adriamycin (DNA-intercalatingantibiotic) and U89 (antimetabolite), had no effect on acetylatedtubulin levels, whereas the microtubule-destabilizing drug vincris-tine led to a slight decrease of acetylated tubulin levels comparedwith untreated cells (Fig. 3A).To further explore the synergistic combination of lonafarnib with
paclitaxel, immunofluorescence analysis of acetylated tubulin attwo different time points was done (Fig. 3B). This analysisconfirmed the marked increase in acetylated tubulin levels after16 hours when low doses of lonafarnib (at 0.5, 1, and 5 Amol/L)were combined with low doses of 2 nmol/L paclitaxel. At 32 hoursof treatment, similar effects on acetylated tubulin were observed,suggesting that this effect is maintained for at least 32 hours.Because tubulin acetylation is associated with microtubule
stability, we examined whether the increased levels of acetylatedtubulin observed with the combination of lonafarnib andpaclitaxel resulted in increased mitotic arrest and cell death.Flow cytometry analysis of DNA content revealed that thecombination of lonafarnib and paclitaxel led to a synergisticincrease in G2-M arrest as compared with each drug alone(Fig. 3C). Specifically, 16-hour treatment with as low as 0.5 Amol/L lonafarnib + 2 nmol/L paclitaxel resulted in a dramatic increasein G2-M arrested cells as compared with untreated cells or cellstreated with each drug alone. Longer treatment (32 hours) withthe same drug combinations resulted in a dose-dependentincrease in apoptotic cell death that is likely due to cellspreviously arrested in mitosis becoming apoptotic (Fig. 3C). Thepercentage of apoptotic cells in the combination treatments wassimilar to that achieved with paclitaxel at 100 nmol/L, whereaseither drug alone at low dose produced minimal apoptotic cells.Overall, these results show that the lonafarnib/paclitaxel-mediatedincrease in tubulin acetylation correlates with a synergisticincrease in mitotic arrest and cell death.The synergistic increase in tubulin acetylation correlates
with farnesyl transferase inhibition. Because lonafarnib inhibitsthe FT enzyme, we wanted to determine if the increase intubulin acetylation observed with the combination of lonafarniband paclitaxel correlates with FT inhibition in cells. If so, itwould suggest that the observed increase in tubulin acetylationmay be a consequence of FTase inhibition. To do this, HDJ-2 wasused as a readout for FT inhibition, since FTI treatment inhibitsHDJ-2 farnesylation resulting in the appearance of a slower-migrating non-farnesylated HDJ-2 form. As shown in Fig. 4A , 1Amol/L lonafarnib alone and in combination with paclitaxelinhibited HDJ-2 farnesylation in a time-dependent manner, asassessed by the increase of the non-farnesylated (upper band)and concomitant decrease of the farnesylated HDJ-2 band (lowerband). As expected, paclitaxel alone had no effect on HDJ-2farnesylation. When the same blots were reprobed for acetylateda-tubulin, we observed a correlation between inhibition of HDJ-2
farnesylation and tubulin acetylation beginning at 3 hours oftreatment with the lonafarnib/paclitaxel combination. In con-trast, minimal effect on tubulin acetylation was observed witheither drug alone. Taken together, these results show a positivetemporal correlation between FT inhibition and tubulin acety-lation when lonafarnib and paclitaxel are combined.Next, we wanted to determine if there is also a correlation
between tubulin acetylation and mitotic arrest. Therefore, inparallel with the time course experiment described above, wequantitated the percentage of cells in mitosis after treatment withthe combination of lonafarnib and paclitaxel. This result isrepresented in Fig. 4B showing that there is about a 3-hour delaybetween the increase in microtubule acetylation (starting at 3hours) and the first indication of mitotic arrest (at 6 hours).Furthermore, the percentage of cells in mitosis increased with
Figure 4. The synergistic increase in acetylated tubulin caused by lonafarniband paclitaxel treatment correlates with FT inhibition and mitotic arrest. A,Western blot analysis for acetylated tubulin, HDJ-2 (N, non-farnesylated band;F, farnesylated band), and total tubulin following lonafarnib and/or paclitaxeltreatment over time. B, percent mitosis assessed by DNA staining, done inparallel and with the same drug treatments over time as in A . Bars, SD.
Lonafarnib and Paclitaxel Enhance Tubulin Acetylation
www.aacrjournals.org 3889 Cancer Res 2005; 65: (9). May 1, 2005

longer exposures to the combination of the two drugs, peaking at12 hours of treatment. Overall, this result shows that whenlonafarnib and paclitaxel are combined, microtubule acetylationoccurs before mitotic arrest and suggests that there is a correlationbetween tubulin acetylation/stability and mitotic arrest.Lonafarnib in combination with paclitaxel inhibits the
tubulin deacetylating activity of histone deacetylase 6. Ourobservation that lonafarnib and paclitaxel synergistically enhancetubulin acetylation (Fig. 3) prompted us to explore the possibilitythat this effect is due to the functional inhibition of the only knowntubulin-specific deacetylase (30), HDAC6. To determine the effectof lonafarnib on HDAC6 function, we transfected A549 cells withFLAG-tagged HDAC6 (wild-type or catalytic subunit mutant) andthese proteins were immunoprecipitated with an anti-FLAGantibody (see Materials and Methods). The tubulin deacetylaseactivity of HDAC6 in the presence of lonafarnib and paclitaxel wasassayed in vitro by coincubating the immunoprecipitants with
purified bovine brain microtubule protein. Western blot analyses ofacetylated tubulin levels were used as a read-out for HDAC6activity (Fig. 5A), such that HDAC6 functionality is evidenced bytubulin deacetylation. As a positive control, we used trichostatin A,which inhibits the function of all histone deacetylases includingHDAC6. As expected, bovine brain tubulin is heavily acetylated(lane 1) and coincubation with wt-HDAC6 almost completelydeacetylated tubulin (lane 3). In contrast, coincubation with thecatalytically inactive mutant HDAC6 had no effect on tubulinacetylation (last lane). The addition of lonafarnib or paclitaxelalone to the purified wild-type HDAC6-tubulin complex had noeffect on HDAC6 activity because tubulin was heavily deacetylated,indicating normal HDAC6 activity. In contrast, when lonafarnib(variable doses) and paclitaxel (kept constant at 10 Amol/L) werecombined in vitro , there was a dose-dependent increase of tubulinacetylation, suggesting that the combination of these agentsinhibits tubulin deacetylating HDAC6 activity. Paclitaxel alone
Figure 5. The synergistic combination of lonafarnib and taxane prevents HDAC6 tubulin deacetylation in vitro and is dependent on HDAC6 functionality. A,representative Western blots of acetylated a-tubulin, total tubulin, and Flag, following immunoprecipitation (IP) from A549 cells transfected with either Flag-HDAC6-WTor Flag-HDAC6-mut. Before Western blotting the Flag-IP complexes were incubated in vitro with preassembled purified bovine brain microtubule protein in the presenceof various drugs to determine the tubulin deacetylase activity of HDAC6 (left-hand blot ). B, Western blotting of acetylated tubulin after treatment with tubacin,a specific HDAC6 inhibitor, both alone and in combination with paclitaxel. Trichostatin A (TSA ) was used as additional positive control for pan-HDAC inhibition. As acontrol for total tubulin levels, blots were reprobed for a-tubulin. C, immunofluorescence analyses of acetylated tubulin in NIH-3T3 cells stably expressing eitherHDAC6-wt or HDAC-mut, following 16-hour drug treatments as indicated. D , assessment of synergy between lonafarnib and docetaxel in HDAC6-wt and HDAC6-mutusing combination index analysis. The lonafarnib/docetaxel combination is synergistic in HDAC6-wt (combination index < 1) but is antagonistic in HDAC6-mt cells(combination index > 1). Bars, SD. E, representative Western blots of acetylated a-tubulin, total tubulin, and HDAC6 following immunoprecipitation (IP) from NIH-3T3cells stably expressing Flag-HDAC6-WT. Before Western blotting the Flag-IP complexes were incubated in vitro with preassembled purified bovine brain microtubuleprotein in the presence of various drugs to determine the tubulin deacetylase activity of HDAC6. The in vitro effects of trichostatin A (pan-HDAC inhibitor),lonafarnib, and docetaxel (DTX ) on acetylated a-tubulin are shown.
Cancer Research
Cancer Res 2005; 65: (9). May 1, 2005 3890 www.aacrjournals.org
had no effect on HDAC6 activity even at 100 Amol/L. We also testedthe microtubule depolymerizing agent colchicine for HDAC6inhibitory activity, and like paclitaxel, it did not inhibit HDAC6function.Since our results suggest that the combination of lonafarnib and
paclitaxel synergistically inhibits HDAC6 function, we wanted todetermine if these drugs also affect the function of other histonedeacetylases. Thus, we treated A549 cells with lonafarnib, alone andin combination with paclitaxel, for 16 hours and probed foracetylated histone 3. Trichostatin A (a pan-HDAC inhibitor) wasincluded as a positive control. As expected, treatment withtrichostatin A resulted in increased levels of acetylated histone 3.In contrast, no effect on acetylated histone 3 was observed withlonafarnib treatment either alone or in combination with paclitaxel(Supplementary Fig. S2), suggesting that lonafarnib and/orpaclitaxel does not affect the function of other histone deacetylases.To probe the importance of HDAC6 inhibition in the mechanism
of synergy between lonafarnib and paclitaxel, we combined aspecific HDAC6 inhibitor, tubacin, with paclitaxel. This experimentallows us to determine whether the combination of a specificHDAC6 inhibitor with paclitaxel leads to a synergistic increase intubulin acetylation, similar to the lonafarnib/paclitaxel combina-tion. Western blot analysis of A549 cells treated with thecombination of tubacin and paclitaxel at low doses (beginning at0.3 Amol/L tubacin and 1 nmol/L paclitaxel) led to a synergisticincrease in acetylated tubulin, as compared with either drug alone(Fig. 5B). These findings were confirmed with acetylated tubulinimmunofluorescence (data not shown). Thus, specific inhibition ofHDAC6 (e.g., with tubacin) in combination with paclitaxel leads toa synergistic increase in acetylated tubulin, further suggesting thatthe lonafarnib/paclitaxel inhibition of HDAC6 activity provides amechanistic basis for the enhanced tubulin acetylation. Further-more, the addition of 3 and 10 Amol/L tubacin (IC50 > 1 mmol/L) topaclitaxel (IC50 7.7 F 1.7 Amol/L) decreased the IC50 of paclitaxel,20.8% and 31.5%, respectively (Supplementary Table S1). Similarresults were also observed when tubacin was combined withdocetaxel (Supplementary Table S1), suggesting that althoughtubacin as a single agent is not cytotoxic, its affect on tubulinacetylation can enhance the cytotoxicity of paclitaxel.To further explore the functional importance of HDAC6 in the
synergy between lonafarnib and paclitaxel, we tested this drugcombination in a pair of cell lines engineered to stably expresseither wild-type HDAC6 (HDAC6-wt) or a catalytic mutantHDAC6 (HDAC6-mut). These cells lines will allow us to determineif a functional HDAC6 protein is required for the observed effectson acetylated tubulin. In agreement with previously publisheddata (30), HDAC6-wt cells had lower baseline levels of acetylatedtubulin relative to HDAC6-mut cells, consistent with the presenceof a functional versus a nonfunctional HDAC6 (Fig. 5C ,untreated). Upon treatment with the lonafarnib/paclitaxel com-bination, there was a synergistic increase in acetylated tubulin inHDAC6-wt cells as expected; however, the lonafarnib/paclitaxelcombination had no effect on tubulin acetylation in the HDAC6-mut cells. These results indicate that the synergistic increase inacetylated tubulin induced by the lonafarnib/paclitaxel combina-tion is dependent on the presence of a functional HDAC6.Next, we wanted to determine if functional HDAC6 is required
not only for the synergistic increase in acetylated tubulin with thelonafarnib/taxane combination (Fig. 5C ) but also for thesynergistic antiproliferative activity of the drugs. Thus, we didcytotoxicity assays employing the routinely used combination
index analysis to assess synergy between the two drugs againstcells with HDAC6-wt and HDAC6-mut genetic background. Ourresults show that the combination of lonafarnib with docetaxelresulted in a robust synergistic antiproliferative effect in HDAC6-wt cells (mean combination index = 0.4, indicating strong synergy;Fig. 5D). In stark contrast, the combination of lonafarnib anddocetaxel was antagonistic in the HDAC6-mut cells (meancombination index = 2.5), suggesting that the lack of functionalHDAC6 in these cells not only precludes increased levels ofacetylated tubulin with this drug combination but also abolishestheir antiproliferative synergy. To confirm that the combination ofdocetaxel with lonafarnib inhibits the tubulin deacetylase activityof HDAC6 in vitro , similar to our previous results with paclitaxel(Fig. 5A), we used cells stably expressing wild-type HDAC6 toimmunoprecipitate HDAC6, and performed an in vitro tubulindeacetylase assay. Our data show that the combination of 10Amol/L lonafarnib with 10 Amol/L docetaxel resulted in asynergistic inhibition of HDAC6 function, as evidenced by theappearance of acetylated tubulin, whereas either drug alone hadno effect on HDAC6 functionality (Fig. 5E). Collectively, these dataprovide a mechanistic link between HDAC6 inhibition, tubulinacetylation, and the synergistic interaction of these drugs.
Discussion
Analyzing the effects of lonafarnib as a single agent onmicrotubules. The FTIs were developed as targeted therapiesagainst cancers with oncogenic Ras mutations, however, FTIs wereshown to retain their activity independently of Ras status (11–13).Here we examined the effects of the FTI lonafarnib on interphasemicrotubules in human cancer cells. Our results show thatprolonged exposure (48 hours) to lonafarnib alone leads tomicrotubule stabilization as evidenced by increased tubulinacetylation, suppression of microtubule dynamics, and bundleformation (Figs. 1 and 2; Table 1). Because tubulin acetylation isan established marker of microtubule stability (36), we believe thatthe lonafarnib-induced microtubule stabilization may contribute toits antiproliferative effects, similar to taxanes and epothilones.However, it is important to note that the microtubule-stabilizingcapacity of lonafarnib is weak relative to other establishedmicrotubule stabilizing agents, which stabilize microtubules at lownanomolar concentrations. This suggests that the mechanism bywhich lonafarnib induces microtubule stabilization may differ fromtraditional microtubule-stabilizing agents (e.g., taxanes). Furthersupporting this hypothesis is our electron microscopy analysis(Supplementary Fig. S1-B), which shows that lonafarnib-inducedmicrotubule bundles are longer and not as tightly clustered aspaclitaxel-induced bundles, suggesting that their differing morphol-ogies may stem from alternative mechanisms of bundle formation.Thus, we propose that lonafarnib is a microtubule-stabilizing agent;however, its mechanism of microtubule stabilization likely differsfrom that of established microtubule-stabilizing agents.Microtubule acetylation and the mechanism of synergy
between lonafarnib and taxanes. Previous reports have shownthat FTIs synergize with taxanes and epothilones in a variety ofhuman cancer cell lines in vitro and in vivo (22, 24); however, themechanism underlying this synergy is unknown. Our results showthat the combination of low doses of lonafarnib (beginning at0.5 Amol/L) and paclitaxel (2 nmol/L) resulted in a dramaticincrease in tubulin acetylation (Fig. 3A-C) compared with untreatedcells or each drug treatment alone. Importantly, the mean Cmax of
Lonafarnib and Paclitaxel Enhance Tubulin Acetylation
www.aacrjournals.org 3891 Cancer Res 2005; 65: (9). May 1, 2005
lonafarnib achieved in patients dosed twice daily with 200 mg oflonafarnib is 4.4 Amol/L6 and, therefore, the doses (lonafarnibbeginning at 0.5 Amol/L) at which we observed synergisticenhancement of acetylated tubulin are within the Cmax. Further-more, the effect of lonafarnib/paclitaxel on acetylated tubulin wasobserved in as little as 3 hours of drug treatment (Fig 4A) andpreceded the synergistic increase in mitotic arrest (Figs. 3C and 4B),suggesting that increased microtubule acetylation/stability isassociated with aberrant mitotic arrest and cell death. Nevertheless,it remains unclear if lonafarnib/paclitaxel-induced microtubuleacetylation only serves as marker for cell death or instead is thecatalyst, and therefore studies are under way addressing this issue.Mechanistically, we show that the synergistic increase in
microtubule acetylation is due to the effect of the combinationof lonafarnib and paclitaxel on HDAC6 (Fig. 5). We propose thatthe enhanced tubulin acetylation we observe is due to theinhibition of HDAC6 function. We provide four lines of evidenceto support this claim. First, we show that the combination oflonafarnib and paclitaxel inhibits HDAC6 tubulin deacetylatingactivity in vitro, whereas either drug alone had no effect (Fig 5A).Second, we can reproduce the lonafarnib/paclitaxel-inducedincrease in tubulin acetylation by using tubacin, a specific HDAC6inhibitor, in combination with paclitaxel (Fig. 5B). This suggeststhat pharmacologic inhibition of HDAC6 in combination withpaclitaxel synergistically increases tubulin acetylation. Third, cellsexpressing a catalytically inactive HDAC6 (HDAC6-mt) fail to showan increase in acetylated tubulin when lonafarnib and paclitaxelare combined (Fig. 5C), suggesting that this drug combinationrequires functional HDAC6 to retain efficacy. Fourth, the robustcytotoxic synergy of lonafarnib and docetaxel is lost in these cellsexpressing mutant HDAC6, whereas potent synergy remains intheir wild-type HDAC6 counterparts (Fig. 5D). This observationprovides evidence that the deacetylating activity of HDAC6 isrequired for the lonafarnib/taxane synergy, providing a mechanis-tic link between functional HDAC6, tubulin acetylation, and celldeath. However, it is still unknown whether the effect of thelonafarnib/taxane combination on HDAC6 function is due to directbinding of these drugs to this enzyme or due to their effects onmicrotubule stability, which in turns alters the affinity of HDAC6for the microtubule. We favor the latter scenario because eitherdrug alone does not alter HDAC6 function, reducing the likelihoodthat these drugs bind HDAC6 directly.Is there a biological link between FTase inhibition and
microtubule acetylation? Because all FTIs tested to date synergizewith paclitaxel, it is likely that they share a common mechanism of
synergy related to FT inhibition. In Fig. 4A , we show that the increasein tubulin acetylation observed with the low dose lonafarnib/paclitaxel combination correlates with FT inhibition. This resultsuggests that inhibition of FT may be biologically linked withenhanced tubulin acetylation. Currently, there are no reports of a linkbetween the FTase enzyme and interphase microtubules. Prelimi-nary data from our laboratory in 50 human cancer cell lines used inthe National Cancer Institute Anticancer Drug Screen (http://dtp.nci.nih.gov) have revealed that acetylated tubulin protein levelsnegatively correlated with FTase gene expression and protein levels(COMPARE analysis http://itbwork.nci.nih.gov/CompareServer/CompareServer;).7 Thus, it may be possible that proteins regulatingmicrotubule stability are farnesylated by FTase; consequently,inhibition of FTase by lonafarnib may in turn affect microtubulestability. In fact, it is already known that the mitotic microtubule-associated protein, CENP-E, is farnesylated and its association withmicrotubules during mitosis is altered in mitotic cells (27). Thus,further investigation of a putative link between FTase and interphasemicrotubules is warranted.Overall, our data show that treatment with lonafarnib alone
causes microtubule bundling, increased microtubule acetylationand stabilization, and suppression of microtubule dynamics. Thisresult is consistent with lonafarnib being a microtubule-stabilizingagent, in addition to its role as an FTI. Importantly, our data alsoshow that functional HDAC6 is required for the synergy betweenlonafarnib and taxanes and suggest that there is a link betweenFTase and tubulin acetylation. As there are ongoing phase II and IIItrials testing the efficacy of this drug combination, elucidating themolecular mechanism(s) of synergy can provide insight into thedesign of future combination cancer therapies.
Acknowledgments
Received 10/20/2004; revised 1/7/2005; accepted 2/16/2005.Grant support: NIH 1R01 CA100202 and Aventis Pharmaceuticals. BESCT grant
no. DAMD17-01-1-0689 (to F.R. Khuri).The costs of publication of this article were defrayed in part by the payment of page
charges. This article must therefore be hereby marked advertisement in accordancewith 18 U.S.C. Section 1734 solely to indicate this fact.
We thank Drs. Mary Ann Jordan and Kathy Kamath (University of California SantaBarbara, Santa Barbara, CA) for providing us with the MCF-7 cells stably expressingGFP:a-tubulin and for sharing their invaluable experience on performing the live-cellmicrotubule dynamic assays; Dr. Stuart Schreiber (Harvard University, Boston, MA) forproviding us with tubacin and FLAG-HDAC6 constructs, and for providing guidance toJason Wong (gm38627, awarded to Stuart L. Schreiber); Dr. W. Robert Bishop for hisinvaluable insight and for providing us with Lonafarnib (Schering-Plough ResearchInstitute); Dr. Robert Apkarian, director of the electron microscopy core facility atEmory University, for his help with transmission electron microscopy; Cindy Giver forher help with flow cytometry; and the Winship Cancer Institute Cancer Imaging andMicroscopy Core for their support and service.
References1. Brunner TB, Hahn SM, Gupta AK, et al. Farnesyl-transferase inhibitors: an overview of the results ofpreclinical and clinical investigations. Cancer Res2003;63:5656–68.
2. Adjei AA. Blocking oncogenic Ras signaling for cancertherapy. J Natl Cancer Inst 2001;93:1062–74.
3. Hahn SM, Bernhard E, McKenna WG. Farnesyltrans-ferase inhibitors. Semin Oncol 2001;28:86–93.
4. McCormick F. Ras-related proteins in signal trans-duction and growth control. Mol Reprod Dev 1995;42:500–6.
5. Jackson JH, Cochrane CG, Bourne JR, et al. Farnesylmodification of Kirsten-ras exon 4B protein is essentialfor transformation. Proc Natl Acad Sci U S A 1990;87:3042–6.
6. Kato K, Cox AD, Hisaka MM, et al. Isoprenoidaddition to Ras protein is the critical modifica-tion for its membrane association and trans-forming activity. Proc Natl Acad Sci U S A 1992;89:6403–7.
7. Willumsen BM, Christensen A, Hubbert NL,Papageorge AG, Lowy DR. The p21 ras C terminus isrequired for transformation and membrane association.Nature 1984;310:583–6.
8. Barbacid M. Ras genes. Annu Rev Biochem 1987;56:779–827.
9. Bos JL. Ras oncogenes in human cancer: a review.Cancer Res 1989;49:4682–9.
10. Li T, Sparano JA. Inhibiting Ras signaling in thetherapy of breast cancer. Clin Breast Cancer 2003;3:405–16; discussion 17–20.
11. End DW, Smets G, Todd AV, et al. Characterization ofthe antitumor effects of the selective farnesyl proteintransferase inhibitor R115777 in vivo and in vitro .Cancer Res 2001;61:131–7.
12. Nagasu T, Yoshimatsu K, Rowell C, Lewis MD, GarciaAM. Inhibition of human tumor xenograft growth by
6 R. Bishop, unpublished data. 7 Unpublished data.
Cancer Research
Cancer Res 2005; 65: (9). May 1, 2005 3892 www.aacrjournals.org
treatment with the farnesyl transferase inhibitor B956.Cancer Res 1995;55:5310–4.
13. Sepp-Lorenzino L, Ma Z, Rands E, et al. Apeptidomimetic inhibitor of farnesyl:protein transferaseblocks the anchorage-dependent and -independentgrowth of human tumor cell lines. Cancer Res 1995;55:5302–9.
14. Moasser MM, Rosen N. The use of molecularmarkers in farnesyltransferase inhibitor (FTI) therapyof breast cancer. Breast Cancer Res Treat 2002;73:135–44.
15. Nogales E. Structural insights into microtubulefunction. Annu Rev Biochem 2000;69:277–302.
16. Jordan MA. Mechanism of action of antitumor drugsthat interact with microtubules and tubulin. Curr MedChem Anti-Canc Agents 2002;2:1–17.
17. Jordan MA, Wilson L. Microtubules as a target foranticancer drugs. Nat Rev Cancer 2004;4:253–65.
18. Drukman S, Kavallaris M. Microtubule alterationsand resistance to tubulin-binding agents [review]. IntJ Oncol 2002;21:621–8.
19. Rowinsky EK. The development and clinical utility ofthe taxane class of antimicrotubule chemotherapyagents. Annu Rev Med 1997;48:353–74.
20. Checchi PM, Nettles JH, Zhou J, Snyder JP, Joshi HC.Microtubule-interacting drugs for cancer treatment.Trends Pharmacol Sci 2003;24:361–5.
21. Wartmann M, Altmann KH. The biology andmedicinal chemistry of epothilones. Curr Med ChemAnti-Canc Agents 2002;2:123–48.
22. Moasser MM, Sepp-Lorenzino L, Kohl NE, et al.Farnesyl transferase inhibitors cause enhanced mitotic
sensitivity to taxol and epothilones. Proc Natl Acad SciU S A 1998;95:1369–74.
23. Sun J, Blaskovich MA, Knowles D, et al. Antitumorefficacy of a novel class of non-thiol-containingpeptidomimetic inhibitors of farnesyltransferase andgeranylgeranyltransferase I: combination therapy withthe cytotoxic agents cisplatin, Taxol, and gemcitabine.Cancer Res 1999;59:4919–26.
24. Shi B, Yaremko B, Hajian G, et al. The farnesyl proteintransferase inhibitor SCH66336 synergizes with taxanesin vitro and enhances their antitumor activity in vivo .Cancer Chemother Pharmacol 2000;46:387–93.
25. Khuri FR, Glisson BS, Kim ES, et al. Phase I studyof the farnesyltransferase inhibitor lonafarnib withpaclitaxel in solid tumors. Clin Cancer Res 2004;10:2968–76.
26. Crespo NC, Ohkanda J, Yen TJ, Hamilton AD, SebtiSM. The farnesyltransferase inhibitor, FTI-2153, blocksbipolar spindle formation and chromosome alignmentand causes prometaphase accumulation during mitosisof human lung cancer cells. J Biol Chem 2001;276:16161–7.
27. Crespo NC, Delarue F, Ohkanda J, et al. Thefarnesyltransferase inhibitor, FTI-2153, inhibits bipolarspindle formation during mitosis independently oftransformation and Ras and p53 mutation status. CellDeath Differ 2002;9:702–9.
28. Ashar HR, James L, Gray K, et al. Farnesyltransferase inhibitors block the farnesylation ofCENP-E and CENP-F and alter the association ofCENP-E with the microtubules. J Biol Chem 2000;275:30451–7.
29. Taveras AG, Kirschmeier P, Baum CM. Sch-66336(sarasar) and other benzocycloheptapyridyl farnesylprotein transferase inhibitors: discovery, biology andclinical observations. Curr Top Med Chem 2003;3:1103–14.
30. Hubbert C, Guardiola A, Shao R, et al. HDAC6 is amicrotubule-associated deacetylase. Nature 2002;417:455–8.
31. Mabjeesh NJ, Escuin D, LaVallee TM, et al. 2ME2inhibits tumor growth and angiogenesis by disruptingmicrotubules and dysregulating HIF. Cancer Cell2003;3:363–75.
32. Giannakakou P, Villalba L, Li H, Poruchynsky M,Fojo T. Combinations of paclitaxel and vinblastine andtheir effects on tubulin polymerization and cellularcytotoxicity: characterization of a synergistic schedule.Int J Cancer 1998;75:57–63.
33. Giannakakou P, Sackett DL, Kang YK, et al.Paclitaxel-resistant human ovarian cancer cellshave mutant h-tubulins that exhibit impaired pacli-taxel-driven polymerization. J Biol Chem 1997;272:17118–25.
34. Vanier MT, Neuville P, Michalik L, Launay JF.Expression of specific tau exons in normal andtumoral pancreatic acinar cells. J Cell Sci 1998;111:1419–32.
35. Kamath K, Jordan MA. Suppression of microtubuledynamics by epothilone B is associated with mitoticarrest. Cancer Res 2003;63:6026–31.
36. Piperno G, LeDizet M, Chang XJ. Microtubulescontaining acetylated a-tubulin in mammalian cells inculture. J Cell Biol 1987;104:289–302.
Lonafarnib and Paclitaxel Enhance Tubulin Acetylation
www.aacrjournals.org 3893 Cancer Res 2005; 65: (9). May 1, 2005
Related Documents


