1 The Success of Computer Crime Act Implementation (UU ITE No.11 Year 2008) in the Higher Education Institution in Indonesian Rizki Yudhi Dewantara A Thesis Submitted in Fulfillment of the Requirements for the Degree of Master of Public Administration Prince of Songkla University 2013 Copyright of Prince of Songkla University

Welcome message from author
This document is posted to help you gain knowledge. Please leave a comment to let me know what you think about it! Share it to your friends and learn new things together.
Transcript

1
The Success of Computer Crime Act Implementation (UU ITE No.11 Year 2008)
in the Higher Education Institution in Indonesian
Rizki Yudhi Dewantara
A Thesis Submitted in Fulfillment of the Requirements for the Degree of
Master of Public Administration
Prince of Songkla University
2013
Copyright of Prince of Songkla University

2
Thesis Title The Success of Computer Crime Act Implementation
(UU ITE No.11 Year 2008) in the Higher Education Institution
in Indonesia
Author Mr. Rizki Yudhi Dewantara
Major Program Master of Public Administration
Major Advisor: Examining Committee:
………………………………….… ………..……………...…....Chairperson (Asst.Prof.Dr.Suwit Chanpetch) (Asst.Prof.Dr.Aniwat Kaewjomnong) Co-advisor: …………………..………………………. (Asst.Prof.Dr.Suwit Chanpetch) ……………………………………. …………………..………………………. (Prof.Dr.Bambang Supriyono) (Dr.Nuttida Suwanno)
………………………..……………….
(Prof.Dr.Bambang Supriyono)
The Graduate School, Prince of Songkla University, has approved this
thesis as fulfillment of the requirements for the Master of Public Administration
Degree.
..…………………………………
(Assoc.Prof.Dr.Teerapol Srichana) Dean of Graduate School

3
This is to certify that the work here submitted is the result of the candidate’s own
investigations. Due acknowledgement has been made of any assistance received.
..……………………….……..... Signature
(Asst.Prof.Dr.Suwit Chanpetch)
Major Advisor
………………………….……... Signature
(Rizki Yudhi Dewantara)
Candidate
4
I hereby certify that this work has not been accepted in substance for any degree, and
is not being currently submitted in candidature for any degree.
..……………………………..... Signature
(Rizki Yudhi Dewantara)
v
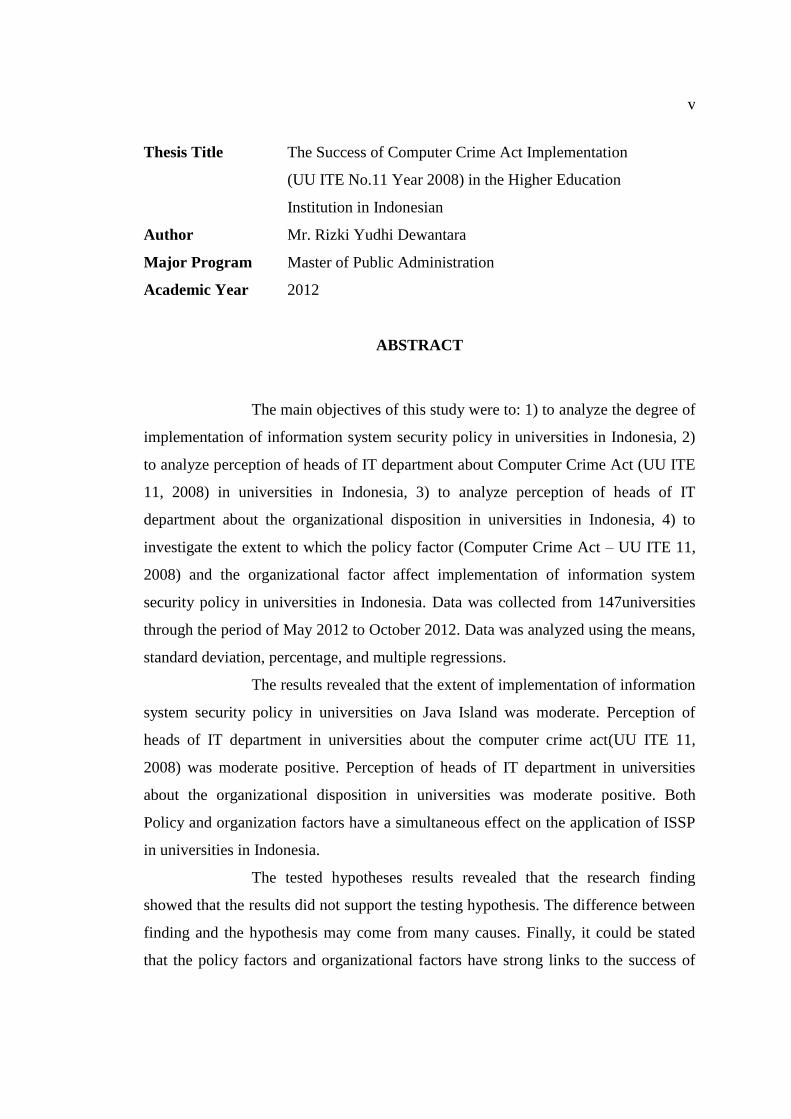
Thesis Title The Success of Computer Crime Act Implementation
(UU ITE No.11 Year 2008) in the Higher Education
Institution in Indonesian
Author Mr. Rizki Yudhi Dewantara
Major Program Master of Public Administration
Academic Year 2012
ABSTRACT
The main objectives of this study were to: 1) to analyze the degree of
implementation of information system security policy in universities in Indonesia, 2)
to analyze perception of heads of IT department about Computer Crime Act (UU ITE
11, 2008) in universities in Indonesia, 3) to analyze perception of heads of IT
department about the organizational disposition in universities in Indonesia, 4) to
investigate the extent to which the policy factor (Computer Crime Act – UU ITE 11,
2008) and the organizational factor affect implementation of information system
security policy in universities in Indonesia. Data was collected from 147universities
through the period of May 2012 to October 2012. Data was analyzed using the means,
standard deviation, percentage, and multiple regressions.
The results revealed that the extent of implementation of information
system security policy in universities on Java Island was moderate. Perception of
heads of IT department in universities about the computer crime act(UU ITE 11,
2008) was moderate positive. Perception of heads of IT department in universities
about the organizational disposition in universities was moderate positive. Both
Policy and organization factors have a simultaneous effect on the application of ISSP
in universities in Indonesia.
The tested hypotheses results revealed that the research finding
showed that the results did not support the testing hypothesis. The difference between
finding and the hypothesis may come from many causes. Finally, it could be stated
that the policy factors and organizational factors have strong links to the success of

vi
information systems security policy implementation at the universities and also the
success of the application of computer crime act (UU ITE 11, 2008).

CONTENTS
ABSTRACT .................................................................................................................. v
ACKNOWLEDGEMENT ......................................................................................... vii
CONTENTS ............................................................................................................. viii
LIST OF TABLES ...................................................................................................... xi
LIST OF FIGURES ................................................................................................. xiii
LIST OF ABBREVIATIONS .................................................................................. xiv
CHAPTER I ................................................................................................................. 1
INTRODUCTION ....................................................................................................... 1 1.1 Background of Study ........................................................................................................... 1 1.2 Conceptual Framework ........................................................................................................ 5 1.3 Question of the Research ..................................................................................................... 6 1.5 Hypothesis ............................................................................................................................ 7 1.6 Benefit of the Research ........................................................................................................ 8 1.7 Scope of the Research .......................................................................................................... 8 1.8 Definition of Terms .............................................................................................................. 9
CHAPTER 2 ............................................................................................................... 11
LITERATURE REVIEW ......................................................................................... 11 2.1 Public Administration, Public Policy, Public Policy Implementation and Its Process ...... 11
2.1.1 Public Administration ................................................................................. 11
2.1.2 Public Policy ............................................................................................... 12
2.1.3 Policy Implementation ................................................................................ 15
2.1.4 Policy Implementation Models ................................................................... 16
2.1.5 Successful Implementation ......................................................................... 22 2.2 Computer Crime and Computer Crime Act ....................................................................... 23
2.2.1 Definition of Computer Crime .................................................................... 24
2.2.2 Categorize of Computer Crime ................................................................... 25
2.2.3 Computer Crime Prevention ....................................................................... 30

2.3 Previous Research .............................................................................................................. 33 2.3.1 Previous Study on Computer Crime ........................................................... 33
2.3.2 Previous Study on Policy Implementation .................................................. 36
2.4 Identification of Dependent Variables and Independent Variables ................................... 37 2.4.1 Dependent Variable .................................................................................... 37
2.4.2 Independent Variables ................................................................................ 42
2.4.3 Factors of Organization ............................................................................... 45
CHAPTER III ............................................................................................................ 53
RESEARCH METHODOLOGY ............................................................................. 53 3.1 Data and Data Collection ................................................................................................... 53
3.1.1 Types of Data .............................................................................................. 53
3.1.2 Population and Sample ............................................................................... 53
3.1.3 Data Collection Method and Research Tools ............................................. 55
3.1.4 Validity and Reliability Test ....................................................................... 56 3.2 Data Analysis ..................................................................................................................... 57
3.2.1 Descriptive analysis and criteria ................................................................. 57
3.2.2 Quantitative Analysis .................................................................................. 59
CHAPTER IV ............................................................................................................ 65
RESULTS ................................................................................................................... 65 4.1 General Information of the Sample .................................................................................... 65 4.2 Descriptive statistics of variables ....................................................................................... 66
4.2.1 Dependent Variable .................................................................................... 66
4.2.2 Independent Variables ................................................................................ 77 4.3 Hypotheses Testing ............................................................................................................ 87
CHAPTER V .............................................................................................................. 92
SUMMARY, DISCUSSION AND RECOMMENDATIONS ................................ 92 5.1 Summary ............................................................................................................................ 92 5.2 Discussion .......................................................................................................................... 94
5.2.1 Level of implementation of ISSP in universities in Indonesia ................... 94
5.2.2 Factor of policy (the Computer Crime Act - UU ITE 11, 2008) ................ 95
5.2.3 Factor of organization ................................................................................. 95

5.2.4 Factors effecting implementation of information security policy ............... 96 5.3 Recommendations .............................................................................................................. 97
5.3.1 Recommendation to universities ................................................................. 97
5.3.2 Recommendation to government ................................................................ 98
BIBLIOGRAPHY .................................................................................................... 100
APPENDICES .......................................................................................................... 106 Appendix 1 Draft of Questionnaire ........................................................................................ 106 Appendix 2 Data Processing Result ....................................................................................... 110 Appendix 3 List of Respondent ............................................................................................. 124 Appendix 4 Research Site ...................................................................................................... 126
VITAE ....................................................................................................................... 128

LIST OF TABLES
Table 2.1 Variables, Indicators/sub indicator, and Sources of questions .................. 50
Table 3.1 Amount of population and sample of universities in Java Island by
province ...................................................................................................... 54
Table 3.2 Criteria of Likert Scale ............................................................................... 56
Table 3.3 Reliability Score for each group of indicator ............................................ 57
Table 3.4 Criteria for interpreting descriptive statistics in dependent variable ......... 58
Table 3.5 Criteria for Independent Variables ............................................................ 59
Table 4.1 Frequency and percentage of universities sample classified by province . 66
Table 4.2 Mean and interpretation of ISSP implementation ..................................... 66
Table 4.3 Mean and interpretation of administrative preparation ............................. 67
Table 4.4 Frequency and percentage of total item applied in administrative
preparation ................................................................................................. 68
Table 4.5 Frequency and percentage of universities implement activities in setting
working group. ........................................................................................... 69
Table 4.6 Frequency and percentage of total items in setting working group activities
in Universities ............................................................................................ 70
Table 4.7 Frequency and percentage of information system security policy ............ 71
Table 4.8 Frequency and percentage of item used in information system security
policy .......................................................................................................... 71
Table 4.9 Frequency and percentages of availability of ISSP document .................. 72
Table 4.10 Frequency and percentage of items used in ISSP document ..................... 73
Table 4.11 Mean and interpretation of technical preparation ...................................... 73
Table 4.12 Frequency and percentage of total indicator used in technical preparation
.................................................................................................................... 74
Table 4.13 Frequency and percentage of items applied in universities as an access
service provider .......................................................................................... 75
Table 4.14 Frequency and percentage of items applied in universities as an access
service provider .......................................................................................... 75
Table 4.15 Frequency and percentage of items applied in universities as a hosting
service provider .......................................................................................... 76
Table 4.16 Frequency and percentage of indicators applied in universities as a hosting
service provider .......................................................................................... 77
Table 4.17 Mean and standard deviation of independent variables ............................. 77
Table 4.18 Mean, standard deviation, and interpretation of factors of policy ............. 78
Table 4.19 Percentages, mean, and standard deviation of response regarding objective
and purpose of the Act ............................................................................... 79
Table 4.20 Percentage, mean, and standard deviation of responses regarding clarity of
the Act ........................................................................................................ 80
Table 4.21 Percentages, mean, and standard deviation of responses regarding control
process of the Act ....................................................................................... 81
Table 4.22 Mean, standard deviation, and interpretation of organization factor ......... 82
Table 4.23 Percentage, mean, and standard deviation of responses regarding
leadership style in universities ................................................................... 83
Table 4.24 Percentages, mean, and standard deviation of responses regarding human
resources in universities ............................................................................. 84
Table 4.25 Percentage, mean, and standard deviation of responses regarding
organizational structure in university ......................................................... 85
Table 4.26 Percentages, mean, and standard deviation of responses regarding funding
and physical resources in universities ........................................................ 86
Table 4.27 Administrative preparation regression analysis results ............................. 88
Table 4.28 Technical preparation regression analysis results ...................................... 89
Table 4.29 ISSP regression analysis results ................................................................. 90
LIST OF FIGURES
Figure 2.1 The Policy Cycle ........................................................................................ 13
Figure 2.2 Van Meter and Van Horn’s model of implementation ............................... 17
Figure 2.3 Edwards’ model of implementation ........................................................... 18
Figure 2.4 Mazmanian and Sabatier’s Statutory-Coherence Approach ...................... 20
Figure A.1 Map of Indonesia ..................................................................................... 126
Figure A.2 Map Of Java Island, Indonesia ................................................................ 127
LIST OF ABBREVIATIONS
IS Information System
ISSP Information System Security Policy
IT Information Technology
ITE Information and Electronic Transaction
UU Undang-Undang (Act or Laws)
CHAPTER I
INTRODUCTION
1.1 Background of Study
Computers are now faster, more powerful, smaller, cheaper, and more
user-friendly. Computer systems have grown and evolved in the society, businesses
and personal lives among us. Currently, computer systems become a staple of modern
business, banking, and government to carry out its activities. Business activities and
government rely on computers, especially activities that are based on e-mail or web.
Without computers, the global business and government operations will cease. The
survey sites on the Internet mentioned of the computer users in the world reach
billions of people, whereas computer users are connected to the Internet known as
2,405,518,376 people (http://www.internetworldstats.com/stats.htm/June 2012).
Advances in computer technology, information and communication
systems bring new crime that has different characteristics from conventional crimes.
It is estimated that crime using computer technology has led to substantial losses. The
increasing number of users of computers and information technology supports the
crimes. Computer crime has no limit by age, sex, and race while the computer that has
the potential to cause offense, and then anyone can commit a crime (Doney, 2001,
31). The motives of computer criminal might be various, which ranges from money to
fun, from economic gain to intellectual challenge, from revenge to "why not?" In

2
some cases, there may be more than one motivational factor (Icove, Seger and Storch,
1995; 66).
Indonesia already has a criminal record in the computer field since the
beginning of 1980; the case was an attack on a bank's computer system by employees
that existed in a government bank. Other forms of computer crime in recent year are
piracy and theft of websites over the Internet, pornography and harassment through
social networking sites. According to the Association of Indonesian Internet Service
Provider (APJII) in 2003, 2267 cases of network incidents were recorded and in 2004,
in which there were 1103 cases. The government does not process strictly on these
cases, and many victims did not report the crime (www.tekno.kompas.com/read/2008/
06/07/15301865). Despite hacking cases found in Indonesia, according to research
data of V and IT Criminal Investigation Police Cybercrime Unit, only two cases of
successful hacking were exposed and processed to court. The case is piracy which
happened in General Elections Commission (KPU) website in 2004 and the Golkar
party website hacking case in 2006. Both cases have attracted public attention. Until
now, web hacking is a case that is common and government institutions subject to the
most frequent targets (depkominfo, 2012). A survey noted, in 2010 Indonesia have
around 1.9 million of broadband subscribers, 220 million mobile cellular subscribers,
and 38 million fixed telephone subscribers. Moreover, there are around 55 million
Internet connections that provide in Indonesia (depkominfo, 2011). This will give an
opportunity to increase the number of computer crimes in line with the growth of the
user of information technology.
The Indonesian government has tried to anticipate the occurrence of
computer crime by setting a draft of computer crime law since 2000, at 2004 the latest

3
revision of the proposed law of information technology was sent to the Secretariat of
the Republic of Indonesia by the Ministry of Communication and Information, and to
parliament but returned to corrected. However, there are some positive laws that can
be applied to the perpetrators of cybercrime, such as:
a. Indonesian Criminal Code (Kitab Undang Undang Hukum Pidana)
b. Law of Republic Indonesia No. 19 Year 2002 concerning Copyrights.
(Undang-Undang No 19 Tahun 2002 tentang Hak Cipta)
c. Law of Republic Indonesia No. 36 Year 1999 concerning
Telecommunication. (Undang-Undang No 36 Tahun 1999 tentang Telekomunikasi)
After going through a long process, finally the president has signed the
Indonesia Computer Crime Act (UU ITE 11, 2008) on 25 March 2008. This Act is the
main piece of legislation that regulates computer crimes; although the other laws that
prosecute various types of computer crime.
Since the computer crime act (UU ITE 11, 2008) applied in Indonesia,
many questions arise whether this Act has fully been implemented in the every layer
of society or whether it has implemented effectively. Effective is successful in
producing a desired or intended result. Implementing the act can be said to be
successful if the goal is reached. The assessment of the success implementation of
public policy is in accordance with the opinion of the Matland, which, goals of the
statute are achieved (Matland, 1995:154). Furthermore, the adoption of Computer
Crime Act was not adequate to prevent computer crime: The law does not apply itself.
Successful implementation also depends on both the legal factors and several factors,
including a committed and skilled leadership, capacity, and resources of the
institution.
4
Universities in Indonesia have currently been dominated by using IT
devices, whether hardware, software, and computer networks, that crime can occur.
Crimes such as theft of data, access to which is not legal, pornography, sexual
harassment, and hacking sites owned by other institutions, which were carried out
within universities. In addition, universities are not immune from the threat of piracy
from the outside because universities have strategic data stored in data storage centers
owned by the institution, so it attract others people to try to penetrate the computer
systems in education institution with various motives. Computer crime cases occur in
universities, like stealing or modifying data that are confidential. These data could be
misused for personal benefit or group of people. Another case occurs such as,
destroying the necessary data that is stored in data center by the break through the
security information systems and spread the virus so that the user cannot access the
data. Based on information mentioned above, the computer system at Indonesia
Universities needs to protect from all forms of criminal acts that will be and are
happening at universities.
In order to prevent computer crime, universities must provide the
prevention of computer crimes in accordance with the computer crime act (UU ITE
11, 2008). In Article 4 point D, the objectives of the computer crime act (UU ITE 11,
2008) are to give senses of security, justice, and legal certainty for Information
Technology users and providers. Therefore, universities as the user and providers of
IT must apply ISSP in their work place as a part of contribution success of public
policy implementation. In this study, the researcher will find out the process of ISSP
implementation on universities and which factors influence it.

5
Despite extensive research on policy implementation, there is no
research about success of the implementation Computer Crime Act to prevent
computer crime in universities.
This study is to determine the extent to which universities implements the
computer crime act that is Information System Security Policy (ISSP) and to examine
factors that affect the implementation of the computer crime act that hypothesized to
influence computer crime prevention in universities.
1.2 Conceptual Framework
To conduct the research, researcher postulated that the implementation of
ISSP can affect directly to computer crime prevention in an organization, but the
impact of such act depends on how effectively implemented. The proposed model for
this study shown in figure 1.1

6
Figure 1.1 Proposed Conceptual Frameworks
1.3 Question of the Research
To conduct the research, the formulated research questions are as follows:
1) To what extent is implementation information system security policy in
universities in Indonesia?
2) What is the perception of heads of IT department about the factor of policy
(Computer Crime Act -UU ITE 11, 2008) in universities in Indonesia?
3) What is the perception of heads of IT department about the organizational
factors in universities in Indonesia?
4) To what extent do policy and organization variables affect the
implementation of information system security policy in universities in Indonesia?
Implementation of Information System Security Policy
1. Administrative Preparation
1.1 Setting Working Group 1.2 Setting Information Security
Policy 1.3 Enhancing knowledge to the IT
User
2. Technical Preparation 2.1 Universities as an access
service provider 2.2 Universities as a hosting
service provider
Law Factors
1. Objectives and purposes of the act
2. Communication/ Socialization
3. Control process
Organizational Factors 1. Leadership
2. Human Resources 3. Organizational Structure
4. Fund and Physical Resources

7
1.4 Objective of the Research
This research aims:
1) To analyze the degree of implementation of information system security
policy in universities in Indonesia.
2) To analyze perception of heads of IT department about computer crime act
(UU ITE 11, 2008) in universities in Indonesia.
3) To analyze perception of heads of IT department about the organizational
disposition in universities in Indonesia.
4) To investigate the extent to which the policy factor (Computer Crime Act –
UU ITE 11, 2008) and the organizational factor affect implementation of information
system security policy in universities in Indonesia.
1.5 Hypothesis
Based on the proposed conceptual framework, six hypotheses were developed
and analyzed.
1) The degree of implementing information system security policy in
universities in Indonesia is high.
2) Perception of heads of IT department about the computer crime act (UU
ITE 11, 2008) in universities in Indonesia is highly positive.
3) Perception of heads of IT department about the organizational disposition
in universities in Indonesia is highly positive.

8
4) Only the policy factor (Computer Crime Act – UU ITE 11, 2008) affect
positively on implementation of information system security policy in universities in
Indonesia.
1.6 Benefit of the Research
Findings obtained from this research will share valuable information to
universities and Government of Indonesia in order to improve the success the
implementation of computer crime act (UU ITE 11, 2008).
This research value will enrich the substantive scope related computer
crime act implementation (UU ITE 11, 2008) in universities in Indonesia.
Theoretically, the result and findings in this research will strengthen
the concept of public policy implementation in the context of success of act
implementation in universities.
This research will share benefit value to other research related to
public policy implementation especially in act implementation in other institution or
society.
1.7 Scope of the Research
This research focuses on success of implementation information
system security policy in universities in Indonesia.
1.7.1 Scope of the Content
The content studied in this research is as followed:

9
1) The degree of implementation information system security policy in
universities in Indonesia
2) The opinion of heads of IT department toward computer crime act
(UU ITE 11, 2008)
3) The opinion of heads of IT department toward the organizational
disposition of universities in Indonesia
4) Factors affecting implementation information system security policy
in universities in Indonesia.
Scope of content has been shown in the research framework.
1.7.2 Population
The populations in this study are universities in Indonesia and based
on Java Island.
1.8 Definition of Terms
The definitions used in this study are presented as follows:
1.8.1 Information System Security Policy
Information system security policy is a regulation that can bind to all
users and employees at the venue that is comprehensive and standards. There are
many standards that can be used; those standards usually made by a vendor of IT
solutions. For example, standardization of cabling, server room construction
standards, standardization of server farm, and so on.

10
1.8.2 Computer Crime Act (UU ITE 11, 2008)
The Law/Act refers to a binding custom that in other word is a practice
of a community or the whole body of such customs, practices, or rules
(http://www.merriam-webster.com/dictionary). The Act on Information and
Electronic Transactions Number 11, Year 2008 (UU ITE 11, 2008), is provisions
applicable to any person to take legal actions as stipulated in this Law, either within
or outside the jurisdiction of Indonesia, which has the effect of law in the territory of
Indonesia and/or outside the Indonesian law and prejudice the interests of Indonesia.
1.8.3 Organizations
University is organization that is observed in this study. University is
an institution of higher education and research that provide academic degrees in a
variety of subjects and provides undergraduate and graduate education. A university
in Indonesia is regulated in the Law of the Republic of Indonesia Number 12 Year
2011.

CHAPTER 2
LITERATURE REVIEW
The main objectives in this chapter are to review previous literature
regarding public administration, public policy implementation, computer crime,
computer crime act, information system security policy, particularly success factors in
implementing computer crime act in higher education institution and to propose
model for analysis.
2.1 Public Administration, Public Policy, Public Policy Implementation and Its
Process
Before we describe to the main topic about public policy process and
policy implementation, researcher will describe the term of public administration.
Public policy and policy implementation is part of public administration.
2.1.1 Public Administration
There is some definition of public administration: Rosenbloom and
Kravchuck specify the term of public administration as follows: Public administration
is the use of managerial, political and legal theories and processes to fulfill legislative,
executive, and judicial mandates for the provision of government regulatory and
service functions (Rosenbloom and Kravchuk, 2005:4). Other definition state by
Gordon and Milakovich (1995) they mentioned that Public administration may be
defined as all processes, organizations, and individuals (the latter acting in official

2
positions and roles) associated with carrying out laws and other rules adopted or
issued by legislatures, executives, and courts (cited from Stillman, 1996:3).
In this study we will concern on public administration as a managerial
approach. According to some authors, public administration is centrally concerned
with the organization of government policies and program as well as the behavior of
official formally responsible for their conduct (ECOSOC, 2006:5).
2.1.2 Public Policy
According to Anderson (1979:3), policy is a purposive course of action
followed by an actor or set of actors in dealing with a problem or matter of concern
(cited from Hill and Hupe, 2002:5). This concept of policy focuses attention on what
is actually done as against what is proposed or intended, and it differentiates a policy
from a decision, which is a choice among competing alternatives. Public policy is
those policies developed by governmental bodies and officials. Policy can be defined
as the programmatic activities formulated in response to an authoritative decision.
These activities are the policy designer’s plan for carrying out the wishes expressed
by a legitimating organization, be it a legislature, judicial agent, or an executive body
(Matland, 1995:154).
In public policy process, there are five steps and in each steps there are
some key questions that must be answered to understand what the activities in each
steps are, as follows:
Problem identification: What is a policy problem? What makes it a
public problem? How does it get on the agenda of government?
Formulation: How are alternatives for dealing with the problem
developing? Who participates in policy formulation?

3
Adoption: How is policy alternative adopted or enacted? What
requirements must be met? Who adopts policy? What processes are used? What is the
content of the adopted policy?
Implementation: Who are involved? What is done, if anything, to carry
a policy into effect? What impact does this have on policy content?
Evaluation: How is the effectiveness or impact of a policy measured?
Who evaluates policy? What are the consequences of policy evaluation? Are there
demands for change or repeal? (Anderson, 1979:24)
Policy process stated by Lester and Steward could be depicted as
policy cycle in figure 2.1.
Figure 2.1 The Policy Cycle
Source: Lester and Steward (2000:5)

4
Lester and Steward (2000:5), explained there are six stages of policy
process, as follows:
Agenda setting
Agenda setting is described as a set of political concerns meriting the
attention of the polity, and it included both systemic agendas and institutional
agendas.
Policy formulation
Policy formulation or policy adoption usually defined as the passage of
legislation designed to remedy some past problem or prevent some future public
policy problem. Originally, policy formulation was explained in terms of an elitist or
pluralist model. More recently, however, policy formulation is viewed as the result of
a multitude of forces that affect policy outputs, such as historical/geographic
conditions, socioeconomic conditions, mass political behavior (including public
opinion, interest groups, and political parties), governmental institutions (including
legislatures, courts, and the bureaucracy), as well as elite perceptions and behavior.
Policy implementation
It has most have been described as what happens after a bill becomes
law. Simply enacting legislation is no guarantee that action will be taken to put the
law into effect or that the problem will be solved. Law must be translated into specific
guidelines so that the federal, state, or local bureaucracy can see to it that the intent of
the legislation is achieved at the point where the policy is to be delivered. The
implementation process can be defined as a series of governmental decisions and
actions directed toward putting an already decided mandate into effect.
5
Policy evaluation
Policy evaluation is concerned with what happens as a result of the
public policy, that is, what happens after a policy is implemented. It is concerned with
the actual impacts of legislation or the extent to which the policy actually achieves its
intended results.
Policy change
As an analytical concept, policy change refers to the point at which a
policy is evaluated and redesigned so that the entire policy process begins anew.
Policy termination
Policy termination is a means of ending outdated or inadequate
policies. Some programs are found to be unworkable and thus need to be abolished,
whereas other programs are often scaled back due to a shortage of resources or for
purely non-rational or symbolic reasons. Essentially, policy termination is the end
point of the policy cycle. It can mean many things, such as agency termination, policy
redirection, project elimination, partial elimination, or fiscal retrenchment.
2.1.3 Policy Implementation
Policy Implementation is one of the most important stages of the
overall process of public policy. Policy implementation is a series of activities after a
policy has been formulated. Without a policy implementation process, a policy would
be in vain. Thus, policy implementation is a chain that connects the formulation of
policies with the output (outcomes) policy.
According to De Leon (cited from Hill, 2002:2) policy implementation
is a way to know what happens between policy expectations and (perceived) policy
results. Van Meter and Van Horn (1975:447) indicate that policy implementation

6
encompasses those actions by public and private individuals (or groups) that are
directed at the achievement of objectives set forth in prior policy decision.
2.1.4 Policy Implementation Models
Chuayrak (cited from Peerapong, 2010: 48) state that, the study of a
policy implementation model is an attempt to investigate the relationships among
various factors, which may cause the success or failure of the policy implementation.
Practically, it is understood that the factors affecting the implementation of the policy
may vary because of the context around it studies, such as the organization economic
situation, time, implementers, etc. The following section will briefly review some of
the models of policy implementation from study of literature for further development
of the model framework for this study.
According to Van Meter, Van Horn, Mazmanian, and Sabatier (cited
from Matland, 1995, 146), top down models see implementation as concern with the
degree to which the actions of implementing officials and target groups coincide with
the goals embodied in an authoritative decision. Mazmanian and Sabatier define
implementation as “the carrying out of basic policy decision, usually incorporated in a
statute but which can also take the form of important executive orders or court
decisions…” The starting point is the authoritative decision; as the name implies,
centrally located actors are seen as most relevant to producing the desired effects.

7
Figure 2.2 Van Meter and Van Horn’s model of implementation
Source: Van Meter and Van Horn (1975:463)
Van Meter and Van Horn posited six variables that were believed to
shape the linkage between policy and performance. Their variables included the
following: (1) policy standards and objectives; (2) policy resources (e.g., funds or
other incentives); (3) inter-organizational communication and enforcement activities;
(4) characteristics of implementing agencies (e.g., staff size, degree of hierarchical
control, organizational vitality); (5) economic, social, and political conditions (e.g.,
economic resources within the implementing jurisdiction, public opinion, interest-
group support); and (6) the disposition of the implementers.
The model of implementation process from Van Meter and Van Horn
is depicted in figure 2.2. Based on figure 2.2, we could conclude that Van Meter and
Van Horn have formulated the pattern of interrelation among factors influencing the
performance of policy implementation. Implementation needs resources. The
performance of policy implementation is low if government does not allocate enough
Inter-‐organizational Communication and Enforcement Activities
Characteristics of the Implementing Agencies
Economic, Social, and Political Conditions
The Disposition of Implementer
POLICY
Standard and
Objectives
Resources
PER
FOR
MA
NC
E

8
money. All implementers must understand what the aims of policy are. The
understanding of policy aims could be developed through communication process in
organization. Social, economy, and political condition also influence policy
implementation. Support for policy implementation from political elites, society,
interest groups, and private sector is needed to the effectiveness of policy
implementation. Some factors like resources, communication process, and condition
of social, economy, and politic will shape the attitude and behavior of implementers
when they implement the policy
Figure 2.3 Edwards’ model of implementation
Source: Edwards (1980: 148)
Edwards (1980: 147-171) proposed an implementation model for
policy outcomes-success or failures from the organizational perspective. The model
comprises four factors interacting with implementation performance (outcomes):
communication; bureaucratic structure; resources; and dispositions. He believed that
Communication
Bureaucratic Structure
Disposition
Resources
Implementation

9
each factor played both supporting and obstructing roles in policy implementation.
Therefore, it is necessary for implementers or analysts to understand and handle the
interaction of these factors together.
In the most fully developed top-down model, Mazmanian and Sabatier
(cited from Matland, 1995:147) present three general sets of factors (tractability of the
problem, ability of statute to structure implementation, and non statutory variables
affecting implementation), which they argue, determine the probability of successful
implementation.
Top-downers have exhibited a strong desire to develop generalizable
policy advice. This requires finding consistent, recognizable patterns in behavior
across different policy areas. Belief that such patterns exist and the desire to give
advice has given the top-down view a highly prescriptive bent and has led to a
concentration on variables that can be manipulated at the central level. Common top-
down advice is: Make policy goals clear and consistent; minimize the number of
actors, limit the extent of change necessary, and place implementation responsibility
in an agency sympathetic with the policy’s goals (Matland, 1995:147).
Mazmanian and Sabatier’s framework is comprehensive and combine
stop-down and bottom-up concerns. The framework comprises three broad categories
of variables: (1) the tractability of the problem being addressed (four variables), (2)
the ability of legislation to structure positive implementation (seven variables), and
(3) the net effect of political variables relating to support for statutory objectives (six
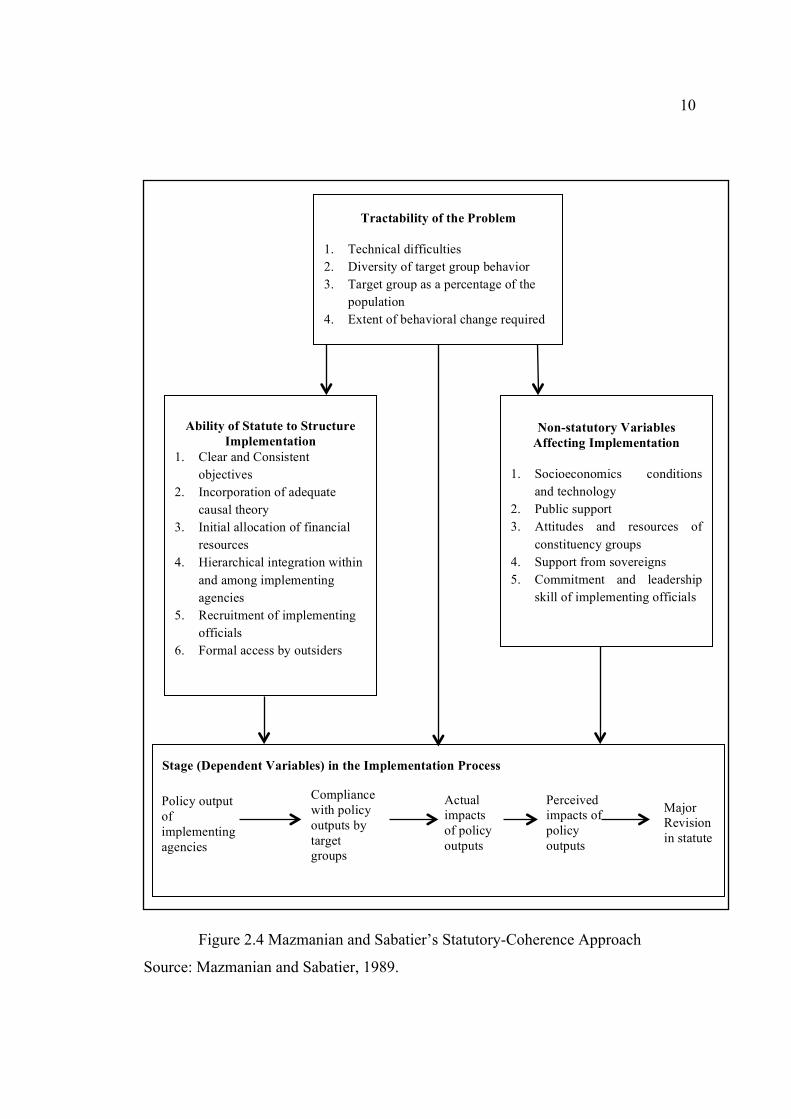
variables). The model is illustrated in Figure 2.4.
10
Figure 2.4 Mazmanian and Sabatier’s Statutory-Coherence Approach
Source: Mazmanian and Sabatier, 1989.
Ability of Statute to Structure Implementation
1. Clear and Consistent objectives
2. Incorporation of adequate causal theory
3. Initial allocation of financial resources
4. Hierarchical integration within and among implementing agencies
5. Recruitment of implementing officials
6. Formal access by outsiders
Stage (Dependent Variables) in the Implementation Process
Tractability of the Problem 1. Technical difficulties 2. Diversity of target group behavior 3. Target group as a percentage of the
population 4. Extent of behavioral change required
Non-statutory Variables Affecting Implementation
1. Socioeconomics conditions
and technology 2. Public support 3. Attitudes and resources of
constituency groups 4. Support from sovereigns 5. Commitment and leadership
skill of implementing officials
Policy output of implementing agencies
Compliance with policy outputs by target groups
Actual impacts of policy outputs
Perceived impacts of policy outputs
Major Revision in statute

11
The tractability of problems is concerned with the difficulty of the
issue being confronted by the government. The capacity of programs to be effectively
implemented may be limited by constraints, such as technical difficulties, including
technological requirements, the diversity of behavior being regulated, and the extent
of behavioral change required from target groups.
The ability of legislation to structure implementation relates to the
legal and institutional resources available to enforce program objectives. This
category is concerned with implementation variables, such as the precision and
ranking of program objectives, the allocation of financial resources, and the
hierarchical integration of implementing agencies, regulations applying to
implementing agencies, the commitment of officials to program objectives, and the
legal mandates given to target groups. Non-statutory variables affecting
implementation are concerned with external factors that may impact programs.
Important influences include changes in technology, economic or social conditions,
variations in public support, the attitudes and resources of constituency groups, and
the commitment and legal skills of implementing officials.
Mazmanian and Sabatier synthesized these variables into six
conditions of effective implementation: the clarity and consistency of program
objectives, the extent to which programs incorporate adequate causal (cause and
effect) theory; the extent to which implementation structures support the achievement
of objectives; the commitment and management skills of implementing officials and
agencies; the commitment and active support of organized interest groups, the public,
politicians and/or senior officials; changes in socio-economic, public policy, or

12
technological conditions that do not frustrate program objectives, negate causal
theory, or diminish political support.
2.1.5 Successful Implementation
Ingram and Schneider (cited from Matland, 1995:154) note several
plausible definitions of successful implementation. Among these are: agencies comply
with the directives of the statues; agencies are held accountable for reaching specific
indicators of success; goals of the statute are achieved; local goals are achieved, or
there is an improvement in the political climate around the program In this study, the
focus will see on outputs of the policy implementation. Speaking of outputs and
outcomes implicitly or explicitly means making judgments, in study of
implementation a qualification in terms of ‘success’ or, more often, ‘failure’ is
commonly given. Parson (cited from Hill and Hupe, 2002:10) concludes about the
failure of implementation seen as a result of a poor chain of command and of
problems with structures and roles (machine metaphor); as a result of difficult ‘human
relations’ or ‘the environment’ (organism metaphor); as a result of poor information
flows or ‘learning’ problems (brain metaphor); as a result of labor/management
conflict (domination metaphor); as a result of the ‘culture ’of an organization (culture
metaphor); as a result of subconscious forces, group-think, ego defenses or repressed
sexual instincts (psychic metaphor);as a result of a ‘self-referencing’ system
(autopoietic metaphor); or as a result of power in and around the implementation
process (power metaphor).
Voradej Chandarasorn (cited from Phaopeng, 58: 2010) viewed that
performance in term of success or failure of governmental development programs can
be categorized into three dimensions, as follows.

13
Dimension 1: Policies’ achievement should be considered at three
levels: output, outcome, and ultimate outcome. The output level measures to what
extent the policy has achieved its desired objectives. The outcome level of program
achievement, which is the consequence for the society that flows from the output,
intended or unintended, can be responsibility, etc., to the benefit of the program as
desired. The ultimate outcome level is constituted by the contribution of output and
outcome to country development.
Dimension 2: The success of one policy must not have negative
impacts on other policies or lead to harmful consequences. For example, a welfare
program may improve the income situation of the groups’ benefit as intended, but the
policy success may also have an effect on their initiative to seek employment and
create a dependency attitude among American citizens. In addition, the success of one
program must not be suspected for its validity or reliability. Furthermore, the
measures or approaches of a program must not create any difficulties or problems in
practice or in being applied to real situations.
Dimension 3: The goals and objectives of successful policies will
combine and lead to the overall improvement of the society and the country. Policy
success in this dimension can be considered from the administrative function
structured in each governmental department or ministry, which must be integrated for
the entire society’s benefit rather than its own jurisdiction.
2.2 Computer Crime and Computer Crime Act
In recent times, a lot of attention led to the development of technology
is growing so rapidly. The development of computer technology is quite remarkable

14
developments in digital technology. Similarly, the negative impacts, computer crime
pose a serious threat to all users of the technology as well as ordinary people. Here are
some definitions and a variety of computer crime and its mitigation.
2.2.1 Definition of Computer Crime
In this age of automation and connectivity, almost no organization is
exempt from computer crime. This section outlines the most common targets for
computer crimes:
1) Military and intelligence computers may be targeted by espionage
agents.
2) Businesses may be targeting by their competitors.
3) Banks and other financial organizations may be targeted by
professional criminals.
4) Any organization but especially government and utility company
computers, may be the target of terrorists.
5) Any company may be the target of employees or ex-employees.
Similarly, universities may be the target of students and former students.
6) Any organization may be the target of crackers, sometimes they're
in it for the intellectual challenge, and sometimes they are professionals who may do
it for hire. (Eastomm and Taylor, 2011:4)
FBI investigators recognize two basic kinds of computer crime: (1)
crimes facilitated by computers, as money laundering, transmission of pornography,
or different kinds of fraud; and (2) crimes where a computer itself is the target of
intrusion, data theft, or sabotage. (Newton, 2008:121). Other than that Laudon also
expresses the definition of computer crimes as follows: “Computer crime is the

15
commission of illegal acts through the use of a computer or against a computer
system. Computers or computer systems can be the object of the crime (destroying a
company’s computer center or a company’s computer files), as well as the instrument
of a crime (stealing valuable financial data by illegally gaining access to a computer
system using a home computer)”. (Laudon, 2008:264).
2.2.2 Categorize of Computer Crime
Computer Crimes can be performed by outsiders who penetrate a
computer system or by insiders who are authorized to use the computer system but are
misusing their authorization (Turbat et al., 2005:383). In categorizing of Computer
Crime, Eastomm and Taylor (2011:4) clearly mention about categories of computer
crime. In contrast, computer crime is generally broken into categories that emphasize
the specific criminal activity-taking place rather than the technological process used
to execute the attack. Such lists would be similar to the following:
1) Identity theft
Identity theft is the process of obtaining personal information so that
the perpetrator can pretend to be someone else. The U.S. Department of Justice
defines identity theft in this manner: “Identity theft and identity fraud are terms used
to refer to all types of crime in which someone wrongfully obtains and uses another
person’s personal data in some way that involves fraud or deception, typically for
economic gain.” It is important to consider the means by which identity theft occurs.
The first and most crucial step for the perpetrator is to gain access to personal data so
that it can be used in identity theft. There are four primary ways that one can gain
access to personal information:

16
a. Phising: is any process designed to elicit personal data from the
targeted victim. This is often done via e-mail. A common scenario could involve the
perpetrator setting up a fake Web site that is designed to look like the Web site of a
legitimate financial institution (a bank, credit-card company, etc.). Then, the
perpetrator sends e-mails to as many people as possible, informing them that their
account needs verification and providing them with a link they can click to log on and
verify their account. When someone clicks the link, he or she is taken to the fake Web
site; when the victim enters his or her login information to “verify” the account, that
person provides the perpetrator with his or her username and password. The
perpetrator can then log on to the victim’s real account and steal funds.
b. Hacking or spyware: To some security professionals, it may seem
strange to categorize hacking and spyware together, but when it comes to identity
theft, both hacking and spyware have the same goal: to gain access to a computer
system in order to obtain personal data. Hacking involves trying to compromise a
system’s security in order to gain unauthorized access. Whatever the method used, if
the target system has personal data that the perpetrator wants, he or she can then get
that data directly from the computer system. Spyware also has the goal of obtaining
personal data directly from the target machine. Unlike hacking, however, spyware’s
only goal is to get data from the target machine. Spyware usually involves some piece
of software that is loaded onto the target machine, without the knowledge of the
machine’s owner. That software might record any usernames and passwords entered,
all keystrokes, Web sites visited, or other data.
c. Unauthorized access of data: “Unauthorized access of data” refers to
a scenario in which a person accesses data that he or she has not been given

17
permission to access. A common scenario is when someone who has legitimate access
to some particular source of data chooses either to access data he or she is not
authorized to access or to use the data in a manner other than how he or she has been
authorized.
d. Discarded information: Unfortunately, individuals as well as
organizations often discard old data in a manner that makes it accessible to criminals.
This can be anything from throwing old bills in the trash to a company’s backup disks
being discarded in a Dumpster. In either case, a person could obtain the data medium
(paper, disk, drives, etc.) from the trash and then retrieve personal data.
2) Cyber stalking/harassment
Cyber stalking or harassment is using the Internet to harass or threaten
another person. Or, as the U.S. Department of Justice puts it: “Although there is no
universally accepted definition of cyber stalking, the term is used in this report to
refer to the use of the Internet, e-mail, or other electronic communications devices to
stalk another person. Stalking generally involves harassing or threatening behavior
that an individual engages in repeatedly, such as following a person, appearing at a
person’s home or place of business, making harassing phone calls, leaving written
messages or objects, or vandalizing a person’s property. Most stalking laws require
that the perpetrator make a credible threat of violence against the victim; others
include threats against the victim’s immediate family; and still others require only that
the alleged stalker’s course of conduct constitute an implied threat. While some
conduct involving annoying or menacing behavior might fall short of illegal stalking,
such behavior may be a prelude to stalking and violence and should be treated
seriously.

18
3) Unauthorized access to computer systems or data
We touched briefly on this area of computer crime in relation to
identity theft. In the broader class of computer crimes, however, unauthorized access
to computer systems or data can be for purposes other than identity theft. For
example, the perpetrator might wish to steal confidential corporate data, sensitive
financial documents, or other data. This information could be used to lure customers
away from a competitor, released in order to damage a company’s stock, or used for
blackmail. In any case, the common factor is that the perpetrator is either not
authorized to access the data.
4) Fraud
Fraud is a broad category of crime that can encompass many different
activities. A few of the more common Internet-based frauds include the following:
a. Investment offers: Being presented with unsolicited investment
offers is neither a new phenomenon nor necessarily a criminal activity. Even some
legitimate stockbrokers make their living by “cold calling”—the process of simply
calling people (perhaps from the phone book or some list of likely investors) and
trying to get them to invest in a specific stock. But although this practice it is
sometimes employed by legitimates stockbrokers, it should be noted that it is a very
popular approach with people perpetrating fraud.
b. Auction fraud: Online auctions are quite popular, and rightfully so.
It is often the case that a legitimate user can either find some hard-to-locate item at a
good price or unload items he or she no longer needs. As with many legitimate
business venues, however, criminals do attempt to manipulate auctions to steal from
their victims.

19
c. Check/money-order fraud: A variety of scams on the Internet
involve exchanging a fake money order or cashier’s check for real money. These
fraud schemes are quite common on the popular Craig list Web site.
d. Data piracy: The theft of intellectual property is rampant on the
Internet. For decades, pirated software has been bought, sold, traded, and
disseminated online. More recently, movies have been sold over the Internet. Whether
it is software, songs, or movies, the common denominator is that the perpetrator does
not have a legal right to the intellectual property. And whether the person is acquiring
the intellectual property for personal use, giving it to friends, or selling it, it is still a
crime.
5) Non-access computer crimes
Although this may sound like an odd category for computer crimes, it
encompasses a number of activities that can cause damage but do not involve the
perpetrator actually gaining access to the target system. The two most common types
of crime in this category are denial-of-service attacks and viruses; the most similar
physical-world crime would be vandalism. A denial-of-service attack is an attempt to
prevent legitimate users from being able to access a given computer resource. The
most common target would be a Web site. While there are a number of methods for
executing this type of attack, they all come down to the simple fact that every
technology can handle only a finite load. If you overload the capacity of a given
technology, it ceases to function.
Another common computer crime that often does not involve the
perpetrator directly accessing the target system is the dissemination of a virus. While
a virus is technically any piece of software that can self replicate, many viruses do far
20
more than that, from damaging system settings to deleting files. Even viruses without
a malicious payload can disrupt network traffic simply by constantly self-replicating.
2.2.3 Computer Crime Prevention
As a result of the emergence of computer crime, preventive actions
from owners and computer users from both business and government sectors are
needed. Although the government has issued laws on computer crime, agencies and
individuals also must play an active role in preventing activity using a computer or
other high tech tools that could potentially lead to crime. How to prevent computer
crime also vary, organization and individuals can protect their computer system with
data security and securing the computer networks. Computer Crime Act or law might
be the one way for prevents the crime. Many countries have used computer
technology or computer crime laws/act to fight the crimes. Developed countries like
the U.S. and several countries in Europe had already been implemented specifically
for computer crime laws to deal with this crime. European countries have been ahead
of the United States in developing legislation to deal with computer crime (Post and
Anderson, 2006:557). In 1980 US Government passed new laws concerning computer
crimes, and in 1986 Computer Fraud and Abuse Act and the Electronic
Communication Privacy Act were enacted. At the same year Scottish Law
Commission published a memorandum on computer crime and followed it up the next
year with a report (Scottish Law Commission 1996, 1987). United Kingdom uses the
UK Computer Misuse Act 1990 and the UK Data Protection Act 1998 (Walton,
2005). Countries in Asia are slower in applying computer crime law. India used the
Information Technology Act. 2000. Thailand used Computer Crime Act of 2007, and
Indonesia using the Information and Electronic Transaction Act. 2008.

21
1) Computer crime controls from government
Computer crime means that breaching the law, therefore the
perpetrators of computer crimes are the people against the law, but law is also not
fully effective if not supported from the behavior of individuals and organizations in
securing the computer systems. Federal, state, and local governments have obligations
to establish laws that provide a means for those unfairly injured to allow them to gain
compensation from those who did the damage. Instead, laws intended for other
purposes were stretched to cover computer crimes (Post and Anderson, 2006:556).
Another effort of the government is to establish computer crime
prevention agencies, as an example in the United States is National Infrastructure
Protection Center (NICP). This joint partnership between government and private
industry is designed to protect the nation’s infrastructure-its telecommunication,
energy, transportation, banking and finance, emergency, and governmental
operations. The FBI has also established Regional Computer Intrusion Squads, which
focus on intrusion to public switched networks, major computer network intrusion,
privacy, violations, industrial espionage, pirated computer software, and other
cybercrimes. Another national organization is the Computer Emergency Response
Team (CERT) at Carnegie Mellon University or www.cert.org (Turban et al.,
2005:387)
2) Computer crime controls from organization
Computer Security Policy needed for organizations that aim to secure
their computer systems. Every organization has its own policy in terms of securing
their computer systems to avoid the crime that appears. From some of the literature

22
and studies there are some defines about computer security that can prevent computer
crimes and most of them mention about controls. Information security means
protecting information and information system from unauthorized access, use,
disclosure, disruption, modification, or destruction (Vacca, 2009:225). Information
security and risk management including physical, technical, and administrative
controls surrounding organizational assets to determine the level of protection and
budget warranted by highest to lowest risk. The goal is to reduce potential threats and
money loss (Vacca, 2009:226). Protection is expensive and complex, therefore
organization must not only use controls to prevent or detect security problems, and
they must do so in an organized way, assigning responsibilities and authority
throughout the organization. Another activities relating to the computer crime
prevention in organization are securing the computer, and auditing information
systems (Turban et al., 2005:386-389).
Some of controls that can be put in place to enhance security (Vacca,
2009:232)
1) Administrative control consists of organizational policies and
guidelines that help minimize the exposure of an organization.
2) Technical controls use of software and hardware resources to
control access to information and computing systems, to help mitigate the potential
for errors and blatant security policy violations. Examples of technical control include
passwords, network and host-based firewalls, network intrusion detection systems,
and access control lists and data encryption.

23
3) Physical controls monitor and protect the physical environment of
the workplace and computing facilities. They also monitor and control access to and
from such facilities.
2.3 Previous Research
The case of computer crimes that occur at this time has had a wide
range of variations and forms. Many people assume that this crime will only occur in
business organizations, but in reality a computer crime can happen to any
organization either businesses or non-oriented businesses, as well as individuals. The
legislative and executive work hard to design and create a policy that can control the
crime that is in the form of an Act. The success of a policy implementation is a
collaboration of all relevant elements in it. Application of computer crime act (UU
ITE 11, 2008) in Indonesia is expected to suppress the number of computer crimes
that occurred. In universities, computer crime activity is a serious offense, because the
universities have a strategic data that must be protected.
2.3.1 Previous Study on Computer Crime
Over the past decade, number of computer related criminal incidents
have increased multi-fold and losses related to computer crime. Yet the lack of public
awareness of exactly what defines a computer crime causes many highly publicized
incidents to be labeled unfairly as computer crime along with the actual incidents,
further blurring the line between regular crime and computer crime.
The study about the definition of computer crime has conduct by Kleve
et al., in 2011. ‘ICT Crime’, also indicated as ‘Computer Crime’, ’Cybercrime’ or

24
‘High Tech Crime’, is a term used for a concept that is rather difficult to define
(Kleve et al., 2011:162). This study take attention to the high tech crime occur in
computerized system otherwise the effect of the crime not just occur in the computer
area and the law of that crime sometimes can not applicable to the crime.
In 2001, Doney wrote a paper for computer crime occur in non-profit
organization. Studies show that loss from fraud and embezzlement is about ten times
higher when a computer is used than when it is not. The speed and efficiency that
benefit the organization serve the criminal equally well. The study mention about
stages to deterring computer crimes, one of the points is prosecute and incarcerate
perpetrators. Law enforcement officials urge that perpetrators be sent to jail. Although
punishing criminals has a limited effect on deterring others, it does keep most
computer criminals from repeating their crimes. Data suggest that white-collar
criminals, such as those involved in computer crime, have the lowest recidism rate of
all criminals. (Doney, 2001:32).
Another study is about the successful in term of informing people that
computer crime exists and instilling an awareness of the different types of incident
(Downland, 1999:715). This study mentions about low awareness of Computer
Misuse Act when compared to general awareness of computer misuse.
Highfield presented his study about understanding and applying the
Computer Misuse Act 1990. This is the law of computer crime in United Kingdom.
The Computer Misuse Act 1990 is recent legislation and was introduced to reflect the
increasing importance of computers in commercial life (Highfield, 2000:52). In this
Act the definition and characteristic of computer are its abilities to: 1) Store
Information, 2) Retrieve information to stored, 3) Process that information, and some
25
suggest for wider definition for the crime that occur from computer misuse. Other
relevant definitions and interpretations under the Act are: 1) Access - altering, erasing,
copying, moving, using, having output. 2) Using a program – cause the program to be
executed, it self a function of the program. 3) Modification – altering or erasing
contents added to. The understanding of this law is very important especially for law
enforcement and of course the community. If an understanding of computer crime and
the law is weak, then the sense of security and comfort of use of computers will be
failed to realize. The structure of a good information system security policy with a
clear standard will be useful to prevent the occurrence of computer crime.
A scientist from Iran wrote a journal about the key role of Information
Security in E-Commerce, in 2007. Sanaye’i, a professor from University of Isahan
Iran, claiming that security is to combine system, operations and internal controls to
ensure the integrity and confidentiality of data and operation procedures in an
organization (Sanaye’i, 2007).
Geary in 1994 wrote about IS leadership, his research titled “Executive
Liability for computer Crime and How to Prevent It” is about the new role of
executive in organization has new job as a top cop and organizational managers are
held responsible for the prevention of crime (Geary, 1994)
In 2006 Chang and Ho (2006) publish a journal about organizational
factors to the effectiveness of implementing information security management. The
study result revealed that there were significant impacts of organizational factors
including IT competence of business managers, environment uncertainty, industry
type, and organization size, on the effectiveness of implementing ISM (Chang and
Ho, 2006)

26
2.3.2 Previous Study on Policy Implementation
Study by Percival in 2004 was about contextual factors influence the
implementation. This study is about implementation of act regarding to drug policy in
California’s local government. The implementation requires cooperation between
county and state institutions, including local government and community. A research
take an attention to California’s counties that they have research bring attention to
several contextual variables relevant to policy implementation and policy output at the
local level.. These variables can separate into three primary dimensions: political
factors, community needs, and socioeconomic characteristic. The results of this study
indicate that when large implementation responsibilities are delegated to local
governments, policy outputs should be expected to vary given opportunities provided
to local governments operating in widely different political environments to shape
policy
Study about factors affecting the implementation also conducted by
Kitnitchiva in 2009. The study focus on major factors that affecting the
implementation and effectiveness of the Tax implementation policy. Kitnitchiva
interested to observed characteristics of the implementing organization, the behavior
of executive officials, and the behavior or response from the target group as factors
that influence the process of policy implementation (Kitnitchiva, 2009).
Phaopeng in 2010 wrote dissertation about The Success of ICT Policy
Implementation in Education. This dissertation aims to develop and test a model for
explaining the success of ICT policy implementation in education covering two
groups of the upper-level secondary schools namely Group I-schools under Lab
School Project and Group II the remaining schools. In this study, both quantitative

27
and qualitative research methods are used. For the quantitative analysis, two statistical
techniques including t-test for independent samples, and structural equation modeling
(SEM) analysis-using AMOS statistical program are employed. The study revealed
that 38.4% of the success of ICT policy implementation in education is determined by
the policy conditions, the characteristics of school directors, and the characteristics of
teachers and students. (Phaopeng, 2010)
Mitchell in 2010 also studied about factors affecting success in
implementation. The research about the policy Evidence-based Practice (EBP) is
applied slowly by the child and youth service. In these study, the organizational factor
is as a one of key categories of success in implementation program. Some of the key
organization factors that have attracted attention from implementation researchers
include leadership and organization structure (Mitchell, 2010:211).
2.4 Identification of Dependent Variables and Independent Variables
According to three models of implementation and theory, researcher
identified the factors will be used for this study using personal judgment. The model
had a potential effect on the success of implementation of the computer crime act in
universities.
2.4.1 Dependent Variable
For implementation research, dependent variables are generally
defined as outputs or outcomes. In this study dependent variable is an output. Where
the dependent variable as outputs, they are generally administrative decisions of some
kind: enforcement actions in regulatory policy, determinations of applications for
particular benefits or services, and so on. (Hill and Hupe, 2002:122).

28
In this research will put the performance of act as the dependent
variable (Y), and will measure the success of the implementation of the ISSP in
universities, by observing administrative preparation, and technical preparation.
1) Administrative preparation: Some examples of administrative
controls include the corporate security policy, password policy, hiring policies, and
disciplinary policies that form the basis for the selection and implementation of
logical and physical controls (Vacca, 2009:232). We propose the indicators for this
sub variable are:
1.1) Setting working group
Working group (division of labor) or work specialization is for greater
efficiency. Division of labor, also known as work specialization, is the arrangement of
having discrete parts of a task done by different people (Kinicki andand Wiliams,
2010:249).
1.2) Setting information security policy
Information security policy is an established guidelines and principles
for initiating, implementing, maintaining, and improving information security
management in an organization (Vacca, 2009:226). Information security policy is a
procedure guided users and IT staff members (Senn, 1995:544). For policies to be
effective, they must be properly disseminated, read, understood, and agreed by all
employees as well as backed by upper management.
1.3) Enhancing the user of ICT
Technology most certainly plays a part in protecting an organization
against attack or loss; however, the diligent provision of a secure architecture involves
all aspects of the organization. Staff of the organization must be educated regarding

29
their responsibilities for security and then enabled by the organization to properly
carry out these responsibilities. The best line of defense against all types of computer
security is education and the use of technology, combined with good old common
sense (Salomon, 2010:16). Security education programs stress the threat of intrusion
and hacker’s method and tactics, and provide guidelines on how to respond when
intrusion are detected (Senn, 1995:544). The Security Employee Training and
Awareness program is a critical component of the information security program. It is
vehicle for disseminating security information that the workforce including managers
(Vacca, 2009:248).
2) Technical preparation, this study will observe the use of software
and hardware resources to control access information and computing system, to help
mitigate the potential for errors and blatant security policy violation (Vacca,
2009:232). The indicators for this sub variable are:
2.1) Department of IT as an Access Service Provider
These activities include keeping the necessary information of the
service user, monitoring access to all data and store computer traffic data. The
definition of those activities will be describe as follow:
User identification: a process of identifying the user by asking to see
identification. The most common method of identifying users to computers is with
password (Post and Anderson, 2006:175). That all of the data must be secured, an
activity to protect the data is user limitation to access data, identifying the user by
password or password generators. Restriction of unauthorized user access to computer
resource; concerned with user identification. This control security objective is limiting
the user to control the data (Post and Anderson, 2006:174). User should be allowed to
30
access only the data they need to perform processing within their area of
responsibility (Senn, 1995:543).
Access control: an activity after the computer can identify each user.
User can control access to any piece of data. Access control is methods used to enable
administrators and managers to define what objects a subject can access through
authentication and authorization, providing each subject list of capabilities it can
perform on each object (Vacca, 2009:226). Access control and validation procedures:
Implement procedures to control and validate a person’s access to facilities based on
the role of function, including visitor control and control of access to software’s
program testing and revision (Vacca, 2009:236). Computers and terminals should be
kept in controlled areas. They must certainly be kept away from visitors and delivery
people. Many types of locks and keys can be used to protect terminal and personal
computers. Similarly, all documents should be controlled (Post and Anderson,
2006:178-179).
Data backup activities: to make extra copies (backup copies) of data
information, or software to protect yourself against losses. Should any of these be lost
or accidentally changed, the backup copy can be used to restore original version so
that minimum of works is lost (Senn, 1995:70).
Traffic data monitoring: Another effective security provision is to
monitor access to all of the data. Most computers can keep track of every change to
every file. They can keep log of who accesses each file (Post and Anderson,
2006:174). Keep a record of each activity and the individual responsible for the
activity (Senn, 1995:544).
2.2) Department of IT as a Hosting Service Provider

31
Some activities to protect data and the network such as:
a. Firewalls: the essentially routers that examine each packet of
network data passing through them and block certain types to limit the interaction of
the network with the Internet (Post and Anderson, 2006:188). The purpose of a
firewall is to enforce an organization’s security policy at the border of two networks
(Vacca, 2009:240).
b. Virus protection: To protect its system against viruses, companies
(institution) must buy virus detection software; program that scan computer’s disk to
detect the virus (Senn, 1995:548).
c. Intrusion detection system/IDS: a combination of hardware and
software that continuously monitors the traffic (Post and Anderson, 2006:189).
Although many seem to think IDS are networks security function, there are many
good host-based IDS applications, both commercial and open source, that can
significantly increase security and act as an early warning system for possibly
malicious traffic and/or files for which the AV does not have a definition (Vacca,
2009:239).
d. Auditing information system: an examination of information system,
their inputs, outputs, and processing (Turban et al., 2005:389), and also it’s order to
maintain securities over data audits are used to locate mistakes and to prevent fraud
(Post and Anderson, 2006:178). In an audit, independent parties review transaction
and computer processing to analyze their origin and their impact on the system, and to
determine that these activities were authorized and performed by authorized
individuals. (Senn, 1995:544)

32
e. Training for IT Staffs, Institution staffs and students: Information
technology also plays an important role in training and retaining (Turban et al.,
2005:233). Training, then, refers to educating technical and operational employees in
how to better do their current jobs (Kinicki and Wiliams, 2010:288). In line with this
study, not only staffs should have training activities but also the students as a member
of IT user of institution.
2.4.2 Independent Variables
Hill and Hupe (2002:123) specified seven categories that perhaps
could be an independent variable. One of those categories that are in line with the
research is a factor affecting the responses of implementation (their organization, their
disposition, and so on) – these may be subdivided into issue about overall
characteristic of the agencies as issues about the behavior of front line (or street level)
staff. Based on chosen model on policy implementation, this study will identify the
factors that have a potential effect on the implementation and success implementation
of computer crime act (UU ITE 11, 2008). It will be classified into two variables, the
details of which are discussed below.
1) Factors of Policy
Government or policy makers should give clear direction to the policy
after its enactment, in this study, the government must make laws and guide the
implementation of a documented explanation and provide guidance to the parties that
implements it. This study will measure the perceptions of staff at the University
toward the Act indicators of measurement are as follows:
1.1) Objectives and purpose of the Act

33
Clarity of the standard and objectives: These standard and objectives
are self-evident and easily measurable in some cases. In determining standard and
objectives one could use the statements of policy makers, as reflected in numerous
documents such as program regulation and guidelines, which spell out the criteria for
an evaluation of policy performance (Van Meter and Van Horn, 1975:464). Effective
implementation requires that a programs standards and objectives could be understood
by those individuals responsible for their achievement. Therefore the prospect of
effective implementation will be enhanced by the clarity with which standard and
objectives are stated and by the accuracy and consistency with which they are
communicated (Van Meter and Van Horn, 1975:466). In the implementation of the
Act required government regulations to help explain the details of the implementation
of the Act. Much recent legislation and regulation requires explicit compliance action.
Few laws and regulation specify how compliance is to be achieved (Sundt, 2005:3).
The computer crime act (UU ITE 11, 2008) mention in article 54 that government
regulation must have been enacted not longer than two years up on promulgation of
the law. It can be summarized that the law must have regulation or guidance for
organization therefore the government should provide this action.
1.2) Usefulness of the acts: Most people want the government to
protect them from these many forms of crime. Computer users have certain
responsibilities in term of computer security and privacy. First, they have an
obligation to obey the laws that pertain to computers (Post and Anderson, 2006:557).
1.3) Practical of the Acts: Federal, state, and local government have
obligations to establish laws that provide a means for those unfairly injured to allow
them to gain compensation from those who did the damage. Instead, laws intended for

34
other purposes were stretched to cover computer crimes (Post and Anderson,
2006:556).
1.4) Current up to date to the situation: As society changes, the laws
must also be changed. Hence, as the use of computers grows, we can expect to see
more laws governing their use. Existing laws will be extended and new ones created.
To date, computer laws have been concerned with three primary areas: property
rights, privacy, and crime (Post and Anderson, 2006:557).
2) Clarity of the Acts
Clearly explains the definition of computer crime: Laws continually
change and new interpretations and applications regularly arise (Post and Anderson,
2006:557). It means that if the laws not clearly mention the definition about computer
crime and information security activities, the public or society will generally need a
lawyer or specialist to help understanding the law and apply the current laws.
2.1) Penalty/Punishment: Federal, state, and local governments have
obligations to establish laws that provide a means for those unfairly injured to allow
them to gain compensation from those who did the damage. Instead, laws intended for
other purposes were starched to cover computer crimes (Post and Anderson,
2006:556).
2.2) Publication and Socialization: Computer crime acts and it’s
regulation or explanations must known to all users of computers in universities
through media publications. One of most important techniques of federal influence is
the socialization of state and local actors (Van Meter and Van Horn, 1975:464).
Socialization is a continuing process whereby an individual acquires a personal
identity and learns the norms, values, behavior, and social skills appropriate to his or

35
her social position. In bureaucracies, socialization is often thought to be an important
mechanism of inculcating values in employees and consequently influencing their-on-
the job behavior (Rosenbloom and Kravchuk, 2005:518).
2.3) Assistance centers and Technical Advice: Higher-level officials
can often do much to facilitate implementation by aiding subordinates in interpreting
federal regulation and guidelines, structuring responses to policy initiatives, and
obtaining the physical and technical resources required to carry out a policy (Van
Meter and Van Horn, 1975:467).
3) Control Process:
Punishment is one type of reinforcement. Punishment is the application
of negative consequences to stop or change undesirable behavior (Kinicki and
Wiliams, 2010:392).
3.1) Legal institution participation: Law enforcement agencies that
their effort is to stop criminal in computer crime (Stair and Reynolds, 2008:400).
3.2) Legal institution has enough staff: Universities staff has a sense of
responsibility to law enforcement against computer crime. Working together for
common purposes. The common purpose is realized through coordinated effort, the
coordination of individual efforts into a group or organization-wide effort (Kinicki
and Wiliams, 2010:249).
2.4.3 Factors of Organization
According to Van Meter and Van Horn (1975:471) the characteristics
that may impinge on an organization’s capacity to implement policy include the
competence and size of an agency’s staff, the degree of hierarchical control of subunit
decisions and processes within the implementing agencies, an agency’s political

36
resources (e.g. support among legislators and executives), the vitality of an
organization, the degree of “open” communication (i.e., networks of communication
with free horizontal and vertical communication) within an organization, the agency’s
formal and informal linkages with the “policy making” or “policy enforcing” body.
Robbins (2005:5) mention about term of organization is a consciously
coordinated social unit, composed of two or more people that function on a relatively
continuous basis to achieve a common goal or set of goals. The definition of
organizational behavior is concerned with the study of what people do in organization
and how that behavior affects the performance of the organization. Implementing
organizations for this study are defined as organization characteristics that influence
the success of implementation:
1) Leadership
Leadership is defined as a process whereby an individual influences a
group of individuals to achieve a common goal (Kreitner and Kinicki, 2010:467).
Leadership style is the way in which the functions of leadership are carried out, the
way in which the manager typically behaves towards members of the group. The
emphasis is on generating a vision for the organization and the leader’s ability to
appeal to higher ideals and values of followers, and creating a feeling of justice,
loyalty and trust (Mullins, 2007:414). Information System (IS) Leadership is a critical
area for many organizations because of their increasing dependence on IS both for
operational stability and for enablement of process innovation and business strategy.
Information System leadership is distinctive from leadership in general because the
Chief Information Officer (CIO) is expected to combine IS technical skills with in
depth understanding of the organization across all function from operational to

37
strategic (Karahana and Watson, 2006:171). In this sub variable will use some
indicators in IS Leadership.
1.1) Knowledge in ISSP and computer crime act (UU ITE 11, 2008):
As the leader of a technician function, the CIO needs to have an in-depth
understanding of technology and its capabilities (Karahana and Watson, 2006:172). It
means that CIO must also understand about computer crime and information security
policy.
1.2) Support the Act: IS Leadership sets directions, creates
commitment, mobilizes institutional, political, physiological, and other resources,
facilitates actions and adapts the IS unit to fit a changing environment such that it
adds value and achieves shared objectives.
1.3) Execute the policy: That IS Leadership as a strategic leadership
refers to leadership by executive who have overall responsibility for the enterprise. It
entails substantive decision-making, making responsibility in that the strategic choices
they make can handle profound effects on organizational performance strategic
(Karahana and Watson, 2006:172)
1.4) Motivation: Leadership is related to motivation, interpersonal
behavior and the process of communication. Good management leadership helps to
develop teamwork and the integration of individual and group goals. (Mulllins,
2005:282)
2) Human Resources
The effectiveness of any work organization is dependent upon the
efficient use of resources. The human element plays a major part in the overall
success of the organization (Mullins, 1996:626). In this study universities must have

38
skilled staff that can apply the law in their workplace. Having the good employees is
support the success of implementation of the Act to the organization. Employees who
have high intellectual skills are an advantage of the organization. In this study will be
observed on human resources that exist in the organization. Indicators of human
resources to be measured are:
2.1) Amount of specialist staff: The department put more staff, which
is specialist in computer crime matters and its prevention for combating the crime.
Recruiting is the process of locating and attracting qualified applicants for jobs open
in organization. The word qualified is important: You want to find people whose
skills, abilities, and characteristics are best suited to your organization. (Kinicki and
Wiliams, 2010:280). Recruitment is finding employees, testing them, and deciding
which ones to hire (Turban et al. 2005:233).
2.2) Hiring and employee Evaluation: Employers should always check
candidate’s reference. In more extreme situations, employers can check employee
background for criminal records (Post and Anderson, 2006:179).
2.3) Performance Evaluation: Most employees Periodically evaluated
by their immediate supervisors. Performance test or skills measure performance on
actual job tasks (Kinicki and Wiliams, 2010:280).
3) Organizational Structure
Researcher proposed the major elements of an organization
3.1) Degree of decentralization: An advantage in having decentralized
authority is that managers are encouraged to solve their own problems rather than to
buck the decision to a higher level (Kinicki and Wiliams, 2010:251). Delegation is the
process of assigning managerial authority and responsibility to managers and

39
employees lower in the hierarchy. To be more efficient, most managers are expected
to delegate as much of their works as possible (Kinicki and Wiliams, 2010:251).
3.2) Span of control: Span of control or span of management, refers to
the number of people reporting directly to a given manager (Kinicki and Wiliams,
2010:250).
3.3) Staff Authority: Information security problem are increasing
rapidly, causing damage to many organization. Protection is expensive and complex.
Therefore, companies must not only use controls to prevent or detect security
problems, they must do so in organized way, assigning responsibilities and authority
throughout the organization (Turban et al, 2005:387).
4) Funding and physical resources inter-organizational relationship:
4.1) Availability of budget: Companies with insufficient IT security
spending would face a risky scenario through which their overall profitability and
efficiency might suffer (Luo and Warkentin, 2004:1).
4.2) Availability of physical resources: Physical control monitor and
protect the physical environment of the workplace and computing facilities (Vacca,
2009:232). Physical security concerns with threats, risk, and countermeasures to
protect facilities, hardware, data, media, and personnel. Main topics include restricted
areas, authorization models, intrusion detection, fire detection, and security guards.
(Vacca, 2009:236).
4.3) Availability of software and hardware facility security plan:
Implement policies and procedures to safeguard the facility and the equipment there
in from unauthorized physical access, tampering and theft (Vacca, 2009:236). Access

40
card and biometrics devices, which recognize voice patters, finger or palm prints,
retinal eye patterns, and signatures, are among the most effective physical security.
The summary of variables, indicators/sub indicator, and sources of
questions shown in table 2.1
Table 2.1 Variables, Indicators/sub indicator, and Sources of questions
Variables Question Indicators / Sub Indicators Source of Questionnaire
DEPENDENT
IMPLEMENTATION OF INFORMATION SYSTEM SECURITY POLICY (Y)
1. Administrative
Preparation
1 – 5 1.1 Working Group and its duties Kinicki and Wiliams, 2010:249
6 – 7 1.2 Information security policy Vacca, 2009:226
Senn, 1995:544
8 – 10
1.3 Enhancing the user of ICT
Salomon, 2010:16
Senn, 1995:544
Vacca, 2009:248
2. Technical
Preparation
2.1 Department of IT as an Access Service Provider
11 • User Identification Post and Anderson, 2006:174-
175
Senn, 1995:543
12 • Access Control: Vacca, 2009:226, 236
Post and Anderson, 2006:178-179
13 • Data Backup Activities Senn, 1995:70
14 • Traffic Data Monitoring Senn, 1995:544
2.2 Department of IT as a Hosting Service Provider
15 • Firewalls Post and Anderson, 2006:188
Vacca, 2009:240
16 • Virus Protection Senn, 1995:548
Post and Anderson, 2006:189
17 • Intrusion Detection System Vacca, 2009:239
18 • Auditing Information System Post and Anderson, 2006:178
Senn, 1995:544
Turban et al., 2005:389

41
Table 2.1 (continue) Variables Question Indicators/Sub Indicators Source of Questionnaire
19 • Training about ISSP for Turban et al., 2005:233
Students and staffs
20 • Training about ISSP for IT
Staffs
Kinicki and Wiliams,
2010:288
INDEPENDENT
FACTORS OF POLICY (X1)
1. Objectives and
purpose of the Act
1 • Clarity of standard and objectives Van Meter and Van Horn,
1975:464
Sundt, 2005:3
2 • Usefulness of the acts Post and Anderson,
2006:557 3 • Practical of the Acts
4 • Current up to date to the situation
2. Clarity of the Act 5 • Clearly explain about computer
crime
Post and Anderson,
2006:557
6 • Level of sanction/penalty Post and Anderson,
2006:556
7 • Publication Van Meter and Van Horn,
1975:464
8 • Socialization process Rosenbloom and Kravchuk,
2005:518
9 • Assistance centers and Technical
Advice
Van Meter and Van Horn,
1975:467
3. Control Process 10 Penalty/Punishment Kinicki and Wiliams,
2010:392
11 Legal Institution participation
12 Legal Institution has enough Staff Kinicki and Wiliams,
2010:249
FACTORS OF ORGANIZATION (X2)
1. Leadership 1 • Knowledge in ISSP Karahana and Watson,
2006:172
2 • Knowledge in UU ITE 11, 2008 Karahana and Watson,
2006:172
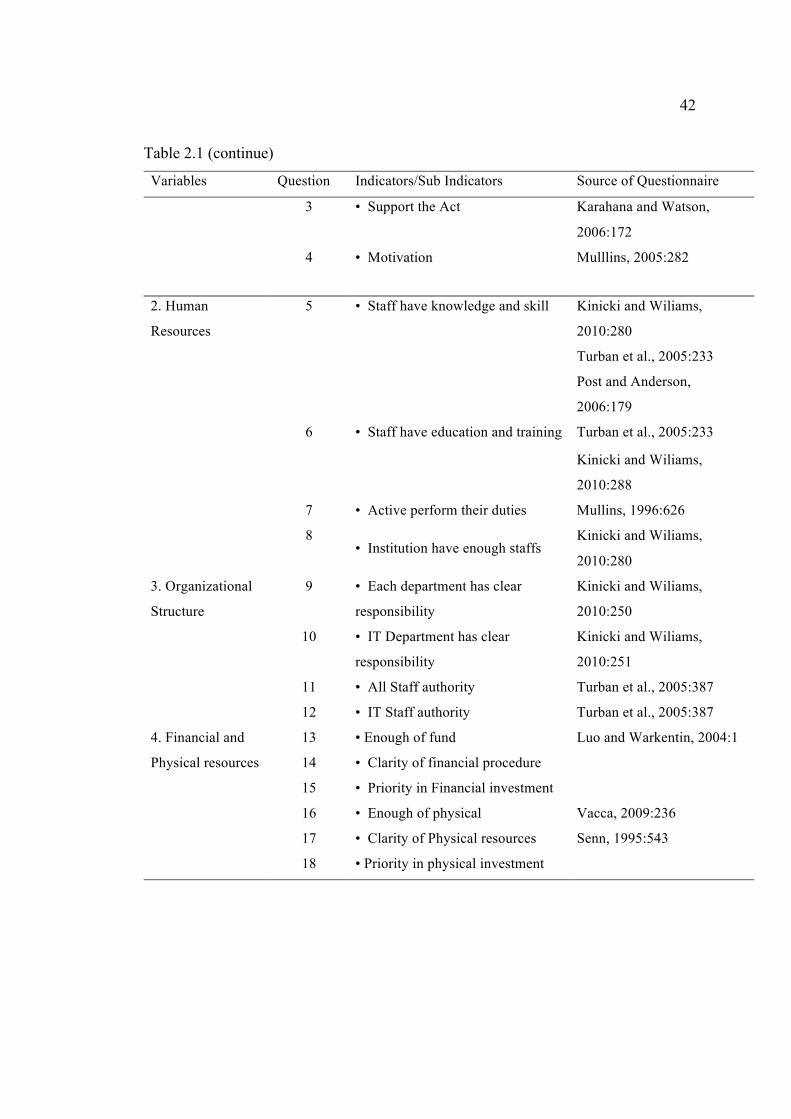
42
Table 2.1 (continue)
Variables Question Indicators/Sub Indicators Source of Questionnaire
3 • Support the Act Karahana and Watson,
2006:172
4 • Motivation Mulllins, 2005:282
2. Human
Resources
5 • Staff have knowledge and skill Kinicki and Wiliams,
2010:280
Turban et al., 2005:233
Post and Anderson,
2006:179
6 • Staff have education and training Turban et al., 2005:233
Kinicki and Wiliams,
2010:288
7 • Active perform their duties Mullins, 1996:626
8 • Institution have enough staffs
Kinicki and Wiliams,
2010:280
3. Organizational
Structure
9 • Each department has clear
responsibility
Kinicki and Wiliams,
2010:250
10 • IT Department has clear
responsibility
Kinicki and Wiliams,
2010:251
11 • All Staff authority Turban et al., 2005:387
12 • IT Staff authority Turban et al., 2005:387
4. Financial and
Physical resources
13 • Enough of fund Luo and Warkentin, 2004:1
14 • Clarity of financial procedure
15 • Priority in Financial investment
16 • Enough of physical Vacca, 2009:236
17 • Clarity of Physical resources Senn, 1995:543
18 • Priority in physical investment

CHAPTER III
RESEARCH METHODOLOGY
This chapter describes the research methodology used, consisting of
types and sources of data, population and sample, instrument used for data collection.
In this study, the research approach is a quantitative approach, which used a survey
method.
3.1 Data and Data Collection
3.1.1 Types of Data
The data used in this study are:
1. Primary data obtained from the interview through closed
questionnaires mailed to respondents in each University.
2. Secondary data obtained from other sources that were already
collected. This secondary data consists of all information related to computer crime
act in Indonesia, theory of information system security policy, and related research.
Secondary data collected from archives of Ministry of National Education and
Directorate General of Higher Education of Indonesia, public journals, articles,
statistical agency, and any news media.
3.1.2 Population and Sample
Populations of this study are universities in Java Island. In 2009, total
populations were 244 universities in Java Island both public and private. The reason
of determining the study population on the island of Java is the number of universities

2
in Indonesia concentrated in Java Island. The number of universities in the study area
is shown on table 3.1. To determine the sample size, this research uses Taro Yamane
formula (Yamane, 1967) at 95% level of confidence.
n =N
1+ N(e)!
where:
n : Sample size
N : Population size
e : Level of error
n = 244
1+ 244(0.05)!
n = 141
By using the formula above, with the level of error 5%, the researchers
obtain a sample size as many as 141 universities.
Table 3.1 Amount of population and sample of universities in Java Island by province
Province Population (unit) Sample (unit)
DKI Jakarta 52 30
West Java 49 28
Banten 4 2
Central Java 38 22
DI Yogyakarta 20 12
East Java 81 47
Total 244 141
3
By using proportionate stratified sampling technique the number of
sample classified shown in table 3.1. Sampling methods in each province is simple
random sampling.
3.1.3 Data Collection Method and Research Tools
The method of data collection in this study is a structured
questionnaire. The questionnaire was distributed using airmail letter, research staff
collection, and e-mail. The data collected during May to November 2012.
The questionnaire consists of two sections, the first section used to
describe the first research objective of evaluating the success of the application of the
computer crime act (UU ITE 11, 2008) at universities. The questions used which are
“Yes” and “No”, also be interpreted here is available (Yes) or not available (No) in
accordance with the conditions.
Second section used to explain the second and third objective, which is
about the factors that influence the successful implementation of the computer crime
act (UU ITE 11, 2008). The questions contained in the questionnaire made in the form
of a question using the scale. The scale used is a Likert scale (Table 3.2) to determine
the assessment of the IT head department that works on management Information
systems department that influence the successful implementation of the act (UU ITE
11, 2008).
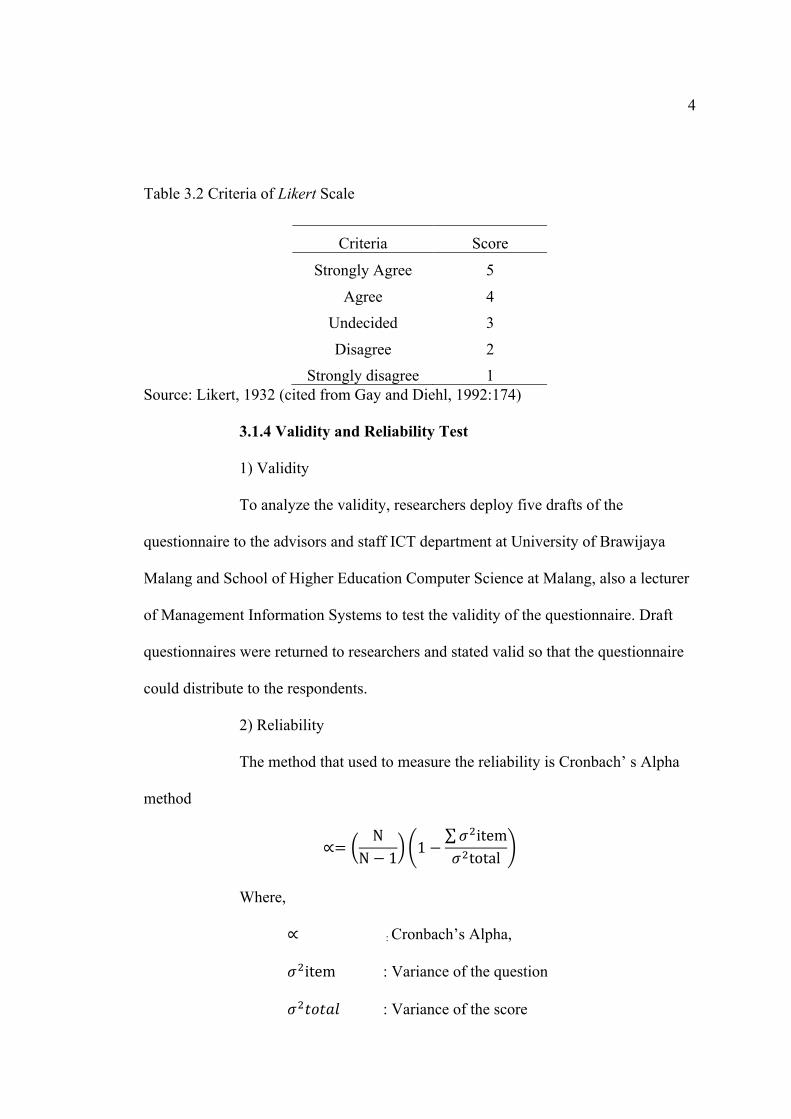
4
Table 3.2 Criteria of Likert Scale
Criteria Score
Strongly Agree 5
Agree 4 Undecided 3
Disagree 2 Strongly disagree 1
Source: Likert, 1932 (cited from Gay and Diehl, 1992:174)
3.1.4 Validity and Reliability Test
1) Validity
To analyze the validity, researchers deploy five drafts of the
questionnaire to the advisors and staff ICT department at University of Brawijaya
Malang and School of Higher Education Computer Science at Malang, also a lecturer
of Management Information Systems to test the validity of the questionnaire. Draft
questionnaires were returned to researchers and stated valid so that the questionnaire
could distribute to the respondents.
2) Reliability
The method that used to measure the reliability is Cronbach’ s Alpha
method
∝=N
N− 1 1−𝜎!item𝜎!total
Where,
∝ : Cronbach’s Alpha,
𝜎!item : Variance of the question
𝜎!𝑡𝑜𝑡𝑎𝑙 : Variance of the score

5
N : The number of question
From the test results, it is known that the all of the questions are
reliable that is indicated by score result of Cronbach’s Alpha test in every item
indicators, means that all of the question are reliable to distribute to the respondent.
The complete test result shows in table 3.3.
Table 3.3 Reliability Score for each group of indicator
Item of Indicator Cronbach’s Alpha N of items
Objective and purposes of the acts 0.795 5
Clarity of the act 0.782 6
Control process 0.784 3
Leadership 0.830 4
Human resources 0.777 4
Organization structure 0.840 5
Financial and physical resources 0.744 6
3.2 Data Analysis
This paragraph consists of detail of both descriptive and qualitative
analysis, which is described below.
3.2.1 Descriptive analysis and criteria
In this study, the descriptive statistics of each variable are presented in
frequency, percentage, mean, and standard deviation. Descriptive statistics is used to
analyze the first objectives related to evaluation of success implementation computer
crime act (UU ITE 11, 2008) in universities. Criteria for success in the
implementation used in the descriptive analysis determined as follows:
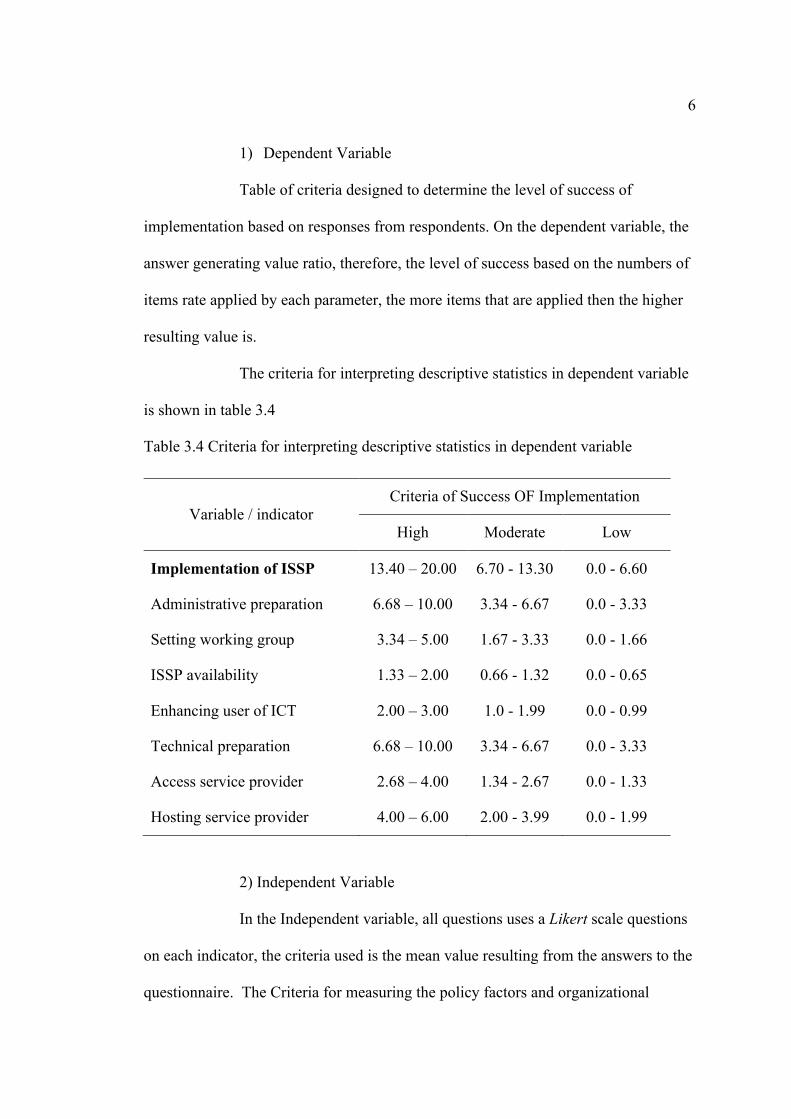
6
1) Dependent Variable
Table of criteria designed to determine the level of success of
implementation based on responses from respondents. On the dependent variable, the
answer generating value ratio, therefore, the level of success based on the numbers of
items rate applied by each parameter, the more items that are applied then the higher
resulting value is.
The criteria for interpreting descriptive statistics in dependent variable
is shown in table 3.4
Table 3.4 Criteria for interpreting descriptive statistics in dependent variable
Variable / indicator Criteria of Success OF Implementation
High Moderate Low
Implementation of ISSP 13.40 – 20.00 6.70 - 13.30 0.0 - 6.60
Administrative preparation 6.68 – 10.00 3.34 - 6.67 0.0 - 3.33
Setting working group 3.34 – 5.00 1.67 - 3.33 0.0 - 1.66
ISSP availability 1.33 – 2.00 0.66 - 1.32 0.0 - 0.65
Enhancing user of ICT 2.00 – 3.00 1.0 - 1.99 0.0 - 0.99
Technical preparation 6.68 – 10.00 3.34 - 6.67 0.0 - 3.33
Access service provider 2.68 – 4.00 1.34 - 2.67 0.0 - 1.33
Hosting service provider 4.00 – 6.00 2.00 - 3.99 0.0 - 1.99
2) Independent Variable
In the Independent variable, all questions uses a Likert scale questions
on each indicator, the criteria used is the mean value resulting from the answers to the
questionnaire. The Criteria for measuring the policy factors and organizational

7
factors is shown in Table 3.5
Table 3.5 Criteria for Independent Variables
Variables/Sub Variables Criteria
Highly Positive
Moderately positive
Negative
The policy factor 3.67 – 5.0 2.34 - 3.66 1.0 – 2.33
Objectives and purpose of the Act 3.67 – 5.0 2.34 - 3.66 1.0 – 2.33
Clarity of the Act 3.67 – 5.0 2.34 - 3.66 1.0 – 2.33
Control process 3.67 – 5.0 2.34 - 3.66 1.0 – 2.33
The organization factor 3.67 – 5.0 2.34 - 3.66 1.0 – 2.33
Leadership 3.67 – 5.0 2.34 - 3.66 1.0 – 2.33
Human resources 3.67 – 5.0 2.34 - 3.66 1.0 – 2.33
Organizational structure 3.67 – 5.0 2.34 - 3.66 1.0 – 2.33
Financial and physical resources 3.67 – 5.0 2.34 - 3.66 1.0 – 2.33
3.2.2 Quantitative Analysis
Based on the research question and purpose of this study, data was
analyzed using the multiple regression technique. Multiple regression analysis is the
degree of relationship existing between three or more variables. The multiple
regression equations in this research can be written as follows:
1) Model Specification
This research will use three model equations in order to determine
which of the form would best fit the relationship between dependent variable (ISSP
implementation) and independent variables (Policy and Organization). The model
form that has highest R2 and shows many statistical significant variables adopted in

8
this research. The model forms fitted specified in equations below:
1.1) Y = α+β1X1+ β1X2+ ε (3.2)
1.2) Y1 = α+β1X1+ β1X2+ ε (3.3)
1.3) Y2 = α+β1X1+ β1X2+ ε (3.4)
Where:
Y = ISSP Implementation
Y1 = ISSP Implementation in Administrative Preparation
Y2 = ISSP Implementation in Technical Preparation
α = intercept
β1 = regression coefficient of X1, X2.
X1 = policy factors
X2 = organizational factors
ε = error item
Details definitions of the variables used in the models are described as
follows.
(1) ISSP (Y) refers to the total score of mean in both administrative
preparation and technical preparation, and measured in mean score in statistic
calculation ranging from 1 – 20.
(2) ISSP Implementation in Administrative Preparation (Y1) refers to
the total score of administrative preparation, and measured in mean score in statistic
calculation ranging from 1 – 10.
(3) ISSP Implementation in Technical Preparation (Y2) refers to the
total score of technical preparation, and measured in mean score in statistic

9
calculation range from 1 – 10.
(4) Policy Factor (X1) is including all measurement in computer crime
act (UU ITE 11, 2008) that consist of purpose and objective, clarity, and control
process, this variable measured in total score of mean of all indicators.
(5) Organizational Factor (X2) is including all measurement in
computer crime act (UU ITE 11, 2008) that consist of leadership, human resources,
organizational structure, fund and physical resources, this variable is measured in total
score of mean of all indicators
2) Model Estimation
The data obtained was analyzed using the multiple regression
technique to determine the relationship between output both administrative and
technical preparation and selected variables. Based on Gujarati (2004) some test
conducted on the model, which are
2.1) Coefficient of determination
It is the square of the correlation coefficient value (R), which provides
a clear, easy to understand measurement of the explanatory power of a correlation
coefficient. The R2 test used to determine the percentage variation of the dependent
variable that is explained by variations of dependent variable, R2 measured by the
following equation:
𝑅! = 1− !!!""!!!"!
(3.5)
Where:
r2 : coefficient of determination
SSerr : The sum of square of residual
SStot : The total sum of squares
10
The value of R2 is between zero and one. If the coefficient determinant
equal to zero, it means that, the independent variables had no effect on the dependent
variable. If the value of coefficient determinant getting closer to one, it means that,
more independent variables affect the dependent variable.
2.2) Testing Model
We have already got equation Y = α+β1X1+ β1X2 + ε as a model in
this research. Thus, we must measure or test this model, which it can categorize as
Best Linear Unbiased Estimator (BLUE) as follows:
a) Normality
The linear regression assumes that any residual from regression model
has spread to follow the normal distribution. In this research, the Kolmogorv-Smirnov
test used to measure the normality of residual.
b) Heteroscedasticity
If the Ordinary Least Squares (OLS) assumption that the variance of
the error term is constant for all observations does not hold, we face the problem of
heteroscedasticity. Heteroscedasticity refers to the case in which the variance of the
error term is not constant for all values of the independent variable. To ensure this
condition, Glejser test is used in this research.
c) Multicollinearity
It refers to the case in which two or more explanatory variables in the
regression model are highly correlated, making it difficult or impossible to isolate
(separate) their individual effects on the dependent variable.
2.3) Hypothesis Testing
a) F test

11
F test was used to examine simultaneous influences of independent
variables, which are factor of policy and factor of organization on dependent variable
that is administrative preparation and technical preparation. According Gujarati
(2004), formula for F test is as follows:
𝐹!"#"$!"$% = 1− !!/(!!!)!!!! !(!!!)
(3.6)
Where
R2 = Coefficient of determination
K = The total number of variables
n = Number of samples
b) Student (t) test
The t test was used to test the significance of the effect of each
independent variable on the dependent variable. This test aims to measure the
relationship among the independent variables, which are policy and organization, and
the dependent variable, which is administrative and technical preparation.
Formula for the t test as follows:
𝑡!"#"$!"$% = 1− !!!!!!
(3.7)
Where,
bi = Value of regression coefficient
Se = Standard error of regression coefficient
The result of this study is the discovery of the main factors affecting
the successful implementation of the policy, and among these factors, which are the
most crucial factors that affect the successful implementation of policies based on the
perception of the respondent.

12
To support the technique of data analysis uses in this research, namely
statistical analysis that conducts of The Statistical Package of the Social Science
(SPSS) software. This software is tremendously useful for the researcher to fit the
hypothesis in this research.

CHAPTER IV
RESULTS
The following chapter presents the analyzed results of the study. The
first section describes general information of the sample in term of descriptive
statistics. The second section analyzes descriptive statistics of variables. The last
section presents the results of tested hypotheses.
4.1 General Information of the Sample
The required samples in this study are 141 universities. This study
gathered data from heads of IT department in universities in Java Island through
questionnaire. Questionnaires were distributed to universities individually by the
researcher or a representative. The follow-ups to the initial distribution were made by
phone for the first and second time. However, the amount of questionnaire distributed
to universities was larger than the numbers of sample specified to anticipate the
questionnaire was not returning or not respond by the universities. By doing this
process, the returned questionnaires are 147 universities.
The responding classified by province displayed on table 4.1. On the
table 4.1 shows that most of universities sample are situated in East Java province
(42.2 percents) and only few universities sample are situated in Banten province (2.6
percents).

66
Table 4.1 Frequency and percentage of universities sample classified by province
Province Frequency Percentage
DKI Jakarta 29 20.0
West Java 22 15.0
Banten 4 2.6
Central Java 16 10.8
DI Yogyakarta 14 9.4
East Java 62 42.2
Total 147 100
4.2 Descriptive statistics of variables
4.2.1 Dependent Variable
Implementing of information system security policy consists of two
main activities, which are administrative preparation and technical preparation. The
descriptive statistics of activities are presented in table 4.2
Table 4.2 Mean and interpretation of ISSP implementation
ISSP implementation Mean Interpretation
Administrative Preparation 2.86 Low
Technical Preparation 5.99 Moderate
Total 8.85 Moderate
Table 4.2 shows that the extent of implementing information security
policy in universities was moderate. It is also indicated that the universities

67
implemented technical preparation activity is higher than administrative preparation
activity.
Detail of two preparative activities securing information system
reported as follows:
1) Administrative Preparation
The administrative preparation consists of three groups of questions
that include setting working group, ISSP availability, and enhancing the user of ICT.
The results presented in table 4.3
Table 4.3 Mean and interpretation of administrative preparation
(n= 147)
Administrative preparation Mean Interpretation
Setting working group 0.61 Low
ISSP availability 1.07 Moderate
Enhancing User of ICT 1.17 Moderate
Total 2.86 Low
Data from table 4.3 shown the score of the setting working group
activity is low, but the other activities score were moderate. It is indicated that the
working group was not sufficient for the universities.
Table 4.4 shows the frequency and percentage of amount of activities
applied in administrative preparation on universities.

68
Table 4.4 Frequency and percentage of total item applied in administrative
preparation
Amount of item applied Frequency Percentage 0 45 30.6 1 17 11.6 2 19 12.9 3 9 6.1 4 6 4.1 5 31 21.1 6 1 .7 7 2 1.4 8 15 10.2 9 1 .7 10 1 .7
Total 147 100.0 Mean 2.86
In the entire activities on administrative preparation, known the
number of items the most widely implemented as many as five items, and all items
that perform only one university. The average value found to be 2.86 this is shown the
use of administrative preparations for the success level of implementation of the ISSP
is low, also showed by the high number of universities that not applied all the items
that are similar to 45 or by 30.6 percent.
The details of activities in administrative preparation are described
below:
1.1) Setting Working Group
The Frequency and percentage of setting working group demonstrated in table 4.5.

69
Table 4.5 Frequency and percentage of universities implement activities in setting
working group.
(n= 147)
Item Working group
No Yes F % F %
Workgroup availability 114 78 33 22
Source of workgroup 142 97 5 3
Decision making authority 141 96 6 4
Formal group meeting 126 86 21 14
Workgroup evaluation 123 84 24 16
Approximately 22 percent of universities that had a working group for
computer crimes, meanwhile only three percent of universities have a member of the
working group which are come from related institutions such as the head of the
division of computer crime, IT security specialists, lawyers, or the authorities to
handle cases of computer crime. In addition, most of the respondents were not have
decision-making authority on the working group that is similar to four percent, then
only 14 percent had a regular group meeting, and furthermore 24 percent conducted
an assessment on the working group activities.
Table 4.6 describes the frequency and percentage of item used in
setting working group.

70
Table 4.6 Frequency and percentage of total items in setting working group activities
in Universities
Amount of item applied Frequency Percentage
0 114 77.6
1 5 3.4
2 5 3.4
3 19 12.9
4 3 2.0
5 1 .7
Total 147 100.0
Mean 0.61
The average items on the working group on universities in Indonesia is
as much as one item; with a mean value of 0.60, shown that the application setting of
working groups in universities classified as low. The university that is not applying all
of the items on the setting of the working group has the highest value which reached
more than 75 percent. The mean value shown only one item on the working group
setting of applied to the universities.
Furthermore, the highest standard which is showed on the universities
performed three items, it is about 12.9 percent moreover, the lowest value shown on
the universities performed five items of applications, or about 0.7 percent.
1.2) Setting Information Security Policy
Table 4.7 describes the frequency and percentage of information
system security policy.

71
Table 4.7 Frequency and percentage of information system security policy
(n= 147)
Item Information system security policy
No Yes F % F %
ISSP availability 48 33 99 67
ISSP declared 88 60 59 40
Table 4.7, demonstrate the number of the universities implemented the
ISSP as much as 67%, furthermore only 40% declared the ISSP. The facts convince
most of the universities implementing ISSP as one of the computer crime prevention,
although from entire the universities which are conduct ISSP is not fully followed by
the declaration of policy in the universities.
Table 4.8 Frequency and percentage of item used in information system security
policy
Item applied Frequency Percentage
0 48 32.7
1 40 27.2
2 59 40.1
Total 147 100.0
Mean 1.07
The data in table 4.8 shows the average value by 1.07 it could be
inferred that the average of universities has an item on the application of ISSP was
moderate, and at least one item of setting ISSP applied in universities in Indonesia.
The results in table 4.7 also depict a high percentage reached by universities that is

72
performing two items as many as 40 percent. High number also showed on
universities which are not applying ISSP similar to 32.7 percent.
1.3) Enhancing the User of ICT
Table 4.9 describes the frequency and percentage of availability of
information system security policy document.
Table 4.9 Frequency and percentages of availability of ISSP document
(n= 147)
Item Availability of security policy document
No Yes F % F %
For student 99 67 48 33
For institution staff 95 65 52 35
For IT staff 74 50 73 50
From Table 4.9, it is recognized that most of universities that provide
documents about computer crime and security policy information system was focused
on IT staff by 50% while those for institutional staff only 35% and the lowest for the
students as much as 33%. Only a few universities that provide documents related to
computer crime. Most universities provide these documents mainly for IT staff while
only a few universities also preparing the documents concerning crime computer for
employees of the institution and the students.
Table 4.10 describes the frequency and percentage of items used in
ISSP document.

73
Table 4.10 Frequency and percentage of items used in ISSP document
(n= 147)
Indicator applied Frequency Percentage
0 73 49.7
1 22 15
2 5 3.4
3 47 32
Total 147 100.0
Mean 1.17
In Table 4.10 known that the average value is 1.17, it can be concluded
that the items that relate to the procurement documents an average of one item and the
average value can be considered that the availability of ISSP document was moderate.
Also known from the table, most of the universities are not provide ISSP documents
for all users which are equal to 49.7%.
2) Technical Preparation
Technical preparation consists of two groups of activities. First is the
university as an access service provider and the other as a hosting service provider.
The summary of descriptive statistic about technical preparation showed on table
4.11.
Table 4.11 Mean and interpretation of technical preparation
(n= 147)
Technical preparation activities Mean Interpretation
Access service provider 2.83 High
Hosting service provider 3.16 Moderate
Total 5.99 Moderate
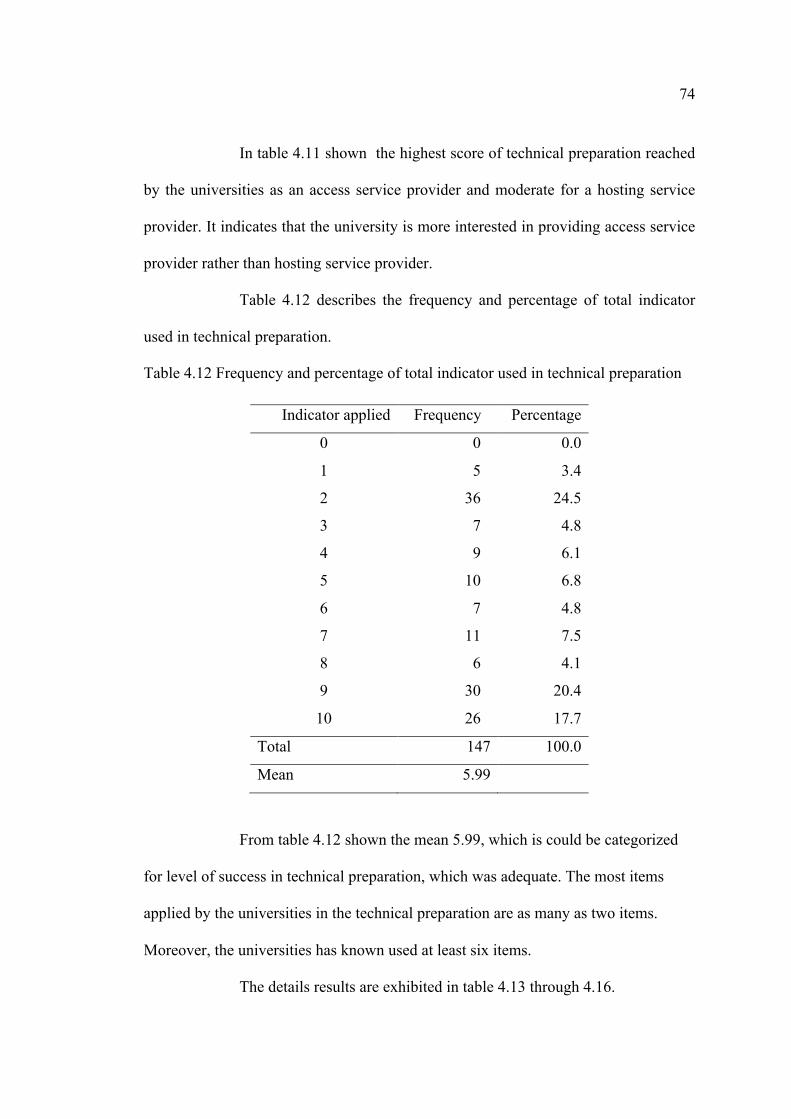
74
In table 4.11 shown the highest score of technical preparation reached
by the universities as an access service provider and moderate for a hosting service
provider. It indicates that the university is more interested in providing access service
provider rather than hosting service provider.
Table 4.12 describes the frequency and percentage of total indicator
used in technical preparation.
Table 4.12 Frequency and percentage of total indicator used in technical preparation
Indicator applied Frequency Percentage
0 0 0.0
1 5 3.4
2 36 24.5
3 7 4.8
4 9 6.1
5 10 6.8
6 7 4.8
7 11 7.5
8 6 4.1
9 30 20.4
10 26 17.7
Total 147 100.0
Mean 5.99
From table 4.12 shown the mean 5.99, which is could be categorized
for level of success in technical preparation, which was adequate. The most items
applied by the universities in the technical preparation are as many as two items.
Moreover, the universities has known used at least six items.
The details results are exhibited in table 4.13 through 4.16.

75
2.1) University as an Access Service Provider
Table 4.13 describes the frequency and percentage of items applied in
universities as an access service provider.
Table 4.13 Frequency and percentage of items applied in universities as an access
service provider
(n= 147)
Item As an access service provider
No Yes F % F %
Applied user ID 46 31 101 69
Monitoring user access 52 35 95 65
Data backup 10 7 137 93
Log data backup 64 44 83 56
From table 4.13 has known that the activity applied by universities is
as an access service provider. The most activity is data backup by 93 percent, and the
lowest activity is Log Data Backup by 56 percent.
Table 4.14 Frequency and percentage of items applied in universities as an access
service provider
Item applied Frequency Percentage
0 3 2.0
1 40 27.2
2 15 10.2
3 10 6.8
4 79 53.7
Total 147 100.0
Mean 2.83

76
In table 4.14 known that more than 50 percent of universities perform
four items, whereas universities that are not perform the items at all the item has the
low value of two percent.
From the mean value of 2.83, apparently the average universities
applying minimum three items as an access service provider and the criteria of mean
values indicate the implementation was high.
2.2) University as a Hosting Service Provider
Table 4.15 showed information about activity of universities as a
hosting service provider and table 4.16 describe about frequency and percentage of
indicators applied in universities as a hosting service provider.
Table 4.15 Frequency and percentage of items applied in universities as a hosting
service provider
(n= 147)
Item As a hosting service provider
No Yes F % F %
Firewall 50 34 97 66
Antivirus 19 13 128 87
IDS 78 53 69 47
Audit information system 83 56 64 44
Training for student and staff 96 65 51 35
Training for IT staff 91 62 56 38
High score of percentage on antivirus application by 87 percent and
low percentage on both organizing training for IT staff and students or staff of the
universities by 38 and 35 percent.

77
Table 4.16 Frequency and percentage of indicators applied in universities as a hosting
service provider
Indicator applied Frequency Percentage
0 6 4.1
1 41 27.9
2 22 15.0
3 15 10.2
4 6 4.1
5 31 21.1
6 26 17.7
Total 147 100.0
Mean 3.16
From table 4.16 shown as many as 27.9 percent of universities perform
only one item as a hosting service provider while average items that are applied to all
universities in this activity are three items.
It could be seen the mean value of 3.16, can therefore be said that the
implementation of the universities as a hosting service provider was moderate.
4.2.2 Independent Variables
The outcome of descriptive statistics of independent variables shows in
table 4.17.
Table 4.17 Mean and standard deviation of independent variables
Independent variables Mean Std. Deviation
Factor of policy 3.11 .69
Factor of organization 3.46 .77

78
The mean value of the policy factor is at 3.10 considered moderate
positive, or it can be said that the role of policy factor is moderate in support for the
successful implementation of computer crime act (UU ITE 11, 2008) at universities in
Indonesia. The factor of organization the mean value by 3.46, it can be considered
moderate positive, in other words, organizational factors have a considerable
contribution to the successful implementation of the computer crime act (UU ITE 11,
2008) at universities in Indonesia.
The detail of descriptive statistics of factor of policy and factor of
organization reported as follows:
1) Factor of Policy (X1)
The result of descriptive statistics the factor of policy shows on table
4.18.
Table 4.18 Mean, standard deviation, and interpretation of factors of policy
(n= 147)
Factor of policy Mean SD. Interpretation
Objectives and purpose of the Act 3.20 0.87 Moderate positive
Clarity of the Act 2.70 0.63 Moderate positive
Control process 3.32 0.81 Moderate positive
Total 3.11 .70 Moderate positive
In table 4.18 shown the control process has the highest mean value of
3.32. While the lowest response detected in communication and socialization process
of the act with a mean of 2.70. Might be interpreted based on the perception that the
characteristic of the act of communication and socialization activities of computer

79
crime act (UU ITE 11, 2008) is moderate positive (mean 3.11). The details results are
exhibited in table 4.20 through 4.22.
1.1) Objective and Purpose of the Act
The findings of descriptive statistics regarding the objective and
purpose of the act shown on table 4.19
Table 4.19 Percentages, mean, and standard deviation of response regarding objective
and purpose of the Act
(n= 147)
Objectives and purpose of the
Act
Strongly
agree Agree Neutral Disagree
Strongly
disagree Mean SD
1. The UU ITE 11, 2008
clearly explains the purpose
of issuing the computer crime
act.
12.9 32 37.4 15.6 2.00 3.38 0.96
2. The UU ITE 11, 2008 is
useful to prevent computer
crime activity.
12.9 27.9 36.1 18.4 4.8 3.26 1.05
The UU ITE 11, 2008 is fully
applied or has been
implemented.
12.2 19.7 34.7 25.9 7.5 3.03 1.11
3. The UU ITE 11, 2008 is up
to date to recent computer
crime case.
7.5 30.6 48.3 10.9 2.7 3.29 0.86
Total 3.20 0.87
In terms of objectives and purpose of the act, the mean was 3.2, with a
standard deviation of 0.87. It indicates the level of objective and purpose of computer
crime act (UU ITE 11, 2008) was moderate positive. On the table known, the highest
mean value achieved by clarity of purpose computer crime act (UU ITE 11, 2008)

80
amounted to 3.38 while the lowest value known at the perception of implementation
of the Act in the amount of 3.03. It can be indicated the computer crime act (UU ITE
11, 2008) has not been fully implemented in the society; however, the purpose of this
issuance of the act is acceptable.
1.2) Clarity of the Act
Table 4.20 shows the descriptive statistics of communication and
socialization process
Table 4.20 Percentage, mean, and standard deviation of responses regarding clarity of
the Act
(n= 147)
Clarity of The Act Strongly
agree Agree Neutral
Dis-
agree
Strongly
disagree Mean SD
1. The UU ITE 11, 2008 clearly
explains the meaning of computer
crime.
6.8 35.4 40.1 12.9 4.8 3.27 0.93
2. The UU ITE 11, 2008 has levels of
sanctions/ penalties for violators of
computer crime in every type of
crime.
6.8 32.0 41.5 12.9 6.8 3.19 0.98
3. The UU ITE 11, 2008 has been
published to the public with the
regulations contained within it.
0 4.8 25.2 53.7 16.3 2.18 0.76
4. There are enough training and
socialization for the implementation
of the UU ITE 11, 2008 in society,
especially in universities
0
.
7
4.1 34.0 45.6 15.6 2.29 0.80
5. It is easy to access technical
assistance, which facilitates the
implementation of the UU ITE 11,
2008 (i.e., Crisis Center and technical
advice).
0.7 16.3 54.4 21.8 6.8 2.82 0.80
Total 2.70 0.63
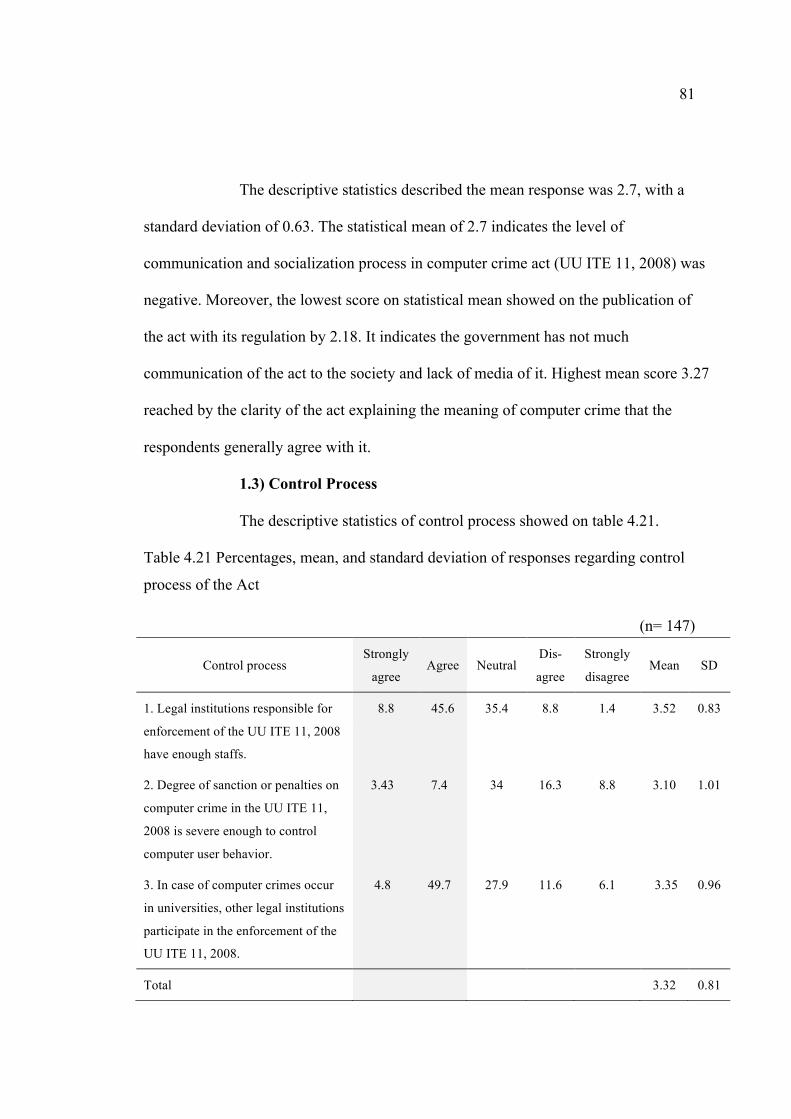
81
The descriptive statistics described the mean response was 2.7, with a
standard deviation of 0.63. The statistical mean of 2.7 indicates the level of
communication and socialization process in computer crime act (UU ITE 11, 2008) was
negative. Moreover, the lowest score on statistical mean showed on the publication of
the act with its regulation by 2.18. It indicates the government has not much
communication of the act to the society and lack of media of it. Highest mean score 3.27
reached by the clarity of the act explaining the meaning of computer crime that the
respondents generally agree with it.
1.3) Control Process
The descriptive statistics of control process showed on table 4.21.
Table 4.21 Percentages, mean, and standard deviation of responses regarding control
process of the Act
(n= 147)
Control process Strongly
agree Agree Neutral
Dis-
agree
Strongly
disagree Mean SD
1. Legal institutions responsible for
enforcement of the UU ITE 11, 2008
have enough staffs.
8.8 45.6 35.4 8.8 1.4 3.52 0.83
2. Degree of sanction or penalties on
computer crime in the UU ITE 11,
2008 is severe enough to control
computer user behavior.
3.43
7.4
34 16.3 8.8 3.10 1.01
3. In case of computer crimes occur
in universities, other legal institutions
participate in the enforcement of the
UU ITE 11, 2008.
4.8 49.7 27.9 11.6 6.1 3.35 0.96
Total 3.32 0.81

82
The table described that the mean response was 3.32, with a standard
deviation of 0.81. The statistical mean of 3.32 indicates the control process in
computer crime act (UU ITE 11, 2008) was moderate positive. In terms of control
process, the information in table 4.17 reveals that the highest mean score reach by the
adequacy of the number of staff in the agency responsible for act enforcement with
3.52 and the lowest score showed in degree of sanction or penalties to control
computer user behavior. It indicates that degree of sanction or penalties on computer
crime act (UU ITE 11, 2008) was not strong enough to control computer user
behavior, however, the adequacy of the number of staff in the agency responsible for
law enforcement actions can be interpreted as moderate positive.
2) Factors of Organization (X2)
The result of descriptive statistics on factor of organization describes
on table 4.22.
Table 4.22 Mean, standard deviation, and interpretation of organization factor
(n= 147)
Organization factor Mean SD. Interpretation
Leadership 3.18 0.75 Moderate positive
Human resources 3.66 0.99 Moderate positive
Organizational structure 3.87 0.82 Positive
Funding and physical resources 3.12 0.94 Moderate positive
Total 3.46 .774 Moderate positive
In table 4.22, known very positive response of respondent shows on
organizational structure; it has the highest mean value of 3.87. Meanwhile, leadership,

83
human resources and funding and physical resources with a mean of 3.18, 3.66 and
3.12 get moderate positive response from respondents. There is no negative responses
arise in factors of policy. Might be interpreted based on the perception of respondent
that the organizational factor has adequate in support ISSP implementation.
Moreover, the universities had strength in organizational structure. The details results
are exhibited in table 4.23 through 4.26.
2.1) Leadership
The result of descriptive statistics about leadership style in universities
shows in table 4.23.
Table 4.23 Percentage, mean, and standard deviation of responses regarding
leadership style in universities
(n= 147)
Leadership Strongly
agree Agree Neutral
Dis-
agree
Strongly
disagree Mean SD
1. The executive has
knowledge in computer crime
field and information security.
10.2 8.2 22.4 51.0 8.2 2.61 1.08
2. The executive has
knowledge about the UU ITE
11, 2008 and its enforcement
in institution
0.0 27.2 33.3 38.8 0.7 2.87 0.82
3. The executive strongly
supports the implementation of
UU ITE 11, 2008.
11.6 44.2 30.6 11.6 2.0 3.52 0.91
4. The executive has AN
ability to motivate the IT staffs
to keep enforce computer
crime act UU ITE 11, 2008.
21.1 42.9 27.9 6.8 1.4 3.76 0.91
Total 3.18 0.75

84
The descriptive statistics of the leadership’s style in the process of
implementation of the act describe that the mean response was 3.18, with a standard
deviation of 0.75. The statistical mean of 3.18 indicates the leadership style in a way
to success the implementation computer crime act (UU ITE 11, 2008) was moderate.
The low score of mean shown on the ability of the head of the university to know
about computer crime and its prevention (2.61), and also lack information about the
act (UU ITE 11, 2008) (2.87). Means that the head of the university must know more
about the necessity of computer crime act implement to their universities. However,
the head of university support the implementation of the act, and could influence the
staff to keep enforcing the act.
2.2) Human Resources
The result of descriptive statistic on human resources shows on table
4.24.
Table 4.24 Percentages, mean, and standard deviation of responses regarding human
resources in universities
(n= 147)
Human resources Strongly
agree Agree Neutral Disagree
Strongly
disagree Mean SD
1. Staffs have knowledge
and skill their job
25.2 40.8 22.4 8.2 3.4 3.76 1.02
2. Staffs have enough
education and training.
19.7 44.9 10.9 15.6 8.8 3.51 1.22
3. Staffs are active to
perform their duties.
29.9 38.8 27.9 2.7 0.7 3.95 0.86
4. Your institution has
enough staffs.
11.6 55.1 10.2 13.6 9.5 3.46 1.15
Total 3.66 0.99

85
The descriptive statistics of the human resources that could success of
implementation of the act described that the mean response was 3.66, with a standard
deviation of 1.07. The statistical mean of 3.66 indicates the contribution of the human
resources in order to success the implementation of computer crime act (UU ITE 11,
2008) was moderate positive. Furthermore, the highest mean score reached by the
staff performance which active perform their duties with 3.95 and the lowest score
founded in the adequacy of staff by 3.46.
2.3) Organizational Structure
The descriptive statistic result of the organizational structure shows on
table 4.25.
Table 4.25 Percentage, mean, and standard deviation of responses regarding
organizational structure in university
(n= 147)
Organizational structure Strongly
agree Agree Neutral Disagree
Strongly
disagree Mean SD
1. In your institution, every
department has clear
responsibility.
27.9 44.9 23.1 4.1 - 3.97 0.82
2. IT department has clear
responsibility.
27.9 44.9 21.1 4.1 2.0 3.93 0.91
3. All staffs receive enough
authority to handle their
duties.
22.4 42.9 23.1 9.5 2.0 3.74 0.98
4. IT Staffs receive enough
authority to handle their
duties.
26.5 44.9 20.4 6.8 1.4 3.88 0.92
Total 3.87 0.82

86
The descriptive statistics of the organizational structure that could
success of implementation of the act describe that the mean response was 3.87, with a
standard deviation of 0.82. The statistical mean of 3.87 indicates the form of
organizational structure was moderate positive in order to success the implementation
of computer crime act (UU ITE 11, 2008). The information in table 4.20 indicated
that every department in university has a clear responsibility, in this sub indicator
mean score is highest by 3.97 otherwise the lowest showed in staffs that receive
enough authority to handle their duties by 3.74.
2.4) Funding and Physical Resources
Descriptive statistic on funding physical resources is shown on table
4.26.
Table 4.26 Percentages, mean, and standard deviation of responses regarding funding
and physical resources in universities
(n= 147) Financial and physical
resources
Strongly
agree Agree Neutral Disagree
Strongly
disagree Mean SD
1. Your university has enough
funds to invest in any activities.
8.2 51.7 11.6 15 13.6 3.26 1.21
2. Decision-making procedure
on financial resources is clear.
2.7 52.4 32 11.6 1.4 3.44 0.78
3. Financial investment on ICT
is the first priority.
8.2 13.6 39.5 16.3 22.4 2.69 1.19
4. Your institution has enough
physical resources for any
activities.
7.5 52.4 12.9 17.7 9.5 3.31 1.13
5. Decision-making procedure
on physical resources is clear.
2.7 50.3 29.3 13.6 4.1 3.34 0.89
6. Physical investment on ICT
is the first priority.
8.2 13.6 42.2 15 21.1 2.73 1.17
87
Total 3.12 0.94
In Table 4.26, the descriptive statistics of the human resources that
could success of implementation of the act describe that the mean response was 3.08,
with a standard deviation of 0.99. The statistical mean of 3.08 indicates the activity in
funding and physical resources was low in order to success the implementation of
computer crime act (UU ITE 11, 2008). Based on the respondent perceptions
regarding funding and physical resources, indicates that highest mean score reached
by clarity of decision making in procedure on financial resources with 3.44. In
contrast, the low score of the mean was on the first priority of financial investment in
ICT about 2.69. That indicates most respondent was not in agreement with the ICT
investment for the first priority in universities, although the universities have enough
fund to invest in any activities and the procedure of funding are clear. The same
problem faced in physical resources.
4.3 Hypotheses Testing
Hypothesis testing performs using multiple regressions analysis. The
multiple regression analysis carried out to investigate the determinant factors
effecting the implementation of computer crime act (UU ITE 11, 2008) in
universities. In this section will test the hypotheses in three models of regression. The
result of regression analysis of factors influencing the implementation of computer
crime act (UU ITE 11, 2008) in administrative preparation is shown in table 4.27, and
Technical preparation is described in table 4.28, and combine both of preparation
which called ISSP is described in table 4.29.

88
The first model describing the result of regression analysis of factors
influencing administrative preparation is shown in table 4.27.
Table 4.27 Administrative preparation regression analysis results
Model Unstandardized
coefficients Standardized coefficients t Sig.
B Std. Error Beta
Constant -6.438 .796 -8.087 .000
Factor of policy .465 .315 .117 1.474 .143
Factor of organization 2.266 .285 .633 7.962 .000
Multiple R 0.719 Standard Error 1.93898
R2 0.517 F 183.330
Adjusted R2 0.510
The result of the test was the constant value which is equal to -6,438
that shows if there is no change of policy factor and organization factor, the value of
the administrative preparation is -6.438. Value of the regression coefficient for the
policy factor is equal to 0.645 states that every 1 percent increase in policy factor will
increase the value of administrative preparation for 0.645 while the organization
factor, each increase of 1% would increase the value of 2.266.
The coefficient determination (AdjR2 = 0.510) of regression
administrative preparation indicated that 51 percent of variation in administrative
preparation explained by the independent variables while the rest 49 percent of the
variation was due to the other variables which was not include in the model. The
overall regression result is shown only factor of organization was significant as
Fstatistic value of 183.330 and significant at α=0.00. This provides evidence that only

89
factor of organization had an impact simultaneously on administrative preparation in
the study area.
The second model of the result of regression analysis of factors that
influences technical preparation is shown in table 4.28.
Table 4.28 Technical preparation regression analysis results
Model Unstandardized
coefficients Standardized coefficients t Sig.
B Std. Error Beta
Constant -6.166 .800 -7.711 .000
Factor of policy .653 .317 .141 2.060 .041
Factor of organization 2.924 .286 .699 10.230 .000
Multiple R 0.802 Standard error 1.94735
R2 0.643 F 129.862
Adjusted R2 0.638
In table 4.28, the constant value is equal to -6,166 it means if there is
no change of policy factors and organization factors, the value of the technical
preparation are -6.166. Value of the regression coefficient for the policy factor is
equal to 0.853 states that every 1 percent increase in policy factors will increase the
value of technical preparation for 0.853 meanwhile for the organization factors, each
increase of 1 percent would increase the value of 2.924.
The coefficient determination (AdjR2 = 0.638) of regression technical
preparation form indicated that 63.8 percent of variation in technical preparation
explained by the independent variables while the rest 36.2 percent of the variation
was due to the other variable which was not included in the model. The overall
regression result was significant as Fstatistic value of 129.862 and significant below α=
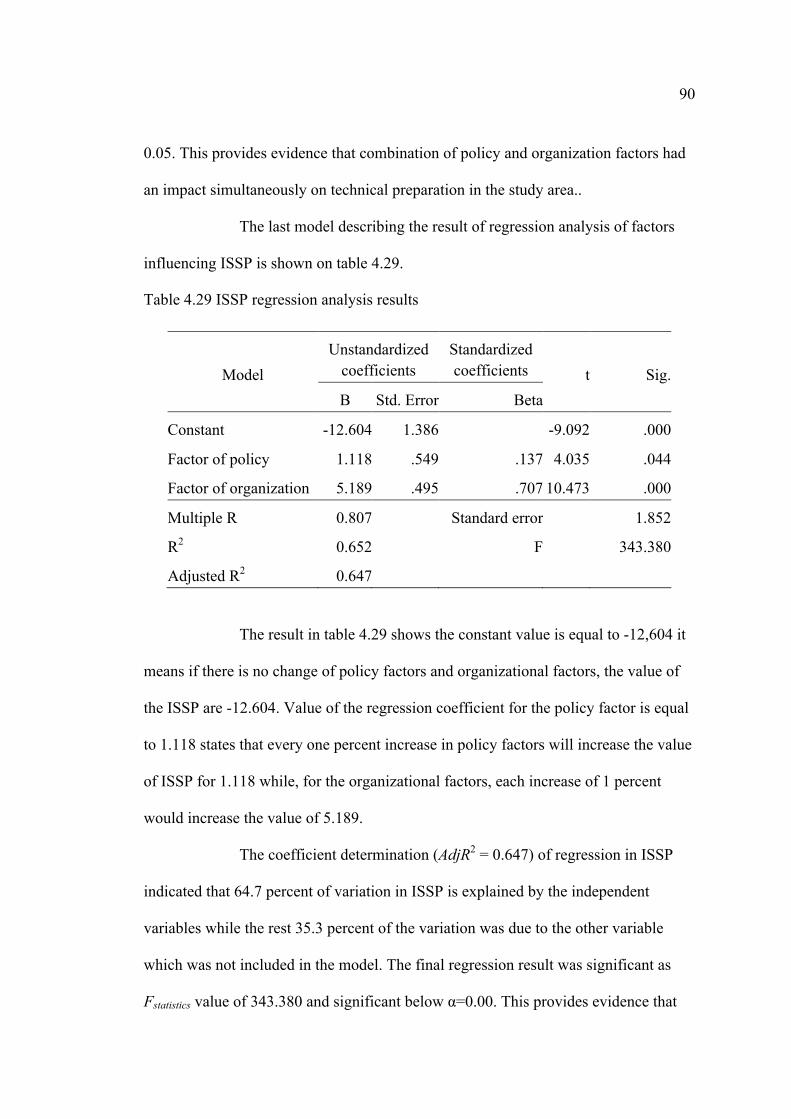
90
0.05. This provides evidence that combination of policy and organization factors had
an impact simultaneously on technical preparation in the study area..
The last model describing the result of regression analysis of factors
influencing ISSP is shown on table 4.29.
Table 4.29 ISSP regression analysis results
Model Unstandardized
coefficients Standardized coefficients t Sig.
B Std. Error Beta
Constant -12.604 1.386 -9.092 .000
Factor of policy 1.118 .549 .137 4.035 .044
Factor of organization 5.189 .495 .707 10.473 .000
Multiple R 0.807 Standard error 1.852
R2 0.652 F 343.380
Adjusted R2 0.647
The result in table 4.29 shows the constant value is equal to -12,604 it
means if there is no change of policy factors and organizational factors, the value of
the ISSP are -12.604. Value of the regression coefficient for the policy factor is equal
to 1.118 states that every one percent increase in policy factors will increase the value
of ISSP for 1.118 while, for the organizational factors, each increase of 1 percent
would increase the value of 5.189.
The coefficient determination (AdjR2 = 0.647) of regression in ISSP
indicated that 64.7 percent of variation in ISSP is explained by the independent
variables while the rest 35.3 percent of the variation was due to the other variable
which was not included in the model. The final regression result was significant as
Fstatistics value of 343.380 and significant below α=0.00. This provides evidence that

91
integration of policy and organizational factors had an impact simultaneously on ISSP
implementation.
From the overall results of the regression analysis is shown there is a
positive relationship between the factor of policy and factor of organization of the
ISSP. This is answered the fourth hypothesis that the hypothesis proved to be correct.

CHAPTER V
SUMMARY, DISCUSSION AND RECOMMENDATIONS
This chapter consists of three sections. The first section presents
summary of the research. The second section discusses the findings with respect to
each of variables and set of variables in the analysis whereas the final section presents
recommendations.
5.1 Summary
Objectives of the study were: 1) to analyze the degree of
implementation of information system security policy in universities in Indonesia, 2)
to analyze perception of heads of IT department about Computer Crime Act (UU ITE
11, 2008) in universities in Indonesia, 3) to analyze perception of heads of IT
department about the organizational disposition in universities in Indonesia, 4) to
investigate the extent to which the policy factor (Computer Crime Act – UU ITE 11,
2008) and the organizational factor affect implementation of information system
security policy in universities in Indonesia.
Data were collected using questionnaires from heads of IT department
in 147 universities on the island of Java during May to October 2012. Data were
analyzed using means, standard deviation, percentage, and multiple regressions.
The Results revealed as follows.
1) The extent of implementation of information system security policy
in universities on Java Island was moderate in the sense that implementing technical

93
preparation activities is higher than administrative preparation activities.
2) Perception of heads of IT department in universities about the
computer crime act (UU ITE 11, 2008) was moderate positive. All sub-variables that
consist of the objective and purpose of the act, clarity of the act,
and control process showed moderately positive results.
3) Perception of heads of IT department in universities about the
organizational disposition in universities is moderately positive. One sub-variable on
organizational factors, which is organizational structure, showed extremely positive.
Meanwhile, other three sub-variables: - leadership, human resources, and funding and
physical resources - showed moderate positive.
4) Both factors which are policy factors and organization factors have
a simultaneous effect on the application of ISSP in universities in Indonesia..
The tested hypotheses results revealed that:
1. The first hypothesis stated that the degree of implementing
information system security policy in universities in Indonesia is high. The research
finding showed that degree of implementing information system security policy in
universities in Indonesia is moderate. Thus this result did not support the testing
hypothesis.
2. The second hypothesis stated that perception of heads of IT
department about the computer crime act (UU ITE 11, 2008) in universities in
Indonesia is highly positive. The research finding showed that perception of heads of
IT department in universities about the computer crime act (UU ITE 11, 2008) was
moderate positive. Thus this result did not support the testing hypothesis.
3. The third hypothesis stated that perception of heads of IT

94
department in universities about the organizational disposition in universities is highly
positive. The research finding showed that perception of heads of IT department in
universities about the organizational disposition in universities is moderately positive.
Thus this result did not support the testing hypothesis.
4. The forth hypothesis postulated that only the policy factor
(Computer Crime Act – UU ITE 11, 2008) affect positively on implementation of
information system security policy in universities in Indonesia. The research finding
showed that both policy and organization factors have a simultaneous effect on the
application of information system security policy in universities in Indonesia. Thus
this result rejected the testing hypothesis.
5.2 Discussion
5.2.1 Level of implementation of ISSP in universities in Indonesia
Although Indonesia government regulated the Computer Crime Act
(UU ITE 11, 2008) to prevent computer crimes, the results of this research revealed
that implementation of information system security policy in universities in Indonesia
were still moderate. Universities could be at high risk on computer crime because IT
department in universities cannot prevent or handle computer crime perfectly. This
finding may come from many causes;
1) The administrative preparation in the prevention of computer crime
in the university is very rare in Indonesia, which causes information systems security
activities are not too effective. It can also be seen from the extremely low number of
universities that have special working group of computer crime.

95
2) On the activities of the Technical Preparation is known that the
number of universities that conduct technical security is high but the number of items
of technical preparation that is applied is not many to apply, it makes the university is
still vulnerable to computer crime.
This result inline with study by Sanaye’I (2007), a professor from
University of Isahan Iran, claiming that security is to combine system, operations and
internal controls to ensure the integrity and confidentiality of data and operation
procedures in an organization (Sanaye’i, 2007)
5.2.2 Factor of policy (the Computer Crime Act - UU ITE 11,
2008)
The opinion of the head of IT department at universities in Indonesia
towards the factor of policy (Computer crime act - UU ITE 11, 2008) was moderate
positive. That information did not match with the assumption that stated highly
positively. This difference may be caused by the average respondents stated enough
on law enforcement process. Hence it can be stated that the enforcement process of
the Computer crime act (UU ITE 11, 2008) was not effective enough. Therefore, it
should increase more interest in parameters on policy factor that are: publishing,
training, and technical assistance from the Act.
This opinion is also similar to Phaopeng (2010), who mentioned about
the success of ICT policy implementation is determined by the policy conditions.
Phaopeng conducted research about the success of ICT policy implementation in
education (Phaopeng, 2010)
5.2.3 Factor of organization

96
Opinion of the head IT department at university in Indonesia towards
the organizational factors was moderate positive. Results did not match with the
hypothesis that stated highly positive. This difference may be caused by the responses
toward organizational structure that gave a highly positive value while the leadership,
human resources, and funding and physical resources states moderately positive.
Therefore, the increasing attention by the university’s leader are considered highly
necessary, in addition, to the increasing need for financial resources and the
procurement of physical facilities is to be considered by the university.
This research result is similar with study by Geary about the role of the
leader of the organization to prevent computer crime. Geary stated that the CEO now
has the job of top cop, organizational managers are held responsible for the
prevention of crime (Geary, 1994)
5.2.4 Factors effecting implementation of information security
policy
The final point is investigating the extent to which the policy factor
(Computer Crime Act – UU ITE 11, 2008) and the organizational factors affect
implementation of ISSP in Indonesia Universities, and the tested hypothesis result
was both variables affected the success of ISSP implementation in universities
positively. This suggests that the policy factors and organizational factors have strong
links to the success of information systems security policy implementation at the
universities and also the success of the application of computer crime act (UU ITE 11,
2008). The higher the requirements to be fulfilled in both policy factors and
organizational factors, the more successful the implementation of the act (UU ITE 11,
2008).

97
This is inline with research result by Chang and Ho (2006) in which
they studied about organizational factors to the effectiveness of implementing
information security management. The study result revealed that there were
significant impacts of organizational factors including IT competence of business
managers, environment uncertainty, industry type, and organization size, on the
effectiveness of implementing ISM.
5.3 Recommendations
Based on results presented in chapter IV and details also discussed in
chapter V, recommendation to improve success implementation the computer crime
act (UU ITE 11, 2008) in Indonesia universities was made.
5.3.1 Recommendation to universities
5.3.1.1 Implementation of ISSP
The recommendation to universities regarding implementation of ISSP
in universities is as follows:
1) Low percentage appears on the availability of a special unit or
workgroup for information system security. Concern of leaders to the security of
information systems by organizing a special unit or workgroup security information
system is needed in university.
2) Universities also have a low percentage of administrative
preparation, especially the provision of documents relating to the ISSP and prevention
of computer crime. Procurement documents to all users of IT can enhance the user's
98
knowledge of the security of information systems.
3) Universities need to implement the technical preparation activities
according to Indonesia Information Security Standards (ISO) ISO / IEC 27001: 2009.
5.3.1.2 Organizational factor
Moreover, the recommendation to universities regarding to
organizational factor is as follows:
1) More support from executive specially in increasing knowledge of
information system security and computer crime also more attention to ICT priority
regarding funding and physical resources will strengthen the success of computer
crime act implementation.
2) To provide written policies and procedures against crime and
declared security awareness program in university.
3) Reporting to law enforcement agencies of detected crimes.
5.3.2 Recommendation to government
Some suggestions related to the successful implementation of
computer crime laws for the government of Indonesia is as follows:
1) Issuing government regulations to simplify the understanding and
implementation of the computer crime act (UU ITE 11, 2008) by the universities such
as the application of ISSP which is appropriate to Indonesia safety standards (SNI)
ISO / IEC 27001: 2009, also providing technical guidance of ISSP implementation.
2) Banning the site and illegal organization that potentially provide the
computer crime.

99
3) Adding more personnel that have special ability in computer crime to handle the
crime that occur, and increase the speed of process the crime to the court.
100
BIBLIOGRAPHY
Act No. 11 of 2008, concerning on “Electronics Informatics and Transaction”.
Ministry of Law and Human Rights. Anderson, James E., 1979. “Public Policy Making”, New York : Holt, Rinehart and
Winston. Anderson, Ross J., Stajano, Frank., and Lee, Jong-Hyeon., 2001, “Security Policies”.
Advances in Computers (AC) 55:185-235 Berman, Evan M, 1998. “Productivity in Public and Nonprofit Organizations:
Strategies and Techniques”, SAGE Publications Berry, Frances Stikes, Berry, William D., Foster, Stephen K 1998 “The Determinants
of Success in Implementing an Expert System in State Government” Lead Article, Public Administration Review Vol. 58, No. 4, www.jstor.org
Burden, Kit and Palmer, Creole, Lyde, Barlow and Gilbert, 2003, “Internet Crime:
Cyber Crime – A New Breed of Criminal?”, Computer Law and Security Report Vol.19 No.3 2003, Elsevier Ltd
Economic and Social Council (ECOSOC), United Nations, 2006, “Definition of
Basic Concepts and Terminologies in Governance and Public Administration”, Committee of Experts on Puclic Administration, fifth session, New York, 27-31 March 2006.
Chang, Sucich Ernest., and Ho, Chienta Bruce., 2006. “Organizational Factor to The
Effectiveness of Implementing Information Security Management”, Journal of Industrial Management and Data System Vol.106. No. 3 Pp. 345-361. Emerald Group Publishing Limited
Cheurprakobkit, Sutham and Pena, Gloria T., 2003, “Computer Crime Enforcement
in Texas: Funding, Training and Investigating Problems”, Journal of Police and Criminal Phsycology, Vol 18, Number 1.
Chick, Warren B, “Challenges to Criminal Law Making in the New Global
Information Society: A Critical Comparative Study of the Adequacies of Computer-Related Criminal Legislation in the United States, the United Kingdom and Singapore” Paper, www.law.ed.ac.uk/ahrc/complaw/ docs/chik.doc. accesed on Nov 20, 2010
DeLeon, Peter and DeLeon. Linda 2001, “What Ever Happened to Policy
Implementation? An Alternative Approach”, University of Colorado Denver

101
Doherty, Neil Fancis, et al., 2009, “The Information Security Policy Unpacked: A Critical Study of the Content of University Policy”, International Journal of Information Management, Elsevier Ltd
Doney, Lloyd, 2001, Nonprofits Aren’t Immune to Computer Crime, Articles
Nonprofit World, Vol.19, Number 2 March/April 2001 Odana Road Suite 1, Madison, USA
Donnely, Gibson., Konopaske, Robert., Ivancevich, Ma 2006, Organization;
Behaviour Structure and Process, McGraw – Hill International Edition Dowland P.S., Furnel S.M., Illingworth and Reynolds P.L., 1999 “Computer Crime
and Abuse:A Survey of Public Attitudes and Awareness”, Computer and Security Vol 18 pp.715-726, Elsevier Science Limited.
Dye. Thomas R, 2002, Understanding Public Policy (tenth edition). New Jersey:
Prentice Hall. Easttom, Chuck and Taylor, Jeff Det. 2011, Computer Crime, Investigation, and the
Law, Course Technology, Cengage, Boston, USA Edwards, G. C. 1980. “Implementing Public Policy”. Washington, DC.:
Congressional Quarterly Press. Frederickson, H. George and Smith Kevin B. 2003, “The Public Administration
Theory Primer”, Westview Press Oxford, USA Gay, L. R. and Diehl, P. L., 1992, “Research Method for Business and Management”,
Macmillan. Pub. Co. Geary, M. James. 1994, “Executive Liability for Computer Crime and How to Prevent
It” Information Management and Computer Security Vol.2 No.2 1994 Pp.29-31, MCB University Press Limited.
Gujarati, D. 2004, “Basic Econometric, Fourth Edition”, The McGraw-Hill
Companies. Gottschalk, Petter , 2000, “Information Systems Executives: The Changing Role of
New IS/IT Leaders”, Norwegian School of Management, Informing Science Vol 3 No 2.
Highfield, Malcolm, 2000, “The Computer Misuse Act 1990: Understanding and
Applying the Law” Baltimore Technologies plc, Information Security Technical Report, Vol 5, No.2, Elseviere Science Ltd.
Hill, Michael and Hupe, Peter, 2002, “Implementing Public Policy: Governance in
Theory and in Practice”. London: SAGE Publications Ltd.

102
Hill, Michael. 1997, “The Policy Process in Modern State”, Prentice Hall / Harvester
Wheatsehaf, London Icove, David., Seger, Karl., and VonStorch, William, 1995, “Computer Crime, A
Crimefighter's Handbook”, O'Reilly and Associates, Inc. 103 Morris Street, Suite A Sebastopol, CA 95472
Ivancevich, John M., Konopaske, Robert., and Matteson, Michael T., 2005,
“Organizational Behavior and Management”, Seventh Edition, McGraw Hill USA
Kaplan, David, 2000, “Structural Equation Modeling, Foundation and Extensions”,
SAGE Publications USA Karahanna, Elena and Watson, Richard Thomas., 2006, “Information System
Leadership”, IEEE Transaction on Engineering Management, Vol 53, No.2, May. www.ieee.org.
Keith, Timothy Z. 2006, “Multiple Regression and Beyond”, Pearson Education USA Kinicki, Angelo and Williams, Brian., 2010, “Management: A Practical
Introduction”, Mc Graw Hill, USA. Kitnitchiva, Anuphan. 2009 “Major Factors Affecting The Implementation And
Effectiveness Of The RandD Tax Incentive Policy”, Dissertation of National Institute of Development Administration Thailand
Kleve, Pieter., De Mulder, Richard., and Van Noortwijk, Kees., 2011, “The
Definition of ICT Crime”, Computer Law and Security Review 27, Science Direct, Elsevier Publications Ltd.
Kline, Rex B. 2011, “Principles and Practice of Structural Equation Modeling”,
Third Edition, The Guilford Press, New York, London. Kreitner, Robert and Kinicki, Angelo, 2010, “Organizational Behavior”, Ninth
edition, McGraw-Hill/Irwin USA Lane, Jan-Erik, 1993, “The Public Sector, Concepts, Models and Approaches”,
SAGE Publication Ltd. London Lester, James P., and Steward, JR, Joseph, 2000. “Public Policy, An Evolutionary
Approach, Second Edition”, Wadsworth Luo Xin, Warkentin Merril. 2004. “Assessment of Information Security spending and
cost of failure”, Proceeding of the Third Security Conference, 14-15 April 2004, Las Vegas, Nevada, USA.

103
Matland, Richard E. 1995. “Synthesizing the Implementation Literature: The
Ambiguity-Conflict Model of Policy Implementation”. Journal of Public Administration Research and Theory: J-PART, Vol. 5, No. 2. (Apr., 1995). Texas: University of Houston
Minister of National Education, 2010. Indonesian Government Regulation Number 17
Year 2010 On The Management And Conduct Of Education Mitchell, Penelope F., 2010, “Evidence-Based Practice in Real World Service for
Young People with Complex Needs: New Opportunities Suggested by Recent Implementation Science”, Children and Youth Service Review 33, Elsevier Publications Ltd.
Mullins, Laurie J, 1996, “Management and Organization Behavior, Forth Edition”,
Pitman Publishing, Great Britain. Newton, Michael, 2008. “The Encyclopedia of Crime Scene Investigation”, Info base
Publishing, Inc. USA Nuth, Maryke Silalahi, 2008, “Taking Advantage of New Technologies: For and
Against Crime”, Computer Law and Security Report Vol.24, Elsevier Ltd Percival, Garrick L 2004. “The Influence of Local Contextual Characteristics on the
Implementation of a statewide voter Initiative: The Case of California’s Substance Abuse and Crime Prevention Act (Proportion 36)”, Blackwell Publishing Inc. Oxford, USA
Phaopeng, Peerapol 2010. “The Success of ICT Policy Implementation in Education:
Evidence from Upper-Level Secondary Schools in Thailand”, dissertation in School of Public Administration, National Institute of Development Administration, Thailand.
Post, Gerald V. and Anderson, David L. 2006. “Management Information System”,
McGraw-Hill/Irwin USA Potter, Richard E., Rainer Jr, Kelly R., Turban Efraim., 2005, “Introduction to
Information Technology”, Wailey and Sons Inc, USA Reyes, Anthony et all, 2007, Crime Investigations Bridging the Gaps Between
Security Professionals, Law Enforcement, and Prosecutors, Robbins, Stephen P, 2005, Organizational Behavior, Pearson Education, Inc, Upper
Saddle River, New Jersey, USA
104
Rosenbloom, David H., and Kravchuk Robert S., 2005, Public Administration, Understanding Management, Politics, and Law in The Public Sector, McGraw-Hill, USA
Salomon, David, 2010, “Elements of Computer Security”, Springer-Verlag Limited,
London Sanaye’i, A. Ph.D, 2007. “The Key Role Information Security in E-Commerce”,
Iranian Journal of Information Science and Technology Vol.5 No.1 January/June 2007.
Senn, James A, 1995. Information Technology in Business, Principles, Practices, and
Opportunities, Prentice Hall International Inc. Sieber U. Prof. Dr. 1995. “Computer Crime and Criminal Information Law - New
Trends in the International Risk and Information Society”, article in the German language published in Computer und Recht (CR) 1995, pp. 100 et seq. http://www.uplink.com.au/lawlibrary/ accessed on December 17, 2010
Stillman II, Richard J. 1996. Public Administration, Concept and Cases, Houghton
Mifflin Company, Boston, USA Sugiyono. 2007. Research Method for Administration and Management (Metode
Penelitian Administrasi dan Manajemen), Bandung, Alfabeta. Sundt, Chris, 2005, “Information Security and The Law”, Information Security
Technical Report 11 (2006) 2-9, Elsevier Science Limited. Tipton, Harold F., and Krause Micki, 2003, Information Security Management
Handbook Fifth Edition, Volume 2, Auerbach Publications, A Crc Press Company Boca Raton London New York Washington, D.C.
Turnhout, Esther 2009 “The Rise And Fall Of A Policy: Policy Succession And The
Attempted Termination Of Ecological Corridors Policy In The Netherlands” Policy Sci Journal, Springer.
United Nations. 2006. “Definition of Basic Concepts ant Terminologies in
Governance and Public Administration” article of Economic and Social Council,
Vacca, John R, 2009, Computer and Information Security Handbook, Morgan
Kaufmann Publishers is an imprint of Elsevier. 30 Corporate Drive, Suite 400, Burlington, MA 01803, USA.

105
Van Meter, Donald S. and Van Horn, Carl E., 1975, “The Policy Implementation Process: A Conceptual Framework” Administration and Society, SAGE Publications, Inc.
Walton, Richard, 2006, “The Computer Misuse Act”, Information Security Technical
report 11, Elsevier Ltd Yamane, Taro, 1967, “Statistics an Introductory Analysis”, Harper and Row. New
York.
Zikmund, G. William. 2003. Business Research Methods. Thomson – South Water, Ohio.

106
APPENDICES
Appendix 1 Draft of Questionnaire
Thesis Title: The Success of Computer Crime Act Implementation (UU ITE No.11, Year 2008) In Higher Education Institution In Indonesia Introduction Computer crime has grown rapidly along with the development of the digital world and the higher education institution cannot be separated from the activities of a computer crime. For that issue we are testing whether the Indonesia computer crime act (UU ITE 11, 2008) successfully applied to prevent the crime that would arise, especially in higher education institution environment. In this regard we request the head of department or managers or staff of information systems at higher education institution to give the perception about the application of computer crime and computer crime acts in your work environment. The purposes of this study are: 1. To study the implementation of computer crime acts and, 2. To identify factors that influence the implementation of computer crime acts that exists in Indonesia. Researcher Identity Researcher: Rizki Yudhi Dewantara (Student Double Degree Program Prince of Songkla
University Thailand and Fakultas Ilmu Administrasi Universitas Brawijaya Malang)
Advisor: (1st) Asst.Prof.Dr.Suwit Chanpetch, (2nd) Dr.Nuttida Suwanno (Prince of Songkla University) Co. Advisor: Prof. Dr. Bambang Supriyono MS. (Universitas Brawijaya) This questionnaire used for conduct thesis at the Department of Public Administration, Faculty of Management Science, Prince of Songkla University, Thailand. Thank you The questionnaires divided into 3 sections, which are: Section 1: Respondent data Section 2: Institutional activities for preventing computer crime Section 3: Perception of head of department or managers or staff of information systems in
your institution about computer crime acts (UU ITE 11, 2008)

107
Section I: Respondent Data 1. Name of respondent: _______________________________________________________ 2. Position of respondent: [ ] IT Staff [ ] Supervisor [ ] Head of Department 3. Name of institution: _______________________________________________________ 4. Address: _________________________________________ City___________________ 5. Contact: ______________________________e-mail_____________________________ ___________________________________________________________________________ Section II: Activities for preventing computer crime Directions: Please read the statement carefully. Give the tick to the appropriate option that represents your institution. A. Administration Preparation
No Statement Yes No Working Group and its duties 1 Having a working group or committee responsible for the implementation of
the Act UU ITE 11, 2008
2 Member of working group come from related institution such as the head of the division of computer crime, IT security specialists, lawyers, or the authorities to handle cases of computer crime.
3 Working group has authorities in making decisions about security and action against computer crime.
4 Working group has formal and informal meetings schedule to discuss the prevention of computer crime and problems in campus area.
5 Evaluating working group performance about the successful prevention of computer crime and the application of UU ITE 11, 2008.
Information Security Policy 6 Having a clear information system security policy. 7 Declaring the information system security policy. Communicate the computer crime act to the user of ICT 8 Providing and Distributing the material of computer crime prevention such as
printable document computer crime act UU ITE 11, 2008, security policy standard/ISO/IEC (ISO/IEC 29192-2:2012) to students.
9 Providing and Distributing the material of computer crime prevention such as printable document computer crime act UU ITE 11, 2008, security policy standard/ISO/IEC (ISO/IEC 29192-2:2012) to educational staffs.
10 Providing and Distributing the material of computer crime prevention such as printable document computer crime act UU ITE 11, 2008, security policy standard/ISO/IEC (ISO/IEC 29192-2:2012) to IT staffs.
B. Technical Preparation
No Statement Yes No Higher education institution as an access service provider 11 Having user identification for identifying the user to control access. 12 Monitoring systems to all of data accessed by users. 13 Having data backup activities.
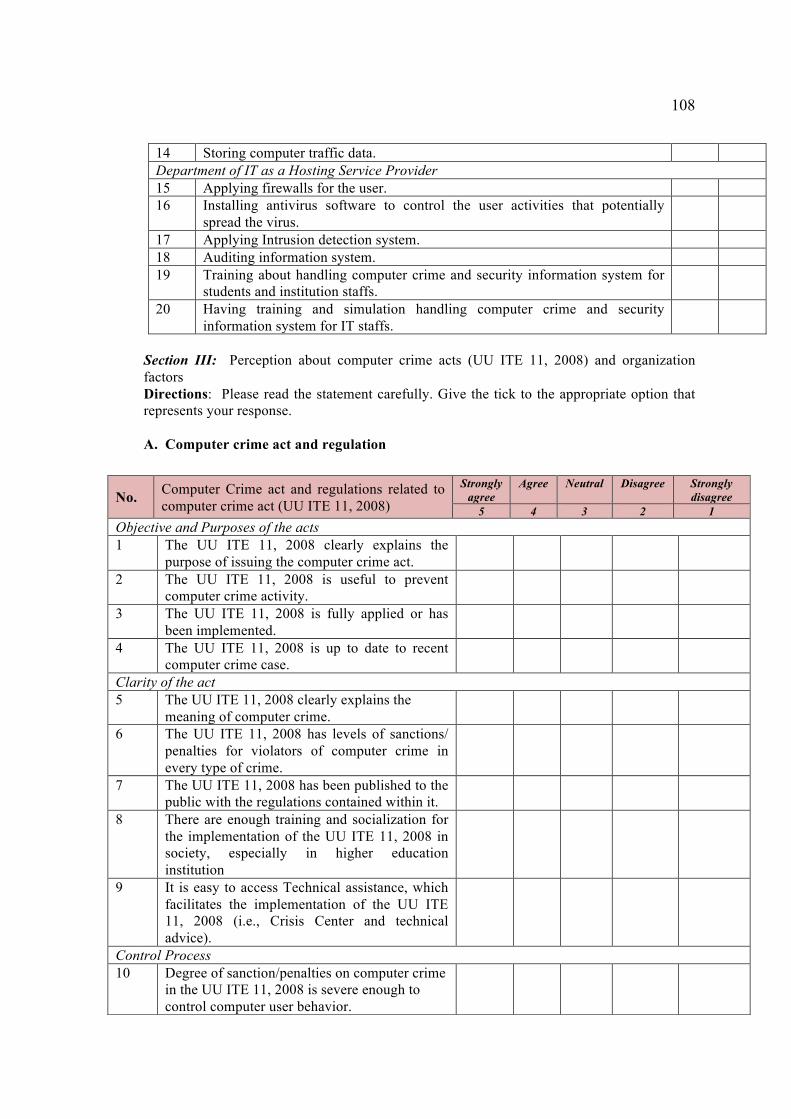
108
14 Storing computer traffic data. Department of IT as a Hosting Service Provider 15 Applying firewalls for the user. 16 Installing antivirus software to control the user activities that potentially
spread the virus.
17 Applying Intrusion detection system. 18 Auditing information system. 19 Training about handling computer crime and security information system for
students and institution staffs.
20 Having training and simulation handling computer crime and security information system for IT staffs.
Section III: Perception about computer crime acts (UU ITE 11, 2008) and organization factors Directions: Please read the statement carefully. Give the tick to the appropriate option that represents your response. A. Computer crime act and regulation
No. Computer Crime act and regulations related to computer crime act (UU ITE 11, 2008)
Strongly agree
Agree Neutral Disagree Strongly disagree
5 4 3 2 1 Objective and Purposes of the acts 1 The UU ITE 11, 2008 clearly explains the
purpose of issuing the computer crime act.
2 The UU ITE 11, 2008 is useful to prevent computer crime activity.
3 The UU ITE 11, 2008 is fully applied or has been implemented.
4 The UU ITE 11, 2008 is up to date to recent computer crime case.
Clarity of the act 5 The UU ITE 11, 2008 clearly explains the
meaning of computer crime.
6 The UU ITE 11, 2008 has levels of sanctions/ penalties for violators of computer crime in every type of crime.
7 The UU ITE 11, 2008 has been published to the public with the regulations contained within it.
8 There are enough training and socialization for the implementation of the UU ITE 11, 2008 in society, especially in higher education institution
9 It is easy to access Technical assistance, which facilitates the implementation of the UU ITE 11, 2008 (i.e., Crisis Center and technical advice).
Control Process 10 Degree of sanction/penalties on computer crime
in the UU ITE 11, 2008 is severe enough to control computer user behavior.
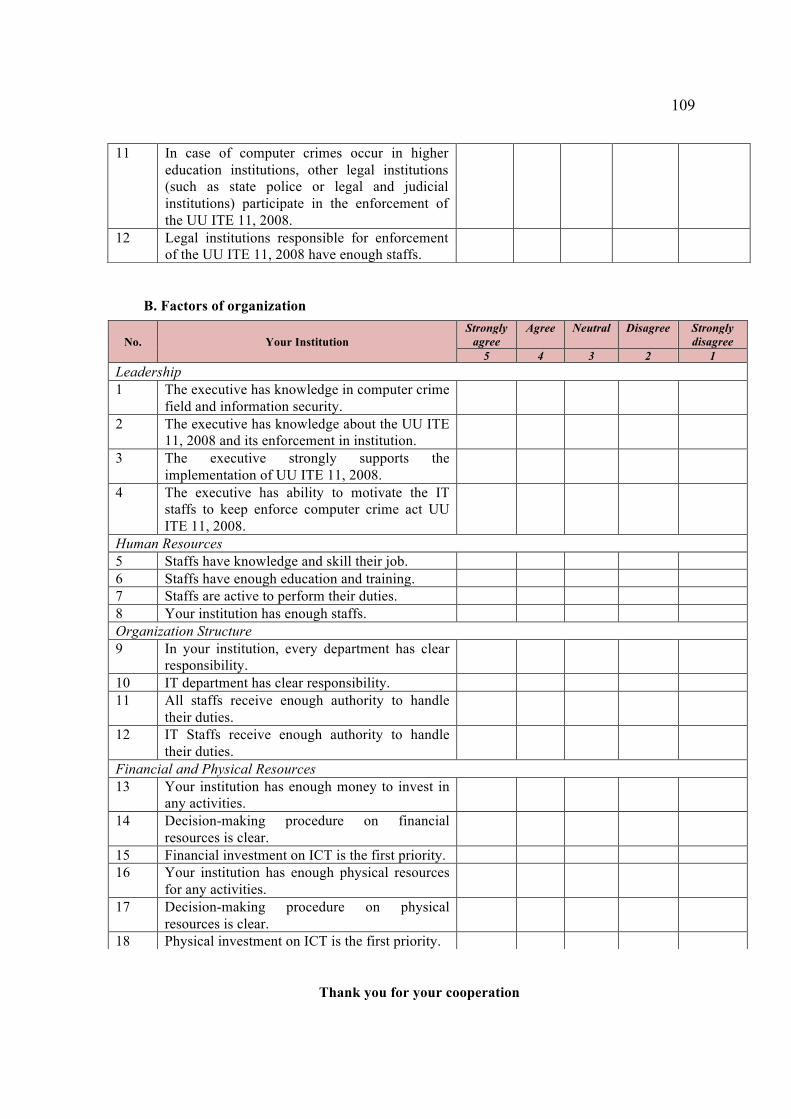
109
B. Factors of organization
Thank you for your cooperation
11 In case of computer crimes occur in higher education institutions, other legal institutions (such as state police or legal and judicial institutions) participate in the enforcement of the UU ITE 11, 2008.
12 Legal institutions responsible for enforcement of the UU ITE 11, 2008 have enough staffs.
No. Your Institution Strongly
agree Agree Neutral Disagree Strongly
disagree 5 4 3 2 1
Leadership 1 The executive has knowledge in computer crime
field and information security.
2 The executive has knowledge about the UU ITE 11, 2008 and its enforcement in institution.
3 The executive strongly supports the implementation of UU ITE 11, 2008.
4 The executive has ability to motivate the IT staffs to keep enforce computer crime act UU ITE 11, 2008.
Human Resources 5 Staffs have knowledge and skill their job. 6 Staffs have enough education and training. 7 Staffs are active to perform their duties. 8 Your institution has enough staffs. Organization Structure 9 In your institution, every department has clear
responsibility.
10 IT department has clear responsibility. 11 All staffs receive enough authority to handle
their duties.
12 IT Staffs receive enough authority to handle their duties.
Financial and Physical Resources 13 Your institution has enough money to invest in
any activities.
14 Decision-making procedure on financial resources is clear.
15 Financial investment on ICT is the first priority. 16 Your institution has enough physical resources
for any activities.
17 Decision-making procedure on physical resources is clear.
18 Physical investment on ICT is the first priority.

110
Appendix 2 Data Processing Result
GET FILE='/Volumes/Data/CC Thesis/uji statistik/data newest dependnt.sav'. DATASET NAME DataSet1 WINDOW=FRONT. SORT VARIABLES BY NAME (A). SORT VARIABLES BY ALIGNMENT (A). SORT CASES BY Catagories(A). SAVE OUTFILE='/Users/rizkidewantara/Documents/data newest uni only.sav' /COMPRESSED. FREQUENCY VARIABLES=Y11 Y12 Y13 Y14 Y15 Y21 Y22 Y31 Y32 Y33 Y41 Y42 Y43 Y44 Y51 Y52 Y53 Y54 Y55 Y56 /STATISTICS=STDDEV MEAN /ORDER=ANALYSIS. Frequency
Notes Output Created 03-MAR-2013 17:15:33 Comments
Input
Data /Users/rizkidewantara/Documents/data newest uni only.sav
Active Dataset DataSet1 Filter <none> Weight <none> Split File <none> N of Rows in Working Data File 147
Missing Value Handling Definition of Missing User-defined missing values are treated
as missing.
Cases Used Statistics are based on all cases with valid data.
Syntax
FREQUENCY VARIABLES=Y11 Y12 Y13 Y14 Y15 Y21 Y22 Y31 Y32 Y33 Y41 Y42 Y43 Y44 Y51 Y52 Y53 Y54 Y55 Y56 /STATISTICS=STDDEV MEAN /ORDER=ANALYSIS.
Resources Processor Time 00:00:00.03 Elapsed Time 00:00:00.00
[DataSet1] /Users/rizkidewantara/Documents/data newest uni only.sav
Statistics Workgroup
Availabilty Source of
Workgroup Decision Making
Authority Formal Group
Meeting Workgroup Evaluation
IS Security Policy
N Valid 147 147 147 147 147 147 Missing 0 0 0 0 0 0
Mean .22 .03 .04 .14 .16 .67 Std. Deviation .419 .182 .199 .351 .371 .471
Statistics IS Security
declared ISSP
document for student
ISSP document for
Institution Staffs
ISSP documentforInstitution
IT Staff
Applied User ID Monitoring user
access
N Valid 147 147 147 147 147 147 Missing 0 0 0 0 0 0
Mean .40 .33 .35 .50 .69 .65 Std. Deviation .492 .471 .480 .502 .465 .480
Statistics
Backup Data
Log data Backup
firewall Antivirus IDS Audit IS Training for Student
N Valid 147 147 147 147 147 147 147 Missing 0 0 0 0 0 0 0
Mean .93 .56 .66 .87 .47 .44 .35 Std. Deviation .253 .498 .475 .337 .501 .498 .478

111
Statistics
Training for IT
N Valid 147 Missing 0
Mean .38 Std. Deviation .487 Frequency Table
Workgroup Availabilty Frequency Percent Valid Percent Cumulative Percent
Valid 0 114 77.6 77.6 77.6 1 33 22.4 22.4 100.0 Total 147 100.0 100.0
Source of Workgroup
Frequency Percent Valid Percent Cumulative Percent
Valid 0 142 96.6 96.6 96.6 1 5 3.4 3.4 100.0 Total 147 100.0 100.0
Decision Making Authority
Frequency Percent Valid Percent Cumulative Percent
Valid 0 141 95.9 95.9 95.9 1 6 4.1 4.1 100.0 Total 147 100.0 100.0
Formal Group Meeting
Frequency Percent Valid Percent Cumulative Percent
Valid 0 126 85.7 85.7 85.7 1 21 14.3 14.3 100.0 Total 147 100.0 100.0
Workgroup Evaluation
Frequency Percent Valid Percent Cumulative Percent
Valid 0 123 83.7 83.7 83.7 1 24 16.3 16.3 100.0 Total 147 100.0 100.0
IS Security Policy
Frequency Percent Valid Percent Cumulative Percent
Valid 0 48 32.7 32.7 32.7 1 99 67.3 67.3 100.0 Total 147 100.0 100.0
IS Security declared
Frequency Percent Valid Percent Cumulative Percent
Valid 0 88 59.9 59.9 59.9 1 59 40.1 40.1 100.0 Total 147 100.0 100.0
ISSP document for student
Frequency Percent Valid Percent Cumulative Percent
Valid 0 99 67.3 67.3 67.3 1 48 32.7 32.7 100.0 Total 147 100.0 100.0
ISSP document for Institution Staffs
Frequency Percent Valid Percent Cumulative Percent
Valid 0 95 64.6 64.6 64.6 1 52 35.4 35.4 100.0 Total 147 100.0 100.0
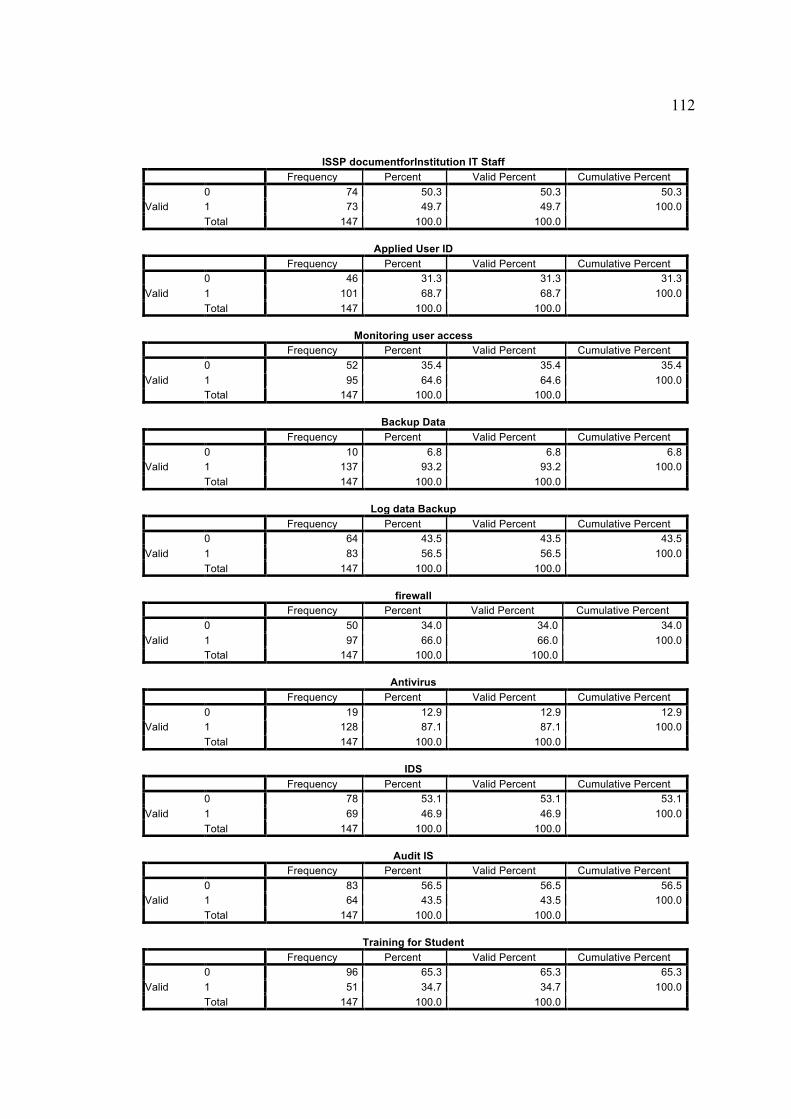
112
ISSP documentforInstitution IT Staff
Frequency Percent Valid Percent Cumulative Percent
Valid 0 74 50.3 50.3 50.3 1 73 49.7 49.7 100.0 Total 147 100.0 100.0
Applied User ID
Frequency Percent Valid Percent Cumulative Percent
Valid 0 46 31.3 31.3 31.3 1 101 68.7 68.7 100.0 Total 147 100.0 100.0
Monitoring user access
Frequency Percent Valid Percent Cumulative Percent
Valid 0 52 35.4 35.4 35.4 1 95 64.6 64.6 100.0 Total 147 100.0 100.0
Backup Data
Frequency Percent Valid Percent Cumulative Percent
Valid 0 10 6.8 6.8 6.8 1 137 93.2 93.2 100.0 Total 147 100.0 100.0
Log data Backup
Frequency Percent Valid Percent Cumulative Percent
Valid 0 64 43.5 43.5 43.5 1 83 56.5 56.5 100.0 Total 147 100.0 100.0
firewall
Frequency Percent Valid Percent Cumulative Percent
Valid 0 50 34.0 34.0 34.0 1 97 66.0 66.0 100.0 Total 147 100.0 100.0
Antivirus
Frequency Percent Valid Percent Cumulative Percent
Valid 0 19 12.9 12.9 12.9 1 128 87.1 87.1 100.0 Total 147 100.0 100.0
IDS
Frequency Percent Valid Percent Cumulative Percent
Valid 0 78 53.1 53.1 53.1 1 69 46.9 46.9 100.0 Total 147 100.0 100.0
Audit IS
Frequency Percent Valid Percent Cumulative Percent
Valid 0 83 56.5 56.5 56.5 1 64 43.5 43.5 100.0 Total 147 100.0 100.0
Training for Student
Frequency Percent Valid Percent Cumulative Percent
Valid 0 96 65.3 65.3 65.3 1 51 34.7 34.7 100.0 Total 147 100.0 100.0

113
Training for IT Frequency Percent Valid Percent Cumulative Percent
Valid 0 91 61.9 61.9 61.9 1 56 38.1 38.1 100.0 Total 147 100.0 100.0
FREQUENCY VARIABLES=SumY1 SumTeknic SumY2 SumY3 SumY4 SumY5 TotDependen /STATISTICS=STDDEV MEAN /ORDER=ANALYSIS. Frequency
Notes Output Created 03-MAR-2013 17:16:48 Comments
Input
Data /Users/rizkidewantara/Documents/data newest uni only.sav
Active Dataset DataSet1 Filter <none> Weight <none> Split File <none> N of Rows in Working Data File 147
Missing Value Handling Definition of Missing User-defined missing values are treated
as missing.
Cases Used Statistics are based on all cases with valid data.
Syntax
FREQUENCY VARIABLES=SumY1 SumTeknic SumY2 SumY3 SumY4 SumY5 TotDependen /STATISTICS=STDDEV MEAN /ORDER=ANALYSIS.
Resources Processor Time 00:00:00.02 Elapsed Time 00:00:00.00
[DataSet1] /Users/rizkidewantara/Documents/data newest uni only.sav
Statistics SumWorkGroup&Duties SumTecnic SumISSP
Availability SumEnhancing
User of ICT SumAcess
ServiceProvider SumHosting
Service Provider
N Valid 147 147 147 147 147 147 Missing 0 0 0 0 0 0
Mean .6054 5.9932 1.0748 1.1769 2.8299 3.1633 Std. Deviation 1.21383 3.23825 .85278 1.33807 1.37678 2.02735
Statistics Total Dependen
N Valid 147 Missing 0
Mean 8.8503 Std. Deviation 5.68265 Frequency Table
SumWorkGroup&Duties Frequency Percent Valid Percent Cumulative Percent
Valid
.00 114 77.6 77.6 77.6 1.00 5 3.4 3.4 81.0 2.00 5 3.4 3.4 84.4 3.00 19 12.9 12.9 97.3 4.00 3 2.0 2.0 99.3 5.00 1 .7 .7 100.0 Total 147 100.0 100.0

114
SumTecnic Frequency Percent Valid Percent Cumulative Percent
Valid
1.00 5 3.4 3.4 3.4 2.00 36 24.5 24.5 27.9 3.00 7 4.8 4.8 32.7 4.00 9 6.1 6.1 38.8 5.00 10 6.8 6.8 45.6 6.00 7 4.8 4.8 50.3 7.00 11 7.5 7.5 57.8 8.00 6 4.1 4.1 61.9 9.00 30 20.4 20.4 82.3 10.00 26 17.7 17.7 100.0 Total 147 100.0 100.0
SumISSP Availability
Frequency Percent Valid Percent Cumulative Percent
Valid
.00 48 32.7 32.7 32.7 1.00 40 27.2 27.2 59.9 2.00 59 40.1 40.1 100.0 Total 147 100.0 100.0
SumEnhancing User of ICT
Frequency Percent Valid Percent Cumulative Percent
Valid
.00 73 49.7 49.7 49.7 1.00 22 15.0 15.0 64.6 2.00 5 3.4 3.4 68.0 3.00 47 32.0 32.0 100.0 Total 147 100.0 100.0
SumAcess ServiceProvider
Frequency Percent Valid Percent Cumulative Percent
Valid
.00 3 2.0 2.0 2.0 1.00 40 27.2 27.2 29.3 2.00 15 10.2 10.2 39.5 3.00 10 6.8 6.8 46.3 4.00 79 53.7 53.7 100.0 Total 147 100.0 100.0
SumHosting Service Provider
Frequency Percent Valid Percent Cumulative Percent
Valid
.00 6 4.1 4.1 4.1 1.00 41 27.9 27.9 32.0 2.00 22 15.0 15.0 46.9 3.00 15 10.2 10.2 57.1 4.00 6 4.1 4.1 61.2 5.00 31 21.1 21.1 82.3 6.00 26 17.7 17.7 100.0 Total 147 100.0 100.0
Total Dependen Frequency Percent Valid Percent Cumulative Percent
Valid 1.00 5 3.4 3.4 3.4 2.00 35 23.8 23.8 27.2 3.00 2 1.4 1.4 28.6

115
4.00 5 3.4 3.4 32.0 5.00 7 4.8 4.8 36.7 6.00 8 5.4 5.4 42.2 7.00 1 .7 .7 42.9 8.00 8 5.4 5.4 48.3 9.00 4 2.7 2.7 51.0 10.00 9 6.1 6.1 57.1 11.00 12 8.2 8.2 65.3 12.00 2 1.4 1.4 66.7 13.00 4 2.7 2.7 69.4 14.00 1 .7 .7 70.1 15.00 26 17.7 17.7 87.8 16.00 1 .7 .7 88.4 17.00 15 10.2 10.2 98.6 18.00 1 .7 .7 99.3 19.00 1 .7 .7 100.0 Total 147 100.0 100.0
FREQUENCY VARIABLES=SumY1 SumTeknic SumY2 SumY3 SumY4 SumY5 TotDependen SumAdmin /STATISTICS=STDDEV MEAN /ORDER=ANALYSIS. Frequency
Notes Output Created 03-MAR-2013 17:18:20 Comments
Input
Data /Users/rizkidewantara/Documents/data newest uni only.sav
Active Dataset DataSet1 Filter <none> Weight <none> Split File <none> N of Rows in Working Data File 147
Missing Value Handling Definition of Missing User-defined missing values are treated
as missing.
Cases Used Statistics are based on all cases with valid data.
Syntax
FREQUENCY VARIABLES=SumY1 SumTeknic SumY2 SumY3 SumY4 SumY5 TotDependen SumAdmin /STATISTICS=STDDEV MEAN /ORDER=ANALYSIS.
Resources Processor Time 00:00:00.02 Elapsed Time 00:00:00.00
[DataSet1] /Users/rizkidewantara/Documents/data newest uni only.sav
Statistics SumWorkGroup&Duties SumTecnic SumISSP
Availability SumEnhancing
User of ICT SumAcess
ServiceProvider SumHosting
Service Provider
N Valid 147 147 147 147 147 147 Missing 0 0 0 0 0 0
Mean .6054 5.9932 1.0748 1.1769 2.8299 3.1633 Std. Deviation 1.21383 3.23825 .85278 1.33807 1.37678 2.02735
Statistics
Total Dependen SumAdmin
N Valid 147 147 Missing 0 0
Mean 8.8503 2.8571 Std. Deviation 5.68265 2.76970 FREQUENCY VARIABLES=MeanX11 MeanX12 MeanX13 MeanX21 MeanX22 MeanX23 MeanX24 sumMeanX1

116
sumMeanX2 /STATISTICS=STDDEV MEAN /ORDER=ANALYSIS. Frequency
Notes Output Created 03-MAR-2013 17:20:29 Comments
Input
Data /Users/rizkidewantara/Documents/data newest uni only.sav
Active Dataset DataSet1 Filter <none> Weight <none> Split File <none> N of Rows in Working Data File 147
Missing Value Handling Definition of Missing User-defined missing values are treated
as missing.
Cases Used Statistics are based on all cases with valid data.
Syntax
FREQUENCY VARIABLES=MeanX11 MeanX12 MeanX13 MeanX21 MeanX22 MeanX23 MeanX24 sumMeanX1 sumMeanX2 /STATISTICS=STDDEV MEAN /ORDER=ANALYSIS.
Resources Processor Time 00:00:00.05 Elapsed Time 00:00:00.00
[DataSet1] /Users/rizkidewantara/Documents/data newest uni only.sav
Statistics Mean policy
obj+purpose Mean clarity of
the act Mean Control Measurement
Mean Org Leadership
Mean org Human
Resources
Mean org
structure
N Valid 147 147 147 147 147 147 Missing 0 0 0 0 0 0
Mean 3.2415 2.7497 3.3243 3.1888 3.6684 3.8793 Std. Deviation .87557 .63885 .81924 .75489 .99320 .82260
Statistics Mean Fund+Physical Factor of Policy Factor of Organization
N Valid 147 147 147 Missing 0 0 0
Mean 3.1259 3.1051 3.4656 Std. Deviation .94595 .69836 .77426 FREQUENCY VARIABLES=MeanX11 MeanX12 MeanX13 MeanX21 MeanX22 MeanX23 MeanX24 sumMeanX1 sumMeanX2 /NTILES=4 /NTILES=5 /STATISTICS=STDDEV MEAN /ORDER=ANALYSIS. Frequency
Notes Output Created 03-MAR-2013 17:21:35 Comments
Input
Data /Users/rizkidewantara/Documents/data newest uni only.sav
Active Dataset DataSet1 Filter <none> Weight <none> Split File <none> N of Rows in Working Data File 147
Missing Value Handling Definition of Missing User-defined missing values are treated
as missing.
Cases Used Statistics are based on all cases with valid data.

117
Syntax
FREQUENCY VARIABLES=MeanX11 MeanX12 MeanX13 MeanX21 MeanX22 MeanX23 MeanX24 sumMeanX1 sumMeanX2 /NTILES=4 /NTILES=5 /STATISTICS=STDDEV MEAN /ORDER=ANALYSIS.
Resources Processor Time 00:00:00.06 Elapsed Time 00:00:00.00
[DataSet1] /Users/rizkidewantara/Documents/data newest uni only.sav
Statistics Mean policy
obj+purpose Mean clarity
of the act Mean Control Measurement
Mean Org Leadership
Mean org Human
Resources
Mean org structure
N Valid 147 147 147 147 147 147 Missing 0 0 0 0 0 0
Mean 3.2415 2.7497 3.3243 3.1888 3.6684 3.8793 Std. Deviation .87557 .63885 .81924 .75489 .99320 .82260
Percentiles
20 2.5000 2.2000 2.6667 2.5000 2.5000 3.0000 25 2.7500 2.4000 2.6667 2.7500 2.7500 3.0000 40 3.0000 2.6000 3.0000 3.0000 4.0000 4.0000 50 3.2500 2.8000 3.3333 3.0000 4.0000 4.0000 60 3.5000 3.0000 3.6667 3.2500 4.0000 4.0000 75 3.7500 3.2000 4.0000 3.7500 4.5000 4.7500 80 4.0000 3.2000 4.0000 3.7500 4.7500 4.7500
Statistics
Mean Fund+Physical Factor of Policy Factor of Organization
N Valid 147 147 147 Missing 0 0 0
Mean 3.1259 3.1051 3.4656 Std. Deviation .94595 .69836 .77426
Percentiles
20 2.1000 2.4144 2.6667 25 2.3333 2.6056 2.7708 40 3.0000 2.8578 3.4792 50 3.3333 3.2500 3.7083 60 3.6667 3.4511 3.9667 75 3.6667 3.5833 4.0833 80 3.9000 3.7067 4.1208
FREQUENCY VARIABLES=sumMeanX1 sumMeanX2 /NTILES=4 /STATISTICS=STDDEV RANGE MEAN /ORDER=ANALYSIS. Frequency
Notes Output Created 03-MAR-2013 21:56:03 Comments
Input
Data /Users/rizkidewantara/Documents/data newest uni only.sav
Active Dataset DataSet1 Filter <none> Weight <none> Split File <none> N of Rows in Working Data File 147
Missing Value Handling Definition of Missing User-defined missing values are treated
as missing.
Cases Used Statistics are based on all cases with valid data.
Syntax
FREQUENCY VARIABLES=sumMeanX1 sumMeanX2 /NTILES=4 /STATISTICS=STDDEV RANGE MEAN /ORDER=ANALYSIS.

118
Resources Processor Time 00:00:00.03 Elapsed Time 00:00:00.00
[DataSet1] /Users/rizkidewantara/Documents/data newest uni only.sav Statistics
Factor of Policy Factor of Organization
N Valid 147 147 Missing 0 0
Mean 3.1051 3.4656 Std. Deviation .69836 .77426 Range 3.09 3.00
Percentiles 25 2.6056 2.7708 50 3.2500 3.7083 75 3.5833 4.0833
REGRESSION /MISSING LISTWISE /STATISTICS COEFF OUTS CI(95) R ANOVA /CRITERIA=PIN(.05) POUT(.10) /NOORIGIN /DEPENDENT SumAdmin /METHOD=ENTER sumMeanX1 sumMeanX2. Regression
Notes Output Created 03-MAR-2013 21:58:59 Comments
Input
Data /Users/rizkidewantara/Documents/data newest uni only.sav
Active Dataset DataSet1 Filter <none> Weight <none> Split File <none> N of Rows in Working Data File 147
Missing Value Handling Definition of Missing User-defined missing values are treated
as missing.
Cases Used Statistics are based on cases with no missing values for any variable used.
Syntax
REGRESSION /MISSING LISTWISE /STATISTICS COEFF OUTS CI(95) R ANOVA /CRITERIA=PIN(.05) POUT(.10) /NOORIGIN /DEPENDENT SumAdmin /METHOD=ENTER sumMeanX1 sumMeanX2.
Resources
Processor Time 00:00:00.01 Elapsed Time 00:00:00.00 Memory Required 5776 bytes Additional Memory Required for Residual Plots 0 bytes
[DataSet1] /Users/rizkidewantara/Documents/data newest uni only.sav
Variables Entered/Removeda Model Variables Entered Variables Removed Method
1 Factor of Organization, Factor of Policyb . Enter
a. Dependent Variable: SumAdmin b. All requested variables entered.
Model Summary Model R R Square Adjusted R Square Std. Error of the
Estimate 1 .719a .517 .510 1.93898

119
a. Predictors: (Constant), Factor of Organization, Factor of Policy
ANOVAa Model Sum of Squares df Mean Square F Sig.
1 Regression 578.609 2 289.305 76.950 .000b Residual 541.391 144 3.760 Total 1120.000 146
a. Dependent Variable: SumAdmin b. Predictors: (Constant), Factor of Organization, Factor of Policy
Coefficientsa Model Unstandardized Coefficients Standardized
Coefficients t Sig. 95.0%
Confidence Interval for B
B Std. Error Beta Lower Bound
1 (Constant) -6.438 .796 -8.087 .000 -8.012 Factor of Policy .465 .315 .117 1.474 .143 -.159 Factor of Organization 2.266 .285 .633 7.962 .000 1.703
Coefficientsa
Model 95.0% Confidence Interval for B Upper Bound
1 (Constant) -4.865 Factor of Policy 1.089 Factor of Organization 2.828
a. Dependent Variable: SumAdmin Regression
Notes Output Created 03-MAR-2013 22:02:55 Comments
Input
Data /Users/rizkidewantara/Documents/data newest uni only.sav
Active Dataset DataSet1 Filter <none> Weight <none> Split File <none> N of Rows in Working Data File 147
Missing Value Handling Definition of Missing User-defined missing values are treated
as missing.
Cases Used Statistics are based on cases with no missing values for any variable used.
Syntax
REGRESSION /MISSING LISTWISE /STATISTICS CI(95) R ANOVA /CRITERIA=PIN(.05) POUT(.10) /NOORIGIN /DEPENDENT SumAdmin /METHOD=ENTER sumMeanX1 sumMeanX2.
Resources
Processor Time 00:00:00.01 Elapsed Time 00:00:00.00 Memory Required 5776 bytes Additional Memory Required for Residual Plots 0 bytes
[DataSet1] /Users/rizkidewantara/Documents/data newest uni only.sav
Variables Entered/Removeda Model Variables Entered Variables Removed Method
1 Factor of Organization, Factor of Policyb . Enter

120
a. Dependent Variable: SumAdmin b. All requested variables entered.
Model Summary Model R R Square Adjusted R Square Std. Error of the
Estimate 1 .719a .517 .510 1.93898 a. Predictors: (Constant), Factor of Organization, Factor of Policy
ANOVAa Model Sum of Squares df Mean Square F Sig.
1 Regression 578.609 2 289.305 76.950 .000b Residual 541.391 144 3.760 Total 1120.000 146
a. Dependent Variable: SumAdmin b. Predictors: (Constant), Factor of Organization, Factor of Policy
Coefficientsa Model 95.0% Confidence Interval for B
Lower Bound Upper Bound
1 (Constant) -8.012 -4.865 Factor of Policy -.159 1.089 Factor of Organization 1.703 2.828
a. Dependent Variable: SumAdmin REGRESSION /MISSING LISTWISE /STATISTICS COEFF OUTS CI(95) R ANOVA /CRITERIA=PIN(.05) POUT(.10) /NOORIGIN /DEPENDENT SumAdmin /METHOD=ENTER sumMeanX1 sumMeanX2. Regression
Notes Output Created 03-MAR-2013 22:03:32 Comments
Input
Data /Users/rizkidewantara/Documents/data newest uni only.sav
Active Dataset DataSet1 Filter <none> Weight <none> Split File <none> N of Rows in Working Data File 147
Missing Value Handling Definition of Missing User-defined missing values are treated
as missing.
Cases Used Statistics are based on cases with no missing values for any variable used.
Syntax
REGRESSION /MISSING LISTWISE /STATISTICS COEFF OUTS CI(95) R ANOVA /CRITERIA=PIN(.05) POUT(.10) /NOORIGIN /DEPENDENT SumAdmin /METHOD=ENTER sumMeanX1 sumMeanX2.
Resources
Processor Time 00:00:00.02 Elapsed Time 00:00:01.00 Memory Required 5776 bytes Additional Memory Required for Residual Plots 0 bytes
[DataSet1] /Users/rizkidewantara/Documents/data newest uni only.sav
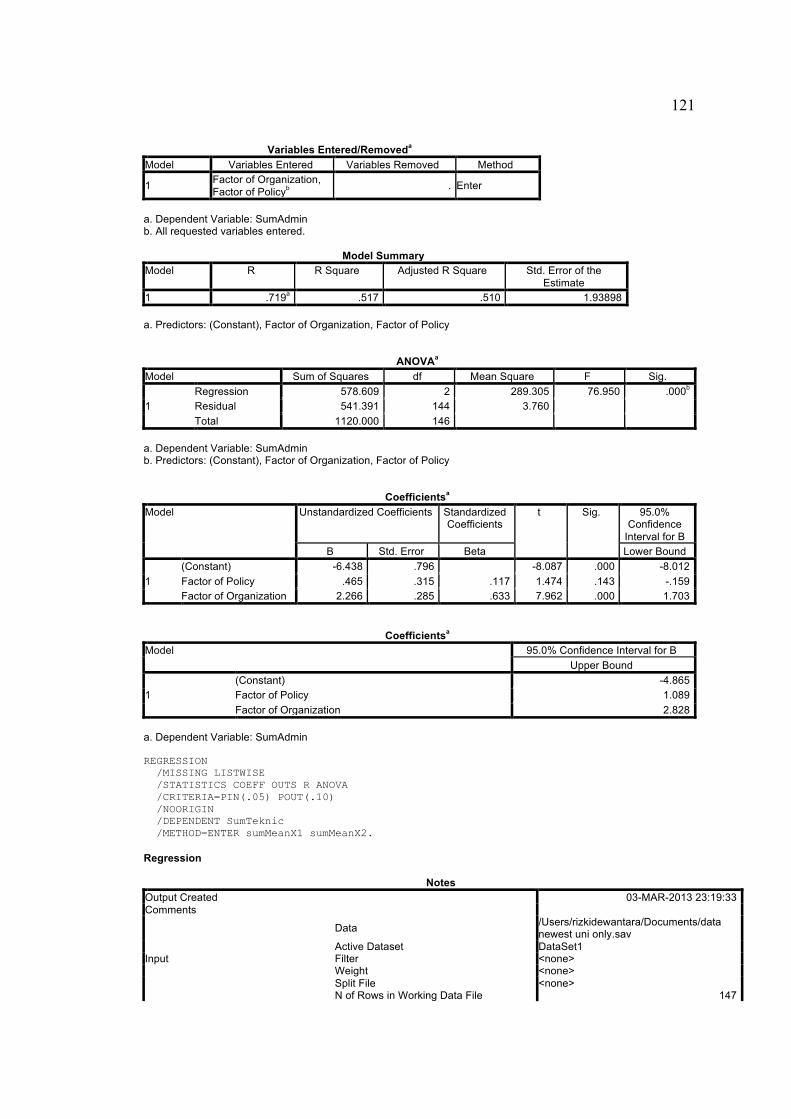
121
Variables Entered/Removeda Model Variables Entered Variables Removed Method
1 Factor of Organization, Factor of Policyb . Enter
a. Dependent Variable: SumAdmin b. All requested variables entered.
Model Summary Model R R Square Adjusted R Square Std. Error of the
Estimate 1 .719a .517 .510 1.93898 a. Predictors: (Constant), Factor of Organization, Factor of Policy
ANOVAa Model Sum of Squares df Mean Square F Sig.
1 Regression 578.609 2 289.305 76.950 .000b Residual 541.391 144 3.760 Total 1120.000 146
a. Dependent Variable: SumAdmin b. Predictors: (Constant), Factor of Organization, Factor of Policy
Coefficientsa Model Unstandardized Coefficients Standardized
Coefficients t Sig. 95.0%
Confidence Interval for B
B Std. Error Beta Lower Bound
1 (Constant) -6.438 .796 -8.087 .000 -8.012 Factor of Policy .465 .315 .117 1.474 .143 -.159 Factor of Organization 2.266 .285 .633 7.962 .000 1.703
Coefficientsa Model 95.0% Confidence Interval for B
Upper Bound
1 (Constant) -4.865 Factor of Policy 1.089 Factor of Organization 2.828
a. Dependent Variable: SumAdmin REGRESSION /MISSING LISTWISE /STATISTICS COEFF OUTS R ANOVA /CRITERIA=PIN(.05) POUT(.10) /NOORIGIN /DEPENDENT SumTeknic /METHOD=ENTER sumMeanX1 sumMeanX2. Regression
Notes Output Created 03-MAR-2013 23:19:33 Comments
Input
Data /Users/rizkidewantara/Documents/data newest uni only.sav
Active Dataset DataSet1 Filter <none> Weight <none> Split File <none> N of Rows in Working Data File 147

122
Missing Value Handling Definition of Missing User-defined missing values are treated
as missing.
Cases Used Statistics are based on cases with no missing values for any variable used.
Syntax
REGRESSION /MISSING LISTWISE /STATISTICS COEFF OUTS R ANOVA /CRITERIA=PIN(.05) POUT(.10) /NOORIGIN /DEPENDENT SumTeknic /METHOD=ENTER sumMeanX1 sumMeanX2.
Resources
Processor Time 00:00:00.01 Elapsed Time 00:00:00.00 Memory Required 5776 bytes Additional Memory Required for Residual Plots 0 bytes
[DataSet1] /Users/rizkidewantara/Documents/data newest uni only.sav
Variables Entered/Removeda Model Variables Entered Variables Removed Method
1 Factor of Organization, Factor of Policyb . Enter
a. Dependent Variable: SumTecnic b. All requested variables entered.
Model Summary Model R R Square Adjusted R Square Std. Error of the
Estimate 1 .802a .643 .638 1.94735 a. Predictors: (Constant), Factor of Organization, Factor of Policy
ANOVAa Model Sum of Squares df Mean Square F Sig.
1 Regression 984.919 2 492.460 129.862 .000b Residual 546.074 144 3.792 Total 1530.993 146
a. Dependent Variable: SumTecnic b. Predictors: (Constant), Factor of Organization, Factor of Policy
Coefficientsa Model Unstandardized Coefficients Standardized
Coefficients t Sig.
B Std. Error Beta
1 (Constant) -6.166 .800 -7.711 .000 Factor of Policy .653 .317 .141 2.060 .041 Factor of Organization 2.924 .286 .699 10.230 .000
a. Dependent Variable: SumTecnic Regression
Notes Output Created 03-MAR-2013 23:24:48 Comments
Input
Data /Users/rizkidewantara/Documents/data newest uni only.sav
Active Dataset DataSet1 Filter <none> Weight <none> Split File <none> N of Rows in Working Data File 147

123
Missing Value Handling Definition of Missing User-defined missing values are
treated as missing.
Cases Used Statistics are based on cases with no missing values for any variable used.
Syntax
REGRESSION /MISSING LISTWISE /STATISTICS COEFF OUTS R ANOVA /CRITERIA=PIN(.05) POUT(.10) /NOORIGIN /DEPENDENT TotDependen /METHOD=ENTER sumMeanX1 sumMeanX2.
Resources
Processor Time 00:00:00.02 Elapsed Time 00:00:00.00 Memory Required 5776 bytes Additional Memory Required for Residual Plots 0 bytes
[DataSet1] /Users/rizkidewantara/Documents/data newest uni only.sav
Variables Entered/Removeda Model Variables Entered Variables Removed Method
1 Factor of Organization, Factor of Policyb . Enter
a. Dependent Variable: Total Dependen b. All requested variables entered.
Model Summary Model R R Square Adjusted R Square Std. Error of the
Estimate 1 .807a .652 .647 3.37621 a. Predictors: (Constant), Factor of Organization, Factor of Policy
ANOVAa Model Sum of Squares df Mean Square F Sig.
1 Regression 3073.279 2 1536.639 134.807 .000b Residual 1641.429 144 11.399 Total 4714.707 146
a. Dependent Variable: Total Dependen b. Predictors: (Constant), Factor of Organization, Factor of Policy
Coefficientsa Model Unstandardized
Coefficients Standardized Coefficients
t Sig.
B Std. Error Beta
1 (Constant) -12.604 1.386 -9.092 .000 Factor of Policy 1.118 .549 .137 2.035 .044 Factor of Organization 5.189 .495 .707 10.473 .000
a. Dependent Variable: Total Dependen

124
Appendix 3 List of Respondent
No Name of Institution No Name of Institution 1 Univ. Lumajang 41 Univ. Muhamadiyah Gresik 2 Univ. Soerjo 42 Univ. Muhamadiyah Jember 3 Univ. Sunan Bonang 43 Univ. Muhamadiyah Malang 4 Univ. Tulungagung 44 Univ. Muhamadiyah Ponorogo 5 Unika. Darma Cendika 45 Univ. Muhamadiyah Sby 6 Unika. Widya Karya 46 Univ. Muhamadiyah Sidoarjo 7 Unika. Widya Mandala Madiun 47 Univ. Narotama 8 Unika. Widya Mandala Surabaya 48 Univ. Panca Marga 9 Univ Negeri Jember 49 Univ. PGRI Adibuana
10 Univ Negeri Malang 50 Univ. Putra Bangsa 11 Univ. 17 Agustus 1945 51 Univ. Surabaya 12 Univ. 17 Agustus 1945 Sby 52 Univ. Tritunggal 13 Univ. 45 53 Univ. Widya Gama 14 Univ. Abdurrahman Saleh 54 Univ. Widya Kartika 15 Univ. Airlangga Surabaya 55 Univ. Wijaya Putra 16 Univ. Al-Falah ; 56 Univ. Wijayakusuma 17 Univ. Bhayangkara 57 Univ. Wisnuwardhana 18 Univ. Bojonegoro 58 Univ. WR.Supratman 19 Univ. Bondowoso 59 Univ. Yos Sudarso 20 Univ. Brawijaya 60 Univ.Yudharta 21 Univ. Dr.Soetomo 61 Universitas 17 Agustus 1945 Cirebon 22 Univ. Gajayana 62 Universitas 17 Agustus 1945 Semarang 23 Univ. Gresik 63 Universitas Al-azhar Indonesia 24 Univ. Hang Tuah 64 Universitas Atma Jaya Yogyakarta 25 Univ. Islam Darul Ulum 65 Universitas Bakrie 26 Univ. Islam Jember 66 Universitas Banten Jaya 27 Univ. Islam Majapait 67 Universitas Bina Nusantara 28 Univ. Islam Malang 68 Universitas Cokroaminoto 29 Univ. Islam Sunan Giri 69 Universitas Darma Persada 30 Univ. Jenggala 70 Universitas Diponegoro 31 Univ. Kanjuruhan 71 Universitas Gadjah Mada 32 Univ. Kartini 72 Universitas Gunadarma 33 Univ. Kristen Cipta Wacana 73 Universitas Ibnu Chaldun 34 Univ. Kristen Petra 74 Universitas Indonesia 35 Univ. Mayjen Sungkono 75 Universitas Indonusa Esa Unggul 36 Univ. Merdeka Malang 76 Universitas Islam Bandung 37 Univ. Merdeka Pasuruan 77 Universitas Islam Batik 38 Univ. Merdeka Ponorogo 78 Universitas Islam Indonesia 39 Univ. Merdeka Surabaya 79 Universitas Islam Jakarta 40 Univ. Moch Sroedji 80 Universitas Islam Kediri

125
List of Respondent (Continue)
No Name of Institution No Name of Institution 81 Universitas Islam Negeri Sunan Gunung Jati 121 Universitas Pendidikan Indonesia 82 Universitas Islam Negeri Sunan Kalijaga 122 Universitas Persada Indonesia Yai 83 Universitas Islam Negeri Syarif Hidayatullah 123 Universitas PGRI Yogyakarta 84 Universitas Islam Nusantara 124 Universitas Pramita Indonesia 85 Universitas Islam Sultan Agung 125 Universitas Prof Dr Moestopo (Beragama) 86 Universitas Jakarta 126 Universitas Proklamasi 45 87 Universitas Janabadra 127 Universitas Sahid 88 Universitas Jayabaya 128 Universitas Sahid Surakarta 89 Universitas Jenderal Soedirman 129 Universitas Sarjanawiyata Tamansiswa 90 Universitas Katolik Indonesia Atma Jaya 130 Universitas Satya Negara Indonesia 91 Universitas Katolik Parahyangan 131 Universitas Sebelas Maret 92 Universitas Komputer Indonesia 132 Universitas Semarang 93 Universitas Krisnadwipayana 133 Universitas Serang Raya 94 Universitas Kristen Indonesia 134 Universitas Siliwangi 95 Universitas Kristen Krida Wacana 135 Universitas Sultan Ageng Tirtayasa 96 Universitas Kristen Maranatha 136 Universitas Surakarta 97 Universitas Kristen Satya Wacana 137 Universitas Swadaya Gunung Djati 98 Universitas Mercu Buana Yogyakarta 138 Universitas Tarumanagara 99 Universitas Muhammadiyah Cirebon 139 Universitas Teknologi Nusantara Cilegon
100 Universitas Muhammadiyah Jakarta 140 Universitas Teknologi Yogyakarta 101 Universitas Muhammadiyah Magelang 141 Universitas Terbuka 102 Universitas Muhammadiyah Prof Dr Hamka 142 Universitas Trisakti 103 Universitas Muhammadiyah Semarang 143 Universitas Veteran Bangun Nusantara 104 Universitas Muhammadiyah Surakarta 144 Universitas Wijaya Kusuma Purwokerto 105 Universitas Muhammadiyah Tangerang 145 Universitas Wiraswasta Indonesia 106 Universitas Muhammadiyah Yogyakarta 146 Universitas Yarsi 107 Universitas Nasional 147 UPN Veteran Jawa Timur 108 Universitas Negeri Jakarta 109 Universitas Negeri Semarang 110 Universitas Negeri Yogyakarta 111 Universitas Nurtanio 112 Universitas Padjadjaran 113 Universitas Pakuan 114 Universitas Pamulang 115 Universitas Pancasila 116 Universitas Paramadina 117 Universitas Pasundan 118 Universitas Pelita Harapan 119 Universitas Pembangunan Jaya Tangerang 120 Universitas Pembangunan Nasional Veteran

126
Appendix 4 Research Site
Site to research is Java Island is one part of five big islands in
Indonesia. Java Island consists of six provinces, which are Banten, DKI Jakarta, West
Java, Central Java, DI Yogyakarta and East Java. Based on the 2010 Population
Census, Java is still the most densely populated areas in Indonesia, which is more
than half (57.5%), Indonesia's population lived on Java Island (BKKBN,
www.bkkbn.go.id/.../2012-02).
Figure A.1 Map of Indonesia
Source: Google pictures
Population Census 2010 results show the number of people in
Indonesia increased to 237,641,326 populations in 2010 with the population growth
rate is high at 1.49 percent. The map of Indonesia and Java Island shown in figure 4.1
and 4.2

127
Figure A.2 Map Of Java Island, Indonesia
Source: Google pictures

128
VITAE
Name Rizki Yudhi Dewantara
Student ID 5310520515
Educational Attainment
Degree Name of Institution Year of Graduation
Bachelor of
Business Administration
Brawijaya University,
Malang, Indonesia
1999
Scholarship Awards during Enrolment
2010-2012 Faculty of Administrative Science, Brawijaya University, Indonesia for
master study scholarship
Work – Position and Address
Work position Lecturer of Business Administration Program, Faculty of
Administrative Science, Brawijaya University, Indonesia
Address Malang, Indonesia
Phone +62341553737
Email [email protected]
List of Publication and Proceeding
Dewantara, Rizki Y., 2012. Success of Implementation Computer Crime Act (UU
ITE 11, 2008), in Higher Education Institution (Case Study in Higher Education
Institution in Indonesia) Submitted and accepted to Academic Journal of
Administrative Science, University of Brawijaya, Indonesia, in 2012)
Dewantara, Rizki Y., 2012. Computer Crime Prevention in Higher Education
Institution Through Computer Crime Act Implementation (UU ITE 11, 2008)
Presented on ASEAN Academic Society International Conference 2012:
Venturing into ASEAN Community 2015: Bringing Up The Cutting Edge of
Science and Technology. December 7-8, 2012, Prince of Songkla University,
Hat Yai, Thailand
Related Documents