1 The Success of Air Pollution Controls in California The Success of Air Pollution Controls in California A 40 th Anniversary Retrospective February 28, 2008 Air Resources Board California Environmental Protection Agency 1 Thank you, Mr. Goldstene. Good afternoon, Chairman Nichols and members of the Board. When the Air Resources Board met for the first time 40 years ago, they knew that they were facing a difficult challenge. Within two weeks of the hearing, the South Coast Air Basin saw its first Stage 1 smog alert of the year – by the end of that year it had experienced almost 200 Stage 1 and 50 Stage 2 smog alerts. Yet the fact that this surprises us today is a testament to the success of the Board and other agencies in cleaning up California’s air. Thanks to that success, the South Coast hasn’t had a Stage 1 alert for nearly 10 years. Today the Board’s programs stand as a model for air quality control efforts all over the world. On the occasion of our 40 th anniversary, let’s recall the story of how we achieved those successes.

Welcome message from author
This document is posted to help you gain knowledge. Please leave a comment to let me know what you think about it! Share it to your friends and learn new things together.
Transcript

1
The Success of Air Pollution Controls
in California
The Success of Air Pollution Controls
in CaliforniaA 40th Anniversary Retrospective
February 28, 2008
Air Resources Board
California Environmental Protection Agency1
Thank you, Mr. Goldstene.
Good afternoon, Chairman Nichols and members of the Board.
When the Air Resources Board met for the first time 40 years ago, they knew that they were facing a difficult challenge. Within two weeks of the hearing, the South Coast Air Basin saw its first Stage 1 smog alert of the year – by the end of that year it had experienced almost 200 Stage 1 and 50 Stage 2 smog alerts.
Yet the fact that this surprises us today is a testament to the success of the Board and other agencies in cleaning up California’s air. Thanks to that success, the South Coast hasn’t had a Stage 1 alert for nearly 10 years. Today the Board’s programs stand as a model for air quality control efforts all over the world.
On the occasion of our 40th anniversary, let’s recall the story of how we achieved those successes.
2
OverviewOverview
History
The Problems and the Solutions
Progress
Costs and Benefits
Challenges Ahead
2
We’ll begin by recounting some of the history of the Air Resources Board.
We’ll discuss some of the major air quality problems, and how California has led the way in solving them.
Then, we’ll describe the progress in air quality.
Next, we’ll show that the benefits of air pollution controls far exceed the costs.
And we’ll finish with a look at the challenges that lie ahead.

3
History
The Problems and the Solutions
Progress
Costs and Benefits
Challenges Ahead
3
First, a brief sketch of the history of the Air Resources Board.

4
The Air Resources Board, then…The Air Resources Board, then…
� Created in 1967 by the Legislature
� Authorized to set ambient air quality standards and emissions standards for motor vehicles
� 60 staff members
Professor Arie Haagen-SmitFirst ARB Chairman
4
While the City of Los Angeles began controlling local industries in 1945, the research of Professor Arie Haagen-Smit and others made it clear that a strong statewide approach was needed. In 1967, California’s Legislature passed the Mulford-Carrell Act, establishing the California Air Resources Board. It met for the first time on February 8, 1968, in Sacramento.
The newly formed Board was authorized to adopt health-based air quality standards, establish air basins, conduct research, and set emission standards for motor vehicles. The minutes of the first meeting show that one of main topics was California’s application to the Federal Health, Education and Welfare Department – the U.S. EPA didn’t exist yet – for a waiver to set its own emission standards, more health-protective than the federal ones. This unique ability has allowed the Air Resources Board to spearhead one of the world’s most successful air pollution control programs.
Also on the agenda were the upcoming California vehicle standards for 1970, and a research proposal for 56,000 dollars to measure diesel smoke.
At the time, the Board employed a staff of 60.

5
The Air Resources Board, now…The Air Resources Board, now…
� Authority broadened to other mobile sources, stationary and area-wide sources, and greenhouse gases
� 1,250 staff members
5
Today, the Board’s authority has broadened to include other mobile sources, stationary sources, area-wide sources, toxic substances, and greenhouse gases. The Board’s programs cover a wide spectrum ranging from cars to pleasure boats, power plants to irrigation pumps, construction materials to consumer products.
To meet these added responsibilities, the staff has grown to 1,250.

6
Partners in Air Quality RegulationPartners in Air Quality Regulation
� Local Air Districts
� State Agencies
� City and County Governments
� U.S. Environmental Protection Agency
� Universities
6
Of course, the Air Resources Board is not the only agency responsible for cleaning California’s air. That responsibility is shared with numerous other public agencies. Academic research has also lent a big boost to air quality efforts.
California’s large size, varied topography, and diverse demographic and economic makeup require flexible solutions. At the same time, cooperation among the various agencies, academia and industry has been a critical ingredient in California’s successful campaign against air pollution.
7
History
The Problems and the Solutions
Progress
Costs and Benefits
Challenges Ahead
7
Let’s move on to outline some of the main air pollution problems in California, and the solutions that have been adopted to remedy them.

8
Major Air Quality Issues in 1968Major Air Quality Issues in 1968
� Unhealthy levels of lead, NO 2, SO2, CO, ozone, particulate matter, and air toxics
� Poor visibility
� Difficulty breathing
� Extreme eye irritation
8
In 1968, the air quality in California was filthy by today’s standards.
The most visible aspect of air pollution was the brownish haze of smog that cloaked California cities, particularly in the South Coast, throughout much of the year. The smog was thick with irritating substances like ozone, formaldehyde and peroxyacetyl nitrate or PAN, which made breathing difficult and made eyes water.
Most Californians breathed high levels of lead, nitrogen dioxide, sulfur dioxide, carbon monoxide, particulate matter and air toxics – pollutants that are harmful to human health.
Toxic emissions from industry, incinerators and consumer products poured into the air with few restrictions.
99
Technology-based Regulations(Required Emission Reductions)
Technology-based Regulations(Required Emission Reductions)
� Mobile Sources (>99% gasoline, 98% diesel reduction )– Cleaner engines– Aftertreatment– Cleaner gasoline and diesel fuel– Alternative fuels
� Stationary Sources (80-90% reduction)– Low-NO X burners– Selective catalytic reduction– Cleaner fuels
� Area Sources (~75% reduction)– Vapor recovery– Consumer products
9
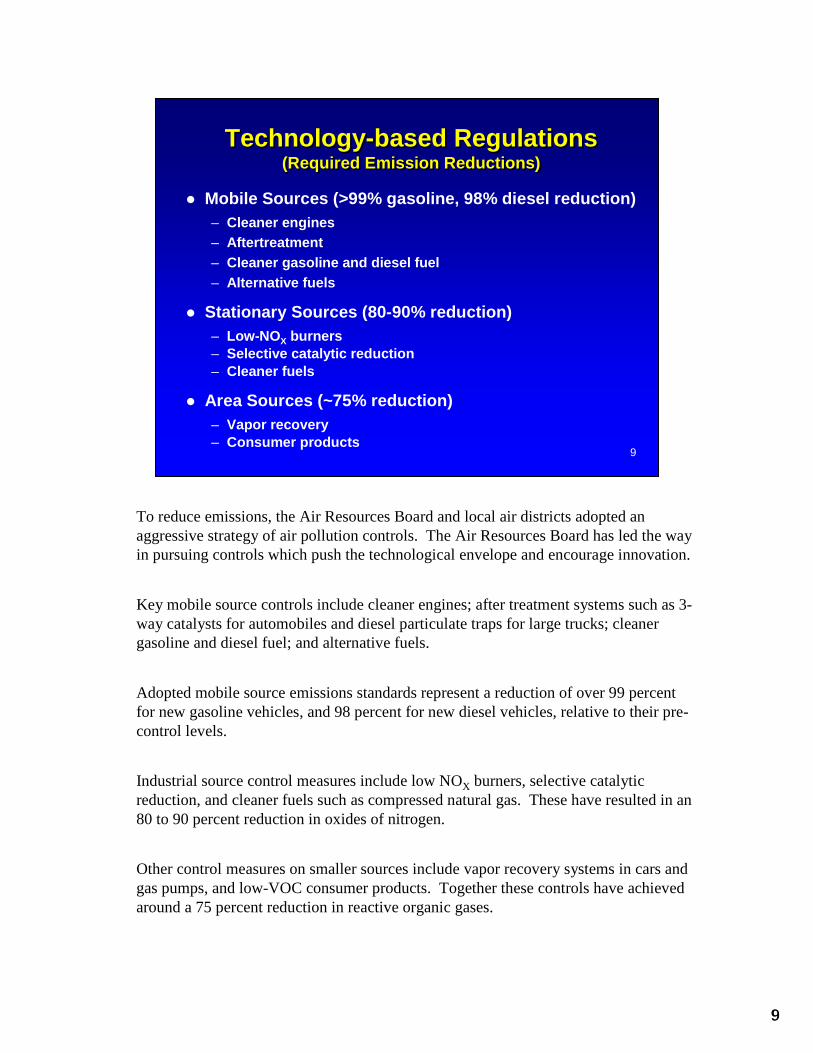
To reduce emissions, the Air Resources Board and local air districts adopted an aggressive strategy of air pollution controls. The Air Resources Board has led the way in pursuing controls which push the technological envelope and encourage innovation.
Key mobile source controls include cleaner engines; after treatment systems such as 3-way catalysts for automobiles and diesel particulate traps for large trucks; cleaner gasoline and diesel fuel; and alternative fuels.
Adopted mobile source emissions standards represent a reduction of over 99 percent for new gasoline vehicles, and 98 percent for new diesel vehicles, relative to their pre-control levels.
Industrial source control measures include low NOX burners, selective catalytic reduction, and cleaner fuels such as compressed natural gas. These have resulted in an 80 to 90 percent reduction in oxides of nitrogen.
Other control measures on smaller sources include vapor recovery systems in cars and gas pumps, and low-VOC consumer products. Together these controls have achieved around a 75 percent reduction in reactive organic gases.

10
Many Developing Countries Have Adopted New Engine Standards First Demonstrated
in California
Standards 71%
No standards 29%
Percentage of World PopulationLiving in Nations With/Without Vehicle Emission Standards
Percentage of World VehiclesDriven in Nations With/Without Vehicle Emission Standards
No standards 35%
Standards 65%10
California leads the world in setting emission standards for motor vehicles. Our standards have influenced the U.S. EPA and the European Union to modify theirs. And they are now being adopted by many developing countries as well, particularly in Asia.
The chart on the left shows that 71 percent of the world’s population lives in nations with vehicle emission standards pioneered by California.
The chart on the right shows that 65 percent of the world’s vehicles are driven in nations with modern vehicle emission standards.
11
History
The Problems and the Solutions
Progress
Costs and Benefits
Challenges Ahead
11
Now let’s take a look at the progress we’ve made.

1212
0
2000
4000
6000
8000
10000
12000
14000
1975 1980 1985 1990 1995 2000 2005 2010
Ozo
ne F
orm
ing
Em
issi
ons
(ton
s/da
y)
Industry
Area-wide
On-Road Vehicles
Off-Road Vehicles
Statewide Emissions TrendsStatewide Emissions TrendsStatewide Emissions Trends
12
The effort to reduce ozone has been a cornerstone of the Board’s policies since the 1960’s.
Thanks to control programs adopted by the Air Resources Board and other agencies, emissions of ozone forming compounds – reactive organic gases and oxides of nitrogen – have diminished to less than half of their 1960’s levels. In all categories – on-road vehicles, off-road vehicles, area-wide, and stationary source emissions –we’ve seen sharp reductions.

13
Ozone Trends in the South CoastOzone Trends in the South Coast
13
0
50
100
150
200
250
300
350
1965 1970 1975 1980 1985 1990 1995 2000 2005
Day
s
0
0.1
0.2
0.3
0.4
0.5
0.6
0.7
Con
cent
ratio
n (p
pm)
Stage 2 Alerts
Stage 1 Alerts
State Exceedances
Peak 1 Hr Ozone
13
This graph shows the trend in peak ozone concentration for the South Coast, which historically has had California’s worst smog.
In the late 1960’s peak ozone concentrations in the range of 0.50 to 0.60 parts per million were common. Today we’re used to thinking of smog as a summertime phenomenon, but in those days, ozone reached unhealthy levels almost every day of the year. Stage 1 alerts, where the ozone concentration exceeded 0.2 parts per million, were declared on over half of all days.
The ozone levels recorded in Los Angeles in the 1960’s are the highest levels ever recorded, anywhere in the world. Today, the peak concentrations are roughly a quarter of their 1960’s levels.

14
Ozone Trends In CaliforniaOzone Trends In California
14
0.00
0.05
0.10
0.15
0.20
0.25
0.30
0.35
1968 1972 1976 1980 1984 1988 1992 1996 2000 2004 2008
Pea
k C
once
ntra
tion
(ppm
)
San Francisco Bay Area
San Diego
San Joaquin Valley
California Standard
14
Other areas of the state have also seen a dramatic reduction in ozone levels. This chart shows peak ozone levels for the San Francisco Bay Area, San Diego, and the San Joaquin Valley. Ozone levels have decreased in all the state’s major urban areas.

15
Lead Trends in the South CoastLead Trends in the South Coast
0
1
2
3
4
5
6
7
1968 1973 1978 1983 1988 1993 1998 2003 2008
Mea
n C
once
ntra
tion
( µg
/ m3 )
2.8 Million IQ Points Lost
With lead
Without lead
15
Lead is another success story.
Until the 1970’s, lead compounds were added to gasoline to improve engine performance. All that lead spewed out of tailpipes and ended up in the air as particulate matter, causing a serious health problem.
In the mid 1970’s, when catalytic converters were introduced on automobiles, lead additives began to be phased out. By the early 1990’s, lead was banned from gasoline. Thanks to that, today, lead is no longer a major air contaminant in California.
If lead had not been banned from gasoline, lead concentrations would have continued to rise as fuel consumption increased. Based on a simple calculation, annual average ambient lead concentrations in the South Coast would have increased to around 6 micrograms per cubic meter.
Lead interferes with children’s brain development. Using a health model to estimate the impact of lead on children’s IQ, the average child in the South Coast would have lost around 2 IQ points if lead emissions had not been controlled, with some children losing as many as 7 points. That’s a total loss of about 2.8 million points for the whole basin.

16
0
10
20
30
40
50
60
70
1968 1973 1978 1983 1988 1993 1998 2003 2008
Mea
n C
once
ntra
tion
( µg
/ m
3 )
PM2.5 Trends in the South CoastPM2.5 Trends in the South Coast
With Controls
Without Controls
6,000-18,000 Premature Deaths
16
This graph shows the annual average PM2.5 concentration for the South Coast. Since PM2.5 wasn’t measured directly until the late 1990’s, the results for 1995 and earlier are derived from measurements of total suspended particulate.
PM2.5 concentrations have gone down gradually since the 1970’s, partly because of reduced oxides of sulfur and nitrogen emissions, but mainly due to reduction in particle emissions such as diesel soot.
Particulate matter is responsible for a large share of the health problems caused by air pollution. Without the Board’s programs, PM2.5 concentrations would have continued to rise in step with population growth. By 2005, the mean annual concentration would have reached around 60 micrograms per cubic meter, five times the state annual standard.
Based on the difference between actual and projected concentrations in 2005, using ARB’sstandard methodology for estimating health impacts, air pollution controls have prevented approximately 6,000 to 18,000 premature deaths – a tremendous health benefit of California’s pollution control efforts. Other serious health impacts such as hospitalizations were avoided as well.

17
PM2.5 Trends in CaliforniaPM2.5 Trends in California
17
San JoaquinValley
San DiegoSan Francisco Bay
California Standard
17
0
5
10
15
20
25
30
35
1968 1971 1974 1978 1981 1984 1987 1990 1993 1996 1999 2002 2005 2008
Mea
n C
once
ntra
tion
(µg
/m3 )
PM2.5 concentrations have also decreased in other areas of the state. The San Francisco Bay Area and San Diego Air Basins, the second and third largest urban areas in the state, are close to attaining the state standards.

18
Pollution Reduced in Spite of GrowthPollution Reduced in Spite of Growth
-100
-50
0
50
100
150
200
250
Per
cent
Cha
nge
1968
-200
8
18
Carbon
Monoxide
Nitrogen
Dioxide
Sulfur
Dioxide
Population Number
of Vehicles
Vehicle
Miles
Levels of other pollutants have diminished considerably as well. Since 1968, the peak level of carbon monoxide has shrunk by 87 percent, nitrogen dioxide by 83 percent, and sulfur dioxide by 90 percent.
Pollutant levels have fallen in spite of California’s rapid growth. In the same time period, California’s population almost doubled, the number of vehicles on the road increased by 170 percent, and the number of vehicle miles traveled almost tripled.

19
History
The Problems and the Solutions
Progress
Costs and Benefits
Challenges Ahead
19
Now let’s contrast the costs and benefits of air pollution controls.

20
Cost Versus Benefit of Pollution Control Programs
Cost Versus Benefit of Pollution Control Programs
� Cost of control around $10 billion� Air pollution control industry generated $6.2 billi on & 32,000 jobs� Annually, benefits are thousands fewer:
– Premature deaths– Hospitalizations for heart and lung disease – School absences and lost work days
� $4 in health benefits for each $1 of control
20
The improvements in California's air quality over the last four decades have come at a modest cost to society.
The total cost of air pollution controls is estimated to be 10 billion dollars, a small share of California’s 1.7 trillion dollar economy. At the same time, the air pollution control industry in California generates around 6.2 billion dollars and employs 32,000 people, so much of the money spent on control stays in the state.
The benefits of controls include thousands fewer premature deaths and hospitalizations each year, and millions fewer lost school and work days.
The value of these benefits is approximately four dollars for every dollar spent on control. California’s air pollution control strategies are cost-effective.

21
History
The Problems and the Solutions
Progress
Costs and Benefits
Challenges Ahead
21
Finally, let’s take a look at the challenges that lie ahead.

22
The Next 40 YearsThe Next 40 Years
� Yesterday’s Successes– Entire state attainment
for lead, CO, SO 2, NO2
– Peak ozone reduced 75%– PM2.5 and toxics
reduced 50%
� Today’s Challenges– Public health remains a
top priority– Ozone and PM2.5 in the
South Coast and SJV– Diesel and goods
movement– Climate change program
22
Today, as the Air Resources Board greets its 40th anniversary, the entire state attains the lead, carbon monoxide, sulfur dioxide and nitrogen dioxide standards. Peak ozone concentrations have diminished by 75 percent. The health risks posed by PM2.5 and toxic substances have shrunk by at least half. And all these reductions have been achieved in spite of rapid growth in California’s population, economy, and vehicle use.
Health protection and climate change are our top priorities as we confront the air quality challenges of the 21st century. As we move closer to attaining the ozone standard in the San Joaquin Valley and the South Coast, we look to advanced technology and new, less controlled emission categories to achieve the reductions we need. With the new state implementation plan in progress, PM2.5 is a major focus of our efforts. The Diesel Risk Reduction and Goods Movement Programs target some of the big remaining sources of air pollution. And as we develop measures to curb greenhouse gases, implementing these measures will likely lead to air pollution co-benefits
As we move forward to confront the challenges ahead, four decades of success at cleaning California’s air give us confidence that the Air Resources Board will meet the challenges of future decades with the same innovative spirit and technical excellence that has made us a world leader in improving air quality.
Related Documents