MINISTRY OF HOUSING AND CONSTRUCTION THE SYRIAN ARAB REPUBLIC THE STUDY ON SEWERAGE SYSTEM DEVELOPMENT IN THE SYRIAN ARAB REPUBLIC FINAL REPORT [Volume III : Supporting Report] MARCH 2008 JAPAN INTERNATIONAL COOPERATION AGENCY NJS CONSULTANTS CO.,LTD. and TOKYO ENGINEERING CONSULTANTS CO.,LTD. No. GE JR 08-006

Welcome message from author
This document is posted to help you gain knowledge. Please leave a comment to let me know what you think about it! Share it to your friends and learn new things together.
Transcript
MINISTRY OF HOUSING AND CONSTRUCTION
THE SYRIAN ARAB REPUBLIC
THE STUDY ON SEWERAGE SYSTEM DEVELOPMENT
IN THE SYRIAN ARAB REPUBLIC
FINAL REPORT [Volume III : Supporting Report]
MARCH 2008
JAPAN INTERNATIONAL COOPERATION AGENCY
NJS CONSULTANTS CO.,LTD. and
TOKYO ENGINEERING CONSULTANTS CO.,LTD.
No.
GEJR
08-006
< Structure of Report >
(As of November 2007)
Volume I Executive Summary
Volume II Main Report
(Master Plan and Feasibility Study)
Volume III Supporting Report
(Master Plan and Feasibility Study)
1 USD = 52.61 SP 1 USD = 118.32 Yen 1 Euro = 72.820 SP 1 USD = 0.71 JD 1 USD = 1.45 TD
i
JAPAN INTERNATIONAL COOPERATION AGENCY (JICA)
MINISTRY OF HOUSING AND CONSTRUCTION THE SYRIAN ARAB REPUBLIC
THE STUDY
ON SEWERAGE SYSTEM DEVELOPMENT
IN THE SYRIAN ARAB REPUBLIC
<FINAL REPORT>
Volume III: Supporting Report
TABLE OF CONTENTS
PART I: MASTER PLAN
Appendix for Chapter 4 10th 5Year Plan ...................................................................... AM4-1 Appendix for Chapter 7 Population Projection............................................................. AM7-1 Appendix for Chapter 8
Appendix 8.1 Summary of Discharge, Runoff and Industrial Wastewater ..................... AM8-1 Appendix 8.2 Water Quality Analysis Survey for Industrial Wastewater ....................... AM8-27 Appendix 8.3 Estimation of Industrial Wastewater Pollution Load................................ AM8-48
Appendix for Chapter 9
Appendix 9.1 Sewerage System Database ...................................................................... AM9-2 Appendix 9.2 Criteria of Wet-land Treatment Method ................................................... AM9-46 Appendix 9.3 Capacity Calculation of Facility and Layout of Facilities on STP........... AM9-47 Appendix 9.4 Study on Cost Threshold Sewer Length ................................................... AM9-74 Appendix 9.5 Comparison of Conveyance System in Banias......................................... AM9-75 Appendix 9.6 Comparison of Economical Efficiency for Macro Plan ........................... AM9-80
Appendix for Chapter 10
Appendix 10.1 Cost Function for STP.......................................................................... AM10-2
ii
Appendix 10.2 Project Cost Estimation ........................................................................ AM10-3
Appendix for Chapter 11 Economic Analysis for Master Plan Priority Area........... AM11-1
Appendix for Chapter 12 Appendix 12.1 Definition of Attribute Data ................................................................. AM12-2 Appendix 12.2 Attendees List of GIS Training............................................................. AM12-10 Appendix 12.3 The Pictures in the GIS Training.......................................................... AM12-12 Appendix 12.4 Questionnaire of Field Survey regarding the Formulation for
Sewerage Database (in Arabic)............................................................. AM12-13 Appendix 12.5 Figure of the GIS Data Model.............................................................. AM12-19 Appendix 12.6 Schedule and Target Locations of Field Survey regarding the Formulation
for Sewerage Database in Seven (7) Governorates .............................. AM12-20
Appendix for Chapter 13 Result of the Stakeholder Meeting .................................... AM13-1
PART II: FEASIBILITY STUDY Appendix for Chapter 1
Appendix 1.1 Offensive Odor Management on STP ........................................................AF1-2 Appendix 1.2 Drawings of Proposed STP Facilities.........................................................AF1-7 Appendix 1.3 Capacity Calculation ..................................................................................AF1-18 Appendix 1.4 Separation of Rain Water............................................................................AF1-30
Appendix for Chapter 3 Sample of sewerage ledgers and records ................................ AF3-1
Appendix for Chapter 4
Appendix 4.1 Construction Cost .......................................................................................AF4-1 Appendix 4.2 O&M Cost ..................................................................................................AF4-16
Appendix for Chapter 5 Appendix 5.1 Economic Analysis of F/S Project..............................................................AF5-2 Appendix 5.2 Financial Analysis of F/S Project (Baseline Scenario)...............................AF5-3 Appendix 5.3 Financial Analysis of F/S Project (O&M Cost Recovery Scenario) ..........AF5-4 Appendix 5.4 Financial Analysis of F/S Project (50% Capital Cost Recovery Scenario) AF5-5 Appendix 5.5 Financial Analysis of F/S Project (Financial Feasibility Scenario)............AF5-6
Appendix for Chapter 6 Result of the 3rd Stakeholder Meeting and Pre-EIA
iii
Level Study..................................................................................................AF6-2 Appendix for Chapter 7 Balanced Regional Planning
and Urban Development ............................................................................AF7-2
PART III: Summary of the Results of Subcontract Survey
Appendix 1 Industrial Wastewater Quality Analysis Survey
Technical Specification .....................................................................................................AS1-2 Result of Survey................................................................................................................AS1-6
Appendix 2 Domestic Wastewater Quality Analysis Survey
Technical Specification .....................................................................................................AS2-2 Result of Survey................................................................................................................AS2-5
Appendix 3 Social Consideration Survey
Technical Specification .....................................................................................................AS3-2 Result of Survey................................................................................................................AS3-5
Appendix 4 Topographic Survey
Technical Specification .....................................................................................................AS4-2 Result of Survey................................................................................................................AS4-4
Appendix 5 Soil Survey
Technical Specification .....................................................................................................AS5-2 Result of Survey................................................................................................................AS5-4
PART IV: Minutes of Meeting
Minutes of Meeting ..............................................................................................................A-1
PART I : MASTER PLAN

The study on sewerage system development in the Syrian Arab Republic Final Report
AM7-1
Appendix for Chapter 7 Population Projection
The study on sewerage system development in the Syrian Arab Republic Final Report
AM7-2
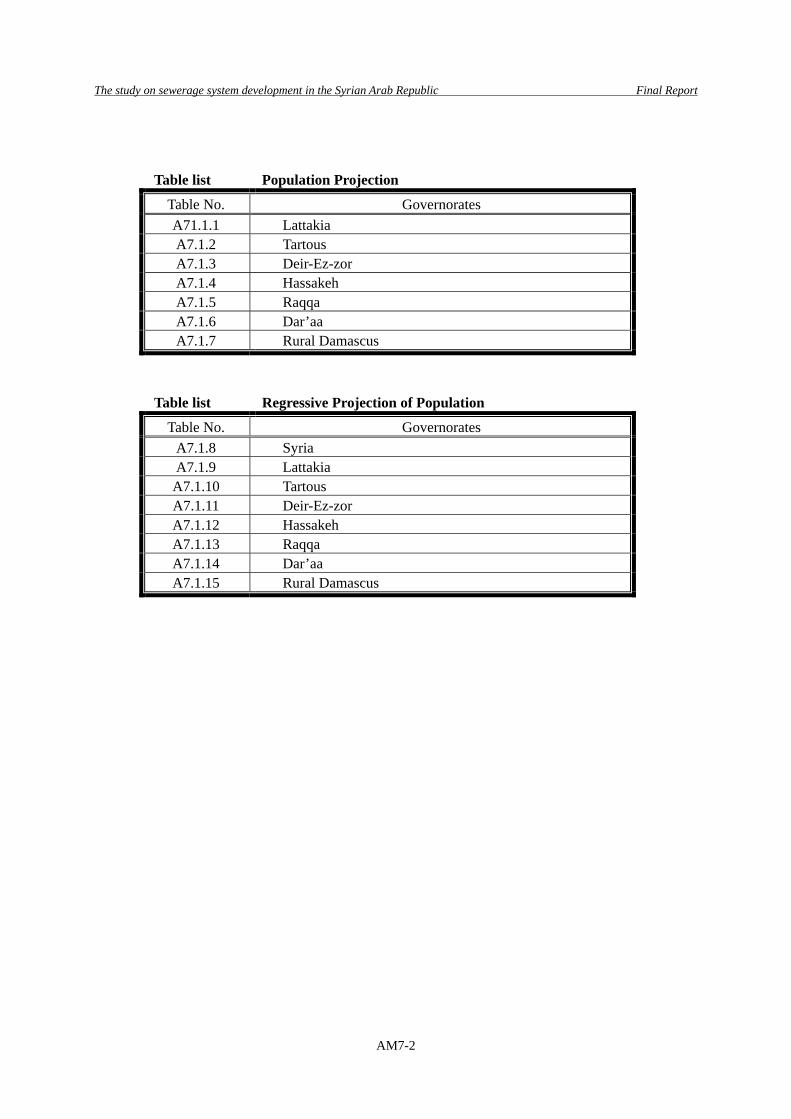
Table list Population Projection
Table No. Governorates A71.1.1 Lattakia A7.1.2 Tartous A7.1.3 Deir-Ez-zor A7.1.4 Hassakeh A7.1.5 Raqqa A7.1.6 Dar’aa A7.1.7 Rural Damascus
Table list Regressive Projection of Population
Table No. Governorates A7.1.8 Syria A7.1.9 Lattakia
A7.1.10 Tartous A7.1.11 Deir-Ez-zor A7.1.12 Hassakeh A7.1.13 Raqqa A7.1.14 Dar’aa A7.1.15 Rural Damascus
The study on sewerage system development in the Syrian Arab Republic Final Report
AM7-3
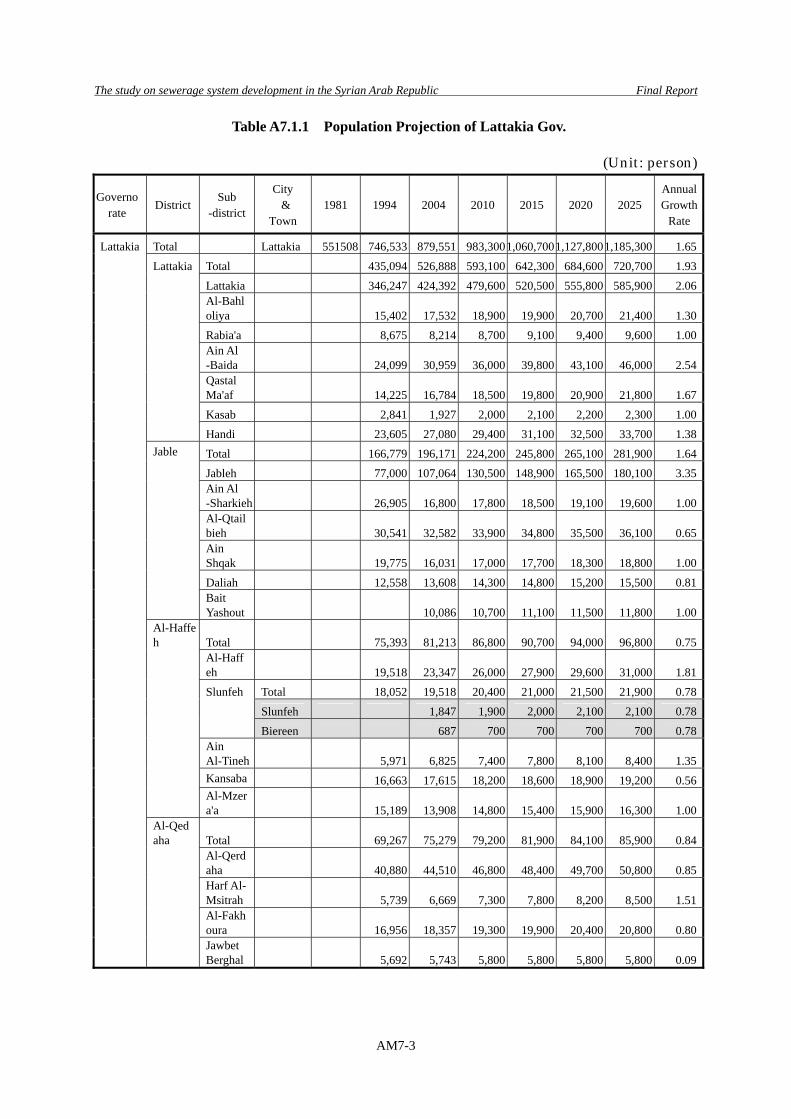
Table A7.1.1 Population Projection of Lattakia Gov.
(Unit: person)
Governo rate
District Sub
-district
City &
Town 1981 1994 2004 2010 2015 2020 2025
AnnualGrowth
Rate
Lattakia Total Lattakia 551508 746,533 879,551 983,3001,060,7001,127,800 1,185,300 1.65 Lattakia Total 435,094 526,888 593,100 642,300 684,600 720,700 1.93 Lattakia 346,247 424,392 479,600 520,500 555,800 585,900 2.06
Al-Bahloliya 15,402 17,532 18,900 19,900 20,700 21,400 1.30
Rabia'a 8,675 8,214 8,700 9,100 9,400 9,600 1.00
Ain Al -Baida 24,099 30,959 36,000 39,800 43,100 46,000 2.54
Qastal Ma'af 14,225 16,784 18,500 19,800 20,900 21,800 1.67
Kasab 2,841 1,927 2,000 2,100 2,200 2,300 1.00 Handi 23,605 27,080 29,400 31,100 32,500 33,700 1.38 Jable Total 166,779 196,171 224,200 245,800 265,100 281,900 1.64 Jableh 77,000 107,064 130,500 148,900 165,500 180,100 3.35
Ain Al -Sharkieh 26,905 16,800 17,800 18,500 19,100 19,600 1.00
Al-Qtailbieh 30,541 32,582 33,900 34,800 35,500 36,100 0.65
Ain Shqak 19,775 16,031 17,000 17,700 18,300 18,800 1.00
Daliah 12,558 13,608 14,300 14,800 15,200 15,500 0.81
Bait Yashout 10,086 10,700 11,100 11,500 11,800 1.00
Al-Haffeh Total 75,393 81,213 86,800 90,700 94,000 96,800 0.75
Al-Haffeh 19,518 23,347 26,000 27,900 29,600 31,000 1.81
Slunfeh Total 18,052 19,518 20,400 21,000 21,500 21,900 0.78 Slunfeh 1,847 1,900 2,000 2,100 2,100 0.78 Biereen 687 700 700 700 700 0.78
Ain Al-Tineh 5,971 6,825 7,400 7,800 8,100 8,400 1.35
Kansaba 16,663 17,615 18,200 18,600 18,900 19,200 0.56
Al-Mzera'a 15,189 13,908 14,800 15,400 15,900 16,300 1.00
Al-Qedaha Total 69,267 75,279 79,200 81,900 84,100 85,900 0.84
Al-Qerdaha 40,880 44,510 46,800 48,400 49,700 50,800 0.85
Harf Al- Msitrah 5,739 6,669 7,300 7,800 8,200 8,500 1.51
Al-Fakhoura 16,956 18,357 19,300 19,900 20,400 20,800 0.80
Jawbet Berghal 5,692 5,743 5,800 5,800 5,800 5,800 0.09
The study on sewerage system development in the Syrian Arab Republic Final Report
AM7-4
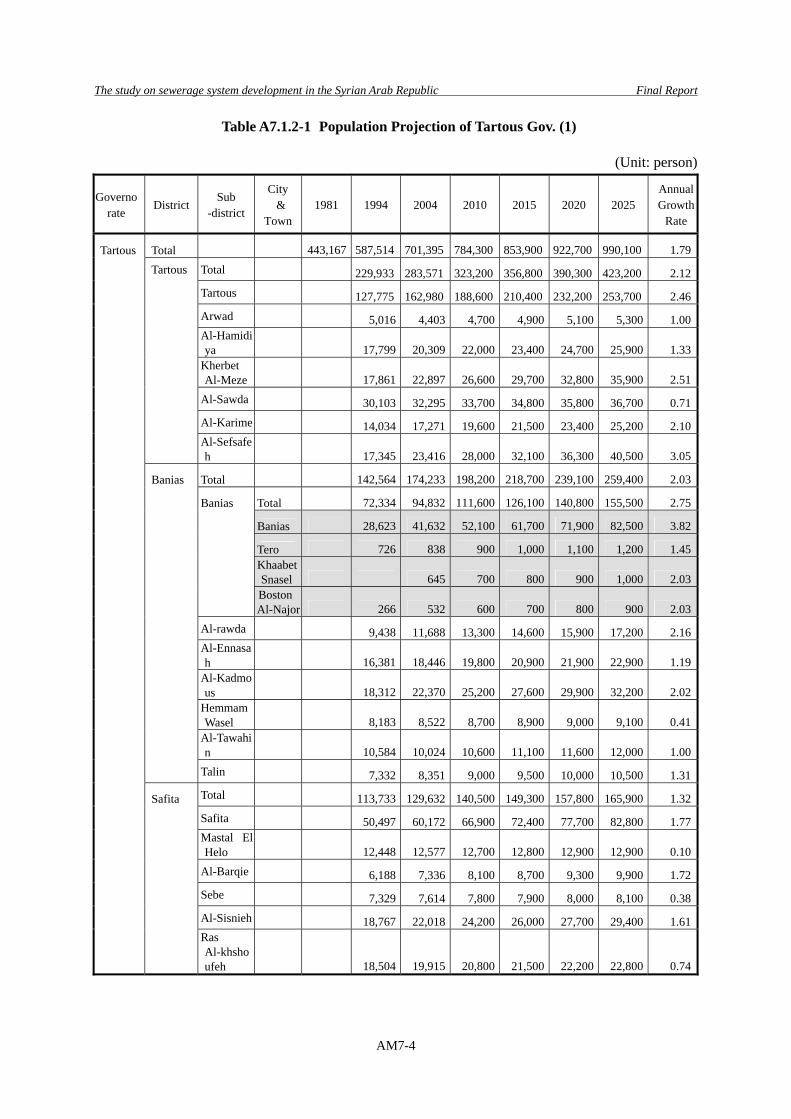
Table A7.1.2-1 Population Projection of Tartous Gov. (1)
(Unit: person)
Governorate
District Sub
-district
City &
Town 1981 1994 2004 2010 2015 2020 2025
AnnualGrowth
Rate
Tartous Total 443,167 587,514 701,395 784,300 853,900 922,700 990,100 1.79
Tartous Total 229,933 283,571 323,200 356,800 390,300 423,200 2.12
Tartous 127,775 162,980 188,600 210,400 232,200 253,700 2.46
Arwad 5,016 4,403 4,700 4,900 5,100 5,300 1.00
Al-Hamidiya 17,799 20,309 22,000 23,400 24,700 25,900 1.33
Kherbet Al-Meze 17,861 22,897 26,600 29,700 32,800 35,900 2.51
Al-Sawda 30,103 32,295 33,700 34,800 35,800 36,700 0.71
Al-Karime 14,034 17,271 19,600 21,500 23,400 25,200 2.10
Al-Sefsafeh 17,345 23,416 28,000 32,100 36,300 40,500 3.05
Banias Total 142,564 174,233 198,200 218,700 239,100 259,400 2.03
Banias Total 72,334 94,832 111,600 126,100 140,800 155,500 2.75
Banias 28,623 41,632 52,100 61,700 71,900 82,500 3.82
Tero 726 838 900 1,000 1,100 1,200 1.45
Khaabet Snasel 645 700 800 900 1,000 2.03
Boston Al-Najor 266 532 600 700 800 900 2.03
Al-rawda 9,438 11,688 13,300 14,600 15,900 17,200 2.16
Al-Ennasah 16,381 18,446 19,800 20,900 21,900 22,900 1.19
Al-Kadmous 18,312 22,370 25,200 27,600 29,900 32,200 2.02
Hemmam Wasel 8,183 8,522 8,700 8,900 9,000 9,100 0.41
Al-Tawahin 10,584 10,024 10,600 11,100 11,600 12,000 1.00
Talin 7,332 8,351 9,000 9,500 10,000 10,500 1.31
Safita Total 113,733 129,632 140,500 149,300 157,800 165,900 1.32
Safita 50,497 60,172 66,900 72,400 77,700 82,800 1.77
Mastal El Helo 12,448 12,577 12,700 12,800 12,900 12,900 0.10
Al-Barqie 6,188 7,336 8,100 8,700 9,300 9,900 1.72
Sebe 7,329 7,614 7,800 7,900 8,000 8,100 0.38
Al-Sisnieh 18,767 22,018 24,200 26,000 27,700 29,400 1.61
Ras Al-khshoufeh 18,504 19,915 20,800 21,500 22,200 22,800 0.74
The study on sewerage system development in the Syrian Arab Republic Final Report
AM7-5
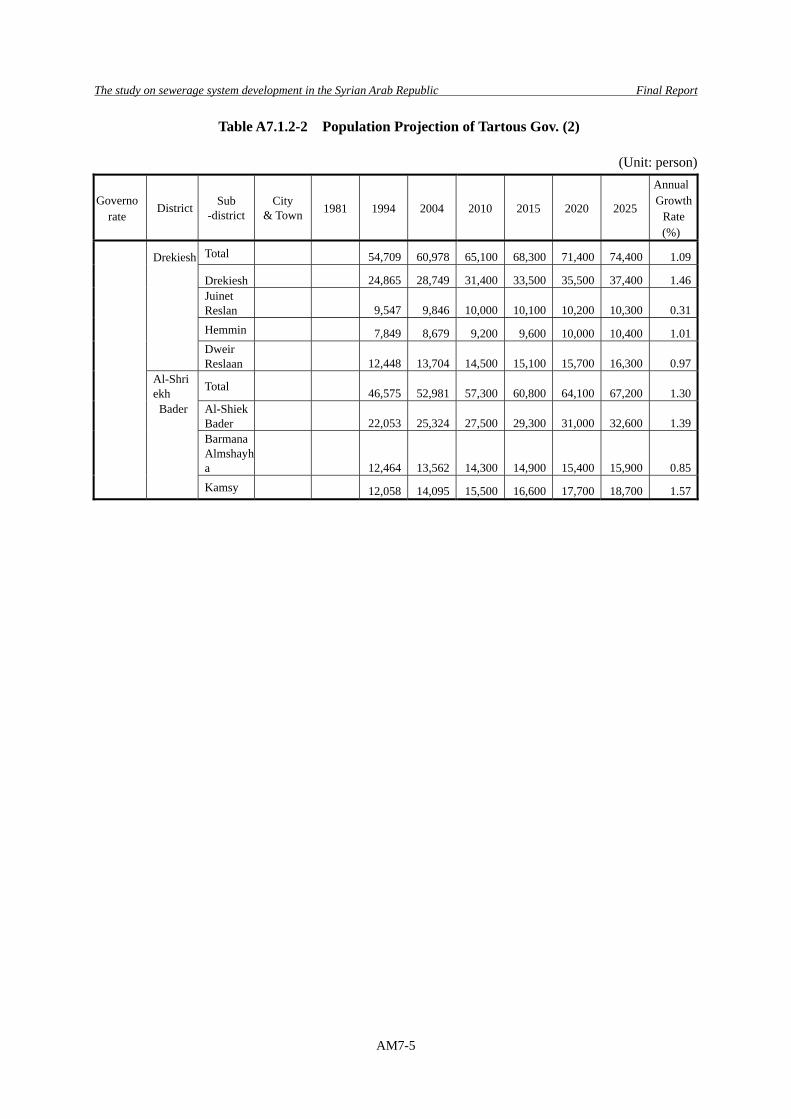
Table A7.1.2-2 Population Projection of Tartous Gov. (2)
(Unit: person)
Governo rate
District Sub -district
City & Town 1981 1994 2004 2010 2015 2020 2025
AnnualGrowth
Rate(%)
Drekiesh Total 54,709 60,978 65,100 68,300 71,400 74,400 1.09
Drekiesh 24,865 28,749 31,400 33,500 35,500 37,400 1.46
Juinet Reslan 9,547 9,846 10,000 10,100 10,200 10,300 0.31
Hemmin 7,849 8,679 9,200 9,600 10,000 10,400 1.01
Dweir Reslaan 12,448 13,704 14,500 15,100 15,700 16,300 0.97
Al-Shriekh Total
46,575 52,981 57,300 60,800 64,100 67,200 1.30
Bader Al-Shiek
Bader 22,053 25,324 27,500 29,300 31,000 32,600 1.39
Barmana Almshayha 12,464 13,562 14,300 14,900 15,400 15,900 0.85
Kamsy 12,058 14,095 15,500 16,600 17,700 18,700 1.57
The study on sewerage system development in the Syrian Arab Republic Final Report
AM7-6
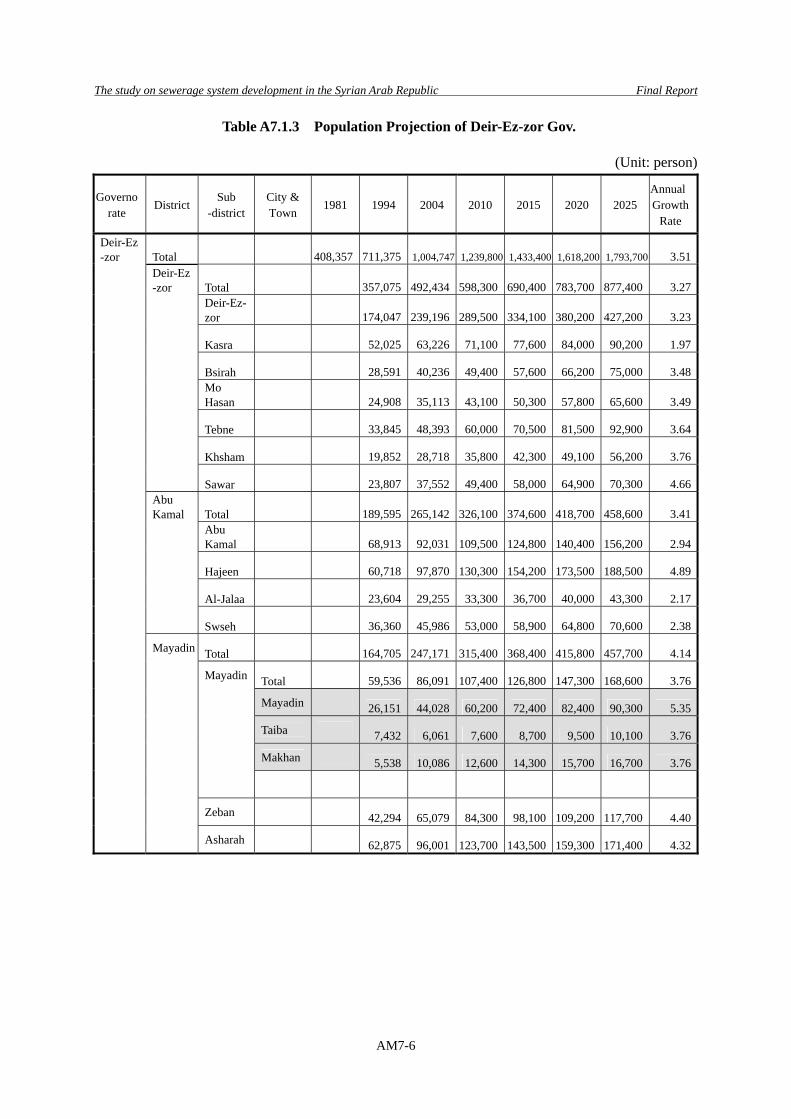
Table A7.1.3 Population Projection of Deir-Ez-zor Gov.
(Unit: person)
Governo rate
District Sub
-districtCity & Town
1981 1994 2004 2010 2015 2020 2025 AnnualGrowth
Rate
Deir-Ez-zor Total 408,357 711,375 1,004,747 1,239,800 1,433,400 1,618,200 1,793,700 3.51
Deir-Ez-zor Total 357,075 492,434 598,300 690,400 783,700 877,400 3.27
Deir-Ez-zor 174,047 239,196 289,500 334,100 380,200 427,200 3.23
Kasra 52,025 63,226 71,100 77,600 84,000 90,200 1.97
Bsirah 28,591 40,236 49,400 57,600 66,200 75,000 3.48
Mo Hasan 24,908 35,113 43,100 50,300 57,800 65,600 3.49
Tebne 33,845 48,393 60,000 70,500 81,500 92,900 3.64
Khsham 19,852 28,718 35,800 42,300 49,100 56,200 3.76
Sawar 23,807 37,552 49,400 58,000 64,900 70,300 4.66
Abu Kamal Total 189,595 265,142 326,100 374,600 418,700 458,600 3.41
Abu Kamal 68,913 92,031 109,500 124,800 140,400 156,200 2.94
Hajeen 60,718 97,870 130,300 154,200 173,500 188,500 4.89
Al-Jalaa 23,604 29,255 33,300 36,700 40,000 43,300 2.17
Swseh 36,360 45,986 53,000 58,900 64,800 70,600 2.38
Mayadin Total 164,705 247,171 315,400 368,400 415,800 457,700 4.14
Mayadin Total 59,536 86,091 107,400 126,800 147,300 168,600 3.76
Mayadin 26,151 44,028 60,200 72,400 82,400 90,300 5.35
Taiba 7,432 6,061 7,600 8,700 9,500 10,100 3.76
Makhan 5,538 10,086 12,600 14,300 15,700 16,700 3.76
Zeban 42,294 65,079 84,300 98,100 109,200 117,700 4.40
Asharah 62,875 96,001 123,700 143,500 159,300 171,400 4.32
The study on sewerage system development in the Syrian Arab Republic Final Report
AM7-7
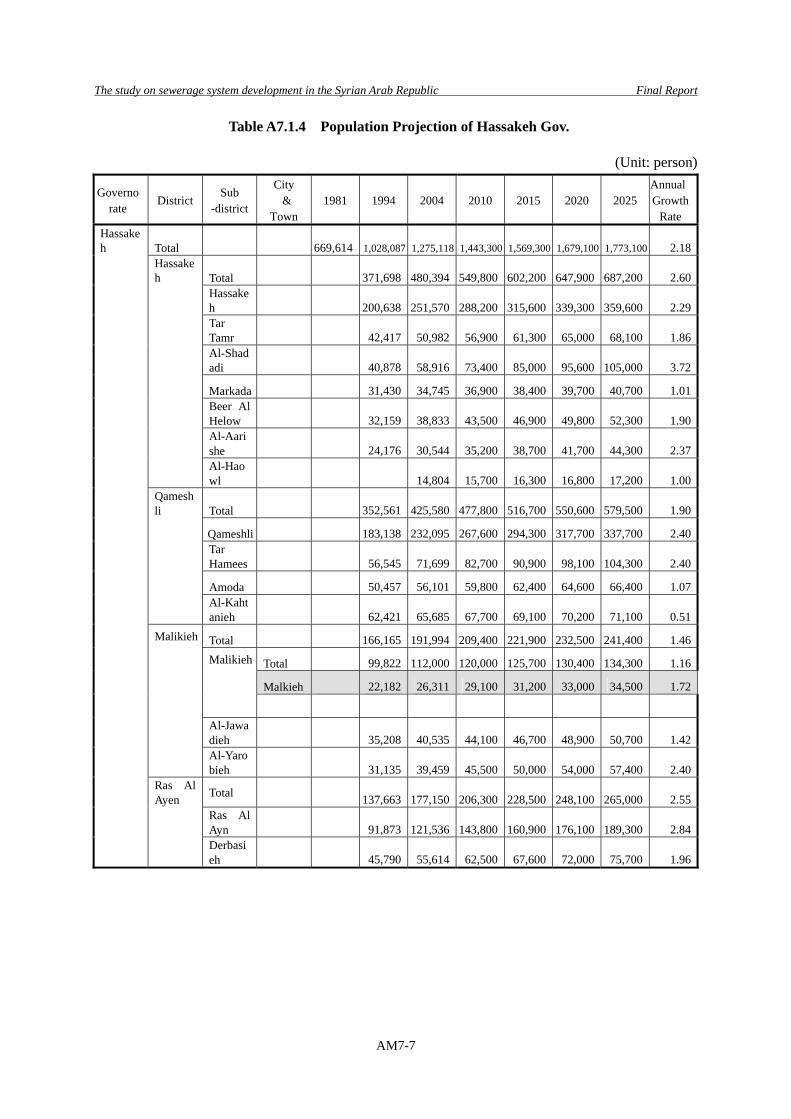
Table A7.1.4 Population Projection of Hassakeh Gov.
(Unit: person)
Governo rate
District Sub
-district
City &
Town 1981 1994 2004 2010 2015 2020 2025
AnnualGrowth
Rate Hassakeh Total 669,614 1,028,087 1,275,118 1,443,300 1,569,300 1,679,100 1,773,100 2.18
Hassakeh Total 371,698 480,394 549,800 602,200 647,900 687,200 2.60
Hassakeh 200,638 251,570 288,200 315,600 339,300 359,600 2.29
Tar Tamr 42,417 50,982 56,900 61,300 65,000 68,100 1.86
Al-Shadadi 40,878 58,916 73,400 85,000 95,600 105,000 3.72
Markada 31,430 34,745 36,900 38,400 39,700 40,700 1.01
Beer Al Helow 32,159 38,833 43,500 46,900 49,800 52,300 1.90
Al-Aarishe 24,176 30,544 35,200 38,700 41,700 44,300 2.37
Al-Haowl 14,804 15,700 16,300 16,800 17,200 1.00
Qameshli Total 352,561 425,580 477,800 516,700 550,600 579,500 1.90
Qameshli 183,138 232,095 267,600 294,300 317,700 337,700 2.40
Tar Hamees 56,545 71,699 82,700 90,900 98,100 104,300 2.40
Amoda 50,457 56,101 59,800 62,400 64,600 66,400 1.07
Al-Kahtanieh 62,421 65,685 67,700 69,100 70,200 71,100 0.51
Malikieh Total 166,165 191,994 209,400 221,900 232,500 241,400 1.46
Malikieh Total 99,822 112,000 120,000 125,700 130,400 134,300 1.16
Malkieh 22,182 26,311 29,100 31,200 33,000 34,500 1.72
Al-Jawadieh 35,208 40,535 44,100 46,700 48,900 50,700 1.42
Al-Yarobieh 31,135 39,459 45,500 50,000 54,000 57,400 2.40
Ras Al Ayen Total 137,663 177,150 206,300 228,500 248,100 265,000 2.55
Ras Al Ayn 91,873 121,536 143,800 160,900 176,100 189,300 2.84
Derbasieh 45,790 55,614 62,500 67,600 72,000 75,700 1.96
The study on sewerage system development in the Syrian Arab Republic Final Report
AM7-8
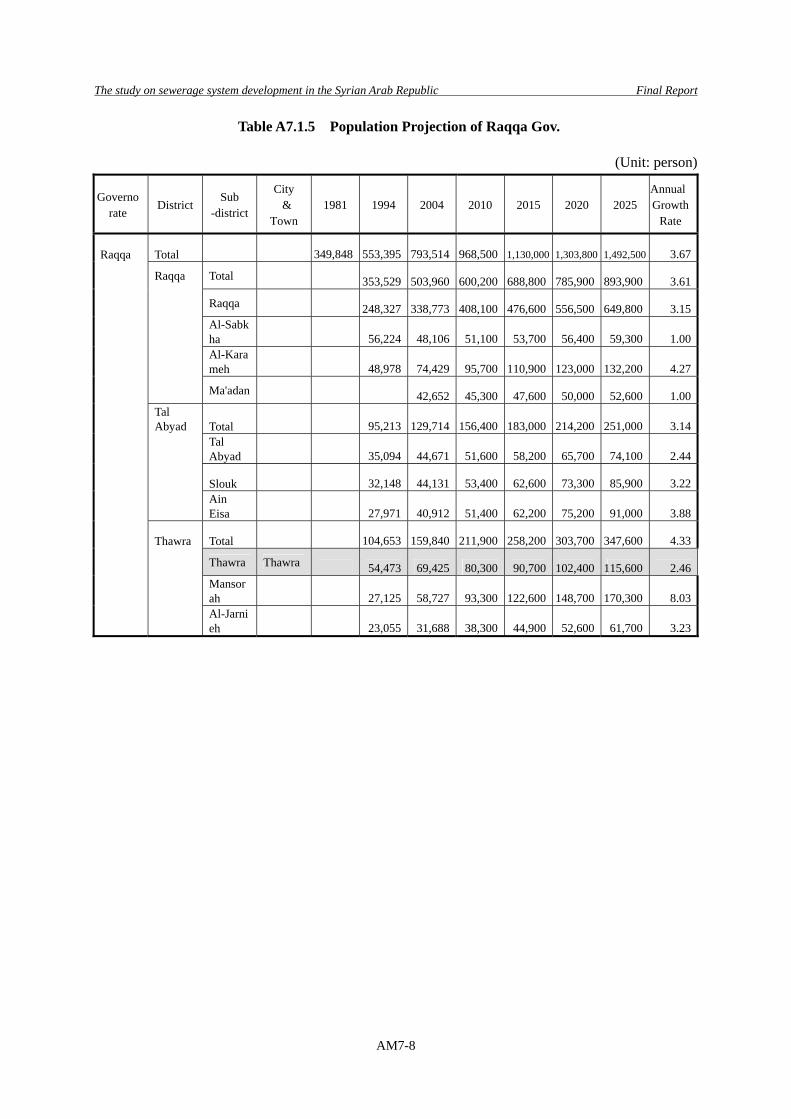
Table A7.1.5 Population Projection of Raqqa Gov.
(Unit: person)
Governo rate
District Sub
-district
City &
Town 1981 1994 2004 2010 2015 2020 2025
AnnualGrowth
Rate
Raqqa Total 349,848 553,395 793,514 968,500 1,130,000 1,303,800 1,492,500 3.67
Raqqa Total 353,529 503,960 600,200 688,800 785,900 893,900 3.61
Raqqa 248,327 338,773 408,100 476,600 556,500 649,800 3.15
Al-Sabkha
56,224 48,106 51,100 53,700 56,400 59,300 1.00
Al-Karameh
48,978 74,429 95,700 110,900 123,000 132,200 4.27
Ma'adan 42,652 45,300 47,600 50,000 52,600 1.00
Tal Abyad Total 95,213 129,714 156,400 183,000 214,200 251,000 3.14
Tal Abyad 35,094 44,671 51,600 58,200 65,700 74,100 2.44
Slouk 32,148 44,131 53,400 62,600 73,300 85,900 3.22
Ain Eisa 27,971 40,912 51,400 62,200 75,200 91,000 3.88
Thawra Total 104,653 159,840 211,900 258,200 303,700 347,600 4.33
Thawra Thawra 54,473 69,425 80,300 90,700 102,400 115,600 2.46
Mansorah 27,125 58,727 93,300 122,600 148,700 170,300 8.03
Al-Jarnieh 23,055 31,688 38,300 44,900 52,600 61,700 3.23
The study on sewerage system development in the Syrian Arab Republic Final Report
AM7-9
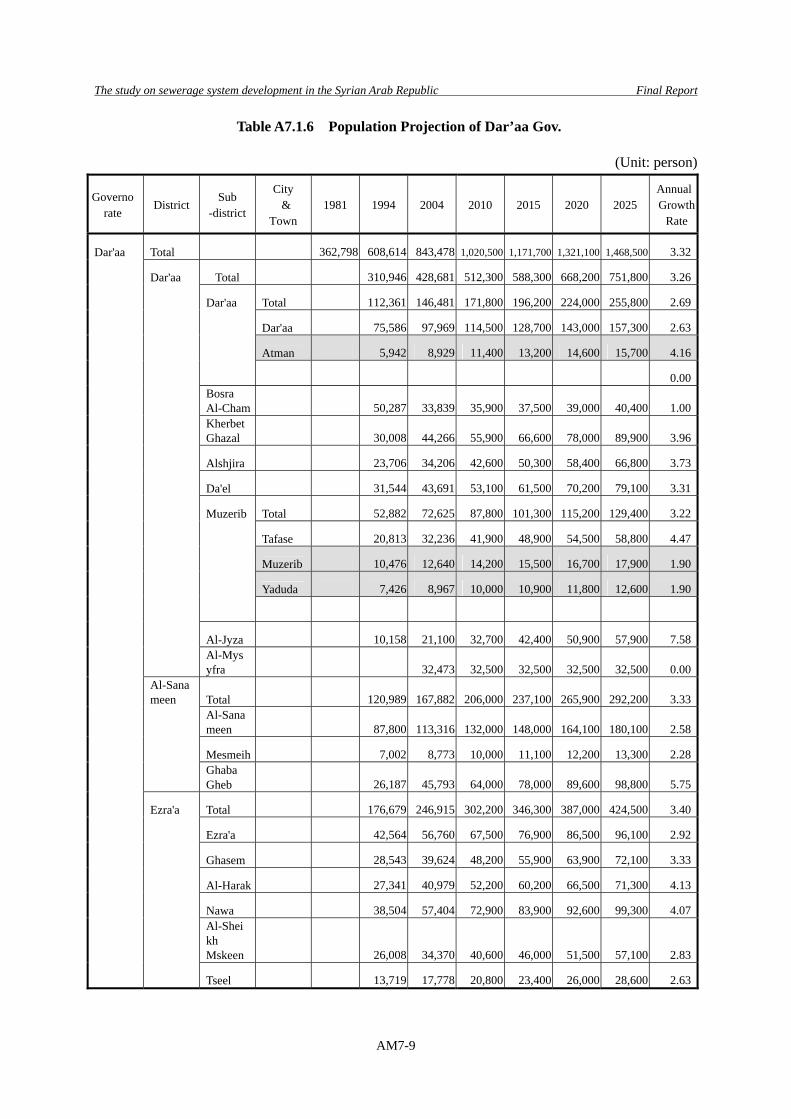
Table A7.1.6 Population Projection of Dar’aa Gov.
(Unit: person)
Governo rate
District Sub
-district
City &
Town 1981 1994 2004 2010 2015 2020 2025
AnnualGrowth
Rate
Dar'aa Total 362,798 608,614 843,478 1,020,500 1,171,700 1,321,100 1,468,500 3.32
Dar'aa Total 310,946 428,681 512,300 588,300 668,200 751,800 3.26
Dar'aa Total 112,361 146,481 171,800 196,200 224,000 255,800 2.69
Dar'aa 75,586 97,969 114,500 128,700 143,000 157,300 2.63
Atman 5,942 8,929 11,400 13,200 14,600 15,700 4.16
0.00
Bosra Al-Cham 50,287 33,839 35,900 37,500 39,000 40,400 1.00
Kherbet Ghazal 30,008 44,266 55,900 66,600 78,000 89,900 3.96
Alshjira 23,706 34,206 42,600 50,300 58,400 66,800 3.73
Da'el 31,544 43,691 53,100 61,500 70,200 79,100 3.31
Muzerib Total 52,882 72,625 87,800 101,300 115,200 129,400 3.22
Tafase 20,813 32,236 41,900 48,900 54,500 58,800 4.47
Muzerib 10,476 12,640 14,200 15,500 16,700 17,900 1.90
Yaduda 7,426 8,967 10,000 10,900 11,800 12,600 1.90
Al-Jyza 10,158 21,100 32,700 42,400 50,900 57,900 7.58
Al-Mysyfra 32,473 32,500 32,500 32,500 32,500 0.00
Al-Sanameen Total 120,989 167,882 206,000 237,100 265,900 292,200 3.33
Al-Sanameen 87,800 113,316 132,000 148,000 164,100 180,100 2.58
Mesmeih 7,002 8,773 10,000 11,100 12,200 13,300 2.28
Ghaba Gheb 26,187 45,793 64,000 78,000 89,600 98,800 5.75
Ezra'a Total 176,679 246,915 302,200 346,300 387,000 424,500 3.40
Ezra'a 42,564 56,760 67,500 76,900 86,500 96,100 2.92
Ghasem 28,543 39,624 48,200 55,900 63,900 72,100 3.33
Al-Harak 27,341 40,979 52,200 60,200 66,500 71,300 4.13
Nawa 38,504 57,404 72,900 83,900 92,600 99,300 4.07
Al-Sheikh Mskeen 26,008 34,370 40,600 46,000 51,500 57,100 2.83
Tseel 13,719 17,778 20,800 23,400 26,000 28,600 2.63
The study on sewerage system development in the Syrian Arab Republic Final Report
AM7-10
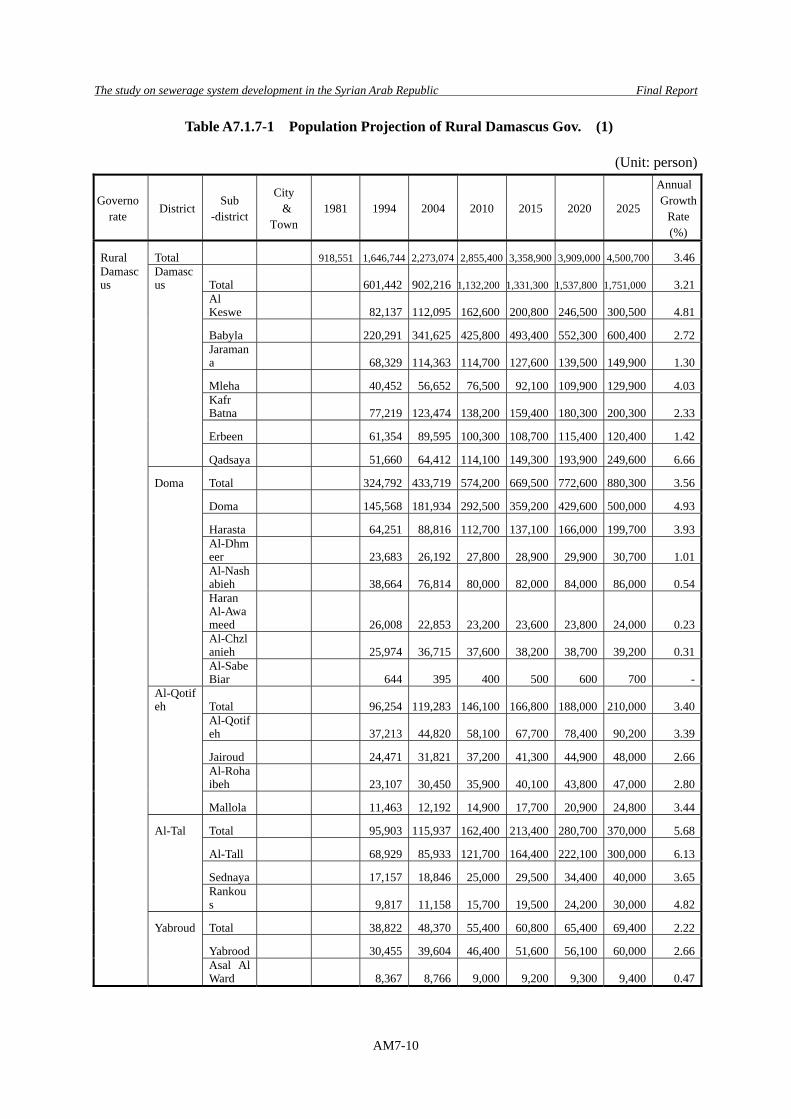
Table A7.1.7-1 Population Projection of Rural Damascus Gov. (1)
(Unit: person)
Governo rate
District Sub
-district
City &
Town 1981 1994 2004 2010 2015 2020 2025
AnnualGrowth
Rate (%)
Rural Total 918,551 1,646,744 2,273,074 2,855,400 3,358,900 3,909,000 4,500,700 3.46Damascus
Damascus Total 601,442 902,216 1,132,200 1,331,300 1,537,800 1,751,000 3.21
Al Keswe 82,137 112,095 162,600 200,800 246,500 300,500 4.81
Babyla 220,291 341,625 425,800 493,400 552,300 600,400 2.72
Jaramana 68,329 114,363 114,700 127,600 139,500 149,900 1.30
Mleha 40,452 56,652 76,500 92,100 109,900 129,900 4.03
Kafr Batna 77,219 123,474 138,200 159,400 180,300 200,300 2.33
Erbeen 61,354 89,595 100,300 108,700 115,400 120,400 1.42
Qadsaya 51,660 64,412 114,100 149,300 193,900 249,600 6.66
Doma Total 324,792 433,719 574,200 669,500 772,600 880,300 3.56
Doma 145,568 181,934 292,500 359,200 429,600 500,000 4.93
Harasta 64,251 88,816 112,700 137,100 166,000 199,700 3.93
Al-Dhmeer 23,683 26,192 27,800 28,900 29,900 30,700 1.01
Al-Nashabieh 38,664 76,814 80,000 82,000 84,000 86,000 0.54
Haran Al-Awameed 26,008 22,853 23,200 23,600 23,800 24,000 0.23
Al-Chzlanieh 25,974 36,715 37,600 38,200 38,700 39,200 0.31
Al-Sabe Biar 644 395 400 500 600 700 -
Al-Qotifeh Total 96,254 119,283 146,100 166,800 188,000 210,000 3.40
Al-Qotifeh 37,213 44,820 58,100 67,700 78,400 90,200 3.39
Jairoud 24,471 31,821 37,200 41,300 44,900 48,000 2.66
Al-Rohaibeh 23,107 30,450 35,900 40,100 43,800 47,000 2.80
Mallola 11,463 12,192 14,900 17,700 20,900 24,800 3.44
Al-Tal Total 95,903 115,937 162,400 213,400 280,700 370,000 5.68
Al-Tall 68,929 85,933 121,700 164,400 222,100 300,000 6.13
Sednaya 17,157 18,846 25,000 29,500 34,400 40,000 3.65
Rankous 9,817 11,158 15,700 19,500 24,200 30,000 4.82
Yabroud Total 38,822 48,370 55,400 60,800 65,400 69,400 2.22
Yabrood 30,455 39,604 46,400 51,600 56,100 60,000 2.66
Asal Al Ward 8,367 8,766 9,000 9,200 9,300 9,400 0.47
The study on sewerage system development in the Syrian Arab Republic Final Report
AM7-11
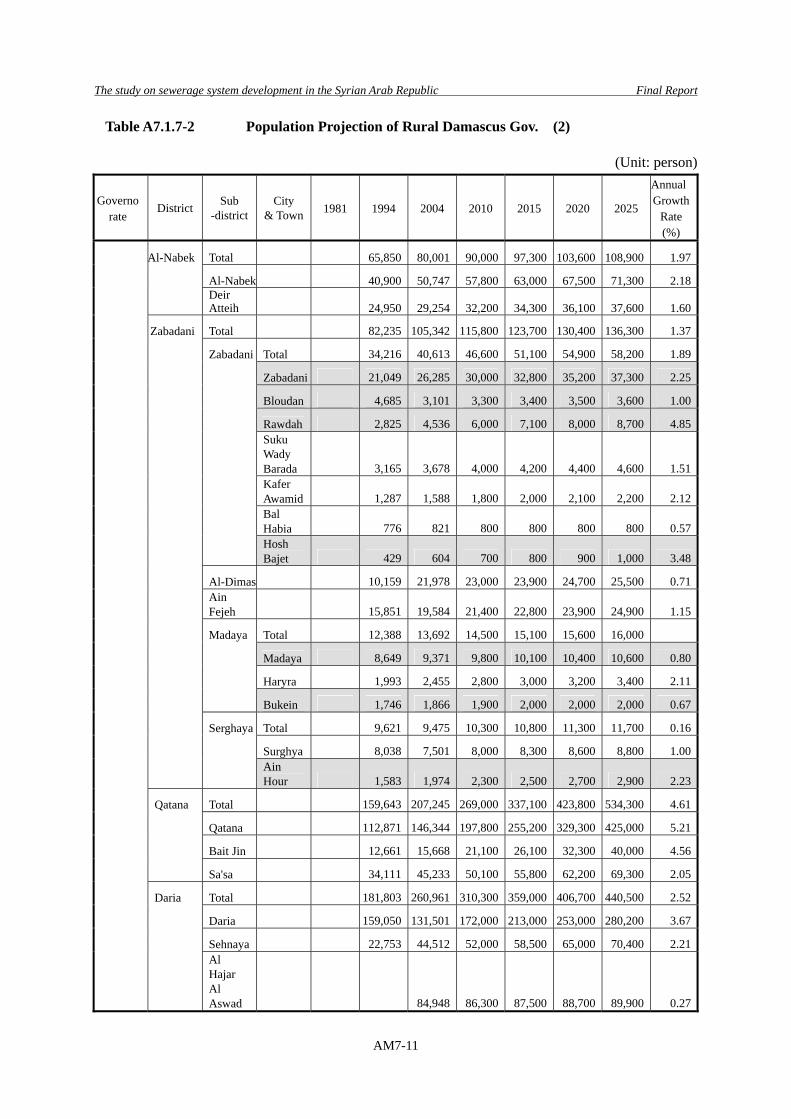
Table A7.1.7-2 Population Projection of Rural Damascus Gov. (2)
(Unit: person)
Governo rate
District Sub -district
City & Town 1981 1994 2004 2010 2015 2020 2025
AnnualGrowth
Rate (%)
Al-Nabek Total 65,850 80,001 90,000 97,300 103,600 108,900 1.97
Al-Nabek 40,900 50,747 57,800 63,000 67,500 71,300 2.18
Deir Atteih 24,950 29,254 32,200 34,300 36,100 37,600 1.60
Zabadani Total 82,235 105,342 115,800 123,700 130,400 136,300 1.37
Zabadani Total 34,216 40,613 46,600 51,100 54,900 58,200 1.89
Zabadani 21,049 26,285 30,000 32,800 35,200 37,300 2.25
Bloudan 4,685 3,101 3,300 3,400 3,500 3,600 1.00
Rawdah 2,825 4,536 6,000 7,100 8,000 8,700 4.85
Suku Wady Barada 3,165 3,678 4,000 4,200 4,400 4,600 1.51
Kafer Awamid 1,287 1,588 1,800 2,000 2,100 2,200 2.12
Bal Habia 776 821 800 800 800 800 0.57
Hosh Bajet 429 604 700 800 900 1,000 3.48
Al-Dimas 10,159 21,978 23,000 23,900 24,700 25,500 0.71
Ain Fejeh 15,851 19,584 21,400 22,800 23,900 24,900 1.15
Madaya Total 12,388 13,692 14,500 15,100 15,600 16,000
Madaya 8,649 9,371 9,800 10,100 10,400 10,600 0.80
Haryra 1,993 2,455 2,800 3,000 3,200 3,400 2.11
Bukein 1,746 1,866 1,900 2,000 2,000 2,000 0.67
Serghaya Total 9,621 9,475 10,300 10,800 11,300 11,700 0.16
Surghya 8,038 7,501 8,000 8,300 8,600 8,800 1.00
Ain Hour 1,583 1,974 2,300 2,500 2,700 2,900 2.23
Qatana Total 159,643 207,245 269,000 337,100 423,800 534,300 4.61
Qatana 112,871 146,344 197,800 255,200 329,300 425,000 5.21
Bait Jin 12,661 15,668 21,100 26,100 32,300 40,000 4.56
Sa'sa 34,111 45,233 50,100 55,800 62,200 69,300 2.05
Daria Total 181,803 260,961 310,300 359,000 406,700 440,500 2.52
Daria 159,050 131,501 172,000 213,000 253,000 280,200 3.67
Sehnaya 22,753 44,512 52,000 58,500 65,000 70,400 2.21
Al Hajar Al Aswad 84,948 86,300 87,500 88,700 89,900 0.27
The study on sewerage system development in the Syrian Arab Republic Final Report
AM7-12
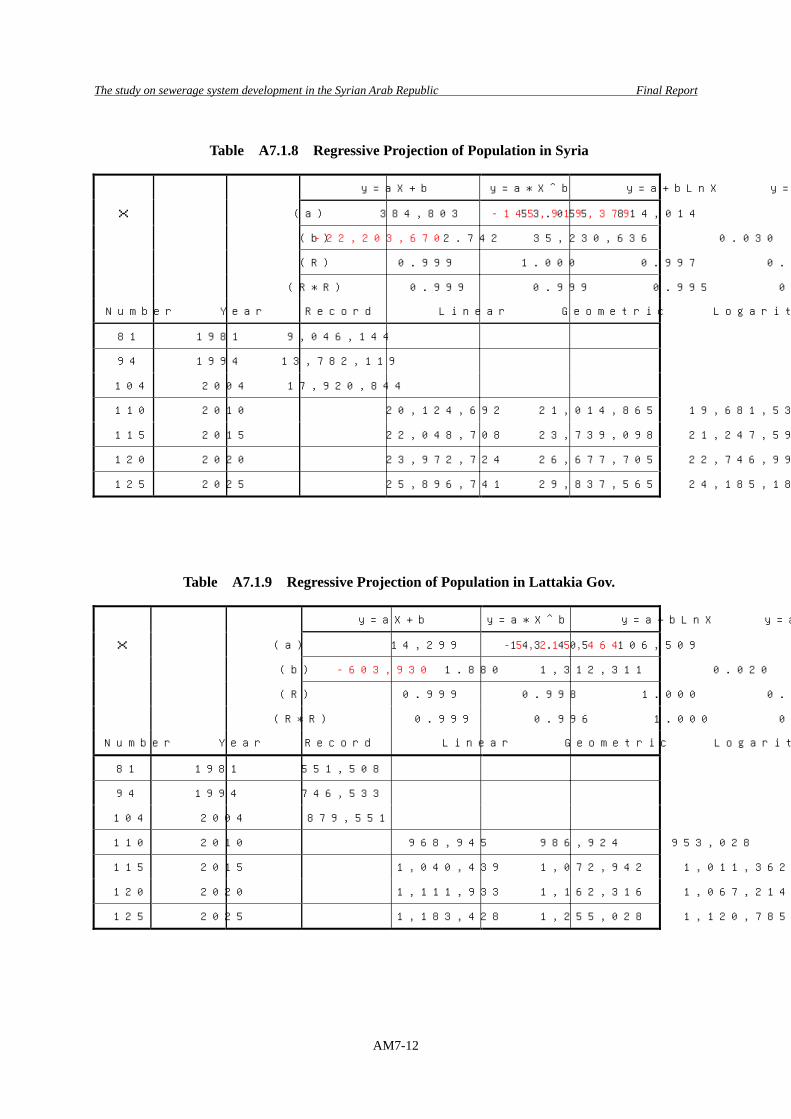
Table A7.1.8 Regressive Projection of Population in Syria
y=aX+b y=a*X^b y=a+bLnX y=a*e^bX
X (a) 384,803 53.055 -145,919,379 814,014
(b) -22,203,670 2.742 35,230,636 0.030
(R) 0.999 1.000 0.997 0.998
(R*R) 0.999 0.999 0.995 0.997
Number Year Record Linear Geometric Logarithm Exponent
81 1981 9,046,144
94 1994 13,782,119
104 2004 17,920,844
110 2010 20,124,692 21,014,865 19,681,532 21,716,247
115 2015 22,048,708 23,739,098 21,247,596 25,212,151
120 2020 23,972,724 26,677,705 22,746,998 29,270,830
125 2025 25,896,741 29,837,565 24,185,183 33,982,879
Table A7.1.9 Regressive Projection of Population in Lattakia Gov.
y=aX+b y=a*X^b y=a+bLnX y=a*e^bX
X (a) 14,299 143.405 -5,215,464 106,509
(b) -603,930 1.880 1,312,311 0.020
(R) 0.999 0.998 1.000 0.996
(R*R) 0.999 0.996 1.000 0.991
Number Year Record Linear Geometric Logarithm Exponent
81 1981 551,508
94 1994 746,533
104 2004 879,551
110 2010 968,945 986,924 953,028 1,008,937
115 2015 1,040,439 1,072,942 1,011,362 1,117,505
120 2020 1,111,933 1,162,316 1,067,214 1,237,755
125 2025 1,183,428 1,255,028 1,120,785 1,370,945
The study on sewerage system development in the Syrian Arab Republic Final Report
AM7-13
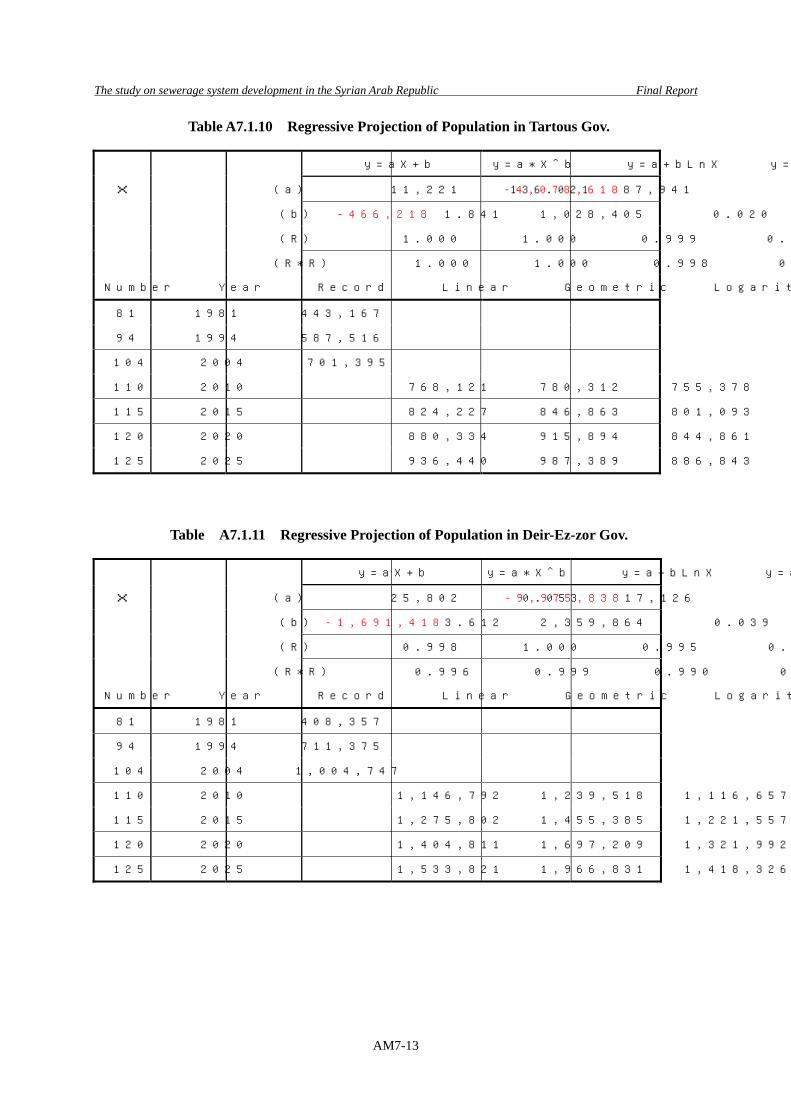
Table A7.1.10 Regressive Projection of Population in Tartous Gov.
y=aX+b y=a*X^b y=a+bLnX y=a*e^bX
X (a) 11,221 136.021 -4,078,618 87,941
(b) -466,218 1.841 1,028,405 0.020
(R) 1.000 1.000 0.999 0.998
(R*R) 1.000 1.000 0.998 0.997
Number Year Record Linear Geometric Logarithm Exponent
81 1981 443,167
94 1994 587,516
104 2004 701,395
110 2010 768,121 780,312 755,378 797,723
115 2015 824,227 846,863 801,093 881,825
120 2020 880,334 915,894 844,861 974,793
125 2025 936,440 987,389 886,843 1,077,562
Table A7.1.11 Regressive Projection of Population in Deir-Ez-zor Gov.
y=aX+b y=a*X^b y=a+bLnX y=a*e^bX
X (a) 25,802 0.053 -9,975,838 17,126
(b) -1,691,418 3.612 2,359,864 0.039
(R) 0.998 1.000 0.995 0.998
(R*R) 0.996 0.999 0.990 0.997
Number Year Record Linear Geometric Logarithm Exponent
81 1981 408,357
94 1994 711,375
104 2004 1,004,747
110 2010 1,146,792 1,239,518 1,116,657 1,294,272
115 2015 1,275,802 1,455,385 1,221,557 1,575,455
120 2020 1,404,811 1,697,209 1,321,992 1,917,726
125 2025 1,533,821 1,966,831 1,418,326 2,334,355
The study on sewerage system development in the Syrian Arab Republic Final Report
AM7-14
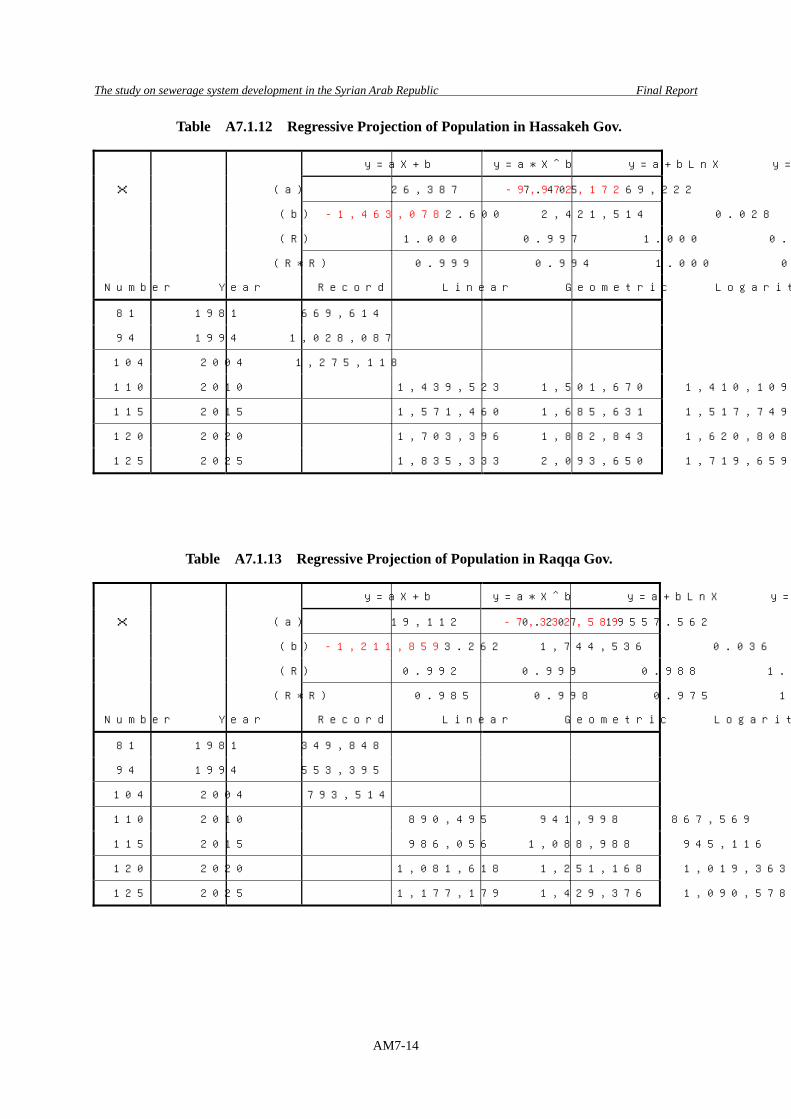
Table A7.1.12 Regressive Projection of Population in Hassakeh Gov.
y=aX+b y=a*X^b y=a+bLnX y=a*e^bX
X (a) 26,387 7.405 -9,972,172 69,222
(b) -1,463,078 2.600 2,421,514 0.028
(R) 1.000 0.997 1.000 0.994
(R*R) 0.999 0.994 1.000 0.987
Number Year Record Linear Geometric Logarithm Exponent
81 1981 669,614
94 1994 1,028,087
104 2004 1,275,118
110 2010 1,439,523 1,501,670 1,410,109 1,547,692
115 2015 1,571,460 1,685,631 1,517,749 1,782,472
120 2020 1,703,396 1,882,843 1,620,808 2,052,868
125 2025 1,835,333 2,093,650 1,719,659 2,364,281
Table A7.1.13 Regressive Projection of Population in Raqqa Gov.
y=aX+b y=a*X^b y=a+bLnX y=a*e^bX
X (a) 19,112 0.207 -7,332,589 19557.562
(b) -1,211,859 3.262 1,744,536 0.036
(R) 0.992 0.999 0.988 1.000
(R*R) 0.985 0.998 0.975 1.000
Number Year Record Linear Geometric Logarithm Exponent
81 1981 349,848
94 1994 553,395
104 2004 793,514
110 2010 890,495 941,998 867,569 980,829
115 2015 986,056 1,088,988 945,116 1,171,868
120 2020 1,081,618 1,251,168 1,019,363 1,400,117
125 2025 1,177,179 1,429,376 1,090,578 1,672,821
The study on sewerage system development in the Syrian Arab Republic Final Report
AM7-15
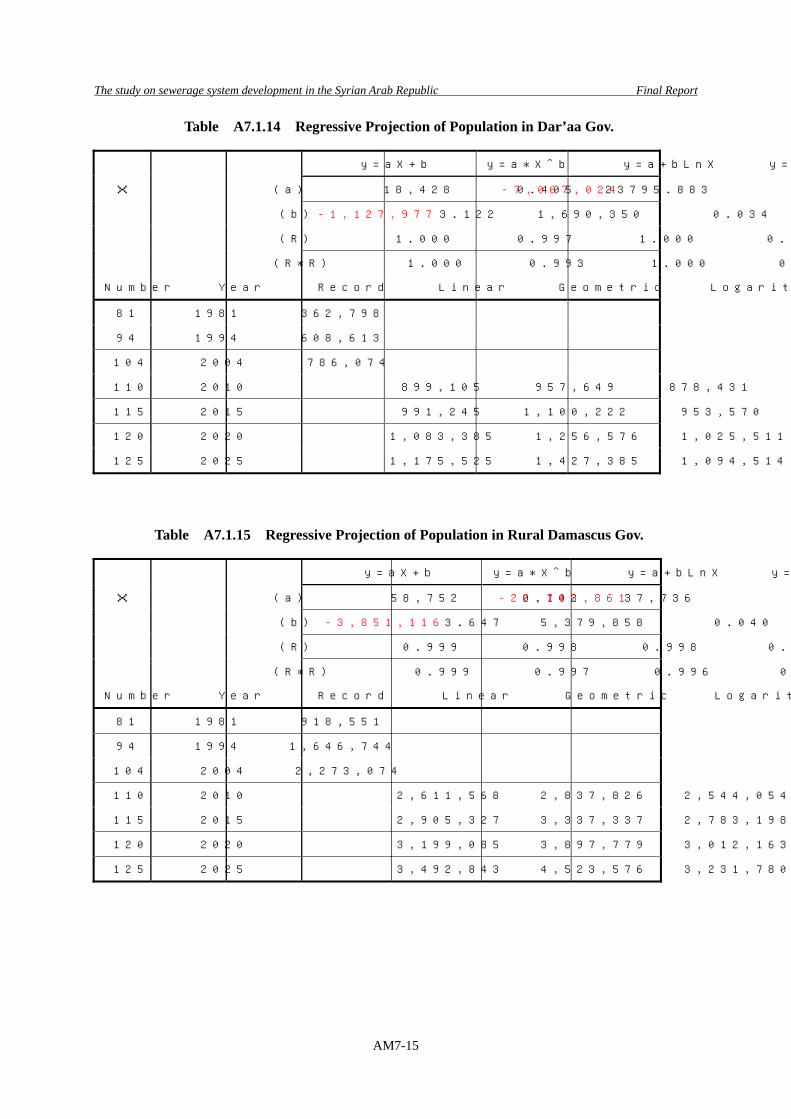
Table A7.1.14 Regressive Projection of Population in Dar’aa Gov.
y=aX+b y=a*X^b y=a+bLnX y=a*e^bX
X (a) 18,428 0.405 -7,067,024 23795.883
(b) -1,127,977 3.122 1,690,350 0.034
(R) 1.000 0.997 1.000 0.993
(R*R) 1.000 0.993 1.000 0.986
Number Year Record Linear Geometric Logarithm Exponent
81 1981 362,798
94 1994 608,613
104 2004 786,074
110 2010 899,105 957,649 878,431 992,928
115 2015 991,245 1,100,222 953,570 1,176,449
120 2020 1,083,385 1,256,576 1,025,511 1,393,889
125 2025 1,175,525 1,427,385 1,094,514 1,651,519
Table A7.1.15 Regressive Projection of Population in Rural Damascus Gov.
y=aX+b y=a*X^b y=a+bLnX y=a*e^bX
X (a) 58,752 0.102 -22,743,861 37,736
(b) -3,851,116 3.647 5,379,858 0.040
(R) 0.999 0.998 0.998 0.996
(R*R) 0.999 0.997 0.996 0.992
Number Year Record Linear Geometric Logarithm Exponent
81 1981 918,551
94 1994 1,646,744
104 2004 2,273,074
110 2010 2,611,568 2,837,826 2,544,054 2,962,267
115 2015 2,905,327 3,337,337 2,783,198 3,612,057
120 2020 3,199,085 3,897,779 3,012,163 4,404,382
125 2025 3,492,843 4,523,576 3,231,780 5,370,508
The study on sewerage system development in the Syrian Arab Republic Final Report
AM8-1
Appendix for Chapter 8 Appendix 8.1 Summary of Discharge, Runoff and Industrial Wastewater
The study on sewerage system development in the Syrian Arab Republic Final Report
AM8-2
Dra
'aD
isch
arge
Loa
d in
200
6 (k
g/da
y)B
OD
COD
T-N
T-P
BO
DCO
DT-
NT-
PB
OD
COD
T-N
T-P
BO
DCO
DT-
NT-
PPo
int
Sew
erag
e Sy
stem
383,
056
Load
Pit L
atrin
e46
0,42
223
.941
.31.
51.
310
,985
.918
,992
.469
8.7
611.
41,
098.
61,
899.
269
.961
.19,
887.
317
,093
.262
8.8
550.
2To
uris
tH
otel
Gue
st22
32.3
56.1
7.7
2.6
0.7
1.2
0.2
0.1
0.1
0.1
0.0
0.0
0.6
1.1
0.1
0.0
Tota
l10
,986
.618
,993
.669
8.8
611.
41,
098.
71,
899.
469
.961
.19,
887.
917
,094
.362
8.9
550.
338
1,05
638
.066
.09.
03.
014
,480
.125
,149
.73,
429.
51,
143.
214
,480
.125
,149
.73,
429.
51,
143.
20.
00.
00.
00.
02,
000
3.8
9.9
5.4
3.0
7.6
19.8
10.8
6.0
7.6
19.8
10.8
6.0
0.0
0.0
0.0
0.0
090
.0%
85.0
%40
.0%
0.0%
0.0
0.0
0.0
0.0
0.0
0.0
0.0
0.0
0.0
0.0
0.0
0.0
Tota
l14
,487
.725
,169
.53,
440.
31,
149.
214
,487
.725
,169
.53,
440.
31,
149.
20.
00.
00.
00.
01,
881
2306
.312
995.
216
2.1
115.
12,
306.
312
,995
.216
2.1
115.
10.
801,
845.
010
,396
.212
9.7
92.1
461.
32,
599.
032
.423
.00
0.0
0.0
0.0
0.0
0.0
0.0
0.0
0.0
0.80
0.0
0.0
0.0
0.0
0.0
0.0
0.0
0.0
Tota
l2,
306.
312
,995
.216
2.1
115.
11,
845.
010
,396
.212
9.7
92.1
461.
32,
599.
032
.423
.0To
tal
27,7
80.6
57,1
58.3
4,30
1.2
1,87
5.7
17,4
31.4
37,4
65.0
3,63
9.9
1,30
2.4
10,3
49.2
19,6
93.3
661.
457
3.3
Non
-Poi
ntFo
rest
9,75
70.
0057
0.01
150.
0022
70.
0000
621
432
.965
.813
.00.
30.
103.
36.
61.
30.
029
.659
.211
.70.
3Lo
adBu
ildin
g an
d Ro
ad75
,367
0.07
730.
1545
0.00
327
0.00
144
214
3,41
4.0
6,82
7.9
144.
363
.40.
301,
024.
22,
048.
443
.319
.02,
389.
84,
779.
510
1.0
44.4
Irrig
ated
Lan
d33
,030
0.04
460.
0892
0.00
828
0.00
075
214
660
3,52
7.4
7,05
4.9
654.
959
.50.
1035
2.7
705.
565
.55.
93,
174.
76,
349.
458
9.4
53.5
Non
-irrig
ated
Lan
d12
5,73
60.
0446
0.08
920.
0082
80.
0007
521
43,
287.
96,
575.
761
0.4
55.4
0.10
328.
865
7.6
61.0
5.5
2,95
9.1
5,91
8.2
549.
449
.9To
tal
10,2
62.1
20,5
24.3
1,42
2.6
178.
71,
709.
03,
418.
017
1.1
30.6
8,55
3.1
17,1
06.3
1,25
1.5
148.
1Ca
tle38
,857
0.00
440.
0217
0.00
242
0.00
042
214
36.7
180.
220
.13.
53.
718
.02.
00.
333
.116
2.2
18.1
3.1
Seep
and
Goa
t41
7,17
90.
0011
0.00
540.
0006
10.
0001
021
496
.748
3.6
54.3
9.3
9.7
48.4
5.4
0.9
87.0
435.
248
.98.
4To
tal
133.
466
3.7
74.4
12.8
13.3
66.4
7.4
1.3
120.
159
7.4
67.0
11.5
Tota
l10
,395
.621
,188
.01,
497.
019
1.4
1,72
2.4
3,48
4.4
178.
631
.88,
673.
217
,703
.71,
318.
415
9.6
38,1
76.2
78,3
46.4
5,79
8.2
2,06
7.1
19,1
53.8
40,9
49.4
3,81
8.4
1,33
4.2
19,0
22.4
37,3
97.0
1,97
9.8
732.
9Fl
ame:
Liv
ing
Syst
em (p
erso
n),
Sew
arag
e Sy
stem
(dis
char
ged
volu
me
or p
erso
n), I
ndus
try (d
isch
ared
vol
ume
(m3/
day)
), La
nd U
se S
yste
m (h
a), L
ive
Stoc
k (h
ead)
Poin
t-Loa
d/To
tal-L
oad
Infil
tratio
n/Ru
noff
Basi
c U
nit:
Livi
ng S
yste
m (g
/per
son/
day)
, Lan
d U
se (k
g/ha
/mm
), Li
ve S
tock
( (g/
head
/day
)/mm
)0.
910.
910.
950.
981.
00.
90.
50.
510
7,31
61.
2420
83R
ural
Dam
ascu
sD
isch
arge
Loa
d in
200
6 (k
g/da
y)B
OD
COD
T-N
T-P
BO
DCO
DT-
NT-
PB
OD
COD
T-N
T-P
BO
DCO
DT-
NT-
PPo
int
Sew
erag
e Sy
stem
1,60
9,12
5Lo
adPi
t Lat
rine
663,
949
23.9
41.3
1.5
1.3
15,8
42.1
27,3
87.9
1,00
7.5
881.
61,
584.
22,
738.
810
0.8
88.2
14,2
57.9
24,6
49.1
906.
879
3.5
Tour
ist
Hot
el G
uest
209
32.3
56.1
7.7
2.6
6.7
11.7
1.6
0.5
0.7
1.2
0.2
0.1
6.1
10.5
1.4
0.5
Tota
l15
,848
.927
,399
.61,
009.
188
2.2
1,58
4.9
2,74
0.0
100.
988
.214
,264
.024
,659
.690
8.2
794.
01,
278,
125
38.0
66.0
9.0
3.0
48,5
68.8
84,3
56.3
11,5
03.1
3,83
4.4
48,5
68.8
84,3
56.3
11,5
03.1
3,83
4.4
0.0
0.0
0.0
0.0
331,
000
3.8
9.9
5.4
3.0
1,25
7.8
3,27
6.9
1,78
7.4
993.
01,
257.
83,
276.
91,
787.
499
3.0
0.0
0.0
0.0
0.0
2,87
590
.0%
85.0
%40
.0%
0.0%
224.
11,
831.
589
.876
.522
4.1
1,83
1.5
89.8
76.5
0.0
0.0
0.0
0.0
Tota
l50
,050
.689
,464
.713
,380
.44,
903.
950
,050
.689
,464
.713
,380
.44,
903.
90.
00.
00.
00.
019
,689
15,3
47.0
83,6
31.2
1,02
5.6
524.
213
,106
.071
,421
.087
6.0
448.
00.
8010
,484
.857
,136
.870
0.8
358.
42,
621.
214
,284
.217
5.2
89.6
8,64
74,
474.
024
,842
.049
0.0
112.
04,
248.
023
,695
.044
8.0
104.
00.
803,
398.
418
,956
.035
8.4
83.2
849.
64,
739.
089
.620
.8To
tal
17,3
54.0
95,1
16.0
1,32
4.0
552.
013
,883
.276
,092
.81,
059.
244
1.6
3,47
0.8
19,0
23.2
264.
811
0.4
Tota
l83
,253
.521
1,98
0.3
15,7
13.5
6,33
8.1
65,5
18.7
168,
297.
414
,540
.55,
433.
717
,734
.843
,682
.81,
173.
090
4.4
Non
-Poi
ntFo
rest
57,2
490.
0057
0.01
150.
0022
70.
0000
611
110
0.1
200.
239
.51.
00.
1010
.020
.03.
90.
190
.118
0.1
35.5
0.9
Load
Build
ing
and
Road
73,7
690.
0773
0.15
450.
0032
70.
0014
411
11,
733.
23,
466.
573
.332
.20.
3052
0.0
1,03
9.9
22.0
9.7
1,21
3.3
2,42
6.5
51.3
22.5
Irrig
ated
Lan
d74
,583
0.04
460.
0892
0.00
828
0.00
075
111
990
10,0
33.9
20,0
67.9
1,86
2.8
169.
20.
101,
003.
42,
006.
818
6.3
16.9
9,03
0.5
18,0
61.1
1,67
6.5
152.
3N
on-ir
rigat
ed L
and
54,8
450.
0446
0.08
920.
0082
80.
0007
511
174
3.9
1,48
7.8
138.
112
.50.
1074
.414
8.8
13.8
1.3
669.
51,
339.
012
4.3
11.3
Tota
l12
,611
.125
,222
.32,
113.
721
4.9
1,60
7.8
3,21
5.5
226.
027
.911
,003
.422
,006
.71,
887.
618
7.0
Catle
187,
137
0.00
440.
0217
0.00
242
0.00
042
111
91.7
450.
150
.28.
79.
245
.05.
00.
982
.640
5.1
45.2
7.8
Seep
and
Goa
t1,
567,
629
0.00
110.
0054
0.00
061
0.00
010
111
188.
594
2.5
105.
918
.118
.994
.310
.61.
816
9.7
848.
395
.316
.3To
tal
280.
31,
392.
615
6.1
26.8
28.0
139.
315
.62.
725
2.2
1,25
3.3
140.
424
.1To
tal
12,8
91.4
26,6
14.9
2,26
9.7
241.
71,
635.
83,
354.
824
1.6
30.6
11,2
55.6
23,2
60.1
2,02
8.1
211.
196
,144
.923
8,59
5.2
17,9
83.2
6,57
9.8
67,1
54.5
171,
652.
214
,782
.15,
464.
328
,990
.466
,942
.93,
201.
11,
115.
5Fl
ame:
Liv
ing
Syst
em (p
erso
n),
Sew
arag
e Sy
stem
(dis
char
ged
volu
me
or p
erso
n), I
ndus
try (d
isch
ared
vol
ume
(m3/
day)
), La
nd U
se S
yste
m (h
a), L
ive
Stoc
k (h
ead)
Poin
t-Loa
d/To
tal-L
oad
Infil
tratio
n/Ru
noff
Basi
c U
nit:
Livi
ng S
yste
m (g
/per
son/
day)
, Lan
d U
se (k
g/ha
/mm
), Li
ve S
tock
( (g/
head
/day
)/mm
)0.
980.
980.
980.
990.
40.
40.
20.
2
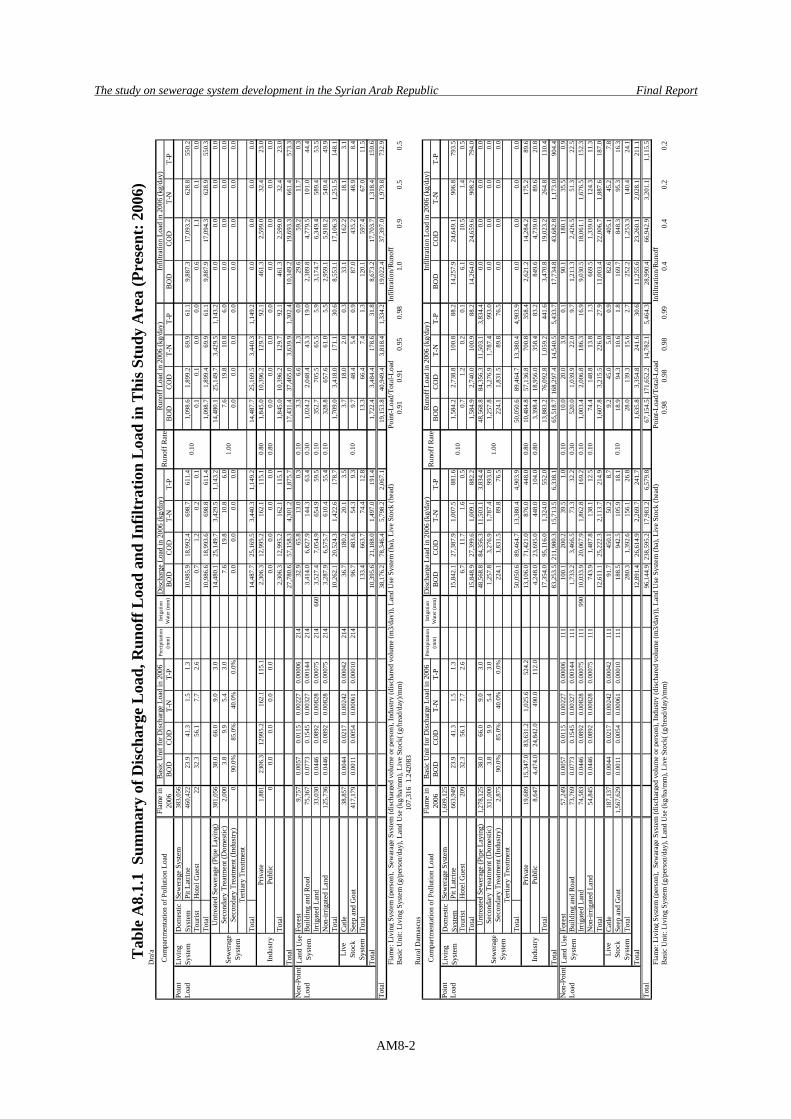
Tabl
e A
8.1.
1 S
umm
ary
of D
ischa
rge
Load
, Run
off L
oad
and
Infil
trat
ion
Load
in T
his S
tudy
Are
a (P
rese
nt: 2
006)
In
filtra
tion
Load
in 2
006
(kg/
day)
Infil
tratio
n Lo
ad in
200
6 (k
g/da
y)
0.10
Tota
l
Live
Stoc
kSy
stem
Indu
stry
Priv
ate
Publ
ic
Land
Use
Syst
em
Sew
erag
eSy
stem
Unt
reat
ed S
ewer
age
(Pip
e La
ying
)
1.00
Seco
ndar
y Tr
eatm
ent (
Dom
estic
)
Terti
ary
Trea
tmen
tSe
cond
ary
Trea
tmen
t (In
dust
ry)
Run
off L
oad
in 2
006
(kg/
day)
Livi
ngSy
stem
Dom
estic
S yst
em0.
10
0.10
Tota
l
Com
partm
enta
tion
of P
ollu
tion
Load
Flam
e in
2006
Basi
c U
nit f
or D
isch
arge
Loa
d in
200
6Pr
ecip
itatio
n(m
m)
Irrig
atio
nW
ater
(mm
)R
unof
f Rat
e
Live
Stoc
kSy
stem
Indu
stry
Priv
ate
Publ
ic
Land
Use
Syst
em
Sew
erag
eSy
stem
Unt
reat
ed S
ewer
age
(Pip
e La
ying
)
1.00
Seco
ndar
y Tr
eatm
ent (
Dom
estic
)
Terti
ary
Trea
tmen
tSe
cond
ary
Trea
tmen
t (In
dust
ry)
Irrig
atio
nW
ater
(mm
)R
unof
f Rat
eR
unof
f Loa
d in
200
6 (k
g/da
y)
Livi
ngSy
stem
Dom
estic
Syst
em0.
10
Com
partm
enta
tion
of P
ollu
tion
Load
Flam
e in
2006
Basi
c U
nit f
or D
isch
arge
Loa
d in
200
6Pr
ecip
itatio
n(m
m)
The study on sewerage system development in the Syrian Arab Republic Final Report
AM8-3
Dam
ascu
s City
Dis
char
ge L
oad
in 2
006
(kg/
day)
BO
DC
OD
T-N
T-P
BO
DC
OD
T-N
T-P
BO
DC
OD
T-N
T-P
BO
DC
OD
T-N
T-P
Poin
tSe
wer
a ge
Syst
em1,
552,
161
Load
Pit L
atrin
e0
23.9
41.3
1.5
1.3
0.0
0.0
0.0
0.0
0.0
0.0
0.0
0.0
0.0
0.0
0.0
0.0
Tour
ist
Hot
el G
uest
4,60
932
.356
.17.
72.
614
8.9
258.
535
.311
.814
.925
.93.
51.
213
4.0
232.
731
.710
.6To
tal
148.
925
8.5
35.3
11.8
14.9
25.9
3.5
1.2
134.
023
2.7
31.7
10.6
038
.066
.09.
03.
00.
00.
00.
00.
00.
00.
00.
00.
00.
00.
00.
00.
01,
552,
161
3.8
9.9
5.4
3.0
5,89
8.2
15,3
66.4
8,38
1.7
4,65
6.5
5,89
8.2
15,3
66.4
8,38
1.7
4,65
6.5
0.0
0.0
0.0
0.0
9,34
390
.0%
85.0
%40
.0%
0.0%
630.
45,
980.
034
2.9
178.
963
0.4
5,98
0.0
342.
917
8.9
0.0
0.0
0.0
0.0
Tota
l6,
528.
721
,346
.48,
724.
64,
835.
46,
528.
721
,346
.48,
724.
64,
835.
40.
00.
00.
00.
09,
343
6,30
4.4
39,8
66.8
571.
517
8.9
Con
nect
to se
war
age
syst
em w
ith tr
eatm
ent p
lant
0.80
0.0
0.0
0.0
0.0
0.0
0.0
0.0
0.0
6,69
82,
025.
016
,141
.026
9.0
80.0
606.
07,
777.
016
3.0
22.0
0.80
484.
86,
221.
613
0.4
17.6
121.
21,
555.
432
.64.
4To
tal
606.
07,
777.
016
3.0
22.0
484.
86,
221.
613
0.4
17.6
121.
21,
555.
432
.64.
4To
tal
7,28
3.5
29,3
82.0
8,92
2.8
4,86
9.1
7,02
8.3
27,5
93.9
8,85
8.5
4,85
4.2
255.
21,
788.
164
.315
.0N
on-P
oint
Fore
st1,
090
0.00
570.
0115
0.00
227
0.00
006
184
3.2
6.3
1.2
0.0
0.10
0.3
0.6
0.1
0.0
2.8
5.7
1.1
0.0
Load
Bui
ldin
g an
d R
oad
9,28
60.
0773
0.15
450.
0032
70.
0014
418
436
1.6
723.
315
.36.
70.
3010
8.5
217.
04.
62.
025
3.2
506.
310
.74.
7Irr
igat
ed L
and
1,41
10.
0446
0.08
920.
0082
80.
0007
518
499
020
2.4
404.
837
.63.
40.
1020
.240
.53.
80.
318
2.2
364.
333
.83.
1N
on-ir
rigat
ed L
and
00.
0446
0.08
920.
0082
80.
0007
518
40.
00.
00.
00.
00.
100.
00.
00.
00.
00.
00.
00.
00.
0To
tal
567.
21,
134.
454
.110
.212
9.1
258.
18.
52.
443
8.2
876.
345
.67.
8C
atle
19,0
200.
0044
0.02
170.
0024
20.
0004
218
415
.575
.88.
51.
51.
57.
60.
80.
113
.968
.27.
61.
3Se
ep a
nd G
oat
5,79
30.
0011
0.00
540.
0006
10.
0001
018
41.
25.
80.
60.
10.
10.
60.
10.
01.
05.
20.
60.
1To
tal
16.6
81.6
9.1
1.6
1.7
8.2
0.9
0.2
15.0
73.4
8.2
1.4
Tota
l58
3.8
1,21
6.0
63.2
11.7
130.
726
6.3
9.4
2.5
453.
194
9.8
53.8
9.2
7,86
7.3
30,5
98.0
8,98
6.0
4,88
0.9
7,15
9.1
27,8
60.1
8,86
7.9
4,85
6.7
708.
32,
737.
911
8.2
24.2
Flam
e: L
ivin
g Sy
stem
(per
son)
, Se
war
age
Syst
em (d
isch
arge
d vo
lum
e or
per
son)
, Ind
ustry
(dis
char
ed v
olum
e (m
3/da
y)),
Land
Use
Sys
tem
(ha)
, Liv
e St
ock
(hea
d)Po
int-L
oad/
Tota
l-Loa
dIn
filtra
tion/
Run
off
Bas
ic U
nit:
Livi
ng S
yste
m (g
/per
son/
day)
, Lan
d U
se (k
g/ha
/mm
), Li
ve S
tock
( (g/
head
/day
)/mm
)0.
980.
991.
001.
000.
10.
10.
010.
00
Tarto
usD
isch
arge
Loa
d in
200
6 (k
g/da
y)B
OD
CO
DT-
NT-
PB
OD
CO
DT-
NT-
PB
OD
CO
DT-
NT-
PB
OD
CO
DT-
NT-
PPo
int
Sew
era g
e Sy
stem
410,
048
Load
Pit L
atrin
e29
1,34
723
.941
.31.
51.
36,
951.
712
,018
.144
2.1
386.
969
5.2
1,20
1.8
44.2
38.7
6,25
6.5
10,8
16.3
397.
934
8.2
Tour
ist
Hot
el G
uest
454
32.3
56.1
7.7
2.6
14.6
3.5
1.2
1.5
0.0
0.3
0.1
13.2
0.0
3.1
1.0
Tota
l6,
966.
312
,018
.144
5.6
388.
069
6.6
1,20
1.8
44.6
38.8
6,26
9.7
10,8
16.3
401.
034
9.2
408,
178
38.0
66.0
9.0
3.0
15,5
10.8
26,9
39.7
3,67
3.6
1,22
4.5
15,5
10.8
26,9
39.7
3,67
3.6
1,22
4.5
0.0
0.0
0.0
0.0
1,87
03.
89.
95.
43.
07.
118
.510
.15.
67.
118
.510
.15.
60.
00.
00.
00.
00
90.0
%85
.0%
40.0
%0.
0%0.
00.
00.
00.
00.
00.
00.
00.
00.
00.
00.
00.
0
Tota
l15
,517
.926
,958
.33,
683.
71,
230.
115
,517
.926
,958
.33,
683.
71,
230.
10.
00.
00.
00.
01,
911
4,63
5.2
32,5
64.0
833.
974
5.6
4,63
5.2
32,5
64.0
833.
974
5.6
0.80
3,70
8.2
26,0
51.2
667.
159
6.5
927.
06,
512.
816
6.8
149.
111
93.
010
8.0
0.0
0.0
3.0
108.
00.
00.
00.
802.
486
.40.
00.
00.
621
.60.
00.
0To
tal
4,63
8.2
32,6
72.0
833.
974
5.6
3,71
0.6
26,1
37.6
667.
159
6.5
927.
66,
534.
416
6.8
149.
1To
tal
27,1
22.4
71,6
48.3
4,96
3.2
2,36
3.8
19,9
25.1
54,2
97.7
4,39
5.4
1,86
5.4
7,19
7.3
17,3
50.7
567.
849
8.3
Non
-Poi
ntFo
rest
32,3
640.
0057
0.01
150.
0022
70.
0000
680
240
8.8
817.
616
1.3
4.1
0.10
40.9
81.8
16.1
0.4
367.
973
5.8
145.
23.
7Lo
adB
uild
ing
and
Roa
d23
,506
0.07
730.
1545
0.00
327
0.00
144
802
3,99
0.3
7,98
0.6
168.
774
.10.
301,
197.
12,
394.
250
.622
.22,
793.
25,
586.
411
8.1
51.9
Irrig
ated
Lan
d27
,288
0.04
460.
0892
0.00
828
0.00
075
802
500
4,34
1.4
8,68
2.8
806.
073
.20.
1043
4.1
868.
380
.67.
33,
907.
37,
814.
572
5.4
65.9
Non
-irrig
ated
Lan
d95
,954
0.04
460.
0892
0.00
828
0.00
075
802
9,40
3.2
18,8
06.5
1,74
5.7
158.
60.
1094
0.3
1,88
0.6
174.
615
.98,
462.
916
,925
.81,
571.
114
2.7
Tota
l18
,143
.736
,287
.52,
881.
731
0.0
2,61
2.4
5,22
4.9
321.
945
.815
,531
.331
,062
.62,
559.
826
4.1
Cat
le44
,889
0.00
440.
0217
0.00
242
0.00
042
802
159.
078
0.0
87.0
15.0
15.9
78.0
8.7
1.5
143.
170
2.0
78.3
13.5
Seep
and
Goa
t26
,531
0.00
110.
0054
0.00
061
0.00
010
802
23.1
115.
312
.92.
22.
311
.51.
30.
220
.710
3.7
11.6
2.0
Tota
l18
2.1
182.
118
2.1
182.
118
.289
.510
.01.
716
3.9
805.
890
.015
.5To
tal
18,3
25.8
36,4
69.5
3,06
3.8
492.
02,
630.
65,
314.
433
1.9
47.5
15,6
95.1
31,8
68.3
2,64
9.7
279.
645
,448
.210
8,11
7.8
8,02
6.9
2,85
5.8
22,5
55.7
59,6
12.1
4,72
7.3
1,91
3.0
22,8
92.5
49,2
19.0
3,21
7.5
778.
0Fl
ame:
Liv
ing
Syst
em (p
erso
n),
Sew
arag
e Sy
stem
(dis
char
ged
volu
me
or p
erso
n), I
ndus
try (d
isch
ared
vol
ume
(m3/
day)
), La
nd U
se S
yste
m (h
a), L
ive
Stoc
k (h
ead)
Poin
t-Loa
d/To
tal-L
oad
Infil
tratio
n/R
unof
fB
asic
Uni
t: Li
ving
Sys
tem
(g/p
erso
n/da
y), L
and
Use
(kg/
ha/m
m),
Live
Sto
ck( (
g/he
ad/d
ay)/m
m)
0.88
0.91
0.93
0.98
1.0
0.8
0.7
0.4
87,6
7489
704.
281.
0382
44
Infil
tratio
n Lo
ad in
200
6 (k
g/da
y)
Infil
tratio
n Lo
ad in
200
6 (k
g/da
y)
0.10
Tota
l
Live
Stoc
kSy
stem
Indu
stry
Priv
ate
Publ
ic
Land
Use
Syst
em
Sew
erag
eSy
stem
Unt
reat
ed S
ewer
age
(Pip
e La
ying
)
1.00
Seco
ndar
y Tr
eatm
ent (
Dom
estic
)
Terti
ary
Trea
tmen
tSe
cond
ary
Trea
tmen
t (In
dust
ry)
Run
off L
oad
in 2
006
(kg/
day)
Livi
ngSy
stem
Dom
estic
Syst
em0.
10
0.10
Tota
l
Com
partm
enta
tion
of P
ollu
tion
Load
Flam
e in
2006
Bas
ic U
nit f
or D
isch
arge
Loa
d in
200
6Pr
ecip
itatio
n(m
m)
Irrig
atio
nW
ater
(mm
)R
unof
f Rat
e
Live
Stoc
kSy
stem
Indu
stry
Priv
ate
Publ
ic
Land
Use
Syst
em
Sew
erag
eSy
stem
Unt
reat
ed S
ewer
age
(Pip
e La
ying
)
1.00
Seco
ndar
y Tr
eatm
ent (
Dom
estic
)
Terti
ary
Trea
tmen
tSe
cond
ary
Trea
tmen
t (In
dust
ry)
Run
off L
oad
in 2
006
(kg/
day)
Livi
ngSy
stem
Dom
estic
Syst
em0.
10
Com
partm
enta
tion
of P
ollu
tion
Load
Flam
e in
2006
Bas
ic U
nit f
or D
isch
arge
Loa
d in
200
6Pr
ecip
itatio
n(m
m)
Irrig
atio
nW
ater
(mm
)R
unof
f Rat
e
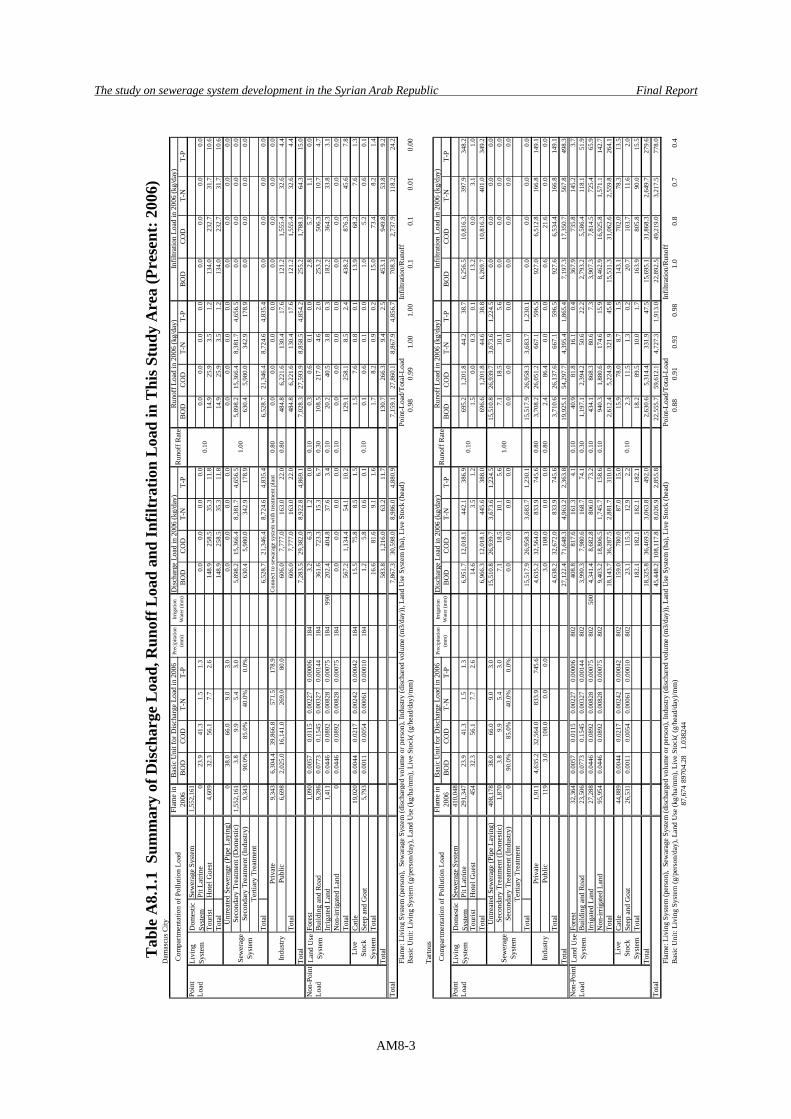
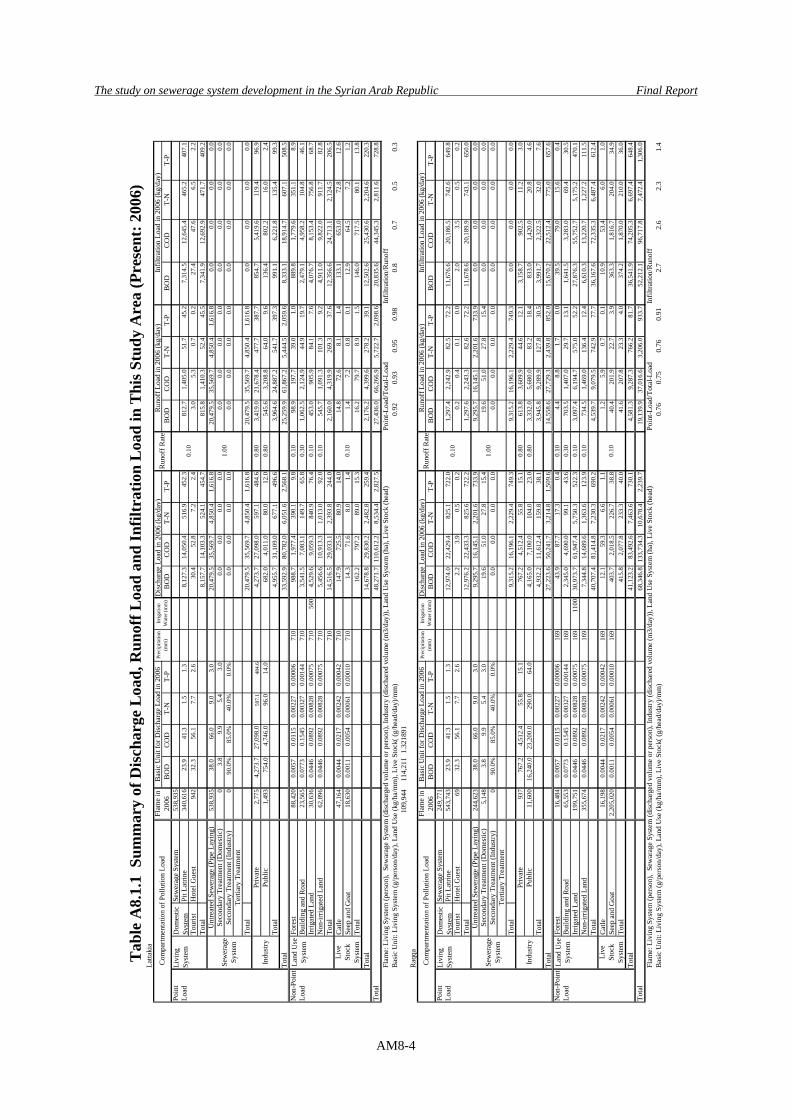
Tab
le A
8.1.
1 S
umm
ary
of D
isch
arge
Loa
d, R
unof
f Loa
d an
d In
filtr
atio
n L
oad
in T
his S
tudy
Are
a (P
rese
nt: 2
006)
The study on sewerage system development in the Syrian Arab Republic Final Report
AM8-4
Latta
kia
Dis
char
ge L
oad
in 2
006
(kg/
day)
BO
DC
OD
T-N
T-P
BO
DC
OD
T-N
T-P
BO
DC
OD
T-N
T-P
BO
DC
OD
T-N
T-P
Poin
tSe
wer
age
Syst
em53
8,93
5Lo
adPi
t Lat
rine
340,
616
23.9
41.3
1.5
1.3
8,12
7.3
14,0
50.4
516.
945
2.3
812.
71,
405.
051
.745
.27,
314.
512
,645
.446
5.2
407.
1To
uris
tH
otel
Gue
st94
232
.356
.17.
72.
630
.452
.87.
22.
43.
05.
30.
70.
227
.447
.66.
52.
2To
tal
8,15
7.7
14,1
03.3
524.
145
4.7
815.
81,
410.
352
.445
.57,
341.
912
,692
.947
1.7
409.
253
8,93
538
.066
.09.
03.
020
,479
.535
,569
.74,
850.
41,
616.
820
,479
.535
,569
.74,
850.
41,
616.
80.
00.
00.
00.
00
3.8
9.9
5.4
3.0
0.0
0.0
0.0
0.0
0.0
0.0
0.0
0.0
0.0
0.0
0.0
0.0
090
.0%
85.0
%40
.0%
0.0%
0.0
0.0
0.0
0.0
0.0
0.0
0.0
0.0
0.0
0.0
0.0
0.0
Tota
l20
,479
.535
,569
.74,
850.
41,
616.
820
,479
.535
,569
.74,
850.
41,
616.
80.
00.
00.
00.
02,
775
4,27
3.7
27,0
98.0
597.
148
4.6
4,27
3.7
27,0
98.0
597.
148
4.6
0.80
3,41
9.0
21,6
78.4
477.
738
7.7
854.
75,
419.
611
9.4
96.9
1,49
375
4.0
4,74
6.0
96.0
14.0
682.
04,
011.
080
.012
.00.
8054
5.6
3,20
8.8
64.0
9.6
136.
480
2.2
16.0
2.4
Tota
l4,
955.
731
,109
.067
7.1
496.
63,
964.
624
,887
.254
1.7
397.
399
1.1
6,22
1.8
135.
499
.3To
tal
33,5
92.9
80,7
82.0
6,05
1.6
2,56
8.1
25,2
59.9
61,8
67.2
5,44
4.5
2,05
9.6
8,33
3.1
18,9
14.7
607.
150
8.5
Non
-Poi
ntFo
rest
88,4
200.
0057
0.01
150.
0022
70.
0000
671
098
8.7
1,97
7.4
390.
19.
80.
1098
.919
7.7
39.0
1.0
889.
81,
779.
635
1.1
8.9
Load
Bui
ldin
g an
d R
oad
23,5
650.
0773
0.15
450.
0032
70.
0014
471
03,
541.
57,
083.
114
9.7
65.8
0.30
1,06
2.5
2,12
4.9
44.9
19.7
2,47
9.1
4,95
8.2
104.
846
.1Irr
igat
ed L
and
30,6
360.
0446
0.08
920.
0082
80.
0007
571
050
04,
529.
69,
059.
384
0.9
76.4
0.10
453.
090
5.9
84.1
7.6
4,07
6.7
8,15
3.4
756.
868
.7N
on-ir
rigat
ed L
and
62,8
960.
0446
0.08
920.
0082
80.
0007
571
05,
456.
610
,913
.31,
013.
092
.00.
1054
5.7
1,09
1.3
101.
39.
24,
911.
09,
822.
091
1.7
82.8
Tota
l71
014
,516
.529
,033
.12,
393.
824
4.0
2,16
0.0
4,31
9.9
269.
337
.612
,356
.624
,713
.12,
124.
520
6.5
Cat
le47
,164
0.00
440.
0217
0.00
242
0.00
042
710
147.
972
5.5
80.9
14.0
14.8
72.6
8.1
1.4
133.
165
3.0
72.8
12.6
Seep
and
Goa
t18
,630
0.00
110.
0054
0.00
061
0.00
010
710
14.3
71.6
8.0
1.4
1.4
7.2
0.8
0.1
12.9
64.5
7.2
1.2
Tota
l16
2.2
797.
289
.015
.316
.279
.78.
91.
514
6.0
717.
580
.113
.8To
tal
14,6
78.8
29,8
30.2
2,48
2.8
259.
42,
176.
24,
399.
627
8.2
39.1
12,5
02.6
25,4
30.6
2,20
4.6
220.
348
,271
.711
0,61
2.2
8,53
4.4
2,82
7.5
27,4
36.0
66,2
66.9
5,72
2.7
2,09
8.6
20,8
35.6
44,3
45.3
2,81
1.6
728.
8Fl
ame:
Liv
ing
Syst
em (p
erso
n),
Sew
arag
e Sy
stem
(dis
char
ged
volu
me
or p
erso
n), I
ndus
try (d
isch
ared
vol
ume
(m3/
day)
), La
nd U
se S
yste
m (h
a), L
ive
Stoc
k (h
ead)
Poin
t-Loa
d/To
tal-L
oad
Infil
tratio
n/R
unof
fB
asic
Uni
t: Li
ving
Sys
tem
(g/p
erso
n/da
y), L
and
Use
(kg/
ha/m
m),
Live
Sto
ck( (
g/he
ad/d
ay)/m
m)
0.92
0.93
0.95
0.98
0.8
0.7
0.5
0.3
109,
944
114,
211
1.32
1891
Raq
qaD
isch
arge
Loa
d in
200
6 (k
g/da
y)B
OD
CO
DT-
NT-
PB
OD
CO
DT-
NT-
PB
OD
CO
DT-
NT-
PB
OD
CO
DT-
NT-
PPo
int
Sew
erag
e Sy
stem
249,
771
Load
Pit L
atrin
e54
3,74
323
.941
.31.
51.
312
,974
.022
,429
.482
5.1
722.
01,
297.
42,
242.
982
.572
.211
,676
.620
,186
.574
2.6
649.
8To
uris
tH
otel
Gue
st69
32.3
56.1
7.7
2.6
2.2
3.9
0.5
0.2
0.2
0.4
0.1
0.0
2.0
3.5
0.5
0.2
Tota
l12
,976
.222
,433
.382
5.6
722.
21,
297.
62,
243.
382
.672
.211
,678
.620
,189
.974
3.1
650.
024
4,62
338
.066
.09.
03.
09,
295.
716
,145
.12,
201.
673
3.9
9,29
5.7
16,1
45.1
2,20
1.6
733.
90.
00.
00.
00.
05,
148
3.8
9.9
5.4
3.0
19.6
51.0
27.8
15.4
19.6
51.0
27.8
15.4
0.0
0.0
0.0
0.0
090
.0%
85.0
%40
.0%
0.0%
0.0
0.0
0.0
0.0
0.0
0.0
0.0
0.0
0.0
0.0
0.0
0.0
Tota
l9,
315.
216
,196
.12,
229.
474
9.3
9,31
5.2
16,1
96.1
2,22
9.4
749.
30.
00.
00.
00.
093
776
7.2
4,51
2.4
55.8
15.1
767.
24,
512.
455
.815
.10.
8061
3.8
3,60
9.9
44.6
12.1
3,15
8.7
902.
511
.23.
011
,600
16,2
40.0
23,2
00.0
290.
064
.04,
165.
07,
100.
010
4.0
23.0
0.80
3,33
2.0
5,68
0.0
83.2
18.4
833.
01,
420.
020
.84.
6To
tal
4,93
2.2
11,6
12.4
159.
838
.13,
945.
89,
289.
912
7.8
30.5
3,99
1.7
2,32
2.5
32.0
7.6
Tota
l27
,223
.650
,241
.73,
214.
81,
509.
614
,558
.627
,729
.32,
439.
885
2.0
15,6
70.2
22,5
12.4
775.
065
7.6
Non
-Poi
ntFo
rest
16,4
840.
0057
0.01
150.
0022
70.
0000
616
943
.987
.717
.30.
40.
104.
48.
81.
70.
039
.579
.015
.60.
4Lo
adB
uild
ing
and
Roa
d65
,553
0.07
730.
1545
0.00
327
0.00
144
169
2,34
5.0
4,69
0.0
99.1
43.6
0.30
703.
51,
407.
029
.713
.11,
641.
53,
283.
069
.430
.5Irr
igat
ed L
and
199,
751
0.04
460.
0892
0.00
828
0.00
075
169
1100
30,9
73.7
61,9
47.4
5,75
0.3
522.
30.
103,
097.
46,
194.
757
5.0
52.2
27,8
76.3
55,7
52.7
5,17
5.2
470.
1N
on-ir
rigat
ed L
and
355,
674
0.04
460.
0892
0.00
828
0.00
075
169
7,34
4.8
14,6
89.6
1,36
3.6
123.
90.
1073
4.5
1,46
9.0
136.
412
.46,
610.
313
,220
.71,
227.
211
1.5
Tota
l40
,707
.481
,414
.87,
230.
369
0.2
4,53
9.7
9,07
9.5
742.
977
.736
,167
.672
,335
.36,
487.
461
2.4
Cat
le16
,198
0.00
440.
0217
0.00
242
0.00
042
169
12.1
59.3
6.6
1.1
1.2
5.9
0.7
0.1
10.9
53.4
6.0
1.0
Seep
and
Goa
t2,
205,
020
0.00
110.
0054
0.00
061
0.00
010
169
403.
72,
018.
522
6.7
38.8
40.4
201.
922
.73.
936
3.3
1,81
6.7
204.
034
.9To
tal
415.
82,
077.
823
3.3
40.0
41.6
207.
823
.34.
037
4.2
1,87
0.0
210.
036
.0To
tal
41,1
23.2
83,4
92.6
7,46
3.6
730.
14,
581.
39,
287.
376
6.2
81.7
36,5
41.9
74,2
05.3
6,69
7.4
648.
468
,346
.813
3,73
4.3
10,6
78.4
2,23
9.7
19,1
39.9
37,0
16.6
3,20
6.0
933.
752
,212
.196
,717
.87,
472.
41,
306.
0Fl
ame:
Liv
ing
Syst
em (p
erso
n),
Sew
arag
e Sy
stem
(dis
char
ged
volu
me
or p
erso
n), I
ndus
try (d
isch
ared
vol
ume
(m3/
day)
), La
nd U
se S
yste
m (h
a), L
ive
Stoc
k (h
ead)
Poin
t-Loa
d/To
tal-L
oad
Infil
tratio
n/R
unof
fB
asic
Uni
t: Li
ving
Sys
tem
(g/p
erso
n/da
y), L
and
Use
(kg/
ha/m
m),
Live
Sto
ck( (
g/he
ad/d
ay)/m
m)
0.76
0.75
0.76
0.91
2.7
2.6
2.3
1.4
Infil
tratio
n Lo
ad in
200
6 (k
g/da
y)
Infil
tratio
n Lo
ad in
200
6 (k
g/da
y)
0.10
Tota
l
Live
Stoc
kSy
stem
Indu
stry
Priv
ate
Publ
ic
Land
Use
Syst
em
Sew
erag
eSy
stem
Unt
reat
ed S
ewer
age
(Pip
e La
ying
)
1.00
Seco
ndar
y Tr
eatm
ent (
Dom
estic
)
Terti
ary
Trea
tmen
tSe
cond
ary
Trea
tmen
t (In
dust
ry)
Run
off L
oad
in 2
006
(kg/
day)
Livi
ngSy
stem
Dom
estic
Syst
em0.
10
0.10
Tota
l
Com
partm
enta
tion
of P
ollu
tion
Load
Flam
e in
2006
Bas
ic U
nit f
or D
isch
arge
Loa
d in
200
6Pr
ecip
itatio
n(m
m)
Irrig
atio
nW
ater
(mm
)R
unof
f Rat
e
Live
Stoc
kSy
stem
Indu
stry
Priv
ate
Publ
ic
Land
Use
Syst
em
Sew
erag
eSy
stem
Unt
reat
ed S
ewer
age
(Pip
e La
ying
)
1.00
Seco
ndar
y Tr
eatm
ent (
Dom
estic
)
Terti
ary
Trea
tmen
tSe
cond
ary
Trea
tmen
t (In
dust
ry)
Run
off L
oad
in 2
006
(kg/
day)
Livi
ngSy
stem
Dom
estic
Syst
em0.
10
Com
partm
enta
tion
of P
ollu
tion
Load
Flam
e in
2006
Bas
ic U
nit f
or D
isch
arge
Loa
d in
200
6Pr
ecip
itatio
n(m
m)
Irrig
atio
nW
ater
(mm
)R
unof
f Rat
e
Tab
le A
8.1.
1 S
umm
ary
of D
isch
arge
Loa
d, R
unof
f Loa
d an
d In
filtr
atio
n L
oad
in T
his S
tudy
Are
a (P
rese
nt: 2
006)
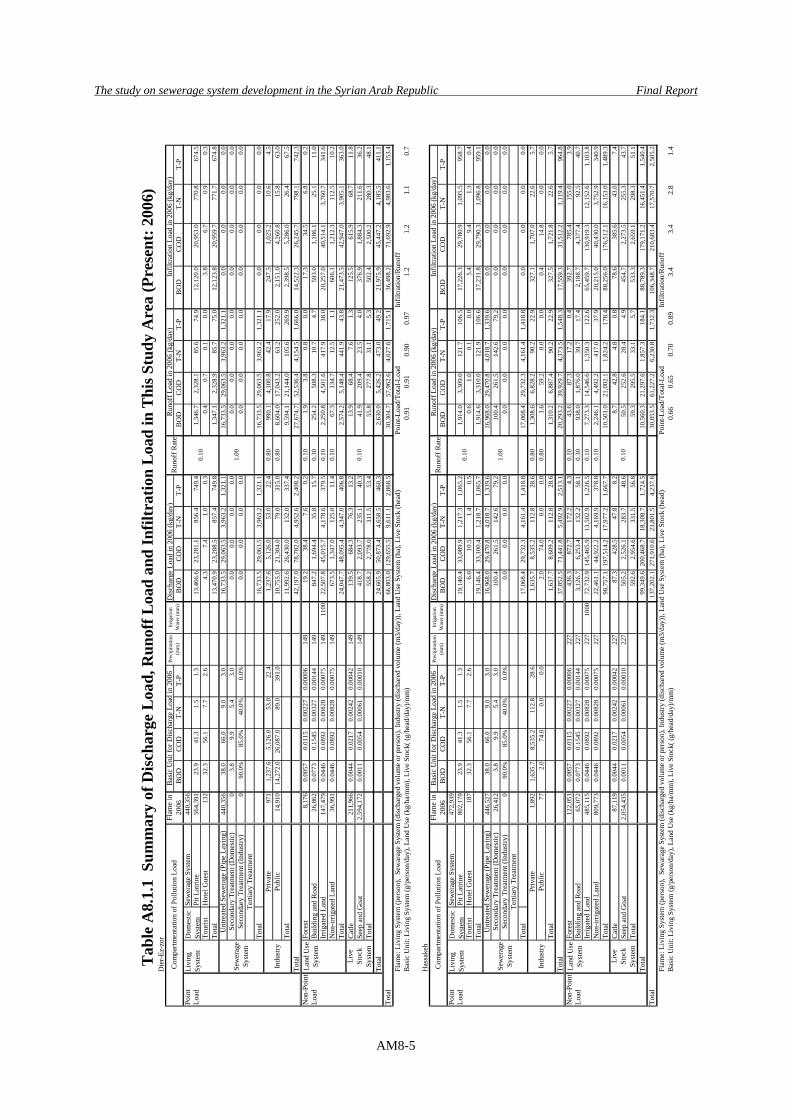
The study on sewerage system development in the Syrian Arab Republic Final Report
AM8-5
Die
r-Ez
-zor
Dis
char
ge L
oad
in 2
006
(kg/
day)
BO
DC
OD
T-N
T-P
BO
DC
OD
T-N
T-P
BO
DC
OD
T-N
T-P
BO
DC
OD
T-N
T-P
Poin
tSe
wer
age
Syst
em44
0,35
6Lo
adPi
t Lat
rine
564,
391
23.9
41.3
1.5
1.3
13,4
66.6
23,2
81.1
856.
474
9.4
1,34
6.7
2,32
8.1
85.6
74.9
12,1
20.0
20,9
53.0
770.
867
4.5
Tour
ist
Hot
el G
uest
132
32.3
56.1
7.7
2.6
4.3
7.4
1.0
0.3
0.4
0.7
0.1
0.0
3.8
6.7
0.9
0.3
Tota
l13
,470
.923
,288
.585
7.4
749.
81,
347.
12,
328.
985
.775
.012
,123
.820
,959
.777
1.7
674.
844
0,35
638
.066
.09.
03.
016
,733
.529
,063
.53,
963.
21,
321.
116
,733
.529
,063
.53,
963.
21,
321.
10.
00.
00.
00.
00
3.8
9.9
5.4
3.0
0.0
0.0
0.0
0.0
0.0
0.0
0.0
0.0
0.0
0.0
0.0
0.0
090
.0%
85.0
%40
.0%
0.0%
0.0
0.0
0.0
0.0
0.0
0.0
0.0
0.0
0.0
0.0
0.0
0.0
Tota
l16
,733
.529
,063
.53,
963.
21,
321.
116
,733
.529
,063
.53,
963.
21,
321.
10.
00.
00.
00.
097
11,
237.
65,
126.
053
.022
.41,
237.
65,
126.
053
.022
.40.
8099
0.1
4,10
0.8
42.4
17.9
247.
51,
025.
210
.64.
514
,910
14,2
72.0
26,0
87.0
89.0
391.
010
,755
.021
,304
.079
.031
5.0
0.80
8,60
4.0
17,0
43.2
63.2
252.
02,
151.
04,
260.
815
.863
.0To
tal
11,9
92.6
26,4
30.0
132.
033
7.4
9,59
4.1
21,1
44.0
105.
626
9.9
2,39
8.5
5,28
6.0
26.4
67.5
Tota
l42
,197
.078
,782
.04,
952.
62,
408.
227
,674
.752
,536
.44,
154.
51,
666.
014
,522
.326
,245
.779
8.1
742.
3N
on-P
oint
Fore
st8,
176
0.00
570.
0115
0.00
227
0.00
006
149
19.2
38.4
7.6
0.2
0.10
1.9
3.8
0.8
0.0
17.3
34.5
6.8
0.2
Load
Bui
ldin
g an
d R
oad
26,8
620.
0773
0.15
450.
0032
70.
0014
414
984
7.2
1,69
4.4
35.8
15.7
0.30
254.
250
8.3
10.7
4.7
593.
01,
186.
125
.111
.0Irr
igat
ed L
and
147,
479
0.04
460.
0892
0.00
828
0.00
075
149
1100
22,5
07.8
45,0
15.7
4,17
8.6
379.
50.
102,
250.
84,
501.
641
7.9
38.0
20,2
57.0
40,5
14.1
3,76
0.7
341.
6N
on-ir
rigat
ed L
and
36,9
910.
0446
0.08
920.
0082
80.
0007
514
967
3.5
1,34
7.0
125.
011
.40.
1067
.313
4.7
12.5
1.1
606.
11,
212.
311
2.5
10.2
Tota
l24
,047
.748
,095
.44,
347.
040
6.8
2,57
4.2
5,14
8.4
441.
943
.821
,473
.542
,947
.03,
905.
136
3.0
Cat
le21
1,96
60.
0044
0.02
170.
0024
20.
0004
214
913
9.5
684.
376
.313
.213
.968
.47.
61.
312
5.5
615.
968
.711
.8Se
ep a
nd G
oat
2,59
4,17
20.
0011
0.00
540.
0006
10.
0001
014
941
8.7
2,09
3.7
235.
140
.341
.920
9.4
23.5
4.0
376.
91,
884.
321
1.6
36.2
Tota
l55
8.2
2,77
8.0
311.
553
.455
.827
7.8
31.1
5.3
502.
42,
500.
228
0.3
48.1
Tota
l24
,605
.950
,873
.44,
658.
546
0.3
2,63
0.0
5,42
6.2
473.
049
.221
,975
.945
,447
.24,
185.
541
1.1
66,8
03.0
129,
655.
59,
611.
12,
868.
530
,304
.757
,962
.64,
627.
61,
715.
136
,498
.271
,692
.94,
983.
61,
153.
4Fl
ame:
Liv
ing
Syst
em (p
erso
n),
Sew
arag
e Sy
stem
(dis
char
ged
volu
me
or p
erso
n), I
ndus
try (d
isch
ared
vol
ume
(m3/
day)
), La
nd U
se S
yste
m (h
a), L
ive
Stoc
k (h
ead)
Poin
t-Loa
d/To
tal-L
oad
Infil
tratio
n/R
unof
fB
asic
Uni
t: Li
ving
Sys
tem
(g/p
erso
n/da
y), L
and
Use
(kg/
ha/m
m),
Live
Sto
ck( (
g/he
ad/d
ay)/m
m)
0.91
0.91
0.90
0.97
1.2
1.2
1.1
0.7
Has
sake
hD
isch
arge
Loa
d in
200
6 (k
g/da
y)B
OD
CO
DT-
NT-
PB
OD
CO
DT-
NT-
PB
OD
CO
DT-
NT-
PB
OD
CO
DT-
NT-
PPo
int
Sew
erag
e Sy
stem
472,
939
Load
Pit L
atrin
e80
2,17
923
.941
.31.
51.
319
,140
.433
,089
.91,
217.
31,
065.
21,
914.
03,
309.
012
1.7
106.
517
,226
.329
,780
.91,
095.
595
8.7
Tour
ist
Hot
el G
uest
187
32.3
56.1
7.7
2.6
6.0
10.5
1.4
0.5
0.6
1.0
0.1
0.0
5.4
9.4
1.3
0.4
Tota
l19
,146
.433
,100
.41,
218.
71,
065.
71,
914.
63,
310.
012
1.9
106.
617
,231
.829
,790
.31,
096.
895
9.1
446,
527
38.0
66.0
9.0
3.0
16,9
68.0
29,4
70.8
4,01
8.7
1,33
9.6
16,9
68.0
29,4
70.8
4,01
8.7
1,33
9.6
0.0
0.0
0.0
0.0
26,4
123.
89.
95.
43.
010
0.4
261.
514
2.6
79.2
100.
426
1.5
142.
679
.20.
00.
00.
00.
00
90.0
%85
.0%
40.0
%0.
0%0.
00.
00.
00.
00.
00.
00.
00.
00.
00.
00.
00.
0
Tota
l17
,068
.429
,732
.34,
161.
41,
418.
817
,068
.429
,732
.34,
161.
41,
418.
80.
00.
00.
00.
01,
892
1,63
5.7
8,53
5.2
112.
828
.61,
635.
78,
535.
211
2.8
28.6
0.80
1,30
8.6
6,82
8.2
90.2
22.9
327.
11,
707.
022
.65.
777
2.0
74.0
0.0
0.0
2.0
74.0
0.0
0.0
0.80
1.6
59.2
0.0
0.0
0.4
14.8
0.0
0.0
Tota
l1,
637.
78,
609.
211
2.8
28.6
1,31
0.2
6,88
7.4
90.2
22.9
327.
51,
721.
822
.65.
7To
tal
37,8
52.5
71,4
41.8
5,49
2.9
2,51
3.1
20,2
93.2
39,9
29.7
4,37
3.5
1,54
8.3
17,5
59.3
31,5
12.2
1,11
9.4
964.
8N
on-P
oint
Fore
st12
2,05
10.
0057
0.01
150.
0022
70.
0000
622
743
6.3
872.
717
2.2
4.3
0.10
43.6
87.3
17.2
0.4
392.
778
5.4
155.
03.
9Lo
adB
uild
ing
and
Roa
d65
,072
0.07
730.
1545
0.00
327
0.00
144
227
3,12
6.7
6,25
3.4
132.
258
.10.
3093
8.0
1,87
6.0
39.7
17.4
2,18
8.7
4,37
7.4
92.5
40.7
Irrig
ated
Lan
d48
5,11
50.
0446
0.08
920.
0082
80.
0007
522
710
0072
,732
.914
5,46
5.9
13,5
02.9
1,22
6.5
0.10
7,27
3.3
14,5
46.6
1,35
0.3
122.
665
,459
.713
0,91
9.3
12,1
52.6
1,10
3.8
Non
-irrig
ated
Lan
d80
9,77
30.
0446
0.08
920.
0082
80.
0007
522
722
,461
.144
,922
.24,
169.
937
8.8
0.10
2,24
6.1
4,49
2.2
417.
037
.920
,215
.040
,430
.03,
752.
934
0.9
Tota
l98
,757
.119
7,51
4.2
17,9
77.2
1,66
7.7
10,5
01.0
21,0
02.1
1,82
4.2
178.
488
,256
.017
6,51
2.1
16,1
53.0
1,48
9.3
Cat
le87
,119
0.00
440.
0217
0.00
242
0.00
042
227
87.3
428.
547
.88.
28.
742
.84.
80.
878
.638
5.6
43.0
7.4
Seep
and
Goa
t2,
054,
435
0.00
110.
0054
0.00
061
0.00
010
227
505.
22,
526.
128
3.7
48.6
50.5
252.
628
.44.
945
4.7
2,27
3.5
255.
343
.7To
tal
592.
62,
954.
633
1.5
56.8
59.3
295.
533
.15.
753
3.3
2,65
9.1
298.
351
.1To
tal
99,3
49.6
200,
468.
718
,308
.71,
724.
510
,560
.321
,297
.61,
857.
318
4.1
88,7
89.3
179,
171.
216
,451
.41,
540.
413
7,20
2.1
271,
910.
623
,801
.54,
237.
630
,853
.561
,227
.26,
230.
81,
732.
310
6,34
8.7
210,
683.
417
,570
.72,
505.
2Fl
ame:
Liv
ing
Syst
em (p
erso
n),
Sew
arag
e Sy
stem
(dis
char
ged
volu
me
or p
erso
n), I
ndus
try (d
isch
ared
vol
ume
(m3/
day)
), La
nd U
se S
yste
m (h
a), L
ive
Stoc
k (h
ead)
Poin
t-Loa
d/To
tal-L
oad
Infil
tratio
n/R
unof
fB
asic
Uni
t: Li
ving
Sys
tem
(g/p
erso
n/da
y), L
and
Use
(kg/
ha/m
m),
Live
Sto
ck( (
g/he
ad/d
ay)/m
m)
0.66
0.65
0.70
0.89
3.4
3.4
2.8
1.4
Infil
tratio
n Lo
ad in
200
6 (k
g/da
y)
Infil
tratio
n Lo
ad in
200
6 (k
g/da
y)
0.10
Tota
l
Live
Stoc
kSy
stem
Indu
stry
Priv
ate
Publ
ic
Land
Use
Syst
em
Sew
erag
eSy
stem
Unt
reat
ed S
ewer
age
(Pip
e La
ying
)
1.00
Seco
ndar
y Tr
eatm
ent (
Dom
estic
)
Terti
ary
Trea
tmen
tSe
cond
ary
Trea
tmen
t (In
dust
ry)
Run
off L
oad
in 2
006
(kg/
day)
Livi
ngSy
stem
Dom
estic
Syst
em0.
10
0.10
Tota
l
Com
partm
enta
tion
of P
ollu
tion
Load
Flam
e in
2006
Bas
ic U
nit f
or D
isch
arge
Loa
d in
200
6Pr
ecip
itatio
n(m
m)
Irrig
atio
nW
ater
(mm
)R
unof
f Rat
e
Live
Stoc
kSy
stem
Indu
stry
Priv
ate
Publ
ic
Land
Use
Syst
em
Sew
erag
eSy
stem
Unt
reat
ed S
ewer
age
(Pip
e La
ying
)
1.00
Seco
ndar
y Tr
eatm
ent (
Dom
estic
)
Terti
ary
Trea
tmen
tSe
cond
ary
Trea
tmen
t (In
dust
ry)
Run
off L
oad
in 2
006
(kg/
day)
Livi
ngSy
stem
Dom
estic
Syst
em0.
10
Com
partm
enta
tion
of P
ollu
tion
Load
Flam
e in
2006
Bas
ic U
nit f
or D
isch
arge
Loa
d in
200
6Pr
ecip
itatio
n(m
m)
Irrig
atio
nW
ater
(mm
)R
unof
f Rat
e
Tab
le A
8.1.
1 S
umm
ary
of D
isch
arge
Loa
d, R
unof
f Loa
d an
d In
filtr
atio
n L
oad
in T
his S
tudy
Are
a (P
rese
nt: 2
006)
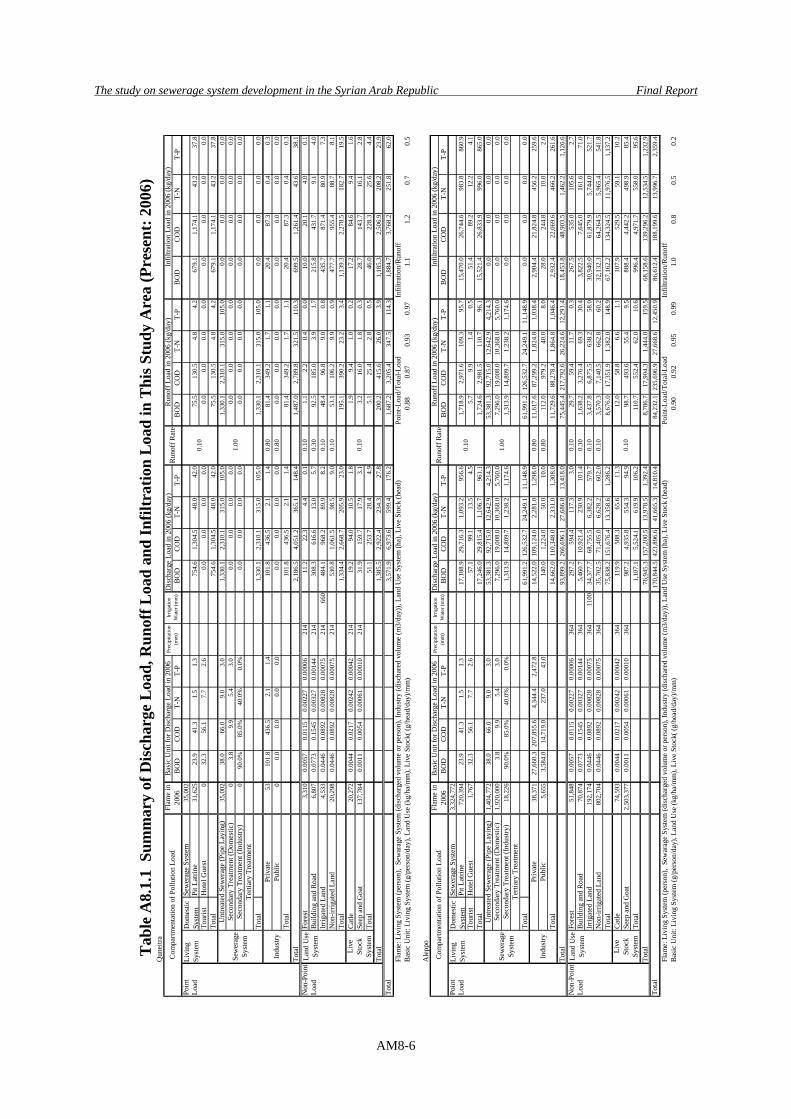
The study on sewerage system development in the Syrian Arab Republic Final Report
AM8-6
Qun
eitra
Dis
char
ge L
oad
in 2
006
(kg/
day)
BO
DCO
DT-
NT-
PB
OD
COD
T-N
T-P
BO
DCO
DT-
NT-
PB
OD
COD
T-N
T-P
Poin
tSe
wer
age
Syst
em35
,002
Load
Pit L
atrin
e31
,625
23.9
41.3
1.5
1.3
754.
61,
304.
548
.042
.075
.513
0.5
4.8
4.2
679.
11,
174.
143
.237
.8To
uris
tH
otel
Gue
st0
32.3
56.1
7.7
2.6
0.0
0.0
0.0
0.0
0.0
0.0
0.0
0.0
0.0
0.0
0.0
0.0
Tota
l75
4.6
1,30
4.5
48.0
42.0
75.5
130.
54.
84.
267
9.1
1,17
4.1
43.2
37.8
35,0
0238
.066
.09.
03.
01,
330.
12,
310.
131
5.0
105.
01,
330.
12,
310.
131
5.0
105.
00.
00.
00.
00.
00
3.8
9.9
5.4
3.0
0.0
0.0
0.0
0.0
0.0
0.0
0.0
0.0
0.0
0.0
0.0
0.0
090
.0%
85.0
%40
.0%
0.0%
0.0
0.0
0.0
0.0
0.0
0.0
0.0
0.0
0.0
0.0
0.0
0.0
Tota
l1,
330.
12,
310.
131
5.0
105.
01,
330.
12,
310.
131
5.0
105.
00.
00.
00.
00.
053
101.
843
6.5
2.1
1.4
101.
843
6.5
2.1
1.4
0.80
81.4
349.
21.
71.
120
.487
.30.
40.
30
0.0
0.0
0.0
0.0
0.0
0.0
0.0
0.0
0.80
0.0
0.0
0.0
0.0
0.0
0.0
0.0
0.0
Tota
l10
1.8
436.
52.
11.
481
.434
9.2
1.7
1.1
20.4
87.3
0.4
0.3
Tota
l2,
186.
54,
051.
236
5.1
148.
41,
487.
02,
789.
832
1.5
110.
369
9.5
1,26
1.4
43.6
38.1
Non
-Poi
ntFo
rest
3,31
00.
0057
0.01
150.
0022
70.
0000
621
411
.222
.34.
40.
10.
101.
12.
20.
40.
010
.020
.14.
00.
1Lo
adBu
ildin
g an
d Ro
ad6,
807
0.07
730.
1545
0.00
327
0.00
144
214
308.
361
6.6
13.0
5.7
0.30
92.5
185.
03.
91.
721
5.8
431.
79.
14.
0Irr
igat
ed L
and
4,53
30.
0446
0.08
920.
0082
80.
0007
521
466
048
4.1
968.
289
.98.
20.
1048
.496
.89.
00.
843
5.7
871.
480
.97.
3N
on-ir
rigat
ed L
and
20,2
980.
0446
0.08
920.
0082
80.
0007
521
453
0.8
1,06
1.5
98.5
9.0
0.10
53.1
106.
29.
90.
947
7.7
955.
488
.78.
1To
tal
1,33
4.4
2,66
8.7
205.
923
.019
5.1
390.
223
.23.
41,
139.
32,
278.
518
2.7
19.5
Catle
20,2
720.
0044
0.02
170.
0024
20.
0004
221
419
.294
.010
.51.
81.
99.
41.
00.
217
.284
.69.
41.
6Se
ep a
nd G
oat
137,
784
0.00
110.
0054
0.00
061
0.00
010
214
31.9
159.
717
.93.
13.
216
.01.
80.
328
.714
3.7
16.1
2.8
Tota
l51
.125
3.7
28.4
4.9
5.1
25.4
2.8
0.5
46.0
228.
325
.64.
4To
tal
1,38
5.5
2,92
2.4
234.
327
.820
0.2
415.
626
.03.
91,
185.
32,
506.
920
8.2
23.9
3,57
1.9
6,97
3.6
599.
417
6.2
1,68
7.2
3,20
5.4
347.
511
4.3
1,88
4.7
3,76
8.2
251.
862
.0Fl
ame:
Liv
ing
Syst
em (p
erso
n),
Sew
arag
e Sy
stem
(dis
char
ged
volu
me
or p
erso
n), I
ndus
try (d
isch
ared
vol
ume
(m3/
day)
), La
nd U
se S
yste
m (h
a), L
ive
Stoc
k (h
ead)
Poin
t-Loa
d/To
tal-L
oad
Infil
tratio
n/Ru
noff
Basi
c U
nit:
Livi
ng S
yste
m (g
/per
son/
day)
, Lan
d U
se (k
g/ha
/mm
), Li
ve S
tock
( (g/
head
/day
)/mm
)0.
880.
870.
930.
971.
11.
20.
70.
5
Ale
ppo
Dis
char
ge L
oad
in 2
006
(kg/
day)
BO
DCO
DT-
NT-
PB
OD
COD
T-N
T-P
BO
DCO
DT-
NT-
PB
OD
COD
T-N
T-P
Poin
tSe
wer
age
Syst
em3,
324,
772
Load
Pit L
atrin
e72
0,39
423
.941
.31.
51.
317
,188
.929
,716
.31,
093.
295
6.6
1,71
8.9
2,97
1.6
109.
395
.715
,470
.026
,744
.698
3.8
860.
9To
uris
tH
otel
Gue
st1,
767
32.3
56.1
7.7
2.6
57.1
99.1
13.5
4.5
5.7
9.9
1.4
0.5
51.4
89.2
12.2
4.1
Tota
l17
,246
.029
,815
.41,
106.
796
1.1
1,72
4.6
2,98
1.5
110.
796
.115
,521
.426
,833
.999
6.0
865.
01,
404,
772
38.0
66.0
9.0
3.0
53,3
81.3
92,7
15.0
12,6
42.9
4,21
4.3
53,3
81.3
92,7
15.0
12,6
42.9
4,21
4.3
0.0
0.0
0.0
0.0
1,92
0,00
03.
89.
95.
43.
07,
296.
019
,008
.010
,368
.05,
760.
07,
296.
019
,008
.010
,368
.05,
760.
00.
00.
00.
00.
018
,226
90.0
%85
.0%
40.0
%0.
0%1,
313.
914
,809
.71,
238.
21,
174.
61,
313.
914
,809
.71,
238.
21,
174.
60.
00.
00.
00.
0
Tota
l61
,991
.212
6,53
2.7
24,2
49.1
11,1
48.9
61,9
91.2
126,
532.
724
,249
.111
,148
.90.
00.
00.
00.
038
,371
27,6
60.3
207,
855.
64,
344.
42,
472.
814
,522
.010
9,12
4.0
2,28
1.0
1,29
8.0
0.80
11,6
17.6
87,2
99.2
1,82
4.8
1,03
8.4
2,90
4.4
21,8
24.8
456.
225
9.6
5,65
53,
584.
014
,719
.023
7.0
43.0
140.
01,
224.
050
.010
.00.
8011
2.0
979.
240
.08.
028
.024
4.8
10.0
2.0
Tota
l14
,662
.011
0,34
8.0
2,33
1.0
1,30
8.0
11,7
29.6
88,2
78.4
1,86
4.8
1,04
6.4
2,93
2.4
22,0
69.6
466.
226
1.6
Tota
l93
,899
.226
6,69
6.1
27,6
86.8
13,4
18.0
75,4
45.4
217,
792.
626
,224
.612
,291
.418
,453
.848
,903
.51,
462.
21,
126.
6N
on-P
oint
Fore
st51
,848
0.00
570.
0115
0.00
227
0.00
006
364
297.
259
4.4
117.
33.
00.
1029
.759
.411
.70.
326
7.5
535.
010
5.6
2.7
Load
Build
ing
and
Road
70,8
740.
0773
0.15
450.
0032
70.
0014
436
45,
460.
710
,921
.423
0.9
101.
40.
301,
638.
23,
276.
469
.330
.43,
822.
57,
645.
016
1.6
71.0
Irrig
ated
Lan
d19
2,17
40.
0446
0.08
920.
0082
80.
0007
536
411
0034
,377
.768
,755
.56,
382.
257
9.7
0.10
3,43
7.8
6,87
5.5
638.
258
.030
,940
.061
,879
.95,
744.
052
1.7
Non
-irrig
ated
Lan
d80
2,70
40.
0446
0.08
920.
0082
80.
0007
536
435
,702
.571
,405
.06,
628.
260
2.0
0.10
3,57
0.3
7,14
0.5
662.
860
.232
,132
.364
,264
.55,
965.
454
1.8
Tota
l75
,838
.215
1,67
6.4
13,3
58.6
1,28
6.2
8,67
6.0
17,3
51.9
1,38
2.0
148.
967
,162
.213
4,32
4.5
11,9
76.5
1,13
7.2
Catle
74,5
930.
0044
0.02
170.
0024
20.
0004
236
411
9.9
588.
365
.611
.312
.058
.86.
61.
110
7.9
529.
559
.110
.2Se
ep a
nd G
oat
2,50
3,37
70.
0011
0.00
540.
0006
10.
0001
036
498
7.2
4,93
5.8
554.
394
.998
.749
3.6
55.4
9.5
888.
44,
442.
249
8.9
85.4
Tota
l1,
107.
15,
524.
161
9.9
106.
211
0.7
552.
462
.010
.699
6.4
4,97
1.7
558.
095
.6To
tal
76,9
45.3
157,
200.
513
,978
.51,
392.
48,
786.
717
,904
.31,
444.
015
9.5
68,1
58.6
139,
296.
212
,534
.51,
232.
917
0,84
4.5
423,
896.
641
,665
.314
,810
.484
,232
.123
5,69
6.9
27,6
68.6
12,4
50.9
86,6
12.4
188,
199.
613
,996
.72,
359.
4Fl
ame:
Liv
ing
Syst
em (p
erso
n),
Sew
arag
e Sy
stem
(dis
char
ged
volu
me
or p
erso
n), I
ndus
try (d
isch
ared
vol
ume
(m3/
day)
), La
nd U
se S
yste
m (h
a), L
ive
Stoc
k (h
ead)
Poin
t-Loa
d/To
tal-L
oad
Infil
tratio
n/Ru
noff
Basi
c U
nit:
Livi
ng S
yste
m (g
/per
son/
day)
, Lan
d U
se (k
g/ha
/mm
), Li
ve S
tock
( (g/
head
/day
)/mm
)0.
900.
920.
950.
991.
00.
80.
50.
2
Infil
tratio
n Lo
ad in
200
6 (k
g/da
y)
Infil
tratio
n Lo
ad in
200
6 (k
g/da
y)
Land
Use
Syst
em
0.10
Tota
l
Indu
stry
Priv
ate
Publ
ic
Live
Stoc
kSy
stem
Sew
erag
eSy
stem
Unt
reat
ed S
ewer
age
(Pip
e La
ying
)
1.00
Seco
ndar
y Tr
eatm
ent (
Dom
estic
)
Terti
ary
Trea
tmen
tSe
cond
ary
Trea
tmen
t (In
dust
ry)
Run
off L
oad
in 2
006
(kg/
day)
Livi
ngSy
stem
Dom
estic
S yst
em0.
10
0.10
Tota
l
Com
partm
enta
tion
of P
ollu
tion
Load
Flam
e in
2006
Basi
c U
nit f
or D
isch
arge
Loa
d in
200
6Pr
ecip
itatio
n(m
m)
Irrig
atio
nW
ater
(mm
)R
unof
f Rat
e
Live
Stoc
kSy
stem
Indu
stry
Priv
ate
Publ
ic
Land
Use
Syst
em
Sew
erag
eSy
stem
Unt
reat
ed S
ewer
age
(Pip
e La
ying
)
1.00
Seco
ndar
y Tr
eatm
ent (
Dom
estic
)
Terti
ary
Trea
tmen
tSe
cond
ary
Trea
tmen
t (In
dust
ry)
Run
off L
oad
in 2
006
(kg/
day)
Livi
ngSy
stem
Dom
estic
Syst
em0.
10
Com
partm
enta
tion
of P
ollu
tion
Load
Flam
e in
2006
Basi
c U
nit f
or D
isch
arge
Loa
d in
200
6Pr
ecip
itatio
n(m
m)
Irrig
atio
nW
ater
(mm
)R
unof
f Rat
e
Tabl
e A
8.1.
1 S
umm
ary
of D
ischa
rge
Load
, Run
off L
oad
and
Infil
trat
ion
Load
in T
his S
tudy
Are
a (P
rese
nt: 2
006)
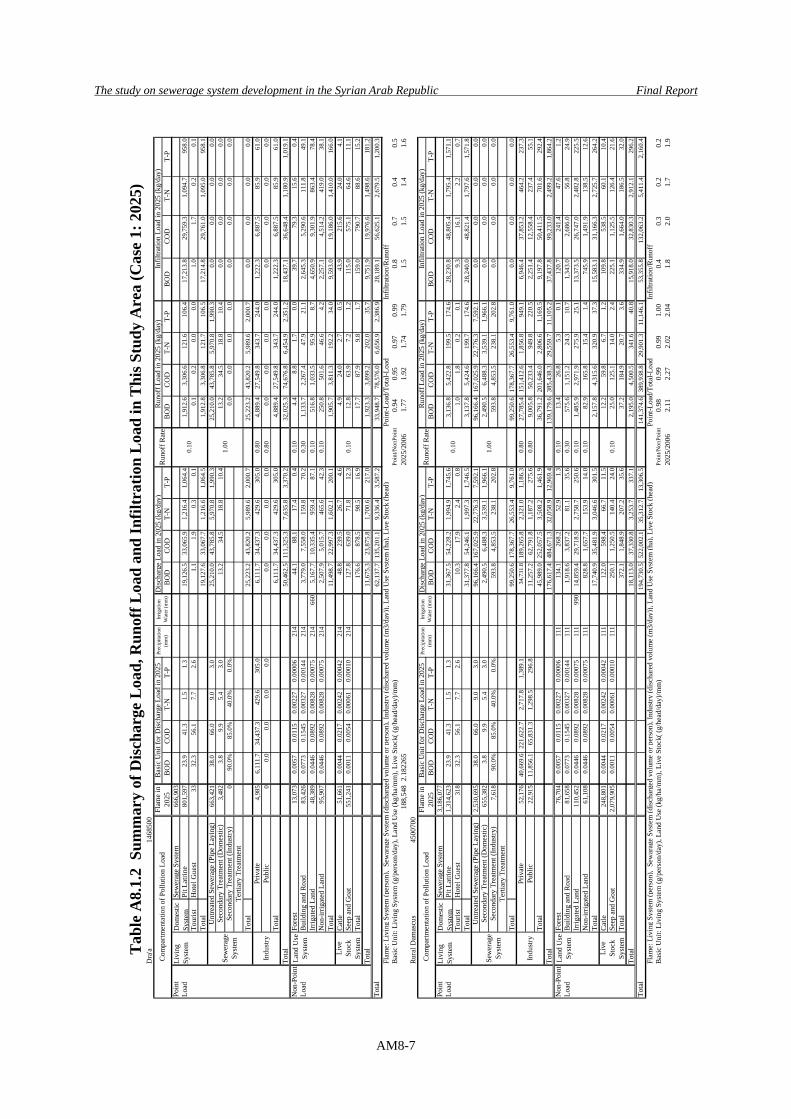
The study on sewerage system development in the Syrian Arab Republic Final Report
AM8-7
Dra
'a14
6850
0D
isch
arge
Loa
d in
202
5 (k
g/da
y)B
OD
CO
DT-
NT-
PB
OD
CO
DT-
NT-
PB
OD
CO
DT-
NT-
PB
OD
CO
DT-
NT-
PPo
int
Sew
erag
e Sy
stem
666,
903
Load
Pit L
atrin
e80
1,59
723
.941
.31.
51.
319
,126
.533
,065
.91,
216.
41,
064.
41,
912.
63,
306.
612
1.6
106.
417
,213
.829
,759
.31,
094.
795
8.0
Tour
ist
Hot
el G
uest
3332
.356
.17.
72.
61.
11.
90.
30.
10.
10.
20.
00.
01.
01.
70.
20.
1To
tal
19,1
27.6
33,0
67.7
1,21
6.6
1,06
4.5
1,91
2.8
3,30
6.8
121.
710
6.5
17,2
14.8
29,7
61.0
1,09
5.0
958.
166
3,42
138
.066
.09.
03.
025
,210
.043
,785
.85,
970.
81,
990.
325
,210
.043
,785
.85,
970.
81,
990.
30.
00.
00.
00.
03,
482
3.8
9.9
5.4
3.0
13.2
34.5
18.8
10.4
13.2
34.5
18.8
10.4
0.0
0.0
0.0
0.0
090
.0%
85.0
%40
.0%
0.0%
0.0
0.0
0.0
0.0
0.0
0.0
0.0
0.0
Tota
l25
,223
.243
,820
.25,
989.
62,
000.
725
,223
.243
,820
.25,
989.
62,
000.
70.
00.
00.
00.
04,
985
6,11
1.7
34,4
37.3
429.
630
5.0
6,11
1.7
34,4
37.3
429.
630
5.0
0.80
4,88
9.4
27,5
49.8
343.
724
4.0
1,22
2.3
6,88
7.5
85.9
61.0
00.
00.
00.
00.
00.
00.
00.
00.
00.
800.
00.
00.
00.
00.
00.
00.
00.
0To
tal
6,11
1.7
34,4
37.3
429.
630
5.0
4,88
9.4
27,5
49.8
343.
724
4.0
1,22
2.3
6,88
7.5
85.9
61.0
Tota
l50
,462
.511
1,32
5.3
7,63
5.8
3,37
0.2
32,0
25.3
74,6
76.8
6,45
4.9
2,35
1.2
18,4
37.1
36,6
48.4
1,18
0.9
1,01
9.1
Non
-Poi
ntFo
rest
13,0
730.
0057
0.01
150.
0022
70.
0000
621
444
.188
.117
.40.
40.
104.
48.
81.
70.
039
.779
.315
.60.
4Lo
adB
uild
ing
and
Roa
d83
,426
0.07
730.
1545
0.00
327
0.00
144
214
3,77
9.0
7,55
8.0
159.
870
.20.
301,
133.
72,
267.
447
.921
.12,
645.
35,
290.
611
1.8
49.1
Irrig
ated
Lan
d48
,389
0.04
460.
0892
0.00
828
0.00
075
214
660
5,16
7.7
10,3
35.4
959.
487
.10.
1051
6.8
1,03
3.5
95.9
8.7
4,65
0.9
9,30
1.9
863.
478
.4N
on-ir
rigat
ed L
and
95,9
070.
0446
0.08
920.
0082
80.
0007
521
42,
507.
95,
015.
746
5.6
42.3
0.10
250.
850
1.6
46.6
4.2
2,25
7.1
4,51
4.2
419.
038
.1To
tal
11,4
98.7
22,9
97.3
1,60
2.1
200.
11,
905.
73,
811.
319
2.2
34.0
9,59
3.0
19,1
86.0
1,41
0.0
166.
0C
atle
51,6
610.
0044
0.02
170.
0024
20.
0004
221
448
.823
9.5
26.7
4.6
4.9
24.0
2.7
0.5
43.9
215.
624
.04.
1Se
ep a
nd G
oat
551,
241
0.00
110.
0054
0.00
061
0.00
010
214
127.
863
9.0
71.8
12.3
12.8
63.9
7.2
1.2
115.
057
5.1
64.6
11.1
Tota
l17
6.6
878.
598
.516
.917
.787
.99.
81.
715
9.0
790.
788
.615
.2To
tal
11,6
75.3
23,8
75.8
1,70
0.6
217.
01,
923.
33,
899.
220
2.0
35.7
9,75
1.9
19,9
76.6
1,49
8.6
181.
262
,137
.713
5,20
1.1
9,33
6.4
3,58
7.2
33,9
48.7
78,5
76.0
6,65
6.9
2,38
6.9
28,1
89.1
56,6
25.1
2,67
9.5
1,20
0.3
Flam
e: L
ivin
g Sy
stem
(per
son)
, Se
war
age
Syst
em (d
isch
arge
d vo
lum
e or
per
son)
, Ind
ustry
(dis
char
ed v
olum
e (m
3/da
y)),
Land
Use
Sys
tem
(ha)
, Liv
e St
ock
(hea
d)Po
int-L
oad/
Tota
l-Loa
dIn
filtra
tion/
Run
off
Bas
ic U
nit:
Livi
ng S
yste
m (g
/per
son/
day)
, Lan
d U
se (k
g/ha
/mm
), Li
ve S
tock
( (g/
head
/day
)/mm
)Po
int/N
onPo
int
0.94
0.95
0.97
0.99
0.8
0.7
0.4
0.5
188,
548
2.18
2265
2025
/200
61.
771.
921.
741.
791.
51.
51.
41.
6R
ural
Dam
ascu
s45
0070
0D
isch
arge
Loa
d in
202
5 (k
g/da
y)B
OD
CO
DT-
NT-
PB
OD
CO
DT-
NT-
PB
OD
CO
DT-
NT-
PB
OD
CO
DT-
NT-
PPo
int
Sew
erag
e Sy
stem
3,18
6,07
7Lo
adPi
t Lat
rine
1,31
4,62
323
.941
.31.
51.
331
,367
.554
,228
.21,
994.
91,
745.
63,
136.
85,
422.
819
9.5
174.
628
,230
.848
,805
.41,
795.
41,
571.
1To
uris
tH
otel
Gue
st31
832
.356
.17.
72.
610
.317
.92.
40.
81.
01.
80.
20.
19.
316
.12.
20.
7To
tal
31,3
77.8
54,2
46.1
1,99
7.3
1,74
6.5
3,13
7.8
5,42
4.6
199.
717
4.6
28,2
40.0
48,8
21.4
1,79
7.6
1,57
1.8
2,53
0,69
538
.066
.09.
03.
096
,166
.416
7,02
5.9
22,7
76.3
7,59
2.1
96,1
66.4
167,
025.
922
,776
.37,
592.
10.
00.
00.
00.
065
5,38
23.
89.
95.
43.
02,
490.
56,
488.
33,
539.
11,
966.
12,
490.
56,
488.
33,
539.
11,
966.
10.
00.
00.
00.
07,
618
90.0
%85
.0%
40.0
%0.
0%59
3.8
4,85
3.5
238.
120
2.8
593.
84,
853.
523
8.1
202.
80.
00.
00.
00.
0
Tota
l99
,250
.617
8,36
7.7
26,5
53.4
9,76
1.0
99,2
50.6
178,
367.
726
,553
.49,
761.
00.
00.
00.
00.
052
,176
40,6
69.6
221,
622.
72,
717.
81,
389.
134
,731
.818
9,26
5.8
2,32
1.0
1,18
6.3
0.80
27,7
85.4
151,
412.
61,
856.
894
9.1
6,94
6.4
37,8
53.2
464.
223
7.3
22,9
1511
,856
.165
,831
.31,
298.
529
6.8
11,2
57.2
62,7
91.8
1,18
7.2
275.
60.
809,
005.
850
,233
.494
9.8
220.
52,
251.
412
,558
.423
7.4
55.1
Tota
l45
,989
.025
2,05
7.5
3,50
8.2
1,46
1.9
36,7
91.2
201,
646.
02,
806.
61,
169.
59,
197.
850
,411
.570
1.6
292.
4To
tal
176,
617.
448
4,67
1.3
32,0
58.9
12,9
69.4
139,
179.
638
5,43
8.3
29,5
59.7
11,1
05.2
37,4
37.8
99,2
33.0
2,49
9.2
1,86
4.2
Non
-Poi
ntFo
rest
76,7
040.
0057
0.01
150.
0022
70.
0000
611
113
4.1
268.
252
.91.
30.
1013
.426
.85.
30.
112
0.7
241.
447
.61.
2Lo
adB
uild
ing
and
Roa
d81
,658
0.07
730.
1545
0.00
327
0.00
144
111
1,91
8.6
3,83
7.2
81.1
35.6
0.30
575.
61,
151.
224
.310
.71,
343.
02,
686.
056
.824
.9Irr
igat
ed L
and
110,
452
0.04
460.
0892
0.00
828
0.00
075
111
990
14,8
59.4
29,7
18.9
2,75
8.7
250.
60.
101,
485.
92,
971.
927
5.9
25.1
13,3
73.5
26,7
47.0
2,48
2.8
225.
5N
on-ir
rigat
ed L
and
61,1
080.
0446
0.08
920.
0082
80.
0007
511
182
8.8
1,65
7.7
153.
914
.00.
1082
.916
5.8
15.4
1.4
745.
91,
491.
913
8.5
12.6
Tota
l17
,740
.935
,481
.93,
046.
630
1.5
2,15
7.8
4,31
5.6
320.
937
.315
,583
.131
,166
.32,
725.
726
4.2
Cat
le24
8,80
10.
0044
0.02
170.
0024
20.
0004
211
112
2.0
598.
466
.711
.512
.259
.86.
71.
210
9.8
538.
560
.110
.4Se
ep a
nd G
oat
2,07
9,90
50.
0011
0.00
540.
0006
10.
0001
011
125
0.1
1,25
0.5
140.
424
.025
.012
5.1
14.0
2.4
225.
11,
125.
512
6.4
21.6
Tota
l37
2.1
1,84
8.9
207.
235
.637
.218
4.9
20.7
3.6
334.
91,
664.
018
6.5
32.0
Tota
l18
,113
.037
,330
.83,
253.
733
7.1
2,19
5.0
4,50
0.5
341.
640
.815
,918
.032
,830
.32,
912.
129
6.2
194,
730.
552
2,00
2.1
35,3
12.7
13,3
06.5
141,
374.
638
9,93
8.8
29,9
01.3
11,1
46.1
53,3
55.8
132,
063.
25,
411.
42,
160.
4Fl
ame:
Liv
ing
Syst
em (p
erso
n),
Sew
arag
e Sy
stem
(dis
char
ged
volu
me
or p
erso
n), I
ndus
try (d
isch
ared
vol
ume
(m3/
day)
), La
nd U
se S
yste
m (h
a), L
ive
Stoc
k (h
ead)
Poin
t-Loa
d/To
tal-L
oad
Infil
tratio
n/R
unof
fB
asic
Uni
t: Li
ving
Sys
tem
(g/p
erso
n/da
y), L
and
Use
(kg/
ha/m
m),
Live
Sto
ck( (
g/he
ad/d
ay)/m
m)
Poin
t/Non
Poin
t0.
980.
990.
991.
000.
40.
30.
20.
220
25/2
006
2.11
2.27
2.02
2.04
1.8
2.0
1.7
1.9
Tabl
e A
8.1.
2 S
umm
ary
of D
ischa
rge
Load
, Run
off L
oad
and
Infil
trat
ion
Load
in T
his S
tudy
Are
a (C
ase
1: 2
025)
In
filtra
tion
Load
in 2
025
(kg/
day)
Infil
tratio
n Lo
ad in
202
5 (k
g/da
y)
0.10
Tota
l
Live
Stoc
kSy
stem
Indu
stry
Priv
ate
Publ
ic
Land
Use
Syst
em
Sew
erag
eSy
stem
Unt
reat
ed S
ewer
age
(Pip
e La
ying
)
1.00
Seco
ndar
y Tr
eatm
ent (
Dom
estic
)Se
cond
ary
Trea
tmen
t (In
dust
ry)
Terti
ary
Trea
tmen
t
Run
off L
oad
in 2
025
(kg/
day)
Livi
ngSy
stem
Dom
estic
Syst
em0.
10
0.10
Tota
l
Com
partm
enta
tion
of P
ollu
tion
Load
Flam
e in
2025
Bas
ic U
nit f
or D
isch
arge
Loa
d in
202
5Pr
ecip
itatio
n(m
m)
Irrig
atio
nW
ater
(mm
)R
unof
f Rat
e
Live
Stoc
kS y
stem
Indu
stry
Priv
ate
Publ
ic
Land
Use
Syst
em
Sew
erag
eSy
stem
Unt
reat
ed S
ewer
age
(Pip
e La
ying
)
1.00
Seco
ndar
y Tr
eatm
ent (
Dom
estic
)Se
cond
ary
Trea
tmen
t (In
dust
ry)
Terti
ary
Trea
tmen
t
Irrig
atio
nW
ater
(mm
)R
unof
f Rat
eR
unof
f Loa
d in
202
5 (k
g/da
y)
Livi
ngSy
stem
Dom
estic
Syst
em0.
10
Com
partm
enta
tion
of P
ollu
tion
Load
Flam
e in
2025
Bas
ic U
nit f
or D
isch
arge
Loa
d in
202
5Pr
ecip
itatio
n(m
m)
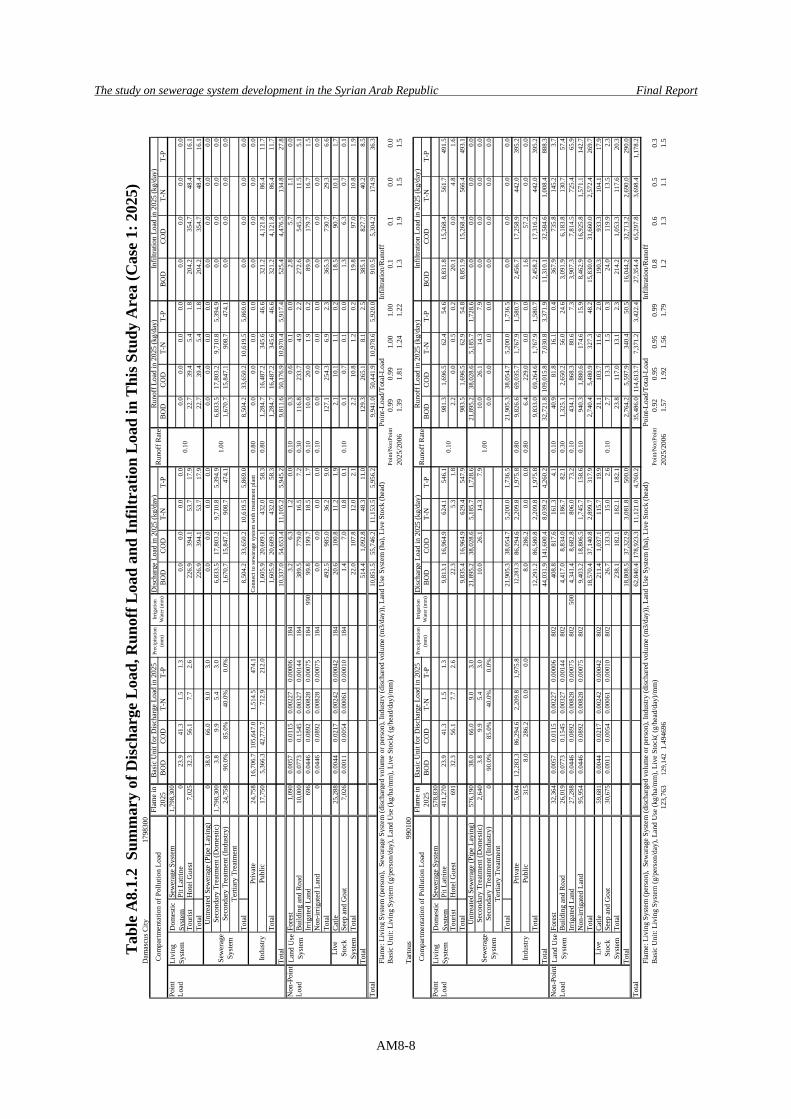
The study on sewerage system development in the Syrian Arab Republic Final Report
AM8-8
Dam
ascu
s City
1798
300
Dis
char
ge L
oad
in 2
025
(kg/
day)
BO
DC
OD
T-N
T-P
BO
DC
OD
T-N
T-P
BO
DC
OD
T-N
T-P
BO
DC
OD
T-N
T-P
Poin
tSe
wer
a ge
Syst
em1,
798,
300
Load
Pit L
atrin
e0
23.9
41.3
1.5
1.3
0.0
0.0
0.0
0.0
0.0
0.0
0.0
0.0
0.0
0.0
0.0
0.0
Tour
ist
Hot
el G
uest
7,02
532
.356
.17.
72.
622
6.9
394.
153
.717
.922
.739
.45.
41.
820
4.2
354.
748
.416
.1To
tal
226.
939
4.1
53.7
17.9
22.7
39.4
5.4
1.8
204.
235
4.7
48.4
16.1
038
.066
.09.
03.
00.
00.
00.
00.
00.
00.
00.
00.
00.
00.
00.
00.
01,
798,
300
3.8
9.9
5.4
3.0
6,83
3.5
17,8
03.2
9,71
0.8
5,39
4.9
6,83
3.5
17,8
03.2
9,71
0.8
5,39
4.9
0.0
0.0
0.0
0.0
24,7
5890
.0%
85.0
%40
.0%
0.0%
1,67
0.7
15,8
47.1
908.
747
4.1
1,67
0.7
15,8
47.1
908.
747
4.1
0.0
0.0
0.0
0.0
Tota
l8,
504.
233
,650
.210
,619
.55,
869.
08,
504.
233
,650
.210
,619
.55,
869.
00.
00.
00.
00.
024
,758
16,7
06.7
105,
647.
01,
514.
547
4.1
Con
nect
to se
war
age
syst
em w
ith tr
eatm
ent p
lant
0.80
0.0
0.0
0.0
0.0
0.0
0.0
0.0
0.0
17,7
505,
366.
342
,773
.771
2.9
212.
01,
605.
920
,609
.143
2.0
58.3
0.80
1,28
4.7
16,4
87.2
345.
646
.632
1.2
4,12
1.8
86.4
11.7
Tota
l1,
605.
920
,609
.143
2.0
58.3
1,28
4.7
16,4
87.2
345.
646
.632
1.2
4,12
1.8
86.4
11.7
Tota
l10
,337
.054
,653
.411
,105
.25,
945.
29,
811.
650
,176
.910
,970
.45,
917.
452
5.4
4,47
6.5
134.
827
.8N
on-P
oint
Fore
st1,
090
0.00
570.
0115
0.00
227
0.00
006
184
3.2
6.3
1.2
0.0
0.10
0.3
0.6
0.1
0.0
2.8
5.7
1.1
0.0
Load
Bui
ldin
g an
d R
oad
10,0
000.
0773
0.15
450.
0032
70.
0014
418
438
9.5
779.
016
.57.
20.
3011
6.8
233.
74.
92.
227
2.6
545.
311
.55.
1Irr
igat
ed L
and
696
0.04
460.
0892
0.00
828
0.00
075
184
990
99.8
199.
718
.51.
70.
1010
.020
.01.
90.
289
.917
9.7
16.7
1.5
Non
-irrig
ated
Lan
d0
0.04
460.
0892
0.00
828
0.00
075
184
0.0
0.0
0.0
0.0
0.10
0.0
0.0
0.0
0.0
0.0
0.0
0.0
0.0
Tota
l49
2.5
985.
036
.29.
012
7.1
254.
36.
92.
336
5.3
730.
729
.36.
6C
atle
25,2
880.
0044
0.02
170.
0024
20.
0004
218
420
.610
0.8
11.2
1.9
2.1
10.1
1.1
0.2
18.5
90.7
10.1
1.7
Seep
and
Goa
t7,
026
0.00
110.
0054
0.00
061
0.00
010
184
1.4
7.0
0.8
0.1
0.1
0.7
0.1
0.0
1.3
6.3
0.7
0.1
Tota
l22
.010
7.8
12.0
2.1
2.2
10.8
1.2
0.2
19.8
97.0
10.8
1.9
Tota
l51
4.4
1,09
2.8
48.3
11.0
129.
326
5.1
8.1
2.5
385.
182
7.7
40.2
8.5
10,8
51.5
55,7
46.2
11,1
53.5
5,95
6.2
9,94
1.0
50,4
41.9
10,9
78.6
5,92
0.0
910.
55,
304.
217
4.9
36.3
Flam
e: L
ivin
g Sy
stem
(per
son)
, Se
war
age
Syst
em (d
isch
arge
d vo
lum
e or
per
son)
, Ind
ustry
(dis
char
ed v
olum
e (m
3/da
y)),
Land
Use
Sys
tem
(ha)
, Liv
e St
ock
(hea
d)Po
int-L
oad/
Tota
l-Loa
dIn
filtra
tion/
Run
off
Bas
ic U
nit:
Livi
ng S
yste
m (g
/per
son/
day)
, Lan
d U
se (k
g/ha
/mm
), Li
ve S
tock
( (g/
head
/day
)/mm
)Po
int/N
onPo
int
0.99
0.99
1.00
1.00
0.1
0.1
0.0
0.0
2025
/200
61.
391.
811.
241.
221.
31.
91.
51.
5Ta
rtous
9901
00D
isch
arge
Loa
d in
202
5 (k
g/da
y)B
OD
CO
DT-
NT-
PB
OD
CO
DT-
NT-
PB
OD
CO
DT-
NT-
PB
OD
CO
DT-
NT-
PPo
int
Sew
era g
e Sy
stem
578,
830
Load
Pit L
atrin
e41
1,27
023
.941
.31.
51.
39,
813.
116
,964
.962
4.1
546.
198
1.3
1,69
6.5
62.4
54.6
8,83
1.8
15,2
68.4
561.
749
1.5
Tour
ist
Hot
el G
uest
691
32.3
56.1
7.7
2.6
22.3
5.3
1.8
2.2
0.0
0.5
0.2
20.1
0.0
4.8
1.6
Tota
l9,
835.
416
,964
.962
9.4
547.
998
3.5
1,69
6.5
62.9
54.8
8,85
1.9
15,2
68.4
566.
449
3.1
576,
190
38.0
66.0
9.0
3.0
21,8
95.2
38,0
28.6
5,18
5.7
1,72
8.6
21,8
95.2
38,0
28.6
5,18
5.7
1,72
8.6
0.0
0.0
0.0
0.0
2,64
03.
89.
95.
43.
010
.026
.114
.37.
910
.026
.114
.37.
90.
00.
00.
00.
00
90.0
%85
.0%
40.0
%0.
0%0.
00.
00.
00.
00.
00.
00.
00.
0
Tota
l21
,905
.338
,054
.75,
200.
01,
736.
521
,905
.338
,054
.75,
200.
01,
736.
50.
00.
00.
00.
05,
064
12,2
83.3
86,2
94.6
2,20
9.8
1,97
5.8
12,2
83.3
86,2
94.6
2,20
9.8
1,97
5.8
0.80
9,82
6.6
69,0
35.7
1,76
7.9
1,58
0.7
2,45
6.7
17,2
58.9
442.
039
5.2
315
8.0
286.
20.
00.
08.
028
6.2
0.0
0.0
0.80
6.4
229.
00.
00.
01.
657
.20.
00.
0To
tal
12,2
91.2
86,5
80.8
2,20
9.8
1,97
5.8
9,83
3.0
69,2
64.6
1,76
7.9
1,58
0.7
2,45
8.2
17,3
16.2
442.
039
5.2
Tota
l44
,031
.914
1,60
0.4
8,03
9.2
4,26
0.2
32,7
21.8
109,
015.
87,
030.
83,
371.
911
,310
.132
,584
.61,
008.
488
8.3
Non
-Poi
ntFo
rest
32,3
640.
0057
0.01
150.
0022
70.
0000
680
240
8.8
817.
616
1.3
4.1
0.10
40.9
81.8
16.1
0.4
367.
973
5.8
145.
23.
7Lo
adB
uild
ing
and
Roa
d26
,019
0.07
730.
1545
0.00
327
0.00
144
802
4,41
7.0
8,83
4.0
186.
782
.10.
301,
325.
12,
650.
256
.024
.63,
091.
96,
183.
813
0.7
57.4
Irrig
ated
Lan
d27
,288
0.04
460.
0892
0.00
828
0.00
075
802
500
4,34
1.4
8,68
2.8
806.
073
.20.
1043
4.1
868.
380
.67.
33,
907.
37,
814.
572
5.4
65.9
Non
-irrig
ated
Lan
d95
,954
0.04
460.
0892
0.00
828
0.00
075
802
9,40
3.2
18,8
06.5
1,74
5.7
158.
60.
1094
0.3
1,88
0.6
174.
615
.98,
462.
916
,925
.81,
571.
114
2.7
Tota
l18
,570
.437
,140
.82,
899.
731
7.9
2,74
0.4
5,48
0.9
327.
348
.215
,830
.031
,660
.02,
572.
426
9.7
Cat
le59
,681
0.00
440.
0217
0.00
242
0.00
042
802
211.
41,
037.
111
5.7
19.9
21.1
103.
711
.62.
019
0.3
933.
310
4.1
17.9
Seep
and
Goa
t30
,675
0.00
110.
0054
0.00
061
0.00
010
802
26.7
133.
315
.02.
62.
713
.31.
50.
324
.011
9.9
13.5
2.3
Tota
l23
8.1
182.
118
2.1
182.
123
.811
7.0
13.1
2.3
214.
21,
053.
311
7.6
20.3
Tota
l18
,808
.537
,322
.93,
081.
850
0.0
2,76
4.2
5,59
7.9
340.
450
.516
,044
.232
,713
.22,
690.
029
0.0
62,8
40.4
178,
923.
311
,121
.04,
760.
235
,486
.011
4,61
3.7
7,37
1.2
3,42
2.4
27,3
54.4
65,2
97.8
3,69
8.4
1,17
8.2
Flam
e: L
ivin
g Sy
stem
(per
son)
, Se
war
age
Syst
em (d
isch
arge
d vo
lum
e or
per
son)
, Ind
ustry
(dis
char
ed v
olum
e (m
3/da
y)),
Land
Use
Sys
tem
(ha)
, Liv
e St
ock
(hea
d)Po
int-L
oad/
Tota
l-Loa
dIn
filtra
tion/
Run
off
Bas
ic U
nit:
Livi
ng S
yste
m (g
/per
son/
day)
, Lan
d U
se (k
g/ha
/mm
), Li
ve S
tock
( (g/
head
/day
)/mm
)Po
int/N
onPo
int
0.92
0.95
0.95
0.99
0.8
0.6
0.5
0.3
123,
763
129,
142
1.49
4696
2025
/200
61.
571.
921.
561.
791.
21.
31.
11.
5
Infil
tratio
n Lo
ad in
202
5 (k
g/da
y)
Infil
tratio
n Lo
ad in
202
5 (k
g/da
y)
Tabl
e A
8.1.
2 S
umm
ary
of D
ischa
rge
Load
, Run
off L
oad
and
Infil
trat
ion
Load
in T
his S
tudy
Are
a (C
ase
1: 2
025)
0.10
Tota
l
Live
Stoc
kSy
stem
Indu
stry
Priv
ate
Publ
ic
Land
Use
Syst
em
Sew
erag
eSy
stem
Unt
reat
ed S
ewer
age
(Pip
e La
ying
)
1.00
Seco
ndar
y Tr
eatm
ent (
Dom
estic
)Se
cond
ary
Trea
tmen
t (In
dust
ry)
Terti
ary
Trea
tmen
t
Run
off L
oad
in 2
025
(kg/
day)
Livi
ngSy
stem
Dom
estic
Syst
em0.
10
0.10
Tota
l
Com
partm
enta
tion
of P
ollu
tion
Load
Flam
e in
2025
Bas
ic U
nit f
or D
isch
arge
Loa
d in
202
5Pr
ecip
itatio
n(m
m)
Irrig
atio
nW
ater
(mm
)R
unof
f Rat
e
Live
Stoc
kSy
stem
Indu
stry
Priv
ate
Publ
ic
Land
Use
Syst
em
Sew
erag
eSy
stem
Unt
reat
ed S
ewer
age
(Pip
e La
ying
)
1.00
Seco
ndar
y Tr
eatm
ent (
Dom
estic
)Se
cond
ary
Trea
tmen
t (In
dust
ry)
Terti
ary
Trea
tmen
t
Run
off L
oad
in 2
025
(kg/
day)
Livi
ngSy
stem
Dom
estic
Syst
em0.
10
Com
partm
enta
tion
of P
ollu
tion
Load
Flam
e in
2025
Bas
ic U
nit f
or D
isch
arge
Loa
d in
202
5Pr
ecip
itatio
n(m
m)
Irrig
atio
nW
ater
(mm
)R
unof
f Rat
e
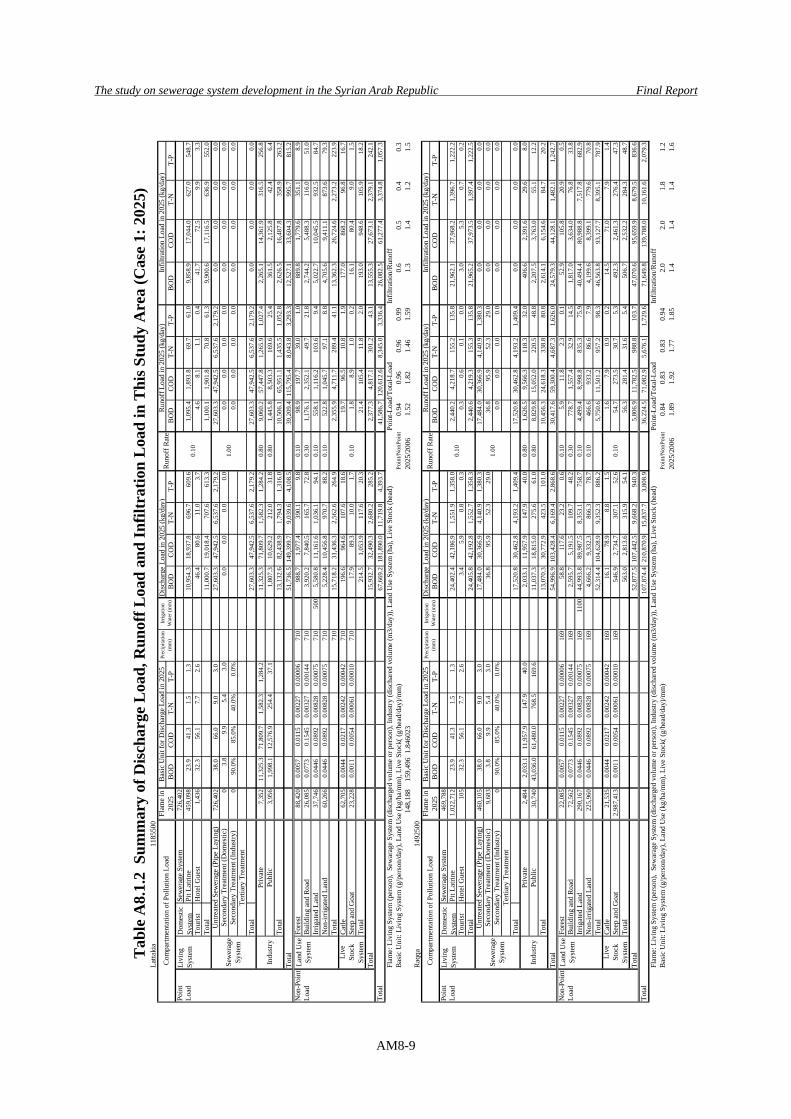
The study on sewerage system development in the Syrian Arab Republic Final Report
AM8-9
Latta
kia
1185
500
Dis
char
ge L
oad
in 2
025
(kg/
day)
BO
DC
OD
T-N
T-P
BO
DC
OD
T-N
T-P
BO
DC
OD
T-N
T-P
BO
DC
OD
T-N
T-P
Poin
tSe
wer
age
Syst
em72
6,40
2Lo
adPi
t Lat
rine
459,
098
23.9
41.3
1.5
1.3
10,9
54.3
18,9
37.8
696.
760
9.6
1,09
5.4
1,89
3.8
69.7
61.0
9,85
8.9
17,0
44.0
627.
054
8.7
Tour
ist
Hot
el G
uest
1,43
632
.356
.17.
72.
646
.480
.611
.03.
74.
68.
11.
10.
441
.772
.59.
93.
3To
tal
11,0
00.7
19,0
18.4
707.
661
3.3
1,10
0.1
1,90
1.8
70.8
61.3
9,90
0.6
17,1
16.5
636.
955
2.0
726,
402
38.0
66.0
9.0
3.0
27,6
03.3
47,9
42.5
6,53
7.6
2,17
9.2
27,6
03.3
47,9
42.5
6,53
7.6
2,17
9.2
0.0
0.0
0.0
0.0
03.
89.
95.
43.
00.
00.
00.
00.
00.
00.
00.
00.
00.
00.
00.
00.
00
90.0
%85
.0%
40.0
%0.
0%0.
00.
00.
00.
00.
00.
00.
00.
0
Tota
l27
,603
.347
,942
.56,
537.
62,
179.
227
,603
.347
,942
.56,
537.
62,
179.
20.
00.
00.
00.
07,
352
11,3
25.3
71,8
09.7
1,58
2.3
1,28
4.2
11,3
25.3
71,8
09.7
1,58
2.3
1,28
4.2
0.80
9,06
0.2
57,4
47.8
1,26
5.9
1,02
7.4
2,26
5.1
14,3
61.9
316.
525
6.8
3,95
61,
998.
112
,576
.925
4.4
37.1
1,80
7.3
10,6
29.2
212.
031
.80.
801,
445.
88,
503.
316
9.6
25.4
361.
52,
125.
842
.46.
4To
tal
13,1
32.6
82,4
38.9
1,79
4.3
1,31
6.0
10,5
06.1
65,9
51.1
1,43
5.5
1,05
2.8
2,62
6.5
16,4
87.8
358.
926
3.2
Tota
l51
,736
.514
9,39
9.7
9,03
9.6
4,10
8.5
39,2
09.4
115,
795.
48,
043.
83,
293.
312
,527
.133
,604
.399
5.7
815.
2N
on-P
oint
Fore
st88
,420
0.00
570.
0115
0.00
227
0.00
006
710
988.
71,
977.
439
0.1
9.8
0.10
98.9
197.
739
.01.
088
9.8
1,77
9.6
351.
18.
9Lo
adB
uild
ing
and
Roa
d26
,085
0.07
730.
1545
0.00
327
0.00
144
710
3,92
0.2
7,84
0.5
165.
772
.80.
301,
176.
12,
352.
149
.721
.82,
744.
25,
488.
311
6.0
51.0
Irrig
ated
Lan
d37
,746
0.04
460.
0892
0.00
828
0.00
075
710
500
5,58
0.8
11,1
61.6
1,03
6.1
94.1
0.10
558.
11,
116.
210
3.6
9.4
5,02
2.7
10,0
45.5
932.
584
.7N
on-ir
rigat
ed L
and
60,2
660.
0446
0.08
920.
0082
80.
0007
571
05,
228.
410
,456
.897
0.7
88.2
0.10
522.
81,
045.
797
.18.
84,
705.
69,
411.
187
3.6
79.3
Tota
l71
015
,718
.231
,436
.32,
562.
626
4.9
2,35
5.9
4,71
1.7
289.
441
.113
,362
.326
,724
.62,
273.
222
3.9
Cat
le62
,705
0.00
440.
0217
0.00
242
0.00
042
710
196.
696
4.6
107.
618
.619
.796
.510
.81.
917
7.0
868.
296
.816
.7Se
ep a
nd G
oat
23,2
280.
0011
0.00
540.
0006
10.
0001
071
017
.989
.310
.01.
71.
88.
91.
00.
216
.180
.49.
01.
5To
tal
214.
51,
053.
911
7.6
20.3
21.4
105.
411
.82.
019
3.0
948.
610
5.9
18.2
Tota
l15
,932
.732
,490
.32,
680.
228
5.2
2,37
7.3
4,81
7.1
301.
243
.113
,555
.327
,673
.12,
379.
124
2.1
67,6
69.2
181,
890.
011
,719
.84,
393.
741
,586
.712
0,61
2.6
8,34
5.0
3,33
6.4
26,0
82.5
61,2
77.4
3,37
4.8
1,05
7.3
Flam
e: L
ivin
g Sy
stem
(per
son)
, Se
war
age
Syst
em (d
isch
arge
d vo
lum
e or
per
son)
, Ind
ustry
(dis
char
ed v
olum
e (m
3/da
y)),
Land
Use
Sys
tem
(ha)
, Liv
e St
ock
(hea
d)Po
int-L
oad/
Tota
l-Loa
dIn
filtra
tion/
Run
off
Bas
ic U
nit:
Livi
ng S
yste
m (g
/per
son/
day)
, Lan
d U
se (k
g/ha
/mm
), Li
ve S
tock
( (g/
head
/day
)/mm
)Po
int/N
onPo
int
0.94
0.96
0.96
0.99
0.6
0.5
0.4
0.3
148,
188
159,
496
1.84
6023
2025
/200
61.
521.
821.
461.
591.
31.
41.
21.
5R
aqqa
1492
500
Dis
char
ge L
oad
in 2
025
(kg/
day)
BO
DC
OD
T-N
T-P
BO
DC
OD
T-N
T-P
BO
DC
OD
T-N
T-P
BO
DC
OD
T-N
T-P
Poin
tSe
wer
age
Syst
em46
9,78
8Lo
adPi
t Lat
rine
1,02
2,71
223
.941
.31.
51.
324
,402
.442
,186
.91,
551.
91,
358.
02,
440.
24,
218.
715
5.2
135.
821
,962
.137
,968
.21,
396.
71,
222.
2To
uris
tH
otel
Gue
st10
532
.356
.17.
72.
63.
45.
90.
80.
30.
30.
60.
10.
03.
05.
30.
70.
2To
tal
24,4
05.8
42,1
92.8
1,55
2.7
1,35
8.3
2,44
0.6
4,21
9.3
155.
313
5.8
21,9
65.2
37,9
73.5
1,39
7.4
1,22
2.5
460,
105
38.0
66.0
9.0
3.0
17,4
84.0
30,3
66.9
4,14
0.9
1,38
0.3
17,4
84.0
30,3
66.9
4,14
0.9
1,38
0.3
0.0
0.0
0.0
0.0
9,68
33.
89.
95.
43.
036
.895
.952
.329
.036
.895
.952
.329
.00.
00.
00.
00.
00
90.0
%85
.0%
40.0
%0.
0%0.
00.
00.
00.
00.
00.
00.
00.
0
Tota
l17
,520
.830
,462
.84,
193.
21,
409.
417
,520
.830
,462
.84,
193.
21,
409.
40.
00.
00.
00.
02,
484
2,03
3.1
11,9
57.9
147.
940
.02,
033.
111
,957
.914
7.9
40.0
0.80
1,62
6.5
9,56
6.3
118.
332
.040
6.6
2,39
1.6
29.6
8.0
30,7
4043
,036
.061
,480
.076
8.5
169.
611
,037
.318
,815
.027
5.6
61.0
0.80
8,82
9.8
15,0
52.0
220.
548
.82,
207.
53,
763.
055
.112
.2To
tal
13,0
70.3
30,7
72.9
423.
510
1.0
10,4
56.3
24,6
18.3
338.
880
.82,
614.
16,
154.
684
.720
.2To
tal
54,9
96.9
103,
428.
46,
169.
42,
868.
630
,417
.659
,300
.44,
687.
31,
626.
024
,579
.344
,128
.11,
482.
11,
242.
7N
on-P
oint
Fore
st22
,085
0.00
570.
0115
0.00
227
0.00
006
169
58.8
117.
623
.20.
60.
105.
911
.82.
30.
152
.910
5.8
20.9
0.5
Load
Bui
ldin
g an
d R
oad
72,5
620.
0773
0.15
450.
0032
70.
0014
416
92,
595.
75,
191.
510
9.7
48.2
0.30
778.
71,
557.
432
.914
.51,
817.
03,
634.
076
.833
.8Irr
igat
ed L
and
290,
167
0.04
460.
0892
0.00
828
0.00
075
169
1100
44,9
93.8
89,9
87.5
8,35
3.1
758.
70.
104,
499.
48,
998.
883
5.3
75.9
40,4
94.4
80,9
88.8
7,51
7.8
682.
9N
on-ir
rigat
ed L
and
225,
960
0.04
460.
0892
0.00
828
0.00
075
169
4,66
6.2
9,33
2.3
866.
378
.70.
1046
6.6
933.
286
.67.
94,
199.
68,
399.
177
9.6
70.8
Tota
l52
,314
.410
4,62
8.9
9,35
2.3
886.
25,
750.
611
,501
.295
7.2
98.3
46,5
63.8
93,1
27.7
8,39
5.1
787.
9C
atle
21,5
350.
0044
0.02
170.
0024
20.
0004
216
916
.178
.98.
81.
51.
67.
90.
90.
214
.571
.07.
91.
4Se
ep a
nd G
oat
2,98
7,41
30.
0011
0.00
540.
0006
10.
0001
016
954
6.9
2,73
4.7
307.
152
.654
.727
3.5
30.7
5.3
492.
32,
461.
327
6.4
47.3
Tota
l56
3.0
2,81
3.6
315.
954
.156
.328
1.4
31.6
5.4
506.
72,
532.
228
4.3
48.7
Tota
l52
,877
.510
7,44
2.5
9,66
8.2
940.
35,
806.
911
,782
.598
8.8
103.
747
,070
.695
,659
.98,
679.
583
6.6
107,
874.
421
0,87
0.9
15,8
37.7
3,80
8.9
36,2
24.5
71,0
82.9
5,67
6.1
1,72
9.6
71,6
49.8
139,
788.
010
,161
.62,
079.
3Fl
ame:
Liv
ing
Syst
em (p
erso
n),
Sew
arag
e Sy
stem
(dis
char
ged
volu
me
or p
erso
n), I
ndus
try (d
isch
ared
vol
ume
(m3/
day)
), La
nd U
se S
yste
m (h
a), L
ive
Stoc
k (h
ead)
Poin
t-Loa
d/To
tal-L
oad
Infil
tratio
n/R
unof
fB
asic
Uni
t: Li
ving
Sys
tem
(g/p
erso
n/da
y), L
and
Use
(kg/
ha/m
m),
Live
Sto
ck( (
g/he
ad/d
ay)/m
m)
Poin
t/Non
Poin
t0.
840.
830.
830.
942.
02.
01.
81.
220
25/2
006
1.89
1.92
1.77
1.85
1.4
1.4
1.4
1.6
Infil
tratio
n Lo
ad in
202
5 (k
g/da
y)
Infil
tratio
n Lo
ad in
202
5 (k
g/da
y)
0.10
Tota
l
Live
Stoc
kS y
stem
Indu
stry
Priv
ate
Publ
ic
Land
Use
Syst
em
Sew
erag
eSy
stem
Unt
reat
ed S
ewer
age
(Pip
e La
ying
)
1.00
Seco
ndar
y Tr
eatm
ent (
Dom
estic
)Se
cond
ary
Trea
tmen
t (In
dust
ry)
Terti
ary
Trea
tmen
t
Run
off L
oad
in 2
025
(kg/
day)
Livi
ngSy
stem
Dom
estic
S yst
em0.
10
0.10
Tota
l
Com
partm
enta
tion
of P
ollu
tion
Load
Flam
e in
2025
Bas
ic U
nit f
or D
isch
arge
Loa
d in
202
5Pr
ecip
itatio
n(m
m)
Irrig
atio
nW
ater
(mm
)R
unof
f Rat
e
Live
Stoc
kS y
stem
Indu
stry
Priv
ate
Publ
ic
Land
Use
Syst
em
Sew
erag
eSy
stem
Unt
reat
ed S
ewer
age
(Pip
e La
ying
)
1.00
Seco
ndar
y Tr
eatm
ent (
Dom
estic
)Se
cond
ary
Trea
tmen
t (In
dust
ry)
Terti
ary
Trea
tmen
t
Run
off L
oad
in 2
025
(kg/
day)
Livi
ngSy
stem
Dom
estic
S yst
em0.
10
Com
partm
enta
tion
of P
ollu
tion
Load
Flam
e in
2025
Bas
ic U
nit f
or D
isch
arge
Loa
d in
202
5Pr
ecip
itatio
n(m
m)
Irrig
atio
nW
ater
(mm
)R
unof
f Rat
e
Tabl
e A
8.1.
2 S
umm
ary
of D
ischa
rge
Load
, Run
off L
oad
and
Infil
trat
ion
Load
in T
his S
tudy
Are
a (C
ase
1: 2
025)
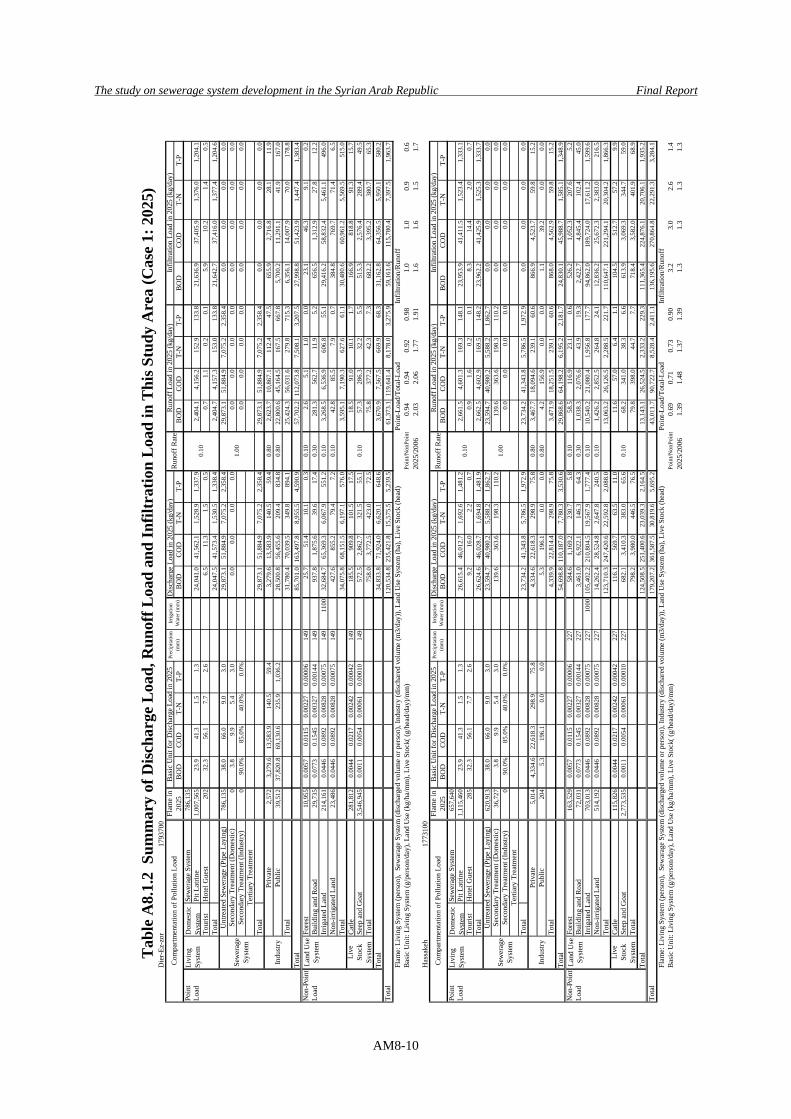
The study on sewerage system development in the Syrian Arab Republic Final Report
AM8-10
Die
r-Ez
-zor
1793
700
Dis
char
ge L
oad
in 2
025
(kg/
day)
BO
DC
OD
T-N
T-P
BO
DC
OD
T-N
T-P
BO
DC
OD
T-N
T-P
BO
DC
OD
T-N
T-P
Poin
tSe
wer
age
Syst
em78
6,13
5Lo
adPi
t Lat
rine
1,00
7,56
523
.941
.31.
51.
324
,041
.041
,562
.11,
528.
91,
337.
92,
404.
14,
156.
215
2.9
133.
821
,636
.937
,405
.91,
376.
01,
204.
1To
uris
tH
otel
Gue
st20
232
.356
.17.
72.
66.
511
.31.
50.
50.
71.
10.
20.
15.
910
.21.
40.
5To
tal
24,0
47.5
41,5
73.4
1,53
0.5
1,33
8.4
2,40
4.7
4,15
7.3
153.
013
3.8
21,6
42.7
37,4
16.0
1,37
7.4
1,20
4.6
786,
135
38.0
66.0
9.0
3.0
29,8
73.1
51,8
84.9
7,07
5.2
2,35
8.4
29,8
73.1
51,8
84.9
7,07
5.2
2,35
8.4
0.0
0.0
0.0
0.0
03.
89.
95.
43.
00.
00.
00.
00.
00.
00.
00.
00.
00.
00.
00.
00.
00
90.0
%85
.0%
40.0
%0.
0%0.
00.
00.
00.
00.
00.
00.
00.
0
Tota
l29
,873
.151
,884
.97,
075.
22,
358.
429
,873
.151
,884
.97,
075.
22,
358.
40.
00.
00.
00.
02,
572
3,27
9.6
13,5
83.9
140.
559
.43,
279.
613
,583
.914
0.5
59.4
0.80
2,62
3.7
10,8
67.1
112.
447
.565
5.9
2,71
6.8
28.1
11.9
39,5
1237
,820
.869
,130
.623
5.9
1,03
6.2
28,5
00.8
56,4
55.6
209.
483
4.8
0.80
22,8
00.6
45,1
64.5
167.
566
7.8
5,70
0.2
11,2
91.1
41.9
167.
0To
tal
31,7
80.4
70,0
39.5
349.
889
4.1
25,4
24.3
56,0
31.6
279.
871
5.3
6,35
6.1
14,0
07.9
70.0
178.
8To
tal
85,7
01.0
163,
497.
88,
955.
54,
590.
957
,702
.211
2,07
3.8
7,50
8.1
3,20
7.5
27,9
98.8
51,4
23.9
1,44
7.4
1,38
3.4
Non
-Poi
ntFo
rest
10,9
550.
0057
0.01
150.
0022
70.
0000
614
925
.751
.410
.10.
30.
102.
65.
11.
00.
023
.146
.39.
10.
2Lo
adB
uild
ing
and
Roa
d29
,735
0.07
730.
1545
0.00
327
0.00
144
149
937.
81,
875.
639
.617
.40.
3028
1.3
562.
711
.95.
265
6.5
1,31
2.9
27.8
12.2
Irrig
ated
Lan
d21
4,16
10.
0446
0.08
920.
0082
80.
0007
514
911
0032
,684
.765
,369
.36,
067.
955
1.2
0.10
3,26
8.5
6,53
6.9
606.
855
.129
,416
.258
,832
.45,
461.
149
6.0
Non
-irrig
ated
Lan
d23
,486
0.04
460.
0892
0.00
828
0.00
075
149
427.
685
5.2
79.4
7.2
0.10
42.8
85.5
7.9
0.7
384.
876
9.7
71.4
6.5
Tota
l34
,075
.868
,151
.56,
197.
157
6.0
3,59
5.1
7,19
0.3
627.
661
.130
,480
.660
,961
.25,
569.
551
5.0
Cat
le28
1,81
20.
0044
0.02
170.
0024
20.
0004
214
918
5.5
909.
810
1.5
17.5
18.5
91.0
10.1
1.7
166.
981
8.8
91.3
15.7
Seep
and
Goa
t3,
546,
945
0.00
110.
0054
0.00
061
0.00
010
149
572.
52,
862.
732
1.5
55.1
57.3
286.
332
.25.
551
5.3
2,57
6.4
289.
449
.5To
tal
758.
03,
772.
542
3.0
72.5
75.8
377.
242
.37.
368
2.2
3,39
5.2
380.
765
.3To
tal
34,8
33.8
71,9
24.0
6,62
0.1
648.
63,
670.
97,
567.
566
9.9
68.3
31,1
62.8
64,3
56.5
5,95
0.1
580.
212
0,53
4.8
235,
421.
815
,575
.55,
239.
561
,373
.111
9,64
1.4
8,17
8.0
3,27
5.9
59,1
61.6
115,
780.
47,
397.
51,
963.
7Fl
ame:
Liv
ing
Syst
em (p
erso
n),
Sew
arag
e Sy
stem
(dis
char
ged
volu
me
or p
erso
n), I
ndus
try (d
isch
ared
vol
ume
(m3/
day)
), La
nd U
se S
yste
m (h
a), L
ive
Stoc
k (h
ead)
Poin
t-Loa
d/To
tal-L
oad
Infil
tratio
n/R
unof
fB
asic
Uni
t: Li
ving
Sys
tem
(g/p
erso
n/da
y), L
and
Use
(kg/
ha/m
m),
Live
Sto
ck( (
g/he
ad/d
ay)/m
m)
Poin
t/Non
Poin
t0.
940.
940.
920.
981.
01.
00.
90.
620
25/2
006
2.03
2.06
1.77
1.91
1.6
1.6
1.5
1.7
Has
sake
h17
7310
0D
isch
arge
Loa
d in
202
5 (k
g/da
y)B
OD
CO
DT-
NT-
PB
OD
CO
DT-
NT-
PB
OD
CO
DT-
NT-
PB
OD
CO
DT-
NT-
PPo
int
Sew
erag
e Sy
stem
657,
640
Load
Pit L
atrin
e1,
115,
460
23.9
41.3
1.5
1.3
26,6
15.4
46,0
12.7
1,69
2.6
1,48
1.2
2,66
1.5
4,60
1.3
169.
314
8.1
23,9
53.9
41,4
11.5
1,52
3.4
1,33
3.1
Tour
ist
Hot
el G
uest
285
32.3
56.1
7.7
2.6
9.2
16.0
2.2
0.7
0.9
1.6
0.2
0.1
8.3
14.4
2.0
0.7
Tota
l26
,624
.646
,028
.71,
694.
81,
481.
92,
662.
54,
602.
916
9.5
148.
223
,962
.241
,425
.91,
525.
31,
333.
762
0,91
338
.066
.09.
03.
023
,594
.740
,980
.25,
588.
21,
862.
723
,594
.740
,980
.25,
588.
21,
862.
70.
00.
00.
00.
036
,727
3.8
9.9
5.4
3.0
139.
636
3.6
198.
311
0.2
139.
636
3.6
198.
311
0.2
0.0
0.0
0.0
0.0
090
.0%
85.0
%40
.0%
0.0%
0.0
0.0
0.0
0.0
0.0
0.0
0.0
0.0
Tota
l23
,734
.241
,343
.85,
786.
51,
972.
923
,734
.241
,343
.85,
786.
51,
972.
90.
00.
00.
00.
05,
014
4,33
4.6
22,6
18.3
298.
975
.84,
334.
622
,618
.329
8.9
75.8
0.80
3,46
7.7
18,0
94.6
239.
160
.686
6.9
4,52
3.7
59.8
15.2
204
5.3
196.
10.
00.
05.
319
6.1
0.0
0.0
0.80
4.2
156.
90.
00.
01.
139
.20.
00.
0To
tal
4,33
9.9
22,8
14.4
298.
975
.83,
471.
918
,251
.523
9.1
60.6
868.
04,
562.
959
.815
.2To
tal
54,6
98.8
110,
187.
07,
780.
33,
530.
629
,868
.664
,198
.26,
195.
22,
181.
724
,830
.145
,988
.71,
585.
11,
348.
9N
on-P
oint
Fore
st16
3,52
90.
0057
0.01
150.
0022
70.
0000
622
758
4.6
1,16
9.2
230.
75.
80.
1058
.511
6.9
23.1
0.6
526.
21,
052.
320
7.6
5.2
Load
Bui
ldin
g an
d R
oad
72,0
310.
0773
0.15
450.
0032
70.
0014
422
73,
461.
06,
922.
114
6.3
64.3
0.30
1,03
8.3
2,07
6.6
43.9
19.3
2,42
2.7
4,84
5.4
102.
445
.0Irr
igat
ed L
and
703,
013
0.04
460.
0892
0.00
828
0.00
075
227
1000
105,
402.
221
0,80
4.5
19,5
67.9
1,77
7.4
0.10
10,5
40.2
21,0
80.4
1,95
6.8
177.
794
,862
.018
9,72
4.0
17,6
11.2
1,59
9.6
Non
-irrig
ated
Lan
d51
4,19
20.
0446
0.08
920.
0082
80.
0007
522
714
,262
.428
,524
.82,
647.
824
0.5
0.10
1,42
6.2
2,85
2.5
264.
824
.112
,836
.225
,672
.32,
383.
021
6.5
Tota
l12
3,71
0.3
247,
420.
622
,592
.82,
088.
013
,063
.226
,126
.52,
288.
522
1.7
110,
647.
122
1,29
4.1
20,3
04.2
1,86
6.3
Cat
le11
5,82
60.
0044
0.02
170.
0024
20.
0004
222
711
6.1
569.
763
.511
.011
.657
.06.
41.
110
4.5
512.
757
.29.
9Se
ep a
nd G
oat
2,77
3,53
50.
0011
0.00
540.
0006
10.
0001
022
768
2.1
3,41
0.3
383.
065
.668
.234
1.0
38.3
6.6
613.
93,
069.
334
4.7
59.0
Tota
l79
8.2
3,98
0.0
446.
576
.579
.839
8.0
44.7
7.7
718.
43,
582.
040
1.9
68.9
Tota
l12
4,50
8.5
251,
400.
623
,039
.32,
164.
513
,143
.126
,524
.52,
333.
222
9.3
111,
365.
422
4,87
6.1
20,7
06.1
1,93
5.2
179,
207.
236
1,58
7.5
30,8
19.6
5,69
5.2
43,0
11.7
90,7
22.7
8,52
8.4
2,41
1.1
136,
195.
627
0,86
4.8
22,2
91.3
3,28
4.1
Flam
e: L
ivin
g Sy
stem
(per
son)
, Se
war
age
Syst
em (d
isch
arge
d vo
lum
e or
per
son)
, Ind
ustry
(dis
char
ed v
olum
e (m
3/da
y)),
Land
Use
Sys
tem
(ha)
, Liv
e St
ock
(hea
d)Po
int-L
oad/
Tota
l-Loa
dIn
filtra
tion/
Run
off
Bas
ic U
nit:
Livi
ng S
yste
m (g
/per
son/
day)
, Lan
d U
se (k
g/ha
/mm
), Li
ve S
tock
( (g/
head
/day
)/mm
)Po
int/N
onPo
int
0.69
0.71
0.73
0.90
3.2
3.0
2.6
1.4
2025
/200
61.
391.
481.
371.
391.
31.
31.
31.
3
Infil
tratio
n Lo
ad in
202
5 (k
g/da
y)
Infil
tratio
n Lo
ad in
202
5 (k
g/da
y)
Tabl
e A
8.1.
2 S
umm
ary
of D
ischa
rge
Load
, Run
off L
oad
and
Infil
trat
ion
Load
in T
his S
tudy
Are
a (C
ase
1: 2
025)
0.10
Tota
l
Live
Stoc
kS y
stem
Indu
stry
Priv
ate
Publ
ic
Land
Use
Syst
em
Sew
erag
eSy
stem
Unt
reat
ed S
ewer
age
(Pip
e La
ying
)
1.00
Seco
ndar
y Tr
eatm
ent (
Dom
estic
)Se
cond
ary
Trea
tmen
t (In
dust
ry)
Terti
ary
Trea
tmen
t
Run
off L
oad
in 2
025
(kg/
day)
Livi
ngSy
stem
Dom
estic
S yst
em0.
10
0.10
Tota
l
Com
partm
enta
tion
of P
ollu
tion
Load
Flam
e in
2025
Bas
ic U
nit f
or D
isch
arge
Loa
d in
202
5Pr
ecip
itatio
n(m
m)
Irrig
atio
nW
ater
(mm
)R
unof
f Rat
e
Live
Stoc
kS y
stem
Indu
stry
Priv
ate
Publ
ic
Land
Use
Syst
em
Sew
erag
eSy
stem
Unt
reat
ed S
ewer
age
(Pip
e La
ying
)
1.00
Seco
ndar
y Tr
eatm
ent (
Dom
estic
)Se
cond
ary
Trea
tmen
t (In
dust
ry)
Terti
ary
Trea
tmen
t
Run
off L
oad
in 2
025
(kg/
day)
Livi
ngSy
stem
Dom
estic
S yst
em0.
10
Com
partm
enta
tion
of P
ollu
tion
Load
Flam
e in
2025
Bas
ic U
nit f
or D
isch
arge
Loa
d in
202
5Pr
ecip
itatio
n(m
m)
Irrig
atio
nW
ater
(mm
)R
unof
f Rat
e
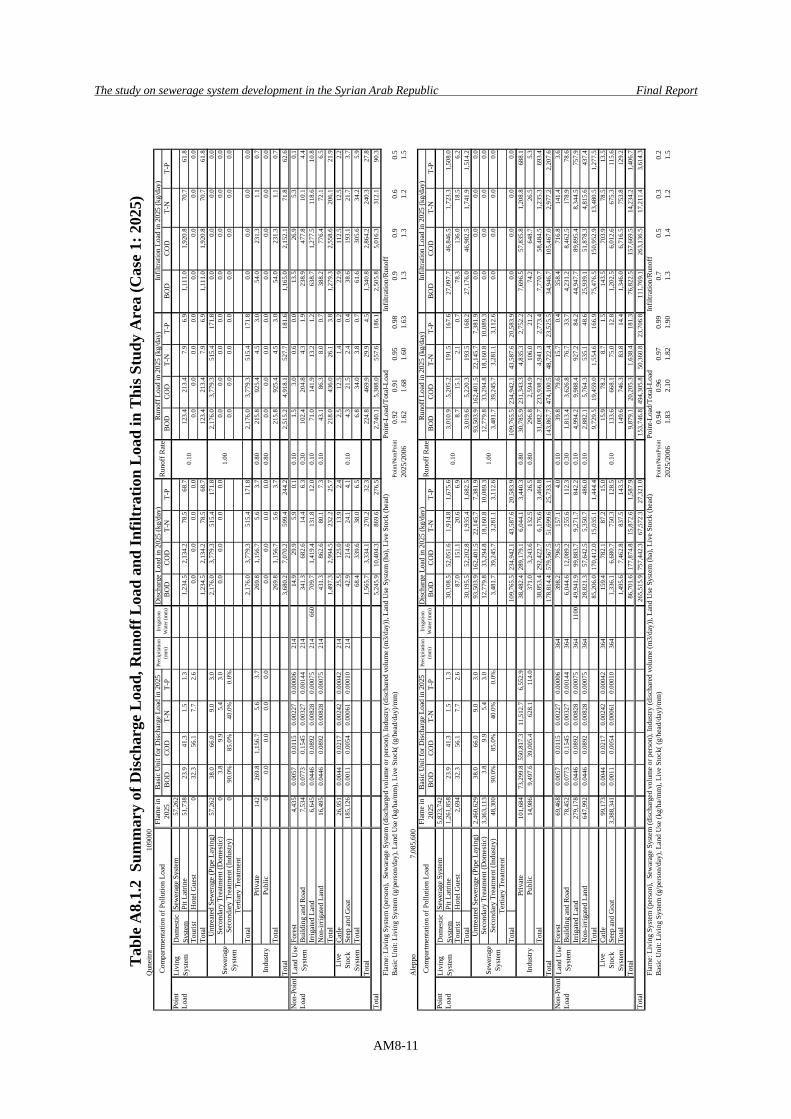
The study on sewerage system development in the Syrian Arab Republic Final Report
AM8-11
Qun
eitra
1090
00D
isch
arge
Loa
d in
202
5 (k
g/da
y)B
OD
CO
DT-
NT-
PB
OD
CO
DT-
NT-
PB
OD
CO
DT-
NT-
PB
OD
CO
DT-
NT-
PPo
int
Sew
erag
e Sy
stem
57,2
62Lo
adPi
t Lat
rine
51,7
3823
.941
.31.
51.
31,
234.
52,
134.
278
.568
.712
3.4
213.
47.
96.
91,
111.
01,
920.
870
.761
.8To
uris
tH
otel
Gue
st0
32.3
56.1
7.7
2.6
0.0
0.0
0.0
0.0
0.0
0.0
0.0
0.0
0.0
0.0
0.0
0.0
Tota
l1,
234.
52,
134.
278
.568
.712
3.4
213.
47.
96.
91,
111.
01,
920.
870
.761
.857
,262
38.0
66.0
9.0
3.0
2,17
6.0
3,77
9.3
515.
417
1.8
2,17
6.0
3,77
9.3
515.
417
1.8
0.0
0.0
0.0
0.0
03.
89.
95.
43.
00.
00.
00.
00.
00.
00.
00.
00.
00.
00.
00.
00.
00
90.0
%85
.0%
40.0
%0.
0%0.
00.
00.
00.
00.
00.
00.
00.
0
Tota
l2,
176.
03,
779.
351
5.4
171.
82,
176.
03,
779.
351
5.4
171.
80.
00.
00.
00.
014
226
9.8
1,15
6.7
5.6
3.7
269.
81,
156.
75.
63.
70.
8021
5.8
925.
44.
53.
054
.023
1.3
1.1
0.7
00.
00.
00.
00.
00.
00.
00.
00.
00.
800.
00.
00.
00.
00.
00.
00.
00.
0To
tal
269.
81,
156.
75.
63.
721
5.8
925.
44.
53.
054
.023
1.3
1.1
0.7
Tota
l3,
680.
27,
070.
259
9.4
244.
22,
515.
24,
918.
152
7.7
181.
61,
165.
02,
152.
171
.862
.6N
on-P
oint
Fore
st4,
435
0.00
570.
0115
0.00
227
0.00
006
214
14.9
29.9
5.9
0.1
0.10
1.5
3.0
0.6
0.0
13.5
26.9
5.3
0.1
Load
Bui
ldin
g an
d R
oad
7,53
40.
0773
0.15
450.
0032
70.
0014
421
434
1.3
682.
614
.46.
30.
3010
2.4
204.
84.
31.
923
8.9
477.
810
.14.
4Irr
igat
ed L
and
6,64
50.
0446
0.08
920.
0082
80.
0007
521
466
070
9.7
1,41
9.4
131.
812
.00.
1071
.014
1.9
13.2
1.2
638.
71,
277.
511
8.6
10.8
Non
-irrig
ated
Lan
d16
,495
0.04
460.
0892
0.00
828
0.00
075
214
431.
386
2.6
80.1
7.3
0.10
43.1
86.3
8.0
0.7
388.
277
6.4
72.1
6.5
Tota
l1,
497.
32,
994.
523
2.2
25.7
218.
043
6.0
26.1
3.8
1,27
9.3
2,55
8.6
206.
121
.9C
atle
26,9
510.
0044
0.02
170.
0024
20.
0004
221
425
.512
5.0
13.9
2.4
2.5
12.5
1.4
0.2
22.9
112.
512
.52.
2Se
ep a
nd G
oat
185,
126
0.00
110.
0054
0.00
061
0.00
010
214
42.9
214.
624
.14.
14.
321
.52.
40.
438
.619
3.1
21.7
3.7
Tota
l68
.433
9.6
38.0
6.5
6.8
34.0
3.8
0.7
61.6
305.
634
.25.
9To
tal
1,56
5.7
3,33
4.1
270.
232
.322
4.8
469.
929
.94.
51,
340.
82,
864.
224
0.3
27.8
5,24
5.9
10,4
04.3
869.
627
6.5
2,74
0.1
5,38
8.0
557.
618
6.1
2,50
5.8
5,01
6.3
312.
190
.3Fl
ame:
Liv
ing
Syst
em (p
erso
n),
Sew
arag
e Sy
stem
(dis
char
ged
volu
me
or p
erso
n), I
ndus
try (d
isch
ared
vol
ume
(m3/
day)
), La
nd U
se S
yste
m (h
a), L
ive
Stoc
k (h
ead)
Poin
t-Loa
d/To
tal-L
oad
Infil
tratio
n/R
unof
fB
asic
Uni
t: Li
ving
Sys
tem
(g/p
erso
n/da
y), L
and
Use
(kg/
ha/m
m),
Live
Sto
ck( (
g/he
ad/d
ay)/m
m)
Poin
t/Non
Poin
t0.
920.
910.
950.
980.
90.
90.
60.
520
25/2
006
1.62
1.68
1.60
1.63
1.3
1.3
1.2
1.5
Ale
ppo
7,08
5,60
0D
isch
arge
Loa
d in
202
5 (k
g/da
y)B
OD
CO
DT-
NT-
PB
OD
CO
DT-
NT-
PB
OD
CO
DT-
NT-
PB
OD
CO
DT-
NT-
PPo
int
Sew
erag
e Sy
stem
5,82
3,74
2Lo
adPi
t Lat
rine
1,26
1,85
823
.941
.31.
51.
330
,108
.552
,051
.61,
914.
81,
675.
63,
010.
95,
205.
219
1.5
167.
627
,097
.746
,846
.51,
723.
31,
508.
0To
uris
tH
otel
Gue
st2,
694
32.3
56.1
7.7
2.6
87.0
151.
120
.66.
98.
715
.12.
10.
778
.313
6.0
18.5
6.2
Tota
l30
,195
.552
,202
.81,
935.
41,
682.
53,
019.
65,
220.
319
3.5
168.
227
,176
.046
,982
.51,
741.
91,
514.
22,
460,
629
38.0
66.0
9.0
3.0
93,5
03.9
162,
401.
522
,145
.77,
381.
993
,503
.916
2,40
1.5
22,1
45.7
7,38
1.9
0.0
0.0
0.0
0.0
3,36
3,11
33.
89.
95.
43.
012
,779
.833
,294
.818
,160
.810
,089
.312
,779
.833
,294
.818
,160
.810
,089
.30.
00.
00.
00.
048
,300
90.0
%85
.0%
40.0
%0.
0%3,
481.
739
,245
.73,
281.
13,
112.
63,
481.
739
,245
.73,
281.
13,
112.
60.
00.
00.
00.
0
Tota
l10
9,76
5.5
234,
942.
143
,587
.620
,583
.910
9,76
5.5
234,
942.
143
,587
.620
,583
.90.
00.
00.
00.
010
1,68
473
,299
.855
0,81
7.3
11,5
12.7
6,55
2.9
38,4
82.4
289,
179.
16,
044.
13,
440.
30.
8030
,785
.923
1,34
3.3
4,83
5.3
2,75
2.2
7,69
6.5
57,8
35.8
1,20
8.8
688.
114
,986
9,49
7.6
39,0
05.4
628.
111
4.0
371.
03,
243.
613
2.5
26.5
0.80
296.
82,
594.
910
6.0
21.2
74.2
648.
726
.55.
3To
tal
38,8
53.4
292,
422.
76,
176.
63,
466.
831
,082
.723
3,93
8.2
4,94
1.3
2,77
3.4
7,77
0.7
58,4
84.5
1,23
5.3
693.
4To
tal
178,
814.
457
9,56
7.5
51,6
99.6
25,7
33.1
143,
867.
747
4,10
0.5
48,7
22.4
23,5
25.5
34,9
46.7
105,
467.
02,
977.
22,
207.
6N
on-P
oint
Fore
st69
,468
0.00
570.
0115
0.00
227
0.00
006
364
398.
279
6.5
157.
14.
00.
1039
.879
.615
.70.
435
8.4
716.
814
1.4
3.6
Load
Bui
ldin
g an
d R
oad
78,4
520.
0773
0.15
450.
0032
70.
0014
436
46,
044.
612
,089
.225
5.6
112.
30.
301,
813.
43,
626.
876
.733
.74,
231.
28,
462.
517
8.9
78.6
Irrig
ated
Lan
d27
9,17
80.
0446
0.08
920.
0082
80.
0007
536
411
0049
,941
.999
,883
.79,
271.
784
2.2
0.10
4,99
4.2
9,98
8.4
927.
284
.244
,947
.789
,895
.48,
344.
575
7.9
Non
-irrig
ated
Lan
d64
7,99
20.
0446
0.08
920.
0082
80.
0007
536
428
,821
.357
,642
.55,
350.
748
6.0
0.10
2,88
2.1
5,76
4.3
535.
148
.625
,939
.151
,878
.34,
815.
643
7.4
Tota
l85
,206
.017
0,41
2.0
15,0
35.1
1,44
4.4
9,72
9.5
19,4
59.0
1,55
4.6
166.
975
,476
.515
0,95
2.9
13,4
80.5
1,27
7.5
Cat
le99
,173
0.00
440.
0217
0.00
242
0.00
042
364
159.
478
2.1
87.2
15.0
15.9
78.2
8.7
1.5
143.
570
3.9
78.5
13.5
Seep
and
Goa
t3,
388,
341
0.00
110.
0054
0.00
061
0.00
010
364
1,33
6.1
6,68
0.7
750.
312
8.5
133.
666
8.1
75.0
12.8
1,20
2.5
6,01
2.6
675.
311
5.6
Tota
l1,
495.
67,
462.
883
7.5
143.
514
9.6
746.
383
.814
.41,
346.
06,
716.
575
3.8
129.
2To
tal
86,7
01.6
177,
874.
815
,872
.61,
587.
99,
879.
120
,205
.31,
638.
418
1.3
76,8
22.5
157,
669.
514
,234
.21,
406.
726
5,51
5.9
757,
442.
367
,572
.327
,321
.015
3,74
6.8
494,
305.
850
,360
.823
,706
.811
1,76
9.1
263,
136.
517
,211
.43,
614.
3Fl
ame:
Liv
ing
Syst
em (p
erso
n),
Sew
arag
e Sy
stem
(dis
char
ged
volu
me
or p
erso
n), I
ndus
try (d
isch
ared
vol
ume
(m3/
day)
), La
nd U
se S
yste
m (h
a), L
ive
Stoc
k (h
ead)
Poin
t-Loa
d/To
tal-L
oad
Infil
tratio
n/R
unof
fB
asic
Uni
t: Li
ving
Sys
tem
(g/p
erso
n/da
y), L
and
Use
(kg/
ha/m
m),
Live
Sto
ck( (
g/he
ad/d
ay)/m
m)
Poin
t/Non
Poin
t0.
940.
960.
970.
990.
70.
50.
30.
220
25/2
006
1.83
2.10
1.82
1.90
1.3
1.4
1.2
1.5
Infil
tratio
n Lo
ad in
202
5 (k
g/da
y)
Infil
tratio
n Lo
ad in
202
5 (k
g/da
y)
0.10
Sew
erag
eSy
stem
Unt
reat
ed S
ewer
age
(Pip
e La
ying
)
1.00
Seco
ndar
y Tr
eatm
ent (
Dom
estic
)Se
cond
ary
Trea
tmen
t (In
dust
ry)
Terti
ary
Trea
tmen
t
Run
off L
oad
in 2
025
(kg/
day)
Tota
l
Indu
stry
Priv
ate
Publ
ic
Land
Use
Syst
em
Live
Stoc
kSy
stem
Livi
ngSy
stem
Dom
estic
S yst
em0.
10
0.10
Tota
l
Com
partm
enta
tion
of P
ollu
tion
Load
Flam
e in
2025
Bas
ic U
nit f
or D
isch
arge
Loa
d in
202
5Pr
ecip
itatio
n(m
m)
Irrig
atio
nW
ater
(mm
)R
unof
f Rat
e
Live
Stoc
kS y
stem
Indu
stry
Priv
ate
Publ
ic
Land
Use
Syst
em
Sew
erag
eSy
stem
Unt
reat
ed S
ewer
age
(Pip
e La
ying
)
1.00
Seco
ndar
y Tr
eatm
ent (
Dom
estic
)Se
cond
ary
Trea
tmen
t (In
dust
ry)
Terti
ary
Trea
tmen
t
Run
off L
oad
in 2
025
(kg/
day)
Livi
ngSy
stem
Dom
estic
S yst
em0.
10
Com
partm
enta
tion
of P
ollu
tion
Load
Flam
e in
2025
Bas
ic U
nit f
or D
isch
arge
Loa
d in
202
5Pr
ecip
itatio
n(m
m)
Irrig
atio
nW
ater
(mm
)R
unof
f Rat
e
Tabl
e A
8.1.
2 S
umm
ary
of D
ischa
rge
Load
, Run
off L
oad
and
Infil
trat
ion
Load
in T
his S
tudy
Are
a (C
ase
1: 2
025)
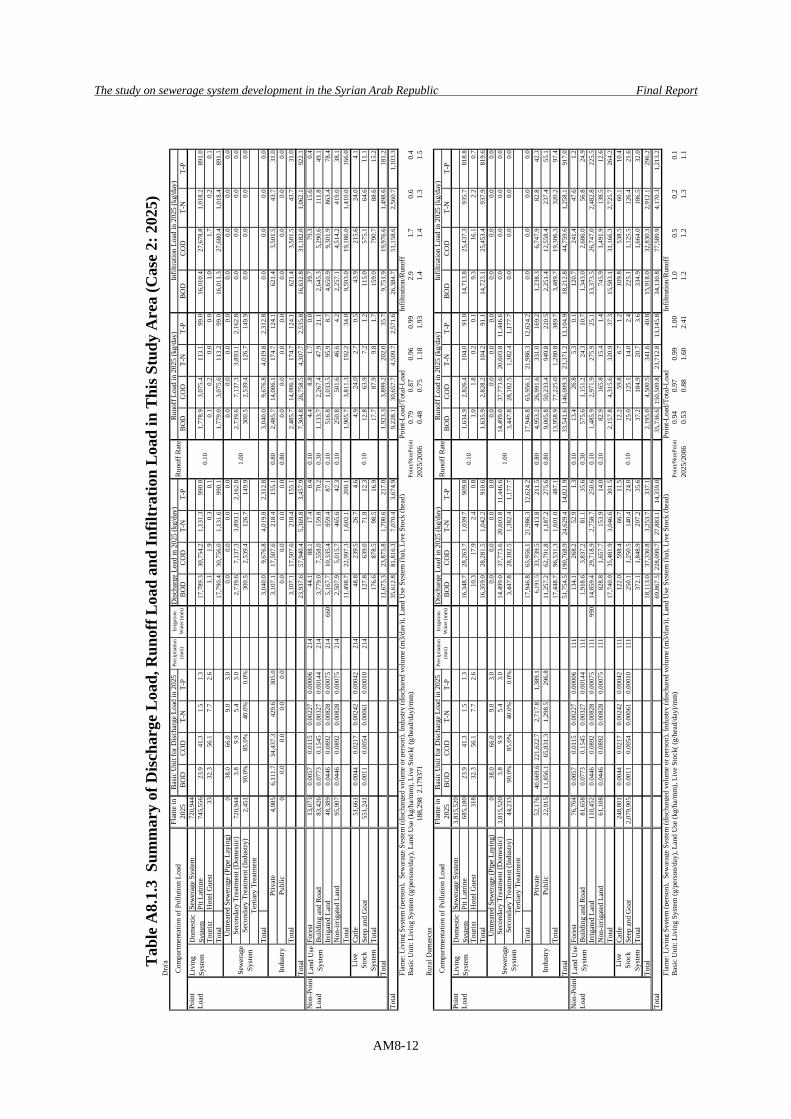
The study on sewerage system development in the Syrian Arab Republic Final Report
AM8-12
Dra
'aD
isch
arge
Loa
d in
202
5 (k
g/da
y)B
OD
CO
DT-
NT-
PB
OD
CO
DT-
NT-
PB
OD
CO
DT-
NT-
PB
OD
CO
DT-
NT-
PPo
int
Sew
erag
e Sy
stem
720,
944
Load
Pit L
atrin
e74
5,55
623
.941
.31.
51.
317
,789
.330
,754
.21,
131.
399
0.0
1,77
8.9
3,07
5.4
113.
199
.016
,010
.427
,678
.81,
018.
289
1.0
Tour
ist
Hot
el G
uest
3332
.356
.17.
72.
61.
11.
90.
30.
10.
10.
20.
00.
01.
01.
70.
20.
1To
tal
17,7
90.4
30,7
56.0
1,13
1.6
990.
11,
779.
03,
075.
611
3.2
99.0
16,0
11.3
27,6
80.4
1,01
8.4
891.
10
38.0
66.0
9.0
3.0
0.0
0.0
0.0
0.0
0.0
0.0
0.0
0.0
0.0
0.0
0.0
0.0
720,
944
3.8
9.9
5.4
3.0
2,73
9.6
7,13
7.3
3,89
3.1
2,16
2.8
2,73
9.6
7,13
7.3
3,89
3.1
2,16
2.8
0.0
0.0
0.0
0.0
2,45
190
.0%
85.0
%40
.0%
0.0%
300.
52,
539.
412
6.7
149.
930
0.5
2,53
9.4
126.
714
9.9
0.0
0.0
0.0
0.0
Tota
l3,
040.
09,
676.
84,
019.
82,
312.
83,
040.
09,
676.
84,
019.
82,
312.
80.
00.
00.
00.
04,
985
6,11
1.7
34,4
37.3
429.
630
5.0
3,10
7.1
17,5
07.6
218.
415
5.1
0.80
2,48
5.7
14,0
06.1
174.
712
4.1
621.
43,
501.
543
.731
.00
0.0
0.0
0.0
0.0
0.0
0.0
0.0
0.0
0.80
0.0
0.0
0.0
0.0
0.0
0.0
0.0
0.0
Tota
l3,
107.
117
,507
.621
8.4
155.
12,
485.
714
,006
.117
4.7
124.
162
1.4
3,50
1.5
43.7
31.0
Tota
l23
,937
.657
,940
.45,
369.
83,
457.
97,
304.
826
,758
.54,
307.
72,
535.
816
,632
.831
,182
.01,
062.
192
2.1
Non
-Poi
ntFo
rest
13,0
730.
0057
0.01
150.
0022
70.
0000
621
444
.188
.117
.40.
40.
104.
48.
81.
70.
039
.779
.315
.60.
4Lo
adB
uild
ing
and
Roa
d83
,426
0.07
730.
1545
0.00
327
0.00
144
214
3,77
9.0
7,55
8.0
159.
870
.20.
301,
133.
72,
267.
447
.921
.12,
645.
35,
290.
611
1.8
49.1
Irrig
ated
Lan
d48
,389
0.04
460.
0892
0.00
828
0.00
075
214
660
5,16
7.7
10,3
35.4
959.
487
.10.
1051
6.8
1,03
3.5
95.9
8.7
4,65
0.9
9,30
1.9
863.
478
.4N
on-ir
rigat
ed L
and
95,9
070.
0446
0.08
920.
0082
80.
0007
521
42,
507.
95,
015.
746
5.6
42.3
0.10
250.
850
1.6
46.6
4.2
2,25
7.1
4,51
4.2
419.
038
.1To
tal
11,4
98.7
22,9
97.3
1,60
2.1
200.
11,
905.
73,
811.
319
2.2
34.0
9,59
3.0
19,1
86.0
1,41
0.0
166.
0C
atle
51,6
610.
0044
0.02
170.
0024
20.
0004
221
448
.823
9.5
26.7
4.6
4.9
24.0
2.7
0.5
43.9
215.
624
.04.
1Se
ep a
nd G
oat
551,
241
0.00
110.
0054
0.00
061
0.00
010
214
127.
863
9.0
71.8
12.3
12.8
63.9
7.2
1.2
115.
057
5.1
64.6
11.1
Tota
l17
6.6
878.
598
.516
.917
.787
.99.
81.
715
9.0
790.
788
.615
.2To
tal
11,6
75.3
23,8
75.8
1,70
0.6
217.
01,
923.
33,
899.
220
2.0
35.7
9,75
1.9
19,9
76.6
1,49
8.6
181.
235
,612
.881
,816
.37,
070.
43,
674.
99,
228.
130
,657
.74,
509.
72,
571.
626
,384
.751
,158
.62,
560.
71,
103.
3Fl
ame:
Liv
ing
Syst
em (p
erso
n),
Sew
arag
e Sy
stem
(dis
char
ged
volu
me
or p
erso
n), I
ndus
try (d
isch
ared
vol
ume
(m3/
day)
), La
nd U
se S
yste
m (h
a), L
ive
Stoc
k (h
ead)
Poin
t-Loa
d/To
tal-L
oad
Infil
tratio
n/R
unof
fB
asic
Uni
t: Li
ving
Sys
tem
(g/p
erso
n/da
y), L
and
Use
(kg/
ha/m
m),
Live
Sto
ck( (
g/he
ad/d
ay)/m
m)
Poin
t/Non
Poin
t0.
790.
870.
960.
992.
91.
70.
60.
418
8,29
82.
1793
7120
25/2
006
0.48
0.75
1.18
1.93
1.4
1.4
1.3
1.5
Rur
al D
amas
cus
Dis
char
ge L
oad
in 2
025
(kg/
day)
BO
DC
OD
T-N
T-P
BO
DC
OD
T-N
T-P
BO
DC
OD
T-N
T-P
BO
DC
OD
T-N
T-P
Poin
tSe
wer
age
Syst
em3,
815,
520
Load
Pit L
atrin
e68
5,18
023
.941
.31.
51.
316
,348
.728
,263
.71,
039.
790
9.8
1,63
4.9
2,82
6.4
104.
091
.014
,713
.825
,437
.393
5.7
818.
8To
uris
tH
otel
Gue
st31
832
.356
.17.
72.
610
.317
.92.
40.
81.
01.
80.
20.
19.
316
.12.
20.
7To
tal
16,3
59.0
28,2
81.5
1,04
2.2
910.
61,
635.
92,
828.
210
4.2
91.1
14,7
23.1
25,4
53.4
937.
981
9.6
038
.066
.09.
03.
00.
00.
00.
00.
00.
00.
00.
00.
00.
00.
00.
00.
03,
815,
520
3.8
9.9
5.4
3.0
14,4
99.0
37,7
73.6
20,6
03.8
11,4
46.6
14,4
99.0
37,7
73.6
20,6
03.8
11,4
46.6
0.0
0.0
0.0
0.0
44,2
3390
.0%
85.0
%40
.0%
0.0%
3,44
7.8
28,1
82.5
1,38
2.4
1,17
7.7
3,44
7.8
28,1
82.5
1,38
2.4
1,17
7.7
0.0
0.0
0.0
0.0
Tota
l17
,946
.865
,956
.121
,986
.312
,624
.217
,946
.865
,956
.121
,986
.312
,624
.20.
00.
00.
00.
052
,176
40,6
69.6
221,
622.
72,
717.
81,
389.
16,
191.
533
,739
.541
3.8
211.
50.
804,
953.
226
,991
.633
1.0
169.
21,
238.
36,
747.
982
.842
.322
,915
11,8
56.1
65,8
31.3
1,29
8.5
296.
811
,257
.262
,791
.81,
187.
227
5.6
0.80
9,00
5.8
50,2
33.4
949.
822
0.5
2,25
1.4
12,5
58.4
237.
455
.1To
tal
17,4
48.7
96,5
31.3
1,60
1.0
487.
113
,958
.977
,225
.01,
280.
838
9.7
3,48
9.7
19,3
06.3
320.
297
.4To
tal
51,7
54.5
190,
768.
924
,629
.414
,021
.933
,541
.614
6,00
9.3
23,3
71.2
13,1
04.9
18,2
12.8
44,7
59.6
1,25
8.1
917.
0N
on-P
oint
Fore
st76
,704
0.00
570.
0115
0.00
227
0.00
006
111
134.
126
8.2
52.9
1.3
0.10
13.4
26.8
5.3
0.1
120.
724
1.4
47.6
1.2
Load
Bui
ldin
g an
d R
oad
81,6
580.
0773
0.15
450.
0032
70.
0014
411
11,
918.
63,
837.
281
.135
.60.
3057
5.6
1,15
1.2
24.3
10.7
1,34
3.0
2,68
6.0
56.8
24.9
Irrig
ated
Lan
d11
0,45
20.
0446
0.08
920.
0082
80.
0007
511
199
014
,859
.429
,718
.92,
758.
725
0.6
0.10
1,48
5.9
2,97
1.9
275.
925
.113
,373
.526
,747
.02,
482.
822
5.5
Non
-irrig
ated
Lan
d61
,108
0.04
460.
0892
0.00
828
0.00
075
111
828.
81,
657.
715
3.9
14.0
0.10
82.9
165.
815
.41.
474
5.9
1,49
1.9
138.
512
.6To
tal
17,7
40.9
35,4
81.9
3,04
6.6
301.
52,
157.
84,
315.
632
0.9
37.3
15,5
83.1
31,1
66.3
2,72
5.7
264.
2C
atle
248,
801
0.00
440.
0217
0.00
242
0.00
042
111
122.
059
8.4
66.7
11.5
12.2
59.8
6.7
1.2
109.
853
8.5
60.1
10.4
Seep
and
Goa
t2,
079,
905
0.00
110.
0054
0.00
061
0.00
010
111
250.
11,
250.
514
0.4
24.0
25.0
125.
114
.02.
422
5.1
1,12
5.5
126.
421
.6To
tal
372.
11,
848.
920
7.2
35.6
37.2
184.
920
.73.
633
4.9
1,66
4.0
186.
532
.0To
tal
18,1
13.0
37,3
30.8
3,25
3.7
337.
12,
195.
04,
500.
534
1.6
40.8
15,9
18.0
32,8
30.3
2,91
2.1
296.
269
,867
.522
8,09
9.7
27,8
83.1
14,3
59.0
35,7
36.6
150,
509.
823
,712
.813
,145
.834
,130
.877
,589
.94,
170.
31,
213.
2Fl
ame:
Liv
ing
Syst
em (p
erso
n),
Sew
arag
e Sy
stem
(dis
char
ged
volu
me
or p
erso
n), I
ndus
try (d
isch
ared
vol
ume
(m3/
day)
), La
nd U
se S
yste
m (h
a), L
ive
Stoc
k (h
ead)
Poin
t-Loa
d/To
tal-L
oad
Infil
tratio
n/R
unof
fB
asic
Uni
t: Li
ving
Sys
tem
(g/p
erso
n/da
y), L
and
Use
(kg/
ha/m
m),
Live
Sto
ck( (
g/he
ad/d
ay)/m
m)
Poin
t/Non
Poin
t0.
940.
970.
991.
001.
00.
50.
20.
120
25/2
006
0.53
0.88
1.60
2.41
1.2
1.2
1.3
1.1
Tabl
e A
8.1.
3 S
umm
ary
of D
ischa
rge
Load
, Run
off L
oad
and
Infil
trat
ion
Load
in T
his S
tudy
Are
a (C
ase
2: 2
025)
In
filtra
tion
Load
in 2
025
(kg/
day)
Infil
tratio
n Lo
ad in
202
5 (k
g/da
y)
Irrig
atio
nW
ater
(mm
)R
unof
f Rat
eR
unof
f Loa
d in
202
5 (k
g/da
y)
0.10
Run
off L
oad
in 2
025
(kg/
day)
0.10
Livi
ngSy
stem
Dom
estic
S yst
em0.
10
Com
partm
enta
tion
of P
ollu
tion
Load
Flam
e in
2025
Bas
ic U
nit f
or D
isch
arge
Loa
d in
202
5Pr
ecip
itatio
n(m
m)
Sew
erag
eSy
stem
Unt
reat
ed S
ewer
age
(Pip
e La
ying
)
1.00
Seco
ndar
y Tr
eatm
ent (
Dom
estic
)
Terti
ary
Trea
tmen
tSe
cond
ary
Trea
tmen
t (In
dust
ry)
Indu
stry
Priv
ate
Publ
ic
Land
Use
Syst
em
Prec
ipita
tion
(mm
)Irr
igat
ion
Wat
er (m
m)
Run
off R
ate
Live
Stoc
kSy
stem
Tota
l
Com
partm
enta
tion
of P
ollu
tion
Load
Flam
e in
2025
Bas
ic U
nit f
or D
isch
arge
Loa
d in
202
5
Livi
ngSy
stem
Dom
estic
S yst
em0.
10
Sew
erag
eSy
stem
Unt
reat
ed S
ewer
age
(Pip
e La
ying
)
1.00
Seco
ndar
y Tr
eatm
ent (
Dom
estic
)
Terti
ary
Trea
tmen
tSe
cond
ary
Trea
tmen
t (In
dust
ry)
Indu
stry
Priv
ate
Publ
ic
Land
Use
Syst
em
Live
Stoc
kSy
stem
Tota
l
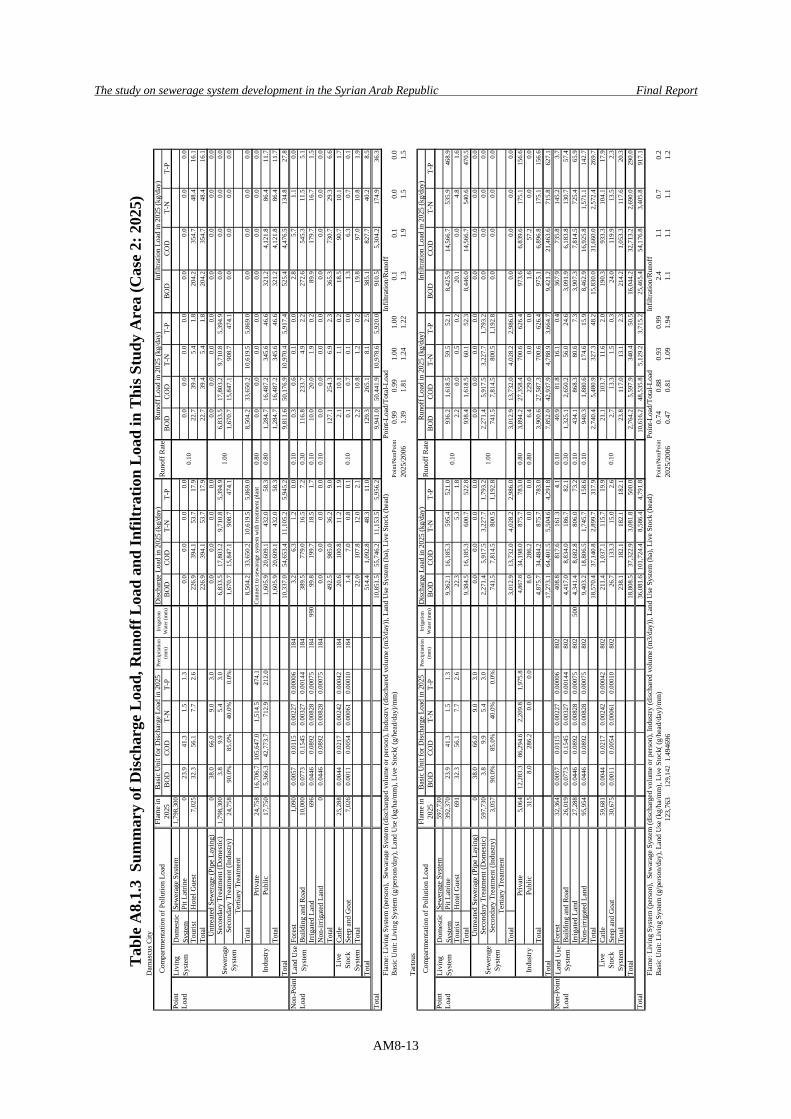
The study on sewerage system development in the Syrian Arab Republic Final Report
AM8-13
Dam
ascu
s City
Dis
char
ge L
oad
in 2
025
(kg/
day)
BO
DC
OD
T-N
T-P
BO
DC
OD
T-N
T-P
BO
DC
OD
T-N
T-P
BO
DC
OD
T-N
T-P
Poin
tSe
wer
age
Syst
em1,
798,
300
Load
Pit L
atrin
e0
23.9
41.3
1.5
1.3
0.0
0.0
0.0
0.0
0.0
0.0
0.0
0.0
0.0
0.0
0.0
0.0
Tour
ist
Hot
el G
uest
7,02
532
.356
.17.
72.
622
6.9
394.
153
.717
.922
.739
.45.
41.
820
4.2
354.
748
.416
.1To
tal
226.
939
4.1
53.7
17.9
22.7
39.4
5.4
1.8
204.
235
4.7
48.4
16.1
038
.066
.09.
03.
00.
00.
00.
00.
00.
00.
00.
00.
00.
00.
00.
00.
01,
798,
300
3.8
9.9
5.4
3.0
6,83
3.5
17,8
03.2
9,71
0.8
5,39
4.9
6,83
3.5
17,8
03.2
9,71
0.8
5,39
4.9
0.0
0.0
0.0
0.0
24,7
5890
.0%
85.0
%40
.0%
0.0%
1,67
0.7
15,8
47.1
908.
747
4.1
1,67
0.7
15,8
47.1
908.
747
4.1
0.0
0.0
0.0
0.0
Tota
l8,
504.
233
,650
.210
,619
.55,
869.
08,
504.
233
,650
.210
,619
.55,
869.
00.
00.
00.
00.
024
,758
16,7
06.7
105,
647.
01,
514.
547
4.1
Con
nect
to se
war
age
syst
em w
ith tr
eatm
ent p
lant
0.80
0.0
0.0
0.0
0.0
0.0
0.0
0.0
0.0
17,7
505,
366.
342
,773
.771
2.9
212.
01,
605.
920
,609
.143
2.0
58.3
0.80
1,28
4.7
16,4
87.2
345.
646
.632
1.2
4,12
1.8
86.4
11.7
Tota
l1,
605.
920
,609
.143
2.0
58.3
1,28
4.7
16,4
87.2
345.
646
.632
1.2
4,12
1.8
86.4
11.7
Tota
l10
,337
.054
,653
.411
,105
.25,
945.
29,
811.
650
,176
.910
,970
.45,
917.
452
5.4
4,47
6.5
134.
827
.8N
on-P
oint
Fore
st1,
090
0.00
570.
0115
0.00
227
0.00
006
184
3.2
6.3
1.2
0.0
0.10
0.3
0.6
0.1
0.0
2.8
5.7
1.1
0.0
Load
Bui
ldin
g an
d R
oad
10,0
000.
0773
0.15
450.
0032
70.
0014
418
438
9.5
779.
016
.57.
20.
3011
6.8
233.
74.
92.
227
2.6
545.
311
.55.
1Irr
igat
ed L
and
696
0.04
460.
0892
0.00
828
0.00
075
184
990
99.8
199.
718
.51.
70.
1010
.020
.01.
90.
289
.917
9.7
16.7
1.5
Non
-irrig
ated
Lan
d0
0.04
460.
0892
0.00
828
0.00
075
184
0.0
0.0
0.0
0.0
0.10
0.0
0.0
0.0
0.0
0.0
0.0
0.0
0.0
Tota
l49
2.5
985.
036
.29.
012
7.1
254.
36.
92.
336
5.3
730.
729
.36.
6C
atle
25,2
880.
0044
0.02
170.
0024
20.
0004
218
420
.610
0.8
11.2
1.9
2.1
10.1
1.1
0.2
18.5
90.7
10.1
1.7
Seep
and
Goa
t7,
026
0.00
110.
0054
0.00
061
0.00
010
184
1.4
7.0
0.8
0.1
0.1
0.7
0.1
0.0
1.3
6.3
0.7
0.1
Tota
l22
.010
7.8
12.0
2.1
2.2
10.8
1.2
0.2
19.8
97.0
10.8
1.9
Tota
l51
4.4
1,09
2.8
48.3
11.0
129.
326
5.1
8.1
2.5
385.
182
7.7
40.2
8.5
10,8
51.5
55,7
46.2
11,1
53.5
5,95
6.2
9,94
1.0
50,4
41.9
10,9
78.6
5,92
0.0
910.
55,
304.
217
4.9
36.3
Flam
e: L
ivin
g Sy
stem
(per
son)
, Se
war
age
Syst
em (d
isch
arge
d vo
lum
e or
per
son)
, Ind
ustry
(dis
char
ed v
olum
e (m
3/da
y)),
Land
Use
Sys
tem
(ha)
, Liv
e St
ock
(hea
d)Po
int-L
oad/
Tota
l-Loa
dIn
filtra
tion/
Run
off
Bas
ic U
nit:
Livi
ng S
yste
m (g
/per
son/
day)
, Lan
d U
se (k
g/ha
/mm
), Li
ve S
tock
( (g/
head
/day
)/mm
)Po
int/N
onPo
int
0.99
0.99
1.00
1.00
0.1
0.1
0.0
0.0
2025
/200
61.
391.
811.
241.
221.
31.
91.
51.
5Ta
rtous
Dis
char
ge L
oad
in 2
025
(kg/
day)
BO
DC
OD
T-N
T-P
BO
DC
OD
T-N
T-P
BO
DC
OD
T-N
T-P
BO
DC
OD
T-N
T-P
Poin
tSe
wer
age
Syst
em59
7,73
0Lo
adPi
t Lat
rine
392,
370
23.9
41.3
1.5
1.3
9,36
2.1
16,1
85.3
595.
452
1.0
936.
21,
618.
559
.552
.18,
425.
914
,566
.753
5.9
468.
9To
uris
tH
otel
Gue
st69
132
.356
.17.
72.
622
.35.
31.
82.
20.
00.
50.
220
.10.
04.
81.
6To
tal
9,38
4.5
16,1
85.3
600.
752
2.8
938.
41,
618.
560
.152
.38,
446.
014
,566
.754
0.6
470.
50
38.0
66.0
9.0
3.0
0.0
0.0
0.0
0.0
0.0
0.0
0.0
0.0
0.0
0.0
0.0
0.0
597,
730
3.8
9.9
5.4
3.0
2,27
1.4
5,91
7.5
3,22
7.7
1,79
3.2
2,27
1.4
5,91
7.5
3,22
7.7
1,79
3.2
0.0
0.0
0.0
0.0
3,05
790
.0%
85.0
%40
.0%
0.0%
741.
57,
814.
580
0.5
1,19
2.8
741.
57,
814.
580
0.5
1,19
2.8
0.0
0.0
0.0
0.0
Tota
l3,
012.
913
,732
.04,
028.
22,
986.
03,
012.
913
,732
.04,
028.
22,
986.
00.
00.
00.
00.
05,
064
12,2
83.3
86,2
94.6
2,20
9.8
1,97
5.8
4,86
7.8
34,1
98.0
875.
778
3.0
0.80
3,89
4.2
27,3
58.4
700.
662
6.4
973.
66,
839.
617
5.1
156.
631
58.
028
6.2
0.0
0.0
8.0
286.
20.
00.
00.
806.
422
9.0
0.0
0.0
1.6
57.2
0.0
0.0
Tota
l4,
875.
734
,484
.287
5.7
783.
03,
900.
627
,587
.370
0.6
626.
497
5.1
6,89
6.8
175.
115
6.6
Tota
l17
,273
.164
,401
.55,
504.
64,
291.
87,
852.
042
,937
.94,
788.
93,
664.
79,
421.
221
,463
.671
5.8
627.
1N
on-P
oint
Fore
st32
,364
0.00
570.
0115
0.00
227
0.00
006
802
408.
881
7.6
161.
34.
10.
1040
.981
.816
.10.
436
7.9
735.
814
5.2
3.7
Load
Bui
ldin
g an
d R
oad
26,0
190.
0773
0.15
450.
0032
70.
0014
480
24,
417.
08,
834.
018
6.7
82.1
0.30
1,32
5.1
2,65
0.2
56.0
24.6
3,09
1.9
6,18
3.8
130.
757
.4Irr
igat
ed L
and
27,2
880.
0446
0.08
920.
0082
80.
0007
580
250
04,
341.
48,
682.
880
6.0
73.2
0.10
434.
186
8.3
80.6
7.3
3,90
7.3
7,81
4.5
725.
465
.9N
on-ir
rigat
ed L
and
95,9
540.
0446
0.08
920.
0082
80.
0007
580
29,
403.
218
,806
.51,
745.
715
8.6
0.10
940.
31,
880.
617
4.6
15.9
8,46
2.9
16,9
25.8
1,57
1.1
142.
7To
tal
18,5
70.4
37,1
40.8
2,89
9.7
317.
92,
740.
45,
480.
932
7.3
48.2
15,8
30.0
31,6
60.0
2,57
2.4
269.
7C
atle
59,6
810.
0044
0.02
170.
0024
20.
0004
280
221
1.4
1,03
7.1
115.
719
.921
.110
3.7
11.6
2.0
190.
393
3.3
104.
117
.9Se
ep a
nd G
oat
30,6
750.
0011
0.00
540.
0006
10.
0001
080
226
.713
3.3
15.0
2.6
2.7
13.3
1.5
0.3
24.0
119.
913
.52.
3To
tal
238.
118
2.1
182.
118
2.1
23.8
117.
013
.12.
321
4.2
1,05
3.3
117.
620
.3To
tal
18,8
08.5
37,3
22.9
3,08
1.8
500.
02,
764.
25,
597.
934
0.4
50.5
16,0
44.2
32,7
13.2
2,69
0.0
290.
036
,081
.610
1,72
4.4
8,58
6.4
4,79
1.8
10,6
16.2
48,5
35.8
5,12
9.2
3,71
5.2
25,4
65.4
54,1
76.8
3,40
5.8
917.
1Fl
ame:
Liv
ing
Syst
em (p
erso
n),
Sew
arag
e Sy
stem
(dis
char
ged
volu
me
or p
erso
n), I
ndus
try (d
isch
ared
vol
ume
(m3/
day)
), La
nd U
se S
yste
m (h
a), L
ive
Stoc
k (h
ead)
Poin
t-Loa
d/To
tal-L
oad
Infil
tratio
n/R
unof
fB
asic
Uni
t: Li
ving
Sys
tem
(g/p
erso
n/da
y), L
and
Use
(kg/
ha/m
m),
Live
Sto
ck( (
g/he
ad/d
ay)/m
m)
Poin
t/Non
Poin
t0.
740.
880.
930.
992.
41.
10.
70.
212
3,76
312
9,14
21.
4946
9620
25/2
006
0.47
0.81
1.09
1.94
1.1
1.1
1.1
1.2
Infil
tratio
n Lo
ad in
202
5 (k
g/da
y)
Infil
tratio
n Lo
ad in
202
5 (k
g/da
y)
Run
off L
oad
in 2
025
(kg/
day)
0.10
Run
off L
oad
in 2
025
(kg/
day)
Prec
ipita
tion
(mm
)Irr
igat
ion
Wat
er (m
m)
Run
off R
ate
Com
partm
enta
tion
of P
ollu
tion
Load
Flam
e in
2025
Bas
ic U
nit f
or D
isch
arge
Loa
d in
202
5
Tabl
e A
8.1.
3 S
umm
ary
of D
ischa
rge
Load
, Run
off L
oad
and
Infil
trat
ion
Load
in T
his S
tudy
Are
a (C
ase
2: 2
025)
Livi
ngSy
stem
Dom
estic
S yst
em0.
10
Sew
erag
eSy
stem
Unt
reat
ed S
ewer
age
(Pip
e La
ying
)
1.00
Seco
ndar
y Tr
eatm
ent (
Dom
estic
)
Terti
ary
Trea
tmen
tSe
cond
ary
Trea
tmen
t (In
dust
ry)
Indu
stry
Priv
ate
Publ
ic
Land
Use
Syst
em
Prec
ipita
tion
(mm
)Irr
igat
ion
Wat
er (m
m)
Run
off R
ate
Live
Stoc
kSy
stem
Tota
l
Com
partm
enta
tion
of P
ollu
tion
Load
Flam
e in
2025
Bas
ic U
nit f
or D
isch
arge
Loa
d in
202
5
Livi
ngSy
stem
Dom
estic
S yst
em0.
10
Sew
erag
eSy
stem
Unt
reat
ed S
ewer
age
(Pip
e La
ying
)
1.00
Seco
ndar
y Tr
eatm
ent (
Dom
estic
)
Terti
ary
Trea
tmen
tSe
cond
ary
Trea
tmen
t (In
dust
ry)
Indu
stry
Priv
ate
Publ
ic
Land
Use
Syst
em
0.10
Tota
l
Live
Stoc
kSy
stem
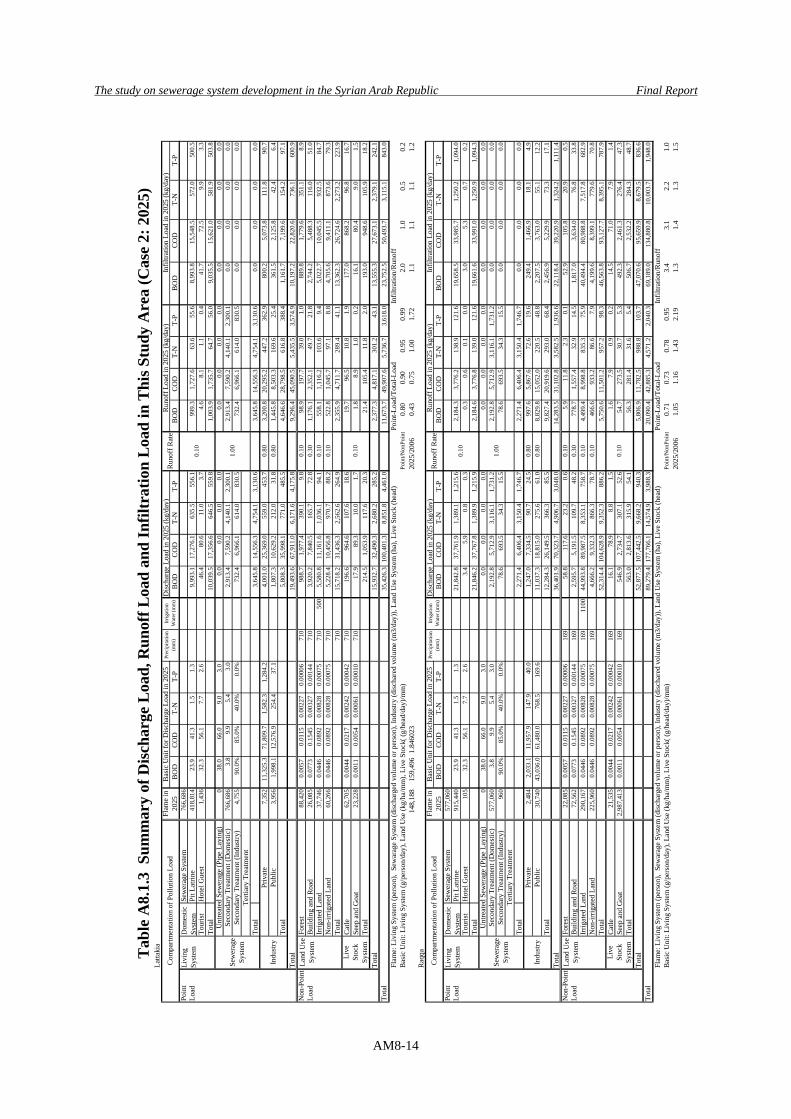
The study on sewerage system development in the Syrian Arab Republic Final Report
AM8-14
Latta
kia
Dis
char
ge L
oad
in 2
025
(kg/
day)
BO
DC
OD
T-N
T-P
BO
DC
OD
T-N
T-P
BO
DC
OD
T-N
T-P
BO
DC
OD
T-N
T-P
Poin
tSe
wer
age
Syst
em76
6,68
6Lo
adPi
t Lat
rine
418,
814
23.9
41.3
1.5
1.3
9,99
3.1
17,2
76.1
635.
555
6.1
999.
31,
727.
663
.655
.68,
993.
815
,548
.557
2.0
500.
5To
uris
tH
otel
Gue
st1,
436
32.3
56.1
7.7
2.6
46.4
80.6
11.0
3.7
4.6
8.1
1.1
0.4
41.7
72.5
9.9
3.3
Tota
l10
,039
.517
,356
.664
6.5
559.
81,
003.
91,
735.
764
.756
.09,
035.
515
,621
.058
1.9
503.
80
38.0
66.0
9.0
3.0
0.0
0.0
0.0
0.0
0.0
0.0
0.0
0.0
0.0
0.0
0.0
0.0
766,
686
3.8
9.9
5.4
3.0
2,91
3.4
7,59
0.2
4,14
0.1
2,30
0.1
2,91
3.4
7,59
0.2
4,14
0.1
2,30
0.1
0.0
0.0
0.0
0.0
4,75
590
.0%
85.0
%40
.0%
0.0%
732.
46,
966.
161
4.0
830.
573
2.4
6,96
6.1
614.
083
0.5
0.0
0.0
0.0
0.0
Tota
l3,
645.
814
,556
.34,
754.
13,
130.
63,
645.
814
,556
.34,
754.
13,
130.
60.
00.
00.
00.
07,
352
11,3
25.3
71,8
09.7
1,58
2.3
1,28
4.2
4,00
1.0
25,3
69.0
559.
045
3.7
0.80
3,20
0.8
20,2
95.2
447.
236
2.9
800.
25,
073.
811
1.8
90.7
3,95
61,
998.
112
,576
.925
4.4
37.1
1,80
7.3
10,6
29.2
212.
031
.80.
801,
445.
88,
503.
316
9.6
25.4
361.
52,
125.
842
.46.
4To
tal
5,80
8.3
35,9
98.1
771.
048
5.5
4,64
6.6
28,7
98.5
616.
838
8.4
1,16
1.7
7,19
9.6
154.
297
.1To
tal
19,4
93.6
67,9
11.0
6,17
1.6
4,17
5.8
9,29
6.4
45,0
90.5
5,43
5.5
3,57
4.9
10,1
97.2
22,8
20.6
736.
160
0.9
Non
-Poi
ntFo
rest
88,4
200.
0057
0.01
150.
0022
70.
0000
671
098
8.7
1,97
7.4
390.
19.
80.
1098
.919
7.7
39.0
1.0
889.
81,
779.
635
1.1
8.9
Load
Bui
ldin
g an
d R
oad
26,0
850.
0773
0.15
450.
0032
70.
0014
471
03,
920.
27,
840.
516
5.7
72.8
0.30
1,17
6.1
2,35
2.1
49.7
21.8
2,74
4.2
5,48
8.3
116.
051
.0Irr
igat
ed L
and
37,7
460.
0446
0.08
920.
0082
80.
0007
571
050
05,
580.
811
,161
.61,
036.
194
.10.
1055
8.1
1,11
6.2
103.
69.
45,
022.
710
,045
.593
2.5
84.7
Non
-irrig
ated
Lan
d60
,266
0.04
460.
0892
0.00
828
0.00
075
710
5,22
8.4
10,4
56.8
970.
788
.20.
1052
2.8
1,04
5.7
97.1
8.8
4,70
5.6
9,41
1.1
873.
679
.3To
tal
710
15,7
18.2
31,4
36.3
2,56
2.6
264.
92,
355.
94,
711.
728
9.4
41.1
13,3
62.3
26,7
24.6
2,27
3.2
223.
9C
atle
62,7
050.
0044
0.02
170.
0024
20.
0004
271
019
6.6
964.
610
7.6
18.6
19.7
96.5
10.8
1.9
177.
086
8.2
96.8
16.7
Seep
and
Goa
t23
,228
0.00
110.
0054
0.00
061
0.00
010
710
17.9
89.3
10.0
1.7
1.8
8.9
1.0
0.2
16.1
80.4
9.0
1.5
Tota
l21
4.5
1,05
3.9
117.
620
.321
.410
5.4
11.8
2.0
193.
094
8.6
105.
918
.2To
tal
15,9
32.7
32,4
90.3
2,68
0.2
285.
22,
377.
34,
817.
130
1.2
43.1
13,5
55.3
27,6
73.1
2,37
9.1
242.
135
,426
.310
0,40
1.3
8,85
1.8
4,46
1.0
11,6
73.7
49,9
07.6
5,73
6.7
3,61
8.0
23,7
52.5
50,4
93.7
3,11
5.1
843.
0Fl
ame:
Liv
ing
Syst
em (p
erso
n),
Sew
arag
e Sy
stem
(dis
char
ged
volu
me
or p
erso
n), I
ndus
try (d
isch
ared
vol
ume
(m3/
day)
), La
nd U
se S
yste
m (h
a), L
ive
Stoc
k (h
ead)
Poin
t-Loa
d/To
tal-L
oad
Infil
tratio
n/R
unof
fB
asic
Uni
t: Li
ving
Sys
tem
(g/p
erso
n/da
y), L
and
Use
(kg/
ha/m
m),
Live
Sto
ck( (
g/he
ad/d
ay)/m
m)
Poin
t/Non
Poin
t0.
800.
900.
950.
992.
01.
00.
50.
214
8,18
815
9,49
61.
8460
2320
25/2
006
0.43
0.75
1.00
1.72
1.1
1.1
1.1
1.2
Raq
qaD
isch
arge
Loa
d in
202
5 (k
g/da
y)B
OD
CO
DT-
NT-
PB
OD
CO
DT-
NT-
PB
OD
CO
DT-
NT-
PB
OD
CO
DT-
NT-
PPo
int
Sew
erag
e Sy
stem
577,
060
Load
Pit L
atrin
e91
5,44
023
.941
.31.
51.
321
,842
.837
,761
.91,
389.
11,
215.
62,
184.
33,
776.
213
8.9
121.
619
,658
.533
,985
.71,
250.
21,
094.
0To
uris
tH
otel
Gue
st10
532
.356
.17.
72.
63.
45.
90.
80.
30.
30.
60.
10.
03.
05.
30.
70.
2To
tal
21,8
46.2
37,7
67.8
1,38
9.9
1,21
5.9
2,18
4.6
3,77
6.8
139.
012
1.6
19,6
61.6
33,9
91.0
1,25
0.9
1,09
4.3
038
.066
.09.
03.
00.
00.
00.
00.
00.
00.
00.
00.
00.
00.
00.
00.
057
7,06
03.
89.
95.
43.
02,
192.
85,
712.
93,
116.
11,
731.
22,
192.
85,
712.
93,
116.
11,
731.
20.
00.
00.
00.
096
090
.0%
85.0
%40
.0%
0.0%
78.6
693.
534
.315
.578
.669
3.5
34.3
15.5
0.0
0.0
0.0
0.0
Tota
l2,
271.
46,
406.
43,
150.
41,
746.
72,
271.
46,
406.
43,
150.
41,
746.
70.
00.
00.
00.
02,
484
2,03
3.1
11,9
57.9
147.
940
.01,
247.
07,
334.
590
.724
.50.
8099
7.6
5,86
7.6
72.6
19.6
249.
41,
466.
918
.14.
930
,740
43,0
36.0
61,4
80.0
768.
516
9.6
11,0
37.3
18,8
15.0
275.
661
.00.
808,
829.
815
,052
.022
0.5
48.8
2,20
7.5
3,76
3.0
55.1
12.2
Tota
l12
,284
.326
,149
.536
6.3
85.5
9,82
7.4
20,9
19.6
293.
068
.42,
456.
95,
229.
973
.317
.1To
tal
36,4
01.9
70,3
23.7
4,90
6.7
3,04
8.0
14,2
83.5
31,1
02.8
3,58
2.5
1,93
6.6
22,1
18.4
39,2
20.9
1,32
4.2
1,11
1.4
Non
-Poi
ntFo
rest
22,0
850.
0057
0.01
150.
0022
70.
0000
616
958
.811
7.6
23.2
0.6
0.10
5.9
11.8
2.3
0.1
52.9
105.
820
.90.
5Lo
adB
uild
ing
and
Roa
d72
,562
0.07
730.
1545
0.00
327
0.00
144
169
2,59
5.7
5,19
1.5
109.
748
.20.
3077
8.7
1,55
7.4
32.9
14.5
1,81
7.0
3,63
4.0
76.8
33.8
Irrig
ated
Lan
d29
0,16
70.
0446
0.08
920.
0082
80.
0007
516
911
0044
,993
.889
,987
.58,
353.
175
8.7
0.10
4,49
9.4
8,99
8.8
835.
375
.940
,494
.480
,988
.87,
517.
868
2.9
Non
-irrig
ated
Lan
d22
5,96
00.
0446
0.08
920.
0082
80.
0007
516
94,
666.
29,
332.
386
6.3
78.7
0.10
466.
693
3.2
86.6
7.9
4,19
9.6
8,39
9.1
779.
670
.8To
tal
52,3
14.4
104,
628.
99,
352.
388
6.2
5,75
0.6
11,5
01.2
957.
298
.346
,563
.893
,127
.78,
395.
178
7.9
Cat
le21
,535
0.00
440.
0217
0.00
242
0.00
042
169
16.1
78.9
8.8
1.5
1.6
7.9
0.9
0.2
14.5
71.0
7.9
1.4
Seep
and
Goa
t2,
987,
413
0.00
110.
0054
0.00
061
0.00
010
169
546.
92,
734.
730
7.1
52.6
54.7
273.
530
.75.
349
2.3
2,46
1.3
276.
447
.3To
tal
563.
02,
813.
631
5.9
54.1
56.3
281.
431
.65.
450
6.7
2,53
2.2
284.
348
.7To
tal
52,8
77.5
107,
442.
59,
668.
294
0.3
5,80
6.9
11,7
82.5
988.
810
3.7
47,0
70.6
95,6
59.9
8,67
9.5
836.
689
,279
.417
7,76
6.1
14,5
74.9
3,98
8.3
20,0
90.4
42,8
85.3
4,57
1.2
2,04
0.3
69,1
89.0
134,
880.
810
,003
.71,
948.
0Fl
ame:
Liv
ing
Syst
em (p
erso
n),
Sew
arag
e Sy
stem
(dis
char
ged
volu
me
or p
erso
n), I
ndus
try (d
isch
ared
vol
ume
(m3/
day)
), La
nd U
se S
yste
m (h
a), L
ive
Stoc
k (h
ead)
Poin
t-Loa
d/To
tal-L
oad
Infil
tratio
n/R
unof
fB
asic
Uni
t: Li
ving
Sys
tem
(g/p
erso
n/da
y), L
and
Use
(kg/
ha/m
m),
Live
Sto
ck( (
g/he
ad/d
ay)/m
m)
Poin
t/Non
Poin
t0.
710.
730.
780.
953.
43.
12.
21.
020
25/2
006
1.05
1.16
1.43
2.19
1.3
1.4
1.3
1.5
Infil
tratio
n Lo
ad in
202
5 (k
g/da
y)
Infil
tratio
n Lo
ad in
202
5 (k
g/da
y)
Com
partm
enta
tion
of P
ollu
tion
Load
Flam
e in
2025
Bas
ic U
nit f
or D
isch
arge
Loa
d in
202
5Pr
ecip
itatio
n(m
m)
Irrig
atio
nW
ater
(mm
)R
unof
f Rat
e
Tabl
e A
8.1.
3 S
umm
ary
of D
isch
arge
Loa
d, R
unof
f Loa
d an
d In
filtr
atio
n L
oad
in T
his S
tudy
Are
a (C
ase
2: 2
025)
R
unof
f Loa
d in
202
5 (k
g/da
y)
Livi
ngSy
stem
Dom
estic
S yst
em0.
10
Sew
erag
eSy
stem
Unt
reat
ed S
ewer
age
(Pip
e La
ying
)
1.00
Seco
ndar
y Tr
eatm
ent (
Dom
estic
)
Terti
ary
Trea
tmen
tSe
cond
ary
Trea
tmen
t (In
dust
ry)
Indu
stry
Priv
ate
Publ
ic
Land
Use
Syst
em
0.10
Tota
l
Com
partm
enta
tion
of P
ollu
tion
Load
Flam
e in
2025
Bas
ic U
nit f
or D
isch
arge
Loa
d in
202
5Pr
ecip
itatio
n(m
m)
Irrig
atio
nW
ater
(mm
)R
unof
f Rat
e
Live
Stoc
kSy
stem
Run
off L
oad
in 2
025
(kg/
day)
Livi
ngSy
stem
Dom
estic
S yst
em0.
10
Sew
erag
eSy
stem
Unt
reat
ed S
ewer
age
(Pip
e La
ying
)
1.00
Seco
ndar
y Tr
eatm
ent (
Dom
estic
)
Terti
ary
Trea
tmen
tSe
cond
ary
Trea
tmen
t (In
dust
ry)
Indu
stry
Priv
ate
Publ
ic
Land
Use
Syst
em
0.10
Tota
l
Live
Stoc
kSy
stem
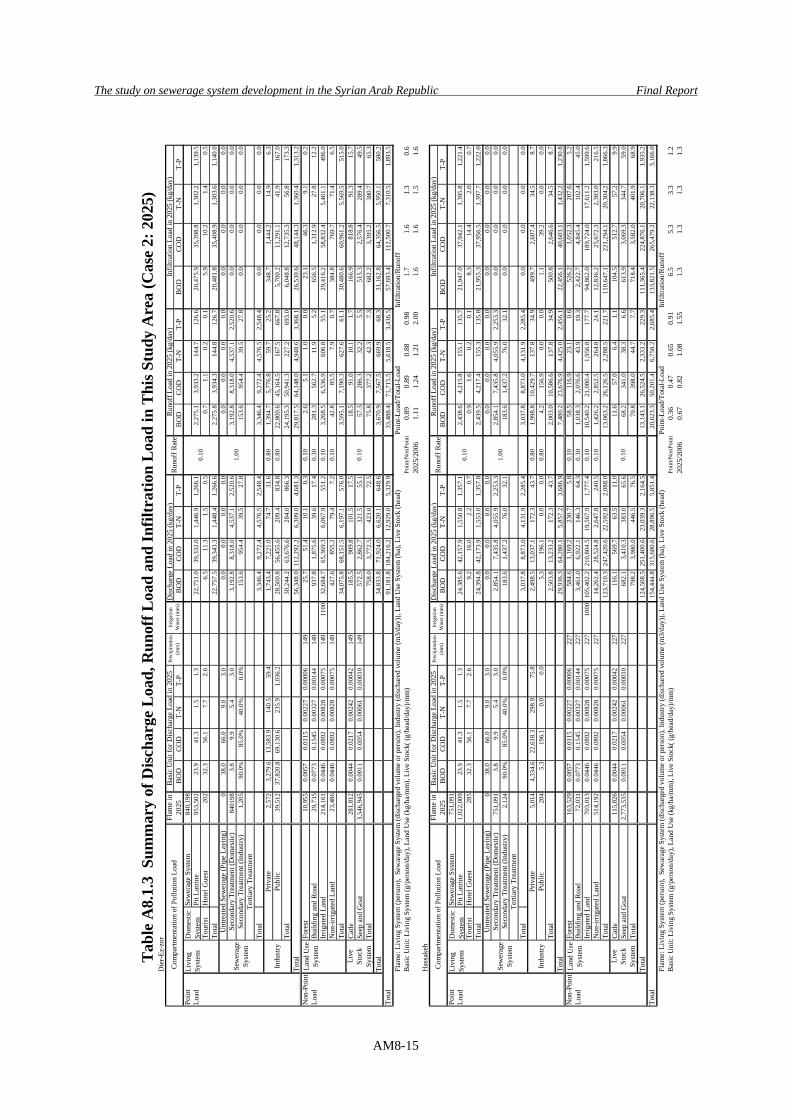
The study on sewerage system development in the Syrian Arab Republic Final Report
AM8-15
Die
r-Ez
-zor
Dis
char
ge L
oad
in 2
025
(kg/
day)
BO
DC
OD
T-N
T-P
BO
DC
OD
T-N
T-P
BO
DC
OD
T-N
T-P
BO
DC
OD
T-N
T-P
Poin
tSe
wer
age
Syst
em84
0,19
8Lo
adPi
t Lat
rine
953,
502
23.9
41.3
1.5
1.3
22,7
51.0
39,3
32.0
1,44
6.9
1,26
6.1
2,27
5.1
3,93
3.2
144.
712
6.6
20,4
75.9
35,3
98.8
1,30
2.2
1,13
9.5
Tour
ist
Hot
el G
uest
202
32.3
56.1
7.7
2.6
6.5
11.3
1.5
0.5
0.7
1.1
0.2
0.1
5.9
10.2
1.4
0.5
Tota
l22
,757
.539
,343
.31,
448.
41,
266.
62,
275.
83,
934.
314
4.8
126.
720
,481
.835
,408
.91,
303.
61,
140.
00
38.0
66.0
9.0
3.0
0.0
0.0
0.0
0.0
0.0
0.0
0.0
0.0
0.0
0.0
0.0
0.0
8401
983.
89.
95.
43.
03,
192.
88,
318.
04,
537.
12,
520.
63,
192.
88,
318.
04,
537.
12,
520.
60.
00.
00.
00.
01,
205
90.0
%85
.0%
40.0
%0.
0%15
3.6
954.
439
.527
.815
3.6
954.
439
.527
.80.
00.
00.
00.
0
Tota
l3,
346.
49,
272.
44,
576.
52,
548.
43,
346.
49,
272.
44,
576.
52,
548.
40.
00.
00.
00.
02,
572
3,27
9.6
13,5
83.9
140.
559
.41,
743.
47,
221.
074
.731
.60.
801,
394.
75,
776.
859
.725
.234
8.7
1,44
4.2
14.9
6.3
39,5
1237
,820
.869
,130
.623
5.9
1,03
6.2
28,5
00.8
56,4
55.6
209.
483
4.8
0.80
22,8
00.6
45,1
64.5
167.
566
7.8
5,70
0.2
11,2
91.1
41.9
167.
0To
tal
30,2
44.2
63,6
76.6
284.
086
6.3
24,1
95.3
50,9
41.3
227.
269
3.0
6,04
8.8
12,7
35.3
56.8
173.
3To
tal
56,3
48.0
112,
292.
26,
309.
04,
681.
329
,817
.564
,148
.04,
948.
63,
368.
126
,530
.648
,144
.31,
360.
41,
313.
2N
on-P
oint
Fore
st10
,955
0.00
570.
0115
0.00
227
0.00
006
149
25.7
51.4
10.1
0.3
0.10
2.6
5.1
1.0
0.0
23.1
46.3
9.1
0.2
Load
Bui
ldin
g an
d R
oad
29,7
350.
0773
0.15
450.
0032
70.
0014
414
993
7.8
1,87
5.6
39.6
17.4
0.30
281.
356
2.7
11.9
5.2
656.
51,
312.
927
.812
.2Irr
igat
ed L
and
214,
161
0.04
460.
0892
0.00
828
0.00
075
149
1100
32,6
84.7
65,3
69.3
6,06
7.9
551.
20.
103,
268.
56,
536.
960
6.8
55.1
29,4
16.2
58,8
32.4
5,46
1.1
496.
0N
on-ir
rigat
ed L
and
23,4
860.
0446
0.08
920.
0082
80.
0007
514
942
7.6
855.
279
.47.
20.
1042
.885
.57.
90.
738
4.8
769.
771
.46.
5To
tal
34,0
75.8
68,1
51.5
6,19
7.1
576.
03,
595.
17,
190.
362
7.6
61.1
30,4
80.6
60,9
61.2
5,56
9.5
515.
0C
atle
281,
812
0.00
440.
0217
0.00
242
0.00
042
149
185.
590
9.8
101.
517
.518
.591
.010
.11.
716
6.9
818.
891
.315
.7Se
ep a
nd G
oat
3,54
6,94
50.
0011
0.00
540.
0006
10.
0001
014
957
2.5
2,86
2.7
321.
555
.157
.328
6.3
32.2
5.5
515.
32,
576.
428
9.4
49.5
Tota
l75
8.0
3,77
2.5
423.
072
.575
.837
7.2
42.3
7.3
682.
23,
395.
238
0.7
65.3
Tota
l34
,833
.871
,924
.06,
620.
164
8.6
3,67
0.9
7,56
7.5
669.
968
.331
,162
.864
,356
.55,
950.
158
0.2
91,1
81.8
184,
216.
212
,929
.05,
329.
933
,488
.471
,715
.55,
618.
53,
436.
557
,693
.411
2,50
0.7
7,31
0.5
1,89
3.5
Flam
e: L
ivin
g Sy
stem
(per
son)
, Se
war
age
Syst
em (d
isch
arge
d vo
lum
e or
per
son)
, Ind
ustry
(dis
char
ed v
olum
e (m
3/da
y)),
Land
Use
Sys
tem
(ha)
, Liv
e St
ock
(hea
d)Po
int-L
oad/
Tota
l-Loa
dIn
filtra
tion/
Run
off
Bas
ic U
nit:
Livi
ng S
yste
m (g
/per
son/
day)
, Lan
d U
se (k
g/ha
/mm
), Li
ve S
tock
( (g/
head
/day
)/mm
)Po
int/N
onPo
int
0.89
0.89
0.88
0.98
1.7
1.6
1.3
0.6
2025
/200
61.
111.
241.
212.
001.
61.
61.
51.
6H
assa
keh
Dis
char
ge L
oad
in 2
025
(kg/
day)
BO
DC
OD
T-N
T-P
BO
DC
OD
T-N
T-P
BO
DC
OD
T-N
T-P
BO
DC
OD
T-N
T-P
Poin
tSe
wer
age
Syst
em75
1,09
1Lo
adPi
t Lat
rine
1,02
2,00
923
.941
.31.
51.
324
,385
.642
,157
.91,
550.
81,
357.
12,
438.
64,
215.
815
5.1
135.
721
,947
.037
,942
.11,
395.
81,
221.
4To
uris
tH
otel
Gue
st28
532
.356
.17.
72.
69.
216
.02.
20.
70.
91.
60.
20.
18.
314
.42.
00.
7To
tal
24,3
94.8
42,1
73.9
1,55
3.0
1,35
7.8
2,43
9.5
4,21
7.4
155.
313
5.8
21,9
55.3
37,9
56.5
1,39
7.7
1,22
2.0
038
.066
.09.
03.
00.
00.
00.
00.
00.
00.
00.
00.
00.
00.
00.
00.
075
1,09
13.
89.
95.
43.
02,
854.
17,
435.
84,
055.
92,
253.
32,
854.
17,
435.
84,
055.
92,
253.
30.
00.
00.
00.
02,
124
90.0
%85
.0%
40.0
%0.
0%18
3.6
1,43
7.2
76.0
32.1
183.
61,
437.
276
.032
.10.
00.
00.
00.
0
Tota
l3,
037.
88,
873.
04,
131.
92,
285.
43,
037.
88,
873.
04,
131.
92,
285.
40.
00.
00.
00.
05,
014
4,33
4.6
22,6
18.3
298.
975
.82,
498.
513
,037
.117
2.3
43.7
0.80
1,99
8.8
10,4
29.7
137.
834
.949
9.7
2,60
7.4
34.5
8.7
204
5.3
196.
10.
00.
05.
319
6.1
0.0
0.0
0.80
4.2
156.
90.
00.
01.
139
.20.
00.
0To
tal
2,50
3.8
13,2
33.2
172.
343
.72,
003.
010
,586
.613
7.8
34.9
500.
82,
646.
634
.58.
7To
tal
29,9
36.3
64,2
80.1
5,85
7.2
3,68
6.9
7,48
0.2
23,6
76.9
4,42
5.0
2,45
6.1
22,4
56.1
40,6
03.1
1,43
2.2
1,23
0.8
Non
-Poi
ntFo
rest
163,
529
0.00
570.
0115
0.00
227
0.00
006
227
584.
61,
169.
223
0.7
5.8
0.10
58.5
116.
923
.10.
652
6.2
1,05
2.3
207.
65.
2Lo
adB
uild
ing
and
Roa
d72
,031
0.07
730.
1545
0.00
327
0.00
144
227
3,46
1.0
6,92
2.1
146.
364
.30.
301,
038.
32,
076.
643
.919
.32,
422.
74,
845.
410
2.4
45.0
Irrig
ated
Lan
d70
3,01
30.
0446
0.08
920.
0082
80.
0007
522
710
0010
5,40
2.2
210,
804.
519
,567
.91,
777.
40.
1010
,540
.221
,080
.41,
956.
817
7.7
94,8
62.0
189,
724.
017
,611
.21,
599.
6N
on-ir
rigat
ed L
and
514,
192
0.04
460.
0892
0.00
828
0.00
075
227
14,2
62.4
28,5
24.8
2,64
7.8
240.
50.
101,
426.
22,
852.
526
4.8
24.1
12,8
36.2
25,6
72.3
2,38
3.0
216.
5To
tal
123,
710.
324
7,42
0.6
22,5
92.8
2,08
8.0
13,0
63.2
26,1
26.5
2,28
8.5
221.
711
0,64
7.1
221,
294.
120
,304
.21,
866.
3C
atle
115,
826
0.00
440.
0217
0.00
242
0.00
042
227
116.
156
9.7
63.5
11.0
11.6
57.0
6.4
1.1
104.
551
2.7
57.2
9.9
Seep
and
Goa
t2,
773,
535
0.00
110.
0054
0.00
061
0.00
010
227
682.
13,
410.
338
3.0
65.6
68.2
341.
038
.36.
661
3.9
3,06
9.3
344.
759
.0To
tal
798.
23,
980.
044
6.5
76.5
79.8
398.
044
.77.
771
8.4
3,58
2.0
401.
968
.9To
tal
124,
508.
525
1,40
0.6
23,0
39.3
2,16
4.5
13,1
43.1
26,5
24.5
2,33
3.2
229.
311
1,36
5.4
224,
876.
120
,706
.11,
935.
215
4,44
4.8
315,
680.
628
,896
.55,
851.
420
,623
.350
,201
.46,
758.
22,
685.
413
3,82
1.5
265,
479.
222
,138
.33,
166.
0Fl
ame:
Liv
ing
Syst
em (p
erso
n),
Sew
arag
e Sy
stem
(dis
char
ged
volu
me
or p
erso
n), I
ndus
try (d
isch
ared
vol
ume
(m3/
day)
), La
nd U
se S
yste
m (h
a), L
ive
Stoc
k (h
ead)
Poin
t-Loa
d/To
tal-L
oad
Infil
tratio
n/R
unof
fB
asic
Uni
t: Li
ving
Sys
tem
(g/p
erso
n/da
y), L
and
Use
(kg/
ha/m
m),
Live
Sto
ck( (
g/he
ad/d
ay)/m
m)
Poin
t/Non
Poin
t0.
360.
470.
650.
916.
55.
33.
31.
220
25/2
006
0.67
0.82
1.08
1.55
1.3
1.3
1.3
1.3
Infil
tratio
n Lo
ad in
202
5 (k
g/da
y)
Infil
tratio
n Lo
ad in
202
5 (k
g/da
y)
Com
partm
enta
tion
of P
ollu
tion
Load
Flam
e in
2025
Bas
ic U
nit f
or D
isch
arge
Loa
d in
202
5Pr
ecip
itatio
n(m
m)
Irrig
atio
nW
ater
(mm
)R
unof
f Rat
e
Tabl
e A
8.1.
3 S
umm
ary
of D
isch
arge
Loa
d, R
unof
f Loa
d an
d In
filtr
atio
n L
oad
in T
his S
tudy
Are
a (C
ase
2: 2
025)
R
unof
f Loa
d in
202
5 (k
g/da
y)
Livi
ngSy
stem
Dom
estic
S yst
em0.
10
Sew
erag
eSy
stem
Unt
reat
ed S
ewer
age
(Pip
e La
ying
)
1.00
Seco
ndar
y Tr
eatm
ent (
Dom
estic
)
Terti
ary
Trea
tmen
tSe
cond
ary
Trea
tmen
t (In
dust
ry)
Indu
stry
Priv
ate
Publ
ic
Land
Use
Syst
em
0.10
Tota
l
Com
partm
enta
tion
of P
ollu
tion
Load
Flam
e in
2025
Bas
ic U
nit f
or D
isch
arge
Loa
d in
202
5Pr
ecip
itatio
n(m
m)
Irrig
atio
nW
ater
(mm
)R
unof
f Rat
e
Live
Stoc
kSy
stem
Run
off L
oad
in 2
025
(kg/
day)
Livi
ngSy
stem
Dom
estic
S yst
em0.
10
Sew
erag
eSy
stem
Unt
reat
ed S
ewer
age
(Pip
e La
ying
)
1.00
Seco
ndar
y Tr
eatm
ent (
Dom
estic
)
Terti
ary
Trea
tmen
tSe
cond
ary
Trea
tmen
t (In
dust
ry)
Indu
stry
Priv
ate
Publ
ic
Land
Use
Syst
em
0.10
Tota
l
Live
Stoc
kSy
stem
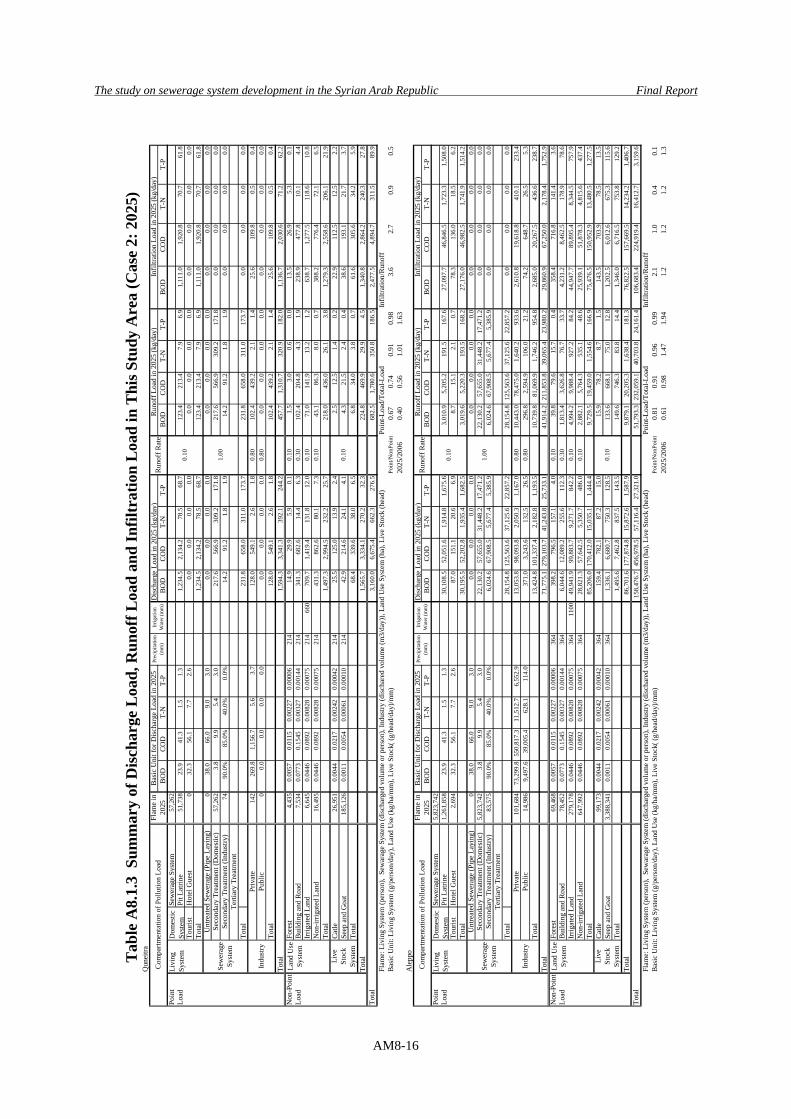
The study on sewerage system development in the Syrian Arab Republic Final Report
AM8-16
Qun
eitra
Dis
char
ge L
oad
in 2
025
(kg/
day)
BO
DC
OD
T-N
T-P
BO
DC
OD
T-N
T-P
BO
DC
OD
T-N
T-P
BO
DC
OD
T-N
T-P
Poin
tSe
wer
age
Syst
em57
,262
Load
Pit L
atrin
e51
,738
23.9
41.3
1.5
1.3
1,23
4.5
2,13
4.2
78.5
68.7
123.
421
3.4
7.9
6.9
1,11
1.0
1,92
0.8
70.7
61.8
Tour
ist
Hot
el G
uest
032
.356
.17.
72.
60.
00.
00.
00.
00.
00.
00.
00.
00.
00.
00.
00.
0To
tal
1,23
4.5
2,13
4.2
78.5
68.7
123.
421
3.4
7.9
6.9
1,11
1.0
1,92
0.8
70.7
61.8
038
.066
.09.
03.
00.
00.
00.
00.
00.
00.
00.
00.
00.
00.
00.
00.
057
,262
3.8
9.9
5.4
3.0
217.
656
6.9
309.
217
1.8
217.
656
6.9
309.
217
1.8
0.0
0.0
0.0
0.0
7490
.0%
85.0
%40
.0%
0.0%
14.2
91.2
1.8
1.9
14.2
91.2
1.8
1.9
0.0
0.0
0.0
0.0
Tota
l23
1.8
658.
031
1.0
173.
723
1.8
658.
031
1.0
173.
70.
00.
00.
00.
014
226
9.8
1,15
6.7
5.6
3.7
128.
054
9.1
2.6
1.8
0.80
102.
443
9.2
2.1
1.4
25.6
109.
80.
50.
40
0.0
0.0
0.0
0.0
0.0
0.0
0.0
0.0
0.80
0.0
0.0
0.0
0.0
0.0
0.0
0.0
0.0
Tota
l12
8.0
549.
12.
61.
810
2.4
439.
22.
11.
425
.610
9.8
0.5
0.4
Tota
l1,
594.
33,
341.
339
2.1
244.
245
7.7
1,31
0.7
320.
918
2.0
1,13
6.7
2,03
0.6
71.2
62.2
Non
-Poi
ntFo
rest
4,43
50.
0057
0.01
150.
0022
70.
0000
621
414
.929
.95.
90.
10.
101.
53.
00.
60.
013
.526
.95.
30.
1Lo
adB
uild
ing
and
Roa
d7,
534
0.07
730.
1545
0.00
327
0.00
144
214
341.
368
2.6
14.4
6.3
0.30
102.
420
4.8
4.3
1.9
238.
947
7.8
10.1
4.4
Irrig
ated
Lan
d6,
645
0.04
460.
0892
0.00
828
0.00
075
214
660
709.
71,
419.
413
1.8
12.0
0.10
71.0
141.
913
.21.
263
8.7
1,27
7.5
118.
610
.8N
on-ir
rigat
ed L
and
16,4
950.
0446
0.08
920.
0082
80.
0007
521
443
1.3
862.
680
.17.
30.
1043
.186
.38.
00.
738
8.2
776.
472
.16.
5To
tal
1,49
7.3
2,99
4.5
232.
225
.721
8.0
436.
026
.13.
81,
279.
32,
558.
620
6.1
21.9
Cat
le26
,951
0.00
440.
0217
0.00
242
0.00
042
214
25.5
125.
013
.92.
42.
512
.51.
40.
222
.911
2.5
12.5
2.2
Seep
and
Goa
t18
5,12
60.
0011
0.00
540.
0006
10.
0001
021
442
.921
4.6
24.1
4.1
4.3
21.5
2.4
0.4
38.6
193.
121
.73.
7To
tal
68.4
339.
638
.06.
56.
834
.03.
80.
761
.630
5.6
34.2
5.9
Tota
l1,
565.
73,
334.
127
0.2
32.3
224.
846
9.9
29.9
4.5
1,34
0.8
2,86
4.2
240.
327
.83,
160.
06,
675.
466
2.3
276.
568
2.5
1,78
0.6
350.
818
6.5
2,47
7.5
4,89
4.7
311.
589
.9Fl
ame:
Liv
ing
Syst
em (p
erso
n),
Sew
arag
e Sy
stem
(dis
char
ged
volu
me
or p
erso
n), I
ndus
try (d
isch
ared
vol
ume
(m3/
day)
), La
nd U
se S
yste
m (h
a), L
ive
Stoc
k (h
ead)
Poin
t-Loa
d/To
tal-L
oad
Infil
tratio
n/R
unof
fB
asic
Uni
t: Li
ving
Sys
tem
(g/p
erso
n/da
y), L
and
Use
(kg/
ha/m
m),
Live
Sto
ck( (
g/he
ad/d
ay)/m
m)
Poin
t/Non
Poin
t0.
670.
740.
910.
983.
62.
70.
90.
520
25/2
006
0.40
0.56
1.01
1.63
Ale
ppo
Dis
char
ge L
oad
in 2
025
(kg/
day)
BO
DC
OD
T-N
T-P
BO
DC
OD
T-N
T-P
BO
DC
OD
T-N
T-P
BO
DC
OD
T-N
T-P
Poin
tSe
wer
age
Syst
em5,
823,
742
Load
Pit L
atrin
e1,
261,
858
23.9
41.3
1.5
1.3
30,1
08.5
52,0
51.6
1,91
4.8
1,67
5.6
3,01
0.9
5,20
5.2
191.
516
7.6
27,0
97.7
46,8
46.5
1,72
3.3
1,50
8.0
Tour
ist
Hot
el G
uest
2,69
432
.356
.17.
72.
687
.015
1.1
20.6
6.9
8.7
15.1
2.1
0.7
78.3
136.
018
.56.
2To
tal
30,1
95.5
52,2
02.8
1,93
5.4
1,68
2.5
3,01
9.6
5,22
0.3
193.
516
8.2
27,1
76.0
46,9
82.5
1,74
1.9
1,51
4.2
038
.066
.09.
03.
00.
00.
00.
00.
00.
00.
00.
00.
00.
00.
00.
00.
05,
823,
742
3.8
9.9
5.4
3.0
22,1
30.2
57,6
55.0
31,4
48.2
17,4
71.2
22,1
30.2
57,6
55.0
31,4
48.2
17,4
71.2
0.0
0.0
0.0
0.0
83,5
7590
.0%
85.0
%40
.0%
0.0%
6,02
4.6
67,9
08.5
5,67
7.4
5,38
5.9
6,02
4.6
67,9
08.5
5,67
7.4
5,38
5.9
0.0
0.0
0.0
0.0
Tota
l28
,154
.812
5,56
3.6
37,1
25.6
22,8
57.2
28,1
54.8
125,
563.
637
,125
.622
,857
.20.
00.
00.
00.
010
1,68
473
,299
.855
0,81
7.3
11,5
12.7
6,55
2.9
13,0
53.8
98,0
93.8
2,05
0.3
1,16
7.0
0.80
10,4
43.0
78,4
75.0
1,64
0.2
933.
62,
610.
819
,618
.841
0.1
233.
414
,986
9,49
7.6
39,0
05.4
628.
111
4.0
371.
03,
243.
613
2.5
26.5
0.80
296.
82,
594.
910
6.0
21.2
74.2
648.
726
.55.
3To
tal
13,4
24.8
101,
337.
42,
182.
81,
193.
510
,739
.881
,069
.91,
746.
295
4.8
2,68
5.0
20,2
67.5
436.
623
8.7
Tota
l71
,775
.127
9,10
3.7
41,2
43.8
25,7
33.1
41,9
14.2
211,
853.
839
,065
.423
,980
.229
,860
.967
,250
.02,
178.
41,
752.
9N
on-P
oint
Fore
st69
,468
0.00
570.
0115
0.00
227
0.00
006
364
398.
279
6.5
157.
14.
00.
1039
.879
.615
.70.
435
8.4
716.
814
1.4
3.6
Load
Bui
ldin
g an
d R
oad
78,4
520.
0773
0.15
450.
0032
70.
0014
436
46,
044.
612
,089
.225
5.6
112.
30.
301,
813.
43,
626.
876
.733
.74,
231.
28,
462.
517
8.9
78.6
Irrig
ated
Lan
d27
9,17
80.
0446
0.08
920.
0082
80.
0007
536
411
0049
,941
.999
,883
.79,
271.
784
2.2
0.10
4,99
4.2
9,98
8.4
927.
284
.244
,947
.789
,895
.48,
344.
575
7.9
Non
-irrig
ated
Lan
d64
7,99
20.
0446
0.08
920.
0082
80.
0007
536
428
,821
.357
,642
.55,
350.
748
6.0
0.10
2,88
2.1
5,76
4.3
535.
148
.625
,939
.151
,878
.34,
815.
643
7.4
Tota
l85
,206
.017
0,41
2.0
15,0
35.1
1,44
4.4
9,72
9.5
19,4
59.0
1,55
4.6
166.
975
,476
.515
0,95
2.9
13,4
80.5
1,27
7.5
Cat
le99
,173
0.00
440.
0217
0.00
242
0.00
042
364
159.
478
2.1
87.2
15.0
15.9
78.2
8.7
1.5
143.
570
3.9
78.5
13.5
Seep
and
Goa
t3,
388,
341
0.00
110.
0054
0.00
061
0.00
010
364
1,33
6.1
6,68
0.7
750.
312
8.5
133.
666
8.1
75.0
12.8
1,20
2.5
6,01
2.6
675.
311
5.6
Tota
l1,
495.
67,
462.
883
7.5
143.
514
9.6
746.
383
.814
.41,
346.
06,
716.
575
3.8
129.
2To
tal
86,7
01.6
177,
874.
815
,872
.61,
587.
99,
879.
120
,205
.31,
638.
418
1.3
76,8
22.5
157,
669.
514
,234
.21,
406.
715
8,47
6.7
456,
978.
557
,116
.427
,321
.051
,793
.323
2,05
9.1
40,7
03.8
24,1
61.4
106,
683.
422
4,91
9.4
16,4
12.7
3,15
9.6
Flam
e: L
ivin
g Sy
stem
(per
son)
, Se
war
age
Syst
em (d
isch
arge
d vo
lum
e or
per
son)
, Ind
ustry
(dis
char
ed v
olum
e (m
3/da
y)),
Land
Use
Sys
tem
(ha)
, Liv
e St
ock
(hea
d)Po
int-L
oad/
Tota
l-Loa
dIn
filtra
tion/
Run
off
Bas
ic U
nit:
Livi
ng S
yste
m (g
/per
son/
day)
, Lan
d U
se (k
g/ha
/mm
), Li
ve S
tock
( (g/
head
/day
)/mm
)Po
int/N
onPo
int
0.81
0.91
0.96
0.99
2.1
1.0
0.4
0.1
2025
/200
60.
610.
981.
471.
941.
21.
21.
21.
3
Infil
tratio
n Lo
ad in
202
5 (k
g/da
y)
Infil
tratio
n Lo
ad in
202
5 (k
g/da
y)
Com
partm
enta
tion
of P
ollu
tion
Load
Flam
e in
2025
Bas
ic U
nit f
or D
isch
arge
Loa
d in
202
5Pr
ecip
itatio
n(m
m)
Irrig
atio
nW
ater
(mm
)R
unof
f Rat
e
Tabl
e A
8.1.
3 S
umm
ary
of D
isch
arge
Loa
d, R
unof
f Loa
d an
d In
filtr
atio
n L
oad
in T
his S
tudy
Are
a (C
ase
2: 2
025)
R
unof
f Loa
d in
202
5 (k
g/da
y)
Livi
ngSy
stem
Dom
estic
S yst
em0.
10
Sew
erag
eSy
stem
Unt
reat
ed S
ewer
age
(Pip
e La
ying
)
1.00
Seco
ndar
y Tr
eatm
ent (
Dom
estic
)
Terti
ary
Trea
tmen
tSe
cond
ary
Trea
tmen
t (In
dust
ry)
Indu
stry
Priv
ate
Publ
ic
Land
Use
Syst
em
0.10
Tota
l
Com
partm
enta
tion
of P
ollu
tion
Load
Flam
e in
2025
Bas
ic U
nit f
or D
isch
arge
Loa
d in
202
5Pr
ecip
itatio
n(m
m)
Irrig
atio
nW
ater
(mm
)R
unof
f Rat
e
Live
Stoc
kSy
stem
Run
off L
oad
in 2
025
(kg/
day)
Livi
ngSy
stem
Dom
estic
S yst
em0.
10
Sew
erag
eSy
stem
Unt
reat
ed S
ewer
age
(Pip
e La
ying
)
1.00
Seco
ndar
y Tr
eatm
ent (
Dom
estic
)
Terti
ary
Trea
tmen
tSe
cond
ary
Trea
tmen
t (In
dust
ry)
0.10
Tota
l
Indu
stry
Priv
ate
Publ
ic
Land
Use
Syst
em
Live
Stoc
kSy
stem
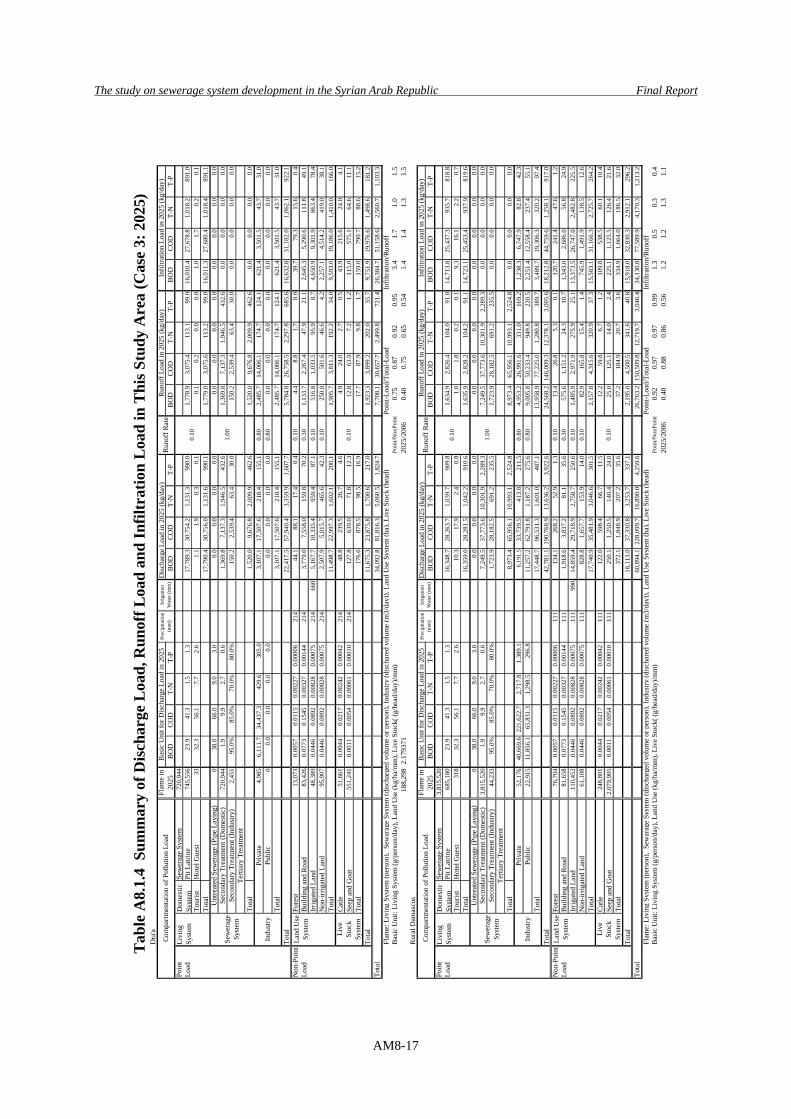
The study on sewerage system development in the Syrian Arab Republic Final Report
AM8-17
Dra
'aD
isch
arge
Loa
d in
202
5 (k
g/da
y)B
OD
CO
DT-
NT-
PB
OD
CO
DT-
NT-
PB
OD
COD
T-N
T-P
BOD
CO
DT-
NT-
PPo
int
Sew
erag
e Sy
stem
720,
944
Load
Pit L
atrin
e74
5,55
623
.941
.31.
51.
317
,789
.330
,754
.21,
131.
399
0.0
1,77
8.9
3,07
5.4
113.
199
.016
,010
.427
,678
.81,
018.
289
1.0
Tour
ist
Hot
el G
uest
3332
.356
.17.
72.
61.
11.
90.
30.
10.
10.
20.
00.
01.
01.
70.
20.
1To
tal
17,7
90.4
30,7
56.0
1,13
1.6
990.
11,
779.
03,
075.
611
3.2
99.0
16,0
11.3
27,6
80.4
1,01
8.4
891.
10
38.0
66.0
9.0
3.0
0.0
0.0
0.0
0.0
0.0
0.0
0.0
0.0
0.0
0.0
0.0
0.0
720,
944
1.9
9.9
2.7
0.6
1,36
9.8
7,13
7.3
1,94
6.5
432.
61,
369.
87,
137.
31,
946.
543
2.6
0.0
0.0
0.0
0.0
2,45
195
.0%
85.0
%70
.0%
80.0
%15
0.2
2,53
9.4
63.4
30.0
150.
22,
539.
463
.430
.00.
00.
00.
00.
0
Tota
l1,
520.
09,
676.
82,
009.
946
2.6
1,52
0.0
9,67
6.8
2,00
9.9
462.
60.
00.
00.
00.
04,
985
6,11
1.7
34,4
37.3
429.
630
5.0
3,10
7.1
17,5
07.6
218.
415
5.1
0.80
2,48
5.7
14,0
06.1
174.
712
4.1
621.
43,
501.
543
.731
.00
0.0
0.0
0.0
0.0
0.0
0.0
0.0
0.0
0.80
0.0
0.0
0.0
0.0
0.0
0.0
0.0
0.0
Tota
l3,
107.
117
,507
.621
8.4
155.
12,
485.
714
,006
.117
4.7
124.
162
1.4
3,50
1.5
43.7
31.0
Tota
l22
,417
.557
,940
.43,
359.
91,
607.
75,
784.
826
,758
.52,
297.
868
5.6
16,6
32.8
31,1
82.0
1,06
2.1
922.
1N
on-P
oint
Fore
st13
,073
0.00
570.
0115
0.00
227
0.00
006
214
44.1
88.1
17.4
0.4
0.10
4.4
8.8
1.7
0.0
39.7
79.3
15.6
0.4
Load
Build
ing
and
Road
83,4
260.
0773
0.15
450.
0032
70.
0014
421
43,
779.
07,
558.
015
9.8
70.2
0.30
1,13
3.7
2,26
7.4
47.9
21.1
2,64
5.3
5,29
0.6
111.
849
.1Irr
igat
ed L
and
48,3
890.
0446
0.08
920.
0082
80.
0007
521
466
05,
167.
710
,335
.495
9.4
87.1
0.10
516.
81,
033.
595
.98.
74,
650.
99,
301.
986
3.4
78.4
Non
-irrig
ated
Lan
d95
,907
0.04
460.
0892
0.00
828
0.00
075
214
2,50
7.9
5,01
5.7
465.
642
.30.
1025
0.8
501.
646
.64.
22,
257.
14,
514.
241
9.0
38.1
Tota
l11
,498
.722
,997
.31,
602.
120
0.1
1,90
5.7
3,81
1.3
192.
234
.09,
593.
019
,186
.01,
410.
016
6.0
Catle
51,6
610.
0044
0.02
170.
0024
20.
0004
221
448
.823
9.5
26.7
4.6
4.9
24.0
2.7
0.5
43.9
215.
624
.04.
1Se
ep a
nd G
oat
551,
241
0.00
110.
0054
0.00
061
0.00
010
214
127.
863
9.0
71.8
12.3
12.8
63.9
7.2
1.2
115.
057
5.1
64.6
11.1
Tota
l17
6.6
878.
598
.516
.917
.787
.99.
81.
715
9.0
790.
788
.615
.2To
tal
11,6
75.3
23,8
75.8
1,70
0.6
217.
01,
923.
33,
899.
220
2.0
35.7
9,75
1.9
19,9
76.6
1,49
8.6
181.
234
,092
.881
,816
.35,
060.
51,
824.
77,
708.
130
,657
.72,
499.
872
1.4
26,3
84.7
51,1
58.6
2,56
0.7
1,10
3.3
Flam
e: L
ivin
g Sy
stem
(per
son)
, Se
war
age
Syst
em (d
isch
arge
d vo
lum
e or
per
son)
, Ind
ustry
(dis
char
ed v
olum
e (m
3/da
y)),
Land
Use
Sys
tem
(ha)
, Liv
e St
ock
(hea
d)Po
int-L
oad/
Tota
l-Loa
dIn
filtra
tion/
Run
off
Bas
ic U
nit:
Livi
ng S
yste
m (g
/per
son/
day)
, Lan
d U
se (k
g/ha
/mm
), Li
ve S
tock
( (g/
head
/day
)/mm
)Po
int/N
onPo
int
0.75
0.87
0.92
0.95
3.4
1.7
1.0
1.5
188,
298
2.17
9371
2025
/200
60.
400.
750.
650.
541.
41.
41.
31.
5R
ural
Dam
ascu
sD
isch
arge
Loa
d in
202
5 (k
g/da
y)B
OD
CO
DT-
NT-
PB
OD
CO
DT-
NT-
PB
OD
COD
T-N
T-P
BOD
CO
DT-
NT-
PPo
int
Sew
erag
e Sy
stem
3,81
5,52
0Lo
adPi
t Lat
rine
685,
180
23.9
41.3
1.5
1.3
16,3
48.7
28,2
63.7
1,03
9.7
909.
81,
634.
92,
826.
410
4.0
91.0
14,7
13.8
25,4
37.3
935.
781
8.8
Tour
ist
Hot
el G
uest
318
32.3
56.1
7.7
2.6
10.3
17.9
2.4
0.8
1.0
1.8
0.2
0.1
9.3
16.1
2.2
0.7
Tota
l16
,359
.028
,281
.51,
042.
291
0.6
1,63
5.9
2,82
8.2
104.
291
.114
,723
.125
,453
.493
7.9
819.
60
38.0
66.0
9.0
3.0
0.0
0.0
0.0
0.0
0.0
0.0
0.0
0.0
0.0
0.0
0.0
0.0
3,81
5,52
01.
99.
92.
70.
67,
249.
537
,773
.610
,301
.92,
289.
37,
249.
537
,773
.610
,301
.92,
289.
30.
00.
00.
00.
044
,233
95.0
%85
.0%
70.0
%80
.0%
1,72
3.9
28,1
82.5
691.
223
5.5
1,72
3.9
28,1
82.5
691.
223
5.5
0.0
0.0
0.0
0.0
Tota
l8,
973.
465
,956
.110
,993
.12,
524.
88,
973.
465
,956
.110
,993
.12,
524.
80.
00.
00.
00.
052
,176
40,6
69.6
221,
622.
72,
717.
81,
389.
16,
191.
533
,739
.541
3.8
211.
50.
804,
953.
226
,991
.633
1.0
169.
21,
238.
36,
747.
982
.842
.322
,915
11,8
56.1
65,8
31.3
1,29
8.5
296.
811
,257
.262
,791
.81,
187.
227
5.6
0.80
9,00
5.8
50,2
33.4
949.
822
0.5
2,25
1.4
12,5
58.4
237.
455
.1To
tal
17,4
48.7
96,5
31.3
1,60
1.0
487.
113
,958
.977
,225
.01,
280.
838
9.7
3,48
9.7
19,3
06.3
320.
297
.4To
tal
42,7
81.1
190,
768.
913
,636
.23,
922.
624
,568
.214
6,00
9.3
12,3
78.1
3,00
5.6
18,2
12.8
44,7
59.6
1,25
8.1
917.
0N
on-P
oint
Fore
st76
,704
0.00
570.
0115
0.00
227
0.00
006
111
134.
126
8.2
52.9
1.3
0.10
13.4
26.8
5.3
0.1
120.
724
1.4
47.6
1.2
Load
Build
ing
and
Road
81,6
580.
0773
0.15
450.
0032
70.
0014
411
11,
918.
63,
837.
281
.135
.60.
3057
5.6
1,15
1.2
24.3
10.7
1,34
3.0
2,68
6.0
56.8
24.9
Irrig
ated
Lan
d11
0,45
20.
0446
0.08
920.
0082
80.
0007
511
199
014
,859
.429
,718
.92,
758.
725
0.6
0.10
1,48
5.9
2,97
1.9
275.
925
.113
,373
.526
,747
.02,
482.
822
5.5
Non
-irrig
ated
Lan
d61
,108
0.04
460.
0892
0.00
828
0.00
075
111
828.
81,
657.
715
3.9
14.0
0.10
82.9
165.
815
.41.
474
5.9
1,49
1.9
138.
512
.6To
tal
17,7
40.9
35,4
81.9
3,04
6.6
301.
52,
157.
84,
315.
632
0.9
37.3
15,5
83.1
31,1
66.3
2,72
5.7
264.
2Ca
tle24
8,80
10.
0044
0.02
170.
0024
20.
0004
211
112
2.0
598.
466
.711
.512
.259
.86.
71.
210
9.8
538.
560
.110
.4Se
ep a
nd G
oat
2,07
9,90
50.
0011
0.00
540.
0006
10.
0001
011
125
0.1
1,25
0.5
140.
424
.025
.012
5.1
14.0
2.4
225.
11,
125.
512
6.4
21.6
Tota
l37
2.1
1,84
8.9
207.
235
.637
.218
4.9
20.7
3.6
334.
91,
664.
018
6.5
32.0
Tota
l18
,113
.037
,330
.83,
253.
733
7.1
2,19
5.0
4,50
0.5
341.
640
.815
,918
.032
,830
.32,
912.
129
6.2
60,8
94.1
228,
099.
716
,890
.04,
259.
626
,763
.215
0,50
9.8
12,7
19.7
3,04
6.4
34,1
30.8
77,5
89.9
4,17
0.3
1,21
3.2
Flam
e: L
ivin
g Sy
stem
(per
son)
, Se
war
age
Syst
em (d
isch
arge
d vo
lum
e or
per
son)
, Ind
ustry
(dis
char
ed v
olum
e (m
3/da
y)),
Land
Use
Sys
tem
(ha)
, Liv
e St
ock
(hea
d)Po
int-L
oad/
Tota
l-Loa
dIn
filtra
tion/
Run
off
Bas
ic U
nit:
Livi
ng S
yste
m (g
/per
son/
day)
, Lan
d U
se (k
g/ha
/mm
), Li
ve S
tock
( (g/
head
/day
)/mm
)Po
int/N
onPo
int
0.92
0.97
0.97
0.99
1.3
0.5
0.3
0.4
2025
/200
60.
400.
880.
860.
561.
21.
21.
31.
1
Tab
le A
8.1.
4 S
umm
ary
of D
ischa
rge
Load
, Run
off L
oad
and
Infil
trat
ion
Load
in T
his S
tudy
Are
a (C
ase
3: 2
025)
In
filtra
tion
Load
in 2
025
(kg/
day)
Infil
tratio
n Lo
ad in
202
5 (k
g/da
y)
0.10
Tota
l
Live
Stoc
kSy
stem
Indu
stry
Priv
ate
Publ
ic
Land
Use
Syst
em
Sew
erag
eSy
stem
Unt
reat
ed S
ewer
age
(Pip
e La
ying
)
1.00
Seco
ndar
y Tr
eatm
ent (
Dom
estic
)Se
cond
ary
Trea
tmen
t (In
dust
ry)
Terti
ary
Trea
tmen
t
Runo
ff L
oad
in 2
025
(kg/
day)
Livi
ngSy
stem
Dom
estic
S yst
em0.
10
0.10
Tota
l
Com
partm
enta
tion
of P
ollu
tion
Load
Flam
e in
2025
Bas
ic U
nit f
or D
isch
arge
Loa
d in
202
5Pr
ecip
itatio
n(m
m)
Irrig
atio
nW
ater
(mm
)R
unof
f Rat
e
Live
Stoc
kSy
stem
Indu
stry
Priv
ate
Publ
ic
Land
Use
Syst
em
Sew
erag
eSy
stem
Unt
reat
ed S
ewer
age
(Pip
e La
ying
)
1.00
Seco
ndar
y Tr
eatm
ent (
Dom
estic
)Se
cond
ary
Trea
tmen
t (In
dust
ry)
Terti
ary
Trea
tmen
t
Irrig
atio
nW
ater
(mm
)R
unof
f Rat
eRu
noff
Loa
d in
202
5 (k
g/da
y)
Livi
ngSy
stem
Dom
estic
S yst
em0.
10
Com
partm
enta
tion
of P
ollu
tion
Load
Flam
e in
2025
Bas
ic U
nit f
or D
isch
arge
Loa
d in
202
5Pr
ecip
itatio
n(m
m)
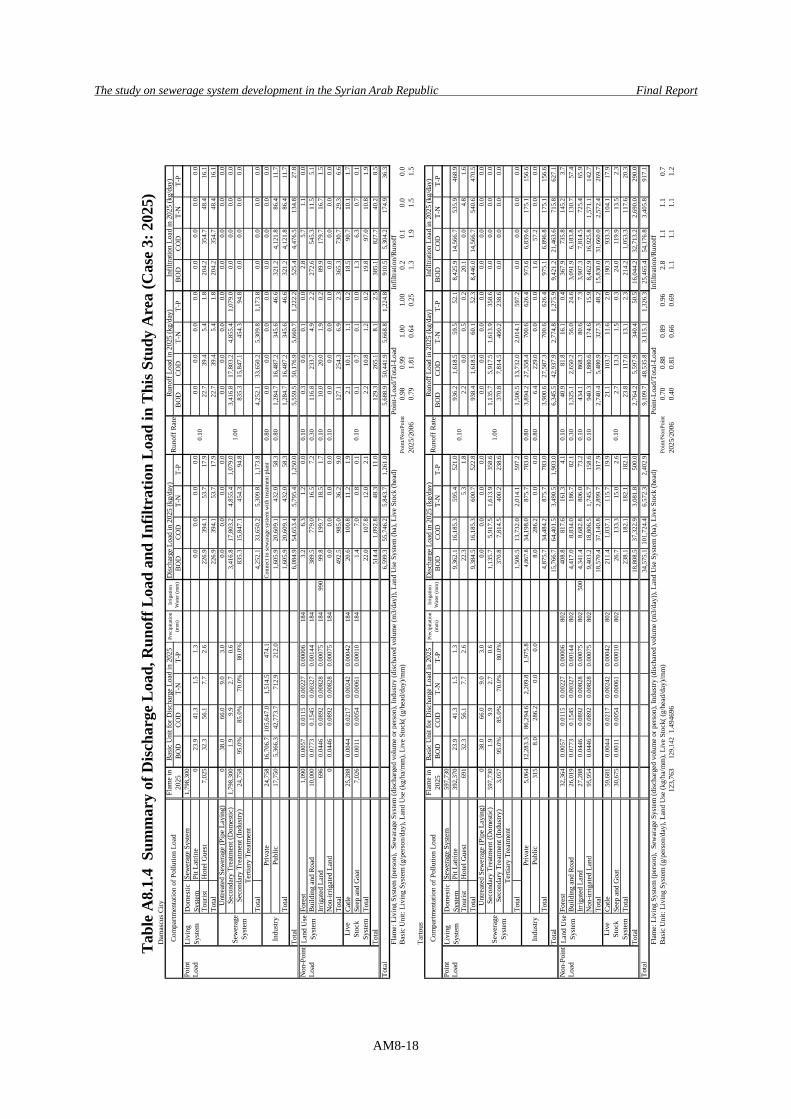
The study on sewerage system development in the Syrian Arab Republic Final Report
AM8-18
Dam
ascu
s City
Dis
char
ge L
oad
in 2
025
(kg/
day)
BO
DC
OD
T-N
T-P
BO
DC
OD
T-N
T-P
BO
DCO
DT-
NT-
PBO
DC
OD
T-N
T-P
Poin
tSe
wer
age
Syst
em1,
798,
300
Load
Pit L
atrin
e0
23.9
41.3
1.5
1.3
0.0
0.0
0.0
0.0
0.0
0.0
0.0
0.0
0.0
0.0
0.0
0.0
Tour
ist
Hot
el G
uest
7,02
532
.356
.17.
72.
622
6.9
394.
153
.717
.922
.739
.45.
41.
820
4.2
354.
748
.416
.1To
tal
226.
939
4.1
53.7
17.9
22.7
39.4
5.4
1.8
204.
235
4.7
48.4
16.1
038
.066
.09.
03.
00.
00.
00.
00.
00.
00.
00.
00.
00.
00.
00.
00.
01,
798,
300
1.9
9.9
2.7
0.6
3,41
6.8
17,8
03.2
4,85
5.4
1,07
9.0
3,41
6.8
17,8
03.2
4,85
5.4
1,07
9.0
0.0
0.0
0.0
0.0
24,7
5895
.0%
85.0
%70
.0%
80.0
%83
5.3
15,8
47.1
454.
394
.883
5.3
15,8
47.1
454.
394
.80.
00.
00.
00.
0
Tota
l4,
252.
133
,650
.25,
309.
81,
173.
84,
252.
133
,650
.25,
309.
81,
173.
80.
00.
00.
00.
024
,758
16,7
06.7
105,
647.
01,
514.
547
4.1
Con
nect
to se
war
age
syst
em w
ith tr
eatm
ent p
lant
0.80
0.0
0.0
0.0
0.0
0.0
0.0
0.0
0.0
17,7
505,
366.
342
,773
.771
2.9
212.
01,
605.
920
,609
.143
2.0
58.3
0.80
1,28
4.7
16,4
87.2
345.
646
.632
1.2
4,12
1.8
86.4
11.7
Tota
l1,
605.
920
,609
.143
2.0
58.3
1,28
4.7
16,4
87.2
345.
646
.632
1.2
4,12
1.8
86.4
11.7
Tota
l6,
084.
954
,653
.45,
795.
41,
250.
05,
559.
550
,176
.95,
660.
71,
222.
252
5.4
4,47
6.5
134.
827
.8N
on-P
oint
Fore
st1,
090
0.00
570.
0115
0.00
227
0.00
006
184
3.2
6.3
1.2
0.0
0.10
0.3
0.6
0.1
0.0
2.8
5.7
1.1
0.0
Load
Build
ing
and
Road
10,0
000.
0773
0.15
450.
0032
70.
0014
418
438
9.5
779.
016
.57.
20.
3011
6.8
233.
74.
92.
227
2.6
545.
311
.55.
1Irr
igat
ed L
and
696
0.04
460.
0892
0.00
828
0.00
075
184
990
99.8
199.
718
.51.
70.
1010
.020
.01.
90.
289
.917
9.7
16.7
1.5
Non
-irrig
ated
Lan
d0
0.04
460.
0892
0.00
828
0.00
075
184
0.0
0.0
0.0
0.0
0.10
0.0
0.0
0.0
0.0
0.0
0.0
0.0
0.0
Tota
l49
2.5
985.
036
.29.
012
7.1
254.
36.
92.
336
5.3
730.
729
.36.
6Ca
tle25
,288
0.00
440.
0217
0.00
242
0.00
042
184
20.6
100.
811
.21.
92.
110
.11.
10.
218
.590
.710
.11.
7Se
ep a
nd G
oat
7,02
60.
0011
0.00
540.
0006
10.
0001
018
41.
47.
00.
80.
10.
10.
70.
10.
01.
36.
30.
70.
1To
tal
22.0
107.
812
.02.
12.
210
.81.
20.
219
.897
.010
.81.
9To
tal
514.
41,
092.
848
.311
.012
9.3
265.
18.
12.
538
5.1
827.
740
.28.
56,
599.
355
,746
.25,
843.
71,
261.
05,
688.
950
,441
.95,
668.
81,
224.
891
0.5
5,30
4.2
174.
936
.3Fl
ame:
Liv
ing
Syst
em (p
erso
n),
Sew
arag
e Sy
stem
(dis
char
ged
volu
me
or p
erso
n), I
ndus
try (d
isch
ared
vol
ume
(m3/
day)
), La
nd U
se S
yste
m (h
a), L
ive
Stoc
k (h
ead)
Poin
t-Loa
d/To
tal-L
oad
Infil
tratio
n/R
unof
fB
asic
Uni
t: Li
ving
Sys
tem
(g/p
erso
n/da
y), L
and
Use
(kg/
ha/m
m),
Live
Sto
ck( (
g/he
ad/d
ay)/m
m)
Poin
t/Non
Poin
t0.
980.
991.
001.
000.
20.
10.
00.
020
25/2
006
0.79
1.81
0.64
0.25
1.3
1.9
1.5
1.5
Tarto
usD
isch
arge
Loa
d in
202
5 (k
g/da
y)B
OD
CO
DT-
NT-
PB
OD
CO
DT-
NT-
PB
OD
COD
T-N
T-P
BOD
CO
DT-
NT-
PPo
int
Sew
erag
e Sy
stem
597,
730
Load
Pit L
atrin
e39
2,37
023
.941
.31.
51.
39,
362.
116
,185
.359
5.4
521.
093
6.2
1,61
8.5
59.5
52.1
8,42
5.9
14,5
66.7
535.
946
8.9
Tour
ist
Hot
el G
uest
691
32.3
56.1
7.7
2.6
22.3
5.3
1.8
2.2
0.0
0.5
0.2
20.1
0.0
4.8
1.6
Tota
l9,
384.
516
,185
.360
0.7
522.
893
8.4
1,61
8.5
60.1
52.3
8,44
6.0
14,5
66.7
540.
647
0.5
038
.066
.09.
03.
00.
00.
00.
00.
00.
00.
00.
00.
00.
00.
00.
00.
059
7,73
01.
99.
92.
70.
61,
135.
75,
917.
51,
613.
935
8.6
1,13
5.7
5,91
7.5
1,61
3.9
358.
60.
00.
00.
00.
03,
057
95.0
%85
.0%
70.0
%80
.0%
370.
87,
814.
540
0.2
238.
637
0.8
7,81
4.5
400.
223
8.6
0.0
0.0
0.0
0.0
Tota
l1,
506.
513
,732
.02,
014.
159
7.2
1,50
6.5
13,7
32.0
2,01
4.1
597.
20.
00.
00.
00.
05,
064
12,2
83.3
86,2
94.6
2,20
9.8
1,97
5.8
4,86
7.8
34,1
98.0
875.
778
3.0
0.80
3,89
4.2
27,3
58.4
700.
662
6.4
973.
66,
839.
617
5.1
156.
631
58.
028
6.2
0.0
0.0
8.0
286.
20.
00.
00.
806.
422
9.0
0.0
0.0
1.6
57.2
0.0
0.0
Tota
l4,
875.
734
,484
.287
5.7
783.
03,
900.
627
,587
.370
0.6
626.
497
5.1
6,89
6.8
175.
115
6.6
Tota
l15
,766
.764
,401
.53,
490.
51,
903.
06,
345.
542
,937
.92,
774.
81,
275.
99,
421.
221
,463
.671
5.8
627.
1N
on-P
oint
Fore
st32
,364
0.00
570.
0115
0.00
227
0.00
006
802
408.
881
7.6
161.
34.
10.
1040
.981
.816
.10.
436
7.9
735.
814
5.2
3.7
Load
Build
ing
and
Road
26,0
190.
0773
0.15
450.
0032
70.
0014
480
24,
417.
08,
834.
018
6.7
82.1
0.30
1,32
5.1
2,65
0.2
56.0
24.6
3,09
1.9
6,18
3.8
130.
757
.4Irr
igat
ed L
and
27,2
880.
0446
0.08
920.
0082
80.
0007
580
250
04,
341.
48,
682.
880
6.0
73.2
0.10
434.
186
8.3
80.6
7.3
3,90
7.3
7,81
4.5
725.
465
.9N
on-ir
rigat
ed L
and
95,9
540.
0446
0.08
920.
0082
80.
0007
580
29,
403.
218
,806
.51,
745.
715
8.6
0.10
940.
31,
880.
617
4.6
15.9
8,46
2.9
16,9
25.8
1,57
1.1
142.
7To
tal
18,5
70.4
37,1
40.8
2,89
9.7
317.
92,
740.
45,
480.
932
7.3
48.2
15,8
30.0
31,6
60.0
2,57
2.4
269.
7Ca
tle59
,681
0.00
440.
0217
0.00
242
0.00
042
802
211.
41,
037.
111
5.7
19.9
21.1
103.
711
.62.
019
0.3
933.
310
4.1
17.9
Seep
and
Goa
t30
,675
0.00
110.
0054
0.00
061
0.00
010
802
26.7
133.
315
.02.
62.
713
.31.
50.
324
.011
9.9
13.5
2.3
Tota
l23
8.1
182.
118
2.1
182.
123
.811
7.0
13.1
2.3
214.
21,
053.
311
7.6
20.3
Tota
l18
,808
.537
,322
.93,
081.
850
0.0
2,76
4.2
5,59
7.9
340.
450
.516
,044
.232
,713
.22,
690.
029
0.0
34,5
75.1
101,
724.
46,
572.
32,
402.
99,
109.
748
,535
.83,
115.
11,
326.
325
,465
.454
,176
.83,
405.
891
7.1
Flam
e: L
ivin
g Sy
stem
(per
son)
, Se
war
age
Syst
em (d
isch
arge
d vo
lum
e or
per
son)
, Ind
ustry
(dis
char
ed v
olum
e (m
3/da
y)),
Land
Use
Sys
tem
(ha)
, Liv
e St
ock
(hea
d)Po
int-L
oad/
Tota
l-Loa
dIn
filtra
tion/
Run
off
Bas
ic U
nit:
Livi
ng S
yste
m (g
/per
son/
day)
, Lan
d U
se (k
g/ha
/mm
), Li
ve S
tock
( (g/
head
/day
)/mm
)Po
int/N
onPo
int
0.70
0.88
0.89
0.96
2.8
1.1
1.1
0.7
123,
763
129,
142
1.49
4696
2025
/200
60.
400.
810.
660.
691.
11.
11.
11.
2
Infil
tratio
n Lo
ad in
202
5 (k
g/da
y)
Infil
tratio
n Lo
ad in
202
5 (k
g/da
y)
0.10
Tota
l
Live
Stoc
kSy
stem
Indu
stry
Priv
ate
Publ
ic
Land
Use
Syst
em
Sew
erag
eSy
stem
Unt
reat
ed S
ewer
age
(Pip
e La
ying
)
1.00
Seco
ndar
y Tr
eatm
ent (
Dom
estic
)Se
cond
ary
Trea
tmen
t (In
dust
ry)
Terti
ary
Trea
tmen
t
Runo
ff L
oad
in 2
025
(kg/
day)
Livi
ngSy
stem
Dom
estic
Syst
em0.
10
0.10
Tota
l
Com
partm
enta
tion
of P
ollu
tion
Load
Flam
e in
2025
Bas
ic U
nit f
or D
isch
arge
Loa
d in
202
5Pr
ecip
itatio
n(m
m)
Irrig
atio
nW
ater
(mm
)R
unof
f Rat
e
Live
Stoc
kSy
stem
Indu
stry
Priv
ate
Publ
ic
Land
Use
Syst
em
Sew
erag
eSy
stem
Unt
reat
ed S
ewer
age
(Pip
e La
ying
)
1.00
Seco
ndar
y Tr
eatm
ent (
Dom
estic
)Se
cond
ary
Trea
tmen
t (In
dust
ry)
Terti
ary
Trea
tmen
t
Runo
ff L
oad
in 2
025
(kg/
day)
Livi
ngSy
stem
Dom
estic
Syst
em0.
10
Com
partm
enta
tion
of P
ollu
tion
Load
Flam
e in
2025
Bas
ic U
nit f
or D
isch
arge
Loa
d in
202
5Pr
ecip
itatio
n(m
m)
Irrig
atio
nW
ater
(mm
)R
unof
f Rat
e
Tab
le A
8.1.
4 S
umm
ary
of D
ischa
rge
Loa
d, R
unof
f Loa
d an
d In
filtr
atio
n L
oad
in T
his S
tudy
Are
a (C
ase
3: 2
025)
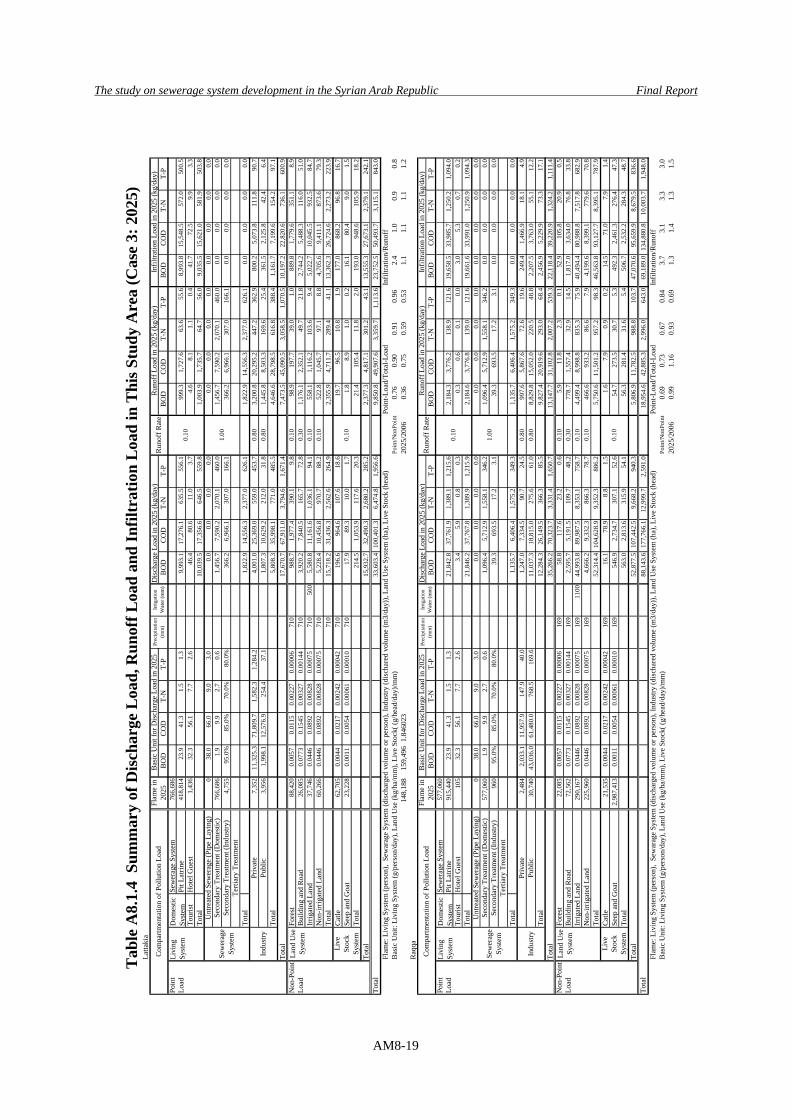
The study on sewerage system development in the Syrian Arab Republic Final Report
AM8-19
Latta
kia
Dis
char
ge L
oad
in 2
025
(kg/
day)
BO
DC
OD
T-N
T-P
BO
DC
OD
T-N
T-P
BO
DC
OD
T-N
T-P
BOD
CO
DT-
NT-
PPo
int
Sew
erag
e Sy
stem
766,
686
Load
Pit L
atrin
e41
8,81
423
.941
.31.
51.
39,
993.
117
,276
.163
5.5
556.
199
9.3
1,72
7.6
63.6
55.6
8,99
3.8
15,5
48.5
572.
050
0.5
Tour
ist
Hot
el G
uest
1,43
632
.356
.17.
72.
646
.480
.611
.03.
74.
68.
11.
10.
441
.772
.59.
93.
3To
tal
10,0
39.5
17,3
56.6
646.
555
9.8
1,00
3.9
1,73
5.7
64.7
56.0
9,03
5.5
15,6
21.0
581.
950
3.8
038
.066
.09.
03.
00.
00.
00.
00.
00.
00.
00.
00.
00.
00.
00.
00.
076
6,68
61.
99.
92.
70.
61,
456.
77,
590.
22,
070.
146
0.0
1,45
6.7
7,59
0.2
2,07
0.1
460.
00.
00.
00.
00.
04,
755
95.0
%85
.0%
70.0
%80
.0%
366.
26,
966.
130
7.0
166.
136
6.2
6,96
6.1
307.
016
6.1
0.0
0.0
0.0
0.0
Tota
l1,
822.
914
,556
.32,
377.
062
6.1
1,82
2.9
14,5
56.3
2,37
7.0
626.
10.
00.
00.
00.
07,
352
11,3
25.3
71,8
09.7
1,58
2.3
1,28
4.2
4,00
1.0
25,3
69.0
559.
045
3.7
0.80
3,20
0.8
20,2
95.2
447.
236
2.9
800.
25,
073.
811
1.8
90.7
3,95
61,
998.
112
,576
.925
4.4
37.1
1,80
7.3
10,6
29.2
212.
031
.80.
801,
445.
88,
503.
316
9.6
25.4
361.
52,
125.
842
.46.
4To
tal
5,80
8.3
35,9
98.1
771.
048
5.5
4,64
6.6
28,7
98.5
616.
838
8.4
1,16
1.7
7,19
9.6
154.
297
.1To
tal
17,6
70.7
67,9
11.0
3,79
4.6
1,67
1.4
7,47
3.5
45,0
90.5
3,05
8.5
1,07
0.5
10,1
97.2
22,8
20.6
736.
160
0.9
Non
-Poi
ntFo
rest
88,4
200.
0057
0.01
150.
0022
70.
0000
671
098
8.7
1,97
7.4
390.
19.
80.
1098
.919
7.7
39.0
1.0
889.
81,
779.
635
1.1
8.9
Load
Build
ing
and
Road
26,0
850.
0773
0.15
450.
0032
70.
0014
471
03,
920.
27,
840.
516
5.7
72.8
0.30
1,17
6.1
2,35
2.1
49.7
21.8
2,74
4.2
5,48
8.3
116.
051
.0Irr
igat
ed L
and
37,7
460.
0446
0.08
920.
0082
80.
0007
571
050
05,
580.
811
,161
.61,
036.
194
.10.
1055
8.1
1,11
6.2
103.
69.
45,
022.
710
,045
.593
2.5
84.7
Non
-irrig
ated
Lan
d60
,266
0.04
460.
0892
0.00
828
0.00
075
710
5,22
8.4
10,4
56.8
970.
788
.20.
1052
2.8
1,04
5.7
97.1
8.8
4,70
5.6
9,41
1.1
873.
679
.3To
tal
710
15,7
18.2
31,4
36.3
2,56
2.6
264.
92,
355.
94,
711.
728
9.4
41.1
13,3
62.3
26,7
24.6
2,27
3.2
223.
9Ca
tle62
,705
0.00
440.
0217
0.00
242
0.00
042
710
196.
696
4.6
107.
618
.619
.796
.510
.81.
917
7.0
868.
296
.816
.7Se
ep a
nd G
oat
23,2
280.
0011
0.00
540.
0006
10.
0001
071
017
.989
.310
.01.
71.
88.
91.
00.
216
.180
.49.
01.
5To
tal
214.
51,
053.
911
7.6
20.3
21.4
105.
411
.82.
019
3.0
948.
610
5.9
18.2
Tota
l15
,932
.732
,490
.32,
680.
228
5.2
2,37
7.3
4,81
7.1
301.
243
.113
,555
.327
,673
.12,
379.
124
2.1
33,6
03.4
100,
401.
36,
474.
81,
956.
69,
850.
849
,907
.63,
359.
71,
113.
623
,752
.550
,493
.73,
115.
184
3.0
Flam
e: L
ivin
g Sy
stem
(per
son)
, Se
war
age
Syst
em (d
isch
arge
d vo
lum
e or
per
son)
, Ind
ustry
(dis
char
ed v
olum
e (m
3/da
y)),
Land
Use
Sys
tem
(ha)
, Liv
e St
ock
(hea
d)Po
int-L
oad/
Tota
l-Loa
dIn
filtra
tion/
Run
off
Bas
ic U
nit:
Livi
ng S
yste
m (g
/per
son/
day)
, Lan
d U
se (k
g/ha
/mm
), Li
ve S
tock
( (g/
head
/day
)/mm
)Po
int/N
onPo
int
0.76
0.90
0.91
0.96
2.4
1.0
0.9
0.8
148,
188
159,
496
1.84
6023
2025
/200
60.
360.
750.
590.
531.
11.
11.
11.
2R
aqqa
Dis
char
ge L
oad
in 2
025
(kg/
day)
BO
DC
OD
T-N
T-P
BO
DC
OD
T-N
T-P
BO
DC
OD
T-N
T-P
BOD
CO
DT-
NT-
PPo
int
Sew
erag
e Sy
stem
577,
060
Load
Pit L
atrin
e91
5,44
023
.941
.31.
51.
321
,842
.837
,761
.91,
389.
11,
215.
62,
184.
33,
776.
213
8.9
121.
619
,658
.533
,985
.71,
250.
21,
094.
0To
uris
tH
otel
Gue
st10
532
.356
.17.
72.
63.
45.
90.
80.
30.
30.
60.
10.
03.
05.
30.
70.
2To
tal
21,8
46.2
37,7
67.8
1,38
9.9
1,21
5.9
2,18
4.6
3,77
6.8
139.
012
1.6
19,6
61.6
33,9
91.0
1,25
0.9
1,09
4.3
038
.066
.09.
03.
00.
00.
00.
00.
00.
00.
00.
00.
00.
00.
00.
00.
057
7,06
01.
99.
92.
70.
61,
096.
45,
712.
91,
558.
134
6.2
1,09
6.4
5,71
2.9
1,55
8.1
346.
20.
00.
00.
00.
096
095
.0%
85.0
%70
.0%
80.0
%39
.369
3.5
17.2
3.1
39.3
693.
517
.23.
10.
00.
00.
00.
0
Tota
l1,
135.
76,
406.
41,
575.
234
9.3
1,13
5.7
6,40
6.4
1,57
5.2
349.
30.
00.
00.
00.
02,
484
2,03
3.1
11,9
57.9
147.
940
.01,
247.
07,
334.
590
.724
.50.
8099
7.6
5,86
7.6
72.6
19.6
249.
41,
466.
918
.14.
930
,740
43,0
36.0
61,4
80.0
768.
516
9.6
11,0
37.3
18,8
15.0
275.
661
.00.
808,
829.
815
,052
.022
0.5
48.8
2,20
7.5
3,76
3.0
55.1
12.2
Tota
l12
,284
.326
,149
.536
6.3
85.5
9,82
7.4
20,9
19.6
293.
068
.42,
456.
95,
229.
973
.317
.1To
tal
35,2
66.2
70,3
23.7
3,33
1.4
1,65
0.7
13,1
47.7
31,1
02.8
2,00
7.2
539.
322
,118
.439
,220
.91,
324.
21,
111.
4N
on-P
oint
Fore
st22
,085
0.00
570.
0115
0.00
227
0.00
006
169
58.8
117.
623
.20.
60.
105.
911
.82.
30.
152
.910
5.8
20.9
0.5
Load
Build
ing
and
Road
72,5
620.
0773
0.15
450.
0032
70.
0014
416
92,
595.
75,
191.
510
9.7
48.2
0.30
778.
71,
557.
432
.914
.51,
817.
03,
634.
076
.833
.8Irr
igat
ed L
and
290,
167
0.04
460.
0892
0.00
828
0.00
075
169
1100
44,9
93.8
89,9
87.5
8,35
3.1
758.
70.
104,
499.
48,
998.
883
5.3
75.9
40,4
94.4
80,9
88.8
7,51
7.8
682.
9N
on-ir
rigat
ed L
and
225,
960
0.04
460.
0892
0.00
828
0.00
075
169
4,66
6.2
9,33
2.3
866.
378
.70.
1046
6.6
933.
286
.67.
94,
199.
68,
399.
177
9.6
70.8
Tota
l52
,314
.410
4,62
8.9
9,35
2.3
886.
25,
750.
611
,501
.295
7.2
98.3
46,5
63.8
93,1
27.7
8,39
5.1
787.
9Ca
tle21
,535
0.00
440.
0217
0.00
242
0.00
042
169
16.1
78.9
8.8
1.5
1.6
7.9
0.9
0.2
14.5
71.0
7.9
1.4
Seep
and
Goa
t2,
987,
413
0.00
110.
0054
0.00
061
0.00
010
169
546.
92,
734.
730
7.1
52.6
54.7
273.
530
.75.
349
2.3
2,46
1.3
276.
447
.3To
tal
563.
02,
813.
631
5.9
54.1
56.3
281.
431
.65.
450
6.7
2,53
2.2
284.
348
.7To
tal
52,8
77.5
107,
442.
59,
668.
294
0.3
5,80
6.9
11,7
82.5
988.
810
3.7
47,0
70.6
95,6
59.9
8,67
9.5
836.
688
,143
.617
7,76
6.1
12,9
99.7
2,59
1.0
18,9
54.6
42,8
85.3
2,99
6.0
643.
069
,189
.013
4,88
0.8
10,0
03.7
1,94
8.0
Flam
e: L
ivin
g Sy
stem
(per
son)
, Se
war
age
Syst
em (d
isch
arge
d vo
lum
e or
per
son)
, Ind
ustry
(dis
char
ed v
olum
e (m
3/da
y)),
Land
Use
Sys
tem
(ha)
, Liv
e St
ock
(hea
d)Po
int-L
oad/
Tota
l-Loa
dIn
filtra
tion/
Run
off
Bas
ic U
nit:
Livi
ng S
yste
m (g
/per
son/
day)
, Lan
d U
se (k
g/ha
/mm
), Li
ve S
tock
( (g/
head
/day
)/mm
)Po
int/N
onPo
int
0.69
0.73
0.67
0.84
3.7
3.1
3.3
3.0
2025
/200
60.
991.
160.
930.
691.
31.
41.
31.
5
Infil
tratio
n Lo
ad in
202
5 (k
g/da
y)
Infil
tratio
n Lo
ad in
202
5 (k
g/da
y)
0.10
Tota
l
Live
Stoc
kSy
stem
Indu
stry
Priv
ate
Publ
ic
Land
Use
Syst
em
Sew
erag
eSy
stem
Unt
reat
ed S
ewer
age
(Pip
e La
ying
)
1.00
Seco
ndar
y Tr
eatm
ent (
Dom
estic
)Se
cond
ary
Trea
tmen
t (In
dust
ry)
Terti
ary
Trea
tmen
t
Runo
ff L
oad
in 2
025
(kg/
day)
Livi
ngSy
stem
Dom
estic
Syst
em0.
10
0.10
Tota
l
Com
partm
enta
tion
of P
ollu
tion
Load
Flam
e in
2025
Bas
ic U
nit f
or D
isch
arge
Loa
d in
202
5Pr
ecip
itatio
n(m
m)
Irrig
atio
nW
ater
(mm
)R
unof
f Rat
e
Live
Stoc
kSy
stem
Indu
stry
Priv
ate
Publ
ic
Land
Use
Syst
em
Sew
erag
eSy
stem
Unt
reat
ed S
ewer
age
(Pip
e La
ying
)
1.00
Seco
ndar
y Tr
eatm
ent (
Dom
estic
)Se
cond
ary
Trea
tmen
t (In
dust
ry)
Terti
ary
Trea
tmen
t
Runo
ff L
oad
in 2
025
(kg/
day)
Livi
ngSy
stem
Dom
estic
Syst
em0.
10
Com
partm
enta
tion
of P
ollu
tion
Load
Flam
e in
2025
Bas
ic U
nit f
or D
isch
arge
Loa
d in
202
5Pr
ecip
itatio
n(m
m)
Irrig
atio
nW
ater
(mm
)R
unof
f Rat
e
Tab
le A
8.1.
4 S
umm
ary
of D
ischa
rge
Loa
d, R
unof
f Loa
d an
d In
filtr
atio
n L
oad
in T
his S
tudy
Are
a (C
ase
3: 2
025)
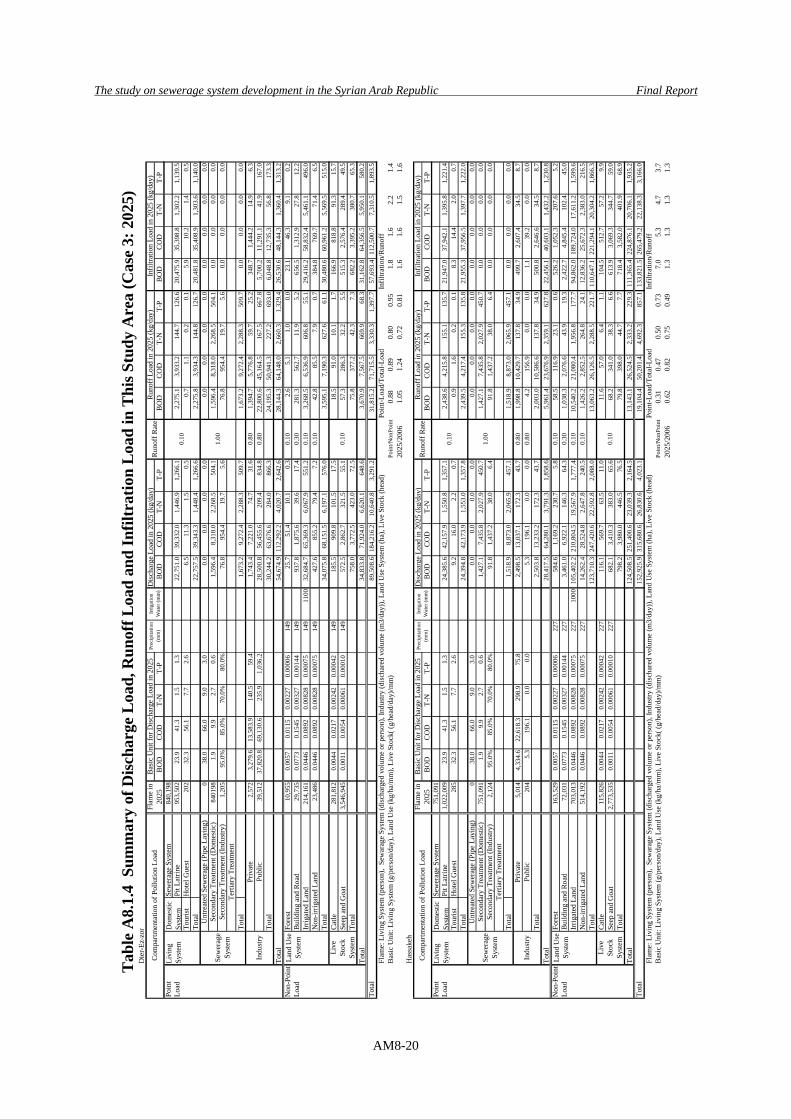
The study on sewerage system development in the Syrian Arab Republic Final Report
AM8-20
Die
r-Ez-
zor
Dis
char
ge L
oad
in 2
025
(kg/
day)
BO
DC
OD
T-N
T-P
BO
DC
OD
T-N
T-P
BO
DC
OD
T-N
T-P
BOD
CO
DT-
NT-
PPo
int
Sew
erag
e Sy
stem
840,
198
Load
Pit L
atrin
e95
3,50
223
.941
.31.
51.
322
,751
.039
,332
.01,
446.
91,
266.
12,
275.
13,
933.
214
4.7
126.
620
,475
.935
,398
.81,
302.
21,
139.
5To
uris
tH
otel
Gue
st20
232
.356
.17.
72.
66.
511
.31.
50.
50.
71.
10.
20.
15.
910
.21.
40.
5To
tal
22,7
57.5
39,3
43.3
1,44
8.4
1,26
6.6
2,27
5.8
3,93
4.3
144.
812
6.7
20,4
81.8
35,4
08.9
1,30
3.6
1,14
0.0
038
.066
.09.
03.
00.
00.
00.
00.
00.
00.
00.
00.
00.
00.
00.
00.
084
0198
1.9
9.9
2.7
0.6
1,59
6.4
8,31
8.0
2,26
8.5
504.
11,
596.
48,
318.
02,
268.
550
4.1
0.0
0.0
0.0
0.0
1,20
595
.0%
85.0
%70
.0%
80.0
%76
.895
4.4
19.7
5.6
76.8
954.
419
.75.
60.
00.
00.
00.
0
Tota
l1,
673.
29,
272.
42,
288.
350
9.7
1,67
3.2
9,27
2.4
2,28
8.3
509.
70.
00.
00.
00.
02,
572
3,27
9.6
13,5
83.9
140.
559
.41,
743.
47,
221.
074
.731
.60.
801,
394.
75,
776.
859
.725
.234
8.7
1,44
4.2
14.9
6.3
39,5
1237
,820
.869
,130
.623
5.9
1,03
6.2
28,5
00.8
56,4
55.6
209.
483
4.8
0.80
22,8
00.6
45,1
64.5
167.
566
7.8
5,70
0.2
11,2
91.1
41.9
167.
0To
tal
30,2
44.2
63,6
76.6
284.
086
6.3
24,1
95.3
50,9
41.3
227.
269
3.0
6,04
8.8
12,7
35.3
56.8
173.
3To
tal
54,6
74.9
112,
292.
24,
020.
72,
642.
628
,144
.364
,148
.02,
660.
31,
329.
426
,530
.648
,144
.31,
360.
41,
313.
2N
on-P
oint
Fore
st10
,955
0.00
570.
0115
0.00
227
0.00
006
149
25.7
51.4
10.1
0.3
0.10
2.6
5.1
1.0
0.0
23.1
46.3
9.1
0.2
Load
Build
ing
and
Road
29,7
350.
0773
0.15
450.
0032
70.
0014
414
993
7.8
1,87
5.6
39.6
17.4
0.30
281.
356
2.7
11.9
5.2
656.
51,
312.
927
.812
.2Irr
igat
ed L
and
214,
161
0.04
460.
0892
0.00
828
0.00
075
149
1100
32,6
84.7
65,3
69.3
6,06
7.9
551.
20.
103,
268.
56,
536.
960
6.8
55.1
29,4
16.2
58,8
32.4
5,46
1.1
496.
0N
on-ir
rigat
ed L
and
23,4
860.
0446
0.08
920.
0082
80.
0007
514
942
7.6
855.
279
.47.
20.
1042
.885
.57.
90.
738
4.8
769.
771
.46.
5To
tal
34,0
75.8
68,1
51.5
6,19
7.1
576.
03,
595.
17,
190.
362
7.6
61.1
30,4
80.6
60,9
61.2
5,56
9.5
515.
0Ca
tle28
1,81
20.
0044
0.02
170.
0024
20.
0004
214
918
5.5
909.
810
1.5
17.5
18.5
91.0
10.1
1.7
166.
981
8.8
91.3
15.7
Seep
and
Goa
t3,
546,
945
0.00
110.
0054
0.00
061
0.00
010
149
572.
52,
862.
732
1.5
55.1
57.3
286.
332
.25.
551
5.3
2,57
6.4
289.
449
.5To
tal
758.
03,
772.
542
3.0
72.5
75.8
377.
242
.37.
368
2.2
3,39
5.2
380.
765
.3To
tal
34,8
33.8
71,9
24.0
6,62
0.1
648.
63,
670.
97,
567.
566
9.9
68.3
31,1
62.8
64,3
56.5
5,95
0.1
580.
289
,508
.618
4,21
6.2
10,6
40.8
3,29
1.2
31,8
15.2
71,7
15.5
3,33
0.3
1,39
7.7
57,6
93.4
112,
500.
77,
310.
51,
893.
5Fl
ame:
Liv
ing
Syst
em (p
erso
n),
Sew
arag
e Sy
stem
(dis
char
ged
volu
me
or p
erso
n), I
ndus
try (d
isch
ared
vol
ume
(m3/
day)
), La
nd U
se S
yste
m (h
a), L
ive
Stoc
k (h
ead)
Poin
t-Loa
d/To
tal-L
oad
Infil
tratio
n/R
unof
fB
asic
Uni
t: Li
ving
Sys
tem
(g/p
erso
n/da
y), L
and
Use
(kg/
ha/m
m),
Live
Sto
ck( (
g/he
ad/d
ay)/m
m)
Poin
t/Non
Poin
t0.
880.
890.
800.
951.
81.
62.
21.
420
25/2
006
1.05
1.24
0.72
0.81
1.6
1.6
1.5
1.6
Has
sake
hD
isch
arge
Loa
d in
202
5 (k
g/da
y)B
OD
CO
DT-
NT-
PB
OD
CO
DT-
NT-
PB
OD
CO
DT-
NT-
PBO
DC
OD
T-N
T-P
Poin
tSe
wer
age
Syst
em75
1,09
1Lo
adPi
t Lat
rine
1,02
2,00
923
.941
.31.
51.
324
,385
.642
,157
.91,
550.
81,
357.
12,
438.
64,
215.
815
5.1
135.
721
,947
.037
,942
.11,
395.
81,
221.
4To
uris
tH
otel
Gue
st28
532
.356
.17.
72.
69.
216
.02.
20.
70.
91.
60.
20.
18.
314
.42.
00.
7To
tal
24,3
94.8
42,1
73.9
1,55
3.0
1,35
7.8
2,43
9.5
4,21
7.4
155.
313
5.8
21,9
55.3
37,9
56.5
1,39
7.7
1,22
2.0
038
.066
.09.
03.
00.
00.
00.
00.
00.
00.
00.
00.
00.
00.
00.
00.
075
1,09
11.
99.
92.
70.
61,
427.
17,
435.
82,
027.
945
0.7
1,42
7.1
7,43
5.8
2,02
7.9
450.
70.
00.
00.
00.
02,
124
95.0
%85
.0%
70.0
%80
.0%
91.8
1,43
7.2
38.0
6.4
91.8
1,43
7.2
38.0
6.4
0.0
0.0
0.0
0.0
Tota
l1,
518.
98,
873.
02,
065.
945
7.1
1,51
8.9
8,87
3.0
2,06
5.9
457.
10.
00.
00.
00.
05,
014
4,33
4.6
22,6
18.3
298.
975
.82,
498.
513
,037
.117
2.3
43.7
0.80
1,99
8.8
10,4
29.7
137.
834
.949
9.7
2,60
7.4
34.5
8.7
204
5.3
196.
10.
00.
05.
319
6.1
0.0
0.0
0.80
4.2
156.
90.
00.
01.
139
.20.
00.
0To
tal
2,50
3.8
13,2
33.2
172.
343
.72,
003.
010
,586
.613
7.8
34.9
500.
82,
646.
634
.58.
7To
tal
28,4
17.5
64,2
80.1
3,79
1.3
1,85
8.6
5,96
1.4
23,6
76.9
2,35
9.1
627.
822
,456
.140
,603
.11,
432.
21,
230.
8N
on-P
oint
Fore
st16
3,52
90.
0057
0.01
150.
0022
70.
0000
622
758
4.6
1,16
9.2
230.
75.
80.
1058
.511
6.9
23.1
0.6
526.
21,
052.
320
7.6
5.2
Load
Build
ing
and
Road
72,0
310.
0773
0.15
450.
0032
70.
0014
422
73,
461.
06,
922.
114
6.3
64.3
0.30
1,03
8.3
2,07
6.6
43.9
19.3
2,42
2.7
4,84
5.4
102.
445
.0Irr
igat
ed L
and
703,
013
0.04
460.
0892
0.00
828
0.00
075
227
1000
105,
402.
221
0,80
4.5
19,5
67.9
1,77
7.4
0.10
10,5
40.2
21,0
80.4
1,95
6.8
177.
794
,862
.018
9,72
4.0
17,6
11.2
1,59
9.6
Non
-irrig
ated
Lan
d51
4,19
20.
0446
0.08
920.
0082
80.
0007
522
714
,262
.428
,524
.82,
647.
824
0.5
0.10
1,42
6.2
2,85
2.5
264.
824
.112
,836
.225
,672
.32,
383.
021
6.5
Tota
l12
3,71
0.3
247,
420.
622
,592
.82,
088.
013
,063
.226
,126
.52,
288.
522
1.7
110,
647.
122
1,29
4.1
20,3
04.2
1,86
6.3
Catle
115,
826
0.00
440.
0217
0.00
242
0.00
042
227
116.
156
9.7
63.5
11.0
11.6
57.0
6.4
1.1
104.
551
2.7
57.2
9.9
Seep
and
Goa
t2,
773,
535
0.00
110.
0054
0.00
061
0.00
010
227
682.
13,
410.
338
3.0
65.6
68.2
341.
038
.36.
661
3.9
3,06
9.3
344.
759
.0To
tal
798.
23,
980.
044
6.5
76.5
79.8
398.
044
.77.
771
8.4
3,58
2.0
401.
968
.9To
tal
124,
508.
525
1,40
0.6
23,0
39.3
2,16
4.5
13,1
43.1
26,5
24.5
2,33
3.2
229.
311
1,36
5.4
224,
876.
120
,706
.11,
935.
215
2,92
5.9
315,
680.
626
,830
.64,
023.
119
,104
.450
,201
.44,
692.
385
7.1
133,
821.
526
5,47
9.2
22,1
38.3
3,16
6.0
Flam
e: L
ivin
g Sy
stem
(per
son)
, Se
war
age
Syst
em (d
isch
arge
d vo
lum
e or
per
son)
, Ind
ustry
(dis
char
ed v
olum
e (m
3/da
y)),
Land
Use
Sys
tem
(ha)
, Liv
e St
ock
(hea
d)Po
int-L
oad/
Tota
l-Loa
dIn
filtra
tion/
Run
off
Bas
ic U
nit:
Livi
ng S
yste
m (g
/per
son/
day)
, Lan
d U
se (k
g/ha
/mm
), Li
ve S
tock
( (g/
head
/day
)/mm
)Po
int/N
onPo
int
0.31
0.47
0.50
0.73
7.0
5.3
4.7
3.7
2025
/200
60.
620.
820.
750.
491.
31.
31.
31.
3
Infil
tratio
n Lo
ad in
202
5 (k
g/da
y)
Infil
tratio
n Lo
ad in
202
5 (k
g/da
y)
0.10
Tota
l
Live
Stoc
kSy
stem
Indu
stry
Priv
ate
Publ
ic
Land
Use
Syst
em
Sew
erag
eSy
stem
Unt
reat
ed S
ewer
age
(Pip
e La
ying
)
1.00
Seco
ndar
y Tr
eatm
ent (
Dom
estic
)Se
cond
ary
Trea
tmen
t (In
dust
ry)
Terti
ary
Trea
tmen
t
Runo
ff L
oad
in 2
025
(kg/
day)
Livi
ngSy
stem
Dom
estic
Syst
em0.
10
0.10
Tota
l
Com
partm
enta
tion
of P
ollu
tion
Load
Flam
e in
2025
Bas
ic U
nit f
or D
isch
arge
Loa
d in
202
5Pr
ecip
itatio
n(m
m)
Irrig
atio
nW
ater
(mm
)R
unof
f Rat
e
Live
Stoc
kSy
stem
Indu
stry
Priv
ate
Publ
ic
Land
Use
Syst
em
Sew
erag
eSy
stem
Unt
reat
ed S
ewer
age
(Pip
e La
ying
)
1.00
Seco
ndar
y Tr
eatm
ent (
Dom
estic
)Se
cond
ary
Trea
tmen
t (In
dust
ry)
Terti
ary
Trea
tmen
t
Runo
ff L
oad
in 2
025
(kg/
day)
Livi
ngSy
stem
Dom
estic
Syst
em0.
10
Com
partm
enta
tion
of P
ollu
tion
Load
Flam
e in
2025
Bas
ic U
nit f
or D
isch
arge
Loa
d in
202
5Pr
ecip
itatio
n(m
m)
Irrig
atio
nW
ater
(mm
)R
unof
f Rat
e
Tab
le A
8.1.
4 S
umm
ary
of D
ischa
rge
Loa
d, R
unof
f Loa
d an
d In
filtr
atio
n L
oad
in T
his S
tudy
Are
a (C
ase
3: 2
025)
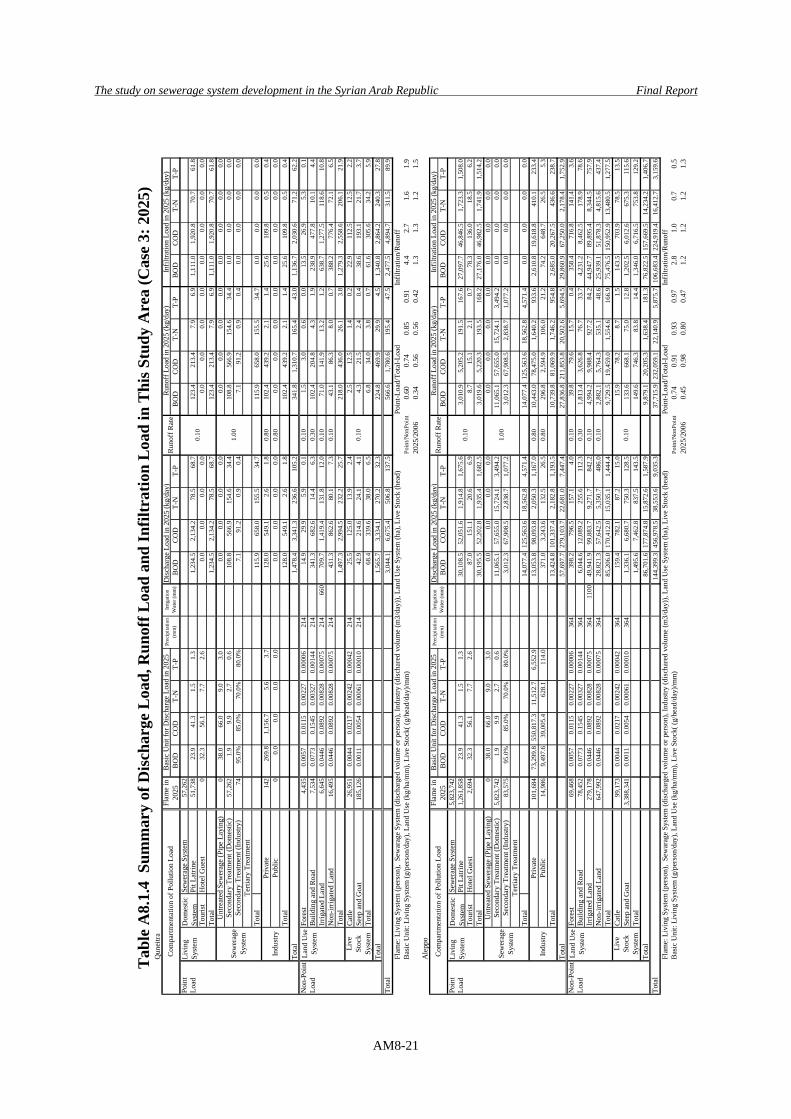
The study on sewerage system development in the Syrian Arab Republic Final Report
AM8-21
Qun
eitra
Dis
char
ge L
oad
in 2
025
(kg/
day)
BO
DC
OD
T-N
T-P
BO
DC
OD
T-N
T-P
BO
DC
OD
T-N
T-P
BOD
CO
DT-
NT-
PPo
int
Sew
erag
e Sy
stem
57,2
62Lo
adPi
t Lat
rine
51,7
3823
.941
.31.
51.
31,
234.
52,
134.
278
.568
.712
3.4
213.
47.
96.
91,
111.
01,
920.
870
.761
.8To
uris
tH
otel
Gue
st0
32.3
56.1
7.7
2.6
0.0
0.0
0.0
0.0
0.0
0.0
0.0
0.0
0.0
0.0
0.0
0.0
Tota
l1,
234.
52,
134.
278
.568
.712
3.4
213.
47.
96.
91,
111.
01,
920.
870
.761
.80
38.0
66.0
9.0
3.0
0.0
0.0
0.0
0.0
0.0
0.0
0.0
0.0
0.0
0.0
0.0
0.0
57,2
621.
99.
92.
70.
610
8.8
566.
915
4.6
34.4
108.
856
6.9
154.
634
.40.
00.
00.
00.
074
95.0
%85
.0%
70.0
%80
.0%
7.1
91.2
0.9
0.4
7.1
91.2
0.9
0.4
0.0
0.0
0.0
0.0
Tota
l11
5.9
658.
015
5.5
34.7
115.
965
8.0
155.
534
.70.
00.
00.
00.
014
226
9.8
1,15
6.7
5.6
3.7
128.
054
9.1
2.6
1.8
0.80
102.
443
9.2
2.1
1.4
25.6
109.
80.
50.
40
0.0
0.0
0.0
0.0
0.0
0.0
0.0
0.0
0.80
0.0
0.0
0.0
0.0
0.0
0.0
0.0
0.0
Tota
l12
8.0
549.
12.
61.
810
2.4
439.
22.
11.
425
.610
9.8
0.5
0.4
Tota
l1,
478.
43,
341.
323
6.6
105.
234
1.8
1,31
0.7
165.
443
.01,
136.
72,
030.
671
.262
.2N
on-P
oint
Fore
st4,
435
0.00
570.
0115
0.00
227
0.00
006
214
14.9
29.9
5.9
0.1
0.10
1.5
3.0
0.6
0.0
13.5
26.9
5.3
0.1
Load
Build
ing
and
Road
7,53
40.
0773
0.15
450.
0032
70.
0014
421
434
1.3
682.
614
.46.
30.
3010
2.4
204.
84.
31.
923
8.9
477.
810
.14.
4Irr
igat
ed L
and
6,64
50.
0446
0.08
920.
0082
80.
0007
521
466
070
9.7
1,41
9.4
131.
812
.00.
1071
.014
1.9
13.2
1.2
638.
71,
277.
511
8.6
10.8
Non
-irrig
ated
Lan
d16
,495
0.04
460.
0892
0.00
828
0.00
075
214
431.
386
2.6
80.1
7.3
0.10
43.1
86.3
8.0
0.7
388.
277
6.4
72.1
6.5
Tota
l1,
497.
32,
994.
523
2.2
25.7
218.
043
6.0
26.1
3.8
1,27
9.3
2,55
8.6
206.
121
.9Ca
tle26
,951
0.00
440.
0217
0.00
242
0.00
042
214
25.5
125.
013
.92.
42.
512
.51.
40.
222
.911
2.5
12.5
2.2
Seep
and
Goa
t18
5,12
60.
0011
0.00
540.
0006
10.
0001
021
442
.921
4.6
24.1
4.1
4.3
21.5
2.4
0.4
38.6
193.
121
.73.
7To
tal
68.4
339.
638
.06.
56.
834
.03.
80.
761
.630
5.6
34.2
5.9
Tota
l1,
565.
73,
334.
127
0.2
32.3
224.
846
9.9
29.9
4.5
1,34
0.8
2,86
4.2
240.
327
.83,
044.
16,
675.
450
6.8
137.
556
6.6
1,78
0.6
195.
447
.52,
477.
54,
894.
731
1.5
89.9
Flam
e: L
ivin
g Sy
stem
(per
son)
, Se
war
age
Syst
em (d
isch
arge
d vo
lum
e or
per
son)
, Ind
ustry
(dis
char
ed v
olum
e (m
3/da
y)),
Land
Use
Sys
tem
(ha)
, Liv
e St
ock
(hea
d)Po
int-L
oad/
Tota
l-Loa
dIn
filtra
tion/
Run
off
Bas
ic U
nit:
Livi
ng S
yste
m (g
/per
son/
day)
, Lan
d U
se (k
g/ha
/mm
), Li
ve S
tock
( (g/
head
/day
)/mm
)Po
int/N
onPo
int
0.60
0.74
0.85
0.91
4.4
2.7
1.6
1.9
2025
/200
60.
340.
560.
560.
421.
31.
31.
21.
5A
lepp
oD
isch
arge
Loa
d in
202
5 (k
g/da
y)B
OD
CO
DT-
NT-
PB
OD
CO
DT-
NT-
PB
OD
CO
DT-
NT-
PBO
DC
OD
T-N
T-P
Poin
tSe
wer
age
Syst
em5,
823,
742
Load
Pit L
atrin
e1,
261,
858
23.9
41.3
1.5
1.3
30,1
08.5
52,0
51.6
1,91
4.8
1,67
5.6
3,01
0.9
5,20
5.2
191.
516
7.6
27,0
97.7
46,8
46.5
1,72
3.3
1,50
8.0
Tour
ist
Hot
el G
uest
2,69
432
.356
.17.
72.
687
.015
1.1
20.6
6.9
8.7
15.1
2.1
0.7
78.3
136.
018
.56.
2To
tal
30,1
95.5
52,2
02.8
1,93
5.4
1,68
2.5
3,01
9.6
5,22
0.3
193.
516
8.2
27,1
76.0
46,9
82.5
1,74
1.9
1,51
4.2
038
.066
.09.
03.
00.
00.
00.
00.
00.
00.
00.
00.
00.
00.
00.
00.
05,
823,
742
1.9
9.9
2.7
0.6
11,0
65.1
57,6
55.0
15,7
24.1
3,49
4.2
11,0
65.1
57,6
55.0
15,7
24.1
3,49
4.2
0.0
0.0
0.0
0.0
83,5
7595
.0%
85.0
%70
.0%
80.0
%3,
012.
367
,908
.52,
838.
71,
077.
23,
012.
367
,908
.52,
838.
71,
077.
20.
00.
00.
00.
0
Tota
l14
,077
.412
5,56
3.6
18,5
62.8
4,57
1.4
14,0
77.4
125,
563.
618
,562
.84,
571.
40.
00.
00.
00.
010
1,68
473
,299
.855
0,81
7.3
11,5
12.7
6,55
2.9
13,0
53.8
98,0
93.8
2,05
0.3
1,16
7.0
0.80
10,4
43.0
78,4
75.0
1,64
0.2
933.
62,
610.
819
,618
.841
0.1
233.
414
,986
9,49
7.6
39,0
05.4
628.
111
4.0
371.
03,
243.
613
2.5
26.5
0.80
296.
82,
594.
910
6.0
21.2
74.2
648.
726
.55.
3To
tal
13,4
24.8
101,
337.
42,
182.
81,
193.
510
,739
.881
,069
.91,
746.
295
4.8
2,68
5.0
20,2
67.5
436.
623
8.7
Tota
l57
,697
.727
9,10
3.7
22,6
81.0
7,44
7.4
27,8
36.8
211,
853.
820
,502
.65,
694.
529
,860
.967
,250
.02,
178.
41,
752.
9N
on-P
oint
Fore
st69
,468
0.00
570.
0115
0.00
227
0.00
006
364
398.
279
6.5
157.
14.
00.
1039
.879
.615
.70.
435
8.4
716.
814
1.4
3.6
Load
Build
ing
and
Road
78,4
520.
0773
0.15
450.
0032
70.
0014
436
46,
044.
612
,089
.225
5.6
112.
30.
301,
813.
43,
626.
876
.733
.74,
231.
28,
462.
517
8.9
78.6
Irrig
ated
Lan
d27
9,17
80.
0446
0.08
920.
0082
80.
0007
536
411
0049
,941
.999
,883
.79,
271.
784
2.2
0.10
4,99
4.2
9,98
8.4
927.
284
.244
,947
.789
,895
.48,
344.
575
7.9
Non
-irrig
ated
Lan
d64
7,99
20.
0446
0.08
920.
0082
80.
0007
536
428
,821
.357
,642
.55,
350.
748
6.0
0.10
2,88
2.1
5,76
4.3
535.
148
.625
,939
.151
,878
.34,
815.
643
7.4
Tota
l85
,206
.017
0,41
2.0
15,0
35.1
1,44
4.4
9,72
9.5
19,4
59.0
1,55
4.6
166.
975
,476
.515
0,95
2.9
13,4
80.5
1,27
7.5
Catle
99,1
730.
0044
0.02
170.
0024
20.
0004
236
415
9.4
782.
187
.215
.015
.978
.28.
71.
514
3.5
703.
978
.513
.5Se
ep a
nd G
oat
3,38
8,34
10.
0011
0.00
540.
0006
10.
0001
036
41,
336.
16,
680.
775
0.3
128.
513
3.6
668.
175
.012
.81,
202.
56,
012.
667
5.3
115.
6To
tal
1,49
5.6
7,46
2.8
837.
514
3.5
149.
674
6.3
83.8
14.4
1,34
6.0
6,71
6.5
753.
812
9.2
Tota
l86
,701
.617
7,87
4.8
15,8
72.6
1,58
7.9
9,87
9.1
20,2
05.3
1,63
8.4
181.
376
,822
.515
7,66
9.5
14,2
34.2
1,40
6.7
144,
399.
345
6,97
8.5
38,5
53.6
9,03
5.3
37,7
15.9
232,
059.
122
,140
.95,
875.
710
6,68
3.4
224,
919.
416
,412
.73,
159.
6Fl
ame:
Liv
ing
Syst
em (p
erso
n),
Sew
arag
e Sy
stem
(dis
char
ged
volu
me
or p
erso
n), I
ndus
try (d
isch
ared
vol
ume
(m3/
day)
), La
nd U
se S
yste
m (h
a), L
ive
Stoc
k (h
ead)
Poin
t-Loa
d/To
tal-L
oad
Infil
tratio
n/R
unof
fB
asic
Uni
t: Li
ving
Sys
tem
(g/p
erso
n/da
y), L
and
Use
(kg/
ha/m
m),
Live
Sto
ck( (
g/he
ad/d
ay)/m
m)
Poin
t/Non
Poin
t0.
740.
910.
930.
972.
81.
00.
70.
520
25/2
006
0.45
0.98
0.80
0.47
1.2
1.2
1.2
1.3
Infil
tratio
n Lo
ad in
202
5 (k
g/da
y)
Infil
tratio
n Lo
ad in
202
5 (k
g/da
y)
0.10
Tota
l
Indu
stry
Priv
ate
Publ
ic
Land
Use
Syst
em
Live
Stoc
kSy
stem
Sew
erag
eSy
stem
Unt
reat
ed S
ewer
age
(Pip
e La
ying
)
1.00
Seco
ndar
y Tr
eatm
ent (
Dom
estic
)Se
cond
ary
Trea
tmen
t (In
dust
ry)
Terti
ary
Trea
tmen
t
Runo
ff L
oad
in 2
025
(kg/
day)
Livi
ngSy
stem
Dom
estic
Syst
em0.
10
0.10
Tota
l
Com
partm
enta
tion
of P
ollu
tion
Load
Flam
e in
2025
Bas
ic U
nit f
or D
isch
arge
Loa
d in
202
5Pr
ecip
itatio
n(m
m)
Irrig
atio
nW
ater
(mm
)R
unof
f Rat
e
Live
Stoc
kSy
stem
Indu
stry
Priv
ate
Publ
ic
Land
Use
Syst
em
Sew
erag
eSy
stem
Unt
reat
ed S
ewer
age
(Pip
e La
ying
)
1.00
Seco
ndar
y Tr
eatm
ent (
Dom
estic
)Se
cond
ary
Trea
tmen
t (In
dust
ry)
Terti
ary
Trea
tmen
t
Runo
ff L
oad
in 2
025
(kg/
day)
Livi
ngSy
stem
Dom
estic
Syst
em0.
10
Com
partm
enta
tion
of P
ollu
tion
Load
Flam
e in
2025
Bas
ic U
nit f
or D
isch
arge
Loa
d in
202
5Pr
ecip
itatio
n(m
m)
Irrig
atio
nW
ater
(mm
)R
unof
f Rat
e
Tab
le A
8.1.
4 S
umm
ary
of D
ischa
rge
Loa
d, R
unof
f Loa
d an
d In
filtr
atio
n L
oad
in T
his S
tudy
Are
a (C
ase
3: 2
025)
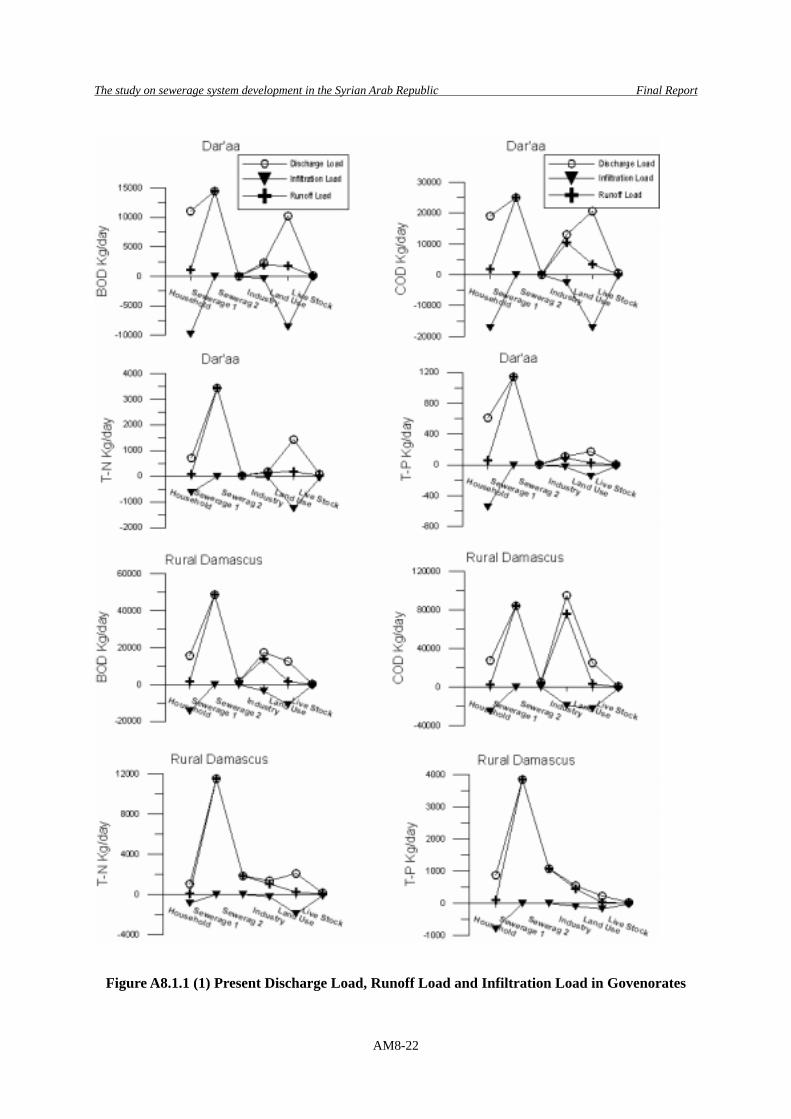
The study on sewerage system development in the Syrian Arab Republic Final Report
AM8-22
Figure A8.1.1 (1) Present Discharge Load, Runoff Load and Infiltration Load in Govenorates

The study on sewerage system development in the Syrian Arab Republic Final Report
AM8-23
Figure A8.1.1 (2) Present Discharge Load, Runoff Load and Infiltration Load in Govenorates
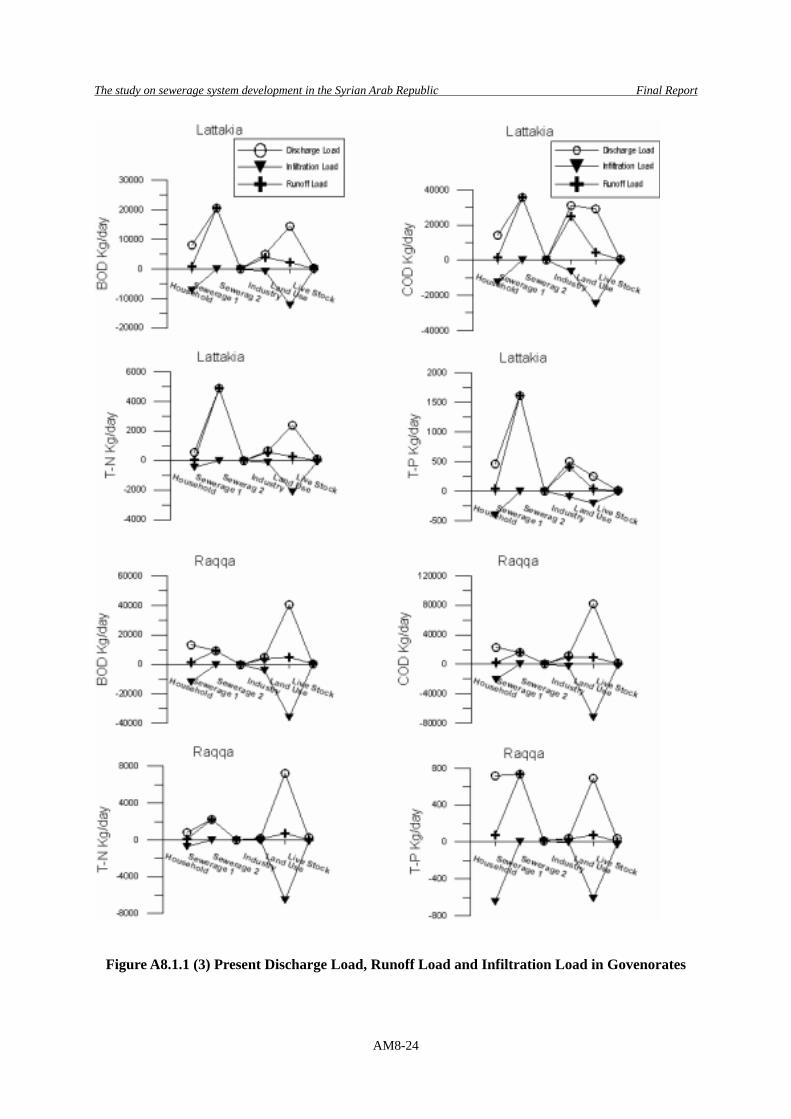
The study on sewerage system development in the Syrian Arab Republic Final Report
AM8-24
Figure A8.1.1 (3) Present Discharge Load, Runoff Load and Infiltration Load in Govenorates
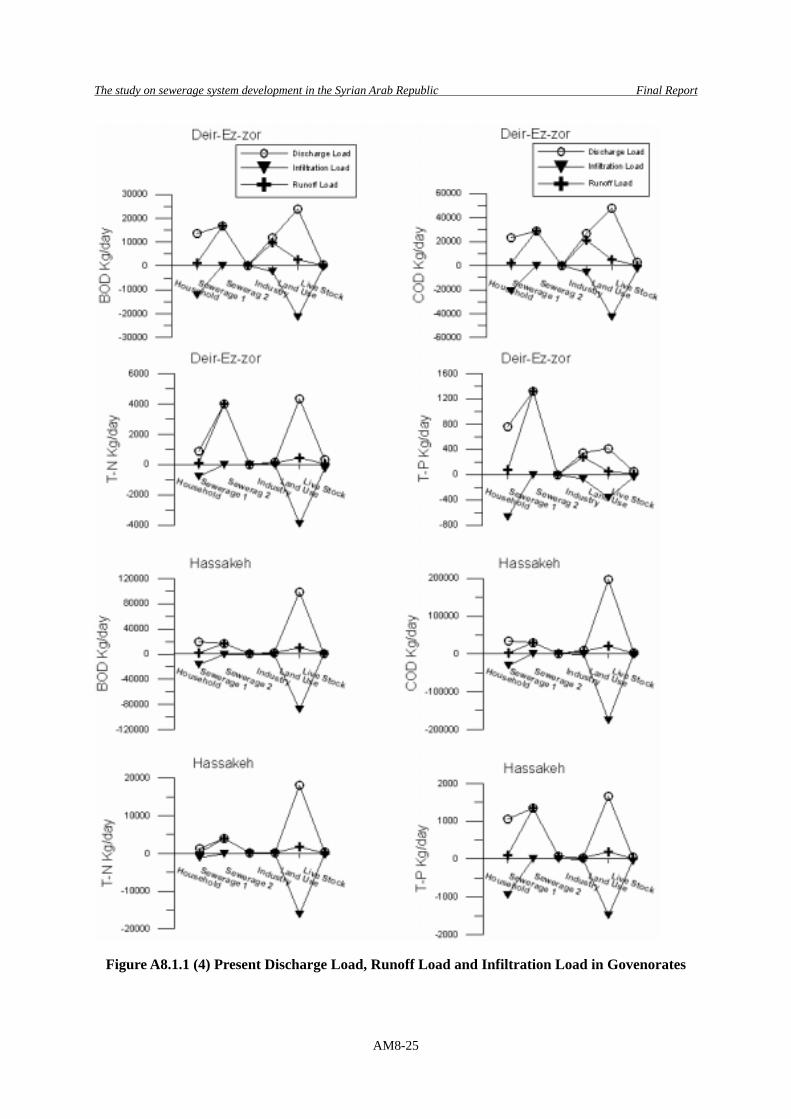
The study on sewerage system development in the Syrian Arab Republic Final Report
AM8-25
Figure A8.1.1 (4) Present Discharge Load, Runoff Load and Infiltration Load in Govenorates
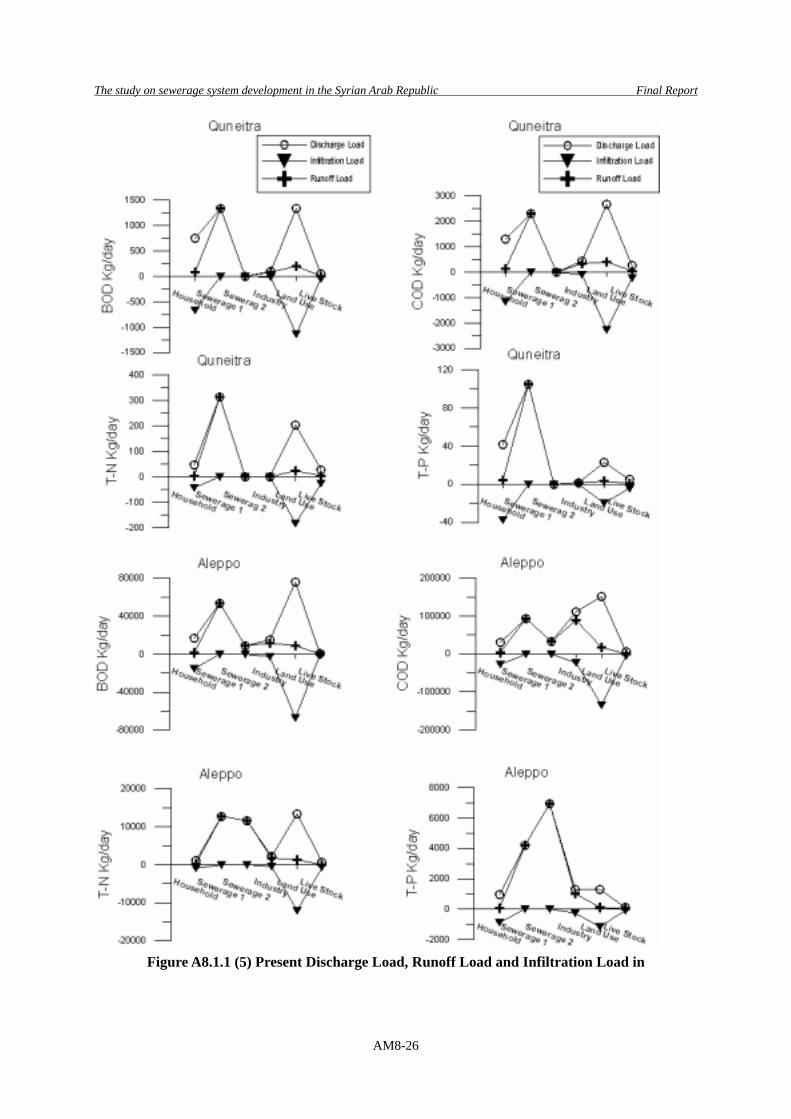
The study on sewerage system development in the Syrian Arab Republic Final Report
AM8-26
Figure A8.1.1 (5) Present Discharge Load, Runoff Load and Infiltration Load in
The study on sewerage system development in the Syrian Arab Republic Final Report
AM8-27
Appendix 8.2 Water Quality Analysis Survey for Industrial Wastewater
The water quality analysis survey for industrial wastewater is planned to obtain reference data for characteristics of industrial wastewater and consideration of treatment process. The contents of water quality survey for industrial wastewater and results of survey are as follows. 8.2.1 Contents of survey
The survey consists of water quality analysis of industrial wastewater for characteristics of water quality and questionnaire survey about the outline of objective factories. (A) Contents of survey and method
(1) Water quality analysis of industrial wastewater Number of sample for the water quality analysis is shown as below. Details of number of sample and water quality item are shown in Table 8.2.1 and Table 8.2.2 Items Objective number Total number of sample 61 samples Number of analysis items 25 items
(Number of analysis items is determined according to the type of industry.)
Number of samples by type of factory Olive Pressing Factory 8 samples Food Factory 13 samples Others 40 samples (2) Questionnaire survey of factory Items of the questionnaire survey are itemized as below:
・ Basic information ・ Production activity ・ Water consumption and raw materials ・ Information of wastewater ・ Wastewater treatment and requirement of facilities
The objective factories of questionnaire survey are same as the objective factories for water quality analysis. (B) Selection of factory (Type of industry)
The objective factory in this survey is selected from the following points of view, and the final decision of objective factories followed suggestion from Ministry of Housing and Construction. Details of number of samples by type of industry are shown in Table1.3.
• The factory (or type of industry), which may have large influence on the water quality environment of water bodies and ground water.
• The factory (or type of industry), which may have influence on treatment process and the facilities of sewerage system.
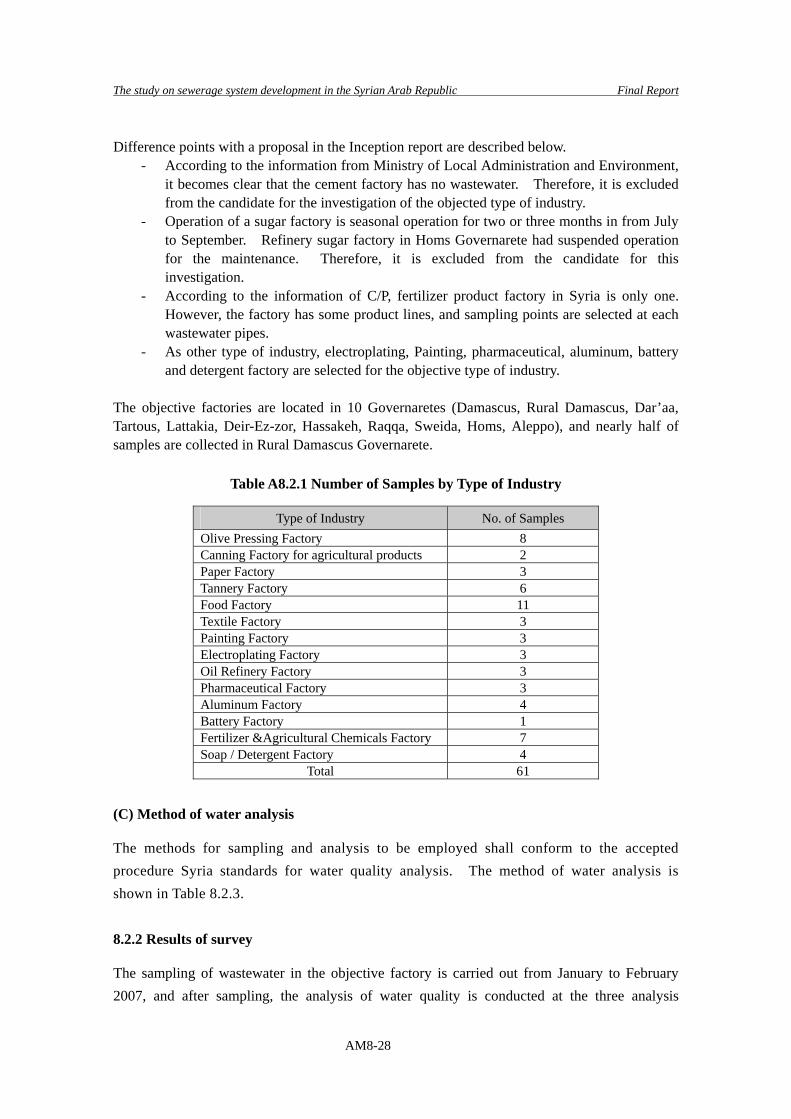
The study on sewerage system development in the Syrian Arab Republic Final Report
AM8-28
Difference points with a proposal in the Inception report are described below.
- According to the information from Ministry of Local Administration and Environment, it becomes clear that the cement factory has no wastewater. Therefore, it is excluded from the candidate for the investigation of the objected type of industry.
- Operation of a sugar factory is seasonal operation for two or three months in from July to September. Refinery sugar factory in Homs Governarete had suspended operation for the maintenance. Therefore, it is excluded from the candidate for this investigation.
- According to the information of C/P, fertilizer product factory in Syria is only one. However, the factory has some product lines, and sampling points are selected at each wastewater pipes.
- As other type of industry, electroplating, Painting, pharmaceutical, aluminum, battery and detergent factory are selected for the objective type of industry.
The objective factories are located in 10 Governaretes (Damascus, Rural Damascus, Dar’aa, Tartous, Lattakia, Deir-Ez-zor, Hassakeh, Raqqa, Sweida, Homs, Aleppo), and nearly half of samples are collected in Rural Damascus Governarete.
Table A8.2.1 Number of Samples by Type of Industry
Type of Industry No. of Samples Olive Pressing Factory 8 Canning Factory for agricultural products 2 Paper Factory 3 Tannery Factory 6 Food Factory 11 Textile Factory 3 Painting Factory 3 Electroplating Factory 3 Oil Refinery Factory 3 Pharmaceutical Factory 3 Aluminum Factory 4 Battery Factory 1 Fertilizer &Agricultural Chemicals Factory 7 Soap / Detergent Factory 4
Total 61 (C) Method of water analysis
The methods for sampling and analysis to be employed shall conform to the accepted procedure Syria standards for water quality analysis. The method of water analysis is shown in Table 8.2.3. 8.2.2 Results of survey
The sampling of wastewater in the objective factory is carried out from January to February 2007, and after sampling, the analysis of water quality is conducted at the three analysis
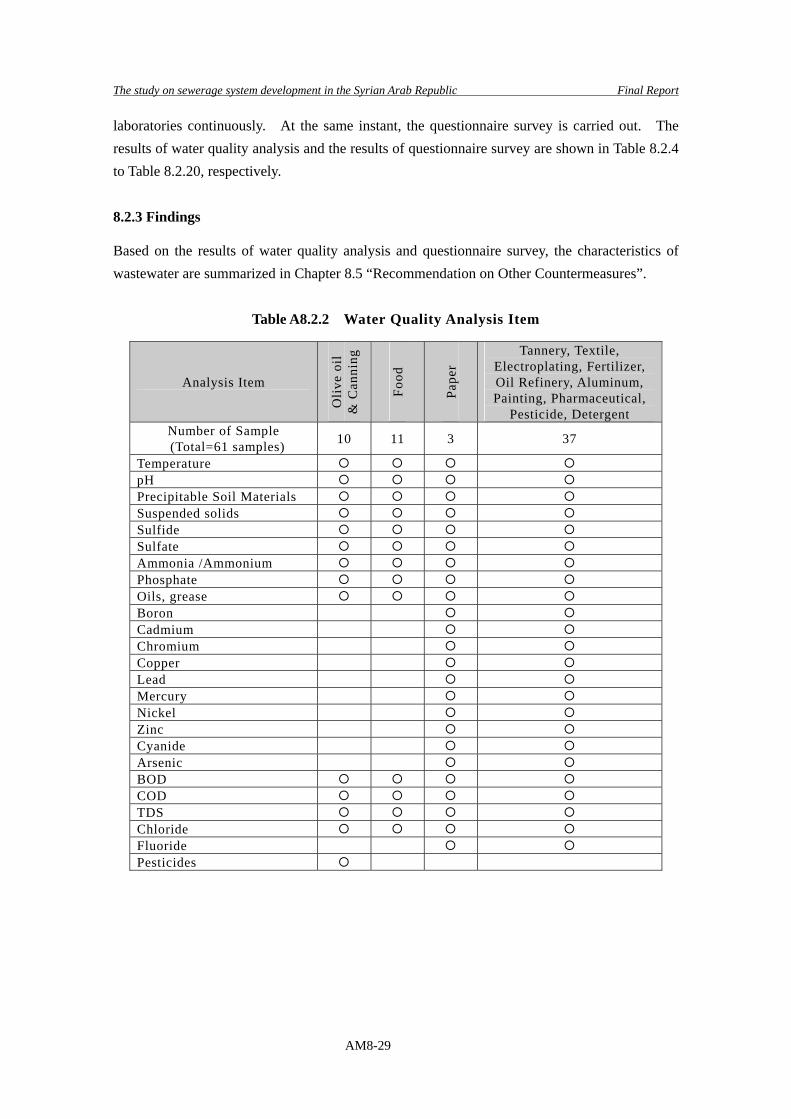
The study on sewerage system development in the Syrian Arab Republic Final Report
AM8-29
laboratories continuously. At the same instant, the questionnaire survey is carried out. The results of water quality analysis and the results of questionnaire survey are shown in Table 8.2.4 to Table 8.2.20, respectively. 8.2.3 Findings
Based on the results of water quality analysis and questionnaire survey, the characteristics of wastewater are summarized in Chapter 8.5 “Recommendation on Other Countermeasures”.
Table A8.2.2 Water Quality Analysis Item
Analysis Item
Oliv
e oi
l
& C
anni
ng
Food
Pape
r Tannery, Textile,
Electroplating, Fertilizer, Oil Refinery, Aluminum, Painting, Pharmaceutical,
Pesticide, Detergent Number of Sample
(Total=61 samples) 10 11 3 37
Temperature pH Precipitable Soil Materials Suspended solids Sulfide Sulfate Ammonia /Ammonium Phosphate Oils, grease Boron Cadmium Chromium Copper Lead Mercury Nickel Zinc Cyanide Arsenic BOD COD TDS Chloride Fluoride Pesticides
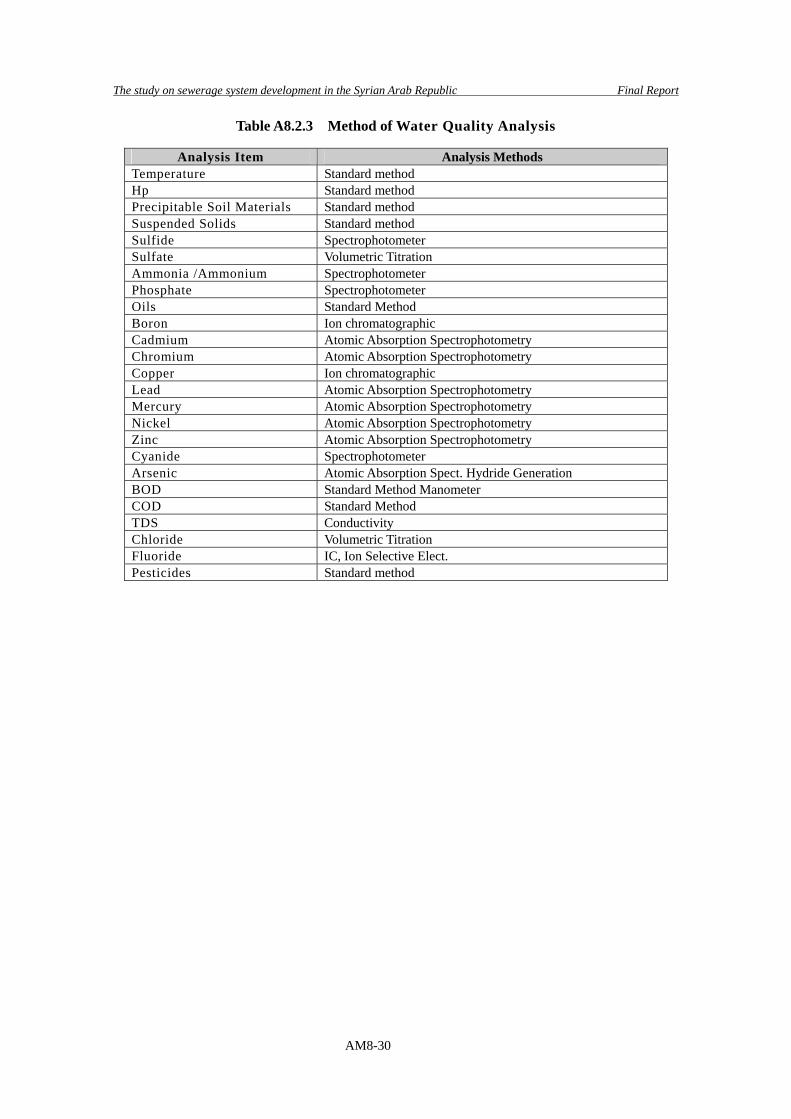
The study on sewerage system development in the Syrian Arab Republic Final Report
AM8-30
Table A8.2.3 Method of Water Quality Analysis
Analysis Item Analysis Methods Temperature Standard method Hp Standard method Precipitable Soil Materials Standard method Suspended Solids Standard method Sulfide Spectrophotometer Sulfate Volumetric Titration Ammonia /Ammonium Spectrophotometer Phosphate Spectrophotometer Oils Standard Method Boron Ion chromatographic Cadmium Atomic Absorption Spectrophotometry Chromium Atomic Absorption Spectrophotometry Copper Ion chromatographic Lead Atomic Absorption Spectrophotometry Mercury Atomic Absorption Spectrophotometry Nickel Atomic Absorption Spectrophotometry Zinc Atomic Absorption Spectrophotometry Cyanide Spectrophotometer Arsenic Atomic Absorption Spect. Hydride Generation BOD Standard Method Manometer COD Standard Method TDS Conductivity Chloride Volumetric Titration Fluoride IC, Ion Selective Elect. Pesticides Standard method
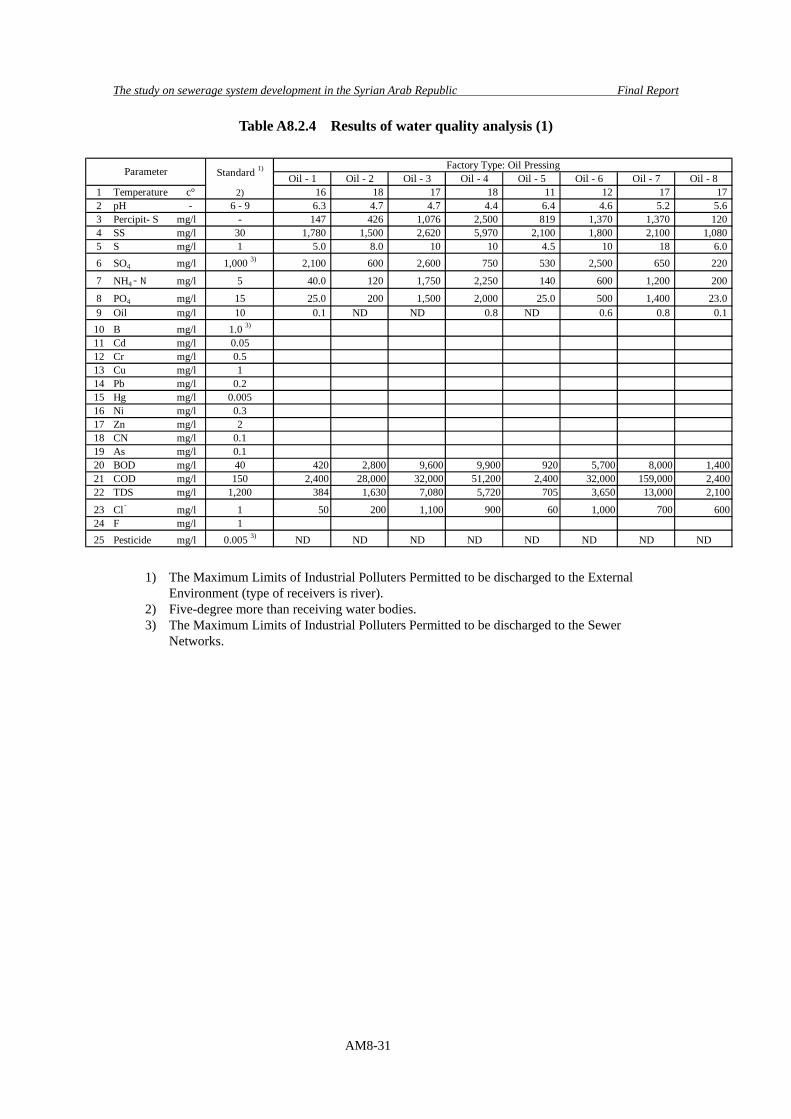
The study on sewerage system development in the Syrian Arab Republic Final Report
AM8-31
Table A8.2.4 Results of water quality analysis (1)
Oil - 1 Oil - 2 Oil - 3 Oil - 4 Oil - 5 Oil - 6 Oil - 7 Oil - 81 Temperature c° 2) 16 18 17 18 11 12 17 172 pH - 6 - 9 6.3 4.7 4.7 4.4 6.4 4.6 5.2 5.63 Percipit- S mg/l - 147 426 1,076 2,500 819 1,370 1,370 1204 SS mg/l 30 1,780 1,500 2,620 5,970 2,100 1,800 2,100 1,0805 S mg/l 1 5.0 8.0 10 10 4.5 10 18 6.06 SO4 mg/l 1,000 3) 2,100 600 2,600 750 530 2,500 650 220
7 NH4-N mg/l 5 40.0 120 1,750 2,250 140 600 1,200 200
8 PO4 mg/l 15 25.0 200 1,500 2,000 25.0 500 1,400 23.09 Oil mg/l 10 0.1 ND ND 0.8 ND 0.6 0.8 0.110 B mg/l 1.0 3)
11 Cd mg/l 0.0512 Cr mg/l 0.513 Cu mg/l 114 Pb mg/l 0.215 Hg mg/l 0.00516 Ni mg/l 0.317 Zn mg/l 218 CN mg/l 0.119 As mg/l 0.120 BOD mg/l 40 420 2,800 9,600 9,900 920 5,700 8,000 1,40021 COD mg/l 150 2,400 28,000 32,000 51,200 2,400 32,000 159,000 2,40022 TDS mg/l 1,200 384 1,630 7,080 5,720 705 3,650 13,000 2,100
23 Cl- mg/l 1 50 200 1,100 900 60 1,000 700 60024 F mg/l 125 Pesticide mg/l 0.005 3) ND ND ND ND ND ND ND ND
Factory Type: Oil PressingStandard 1)Parameter
1) The Maximum Limits of Industrial Polluters Permitted to be discharged to the External Environment (type of receivers is river).
2) Five-degree more than receiving water bodies. 3) The Maximum Limits of Industrial Polluters Permitted to be discharged to the Sewer
Networks.
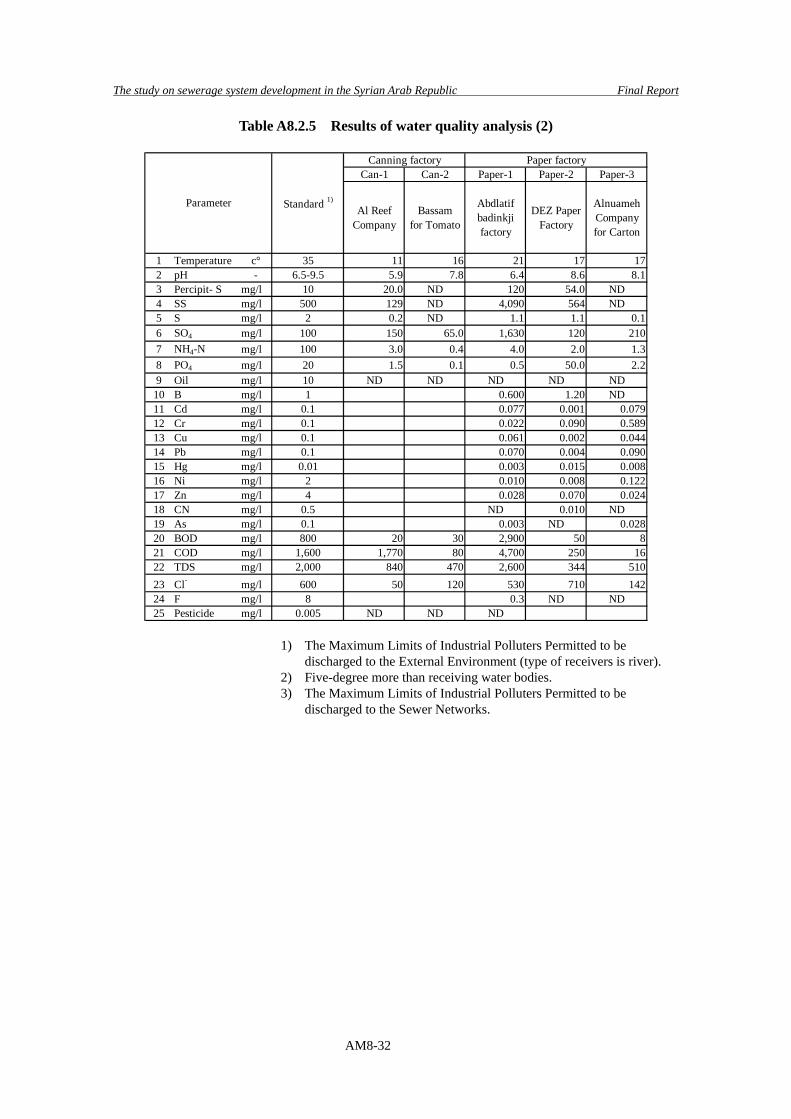
The study on sewerage system development in the Syrian Arab Republic Final Report
AM8-32
Table A8.2.5 Results of water quality analysis (2)
Can-1 Can-2 Paper-1 Paper-2 Paper-3
Al ReefCompany
Bassamfor Tomato
Abdlatifbadinkjifactory
DEZ PaperFactory
AlnuamehCompanyfor Carton
1 Temperature c° 35 11 16 21 17 172 pH - 6.5-9.5 5.9 7.8 6.4 8.6 8.13 Percipit- S mg/l 10 20.0 ND 120 54.0 ND4 SS mg/l 500 129 ND 4,090 564 ND5 S mg/l 2 0.2 ND 1.1 1.1 0.16 SO4 mg/l 100 150 65.0 1,630 120 2107 NH4-N mg/l 100 3.0 0.4 4.0 2.0 1.38 PO4 mg/l 20 1.5 0.1 0.5 50.0 2.29 Oil mg/l 10 ND ND ND ND ND10 B mg/l 1 0.600 1.20 ND11 Cd mg/l 0.1 0.077 0.001 0.07912 Cr mg/l 0.1 0.022 0.090 0.58913 Cu mg/l 0.1 0.061 0.002 0.04414 Pb mg/l 0.1 0.070 0.004 0.09015 Hg mg/l 0.01 0.003 0.015 0.00816 Ni mg/l 2 0.010 0.008 0.12217 Zn mg/l 4 0.028 0.070 0.02418 CN mg/l 0.5 ND 0.010 ND19 As mg/l 0.1 0.003 ND 0.02820 BOD mg/l 800 20 30 2,900 50 821 COD mg/l 1,600 1,770 80 4,700 250 1622 TDS mg/l 2,000 840 470 2,600 344 51023 Cl- mg/l 600 50 120 530 710 14224 F mg/l 8 0.3 ND ND25 Pesticide mg/l 0.005 ND ND ND
Standard 1)Parameter
Canning factory Paper factory
1) The Maximum Limits of Industrial Polluters Permitted to be discharged to the External Environment (type of receivers is river).
2) Five-degree more than receiving water bodies. 3) The Maximum Limits of Industrial Polluters Permitted to be
discharged to the Sewer Networks.
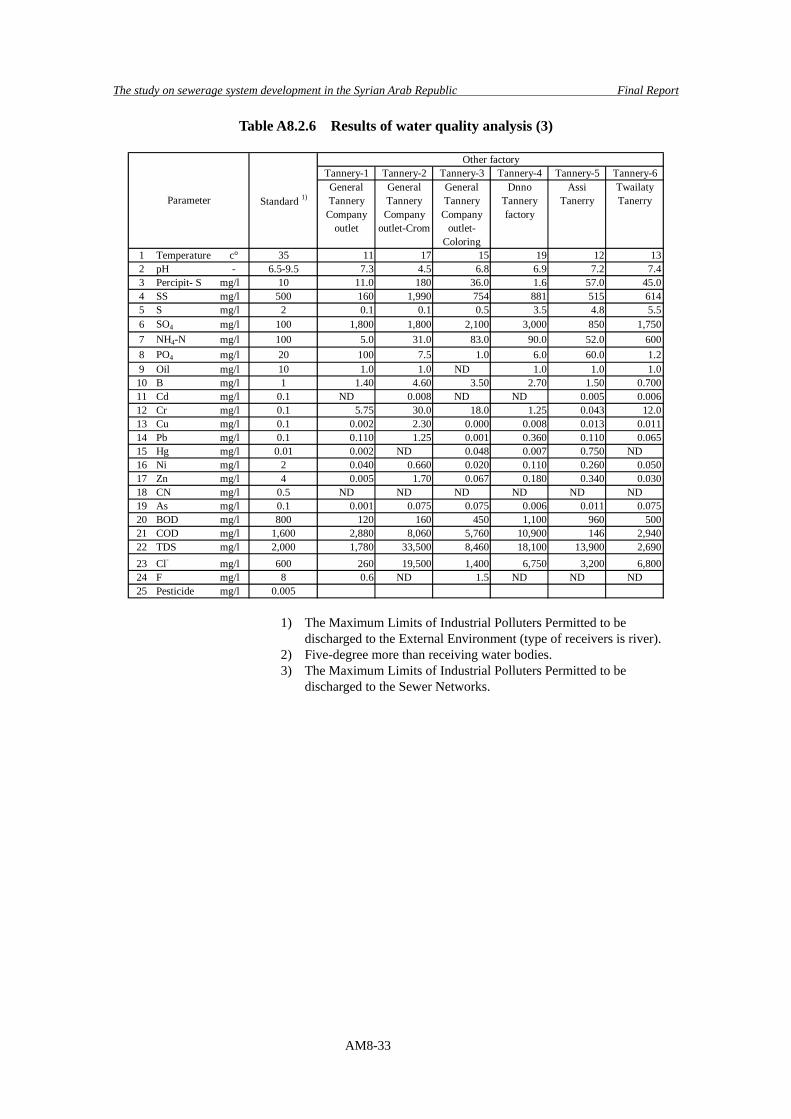
The study on sewerage system development in the Syrian Arab Republic Final Report
AM8-33
Table A8.2.6 Results of water quality analysis (3)
Tannery-1 Tannery-2 Tannery-3 Tannery-4 Tannery-5 Tannery-6GeneralTannery
Companyoutlet
GeneralTanneryCompany
outlet-Crom
GeneralTannery
Companyoutlet-
Coloring
DnnoTanneryfactory
AssiTanerry
TwailatyTanerry
1 Temperature c° 35 11 17 15 19 12 132 pH - 6.5-9.5 7.3 4.5 6.8 6.9 7.2 7.43 Percipit- S mg/l 10 11.0 180 36.0 1.6 57.0 45.04 SS mg/l 500 160 1,990 754 881 515 6145 S mg/l 2 0.1 0.1 0.5 3.5 4.8 5.56 SO4 mg/l 100 1,800 1,800 2,100 3,000 850 1,7507 NH4-N mg/l 100 5.0 31.0 83.0 90.0 52.0 6008 PO4 mg/l 20 100 7.5 1.0 6.0 60.0 1.29 Oil mg/l 10 1.0 1.0 ND 1.0 1.0 1.010 B mg/l 1 1.40 4.60 3.50 2.70 1.50 0.70011 Cd mg/l 0.1 ND 0.008 ND ND 0.005 0.00612 Cr mg/l 0.1 5.75 30.0 18.0 1.25 0.043 12.013 Cu mg/l 0.1 0.002 2.30 0.000 0.008 0.013 0.01114 Pb mg/l 0.1 0.110 1.25 0.001 0.360 0.110 0.06515 Hg mg/l 0.01 0.002 ND 0.048 0.007 0.750 ND16 Ni mg/l 2 0.040 0.660 0.020 0.110 0.260 0.05017 Zn mg/l 4 0.005 1.70 0.067 0.180 0.340 0.03018 CN mg/l 0.5 ND ND ND ND ND ND19 As mg/l 0.1 0.001 0.075 0.075 0.006 0.011 0.07520 BOD mg/l 800 120 160 450 1,100 960 50021 COD mg/l 1,600 2,880 8,060 5,760 10,900 146 2,94022 TDS mg/l 2,000 1,780 33,500 8,460 18,100 13,900 2,69023 Cl- mg/l 600 260 19,500 1,400 6,750 3,200 6,80024 F mg/l 8 0.6 ND 1.5 ND ND ND25 Pesticide mg/l 0.005
Other factory
Standard 1)Parameter
1) The Maximum Limits of Industrial Polluters Permitted to be discharged to the External Environment (type of receivers is river).
2) Five-degree more than receiving water bodies. 3) The Maximum Limits of Industrial Polluters Permitted to be
discharged to the Sewer Networks.
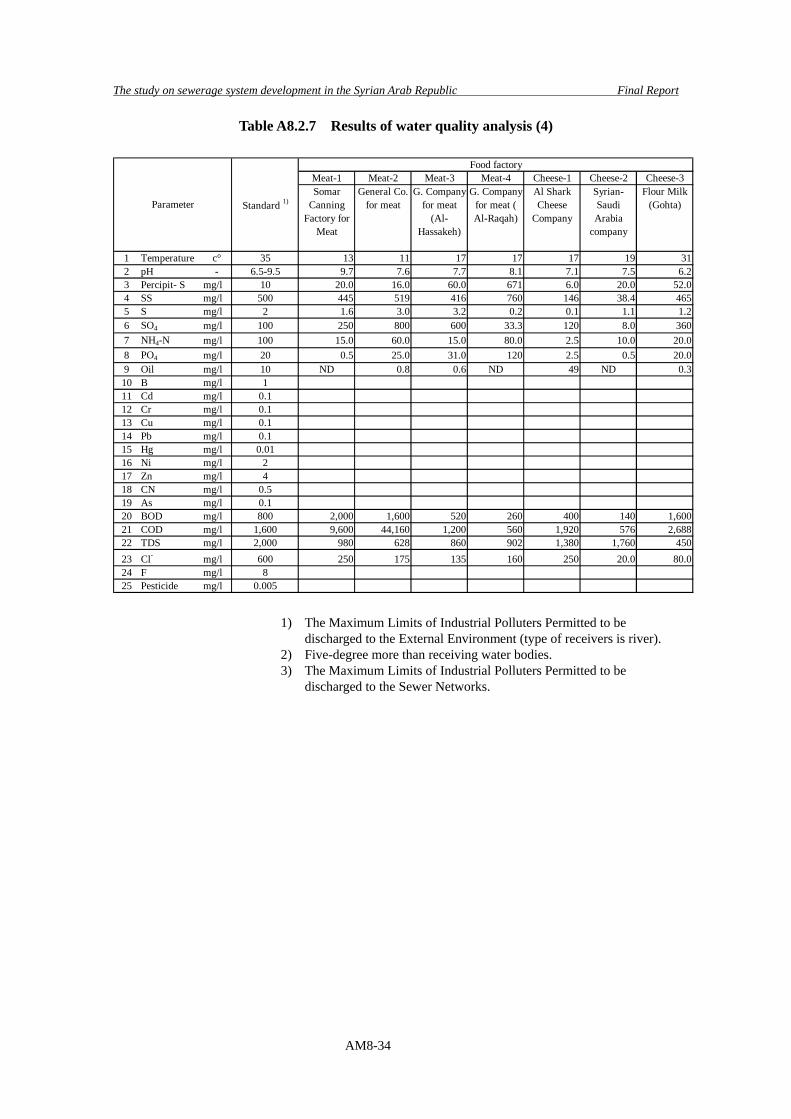
The study on sewerage system development in the Syrian Arab Republic Final Report
AM8-34
Table A8.2.7 Results of water quality analysis (4)
Meat-1 Meat-2 Meat-3 Meat-4 Cheese-1 Cheese-2 Cheese-3Somar
CanningFactory for
Meat
General Co.for meat
G. Companyfor meat
(Al-Hassakeh)
G. Companyfor meat (Al-Raqah)
Al SharkCheese
Company
Syrian-SaudiArabia
company
Flour Milk(Gohta)
1 Temperature c° 35 13 11 17 17 17 19 312 pH - 6.5-9.5 9.7 7.6 7.7 8.1 7.1 7.5 6.23 Percipit- S mg/l 10 20.0 16.0 60.0 671 6.0 20.0 52.04 SS mg/l 500 445 519 416 760 146 38.4 4655 S mg/l 2 1.6 3.0 3.2 0.2 0.1 1.1 1.26 SO4 mg/l 100 250 800 600 33.3 120 8.0 3607 NH4-N mg/l 100 15.0 60.0 15.0 80.0 2.5 10.0 20.08 PO4 mg/l 20 0.5 25.0 31.0 120 2.5 0.5 20.09 Oil mg/l 10 ND 0.8 0.6 ND 49 ND 0.310 B mg/l 111 Cd mg/l 0.112 Cr mg/l 0.113 Cu mg/l 0.114 Pb mg/l 0.115 Hg mg/l 0.0116 Ni mg/l 217 Zn mg/l 418 CN mg/l 0.519 As mg/l 0.120 BOD mg/l 800 2,000 1,600 520 260 400 140 1,60021 COD mg/l 1,600 9,600 44,160 1,200 560 1,920 576 2,68822 TDS mg/l 2,000 980 628 860 902 1,380 1,760 45023 Cl- mg/l 600 250 175 135 160 250 20.0 80.024 F mg/l 825 Pesticide mg/l 0.005
Standard 1)Parameter
Food factory
1) The Maximum Limits of Industrial Polluters Permitted to be discharged to the External Environment (type of receivers is river).
2) Five-degree more than receiving water bodies. 3) The Maximum Limits of Industrial Polluters Permitted to be
discharged to the Sewer Networks.
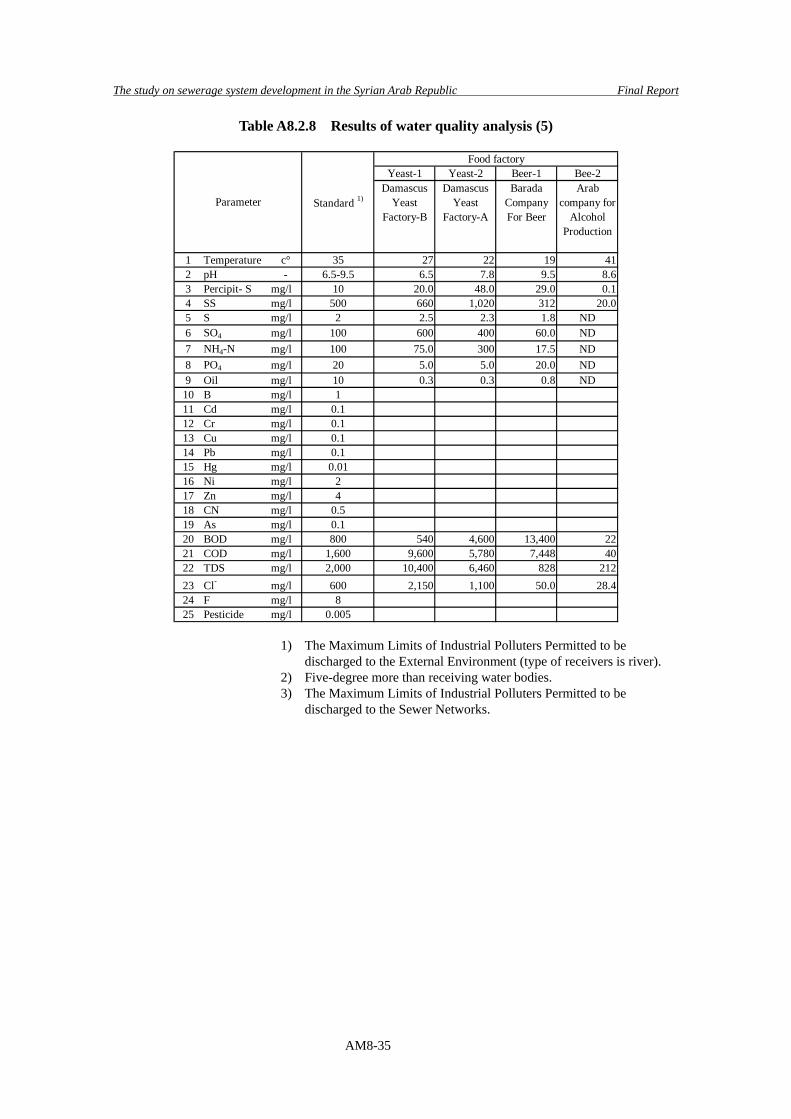
The study on sewerage system development in the Syrian Arab Republic Final Report
AM8-35
Table A8.2.8 Results of water quality analysis (5)
Yeast-1 Yeast-2 Beer-1 Bee-2Damascus
YeastFactory-B
DamascusYeast
Factory-A
BaradaCompanyFor Beer
Arabcompany for
AlcoholProduction
1 Temperature c° 35 27 22 19 412 pH - 6.5-9.5 6.5 7.8 9.5 8.63 Percipit- S mg/l 10 20.0 48.0 29.0 0.14 SS mg/l 500 660 1,020 312 20.05 S mg/l 2 2.5 2.3 1.8 ND6 SO4 mg/l 100 600 400 60.0 ND7 NH4-N mg/l 100 75.0 300 17.5 ND8 PO4 mg/l 20 5.0 5.0 20.0 ND9 Oil mg/l 10 0.3 0.3 0.8 ND10 B mg/l 111 Cd mg/l 0.112 Cr mg/l 0.113 Cu mg/l 0.114 Pb mg/l 0.115 Hg mg/l 0.0116 Ni mg/l 217 Zn mg/l 418 CN mg/l 0.519 As mg/l 0.120 BOD mg/l 800 540 4,600 13,400 2221 COD mg/l 1,600 9,600 5,780 7,448 4022 TDS mg/l 2,000 10,400 6,460 828 21223 Cl- mg/l 600 2,150 1,100 50.0 28.424 F mg/l 825 Pesticide mg/l 0.005
Standard 1)Parameter
Food factory
1) The Maximum Limits of Industrial Polluters Permitted to be discharged to the External Environment (type of receivers is river).
2) Five-degree more than receiving water bodies. 3) The Maximum Limits of Industrial Polluters Permitted to be
discharged to the Sewer Networks.
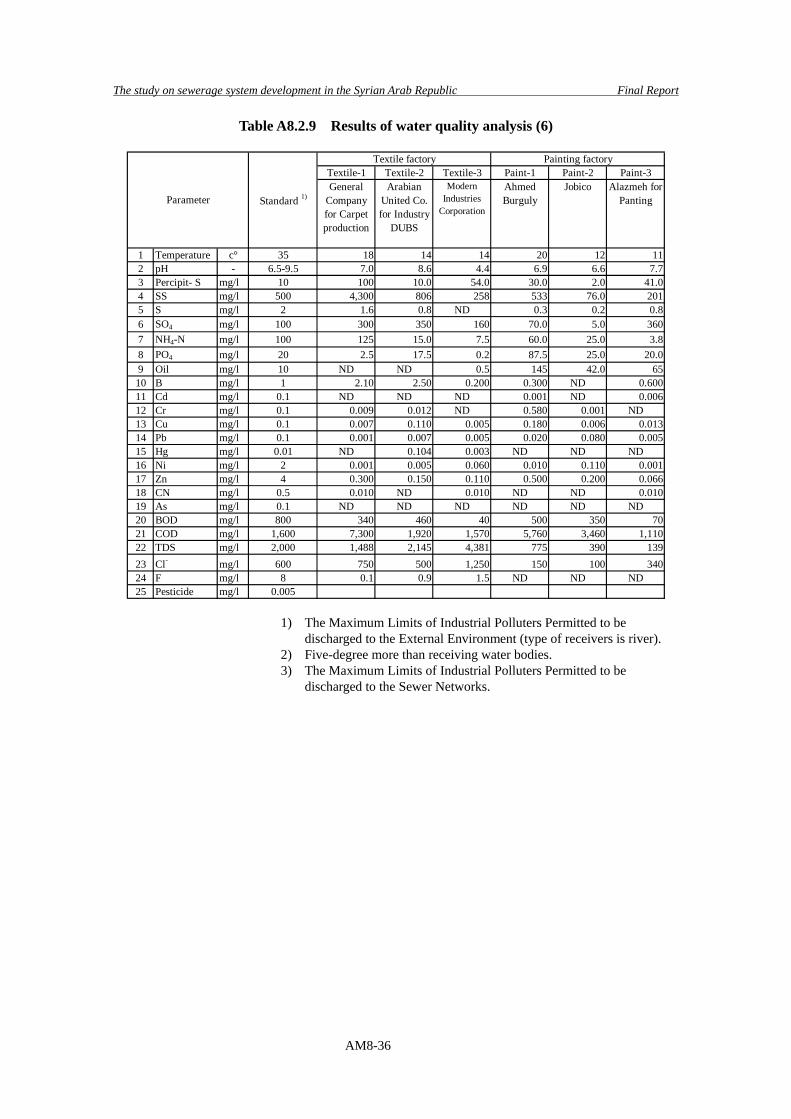
The study on sewerage system development in the Syrian Arab Republic Final Report
AM8-36
Table A8.2.9 Results of water quality analysis (6)
Textile-1 Textile-2 Textile-3 Paint-1 Paint-2 Paint-3General
Companyfor Carpetproduction
ArabianUnited Co.for Industry
DUBS
ModernIndustries
Corporation
AhmedBurguly
Jobico Alazmeh forPanting
1 Temperature c° 35 18 14 14 20 12 112 pH - 6.5-9.5 7.0 8.6 4.4 6.9 6.6 7.73 Percipit- S mg/l 10 100 10.0 54.0 30.0 2.0 41.04 SS mg/l 500 4,300 806 258 533 76.0 2015 S mg/l 2 1.6 0.8 ND 0.3 0.2 0.86 SO4 mg/l 100 300 350 160 70.0 5.0 3607 NH4-N mg/l 100 125 15.0 7.5 60.0 25.0 3.88 PO4 mg/l 20 2.5 17.5 0.2 87.5 25.0 20.09 Oil mg/l 10 ND ND 0.5 145 42.0 6510 B mg/l 1 2.10 2.50 0.200 0.300 ND 0.60011 Cd mg/l 0.1 ND ND ND 0.001 ND 0.00612 Cr mg/l 0.1 0.009 0.012 ND 0.580 0.001 ND13 Cu mg/l 0.1 0.007 0.110 0.005 0.180 0.006 0.01314 Pb mg/l 0.1 0.001 0.007 0.005 0.020 0.080 0.00515 Hg mg/l 0.01 ND 0.104 0.003 ND ND ND16 Ni mg/l 2 0.001 0.005 0.060 0.010 0.110 0.00117 Zn mg/l 4 0.300 0.150 0.110 0.500 0.200 0.06618 CN mg/l 0.5 0.010 ND 0.010 ND ND 0.01019 As mg/l 0.1 ND ND ND ND ND ND20 BOD mg/l 800 340 460 40 500 350 7021 COD mg/l 1,600 7,300 1,920 1,570 5,760 3,460 1,11022 TDS mg/l 2,000 1,488 2,145 4,381 775 390 13923 Cl- mg/l 600 750 500 1,250 150 100 34024 F mg/l 8 0.1 0.9 1.5 ND ND ND25 Pesticide mg/l 0.005
Standard 1)Parameter
Textile factory Painting factory
1) The Maximum Limits of Industrial Polluters Permitted to be discharged to the External Environment (type of receivers is river).
2) Five-degree more than receiving water bodies. 3) The Maximum Limits of Industrial Polluters Permitted to be
discharged to the Sewer Networks.
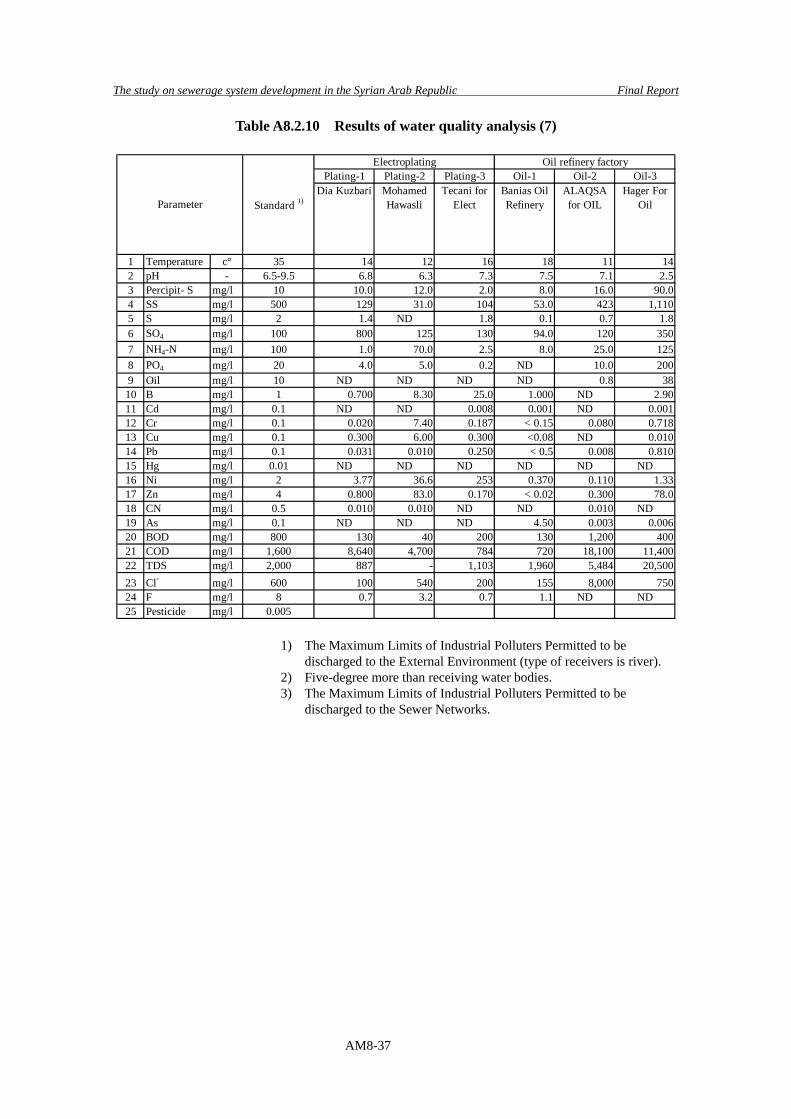
The study on sewerage system development in the Syrian Arab Republic Final Report
AM8-37
Table A8.2.10 Results of water quality analysis (7)
Plating-1 Plating-2 Plating-3 Oil-1 Oil-2 Oil-3Dia Kuzbari Mohamed
HawasliTecani for
ElectBanias OilRefinery
ALAQSAfor OIL
Hager ForOil
1 Temperature c° 35 14 12 16 18 11 142 pH - 6.5-9.5 6.8 6.3 7.3 7.5 7.1 2.53 Percipit- S mg/l 10 10.0 12.0 2.0 8.0 16.0 90.04 SS mg/l 500 129 31.0 104 53.0 423 1,1105 S mg/l 2 1.4 ND 1.8 0.1 0.7 1.86 SO4 mg/l 100 800 125 130 94.0 120 3507 NH4-N mg/l 100 1.0 70.0 2.5 8.0 25.0 1258 PO4 mg/l 20 4.0 5.0 0.2 ND 10.0 2009 Oil mg/l 10 ND ND ND ND 0.8 3810 B mg/l 1 0.700 8.30 25.0 1.000 ND 2.9011 Cd mg/l 0.1 ND ND 0.008 0.001 ND 0.00112 Cr mg/l 0.1 0.020 7.40 0.187 < 0.15 0.080 0.71813 Cu mg/l 0.1 0.300 6.00 0.300 <0.08 ND 0.01014 Pb mg/l 0.1 0.031 0.010 0.250 < 0.5 0.008 0.81015 Hg mg/l 0.01 ND ND ND ND ND ND16 Ni mg/l 2 3.77 36.6 253 0.370 0.110 1.3317 Zn mg/l 4 0.800 83.0 0.170 < 0.02 0.300 78.018 CN mg/l 0.5 0.010 0.010 ND ND 0.010 ND19 As mg/l 0.1 ND ND ND 4.50 0.003 0.00620 BOD mg/l 800 130 40 200 130 1,200 40021 COD mg/l 1,600 8,640 4,700 784 720 18,100 11,40022 TDS mg/l 2,000 887 - 1,103 1,960 5,484 20,50023 Cl- mg/l 600 100 540 200 155 8,000 75024 F mg/l 8 0.7 3.2 0.7 1.1 ND ND25 Pesticide mg/l 0.005
Electroplating Oil refinery factory
Standard 1)Parameter
1) The Maximum Limits of Industrial Polluters Permitted to be discharged to the External Environment (type of receivers is river).
2) Five-degree more than receiving water bodies. 3) The Maximum Limits of Industrial Polluters Permitted to be
discharged to the Sewer Networks.
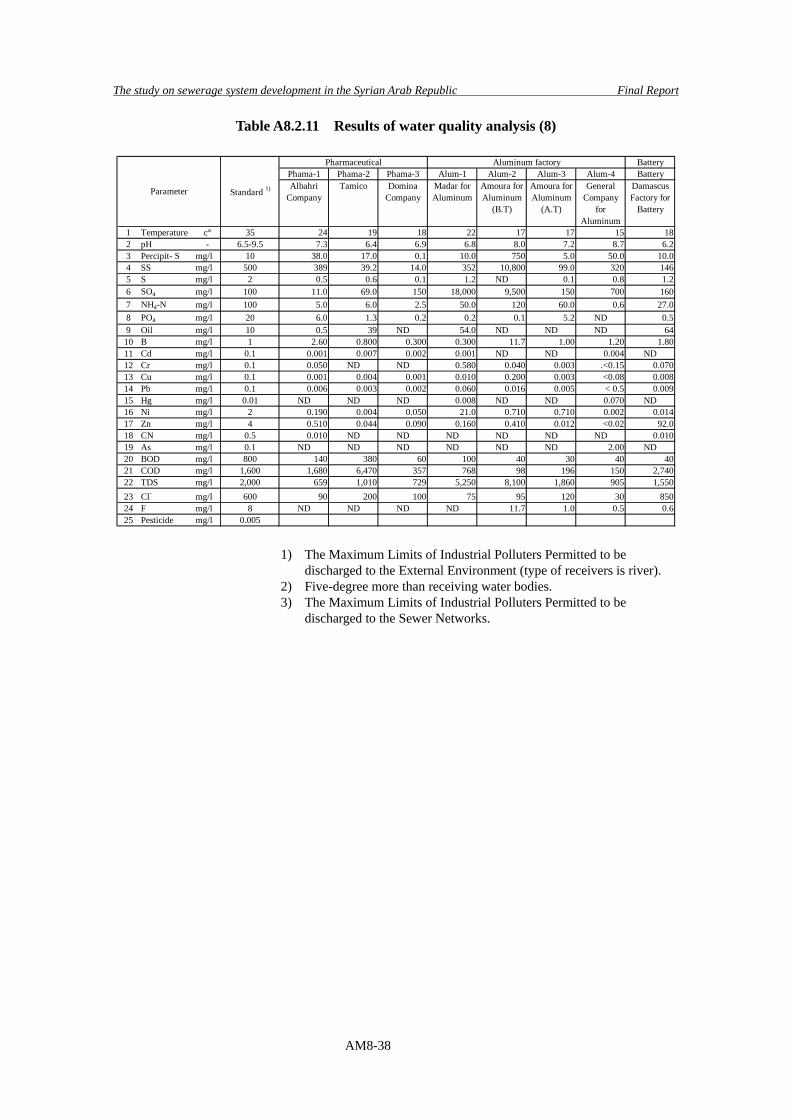
The study on sewerage system development in the Syrian Arab Republic Final Report
AM8-38
Table A8.2.11 Results of water quality analysis (8)
BatteryPhama-1 Phama-2 Phama-3 Alum-1 Alum-2 Alum-3 Alum-4 BatteryAlbahri
CompanyTamico Domina
CompanyMadar forAluminum
Amoura forAluminum
(B.T)
Amoura forAluminum
(A.T)
GeneralCompany
forAluminum
DamascusFactory for
Battery
1 Temperature c° 35 24 19 18 22 17 17 15 182 pH - 6.5-9.5 7.3 6.4 6.9 6.8 8.0 7.2 8.7 6.23 Percipit- S mg/l 10 38.0 17.0 0.1 10.0 750 5.0 50.0 10.04 SS mg/l 500 389 39.2 14.0 352 10,800 99.0 320 1465 S mg/l 2 0.5 0.6 0.1 1.2 ND 0.1 0.8 1.26 SO4 mg/l 100 11.0 69.0 150 18,000 9,500 150 700 1607 NH4-N mg/l 100 5.0 6.0 2.5 50.0 120 60.0 0.6 27.08 PO4 mg/l 20 6.0 1.3 0.2 0.2 0.1 5.2 ND 0.59 Oil mg/l 10 0.5 39 ND 54.0 ND ND ND 6410 B mg/l 1 2.60 0.800 0.300 0.300 11.7 1.00 1.20 1.8011 Cd mg/l 0.1 0.001 0.007 0.002 0.001 ND ND 0.004 ND12 Cr mg/l 0.1 0.050 ND ND 0.580 0.040 0.003 .<0.15 0.07013 Cu mg/l 0.1 0.001 0.004 0.001 0.010 0.200 0.003 <0.08 0.00814 Pb mg/l 0.1 0.006 0.003 0.002 0.060 0.016 0.005 < 0.5 0.00915 Hg mg/l 0.01 ND ND ND 0.008 ND ND 0.070 ND16 Ni mg/l 2 0.190 0.004 0.050 21.0 0.710 0.710 0.002 0.01417 Zn mg/l 4 0.510 0.044 0.090 0.160 0.410 0.012 <0.02 92.018 CN mg/l 0.5 0.010 ND ND ND ND ND ND 0.01019 As mg/l 0.1 ND ND ND ND ND ND 2.00 ND20 BOD mg/l 800 140 380 60 100 40 30 40 4021 COD mg/l 1,600 1,680 6,470 357 768 98 196 150 2,74022 TDS mg/l 2,000 659 1,010 729 5,250 8,100 1,860 905 1,55023 Cl- mg/l 600 90 200 100 75 95 120 30 85024 F mg/l 8 ND ND ND ND 11.7 1.0 0.5 0.625 Pesticide mg/l 0.005
Standard 1)Parameter
Pharmaceutical Aluminum factory
1) The Maximum Limits of Industrial Polluters Permitted to be discharged to the External Environment (type of receivers is river).
2) Five-degree more than receiving water bodies. 3) The Maximum Limits of Industrial Polluters Permitted to be
discharged to the Sewer Networks.
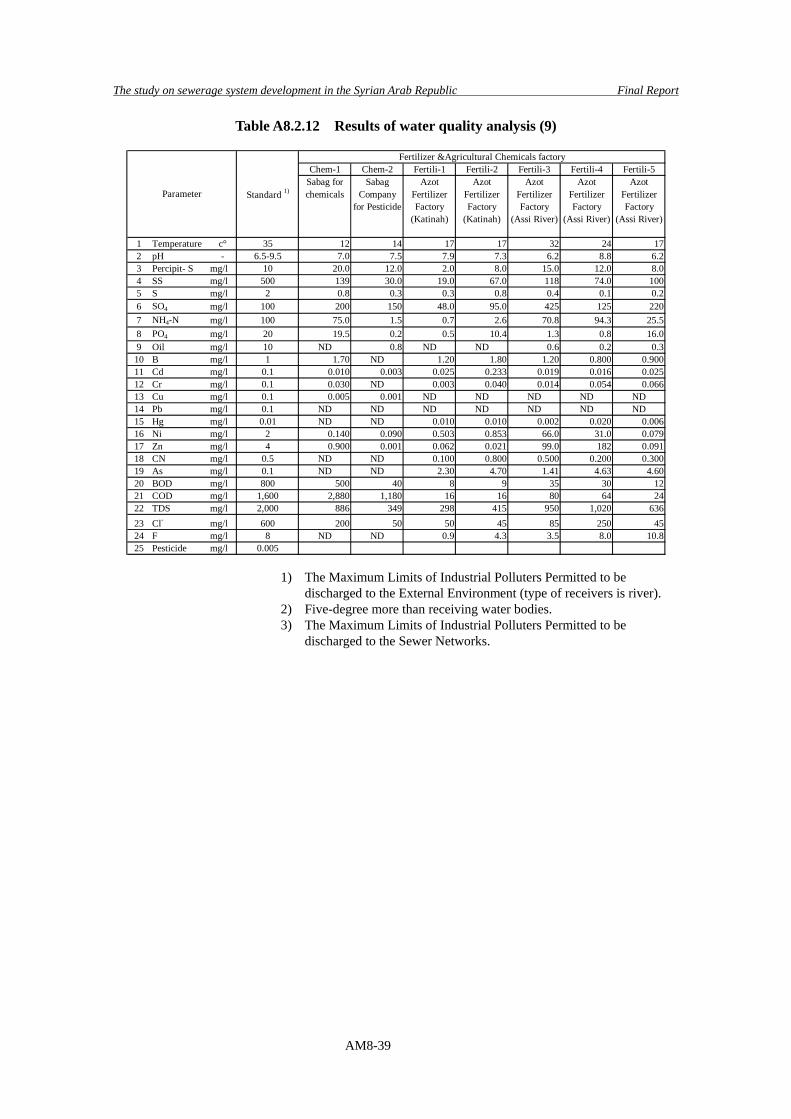
The study on sewerage system development in the Syrian Arab Republic Final Report
AM8-39
Table A8.2.12 Results of water quality analysis (9)
Chem-1 Chem-2 Fertili-1 Fertili-2 Fertili-3 Fertili-4 Fertili-5Sabag forchemicals
SabagCompany
for Pesticide
AzotFertilizerFactory
(Katinah)
AzotFertilizerFactory
(Katinah)
AzotFertilizerFactory
(Assi River)
AzotFertilizerFactory
(Assi River)
AzotFertilizerFactory
(Assi River)
1 Temperature c° 35 12 14 17 17 32 24 172 pH - 6.5-9.5 7.0 7.5 7.9 7.3 6.2 8.8 6.23 Percipit- S mg/l 10 20.0 12.0 2.0 8.0 15.0 12.0 8.04 SS mg/l 500 139 30.0 19.0 67.0 118 74.0 1005 S mg/l 2 0.8 0.3 0.3 0.8 0.4 0.1 0.26 SO4 mg/l 100 200 150 48.0 95.0 425 125 2207 NH4-N mg/l 100 75.0 1.5 0.7 2.6 70.8 94.3 25.58 PO4 mg/l 20 19.5 0.2 0.5 10.4 1.3 0.8 16.09 Oil mg/l 10 ND 0.8 ND ND 0.6 0.2 0.310 B mg/l 1 1.70 ND 1.20 1.80 1.20 0.800 0.90011 Cd mg/l 0.1 0.010 0.003 0.025 0.233 0.019 0.016 0.02512 Cr mg/l 0.1 0.030 ND 0.003 0.040 0.014 0.054 0.06613 Cu mg/l 0.1 0.005 0.001 ND ND ND ND ND14 Pb mg/l 0.1 ND ND ND ND ND ND ND15 Hg mg/l 0.01 ND ND 0.010 0.010 0.002 0.020 0.00616 Ni mg/l 2 0.140 0.090 0.503 0.853 66.0 31.0 0.07917 Zn mg/l 4 0.900 0.001 0.062 0.021 99.0 182 0.09118 CN mg/l 0.5 ND ND 0.100 0.800 0.500 0.200 0.30019 As mg/l 0.1 ND ND 2.30 4.70 1.41 4.63 4.6020 BOD mg/l 800 500 40 8 9 35 30 1221 COD mg/l 1,600 2,880 1,180 16 16 80 64 2422 TDS mg/l 2,000 886 349 298 415 950 1,020 63623 Cl- mg/l 600 200 50 50 45 85 250 4524 F mg/l 8 ND ND 0.9 4.3 3.5 8.0 10.825 Pesticide mg/l 0.005
Standard 1)Parameter
Fertilizer &Agricultural Chemicals factory
1) The Maximum Limits of Industrial Polluters Permitted to be discharged to the External Environment (type of receivers is river).
2) Five-degree more than receiving water bodies. 3) The Maximum Limits of Industrial Polluters Permitted to be
discharged to the Sewer Networks.
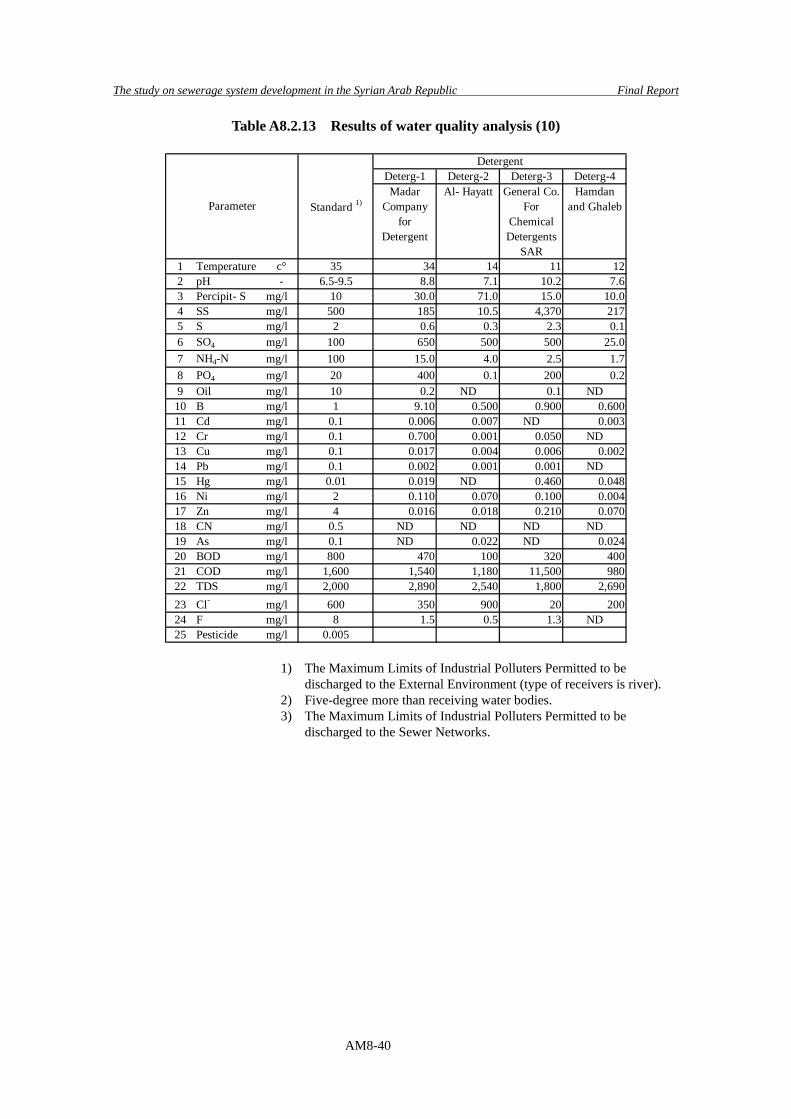
The study on sewerage system development in the Syrian Arab Republic Final Report
AM8-40
Table A8.2.13 Results of water quality analysis (10)
Deterg-1 Deterg-2 Deterg-3 Deterg-4Madar
Companyfor
Detergent
Al- Hayatt General Co.For
ChemicalDetergents
SAR
Hamdanand Ghaleb
1 Temperature c° 35 34 14 11 122 pH - 6.5-9.5 8.8 7.1 10.2 7.63 Percipit- S mg/l 10 30.0 71.0 15.0 10.04 SS mg/l 500 185 10.5 4,370 2175 S mg/l 2 0.6 0.3 2.3 0.16 SO4 mg/l 100 650 500 500 25.07 NH4-N mg/l 100 15.0 4.0 2.5 1.78 PO4 mg/l 20 400 0.1 200 0.29 Oil mg/l 10 0.2 ND 0.1 ND10 B mg/l 1 9.10 0.500 0.900 0.60011 Cd mg/l 0.1 0.006 0.007 ND 0.00312 Cr mg/l 0.1 0.700 0.001 0.050 ND13 Cu mg/l 0.1 0.017 0.004 0.006 0.00214 Pb mg/l 0.1 0.002 0.001 0.001 ND15 Hg mg/l 0.01 0.019 ND 0.460 0.04816 Ni mg/l 2 0.110 0.070 0.100 0.00417 Zn mg/l 4 0.016 0.018 0.210 0.07018 CN mg/l 0.5 ND ND ND ND19 As mg/l 0.1 ND 0.022 ND 0.02420 BOD mg/l 800 470 100 320 40021 COD mg/l 1,600 1,540 1,180 11,500 98022 TDS mg/l 2,000 2,890 2,540 1,800 2,69023 Cl- mg/l 600 350 900 20 20024 F mg/l 8 1.5 0.5 1.3 ND25 Pesticide mg/l 0.005
Standard 1)Parameter
Detergent
1) The Maximum Limits of Industrial Polluters Permitted to be discharged to the External Environment (type of receivers is river).
2) Five-degree more than receiving water bodies. 3) The Maximum Limits of Industrial Polluters Permitted to be
discharged to the Sewer Networks.
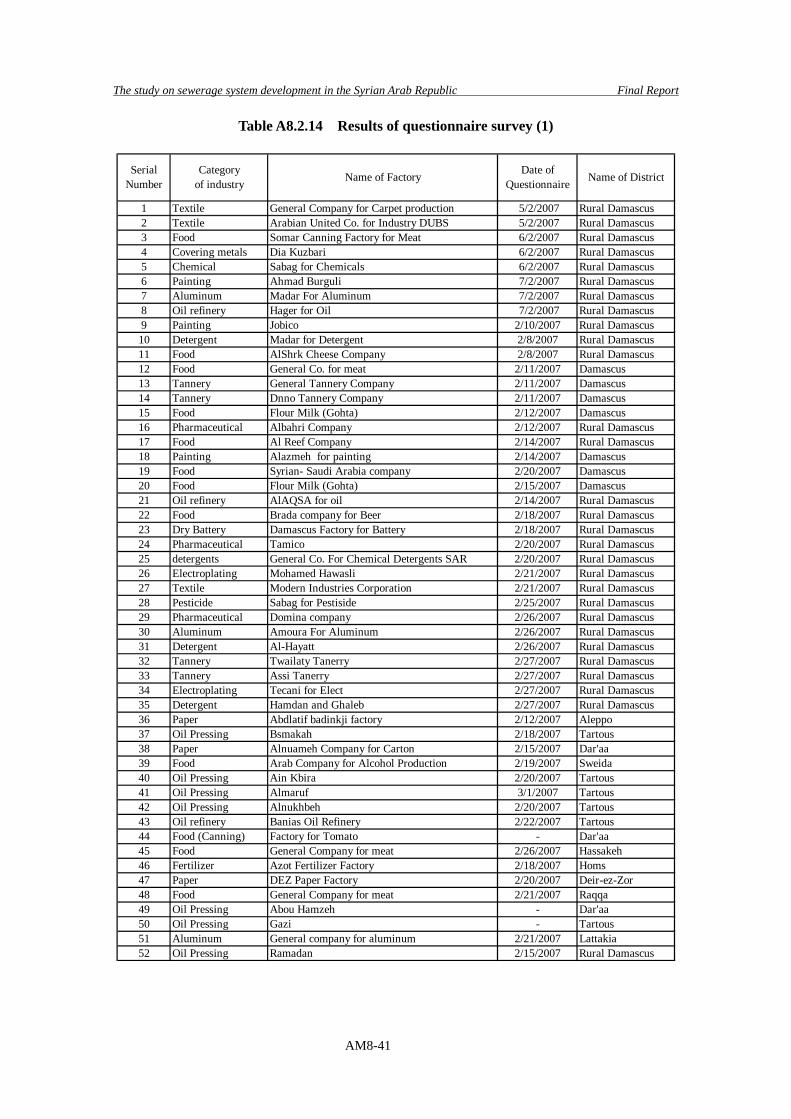
The study on sewerage system development in the Syrian Arab Republic Final Report
AM8-41
Table A8.2.14 Results of questionnaire survey (1)
1 Textile General Company for Carpet production 5/2/2007 Rural Damascus2 Textile Arabian United Co. for Industry DUBS 5/2/2007 Rural Damascus3 Food Somar Canning Factory for Meat 6/2/2007 Rural Damascus4 Covering metals Dia Kuzbari 6/2/2007 Rural Damascus5 Chemical Sabag for Chemicals 6/2/2007 Rural Damascus6 Painting Ahmad Burguli 7/2/2007 Rural Damascus7 Aluminum Madar For Aluminum 7/2/2007 Rural Damascus8 Oil refinery Hager for Oil 7/2/2007 Rural Damascus9 Painting Jobico 2/10/2007 Rural Damascus10 Detergent Madar for Detergent 2/8/2007 Rural Damascus11 Food AlShrk Cheese Company 2/8/2007 Rural Damascus12 Food General Co. for meat 2/11/2007 Damascus13 Tannery General Tannery Company 2/11/2007 Damascus14 Tannery Dnno Tannery Company 2/11/2007 Damascus15 Food Flour Milk (Gohta) 2/12/2007 Damascus16 Pharmaceutical Albahri Company 2/12/2007 Rural Damascus17 Food Al Reef Company 2/14/2007 Rural Damascus18 Painting Alazmeh for painting 2/14/2007 Damascus19 Food Syrian- Saudi Arabia company 2/20/2007 Damascus20 Food Flour Milk (Gohta) 2/15/2007 Damascus21 Oil refinery AlAQSA for oil 2/14/2007 Rural Damascus22 Food Brada company for Beer 2/18/2007 Rural Damascus23 Dry Battery Damascus Factory for Battery 2/18/2007 Rural Damascus24 Pharmaceutical Tamico 2/20/2007 Rural Damascus25 detergents General Co. For Chemical Detergents SAR 2/20/2007 Rural Damascus26 Electroplating Mohamed Hawasli 2/21/2007 Rural Damascus27 Textile Modern Industries Corporation 2/21/2007 Rural Damascus28 Pesticide Sabag for Pestiside 2/25/2007 Rural Damascus29 Pharmaceutical Domina company 2/26/2007 Rural Damascus30 Aluminum Amoura For Aluminum 2/26/2007 Rural Damascus31 Detergent Al-Hayatt 2/26/2007 Rural Damascus32 Tannery Twailaty Tanerry 2/27/2007 Rural Damascus33 Tannery Assi Tanerry 2/27/2007 Rural Damascus34 Electroplating Tecani for Elect 2/27/2007 Rural Damascus35 Detergent Hamdan and Ghaleb 2/27/2007 Rural Damascus36 Paper Abdlatif badinkji factory 2/12/2007 Aleppo37 Oil Pressing Bsmakah 2/18/2007 Tartous38 Paper Alnuameh Company for Carton 2/15/2007 Dar'aa39 Food Arab Company for Alcohol Production 2/19/2007 Sweida40 Oil Pressing Ain Kbira 2/20/2007 Tartous41 Oil Pressing Almaruf 3/1/2007 Tartous42 Oil Pressing Alnukhbeh 2/20/2007 Tartous43 Oil refinery Banias Oil Refinery 2/22/2007 Tartous44 Food (Canning) Factory for Tomato - Dar'aa45 Food General Company for meat 2/26/2007 Hassakeh46 Fertilizer Azot Fertilizer Factory 2/18/2007 Homs47 Paper DEZ Paper Factory 2/20/2007 Deir-ez-Zor48 Food General Company for meat 2/21/2007 Raqqa49 Oil Pressing Abou Hamzeh - Dar'aa50 Oil Pressing Gazi - Tartous51 Aluminum General company for aluminum 2/21/2007 Lattakia52 Oil Pressing Ramadan 2/15/2007 Rural Damascus
Name of DistrictSerialNumber
Categoryof industry
Date ofQuestionnaireName of Factory
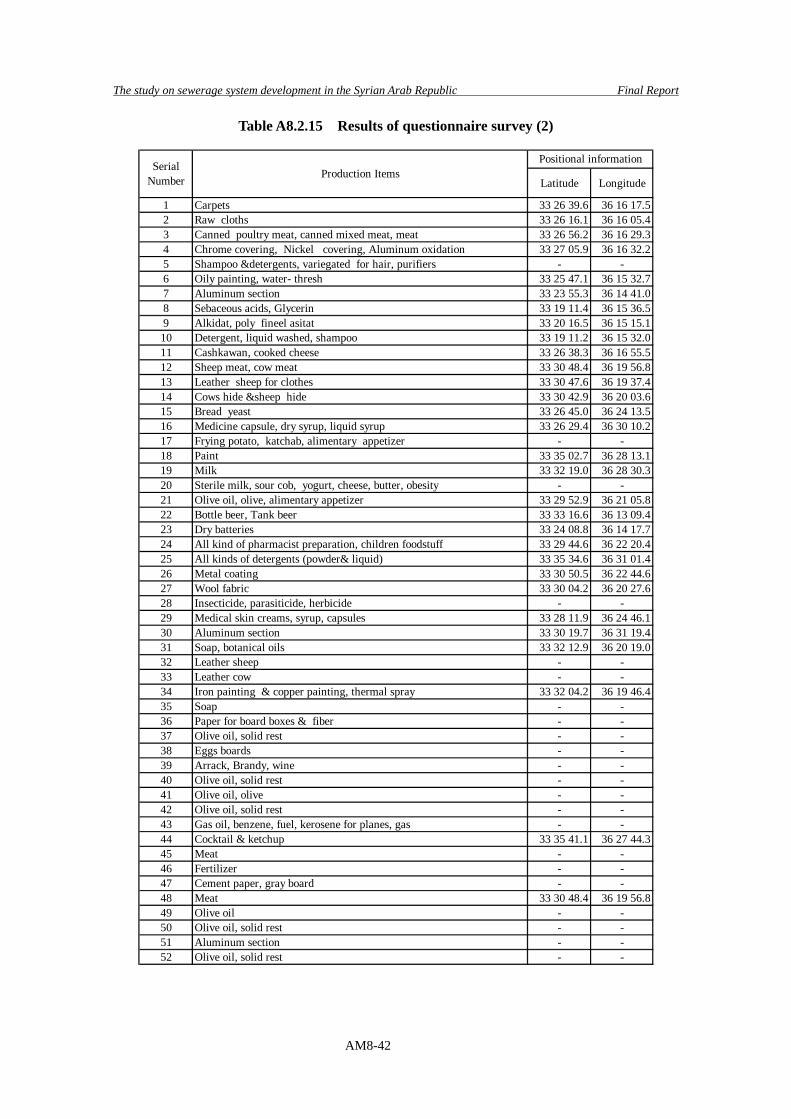
The study on sewerage system development in the Syrian Arab Republic Final Report
AM8-42
Table A8.2.15 Results of questionnaire survey (2)
Latitude Longitude
1 Carpets 33 26 39.6 36 16 17.52 Raw cloths 33 26 16.1 36 16 05.43 Canned poultry meat, canned mixed meat, meat 33 26 56.2 36 16 29.34 Chrome covering, Nickel covering, Aluminum oxidation 33 27 05.9 36 16 32.25 Shampoo &detergents, variegated for hair, purifiers - -6 Oily painting, water- thresh 33 25 47.1 36 15 32.77 Aluminum section 33 23 55.3 36 14 41.08 Sebaceous acids, Glycerin 33 19 11.4 36 15 36.59 Alkidat, poly fineel asitat 33 20 16.5 36 15 15.110 Detergent, liquid washed, shampoo 33 19 11.2 36 15 32.011 Cashkawan, cooked cheese 33 26 38.3 36 16 55.512 Sheep meat, cow meat 33 30 48.4 36 19 56.813 Leather sheep for clothes 33 30 47.6 36 19 37.414 Cows hide &sheep hide 33 30 42.9 36 20 03.615 Bread yeast 33 26 45.0 36 24 13.516 Medicine capsule, dry syrup, liquid syrup 33 26 29.4 36 30 10.217 Frying potato, katchab, alimentary appetizer - -18 Paint 33 35 02.7 36 28 13.119 Milk 33 32 19.0 36 28 30.320 Sterile milk, sour cob, yogurt, cheese, butter, obesity - -21 Olive oil, olive, alimentary appetizer 33 29 52.9 36 21 05.822 Bottle beer, Tank beer 33 33 16.6 36 13 09.423 Dry batteries 33 24 08.8 36 14 17.724 All kind of pharmacist preparation, children foodstuff 33 29 44.6 36 22 20.425 All kinds of detergents (powder& liquid) 33 35 34.6 36 31 01.426 Metal coating 33 30 50.5 36 22 44.627 Wool fabric 33 30 04.2 36 20 27.628 Insecticide, parasiticide, herbicide - -29 Medical skin creams, syrup, capsules 33 28 11.9 36 24 46.130 Aluminum section 33 30 19.7 36 31 19.431 Soap, botanical oils 33 32 12.9 36 20 19.032 Leather sheep - -33 Leather cow - -34 Iron painting & copper painting, thermal spray 33 32 04.2 36 19 46.435 Soap - -36 Paper for board boxes & fiber - -37 Olive oil, solid rest - -38 Eggs boards - -39 Arrack, Brandy, wine - -40 Olive oil, solid rest - -41 Olive oil, olive - -42 Olive oil, solid rest - -43 Gas oil, benzene, fuel, kerosene for planes, gas - -44 Cocktail & ketchup 33 35 41.1 36 27 44.345 Meat - -46 Fertilizer - -47 Cement paper, gray board - -48 Meat 33 30 48.4 36 19 56.849 Olive oil - -50 Olive oil, solid rest - -51 Aluminum section - -52 Olive oil, solid rest - -
Production ItemsSerialNumber
Positional information
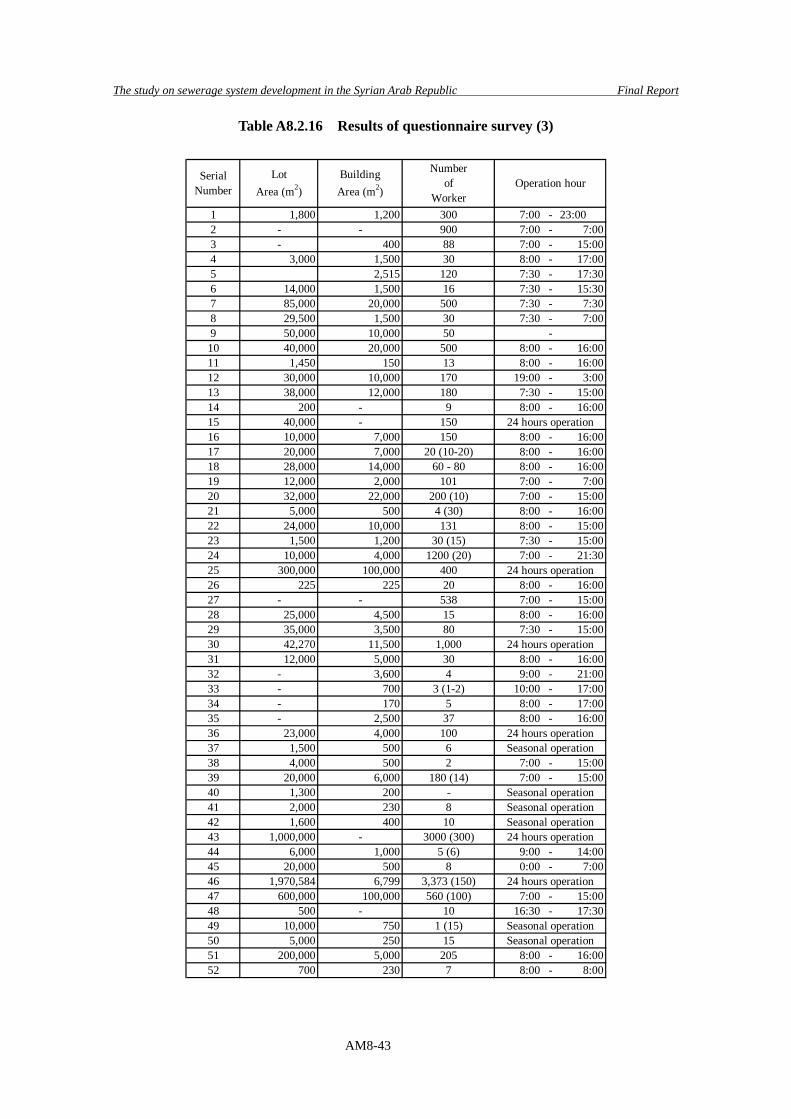
The study on sewerage system development in the Syrian Arab Republic Final Report
AM8-43
Table A8.2.16 Results of questionnaire survey (3)
1 1,800 1,200 300 7:00 - 23:002 - - 900 7:00 - 7:003 - 400 88 7:00 - 15:004 3,000 1,500 30 8:00 - 17:005 2,515 120 7:30 - 17:306 14,000 1,500 16 7:30 - 15:307 85,000 20,000 500 7:30 - 7:308 29,500 1,500 30 7:30 - 7:009 50,000 10,000 5010 40,000 20,000 500 8:00 - 16:0011 1,450 150 13 8:00 - 16:0012 30,000 10,000 170 19:00 - 3:0013 38,000 12,000 180 7:30 - 15:0014 200 - 9 8:00 - 16:0015 40,000 - 15016 10,000 7,000 150 8:00 - 16:0017 20,000 7,000 20 (10-20) 8:00 - 16:0018 28,000 14,000 60 - 80 8:00 - 16:0019 12,000 2,000 101 7:00 - 7:0020 32,000 22,000 200 (10) 7:00 - 15:0021 5,000 500 4 (30) 8:00 - 16:0022 24,000 10,000 131 8:00 - 15:0023 1,500 1,200 30 (15) 7:30 - 15:0024 10,000 4,000 1200 (20) 7:00 - 21:3025 300,000 100,000 40026 225 225 20 8:00 - 16:0027 - - 538 7:00 - 15:0028 25,000 4,500 15 8:00 - 16:0029 35,000 3,500 80 7:30 - 15:0030 42,270 11,500 1,00031 12,000 5,000 30 8:00 - 16:0032 - 3,600 4 9:00 - 21:0033 - 700 3 (1-2) 10:00 - 17:0034 - 170 5 8:00 - 17:0035 - 2,500 37 8:00 - 16:0036 23,000 4,000 10037 1,500 500 638 4,000 500 2 7:00 - 15:0039 20,000 6,000 180 (14) 7:00 - 15:0040 1,300 200 -41 2,000 230 842 1,600 400 1043 1,000,000 - 3000 (300)44 6,000 1,000 5 (6) 9:00 - 14:0045 20,000 500 8 0:00 - 7:0046 1,970,584 6,799 3,373 (150)47 600,000 100,000 560 (100) 7:00 - 15:0048 500 - 10 16:30 - 17:3049 10,000 750 1 (15)50 5,000 250 1551 200,000 5,000 205 8:00 - 16:0052 700 230 7 8:00 - 8:00
LotArea (m2)
SerialNumber Operation hour
Numberof
Worker
BuildingArea (m2)
24 hours operation
24 hours operation
-
24 hours operation
24 hours operationSeasonal operation
Seasonal operationSeasonal operationSeasonal operation
Seasonal operationSeasonal operation
24 hours operation
24 hours operation
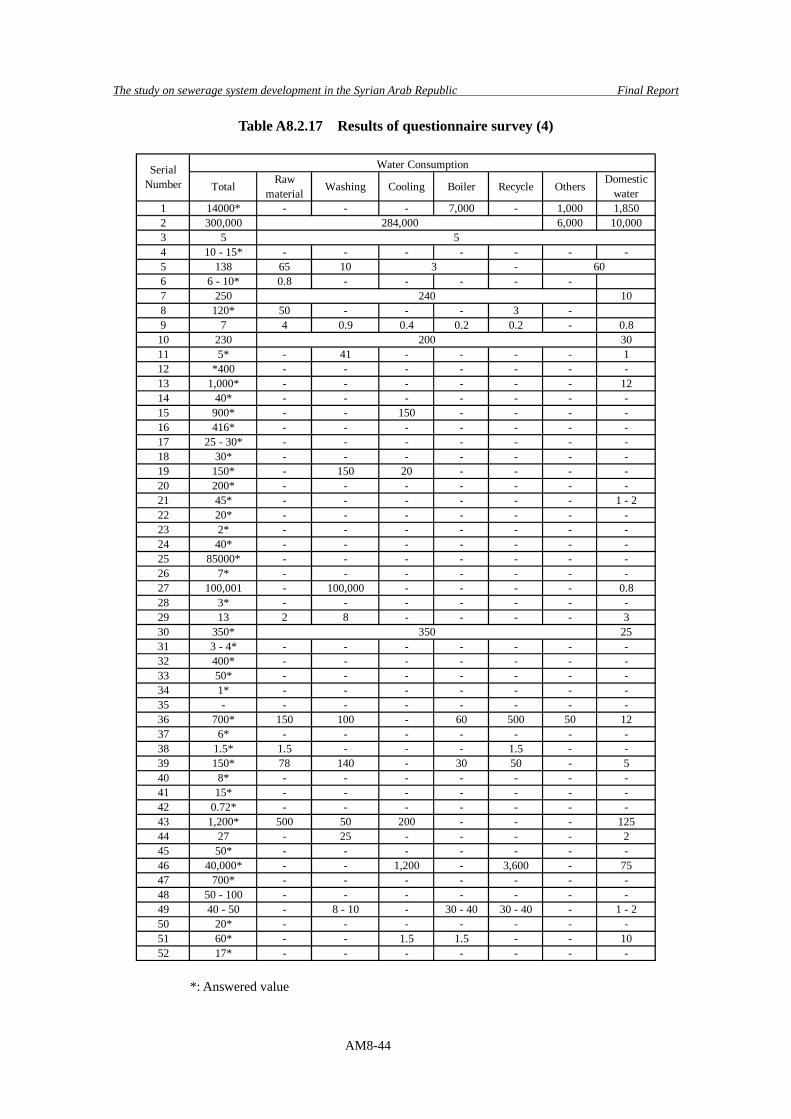
The study on sewerage system development in the Syrian Arab Republic Final Report
AM8-44
Table A8.2.17 Results of questionnaire survey (4)
Total Rawmaterial Washing Cooling Boiler Recycle Others
Domesticwater
1 14000* - - - 7,000 - 1,000 1,8502 300,000 6,000 10,0003 54 10 - 15* - - - - - - -5 138 65 10 -6 6 - 10* 0.8 - - - - -7 250 108 120* 50 - - - 3 -9 7 4 0.9 0.4 0.2 0.2 - 0.810 230 3011 5* - 41 - - - - 112 *400 - - - - - - -13 1,000* - - - - - - 1214 40* - - - - - - -15 900* - - 150 - - - -16 416* - - - - - - -17 25 - 30* - - - - - - -18 30* - - - - - - -19 150* - 150 20 - - - -20 200* - - - - - - -21 45* - - - - - - 1 - 222 20* - - - - - - -23 2* - - - - - - -24 40* - - - - - - -25 85000* - - - - - - -26 7* - - - - - - -27 100,001 - 100,000 - - - - 0.828 3* - - - - - - -29 13 2 8 - - - - 330 350* 2531 3 - 4* - - - - - - -32 400* - - - - - - -33 50* - - - - - - -34 1* - - - - - - -35 - - - - - - - -36 700* 150 100 - 60 500 50 1237 6* - - - - - - -38 1.5* 1.5 - - - 1.5 - -39 150* 78 140 - 30 50 - 540 8* - - - - - - -41 15* - - - - - - -42 0.72* - - - - - - -43 1,200* 500 50 200 - - - 12544 27 - 25 - - - - 245 50* - - - - - - -46 40,000* - - 1,200 - 3,600 - 7547 700* - - - - - - -48 50 - 100 - - - - - - -49 40 - 50 - 8 - 10 - 30 - 40 30 - 40 - 1 - 250 20* - - - - - - -51 60* - - 1.5 1.5 - - 1052 17* - - - - - - -
SerialNumber
240
200
Water Consumption
350
284,0005
3 60
*: Answered value
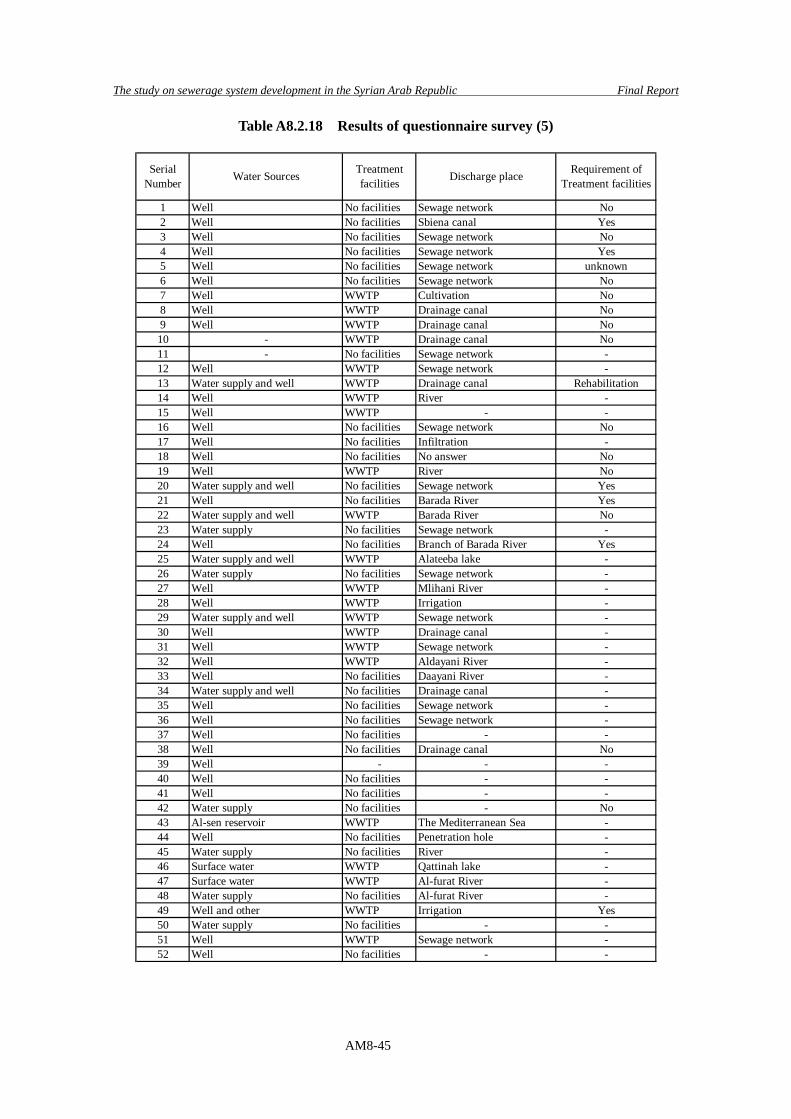
The study on sewerage system development in the Syrian Arab Republic Final Report
AM8-45
Table A8.2.18 Results of questionnaire survey (5)
1 Well No facilities Sewage network No2 Well No facilities Sbiena canal Yes3 Well No facilities Sewage network No4 Well No facilities Sewage network Yes5 Well No facilities Sewage network unknown6 Well No facilities Sewage network No7 Well WWTP Cultivation No8 Well WWTP Drainage canal No9 Well WWTP Drainage canal No10 - WWTP Drainage canal No11 - No facilities Sewage network -12 Well WWTP Sewage network -13 Water supply and well WWTP Drainage canal Rehabilitation14 Well WWTP River -15 Well WWTP - -16 Well No facilities Sewage network No17 Well No facilities Infiltration -18 Well No facilities No answer No19 Well WWTP River No20 Water supply and well No facilities Sewage network Yes21 Well No facilities Barada River Yes22 Water supply and well WWTP Barada River No23 Water supply No facilities Sewage network -24 Well No facilities Branch of Barada River Yes25 Water supply and well WWTP Alateeba lake -26 Water supply No facilities Sewage network -27 Well WWTP Mlihani River -28 Well WWTP Irrigation -29 Water supply and well WWTP Sewage network -30 Well WWTP Drainage canal -31 Well WWTP Sewage network -32 Well WWTP Aldayani River -33 Well No facilities Daayani River -34 Water supply and well No facilities Drainage canal -35 Well No facilities Sewage network -36 Well No facilities Sewage network -37 Well No facilities - -38 Well No facilities Drainage canal No39 Well - - -40 Well No facilities - -41 Well No facilities - -42 Water supply No facilities - No43 Al-sen reservoir WWTP The Mediterranean Sea -44 Well No facilities Penetration hole -45 Water supply No facilities River -46 Surface water WWTP Qattinah lake -47 Surface water WWTP Al-furat River -48 Water supply No facilities Al-furat River -49 Well and other WWTP Irrigation Yes50 Water supply No facilities - -51 Well WWTP Sewage network -52 Well No facilities - -
SerialNumber Water Sources Treatment
facilitiesRequirement of
Treatment facilitiesDischarge place
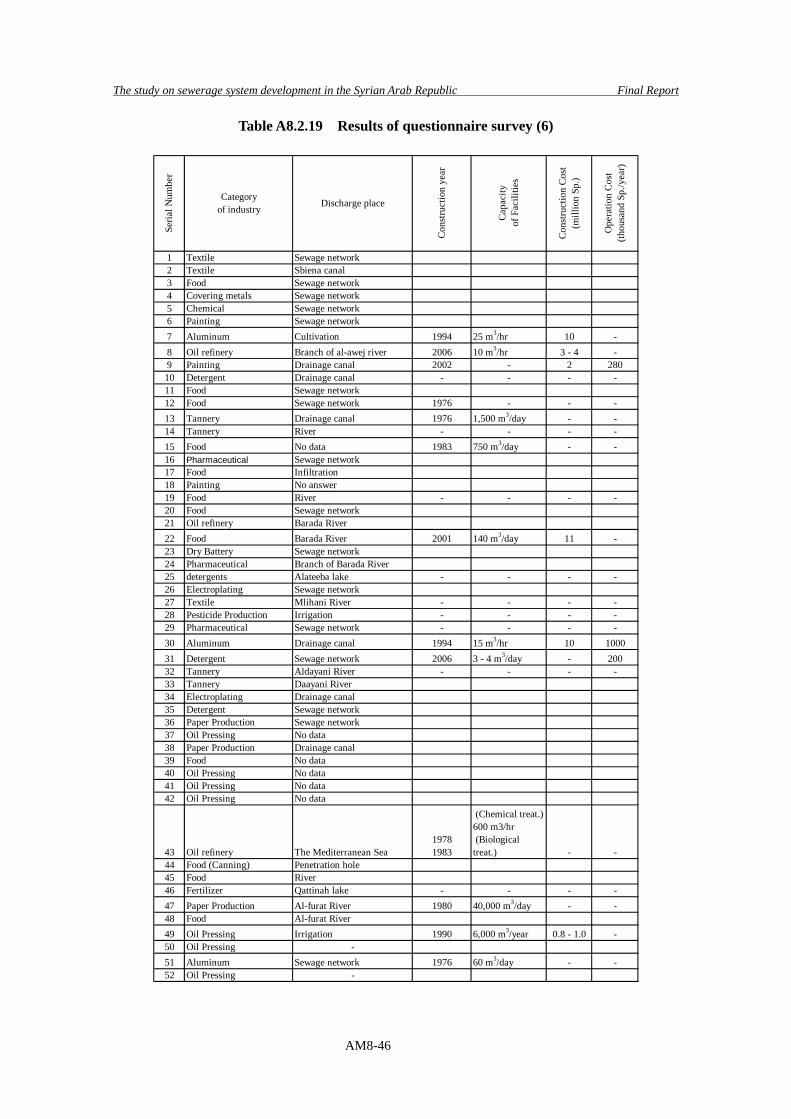
The study on sewerage system development in the Syrian Arab Republic Final Report
AM8-46
Table A8.2.19 Results of questionnaire survey (6)
1 Textile Sewage network2 Textile Sbiena canal3 Food Sewage network4 Covering metals Sewage network5 Chemical Sewage network6 Painting Sewage network7 Aluminum Cultivation 1994 25 m3/hr 10 -8 Oil refinery Branch of al-awej river 2006 10 m3/hr 3 - 4 -9 Painting Drainage canal 2002 - 2 28010 Detergent Drainage canal - - - -11 Food Sewage network12 Food Sewage network 1976 - - -13 Tannery Drainage canal 1976 1,500 m3/day - -14 Tannery River - - - -15 Food No data 1983 750 m3/day - -16 Pharmaceutical Sewage network17 Food Infiltration18 Painting No answer19 Food River - - - -20 Food Sewage network21 Oil refinery Barada River22 Food Barada River 2001 140 m3/day 11 -23 Dry Battery Sewage network24 Pharmaceutical Branch of Barada River25 detergents Alateeba lake - - - -26 Electroplating Sewage network27 Textile Mlihani River - - - -28 Pesticide Production Irrigation - - - -29 Pharmaceutical Sewage network - - - -30 Aluminum Drainage canal 1994 15 m3/hr 10 100031 Detergent Sewage network 2006 3 - 4 m3/day - 20032 Tannery Aldayani River - - - -33 Tannery Daayani River34 Electroplating Drainage canal35 Detergent Sewage network36 Paper Production Sewage network37 Oil Pressing No data38 Paper Production Drainage canal39 Food No data40 Oil Pressing No data41 Oil Pressing No data42 Oil Pressing No data
43 Oil refinery The Mediterranean Sea19781983
(Chemical treat.)600 m3/hr (Biologicaltreat.) - -
44 Food (Canning) Penetration hole45 Food River46 Fertilizer Qattinah lake - - - -47 Paper Production Al-furat River 1980 40,000 m3/day - -48 Food Al-furat River49 Oil Pressing Irrigation 1990 6,000 m3/year 0.8 - 1.0 -50 Oil Pressing -51 Aluminum Sewage network 1976 60 m3/day - -52 Oil Pressing -
Seria
l Num
ber
Categoryof industry
Con
stru
ctio
n ye
ar
Cap
acity
of F
acili
ties
Con
stru
ctio
n C
ost
(mill
ion
Sp.)
Discharge place
Ope
ratio
n C
ost
(thou
sand
Sp.
/yea
r)
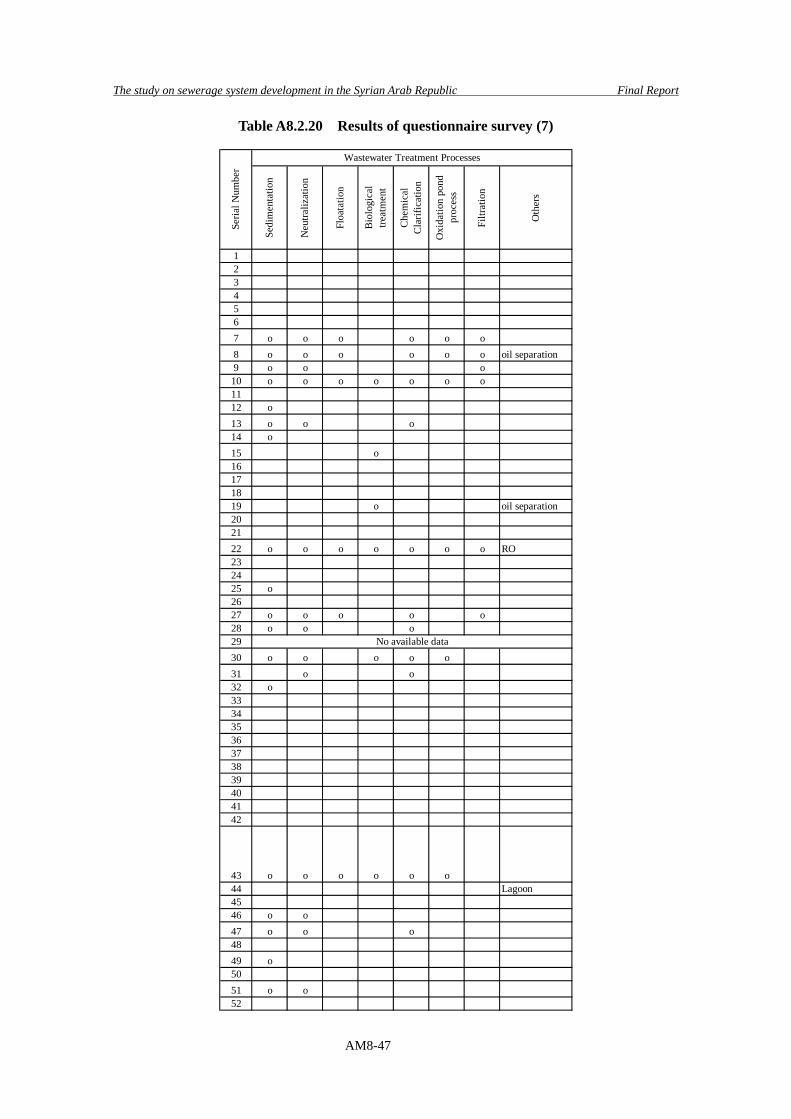
The study on sewerage system development in the Syrian Arab Republic Final Report
AM8-47
Table A8.2.20 Results of questionnaire survey (7)
Sedi
men
tatio
n
Neu
traliz
atio
n
Floa
tatio
n
Bio
logi
cal
treat
men
t
Che
mic
alC
larif
icat
ion
Oxi
datio
n po
ndpr
oces
s
Filtr
atio
n
Oth
ers
1234567 o o o o o o8 o o o o o o oil separation9 o o o10 o o o o o o o1112 o13 o o o14 o15 o16171819 o oil separation202122 o o o o o o o RO232425 o2627 o o o o o28 o o o2930 o o o o o31 o o32 o33343536373839404142
43 o o o o o o44 Lagoon 4546 o o47 o o o4849 o5051 o o52
No available data
Seria
l Num
ber
Wastewater Treatment Processes
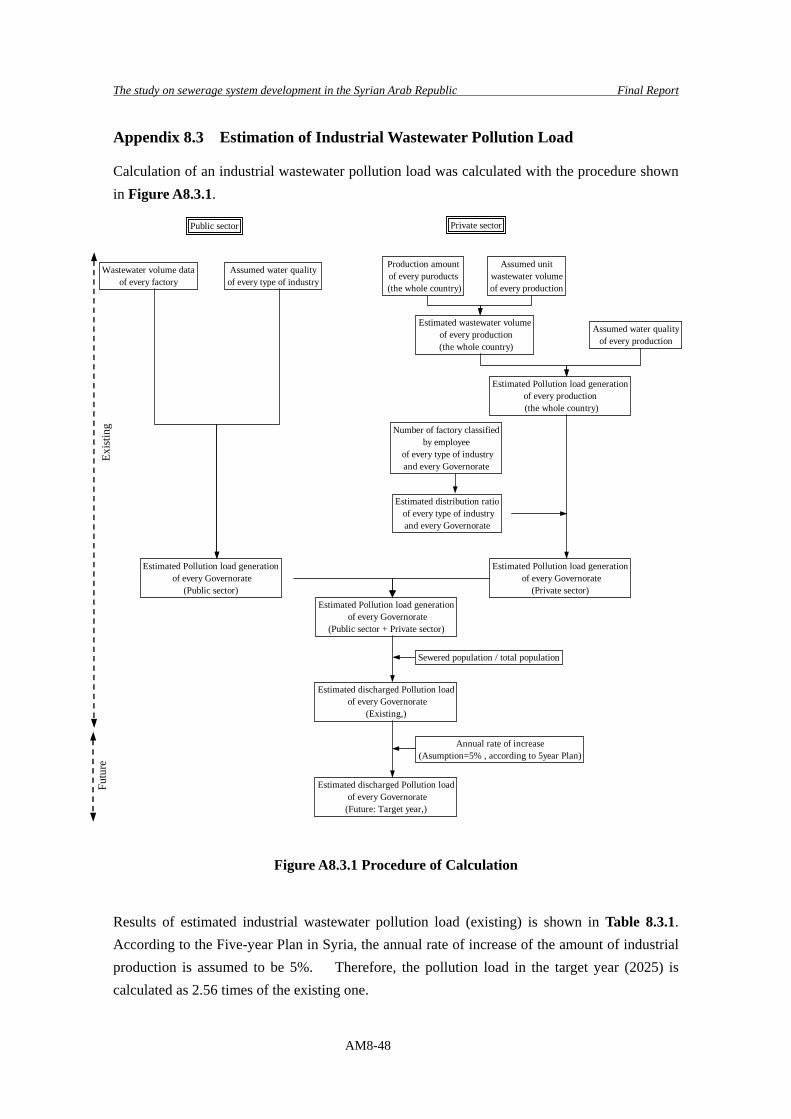
The study on sewerage system development in the Syrian Arab Republic Final Report
AM8-48
Appendix 8.3 Estimation of Industrial Wastewater Pollution Load
Calculation of an industrial wastewater pollution load was calculated with the procedure shown in Figure A8.3.1.
Exist
ing
Futu
re
Public sector Private sector
Wastewater volume dataof every factory
Assumed water qualityof every type of industry
Production amountof every puroducts
(the whole country)
Assumed unitwastewater volumeof every production
Estimated wastewater volume of every production (the whole country)
Assumed water qualityof every production
Estimated Pollution load generationof every production (the whole country)
Estimated distribution ratio of every type of industryand every Governorate
Estimated Pollution load generation of every Governorate
(Private sector)
Estimated Pollution load generation of every Governorate
(Public sector)Estimated Pollution load generation
of every Governorate(Public sector + Private sector)
Estimated discharged Pollution load of every Governorate
(Existing,)
Number of factory classifiedby employee
of every type of industryand every Governorate
Sewered population / total population
Estimated discharged Pollution load of every Governorate(Future: Target year,)
Annual rate of increase(Asumption=5% , according to 5year Plan)
Figure A8.3.1 Procedure of Calculation
Results of estimated industrial wastewater pollution load (existing) is shown in Table 8.3.1. According to the Five-year Plan in Syria, the annual rate of increase of the amount of industrial production is assumed to be 5%. Therefore, the pollution load in the target year (2025) is calculated as 2.56 times of the existing one.
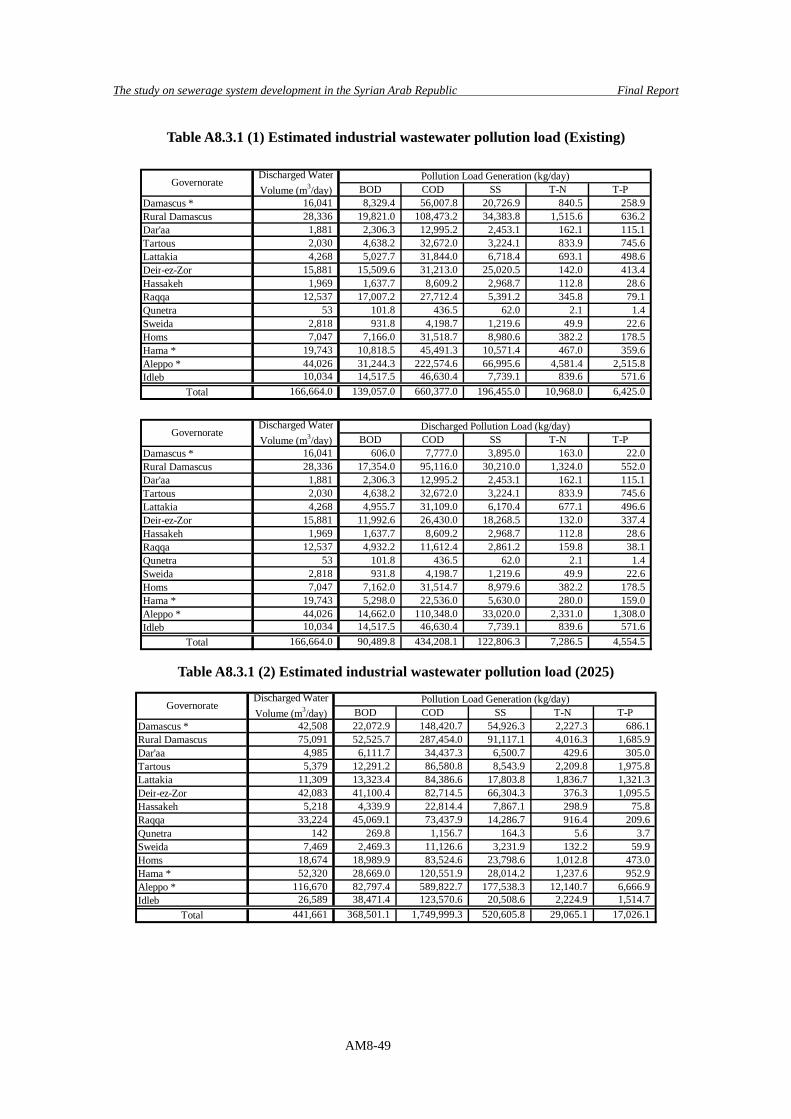
The study on sewerage system development in the Syrian Arab Republic Final Report
AM8-49
Table A8.3.1 (1) Estimated industrial wastewater pollution load (Existing)
BOD COD SS T-N T-PDamascus * 16,041 8,329.4 56,007.8 20,726.9 840.5 258.9 Rural Damascus 28,336 19,821.0 108,473.2 34,383.8 1,515.6 636.2 Dar'aa 1,881 2,306.3 12,995.2 2,453.1 162.1 115.1 Tartous 2,030 4,638.2 32,672.0 3,224.1 833.9 745.6 Lattakia 4,268 5,027.7 31,844.0 6,718.4 693.1 498.6 Deir-ez-Zor 15,881 15,509.6 31,213.0 25,020.5 142.0 413.4 Hassakeh 1,969 1,637.7 8,609.2 2,968.7 112.8 28.6 Raqqa 12,537 17,007.2 27,712.4 5,391.2 345.8 79.1 Qunetra 53 101.8 436.5 62.0 2.1 1.4 Sweida 2,818 931.8 4,198.7 1,219.6 49.9 22.6 Homs 7,047 7,166.0 31,518.7 8,980.6 382.2 178.5 Hama * 19,743 10,818.5 45,491.3 10,571.4 467.0 359.6 Aleppo * 44,026 31,244.3 222,574.6 66,995.6 4,581.4 2,515.8 Idleb 10,034 14,517.5 46,630.4 7,739.1 839.6 571.6
Total 166,664.0 139,057.0 660,377.0 196,455.0 10,968.0 6,425.0
GovernorateDischarged WaterVolume (m3/day)
Pollution Load Generation (kg/day)
BOD COD SS T-N T-PDamascus * 16,041 606.0 7,777.0 3,895.0 163.0 22.0 Rural Damascus 28,336 17,354.0 95,116.0 30,210.0 1,324.0 552.0 Dar'aa 1,881 2,306.3 12,995.2 2,453.1 162.1 115.1 Tartous 2,030 4,638.2 32,672.0 3,224.1 833.9 745.6 Lattakia 4,268 4,955.7 31,109.0 6,170.4 677.1 496.6 Deir-ez-Zor 15,881 11,992.6 26,430.0 18,268.5 132.0 337.4 Hassakeh 1,969 1,637.7 8,609.2 2,968.7 112.8 28.6 Raqqa 12,537 4,932.2 11,612.4 2,861.2 159.8 38.1 Qunetra 53 101.8 436.5 62.0 2.1 1.4 Sweida 2,818 931.8 4,198.7 1,219.6 49.9 22.6 Homs 7,047 7,162.0 31,514.7 8,979.6 382.2 178.5 Hama * 19,743 5,298.0 22,536.0 5,630.0 280.0 159.0 Aleppo * 44,026 14,662.0 110,348.0 33,020.0 2,331.0 1,308.0 Idleb 10,034 14,517.5 46,630.4 7,739.1 839.6 571.6
Total 166,664.0 90,489.8 434,208.1 122,806.3 7,286.5 4,554.5
GovernorateDischarged WaterVolume (m3/day)
Discharged Pollution Load (kg/day)
Table A8.3.1 (2) Estimated industrial wastewater pollution load (2025)
BOD COD SS T-N T-PDamascus * 42,508 22,072.9 148,420.7 54,926.3 2,227.3 686.1 Rural Damascus 75,091 52,525.7 287,454.0 91,117.1 4,016.3 1,685.9 Dar'aa 4,985 6,111.7 34,437.3 6,500.7 429.6 305.0 Tartous 5,379 12,291.2 86,580.8 8,543.9 2,209.8 1,975.8 Lattakia 11,309 13,323.4 84,386.6 17,803.8 1,836.7 1,321.3 Deir-ez-Zor 42,083 41,100.4 82,714.5 66,304.3 376.3 1,095.5 Hassakeh 5,218 4,339.9 22,814.4 7,867.1 298.9 75.8 Raqqa 33,224 45,069.1 73,437.9 14,286.7 916.4 209.6 Qunetra 142 269.8 1,156.7 164.3 5.6 3.7 Sweida 7,469 2,469.3 11,126.6 3,231.9 132.2 59.9 Homs 18,674 18,989.9 83,524.6 23,798.6 1,012.8 473.0 Hama * 52,320 28,669.0 120,551.9 28,014.2 1,237.6 952.9 Aleppo * 116,670 82,797.4 589,822.7 177,538.3 12,140.7 6,666.9 Idleb 26,589 38,471.4 123,570.6 20,508.6 2,224.9 1,514.7
Total 441,661 368,501.1 1,749,999.3 520,605.8 29,065.1 17,026.1
GovernorateDischarged WaterVolume (m3/day)
Pollution Load Generation (kg/day)
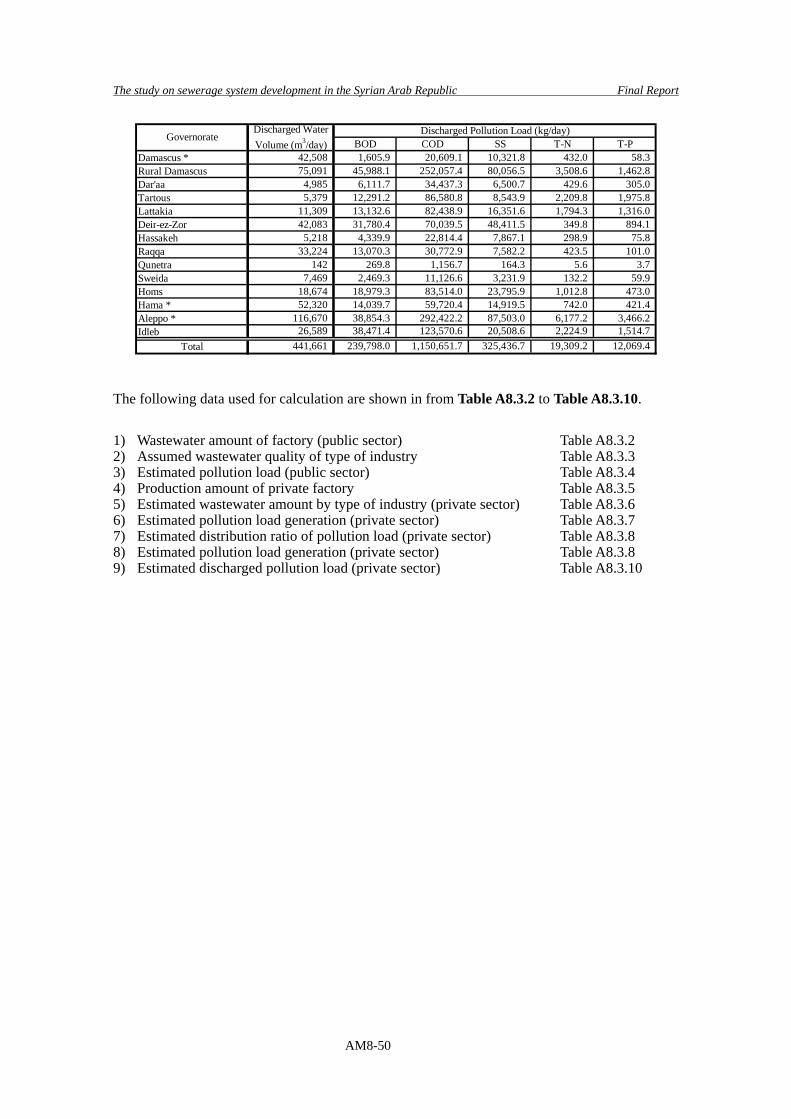
The study on sewerage system development in the Syrian Arab Republic Final Report
AM8-50
BOD COD SS T-N T-PDamascus * 42,508 1,605.9 20,609.1 10,321.8 432.0 58.3 Rural Damascus 75,091 45,988.1 252,057.4 80,056.5 3,508.6 1,462.8 Dar'aa 4,985 6,111.7 34,437.3 6,500.7 429.6 305.0 Tartous 5,379 12,291.2 86,580.8 8,543.9 2,209.8 1,975.8 Lattakia 11,309 13,132.6 82,438.9 16,351.6 1,794.3 1,316.0 Deir-ez-Zor 42,083 31,780.4 70,039.5 48,411.5 349.8 894.1 Hassakeh 5,218 4,339.9 22,814.4 7,867.1 298.9 75.8 Raqqa 33,224 13,070.3 30,772.9 7,582.2 423.5 101.0 Qunetra 142 269.8 1,156.7 164.3 5.6 3.7 Sweida 7,469 2,469.3 11,126.6 3,231.9 132.2 59.9 Homs 18,674 18,979.3 83,514.0 23,795.9 1,012.8 473.0 Hama * 52,320 14,039.7 59,720.4 14,919.5 742.0 421.4 Aleppo * 116,670 38,854.3 292,422.2 87,503.0 6,177.2 3,466.2 Idleb 26,589 38,471.4 123,570.6 20,508.6 2,224.9 1,514.7
Total 441,661 239,798.0 1,150,651.7 325,436.7 19,309.2 12,069.4
GovernorateDischarged WaterVolume (m3/day)
Discharged Pollution Load (kg/day)
The following data used for calculation are shown in from Table A8.3.2 to Table A8.3.10. 1) Wastewater amount of factory (public sector) Table A8.3.2 2) Assumed wastewater quality of type of industry Table A8.3.3 3) Estimated pollution load (public sector) Table A8.3.4 4) Production amount of private factory Table A8.3.5 5) Estimated wastewater amount by type of industry (private sector) Table A8.3.6 6) Estimated pollution load generation (private sector) Table A8.3.7 7) Estimated distribution ratio of pollution load (private sector) Table A8.3.8 8) Estimated pollution load generation (private sector) Table A8.3.8 9) Estimated discharged pollution load (private sector) Table A8.3.10
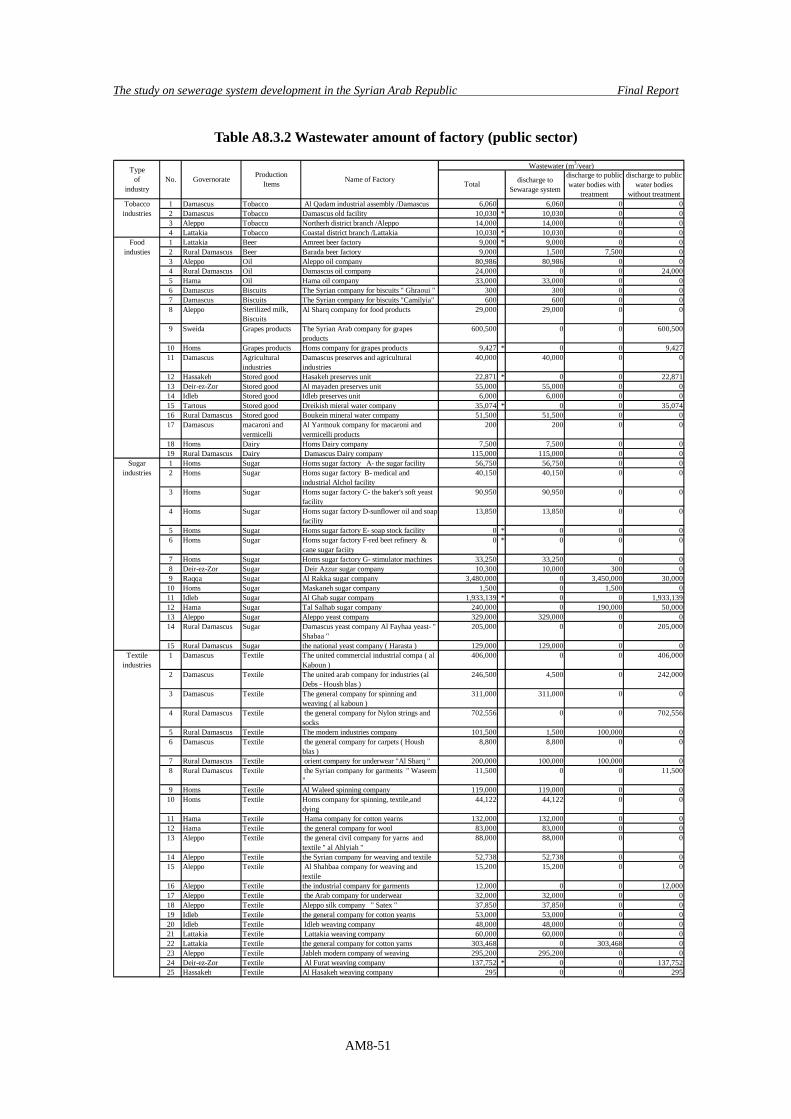
The study on sewerage system development in the Syrian Arab Republic Final Report
AM8-51
Table A8.3.2 Wastewater amount of factory (public sector)
discharge toSewarage system
discharge to publicwater bodies with
treatment
discharge to publicwater bodies
without treatment1 Damascus Tobacco Al Qadam industrial assembly /Damascus 6,060 6,060 0 02 Damascus Tobacco Damascus old facility 10,030 * 10,030 0 03 Aleppo Tobacco Northerh district branch /Aleppo 14,000 14,000 0 04 Lattakia Tobacco Coastal district branch /Lattakia 10,030 * 10,030 0 01 Lattakia Beer Amreet beer factory 9,000 * 9,000 0 02 Rural Damascus Beer Barada beer factory 9,000 1,500 7,500 03 Aleppo Oil Aleppo oil company 80,986 80,986 0 04 Rural Damascus Oil Damascus oil company 24,000 0 0 24,0005 Hama Oil Hama oil company 33,000 33,000 0 06 Damascus Biscuits The Syrian company for biscuits " Ghraoui " 300 300 0 07 Damascus Biscuits The Syrian company for biscuits "Camilyia" 600 600 0 08 Aleppo Sterilized milk,
BiscuitsAl Sharq company for food products 29,000 29,000 0 0
9 Sweida Grapes products The Syrian Arab company for grapesproducts
600,500 0 0 600,500
10 Homs Grapes products Homs company for grapes products 9,427 * 0 0 9,42711 Damascus Agricultural
industriesDamascus preserves and agriculturalindustries
40,000 40,000 0 0
12 Hassakeh Stored good Hasakeh preserves unit 22,871 * 0 0 22,87113 Deir-ez-Zor Stored good Al mayaden preserves unit 55,000 55,000 0 014 Idleb Stored good Idleb preserves unit 6,000 6,000 0 015 Tartous Stored good Dreikish mieral water company 35,074 * 0 0 35,07416 Rural Damascus Stored good Boukein mineral water company 51,500 51,500 0 017 Damascus macaroni and
vermicelliAl Yarmouk company for macaroni andvermicelli products
200 200 0 0
18 Homs Dairy Homs Dairy company 7,500 7,500 0 019 Rural Damascus Dairy Damascus Dairy company 115,000 115,000 0 01 Homs Sugar Homs sugar factory A- the sugar facility 56,750 56,750 0 02 Homs Sugar Homs sugar factory B- medical and
industrial Alchol facility40,150 40,150 0 0
3 Homs Sugar Homs sugar factory C- the baker's soft yeastfacility
90,950 90,950 0 0
4 Homs Sugar Homs sugar factory D-sunflower oil and soapfacility
13,850 13,850 0 0
5 Homs Sugar Homs sugar factory E- soap stock facility 0 * 0 0 06 Homs Sugar Homs sugar factory F-red beet refinery &
cane sugar faciity0 * 0 0 0
7 Homs Sugar Homs sugar factory G- stimulator machines 33,250 33,250 0 08 Deir-ez-Zor Sugar Deir Azzur sugar company 10,300 10,000 300 09 Raqqa Sugar Al Rakka sugar company 3,480,000 0 3,450,000 30,000
10 Homs Sugar Maskaneh sugar company 1,500 0 1,500 011 Idleb Sugar Al Ghab sugar company 1,933,139 * 0 0 1,933,13912 Hama Sugar Tal Salhab sugar company 240,000 0 190,000 50,00013 Aleppo Sugar Aleppo yeast company 329,000 329,000 0 014 Rural Damascus Sugar Damascus yeast company Al Fayhaa yeast- "
Shabaa "205,000 0 0 205,000
15 Rural Damascus Sugar the national yeast company ( Harasta ) 129,000 129,000 0 01 Damascus Textile The united commercial industrial compa ( al
Kaboun )406,000 0 0 406,000
2 Damascus Textile The united arab company for industries (alDebs - Housh blas )
246,500 4,500 0 242,000
3 Damascus Textile The general company for spinning andweaving ( al kaboun )
311,000 311,000 0 0
4 Rural Damascus Textile the general company for Nylon strings andsocks
702,556 0 0 702,556
5 Rural Damascus Textile The modern industries company 101,500 1,500 100,000 06 Damascus Textile the general company for carpets ( Housh
blas )8,800 8,800 0 0
7 Rural Damascus Textile orient company for underwear "Al Sharq " 200,000 100,000 100,000 08 Rural Damascus Textile the Syrian company for garments " Waseem
"11,500 0 0 11,500
9 Homs Textile Al Waleed spinning company 119,000 119,000 0 010 Homs Textile Homs company for spinning, textile,and
dying44,122 44,122 0 0
11 Hama Textile Hama company for cotton yearns 132,000 132,000 0 012 Hama Textile the general company for wool 83,000 83,000 0 013 Aleppo Textile the general civil company for yarns and
textile " al Ahlyiah "88,000 88,000 0 0
14 Aleppo Textile the Syrian company for weaving and textile 52,738 52,738 0 015 Aleppo Textile Al Shahbaa company for weaving and
textile15,200 15,200 0 0
16 Aleppo Textile the industrial company for garments 12,000 0 0 12,00017 Aleppo Textile the Arab company for underwear 32,000 32,000 0 018 Aleppo Textile Aleppo silk company " Satex " 37,850 37,850 0 019 Idleb Textile the general company for cotton yearns 53,000 53,000 0 020 Idleb Textile Idleb weaving company 48,000 48,000 0 021 Lattakia Textile Lattakia weaving company 60,000 60,000 0 022 Lattakia Textile the general company for cotton yarns 303,468 0 303,468 023 Aleppo Textile Jableh modern company of weaving 295,200 295,200 0 024 Deir-ez-Zor Textile Al Furat weaving company 137,752 * 0 0 137,75225 Hassakeh Textile Al Hasakeh weaving company 295 0 0 295
Wastewater (m3/year)Typeof
industryNo. Governorate Production
Items Name of Factory Total
Tobaccoindustries
Sugarindustries
Textileindustries
Foodindusties
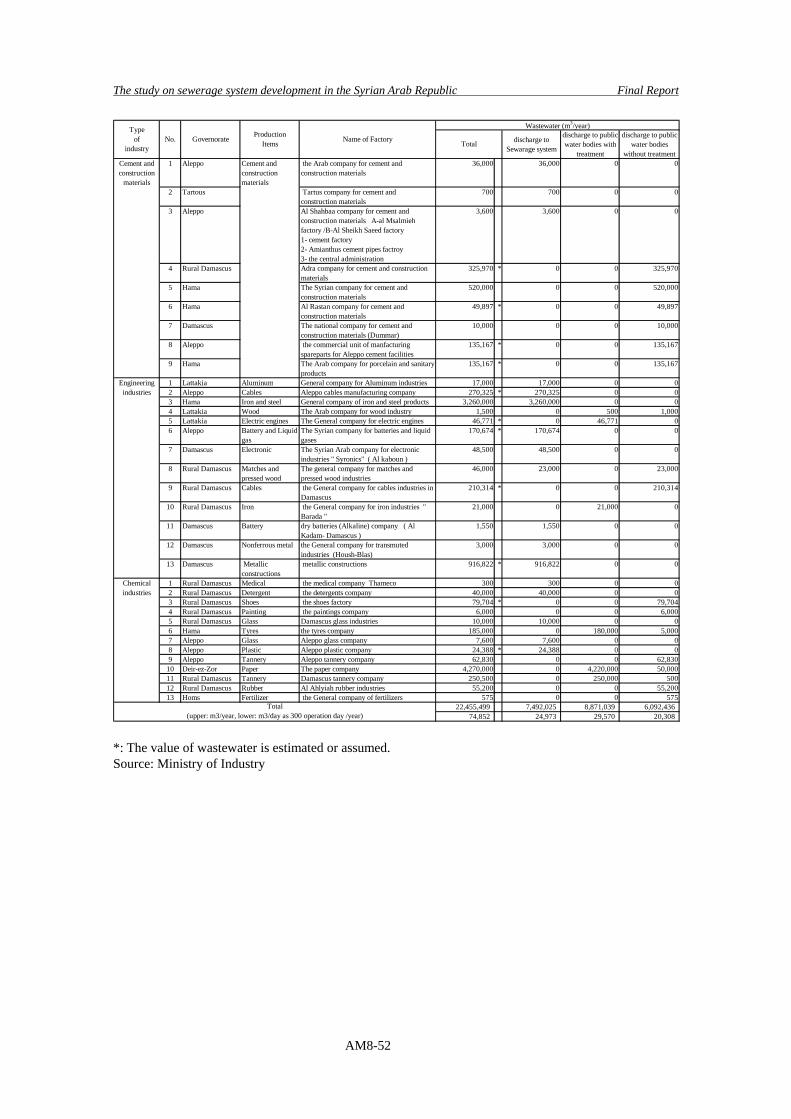
The study on sewerage system development in the Syrian Arab Republic Final Report
AM8-52
discharge toSewarage system
discharge to publicwater bodies with
treatment
discharge to publicwater bodies
without treatment1 Aleppo the Arab company for cement and
construction materials36,000 36,000 0 0
2 Tartous Tartus company for cement andconstruction materials
700 700 0 0
Al Shahbaa company for cement andconstruction materials A-al Msalmiehfactory /B-Al Sheikh Saeed factory1- cement factory2- Amianthus cement pipes factroy3- the central administration
4 Rural Damascus Adra company for cement and constructionmaterials
325,970 * 0 0 325,970
5 Hama The Syrian company for cement andconstruction materials
520,000 0 0 520,000
6 Hama Al Rastan company for cement andconstruction materials
49,897 * 0 0 49,897
7 Damascus The national company for cement andconstruction materials (Dummar)
10,000 0 0 10,000
8 Aleppo the commercial unit of manfacturingspareparts for Aleppo cement facilities
135,167 * 0 0 135,167
9 Hama The Arab company for porcelain and sanitaryproducts
135,167 * 0 0 135,167
1 Lattakia Aluminum General company for Aluminum industries 17,000 17,000 0 02 Aleppo Cables Aleppo cables manufacturing company 270,325 * 270,325 0 03 Hama Iron and steel General company of iron and steel products 3,260,000 3,260,000 0 04 Lattakia Wood The Arab company for wood industry 1,500 0 500 1,0005 Lattakia Electric engines The General company for electric engines 46,771 * 0 46,771 06 Aleppo Battery and Liquid
gasThe Syrian company for batteries and liquidgases
170,674 * 170,674 0 0
7 Damascus Electronic The Syrian Arab company for electronicindustries " Syronics" ( Al kaboun )
48,500 48,500 0 0
8 Rural Damascus Matches andpressed wood
The general company for matches andpressed wood industries
46,000 23,000 0 23,000
9 Rural Damascus Cables the General company for cables industries inDamascus
210,314 * 0 0 210,314
10 Rural Damascus Iron the General company for iron industries "Barada "
21,000 0 21,000 0
11 Damascus Battery dry batteries (Alkaline) company ( AlKadam- Damascus )
1,550 1,550 0 0
12 Damascus Nonferrous metal the General company for transmutedindustries (Housh-Blas)
3,000 3,000 0 0
13 Damascus Metallicconstructions
metallic constructions 916,822 * 916,822 0 0
1 Rural Damascus Medical the medical company Thameco 300 300 0 02 Rural Damascus Detergent the detergents company 40,000 40,000 0 03 Rural Damascus Shoes the shoes factory 79,704 * 0 0 79,7044 Rural Damascus Painting the paintings company 6,000 0 0 6,0005 Rural Damascus Glass Damascus glass industries 10,000 10,000 0 06 Hama Tyres the tyres company 185,000 0 180,000 5,0007 Aleppo Glass Aleppo glass company 7,600 7,600 0 08 Aleppo Plastic Aleppo plastic company 24,388 * 24,388 0 09 Aleppo Tannery Aleppo tannery company 62,830 0 0 62,830
10 Deir-ez-Zor Paper The paper company 4,270,000 0 4,220,000 50,00011 Rural Damascus Tannery Damascus tannery company 250,500 0 250,000 50012 Rural Damascus Rubber Al Ahlyiah rubber industries 55,200 0 0 55,20013 Homs Fertilizer the General company of fertilizers 575 0 0 575
22,455,499 7,492,025 8,871,039 6,092,43674,852 24,973 29,570 20,308
0
Cement andconstructionmaterials
Wastewater (m3/year)
Aleppo 3,600
Typeof
industry
3
No. Governorate ProductionItems Name of Factory
3,600
Engineeringindustries
Total
Chemicalindustries
Total(upper: m3/year, lower: m3/day as 300 operation day /year)
0
Cement andconstruction
materials
*: The value of wastewater is estimated or assumed. Source: Ministry of Industry
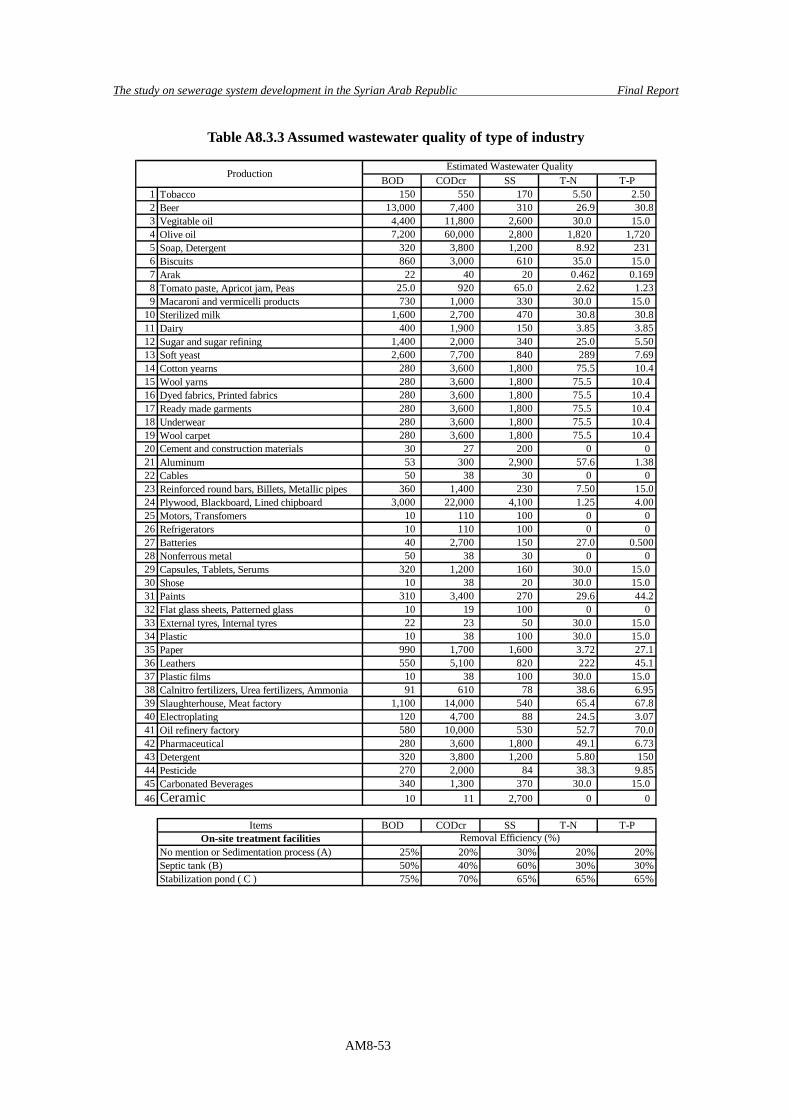
The study on sewerage system development in the Syrian Arab Republic Final Report
AM8-53
Table A8.3.3 Assumed wastewater quality of type of industry
BOD CODcr SS T-N T-P1 Tobacco 150 550 170 5.50 2.50 2 Beer 13,000 7,400 310 26.9 30.83 Vegitable oil 4,400 11,800 2,600 30.0 15.0 4 Olive oil 7,200 60,000 2,800 1,820 1,720 5 Soap, Detergent 320 3,800 1,200 8.92 231 6 Biscuits 860 3,000 610 35.0 15.0 7 Arak 22 40 20 0.462 0.1698 Tomato paste, Apricot jam, Peas 25.0 920 65.0 2.62 1.239 Macaroni and vermicelli products 730 1,000 330 30.0 15.0
10 Sterilized milk 1,600 2,700 470 30.8 30.811 Dairy 400 1,900 150 3.85 3.8512 Sugar and sugar refining 1,400 2,000 340 25.0 5.5013 Soft yeast 2,600 7,700 840 289 7.6914 Cotton yearns 280 3,600 1,800 75.5 10.415 Wool yarns 280 3,600 1,800 75.5 10.4 16 Dyed fabrics, Printed fabrics 280 3,600 1,800 75.5 10.4 17 Ready made garments 280 3,600 1,800 75.5 10.4 18 Underwear 280 3,600 1,800 75.5 10.4 19 Wool carpet 280 3,600 1,800 75.5 10.4 20 Cement and construction materials 30 27 200 0 021 Aluminum 53 300 2,900 57.6 1.3822 Cables 50 38 30 0 023 Reinforced round bars, Billets, Metallic pipes 360 1,400 230 7.50 15.024 Plywood, Blackboard, Lined chipboard 3,000 22,000 4,100 1.25 4.0025 Motors, Transfomers 10 110 100 0 026 Refrigerators 10 110 100 0 027 Batteries 40 2,700 150 27.0 0.50028 Nonferrous metal 50 38 30 0 029 Capsules, Tablets, Serums 320 1,200 160 30.0 15.0 30 Shose 10 38 20 30.0 15.0 31 Paints 310 3,400 270 29.6 44.232 Flat glass sheets, Patterned glass 10 19 100 0 033 External tyres, Internal tyres 22 23 50 30.0 15.0 34 Plastic 10 38 100 30.0 15.0 35 Paper 990 1,700 1,600 3.72 27.136 Leathers 550 5,100 820 222 45.137 Plastic films 10 38 100 30.0 15.0 38 Calnitro fertilizers, Urea fertilizers, Ammonia 91 610 78 38.6 6.9539 Slaughterhouse, Meat factory 1,100 14,000 540 65.4 67.840 Electroplating 120 4,700 88 24.5 3.0741 Oil refinery factory 580 10,000 530 52.7 70.042 Pharmaceutical 280 3,600 1,800 49.1 6.7343 Detergent 320 3,800 1,200 5.80 15044 Pesticide 270 2,000 84 38.3 9.8545 Carbonated Beverages 340 1,300 370 30.0 15.0 46 Ceramic 10 11 2,700 0 0
Items BOD CODcr SS T-N T-POn-site treatment facilities
No mention or Sedimentation process (A) 25% 20% 30% 20% 20%Septic tank (B) 50% 40% 60% 30% 30%Stabilization pond ( C ) 75% 70% 65% 65% 65%
Removal Efficiency (%)
Estimated Wastewater QualityProduction
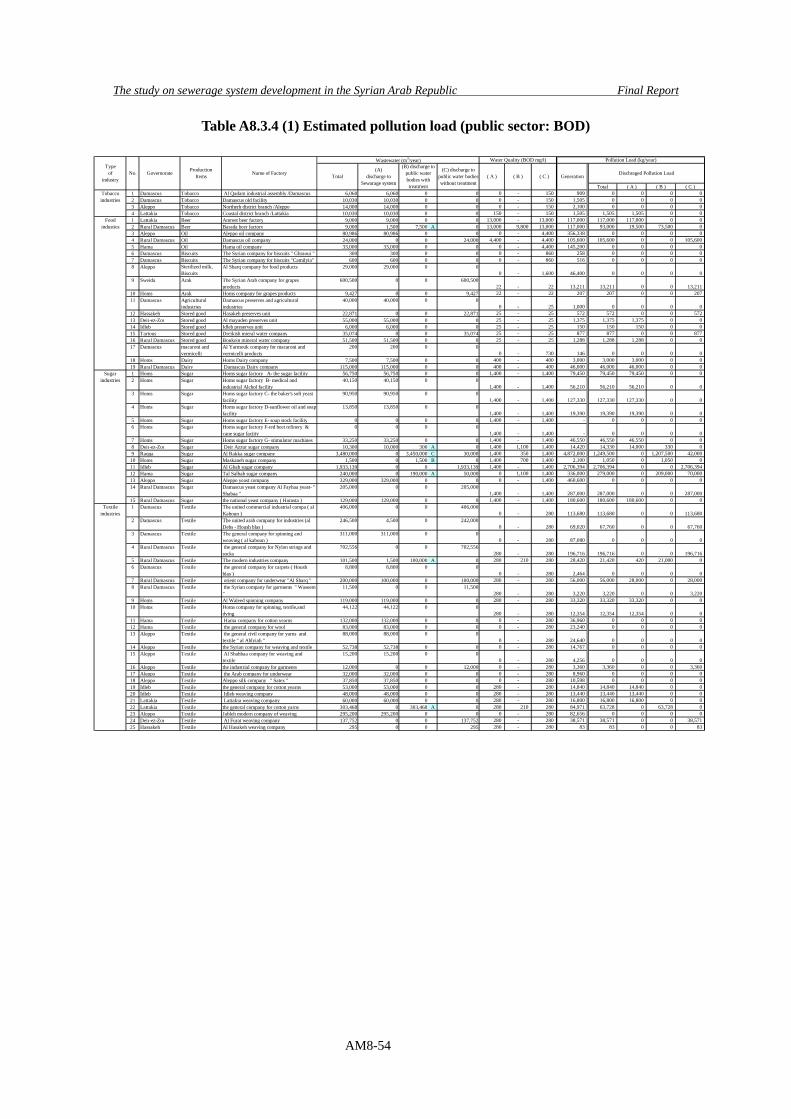
The study on sewerage system development in the Syrian Arab Republic Final Report
AM8-54
Table A8.3.4 (1) Estimated pollution load (public sector: BOD)
Total ( A ) ( B ) ( C )1 Damascus Tobacco Al Qadam industrial assembly /Damascus 6,060 6,060 0 0 0 - 150 909 0 0 0 02 Damascus Tobacco Damascus old facility 10,030 10,030 0 0 0 - 150 1,505 0 0 0 03 Aleppo Tobacco Northerh district branch /Aleppo 14,000 14,000 0 0 0 - 150 2,100 0 0 0 04 Lattakia Tobacco Coastal district branch /Lattakia 10,030 10,030 0 0 150 - 150 1,505 1,505 1,505 0 01 Lattakia Beer Amreet beer factory 9,000 9,000 0 0 13,000 - 13,000 117,000 117,000 117,000 0 02 Rural Damascus Beer Barada beer factory 9,000 1,500 7,500 A 0 13,000 9,800 13,000 117,000 93,000 19,500 73,500 03 Aleppo Oil Aleppo oil company 80,986 80,986 0 0 0 - 4,400 356,338 0 0 0 04 Rural Damascus Oil Damascus oil company 24,000 0 0 24,000 4,400 - 4,400 105,600 105,600 0 0 105,6005 Hama Oil Hama oil company 33,000 33,000 0 0 0 - 4,400 145,200 0 0 0 06 Damascus Biscuits The Syrian company for biscuits " Ghraoui " 300 300 0 0 0 - 860 258 0 0 0 07 Damascus Biscuits The Syrian company for biscuits "Camilyia" 600 600 0 0 0 - 860 516 0 0 0 08 Aleppo Sterilized milk,
BiscuitsAl Sharq company for food products 29,000 29,000 0 0
0 - 1,600 46,400 0 0 0 09 Sweida Arak The Syrian Arab company for grapes
products600,500 0 0 600,500
22 - 22 13,211 13,211 0 0 13,21110 Homs Arak Homs company for grapes products 9,427 0 0 9,427 22 - 22 207 207 0 0 20711 Damascus Agricultural
industriesDamascus preserves and agriculturalindustries
40,000 40,000 0 00 - 25 1,000 0 0 0 0
12 Hassakeh Stored good Hasakeh preserves unit 22,871 0 0 22,871 25 - 25 572 572 0 0 57213 Deir-ez-Zor Stored good Al mayaden preserves unit 55,000 55,000 0 0 25 - 25 1,375 1,375 1,375 0 014 Idleb Stored good Idleb preserves unit 6,000 6,000 0 0 25 - 25 150 150 150 0 015 Tartous Stored good Dreikish mieral water company 35,074 0 0 35,074 25 - 25 877 877 0 0 87716 Rural Damascus Stored good Boukein mineral water company 51,500 51,500 0 0 25 - 25 1,288 1,288 1,288 0 017 Damascus macaroni and
vermicelliAl Yarmouk company for macaroni andvermicelli products
200 200 0 00 - 730 146 0 0 0 0
18 Homs Dairy Homs Dairy company 7,500 7,500 0 0 400 - 400 3,000 3,000 3,000 0 019 Rural Damascus Dairy Damascus Dairy company 115,000 115,000 0 0 400 - 400 46,000 46,000 46,000 0 01 Homs Sugar Homs sugar factory A- the sugar facility 56,750 56,750 0 0 1,400 - 1,400 79,450 79,450 79,450 0 02 Homs Sugar Homs sugar factory B- medical and
industrial Alchol facility40,150 40,150 0 0
1,400 - 1,400 56,210 56,210 56,210 0 03 Homs Sugar Homs sugar factory C- the baker's soft yeast
facility90,950 90,950 0 0
1,400 - 1,400 127,330 127,330 127,330 0 04 Homs Sugar Homs sugar factory D-sunflower oil and soap
facility13,850 13,850 0 0
1,400 - 1,400 19,390 19,390 19,390 0 05 Homs Sugar Homs sugar factory E- soap stock facility 0 0 0 0 1,400 - 1,400 - 0 0 0 06 Homs Sugar Homs sugar factory F-red beet refinery &
cane sugar faciity0 0 0 0
1,400 - 1,400 - 0 0 0 07 Homs Sugar Homs sugar factory G- stimulator machines 33,250 33,250 0 0 1,400 - 1,400 46,550 46,550 46,550 0 08 Deir-ez-Zor Sugar Deir Azzur sugar company 10,300 10,000 300 A 0 1,400 1,100 1,400 14,420 14,330 14,000 330 09 Raqqa Sugar Al Rakka sugar company 3,480,000 0 3,450,000 C 30,000 1,400 350 1,400 4,872,000 1,249,500 0 1,207,500 42,000
10 Homs Sugar Maskaneh sugar company 1,500 0 1,500 B 0 1,400 700 1,400 2,100 1,050 0 1,050 011 Idleb Sugar Al Ghab sugar company 1,933,139 0 0 1,933,139 1,400 - 1,400 2,706,394 2,706,394 0 0 2,706,39412 Hama Sugar Tal Salhab sugar company 240,000 0 190,000 A 50,000 0 1,100 1,400 336,000 279,000 0 209,000 70,00013 Aleppo Sugar Aleppo yeast company 329,000 329,000 0 0 0 - 1,400 460,600 0 0 0 014 Rural Damascus Sugar Damascus yeast company Al Fayhaa yeast- "
Shabaa "205,000 0 0 205,000
1,400 - 1,400 287,000 287,000 0 0 287,00015 Rural Damascus Sugar the national yeast company ( Harasta ) 129,000 129,000 0 0 1,400 - 1,400 180,600 180,600 180,600 0 01 Damascus Textile The united commercial industrial compa ( al
Kaboun )406,000 0 0 406,000
0 - 280 113,680 113,680 0 0 113,6802 Damascus Textile The united arab company for industries (al
Debs - Housh blas )246,500 4,500 0 242,000
0 - 280 69,020 67,760 0 0 67,7603 Damascus Textile The general company for spinning and
weaving ( al kaboun )311,000 311,000 0 0
0 - 280 87,080 0 0 0 04 Rural Damascus Textile the general company for Nylon strings and
socks702,556 0 0 702,556
280 - 280 196,716 196,716 0 0 196,7165 Rural Damascus Textile The modern industries company 101,500 1,500 100,000 A 0 280 210 280 28,420 21,420 420 21,000 06 Damascus Textile the general company for carpets ( Housh
blas )8,800 8,800 0 0
0 - 280 2,464 0 0 0 07 Rural Damascus Textile orient company for underwear "Al Sharq " 200,000 100,000 0 100,000 280 - 280 56,000 56,000 28,000 0 28,0008 Rural Damascus Textile the Syrian company for garments " Waseem
"11,500 0 0 11,500
280 - 280 3,220 3,220 0 0 3,2209 Homs Textile Al Waleed spinning company 119,000 119,000 0 0 280 - 280 33,320 33,320 33,320 0 0
10 Homs Textile Homs company for spinning, textile,anddying
44,122 44,122 0 0280 - 280 12,354 12,354 12,354 0 0
11 Hama Textile Hama company for cotton yearns 132,000 132,000 0 0 0 - 280 36,960 0 0 0 012 Hama Textile the general company for wool 83,000 83,000 0 0 0 - 280 23,240 0 0 0 013 Aleppo Textile the general civil company for yarns and
textile " al Ahlyiah "88,000 88,000 0 0
0 - 280 24,640 0 0 0 014 Aleppo Textile the Syrian company for weaving and textile 52,738 52,738 0 0 0 - 280 14,767 0 0 0 015 Aleppo Textile Al Shahbaa company for weaving and
textile15,200 15,200 0 0
0 - 280 4,256 0 0 0 016 Aleppo Textile the industrial company for garments 12,000 0 0 12,000 0 - 280 3,360 3,360 0 0 3,36017 Aleppo Textile the Arab company for underwear 32,000 32,000 0 0 0 - 280 8,960 0 0 0 018 Aleppo Textile Aleppo silk company " Satex " 37,850 37,850 0 0 0 - 280 10,598 0 0 0 019 Idleb Textile the general company for cotton yearns 53,000 53,000 0 0 280 - 280 14,840 14,840 14,840 0 020 Idleb Textile Idleb weaving company 48,000 48,000 0 0 280 - 280 13,440 13,440 13,440 0 021 Lattakia Textile Lattakia weaving company 60,000 60,000 0 0 280 - 280 16,800 16,800 16,800 0 022 Lattakia Textile the general company for cotton yarns 303,468 0 303,468 A 0 280 210 280 84,971 63,728 0 63,728 023 Aleppo Textile Jableh modern company of weaving 295,200 295,200 0 0 0 - 280 82,656 0 0 0 024 Deir-ez-Zor Textile Al Furat weaving company 137,752 0 0 137,752 280 - 280 38,571 38,571 0 0 38,57125 Hassakeh Textile Al Hasakeh weaving company 295 0 0 295 280 - 280 83 83 0 0 83
Foodindusties
(B) discharge topublic waterbodies withtreatment
Tobaccoindustries
Sugarindustries
Textileindustries
Dischraged Pollution Load(C) discharge topublic water bodieswithout treatment
( A ) ( B ) ( C )
Wastewater (m3/year)
Generation(A)
discharge toSewarage system
Total
Typeof
industryNo. Governorate Production
Items Name of Factory
Water Quality (BOD mg/l) Pollution Load (kg/year)
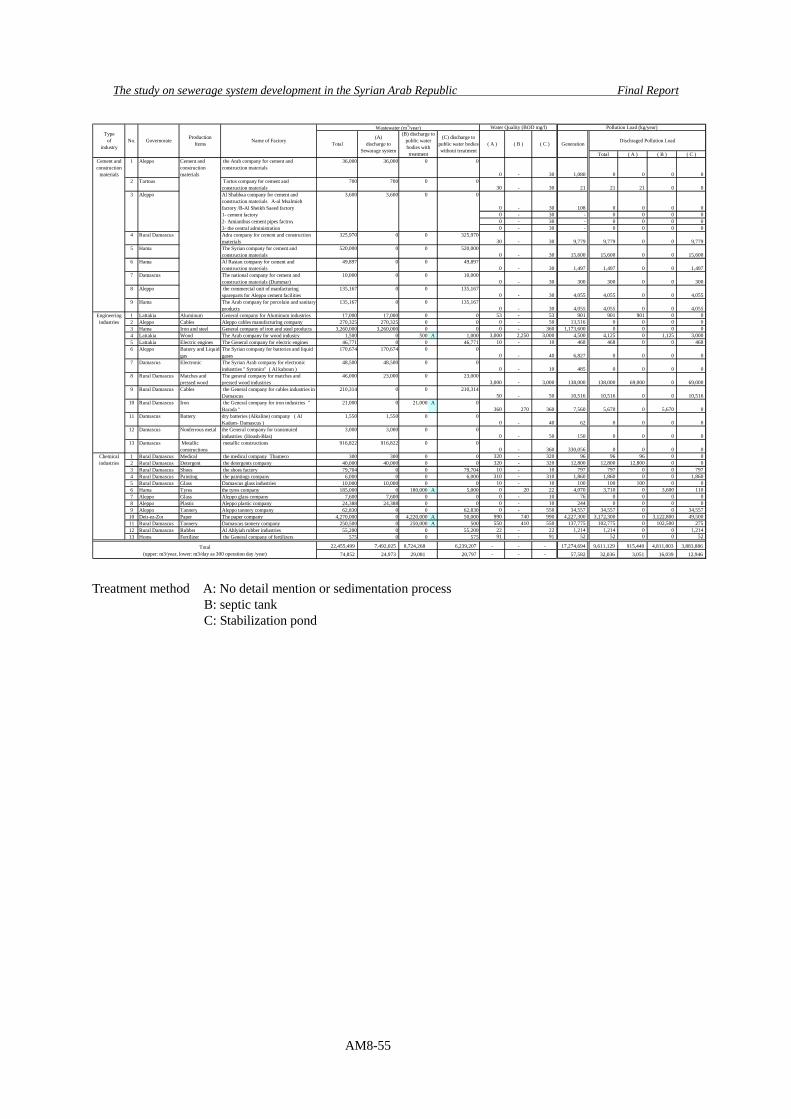
The study on sewerage system development in the Syrian Arab Republic Final Report
AM8-55
Total ( A ) ( B ) ( C )1 Aleppo the Arab company for cement and
construction materials36,000 36,000 0 0
0 - 30 1,080 0 0 0 02 Tartous Tartus company for cement and
construction materials700 700 0 0
30 - 30 21 21 21 0 0Al Shahbaa company for cement andconstruction materials A-al Msalmiehfactory /B-Al Sheikh Saeed factory 0 - 30 108 0 0 0 01- cement factory 0 - 30 - 0 0 0 02- Amianthus cement pipes factroy 0 - 30 - 0 0 0 03- the central administration 0 - 30 - 0 0 0 0
4 Rural Damascus Adra company for cement and constructionmaterials
325,970 0 0 325,97030 - 30 9,779 9,779 0 0 9,779
5 Hama The Syrian company for cement andconstruction materials
520,000 0 0 520,0000 - 30 15,600 15,600 0 0 15,600
6 Hama Al Rastan company for cement andconstruction materials
49,897 0 0 49,8970 - 30 1,497 1,497 0 0 1,497
7 Damascus The national company for cement andconstruction materials (Dummar)
10,000 0 0 10,0000 - 30 300 300 0 0 300
8 Aleppo the commercial unit of manfacturingspareparts for Aleppo cement facilities
135,167 0 0 135,1670 - 30 4,055 4,055 0 0 4,055
9 Hama The Arab company for porcelain and sanitaryproducts
135,167 0 0 135,1670 - 30 4,055 4,055 0 0 4,055
1 Lattakia Aluminum General company for Aluminum industries 17,000 17,000 0 0 53 - 53 901 901 901 0 02 Aleppo Cables Aleppo cables manufacturing company 270,325 270,325 0 0 0 - 50 13,516 0 0 0 03 Hama Iron and steel General company of iron and steel products 3,260,000 3,260,000 0 0 0 - 360 1,173,600 0 0 0 04 Lattakia Wood The Arab company for wood industry 1,500 0 500 A 1,000 3,000 2,250 3,000 4,500 4,125 0 1,125 3,0005 Lattakia Electric engines The General company for electric engines 46,771 0 0 46,771 10 - 10 468 468 0 0 4686 Aleppo Battery and Liquid
gasThe Syrian company for batteries and liquidgases
170,674 170,674 0 00 - 40 6,827 0 0 0 0
7 Damascus Electronic The Syrian Arab company for electronicindustries " Syronics" ( Al kaboun )
48,500 48,500 0 00 - 10 485 0 0 0 0
8 Rural Damascus Matches andpressed wood
The general company for matches andpressed wood industries
46,000 23,000 0 23,0003,000 - 3,000 138,000 138,000 69,000 0 69,000
9 Rural Damascus Cables the General company for cables industries inDamascus
210,314 0 0 210,31450 - 50 10,516 10,516 0 0 10,516
10 Rural Damascus Iron the General company for iron industries "Barada "
21,000 0 21,000 A 0360 270 360 7,560 5,670 0 5,670 0
11 Damascus Battery dry batteries (Alkaline) company ( AlKadam- Damascus )
1,550 1,550 0 00 - 40 62 0 0 0 0
12 Damascus Nonferrous metal the General company for transmutedindustries (Housh-Blas)
3,000 3,000 0 00 - 50 150 0 0 0 0
13 Damascus Metallicconstructions
metallic constructions 916,822 916,822 0 00 - 360 330,056 0 0 0 0
1 Rural Damascus Medical the medical company Thameco 300 300 0 0 320 - 320 96 96 96 0 02 Rural Damascus Detergent the detergents company 40,000 40,000 0 0 320 - 320 12,800 12,800 12,800 0 03 Rural Damascus Shoes the shoes factory 79,704 0 0 79,704 10 - 10 797 797 0 0 7974 Rural Damascus Painting the paintings company 6,000 0 0 6,000 310 - 310 1,860 1,860 0 0 1,8605 Rural Damascus Glass Damascus glass industries 10,000 10,000 0 0 10 - 10 100 100 100 0 06 Hama Tyres the tyres company 185,000 0 180,000 A 5,000 0 20 22 4,070 3,710 0 3,600 1107 Aleppo Glass Aleppo glass company 7,600 7,600 0 0 0 - 10 76 0 0 0 08 Aleppo Plastic Aleppo plastic company 24,388 24,388 0 0 0 - 10 244 0 0 0 09 Aleppo Tannery Aleppo tannery company 62,830 0 0 62,830 0 - 550 34,557 34,557 0 0 34,557
10 Deir-ez-Zor Paper The paper company 4,270,000 0 4,220,000 A 50,000 990 740 990 4,227,300 3,172,300 0 3,122,800 49,50011 Rural Damascus Tannery Damascus tannery company 250,500 0 250,000 A 500 550 410 550 137,775 102,775 0 102,500 27512 Rural Damascus Rubber Al Ahlyiah rubber industries 55,200 0 0 55,200 22 - 22 1,214 1,214 0 0 1,21413 Homs Fertilizer the General company of fertilizers 575 0 0 575 91 - 91 52 52 0 0 52
22,455,499 7,492,025 8,724,268 6,239,207 - - - 17,274,694 9,611,129 915,440 4,811,803 3,883,88674,852 24,973 29,081 20,797 - - - 57,582 32,036 3,051 16,039 12,946
Engineeringindustries
Chemicalindustries
(B) discharge topublic waterbodies withtreatment
Total(upper: m3/year, lower: m3/day as 300 operation day /year)
0Aleppo 3,6003 3,600
Cement andconstruction
materials
Dischraged Pollution Load(C) discharge topublic water bodieswithout treatment
( A ) ( B ) ( C )
0
Cement andconstructionmaterials
Wastewater (m3/year)
Generation(A)
discharge toSewarage system
Total
Typeof
industryNo. Governorate Production
Items Name of Factory
Water Quality (BOD mg/l) Pollution Load (kg/year)
Treatment method A: No detail mention or sedimentation process B: septic tank C: Stabilization pond
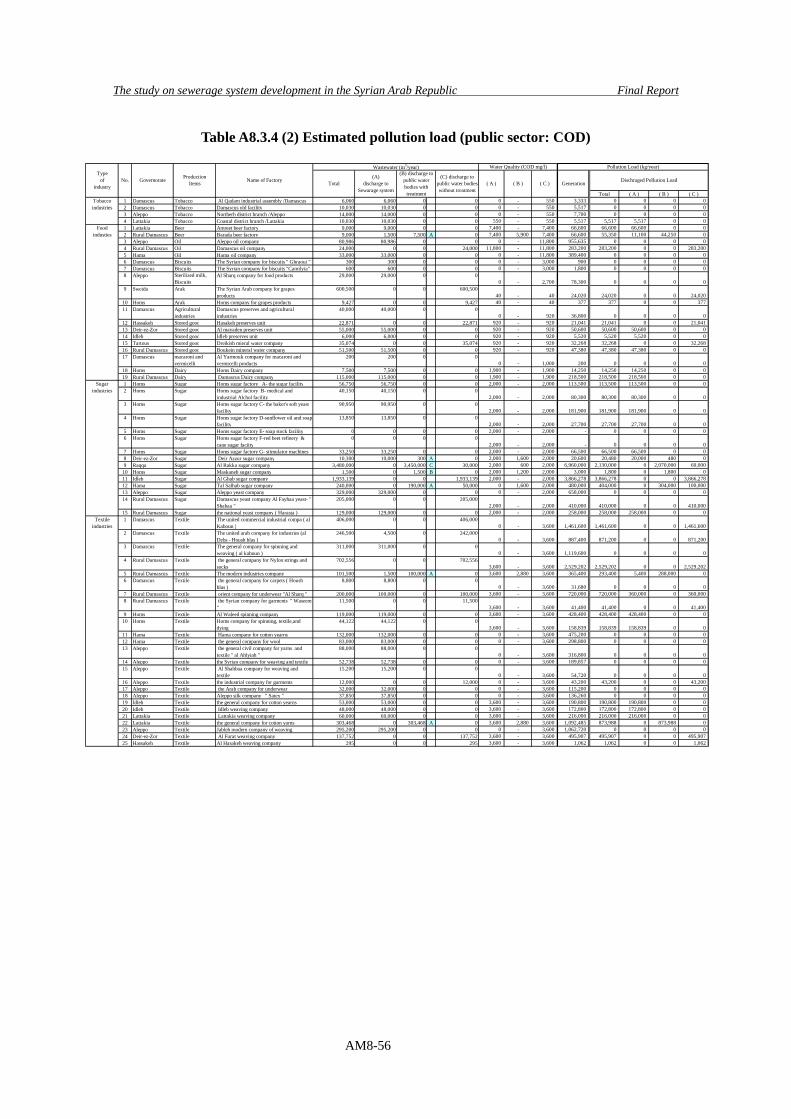
The study on sewerage system development in the Syrian Arab Republic Final Report
AM8-56
Table A8.3.4 (2) Estimated pollution load (public sector: COD)
Total ( A ) ( B ) ( C )1 Damascus Tobacco Al Qadam industrial assembly /Damascus 6,060 6,060 0 0 0 - 550 3,333 0 0 0 02 Damascus Tobacco Damascus old facility 10,030 10,030 0 0 0 - 550 5,517 0 0 0 03 Aleppo Tobacco Northerh district branch /Aleppo 14,000 14,000 0 0 0 - 550 7,700 0 0 0 04 Lattakia Tobacco Coastal district branch /Lattakia 10,030 10,030 0 0 550 - 550 5,517 5,517 5,517 0 01 Lattakia Beer Amreet beer factory 9,000 9,000 0 0 7,400 - 7,400 66,600 66,600 66,600 0 02 Rural Damascus Beer Barada beer factory 9,000 1,500 7,500 A 0 7,400 5,900 7,400 66,600 55,350 11,100 44,250 03 Aleppo Oil Aleppo oil company 80,986 80,986 0 0 0 - 11,800 955,635 0 0 0 04 Rural Damascus Oil Damascus oil company 24,000 0 0 24,000 11,800 - 11,800 283,200 283,200 0 0 283,2005 Hama Oil Hama oil company 33,000 33,000 0 0 0 - 11,800 389,400 0 0 0 06 Damascus Biscuits The Syrian company for biscuits " Ghraoui " 300 300 0 0 0 - 3,000 900 0 0 0 07 Damascus Biscuits The Syrian company for biscuits "Camilyia" 600 600 0 0 0 - 3,000 1,800 0 0 0 08 Aleppo Sterilized milk,
BiscuitsAl Sharq company for food products 29,000 29,000 0 0
0 - 2,700 78,300 0 0 0 09 Sweida Arak The Syrian Arab company for grapes
products600,500 0 0 600,500
40 - 40 24,020 24,020 0 0 24,02010 Homs Arak Homs company for grapes products 9,427 0 0 9,427 40 - 40 377 377 0 0 37711 Damascus Agricultural
industriesDamascus preserves and agriculturalindustries
40,000 40,000 0 00 - 920 36,800 0 0 0 0
12 Hassakeh Stored good Hasakeh preserves unit 22,871 0 0 22,871 920 - 920 21,041 21,041 0 0 21,04113 Deir-ez-Zor Stored good Al mayaden preserves unit 55,000 55,000 0 0 920 - 920 50,600 50,600 50,600 0 014 Idleb Stored good Idleb preserves unit 6,000 6,000 0 0 920 - 920 5,520 5,520 5,520 0 015 Tartous Stored good Dreikish mieral water company 35,074 0 0 35,074 920 - 920 32,268 32,268 0 0 32,26816 Rural Damascus Stored good Boukein mineral water company 51,500 51,500 0 0 920 - 920 47,380 47,380 47,380 0 017 Damascus macaroni and
vermicelliAl Yarmouk company for macaroni andvermicelli products
200 200 0 00 - 1,000 200 0 0 0 0
18 Homs Dairy Homs Dairy company 7,500 7,500 0 0 1,900 - 1,900 14,250 14,250 14,250 0 019 Rural Damascus Dairy Damascus Dairy company 115,000 115,000 0 0 1,900 - 1,900 218,500 218,500 218,500 0 01 Homs Sugar Homs sugar factory A- the sugar facility 56,750 56,750 0 0 2,000 - 2,000 113,500 113,500 113,500 0 02 Homs Sugar Homs sugar factory B- medical and
industrial Alchol facility40,150 40,150 0 0
2,000 - 2,000 80,300 80,300 80,300 0 03 Homs Sugar Homs sugar factory C- the baker's soft yeast
facility90,950 90,950 0 0
2,000 - 2,000 181,900 181,900 181,900 0 04 Homs Sugar Homs sugar factory D-sunflower oil and soap
facility13,850 13,850 0 0
2,000 - 2,000 27,700 27,700 27,700 0 05 Homs Sugar Homs sugar factory E- soap stock facility 0 0 0 0 2,000 - 2,000 - 0 0 0 06 Homs Sugar Homs sugar factory F-red beet refinery &
cane sugar faciity0 0 0 0
2,000 - 2,000 - 0 0 0 07 Homs Sugar Homs sugar factory G- stimulator machines 33,250 33,250 0 0 2,000 - 2,000 66,500 66,500 66,500 0 08 Deir-ez-Zor Sugar Deir Azzur sugar company 10,300 10,000 300 A 0 2,000 1,600 2,000 20,600 20,480 20,000 480 09 Raqqa Sugar Al Rakka sugar company 3,480,000 0 3,450,000 C 30,000 2,000 600 2,000 6,960,000 2,130,000 0 2,070,000 60,000
10 Homs Sugar Maskaneh sugar company 1,500 0 1,500 B 0 2,000 1,200 2,000 3,000 1,800 0 1,800 011 Idleb Sugar Al Ghab sugar company 1,933,139 0 0 1,933,139 2,000 - 2,000 3,866,278 3,866,278 0 0 3,866,27812 Hama Sugar Tal Salhab sugar company 240,000 0 190,000 A 50,000 0 1,600 2,000 480,000 404,000 0 304,000 100,00013 Aleppo Sugar Aleppo yeast company 329,000 329,000 0 0 0 - 2,000 658,000 0 0 0 014 Rural Damascus Sugar Damascus yeast company Al Fayhaa yeast- "
Shabaa "205,000 0 0 205,000
2,000 - 2,000 410,000 410,000 0 0 410,00015 Rural Damascus Sugar the national yeast company ( Harasta ) 129,000 129,000 0 0 2,000 - 2,000 258,000 258,000 258,000 0 01 Damascus Textile The united commercial industrial compa ( al
Kaboun )406,000 0 0 406,000
0 - 3,600 1,461,600 1,461,600 0 0 1,461,6002 Damascus Textile The united arab company for industries (al
Debs - Housh blas )246,500 4,500 0 242,000
0 - 3,600 887,400 871,200 0 0 871,2003 Damascus Textile The general company for spinning and
weaving ( al kaboun )311,000 311,000 0 0
0 - 3,600 1,119,600 0 0 0 04 Rural Damascus Textile the general company for Nylon strings and
socks702,556 0 0 702,556
3,600 - 3,600 2,529,202 2,529,202 0 0 2,529,2025 Rural Damascus Textile The modern industries company 101,500 1,500 100,000 A 0 3,600 2,880 3,600 365,400 293,400 5,400 288,000 06 Damascus Textile the general company for carpets ( Housh
blas )8,800 8,800 0 0
0 - 3,600 31,680 0 0 0 07 Rural Damascus Textile orient company for underwear "Al Sharq " 200,000 100,000 0 100,000 3,600 - 3,600 720,000 720,000 360,000 0 360,0008 Rural Damascus Textile the Syrian company for garments " Waseem
"11,500 0 0 11,500
3,600 - 3,600 41,400 41,400 0 0 41,4009 Homs Textile Al Waleed spinning company 119,000 119,000 0 0 3,600 - 3,600 428,400 428,400 428,400 0 0
10 Homs Textile Homs company for spinning, textile,anddying
44,122 44,122 0 03,600 - 3,600 158,839 158,839 158,839 0 0
11 Hama Textile Hama company for cotton yearns 132,000 132,000 0 0 0 - 3,600 475,200 0 0 0 012 Hama Textile the general company for wool 83,000 83,000 0 0 0 - 3,600 298,800 0 0 0 013 Aleppo Textile the general civil company for yarns and
textile " al Ahlyiah "88,000 88,000 0 0
0 - 3,600 316,800 0 0 0 014 Aleppo Textile the Syrian company for weaving and textile 52,738 52,738 0 0 0 - 3,600 189,857 0 0 0 015 Aleppo Textile Al Shahbaa company for weaving and
textile15,200 15,200 0 0
0 - 3,600 54,720 0 0 0 016 Aleppo Textile the industrial company for garments 12,000 0 0 12,000 0 - 3,600 43,200 43,200 0 0 43,20017 Aleppo Textile the Arab company for underwear 32,000 32,000 0 0 0 - 3,600 115,200 0 0 0 018 Aleppo Textile Aleppo silk company " Satex " 37,850 37,850 0 0 0 - 3,600 136,260 0 0 0 019 Idleb Textile the general company for cotton yearns 53,000 53,000 0 0 3,600 - 3,600 190,800 190,800 190,800 0 020 Idleb Textile Idleb weaving company 48,000 48,000 0 0 3,600 - 3,600 172,800 172,800 172,800 0 021 Lattakia Textile Lattakia weaving company 60,000 60,000 0 0 3,600 - 3,600 216,000 216,000 216,000 0 022 Lattakia Textile the general company for cotton yarns 303,468 0 303,468 A 0 3,600 2,880 3,600 1,092,485 873,988 0 873,988 023 Aleppo Textile Jableh modern company of weaving 295,200 295,200 0 0 0 - 3,600 1,062,720 0 0 0 024 Deir-ez-Zor Textile Al Furat weaving company 137,752 0 0 137,752 3,600 - 3,600 495,907 495,907 0 0 495,90725 Hassakeh Textile Al Hasakeh weaving company 295 0 0 295 3,600 - 3,600 1,062 1,062 0 0 1,062
(A)discharge to
Sewarage systemTotal
Typeof
industryNo. Governorate Production
Items Name of Factory
Water Quality (COD mg/l) Pollution Load (kg/year)Wastewater (m3/year)
Generation Dischraged Pollution Load(C) discharge topublic water bodieswithout treatment
( A ) ( B ) ( C )
Foodindusties
(B) discharge topublic waterbodies withtreatment
Tobaccoindustries
Sugarindustries
Textileindustries
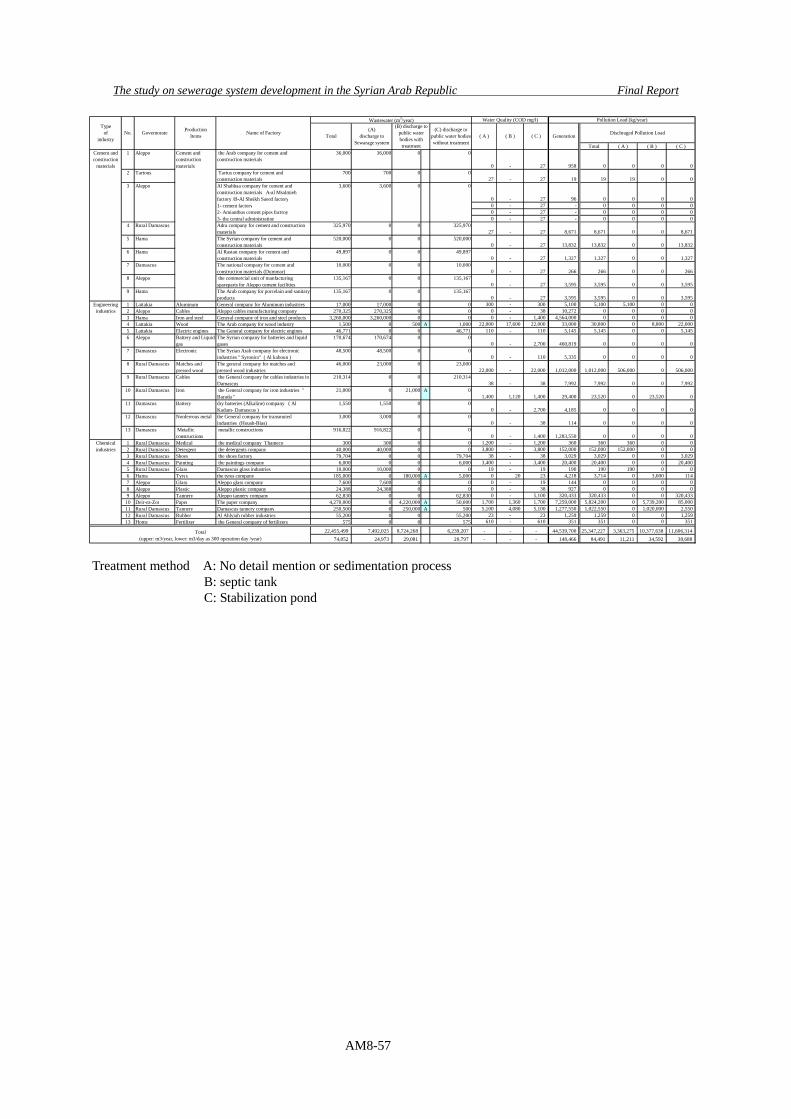
The study on sewerage system development in the Syrian Arab Republic Final Report
AM8-57
Total ( A ) ( B ) ( C )1 Aleppo the Arab company for cement and
construction materials36,000 36,000 0 0
0 - 27 958 0 0 0 02 Tartous Tartus company for cement and
construction materials700 700 0 0
27 - 27 19 19 19 0 0Al Shahbaa company for cement andconstruction materials A-al Msalmiehfactory /B-Al Sheikh Saeed factory 0 - 27 96 0 0 0 01- cement factory 0 - 27 - 0 0 0 02- Amianthus cement pipes factroy 0 - 27 - 0 0 0 03- the central administration 0 - 27 - 0 0 0 0
4 Rural Damascus Adra company for cement and constructionmaterials
325,970 0 0 325,97027 - 27 8,671 8,671 0 0 8,671
5 Hama The Syrian company for cement andconstruction materials
520,000 0 0 520,0000 - 27 13,832 13,832 0 0 13,832
6 Hama Al Rastan company for cement andconstruction materials
49,897 0 0 49,8970 - 27 1,327 1,327 0 0 1,327
7 Damascus The national company for cement andconstruction materials (Dummar)
10,000 0 0 10,0000 - 27 266 266 0 0 266
8 Aleppo the commercial unit of manfacturingspareparts for Aleppo cement facilities
135,167 0 0 135,1670 - 27 3,595 3,595 0 0 3,595
9 Hama The Arab company for porcelain and sanitaryproducts
135,167 0 0 135,1670 - 27 3,595 3,595 0 0 3,595
1 Lattakia Aluminum General company for Aluminum industries 17,000 17,000 0 0 300 - 300 5,100 5,100 5,100 0 02 Aleppo Cables Aleppo cables manufacturing company 270,325 270,325 0 0 0 - 38 10,272 0 0 0 03 Hama Iron and steel General company of iron and steel products 3,260,000 3,260,000 0 0 0 - 1,400 4,564,000 0 0 0 04 Lattakia Wood The Arab company for wood industry 1,500 0 500 A 1,000 22,000 17,600 22,000 33,000 30,800 0 8,800 22,0005 Lattakia Electric engines The General company for electric engines 46,771 0 0 46,771 110 - 110 5,145 5,145 0 0 5,1456 Aleppo Battery and Liquid
gasThe Syrian company for batteries and liquidgases
170,674 170,674 0 00 - 2,700 460,819 0 0 0 0
7 Damascus Electronic The Syrian Arab company for electronicindustries " Syronics" ( Al kaboun )
48,500 48,500 0 00 - 110 5,335 0 0 0 0
8 Rural Damascus Matches andpressed wood
The general company for matches andpressed wood industries
46,000 23,000 0 23,00022,000 - 22,000 1,012,000 1,012,000 506,000 0 506,000
9 Rural Damascus Cables the General company for cables industries inDamascus
210,314 0 0 210,31438 - 38 7,992 7,992 0 0 7,992
10 Rural Damascus Iron the General company for iron industries "Barada "
21,000 0 21,000 A 01,400 1,120 1,400 29,400 23,520 0 23,520 0
11 Damascus Battery dry batteries (Alkaline) company ( AlKadam- Damascus )
1,550 1,550 0 00 - 2,700 4,185 0 0 0 0
12 Damascus Nonferrous metal the General company for transmutedindustries (Housh-Blas)
3,000 3,000 0 00 - 38 114 0 0 0 0
13 Damascus Metallicconstructions
metallic constructions 916,822 916,822 0 00 - 1,400 1,283,550 0 0 0 0
1 Rural Damascus Medical the medical company Thameco 300 300 0 0 1,200 - 1,200 360 360 360 0 02 Rural Damascus Detergent the detergents company 40,000 40,000 0 0 3,800 - 3,800 152,000 152,000 152,000 0 03 Rural Damascus Shoes the shoes factory 79,704 0 0 79,704 38 - 38 3,029 3,029 0 0 3,0294 Rural Damascus Painting the paintings company 6,000 0 0 6,000 3,400 - 3,400 20,400 20,400 0 0 20,4005 Rural Damascus Glass Damascus glass industries 10,000 10,000 0 0 19 - 19 190 190 190 0 06 Hama Tyres the tyres company 185,000 0 180,000 A 5,000 0 20 23 4,218 3,714 0 3,600 1147 Aleppo Glass Aleppo glass company 7,600 7,600 0 0 0 - 19 144 0 0 0 08 Aleppo Plastic Aleppo plastic company 24,388 24,388 0 0 0 - 38 927 0 0 0 09 Aleppo Tannery Aleppo tannery company 62,830 0 0 62,830 0 - 5,100 320,433 320,433 0 0 320,433
10 Deir-ez-Zor Paper The paper company 4,270,000 0 4,220,000 A 50,000 1,700 1,360 1,700 7,259,000 5,824,200 0 5,739,200 85,00011 Rural Damascus Tannery Damascus tannery company 250,500 0 250,000 A 500 5,100 4,080 5,100 1,277,550 1,022,550 0 1,020,000 2,55012 Rural Damascus Rubber Al Ahlyiah rubber industries 55,200 0 0 55,200 23 - 23 1,259 1,259 0 0 1,25913 Homs Fertilizer the General company of fertilizers 575 0 0 575 610 - 610 351 351 0 0 351
22,455,499 7,492,025 8,724,268 6,239,207 - - - 44,539,700 25,347,227 3,363,275 10,377,638 11,606,31474,852 24,973 29,081 20,797 - - - 148,466 84,491 11,211 34,592 38,688
(A)discharge to
Sewarage systemTotal
Typeof
industryNo. Governorate Production
Items Name of Factory
Water Quality (COD mg/l) Pollution Load (kg/year)
0
Cement andconstructionmaterials
Wastewater (m3/year)
Generation Dischraged Pollution Load(C) discharge topublic water bodieswithout treatment
( A ) ( B ) ( C )
Total(upper: m3/year, lower: m3/day as 300 operation day /year)
0Aleppo 3,6003 3,600
Cement andconstruction
materials
Engineeringindustries
Chemicalindustries
(B) discharge topublic waterbodies withtreatment
Treatment method A: No detail mention or sedimentation process B: septic tank C: Stabilization pond
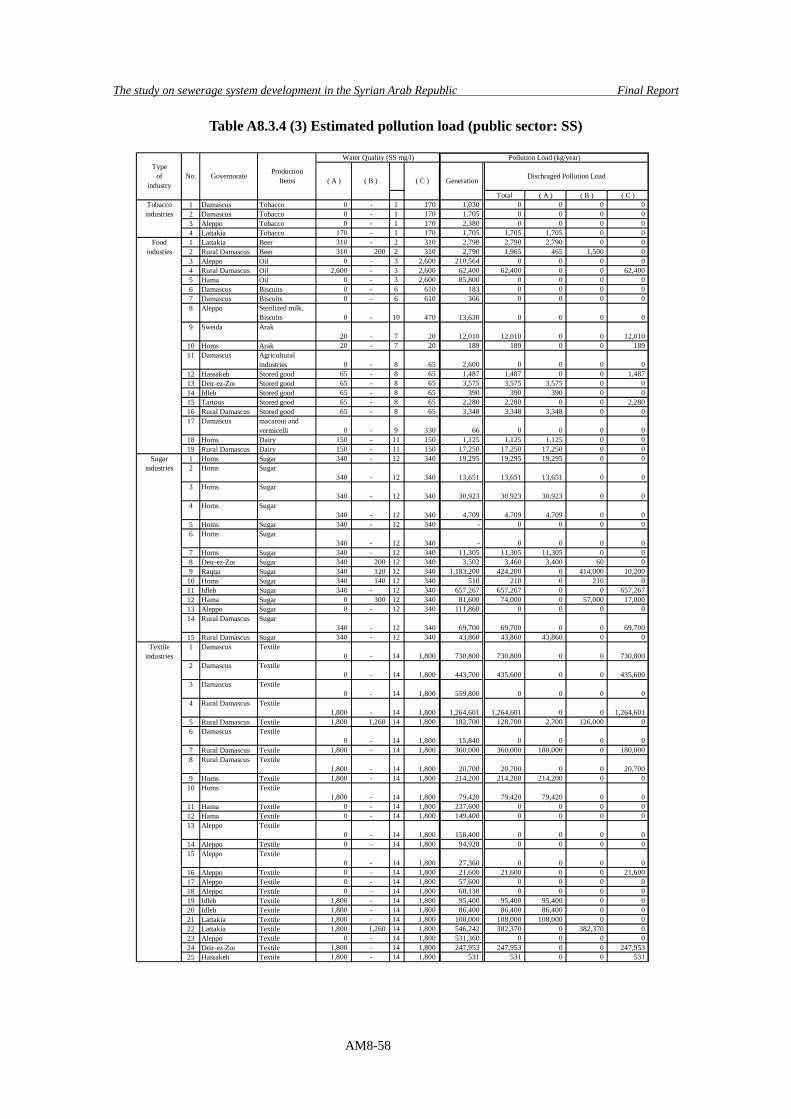
The study on sewerage system development in the Syrian Arab Republic Final Report
AM8-58
Table A8.3.4 (3) Estimated pollution load (public sector: SS)
Total ( A ) ( B ) ( C )1 Damascus Tobacco 0 - 1 170 1,030 0 0 0 02 Damascus Tobacco 0 - 1 170 1,705 0 0 0 03 Aleppo Tobacco 0 - 1 170 2,380 0 0 0 04 Lattakia Tobacco 170 - 1 170 1,705 1,705 1,705 0 01 Lattakia Beer 310 - 2 310 2,790 2,790 2,790 0 02 Rural Damascus Beer 310 200 2 310 2,790 1,965 465 1,500 03 Aleppo Oil 0 - 3 2,600 210,564 0 0 0 04 Rural Damascus Oil 2,600 - 3 2,600 62,400 62,400 0 0 62,4005 Hama Oil 0 - 3 2,600 85,800 0 0 0 06 Damascus Biscuits 0 - 6 610 183 0 0 0 07 Damascus Biscuits 0 - 6 610 366 0 0 0 08 Aleppo Sterilized milk,
Biscuits 0 - 10 470 13,630 0 0 0 09 Sweida Arak
20 - 7 20 12,010 12,010 0 0 12,01010 Homs Arak 20 - 7 20 189 189 0 0 18911 Damascus Agricultural
industries 0 - 8 65 2,600 0 0 0 012 Hassakeh Stored good 65 - 8 65 1,487 1,487 0 0 1,48713 Deir-ez-Zor Stored good 65 - 8 65 3,575 3,575 3,575 0 014 Idleb Stored good 65 - 8 65 390 390 390 0 015 Tartous Stored good 65 - 8 65 2,280 2,280 0 0 2,28016 Rural Damascus Stored good 65 - 8 65 3,348 3,348 3,348 0 017 Damascus macaroni and
vermicelli 0 - 9 330 66 0 0 0 018 Homs Dairy 150 - 11 150 1,125 1,125 1,125 0 019 Rural Damascus Dairy 150 - 11 150 17,250 17,250 17,250 0 01 Homs Sugar 340 - 12 340 19,295 19,295 19,295 0 02 Homs Sugar
340 - 12 340 13,651 13,651 13,651 0 03 Homs Sugar
340 - 12 340 30,923 30,923 30,923 0 04 Homs Sugar
340 - 12 340 4,709 4,709 4,709 0 05 Homs Sugar 340 - 12 340 - 0 0 0 06 Homs Sugar
340 - 12 340 - 0 0 0 07 Homs Sugar 340 - 12 340 11,305 11,305 11,305 0 08 Deir-ez-Zor Sugar 340 200 12 340 3,502 3,460 3,400 60 09 Raqqa Sugar 340 120 12 340 1,183,200 424,200 0 414,000 10,200
10 Homs Sugar 340 140 12 340 510 210 0 210 011 Idleb Sugar 340 - 12 340 657,267 657,267 0 0 657,26712 Hama Sugar 0 300 12 340 81,600 74,000 0 57,000 17,00013 Aleppo Sugar 0 - 12 340 111,860 0 0 0 014 Rural Damascus Sugar
340 - 12 340 69,700 69,700 0 0 69,70015 Rural Damascus Sugar 340 - 12 340 43,860 43,860 43,860 0 01 Damascus Textile
0 - 14 1,800 730,800 730,800 0 0 730,8002 Damascus Textile
0 - 14 1,800 443,700 435,600 0 0 435,6003 Damascus Textile
0 - 14 1,800 559,800 0 0 0 04 Rural Damascus Textile
1,800 - 14 1,800 1,264,601 1,264,601 0 0 1,264,6015 Rural Damascus Textile 1,800 1,260 14 1,800 182,700 128,700 2,700 126,000 06 Damascus Textile
0 - 14 1,800 15,840 0 0 0 07 Rural Damascus Textile 1,800 - 14 1,800 360,000 360,000 180,000 0 180,0008 Rural Damascus Textile
1,800 - 14 1,800 20,700 20,700 0 0 20,7009 Homs Textile 1,800 - 14 1,800 214,200 214,200 214,200 0 0
10 Homs Textile1,800 - 14 1,800 79,420 79,420 79,420 0 0
11 Hama Textile 0 - 14 1,800 237,600 0 0 0 012 Hama Textile 0 - 14 1,800 149,400 0 0 0 013 Aleppo Textile
0 - 14 1,800 158,400 0 0 0 014 Aleppo Textile 0 - 14 1,800 94,928 0 0 0 015 Aleppo Textile
0 - 14 1,800 27,360 0 0 0 016 Aleppo Textile 0 - 14 1,800 21,600 21,600 0 0 21,60017 Aleppo Textile 0 - 14 1,800 57,600 0 0 0 018 Aleppo Textile 0 - 14 1,800 68,130 0 0 0 019 Idleb Textile 1,800 - 14 1,800 95,400 95,400 95,400 0 020 Idleb Textile 1,800 - 14 1,800 86,400 86,400 86,400 0 021 Lattakia Textile 1,800 - 14 1,800 108,000 108,000 108,000 0 022 Lattakia Textile 1,800 1,260 14 1,800 546,242 382,370 0 382,370 023 Aleppo Textile 0 - 14 1,800 531,360 0 0 0 024 Deir-ez-Zor Textile 1,800 - 14 1,800 247,953 247,953 0 0 247,95325 Hassakeh Textile 1,800 - 14 1,800 531 531 0 0 531
Typeof
industryNo. Governorate Production
Items
Water Quality (SS mg/l) Pollution Load (kg/year)
Generation Dischraged Pollution Load( A ) ( B ) ( C )
Foodindusties
Tobaccoindustries
Sugarindustries
Textileindustries
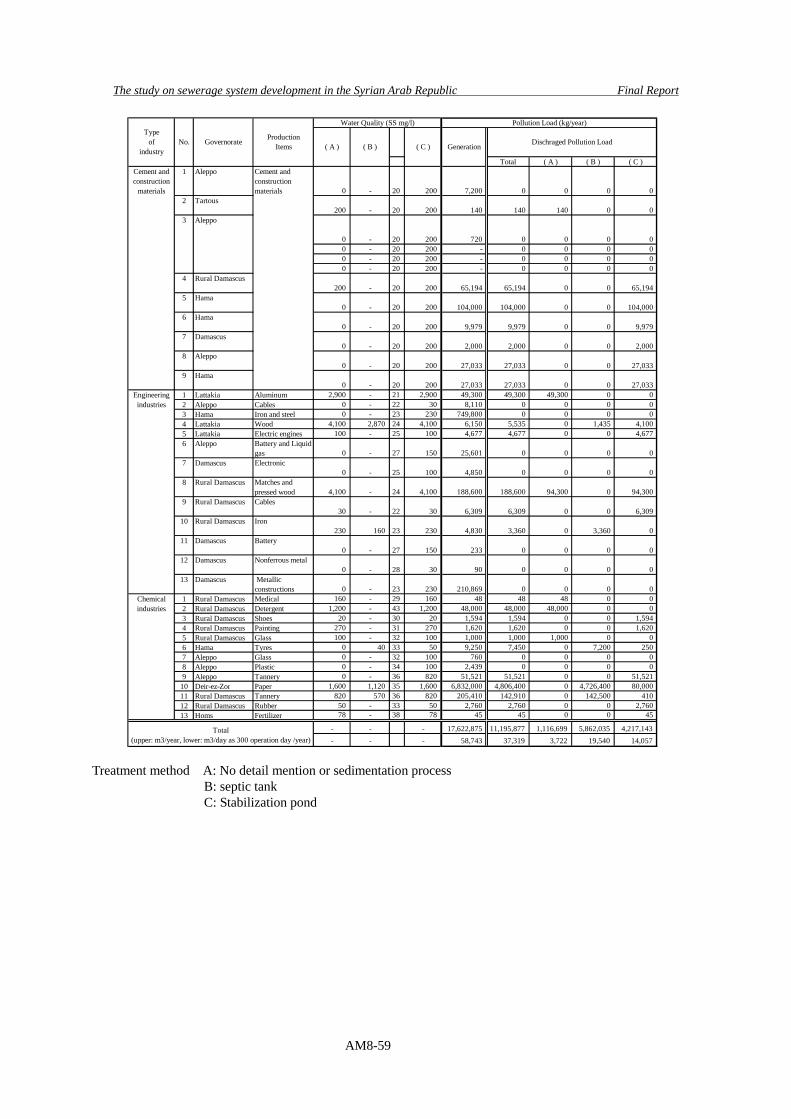
The study on sewerage system development in the Syrian Arab Republic Final Report
AM8-59
Total ( A ) ( B ) ( C )1 Aleppo
0 - 20 200 7,200 0 0 0 02 Tartous
200 - 20 200 140 140 140 0 0
0 - 20 200 720 0 0 0 00 - 20 200 - 0 0 0 00 - 20 200 - 0 0 0 00 - 20 200 - 0 0 0 0
4 Rural Damascus200 - 20 200 65,194 65,194 0 0 65,194
5 Hama0 - 20 200 104,000 104,000 0 0 104,000
6 Hama0 - 20 200 9,979 9,979 0 0 9,979
7 Damascus0 - 20 200 2,000 2,000 0 0 2,000
8 Aleppo0 - 20 200 27,033 27,033 0 0 27,033
9 Hama0 - 20 200 27,033 27,033 0 0 27,033
1 Lattakia Aluminum 2,900 - 21 2,900 49,300 49,300 49,300 0 02 Aleppo Cables 0 - 22 30 8,110 0 0 0 03 Hama Iron and steel 0 - 23 230 749,800 0 0 0 04 Lattakia Wood 4,100 2,870 24 4,100 6,150 5,535 0 1,435 4,1005 Lattakia Electric engines 100 - 25 100 4,677 4,677 0 0 4,6776 Aleppo Battery and Liquid
gas 0 - 27 150 25,601 0 0 0 07 Damascus Electronic
0 - 25 100 4,850 0 0 0 08 Rural Damascus Matches and
pressed wood 4,100 - 24 4,100 188,600 188,600 94,300 0 94,3009 Rural Damascus Cables
30 - 22 30 6,309 6,309 0 0 6,30910 Rural Damascus Iron
230 160 23 230 4,830 3,360 0 3,360 011 Damascus Battery
0 - 27 150 233 0 0 0 012 Damascus Nonferrous metal
0 - 28 30 90 0 0 0 013 Damascus Metallic
constructions 0 - 23 230 210,869 0 0 0 01 Rural Damascus Medical 160 - 29 160 48 48 48 0 02 Rural Damascus Detergent 1,200 - 43 1,200 48,000 48,000 48,000 0 03 Rural Damascus Shoes 20 - 30 20 1,594 1,594 0 0 1,5944 Rural Damascus Painting 270 - 31 270 1,620 1,620 0 0 1,6205 Rural Damascus Glass 100 - 32 100 1,000 1,000 1,000 0 06 Hama Tyres 0 40 33 50 9,250 7,450 0 7,200 2507 Aleppo Glass 0 - 32 100 760 0 0 0 08 Aleppo Plastic 0 - 34 100 2,439 0 0 0 09 Aleppo Tannery 0 - 36 820 51,521 51,521 0 0 51,521
10 Deir-ez-Zor Paper 1,600 1,120 35 1,600 6,832,000 4,806,400 0 4,726,400 80,00011 Rural Damascus Tannery 820 570 36 820 205,410 142,910 0 142,500 41012 Rural Damascus Rubber 50 - 33 50 2,760 2,760 0 0 2,76013 Homs Fertilizer 78 - 38 78 45 45 0 0 45
- - - 17,622,875 11,195,877 1,116,699 5,862,035 4,217,143- - - 58,743 37,319 3,722 19,540 14,057
Typeof
industryNo. Governorate Production
Items
Water Quality (SS mg/l) Pollution Load (kg/year)
Cement andconstructionmaterials
Generation Dischraged Pollution Load( A ) ( B ) ( C )
Total(upper: m3/year, lower: m3/day as 300 operation day /year)
Aleppo3
Cement andconstruction
materials
Engineeringindustries
Chemicalindustries
Treatment method A: No detail mention or sedimentation process B: septic tank C: Stabilization pond
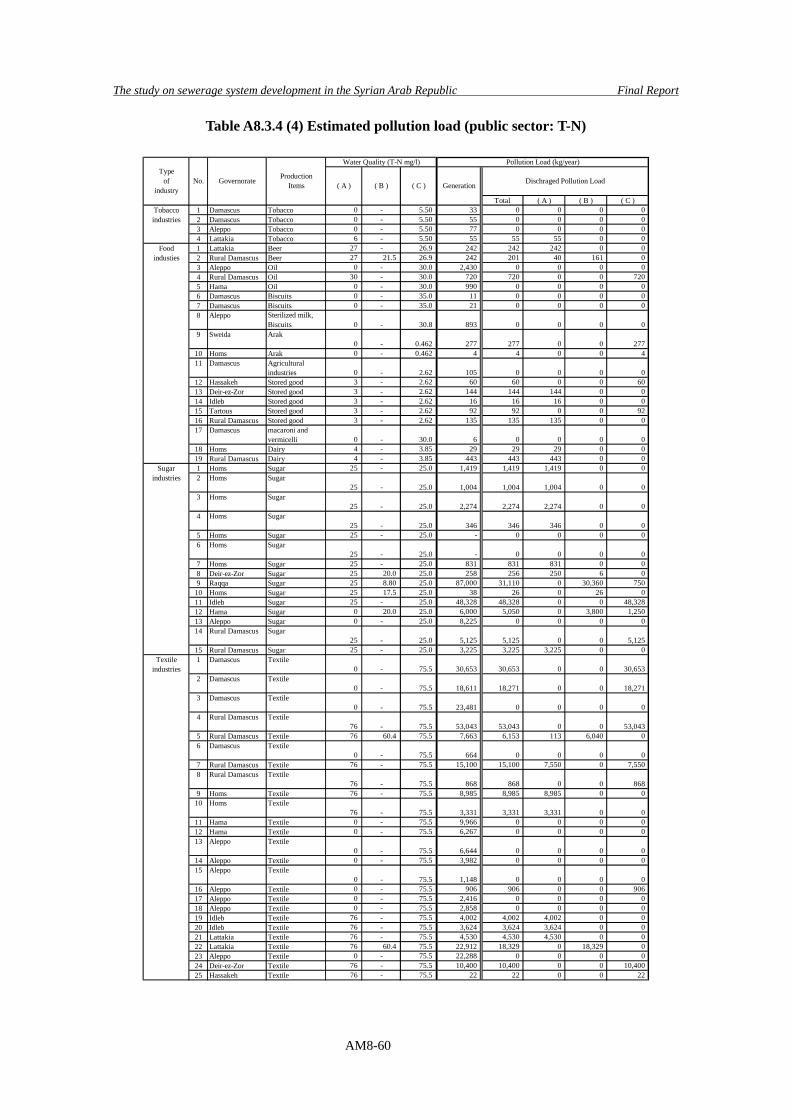
The study on sewerage system development in the Syrian Arab Republic Final Report
AM8-60
Table A8.3.4 (4) Estimated pollution load (public sector: T-N)
Total ( A ) ( B ) ( C )1 Damascus Tobacco 0 - 5.50 33 0 0 0 02 Damascus Tobacco 0 - 5.50 55 0 0 0 03 Aleppo Tobacco 0 - 5.50 77 0 0 0 04 Lattakia Tobacco 6 - 5.50 55 55 55 0 01 Lattakia Beer 27 - 26.9 242 242 242 0 02 Rural Damascus Beer 27 21.5 26.9 242 201 40 161 03 Aleppo Oil 0 - 30.0 2,430 0 0 0 04 Rural Damascus Oil 30 - 30.0 720 720 0 0 7205 Hama Oil 0 - 30.0 990 0 0 0 06 Damascus Biscuits 0 - 35.0 11 0 0 0 07 Damascus Biscuits 0 - 35.0 21 0 0 0 08 Aleppo Sterilized milk,
Biscuits 0 - 30.8 893 0 0 0 09 Sweida Arak
0 - 0.462 277 277 0 0 27710 Homs Arak 0 - 0.462 4 4 0 0 411 Damascus Agricultural
industries 0 - 2.62 105 0 0 0 012 Hassakeh Stored good 3 - 2.62 60 60 0 0 6013 Deir-ez-Zor Stored good 3 - 2.62 144 144 144 0 014 Idleb Stored good 3 - 2.62 16 16 16 0 015 Tartous Stored good 3 - 2.62 92 92 0 0 9216 Rural Damascus Stored good 3 - 2.62 135 135 135 0 017 Damascus macaroni and
vermicelli 0 - 30.0 6 0 0 0 018 Homs Dairy 4 - 3.85 29 29 29 0 019 Rural Damascus Dairy 4 - 3.85 443 443 443 0 01 Homs Sugar 25 - 25.0 1,419 1,419 1,419 0 02 Homs Sugar
25 - 25.0 1,004 1,004 1,004 0 03 Homs Sugar
25 - 25.0 2,274 2,274 2,274 0 04 Homs Sugar
25 - 25.0 346 346 346 0 05 Homs Sugar 25 - 25.0 - 0 0 0 06 Homs Sugar
25 - 25.0 - 0 0 0 07 Homs Sugar 25 - 25.0 831 831 831 0 08 Deir-ez-Zor Sugar 25 20.0 25.0 258 256 250 6 09 Raqqa Sugar 25 8.80 25.0 87,000 31,110 0 30,360 750
10 Homs Sugar 25 17.5 25.0 38 26 0 26 011 Idleb Sugar 25 - 25.0 48,328 48,328 0 0 48,32812 Hama Sugar 0 20.0 25.0 6,000 5,050 0 3,800 1,25013 Aleppo Sugar 0 - 25.0 8,225 0 0 0 014 Rural Damascus Sugar
25 - 25.0 5,125 5,125 0 0 5,12515 Rural Damascus Sugar 25 - 25.0 3,225 3,225 3,225 0 01 Damascus Textile
0 - 75.5 30,653 30,653 0 0 30,6532 Damascus Textile
0 - 75.5 18,611 18,271 0 0 18,2713 Damascus Textile
0 - 75.5 23,481 0 0 0 04 Rural Damascus Textile
76 - 75.5 53,043 53,043 0 0 53,0435 Rural Damascus Textile 76 60.4 75.5 7,663 6,153 113 6,040 06 Damascus Textile
0 - 75.5 664 0 0 0 07 Rural Damascus Textile 76 - 75.5 15,100 15,100 7,550 0 7,5508 Rural Damascus Textile
76 - 75.5 868 868 0 0 8689 Homs Textile 76 - 75.5 8,985 8,985 8,985 0 0
10 Homs Textile76 - 75.5 3,331 3,331 3,331 0 0
11 Hama Textile 0 - 75.5 9,966 0 0 0 012 Hama Textile 0 - 75.5 6,267 0 0 0 013 Aleppo Textile
0 - 75.5 6,644 0 0 0 014 Aleppo Textile 0 - 75.5 3,982 0 0 0 015 Aleppo Textile
0 - 75.5 1,148 0 0 0 016 Aleppo Textile 0 - 75.5 906 906 0 0 90617 Aleppo Textile 0 - 75.5 2,416 0 0 0 018 Aleppo Textile 0 - 75.5 2,858 0 0 0 019 Idleb Textile 76 - 75.5 4,002 4,002 4,002 0 020 Idleb Textile 76 - 75.5 3,624 3,624 3,624 0 021 Lattakia Textile 76 - 75.5 4,530 4,530 4,530 0 022 Lattakia Textile 76 60.4 75.5 22,912 18,329 0 18,329 023 Aleppo Textile 0 - 75.5 22,288 0 0 0 024 Deir-ez-Zor Textile 76 - 75.5 10,400 10,400 0 0 10,40025 Hassakeh Textile 76 - 75.5 22 22 0 0 22
Typeof
industryNo. Governorate Production
Items
Water Quality (T-N mg/l) Pollution Load (kg/year)
Generation Dischraged Pollution Load( A ) ( B ) ( C )
Foodindusties
Tobaccoindustries
Sugarindustries
Textileindustries
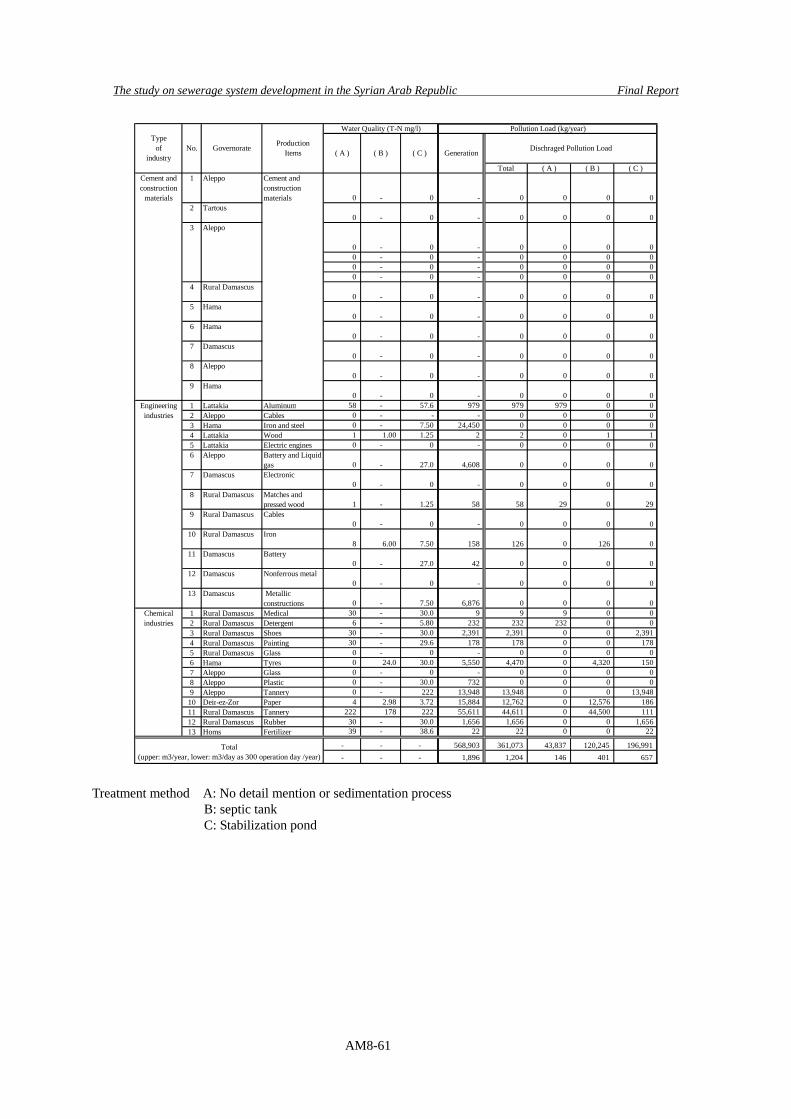
The study on sewerage system development in the Syrian Arab Republic Final Report
AM8-61
Total ( A ) ( B ) ( C )1 Aleppo
0 - 0 - 0 0 0 02 Tartous
0 - 0 - 0 0 0 0
0 - 0 - 0 0 0 00 - 0 - 0 0 0 00 - 0 - 0 0 0 00 - 0 - 0 0 0 0
4 Rural Damascus0 - 0 - 0 0 0 0
5 Hama0 - 0 - 0 0 0 0
6 Hama0 - 0 - 0 0 0 0
7 Damascus0 - 0 - 0 0 0 0
8 Aleppo0 - 0 - 0 0 0 0
9 Hama0 - 0 - 0 0 0 0
1 Lattakia Aluminum 58 - 57.6 979 979 979 0 02 Aleppo Cables 0 - - - 0 0 0 03 Hama Iron and steel 0 - 7.50 24,450 0 0 0 04 Lattakia Wood 1 1.00 1.25 2 2 0 1 15 Lattakia Electric engines 0 - 0 - 0 0 0 06 Aleppo Battery and Liquid
gas 0 - 27.0 4,608 0 0 0 07 Damascus Electronic
0 - 0 - 0 0 0 08 Rural Damascus Matches and
pressed wood 1 - 1.25 58 58 29 0 299 Rural Damascus Cables
0 - 0 - 0 0 0 010 Rural Damascus Iron
8 6.00 7.50 158 126 0 126 011 Damascus Battery
0 - 27.0 42 0 0 0 012 Damascus Nonferrous metal
0 - 0 - 0 0 0 013 Damascus Metallic
constructions 0 - 7.50 6,876 0 0 0 01 Rural Damascus Medical 30 - 30.0 9 9 9 0 02 Rural Damascus Detergent 6 - 5.80 232 232 232 0 03 Rural Damascus Shoes 30 - 30.0 2,391 2,391 0 0 2,3914 Rural Damascus Painting 30 - 29.6 178 178 0 0 1785 Rural Damascus Glass 0 - 0 - 0 0 0 06 Hama Tyres 0 24.0 30.0 5,550 4,470 0 4,320 1507 Aleppo Glass 0 - 0 - 0 0 0 08 Aleppo Plastic 0 - 30.0 732 0 0 0 09 Aleppo Tannery 0 - 222 13,948 13,948 0 0 13,948
10 Deir-ez-Zor Paper 4 2.98 3.72 15,884 12,762 0 12,576 18611 Rural Damascus Tannery 222 178 222 55,611 44,611 0 44,500 11112 Rural Damascus Rubber 30 - 30.0 1,656 1,656 0 0 1,65613 Homs Fertilizer 39 - 38.6 22 22 0 0 22
- - - 568,903 361,073 43,837 120,245 196,991- - - 1,896 1,204 146 401 657
Typeof
industryNo. Governorate Production
Items
Water Quality (T-N mg/l) Pollution Load (kg/year)
Cement andconstructionmaterials
Generation Dischraged Pollution Load( A ) ( B ) ( C )
Total(upper: m3/year, lower: m3/day as 300 operation day /year)
Aleppo3
Cement andconstruction
materials
Engineeringindustries
Chemicalindustries
Treatment method A: No detail mention or sedimentation process B: septic tank C: Stabilization pond
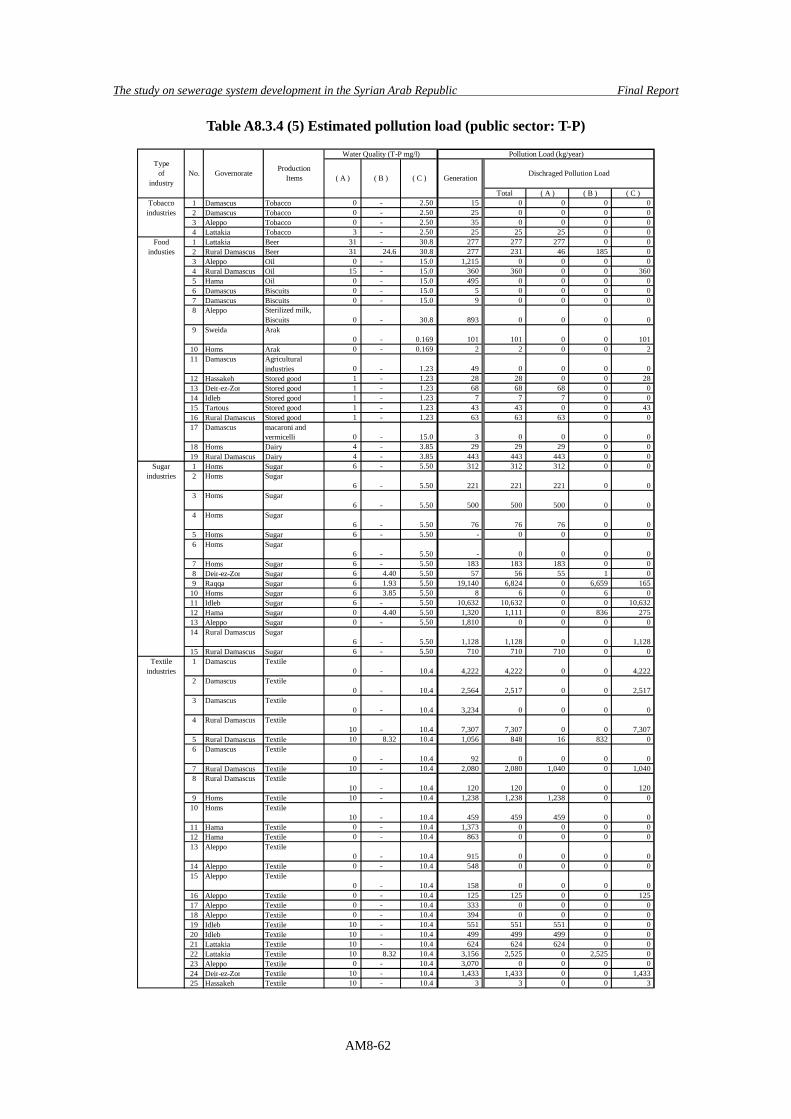
The study on sewerage system development in the Syrian Arab Republic Final Report
AM8-62
Table A8.3.4 (5) Estimated pollution load (public sector: T-P)
Total ( A ) ( B ) ( C )1 Damascus Tobacco 0 - 2.50 15 0 0 0 02 Damascus Tobacco 0 - 2.50 25 0 0 0 03 Aleppo Tobacco 0 - 2.50 35 0 0 0 04 Lattakia Tobacco 3 - 2.50 25 25 25 0 01 Lattakia Beer 31 - 30.8 277 277 277 0 02 Rural Damascus Beer 31 24.6 30.8 277 231 46 185 03 Aleppo Oil 0 - 15.0 1,215 0 0 0 04 Rural Damascus Oil 15 - 15.0 360 360 0 0 3605 Hama Oil 0 - 15.0 495 0 0 0 06 Damascus Biscuits 0 - 15.0 5 0 0 0 07 Damascus Biscuits 0 - 15.0 9 0 0 0 08 Aleppo Sterilized milk,
Biscuits 0 - 30.8 893 0 0 0 09 Sweida Arak
0 - 0.169 101 101 0 0 10110 Homs Arak 0 - 0.169 2 2 0 0 211 Damascus Agricultural
industries 0 - 1.23 49 0 0 0 012 Hassakeh Stored good 1 - 1.23 28 28 0 0 2813 Deir-ez-Zor Stored good 1 - 1.23 68 68 68 0 014 Idleb Stored good 1 - 1.23 7 7 7 0 015 Tartous Stored good 1 - 1.23 43 43 0 0 4316 Rural Damascus Stored good 1 - 1.23 63 63 63 0 017 Damascus macaroni and
vermicelli 0 - 15.0 3 0 0 0 018 Homs Dairy 4 - 3.85 29 29 29 0 019 Rural Damascus Dairy 4 - 3.85 443 443 443 0 01 Homs Sugar 6 - 5.50 312 312 312 0 02 Homs Sugar
6 - 5.50 221 221 221 0 03 Homs Sugar
6 - 5.50 500 500 500 0 04 Homs Sugar
6 - 5.50 76 76 76 0 05 Homs Sugar 6 - 5.50 - 0 0 0 06 Homs Sugar
6 - 5.50 - 0 0 0 07 Homs Sugar 6 - 5.50 183 183 183 0 08 Deir-ez-Zor Sugar 6 4.40 5.50 57 56 55 1 09 Raqqa Sugar 6 1.93 5.50 19,140 6,824 0 6,659 165
10 Homs Sugar 6 3.85 5.50 8 6 0 6 011 Idleb Sugar 6 - 5.50 10,632 10,632 0 0 10,63212 Hama Sugar 0 4.40 5.50 1,320 1,111 0 836 27513 Aleppo Sugar 0 - 5.50 1,810 0 0 0 014 Rural Damascus Sugar
6 - 5.50 1,128 1,128 0 0 1,12815 Rural Damascus Sugar 6 - 5.50 710 710 710 0 01 Damascus Textile
0 - 10.4 4,222 4,222 0 0 4,2222 Damascus Textile
0 - 10.4 2,564 2,517 0 0 2,5173 Damascus Textile
0 - 10.4 3,234 0 0 0 04 Rural Damascus Textile
10 - 10.4 7,307 7,307 0 0 7,3075 Rural Damascus Textile 10 8.32 10.4 1,056 848 16 832 06 Damascus Textile
0 - 10.4 92 0 0 0 07 Rural Damascus Textile 10 - 10.4 2,080 2,080 1,040 0 1,0408 Rural Damascus Textile
10 - 10.4 120 120 0 0 1209 Homs Textile 10 - 10.4 1,238 1,238 1,238 0 0
10 Homs Textile10 - 10.4 459 459 459 0 0
11 Hama Textile 0 - 10.4 1,373 0 0 0 012 Hama Textile 0 - 10.4 863 0 0 0 013 Aleppo Textile
0 - 10.4 915 0 0 0 014 Aleppo Textile 0 - 10.4 548 0 0 0 015 Aleppo Textile
0 - 10.4 158 0 0 0 016 Aleppo Textile 0 - 10.4 125 125 0 0 12517 Aleppo Textile 0 - 10.4 333 0 0 0 018 Aleppo Textile 0 - 10.4 394 0 0 0 019 Idleb Textile 10 - 10.4 551 551 551 0 020 Idleb Textile 10 - 10.4 499 499 499 0 021 Lattakia Textile 10 - 10.4 624 624 624 0 022 Lattakia Textile 10 8.32 10.4 3,156 2,525 0 2,525 023 Aleppo Textile 0 - 10.4 3,070 0 0 0 024 Deir-ez-Zor Textile 10 - 10.4 1,433 1,433 0 0 1,43325 Hassakeh Textile 10 - 10.4 3 3 0 0 3
Typeof
industryNo. Governorate Production
Items
Water Quality (T-P mg/l) Pollution Load (kg/year)
Generation Dischraged Pollution Load( A ) ( B ) ( C )
Foodindusties
Tobaccoindustries
Sugarindustries
Textileindustries
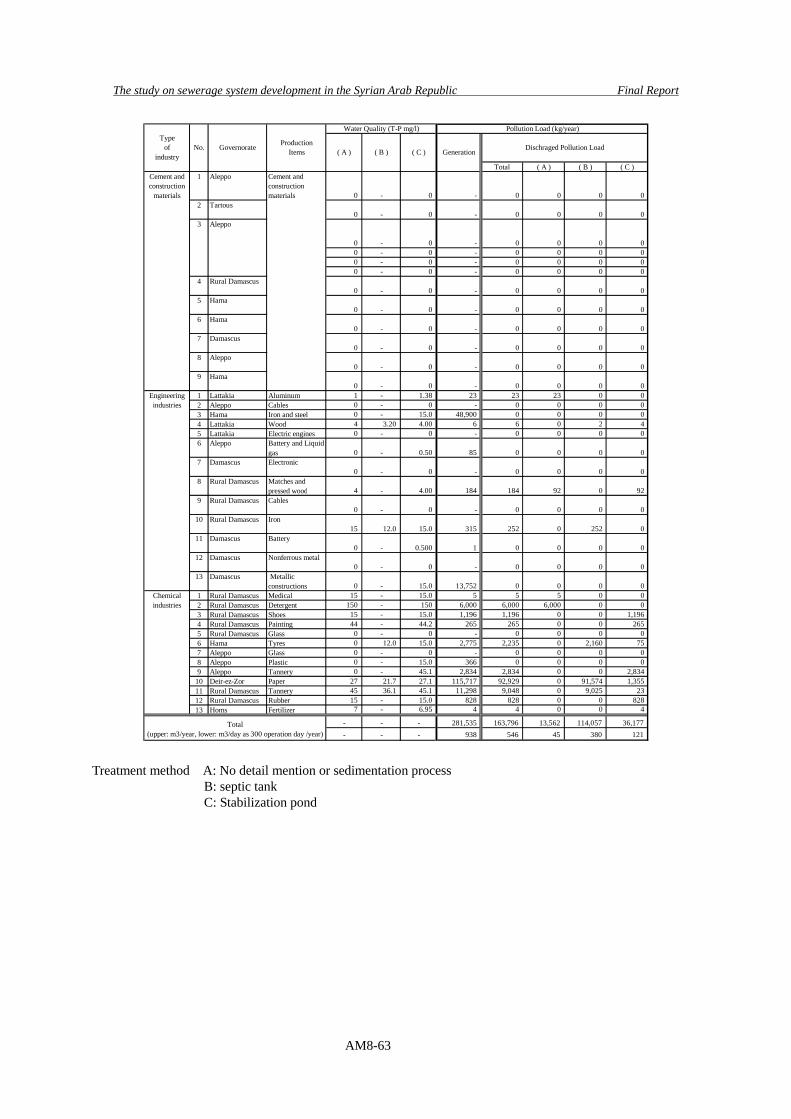
The study on sewerage system development in the Syrian Arab Republic Final Report
AM8-63
Total ( A ) ( B ) ( C )1 Aleppo
0 - 0 - 0 0 0 02 Tartous
0 - 0 - 0 0 0 0
0 - 0 - 0 0 0 00 - 0 - 0 0 0 00 - 0 - 0 0 0 00 - 0 - 0 0 0 0
4 Rural Damascus0 - 0 - 0 0 0 0
5 Hama0 - 0 - 0 0 0 0
6 Hama0 - 0 - 0 0 0 0
7 Damascus0 - 0 - 0 0 0 0
8 Aleppo0 - 0 - 0 0 0 0
9 Hama0 - 0 - 0 0 0 0
1 Lattakia Aluminum 1 - 1.38 23 23 23 0 02 Aleppo Cables 0 - 0 - 0 0 0 03 Hama Iron and steel 0 - 15.0 48,900 0 0 0 04 Lattakia Wood 4 3.20 4.00 6 6 0 2 45 Lattakia Electric engines 0 - 0 - 0 0 0 06 Aleppo Battery and Liquid
gas 0 - 0.50 85 0 0 0 07 Damascus Electronic
0 - 0 - 0 0 0 08 Rural Damascus Matches and
pressed wood 4 - 4.00 184 184 92 0 929 Rural Damascus Cables
0 - 0 - 0 0 0 010 Rural Damascus Iron
15 12.0 15.0 315 252 0 252 011 Damascus Battery
0 - 0.500 1 0 0 0 012 Damascus Nonferrous metal
0 - 0 - 0 0 0 013 Damascus Metallic
constructions 0 - 15.0 13,752 0 0 0 01 Rural Damascus Medical 15 - 15.0 5 5 5 0 02 Rural Damascus Detergent 150 - 150 6,000 6,000 6,000 0 03 Rural Damascus Shoes 15 - 15.0 1,196 1,196 0 0 1,1964 Rural Damascus Painting 44 - 44.2 265 265 0 0 2655 Rural Damascus Glass 0 - 0 - 0 0 0 06 Hama Tyres 0 12.0 15.0 2,775 2,235 0 2,160 757 Aleppo Glass 0 - 0 - 0 0 0 08 Aleppo Plastic 0 - 15.0 366 0 0 0 09 Aleppo Tannery 0 - 45.1 2,834 2,834 0 0 2,834
10 Deir-ez-Zor Paper 27 21.7 27.1 115,717 92,929 0 91,574 1,35511 Rural Damascus Tannery 45 36.1 45.1 11,298 9,048 0 9,025 2312 Rural Damascus Rubber 15 - 15.0 828 828 0 0 82813 Homs Fertilizer 7 - 6.95 4 4 0 0 4
- - - 281,535 163,796 13,562 114,057 36,177- - - 938 546 45 380 121
Typeof
industryNo. Governorate Production
Items
Water Quality (T-P mg/l) Pollution Load (kg/year)
Cement andconstructionmaterials
Generation Dischraged Pollution Load( A ) ( B ) ( C )
Total(upper: m3/year, lower: m3/day as 300 operation day /year)
Aleppo3
Cement andconstruction
materials
Engineeringindustries
Chemicalindustries
Treatment method A: No detail mention or sedimentation process B: septic tank C: Stabilization pond
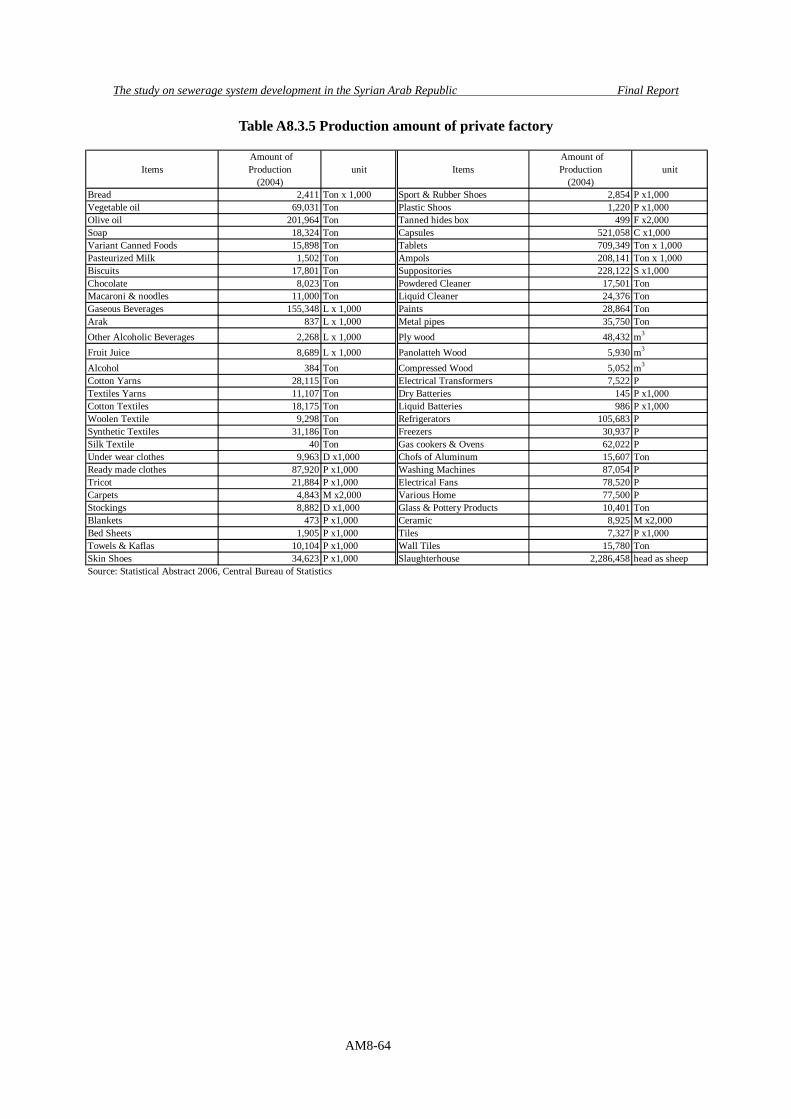
The study on sewerage system development in the Syrian Arab Republic Final Report
AM8-64
Table A8.3.5 Production amount of private factory
Items Amount ofProduction
(2004)unit Items
Amount ofProduction
(2004)unit
Bread 2,411 Ton x 1,000 Sport & Rubber Shoes 2,854 P x1,000Vegetable oil 69,031 Ton Plastic Shoos 1,220 P x1,000Olive oil 201,964 Ton Tanned hides box 499 F x2,000Soap 18,324 Ton Capsules 521,058 C x1,000Variant Canned Foods 15,898 Ton Tablets 709,349 Ton x 1,000Pasteurized Milk 1,502 Ton Ampols 208,141 Ton x 1,000Biscuits 17,801 Ton Suppositories 228,122 S x1,000Chocolate 8,023 Ton Powdered Cleaner 17,501 TonMacaroni & noodles 11,000 Ton Liquid Cleaner 24,376 TonGaseous Beverages 155,348 L x 1,000 Paints 28,864 TonArak 837 L x 1,000 Metal pipes 35,750 TonOther Alcoholic Beverages 2,268 L x 1,000 Ply wood 48,432 m3
Fruit Juice 8,689 L x 1,000 Panolatteh Wood 5,930 m3
Alcohol 384 Ton Compressed Wood 5,052 m3
Cotton Yarns 28,115 Ton Electrical Transformers 7,522 PTextiles Yarns 11,107 Ton Dry Batteries 145 P x1,000Cotton Textiles 18,175 Ton Liquid Batteries 986 P x1,000Woolen Textile 9,298 Ton Refrigerators 105,683 PSynthetic Textiles 31,186 Ton Freezers 30,937 PSilk Textile 40 Ton Gas cookers & Ovens 62,022 PUnder wear clothes 9,963 D x1,000 Chofs of Aluminum 15,607 TonReady made clothes 87,920 P x1,000 Washing Machines 87,054 PTricot 21,884 P x1,000 Electrical Fans 78,520 PCarpets 4,843 M x2,000 Various Home 77,500 PStockings 8,882 D x1,000 Glass & Pottery Products 10,401 TonBlankets 473 P x1,000 Ceramic 8,925 M x2,000Bed Sheets 1,905 P x1,000 Tiles 7,327 P x1,000Towels & Kaflas 10,104 P x1,000 Wall Tiles 15,780 TonSkin Shoes 34,623 P x1,000 Slaughterhouse 2,286,458 head as sheepSource: Statistical Abstract 2006, Central Bureau of Statistics
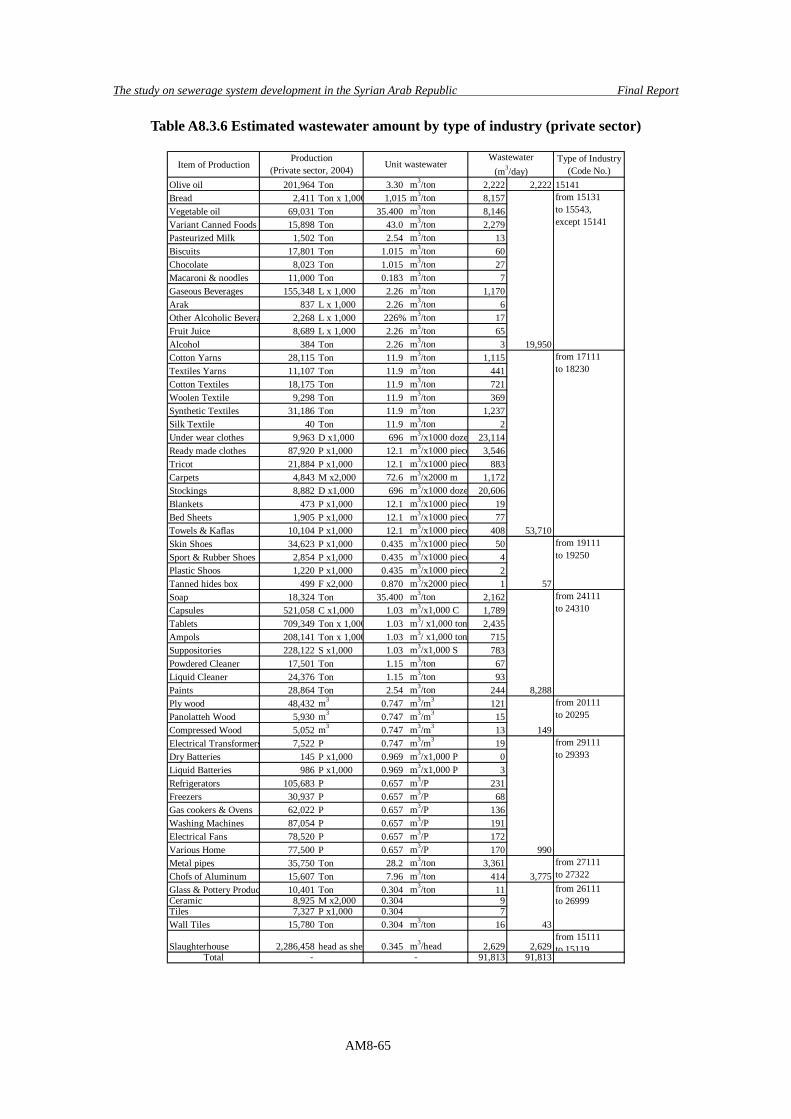
The study on sewerage system development in the Syrian Arab Republic Final Report
AM8-65
Table A8.3.6 Estimated wastewater amount by type of industry (private sector)
Item of Production Type of Industry(Code No.)
Olive oil 201,964 Ton 3.30 m3/ton 2,222 2,222 15141Bread 2,411 Ton x 1,000 1,015 m3/ton 8,157Vegetable oil 69,031 Ton 35.400 m3/ton 8,146Variant Canned Foods 15,898 Ton 43.0 m3/ton 2,279Pasteurized Milk 1,502 Ton 2.54 m3/ton 13Biscuits 17,801 Ton 1.015 m3/ton 60Chocolate 8,023 Ton 1.015 m3/ton 27Macaroni & noodles 11,000 Ton 0.183 m3/ton 7Gaseous Beverages 155,348 L x 1,000 2.26 m3/ton 1,170Arak 837 L x 1,000 2.26 m3/ton 6Other Alcoholic Bevera 2,268 L x 1,000 226% m3/ton 17Fruit Juice 8,689 L x 1,000 2.26 m3/ton 65Alcohol 384 Ton 2.26 m3/ton 3 19,950Cotton Yarns 28,115 Ton 11.9 m3/ton 1,115Textiles Yarns 11,107 Ton 11.9 m3/ton 441Cotton Textiles 18,175 Ton 11.9 m3/ton 721Woolen Textile 9,298 Ton 11.9 m3/ton 369Synthetic Textiles 31,186 Ton 11.9 m3/ton 1,237Silk Textile 40 Ton 11.9 m3/ton 2Under wear clothes 9,963 D x1,000 696 m3/x1000 doze 23,114Ready made clothes 87,920 P x1,000 12.1 m3/x1000 piece 3,546Tricot 21,884 P x1,000 12.1 m3/x1000 piece 883Carpets 4,843 M x2,000 72.6 m3/x2000 m 1,172Stockings 8,882 D x1,000 696 m3/x1000 doze 20,606Blankets 473 P x1,000 12.1 m3/x1000 piece 19Bed Sheets 1,905 P x1,000 12.1 m3/x1000 piece 77Towels & Kaflas 10,104 P x1,000 12.1 m3/x1000 piece 408 53,710Skin Shoes 34,623 P x1,000 0.435 m3/x1000 piece 50Sport & Rubber Shoes 2,854 P x1,000 0.435 m3/x1000 piece 4Plastic Shoos 1,220 P x1,000 0.435 m3/x1000 piece 2Tanned hides box 499 F x2,000 0.870 m3/x2000 piece 1 57Soap 18,324 Ton 35.400 m3/ton 2,162Capsules 521,058 C x1,000 1.03 m3/x1,000 C 1,789Tablets 709,349 Ton x 1,000 1.03 m3/ x1,000 ton 2,435Ampols 208,141 Ton x 1,000 1.03 m3/ x1,000 ton 715Suppositories 228,122 S x1,000 1.03 m3/x1,000 S 783Powdered Cleaner 17,501 Ton 1.15 m3/ton 67Liquid Cleaner 24,376 Ton 1.15 m3/ton 93Paints 28,864 Ton 2.54 m3/ton 244 8,288Ply wood 48,432 m3 0.747 m3/m3 121Panolatteh Wood 5,930 m3 0.747 m3/m3 15Compressed Wood 5,052 m3 0.747 m3/m3 13 149Electrical Transformers 7,522 P 0.747 m3/m3 19Dry Batteries 145 P x1,000 0.969 m3/x1,000 P 0Liquid Batteries 986 P x1,000 0.969 m3/x1,000 P 3Refrigerators 105,683 P 0.657 m3/P 231Freezers 30,937 P 0.657 m3/P 68Gas cookers & Ovens 62,022 P 0.657 m3/P 136Washing Machines 87,054 P 0.657 m3/P 191Electrical Fans 78,520 P 0.657 m3/P 172Various Home 77,500 P 0.657 m3/P 170 990Metal pipes 35,750 Ton 28.2 m3/ton 3,361Chofs of Aluminum 15,607 Ton 7.96 m3/ton 414 3,775Glass & Pottery Produc 10,401 Ton 0.304 m3/ton 11Ceramic 8,925 M x2,000 0.304 9Tiles 7,327 P x1,000 0.304 7Wall Tiles 15,780 Ton 0.304 m3/ton 16 43
Slaughterhouse 2,286,458 head as she 0.345 m3/head 2,629 2,629from 15111to 15119
Total 91,813 91,813
from 26111to 26999
from 19111to 19250
from 24111to 24310
from 20111to 20295
from 29111to 29393
from 15131to 15543,except 15141
from 17111to 18230
Wastewater(m3/day)
from 27111to 27322
- -
Production(Private sector, 2004) Unit wastewater
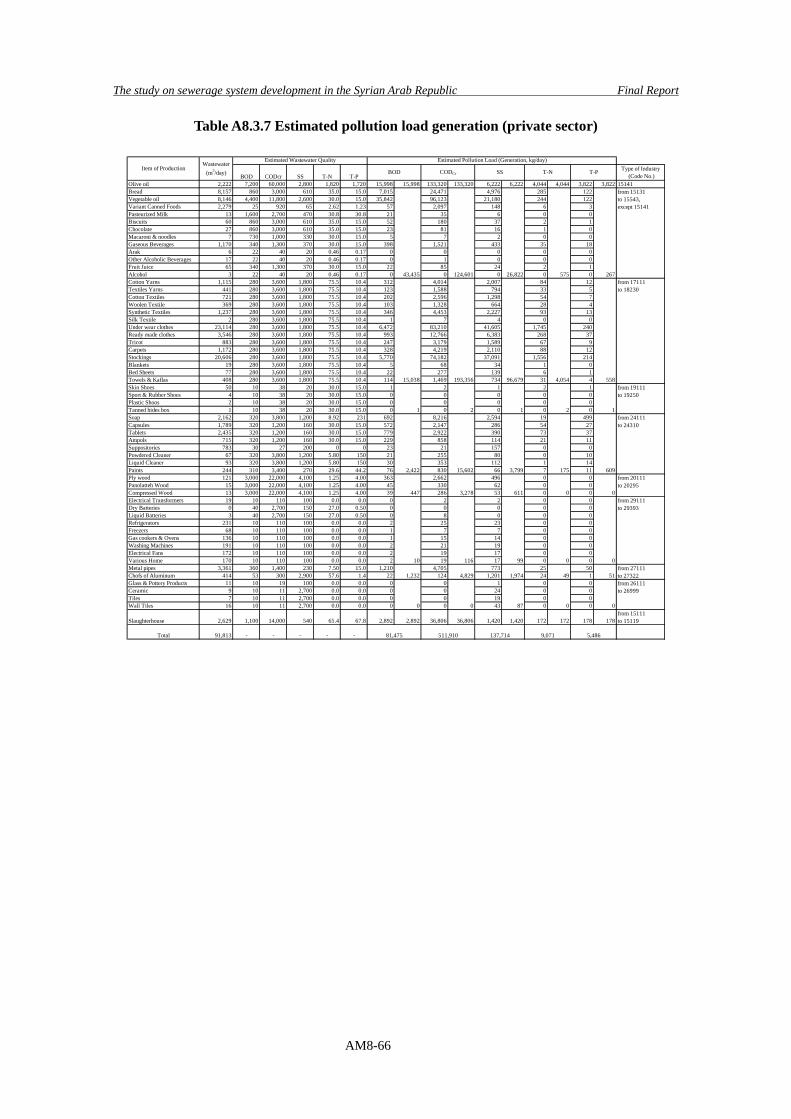
The study on sewerage system development in the Syrian Arab Republic Final Report
AM8-66
Table A8.3.7 Estimated pollution load generation (private sector)
BOD CODcr SS T-N T-PType of Industry
(Code No.)Olive oil 2,222 7,200 60,000 2,800 1,820 1,720 15,998 15,998 133,320 133,320 6,222 6,222 4,044 4,044 3,822 3,822 15141Bread 8,157 860 3,000 610 35.0 15.0 7,015 24,471 4,976 285 122Vegetable oil 8,146 4,400 11,800 2,600 30.0 15.0 35,842 96,123 21,180 244 122Variant Canned Foods 2,279 25 920 65 2.62 1.23 57 2,097 148 6 3Pasteurized Milk 13 1,600 2,700 470 30.8 30.8 21 35 6 0 0Biscuits 60 860 3,000 610 35.0 15.0 52 180 37 2 1Chocolate 27 860 3,000 610 35.0 15.0 23 81 16 1 0Macaroni & noodles 7 730 1,000 330 30.0 15.0 5 7 2 0 0Gaseous Beverages 1,170 340 1,300 370 30.0 15.0 398 1,521 433 35 18Arak 6 22 40 20 0.46 0.17 0 0 0 0 0Other Alcoholic Beverages 17 22 40 20 0.46 0.17 0 1 0 0 0Fruit Juice 65 340 1,300 370 30.0 15.0 22 85 24 2 1Alcohol 3 22 40 20 0.46 0.17 0 43,435 0 124,601 0 26,822 0 575 0 267Cotton Yarns 1,115 280 3,600 1,800 75.5 10.4 312 4,014 2,007 84 12Textiles Yarns 441 280 3,600 1,800 75.5 10.4 123 1,588 794 33 5Cotton Textiles 721 280 3,600 1,800 75.5 10.4 202 2,596 1,298 54 7Woolen Textile 369 280 3,600 1,800 75.5 10.4 103 1,328 664 28 4Synthetic Textiles 1,237 280 3,600 1,800 75.5 10.4 346 4,453 2,227 93 13Silk Textile 2 280 3,600 1,800 75.5 10.4 1 7 4 0 0Under wear clothes 23,114 280 3,600 1,800 75.5 10.4 6,472 83,210 41,605 1,745 240Ready made clothes 3,546 280 3,600 1,800 75.5 10.4 993 12,766 6,383 268 37Tricot 883 280 3,600 1,800 75.5 10.4 247 3,179 1,589 67 9Carpets 1,172 280 3,600 1,800 75.5 10.4 328 4,219 2,110 88 12Stockings 20,606 280 3,600 1,800 75.5 10.4 5,770 74,182 37,091 1,556 214Blankets 19 280 3,600 1,800 75.5 10.4 5 68 34 1 0Bed Sheets 77 280 3,600 1,800 75.5 10.4 22 277 139 6 1Towels & Kaflas 408 280 3,600 1,800 75.5 10.4 114 15,038 1,469 193,356 734 96,679 31 4,054 4 558Skin Shoes 50 10 38 20 30.0 15.0 1 2 1 2 1Sport & Rubber Shoes 4 10 38 20 30.0 15.0 0 0 0 0 0Plastic Shoos 2 10 38 20 30.0 15.0 0 0 0 0 0Tanned hides box 1 10 38 20 30.0 15.0 0 1 0 2 0 1 0 2 0 1Soap 2,162 320 3,800 1,200 8.92 231 692 8,216 2,594 19 499Capsules 1,789 320 1,200 160 30.0 15.0 572 2,147 286 54 27Tablets 2,435 320 1,200 160 30.0 15.0 779 2,922 390 73 37Ampols 715 320 1,200 160 30.0 15.0 229 858 114 21 11Suppositories 783 30 27 200 0 0 23 21 157 0 0Powdered Cleaner 67 320 3,800 1,200 5.80 150 21 255 80 0 10Liquid Cleaner 93 320 3,800 1,200 5.80 150 30 353 112 1 14Paints 244 310 3,400 270 29.6 44.2 76 2,422 830 15,602 66 3,799 7 175 11 609Ply wood 121 3,000 22,000 4,100 1.25 4.00 363 2,662 496 0 0Panolatteh Wood 15 3,000 22,000 4,100 1.25 4.00 45 330 62 0 0Compressed Wood 13 3,000 22,000 4,100 1.25 4.00 39 447 286 3,278 53 611 0 0 0 0Electrical Transformers 19 10 110 100 0.0 0.0 0 2 2 0 0Dry Batteries 0 40 2,700 150 27.0 0.50 0 0 0 0 0Liquid Batteries 3 40 2,700 150 27.0 0.50 0 8 0 0 0Refrigerators 231 10 110 100 0.0 0.0 2 25 23 0 0Freezers 68 10 110 100 0.0 0.0 1 7 7 0 0Gas cookers & Ovens 136 10 110 100 0.0 0.0 1 15 14 0 0Washing Machines 191 10 110 100 0.0 0.0 2 21 19 0 0Electrical Fans 172 10 110 100 0.0 0.0 2 19 17 0 0Various Home 170 10 110 100 0.0 0.0 2 10 19 116 17 99 0 0 0 0Metal pipes 3,361 360 1,400 230 7.50 15.0 1,210 4,705 773 25 50Chofs of Aluminum 414 53 300 2,900 57.6 1.4 22 1,232 124 4,829 1,201 1,974 24 49 1 51Glass & Pottery Products 11 10 19 100 0.0 0.0 0 0 1 0 0Ceramic 9 10 11 2,700 0.0 0.0 0 0 24 0 0Tiles 7 10 11 2,700 0.0 0.0 0 0 19 0 0Wall Tiles 16 10 11 2,700 0.0 0.0 0 0 0 0 43 87 0 0 0 0
Slaughterhouse 2,629 1,100 14,000 540 65.4 67.8 2,892 2,892 36,806 36,806 1,420 1,420 172 172 178 178from 15111to 15119
Total 91,813 - - - - -
from 27111to 27322
81,475 511,910 137,714 9,071 5,486
from 26111to 26999
from 29111to 29393
Item of ProductionWastewater
(m3/day)
Estimated Wastewater Quality Estimated Pollution Load (Generation, kg/day)
BOD CODCr SS
from 15131to 15543,except 15141
from 17111to 18230
T-N T-P
from 24111to 24310
from 20111to 20295
from 19111to 19250
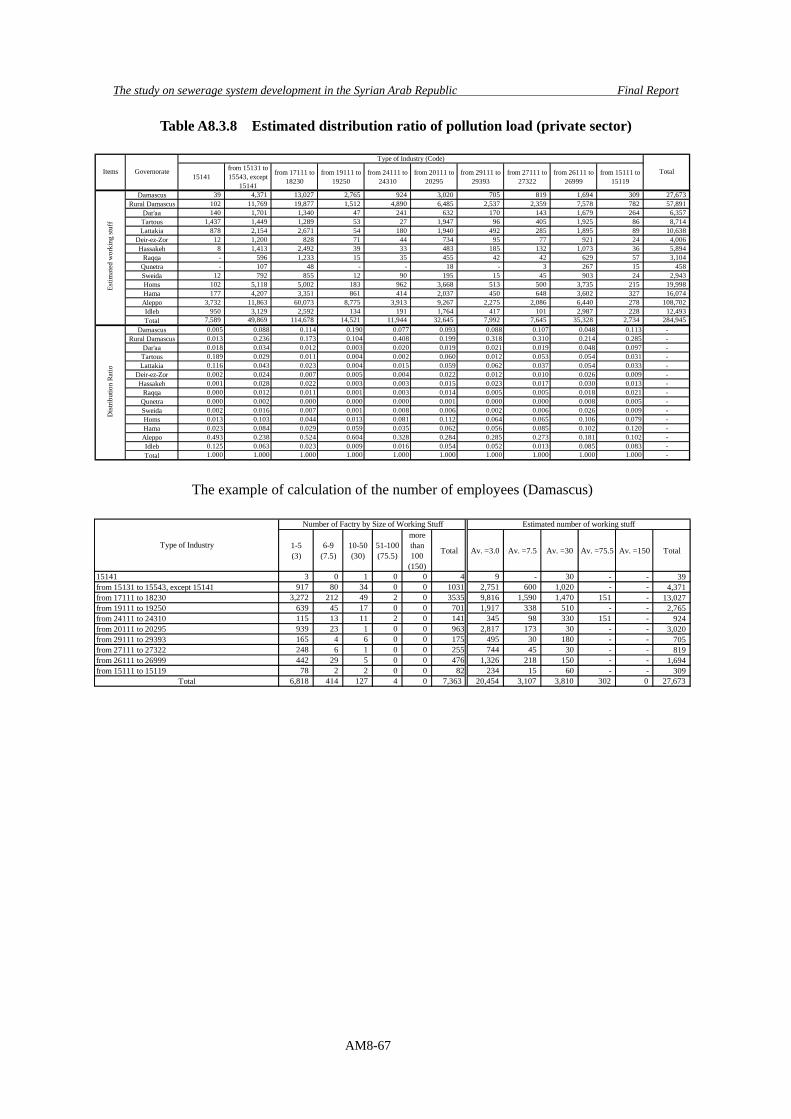
The study on sewerage system development in the Syrian Arab Republic Final Report
AM8-67
Table A8.3.8 Estimated distribution ratio of pollution load (private sector)
15141from 15131 to15543, except
15141
from 17111 to18230
from 19111 to19250
from 24111 to24310
from 20111 to20295
from 29111 to29393
from 27111 to27322
from 26111 to26999
from 15111 to15119
Damascus 39 4,371 13,027 2,765 924 3,020 705 819 1,694 309 27,673 Rural Damascus 102 11,769 19,877 1,512 4,890 6,485 2,537 2,359 7,578 782 57,891
Dar'aa 140 1,701 1,340 47 241 632 170 143 1,679 264 6,357 Tartous 1,437 1,449 1,289 53 27 1,947 96 405 1,925 86 8,714 Lattakia 878 2,154 2,671 54 180 1,940 492 285 1,895 89 10,638
Deir-ez-Zor 12 1,200 828 71 44 734 95 77 921 24 4,006 Hassakeh 8 1,413 2,492 39 33 483 185 132 1,073 36 5,894
Raqqa - 596 1,233 15 35 455 42 42 629 57 3,104 Qunetra - 107 48 - - 18 - 3 267 15 458 Sweida 12 792 855 12 90 195 15 45 903 24 2,943 Homs 102 5,118 5,002 183 962 3,668 513 500 3,735 215 19,998 Hama 177 4,207 3,351 861 414 2,037 450 648 3,602 327 16,074 Aleppo 3,732 11,863 60,073 8,775 3,913 9,267 2,275 2,086 6,440 278 108,702 Idleb 950 3,129 2,592 134 191 1,764 417 101 2,987 228 12,493 Total 7,589 49,869 114,678 14,521 11,944 32,645 7,992 7,645 35,328 2,734 284,945
Damascus 0.005 0.088 0.114 0.190 0.077 0.093 0.088 0.107 0.048 0.113 -Rural Damascus 0.013 0.236 0.173 0.104 0.408 0.199 0.318 0.310 0.214 0.285 -
Dar'aa 0.018 0.034 0.012 0.003 0.020 0.019 0.021 0.019 0.048 0.097 -Tartous 0.189 0.029 0.011 0.004 0.002 0.060 0.012 0.053 0.054 0.031 -Lattakia 0.116 0.043 0.023 0.004 0.015 0.059 0.062 0.037 0.054 0.033 -
Deir-ez-Zor 0.002 0.024 0.007 0.005 0.004 0.022 0.012 0.010 0.026 0.009 -Hassakeh 0.001 0.028 0.022 0.003 0.003 0.015 0.023 0.017 0.030 0.013 -
Raqqa 0.000 0.012 0.011 0.001 0.003 0.014 0.005 0.005 0.018 0.021 -Qunetra 0.000 0.002 0.000 0.000 0.000 0.001 0.000 0.000 0.008 0.005 -Sweida 0.002 0.016 0.007 0.001 0.008 0.006 0.002 0.006 0.026 0.009 -Homs 0.013 0.103 0.044 0.013 0.081 0.112 0.064 0.065 0.106 0.079 -Hama 0.023 0.084 0.029 0.059 0.035 0.062 0.056 0.085 0.102 0.120 -Aleppo 0.493 0.238 0.524 0.604 0.328 0.284 0.285 0.273 0.181 0.102 -Idleb 0.125 0.063 0.023 0.009 0.016 0.054 0.052 0.013 0.085 0.083 -Total 1.000 1.000 1.000 1.000 1.000 1.000 1.000 1.000 1.000 1.000 -
Estim
ated
wor
king
stuf
fD
istri
butio
n R
atio
TotalGovernorateItems
Type of Industry (Code)
The example of calculation of the number of employees (Damascus)
1-5(3)
6-9(7.5)
10-50(30)
51-100(75.5)
morethan100
(150)
Total Av. =3.0 Av. =7.5 Av. =30 Av. =75.5 Av. =150 Total
15141 3 0 1 0 0 4 9 - 30 - - 39 from 15131 to 15543, except 15141 917 80 34 0 0 1031 2,751 600 1,020 - - 4,371 from 17111 to 18230 3,272 212 49 2 0 3535 9,816 1,590 1,470 151 - 13,027 from 19111 to 19250 639 45 17 0 0 701 1,917 338 510 - - 2,765 from 24111 to 24310 115 13 11 2 0 141 345 98 330 151 - 924 from 20111 to 20295 939 23 1 0 0 963 2,817 173 30 - - 3,020 from 29111 to 29393 165 4 6 0 0 175 495 30 180 - - 705 from 27111 to 27322 248 6 1 0 0 255 744 45 30 - - 819 from 26111 to 26999 442 29 5 0 0 476 1,326 218 150 - - 1,694 from 15111 to 15119 78 2 2 0 0 82 234 15 60 - - 309
Total 6,818 414 127 4 0 7,363 20,454 3,107 3,810 302 0 27,673
Type of Industry
Number of Factry by Size of Working Stuff Estimated number of working stuff
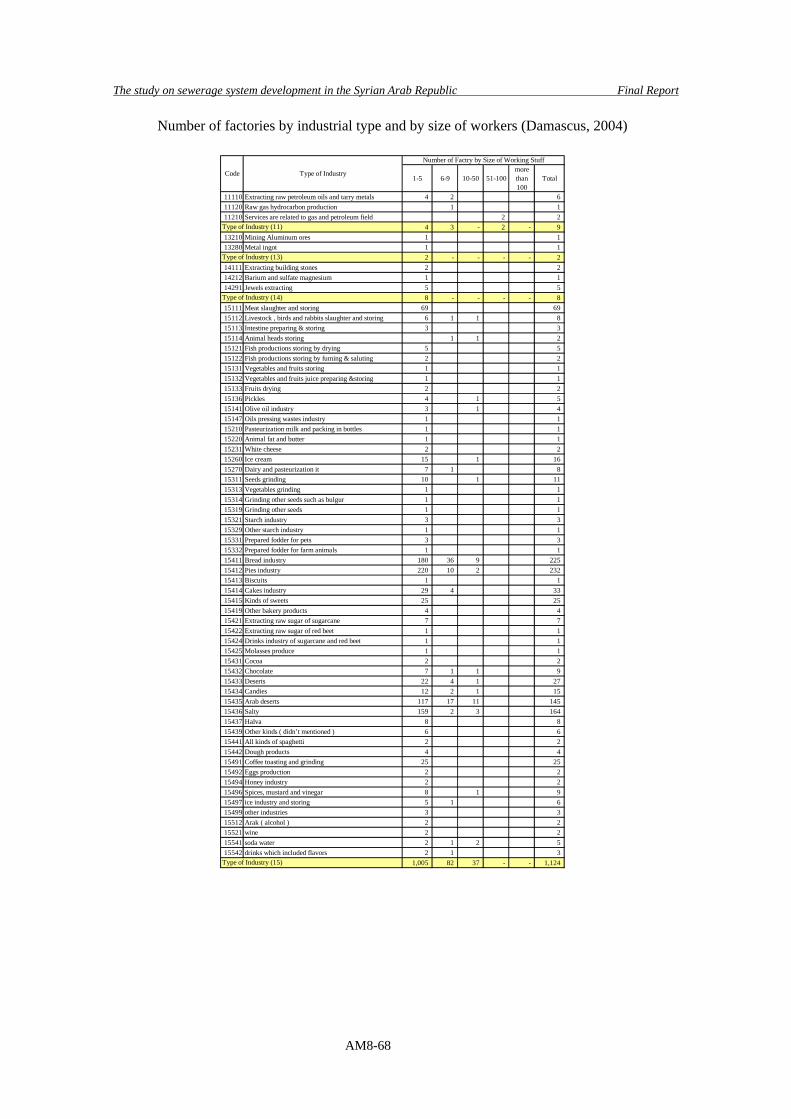
The study on sewerage system development in the Syrian Arab Republic Final Report
AM8-68
Number of factories by industrial type and by size of workers (Damascus, 2004)
1-5 6-9 10-50 51-100morethan100
Total
11110 Extracting raw petroleum oils and tarry metals 4 2 6 11120 Raw gas hydrocarbon production 1 1 11210 Services are related to gas and petroleum field 2 2
4 3 - 2 - 9 13210 Mining Aluminum ores 1 1 13280 Metal ingot 1 1
2 - - - - 2 14111 Extracting building stones 2 2 14212 Barium and sulfate magnesium 1 1 14291 Jewels extracting 5 5
8 - - - - 8 15111 Meat slaughter and storing 69 69 15112 Livestock , birds and rabbits slaughter and storing 6 1 1 8 15113 Intestine preparing & storing 3 3 15114 Animal heads storing 1 1 2 15121 Fish productions storing by drying 5 5 15122 Fish productions storing by fuming & saluting 2 2 15131 Vegetables and fruits storing 1 1 15132 Vegetables and fruits juice preparing &storing 1 1 15133 Fruits drying 2 2 15136 Pickles 4 1 5 15141 Olive oil industry 3 1 4 15147 Oils pressing wastes industry 1 1 15210 Pasteurization milk and packing in bottles 1 1 15220 Animal fat and butter 1 1 15231 White cheese 2 2 15260 Ice cream 15 1 16 15270 Dairy and pasteurization it 7 1 8 15311 Seeds grinding 10 1 11 15313 Vegetables grinding 1 1 15314 Grinding other seeds such as bulgur 1 1 15319 Grinding other seeds 1 1 15321 Starch industry 3 3 15329 Other starch industry 1 1 15331 Prepared fodder for pets 3 3 15332 Prepared fodder for farm animals 1 1 15411 Bread industry 180 36 9 225 15412 Pies industry 220 10 2 232 15413 Biscuits 1 1 15414 Cakes industry 29 4 33 15415 Kinds of sweets 25 25 15419 Other bakery products 4 4 15421 Extracting raw sugar of sugarcane 7 7 15422 Extracting raw sugar of red beet 1 1 15424 Drinks industry of sugarcane and red beet 1 1 15425 Molasses produce 1 1 15431 Cocoa 2 2 15432 Chocolate 7 1 1 9 15433 Deserts 22 4 1 27 15434 Candies 12 2 1 15 15435 Arab deserts 117 17 11 145 15436 Salty 159 2 3 164 15437 Halva 8 8 15439 Other kinds ( didn’t mentioned ) 6 6 15441 All kinds of spaghetti 2 2 15442 Dough products 4 4 15491 Coffee toasting and grinding 25 25 15492 Eggs production 2 2 15494 Honey industry 2 2 15496 Spices, mustard and vinegar 8 1 9 15497 ice industry and storing 5 1 6 15499 other industries 3 3 15512 Arak ( alcohol ) 2 2 15521 wine 2 2 15541 soda water 2 1 2 5 15542 drinks which included flavors 2 1 3
1,005 82 37 - - 1,124
Type of Industry (11)
Type of Industry (13)
Type of Industry (14)
Number of Factry by Size of Working Stuff
Type of IndustryCode
Type of Industry (15)
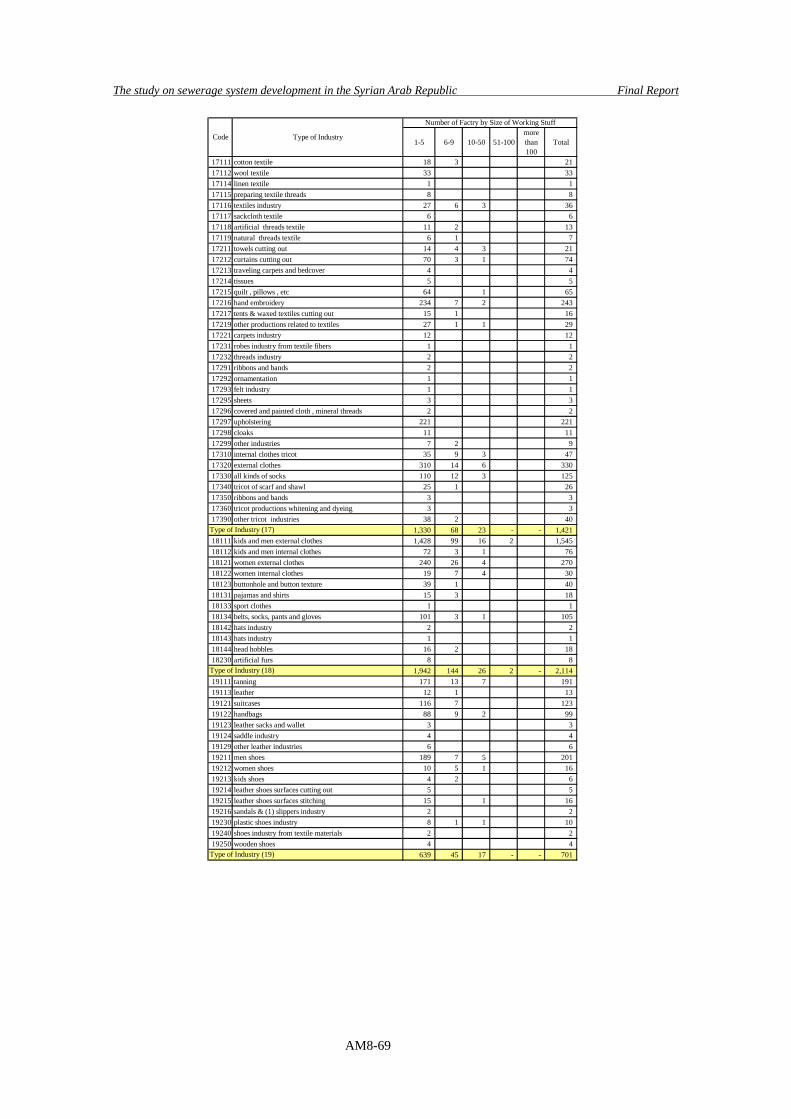
The study on sewerage system development in the Syrian Arab Republic Final Report
AM8-69
1-5 6-9 10-50 51-100morethan100
Total
17111 cotton textile 18 3 21 17112 wool textile 33 33 17114 linen textile 1 1 17115 preparing textile threads 8 8 17116 textiles industry 27 6 3 36 17117 sackcloth textile 6 6 17118 artificial threads textile 11 2 13 17119 natural threads textile 6 1 7 17211 towels cutting out 14 4 3 21 17212 curtains cutting out 70 3 1 74 17213 traveling carpets and bedcover 4 4 17214 tissues 5 5 17215 quilt , pillows , etc 64 1 65 17216 hand embroidery 234 7 2 243 17217 tents & waxed textiles cutting out 15 1 16 17219 other productions related to textiles 27 1 1 29 17221 carpets industry 12 12 17231 robes industry from textile fibers 1 1 17232 threads industry 2 2 17291 ribbons and bands 2 2 17292 ornamentation 1 1 17293 felt industry 1 1 17295 sheets 3 3 17296 covered and painted cloth , mineral threads 2 2 17297 upholstering 221 221 17298 cloaks 11 11 17299 other industries 7 2 9 17310 internal clothes tricot 35 9 3 47 17320 external clothes 310 14 6 330 17330 all kinds of socks 110 12 3 125 17340 tricot of scarf and shawl 25 1 26 17350 ribbons and bands 3 3 17360 tricot productions whitening and dyeing 3 3 17390 other tricot industries 38 2 40
1,330 68 23 - - 1,421 18111 kids and men external clothes 1,428 99 16 2 1,545 18112 kids and men internal clothes 72 3 1 76 18121 women external clothes 240 26 4 270 18122 women internal clothes 19 7 4 30 18123 buttonhole and button texture 39 1 40 18131 pajamas and shirts 15 3 18 18133 sport clothes 1 1 18134 belts, socks, pants and gloves 101 3 1 105 18142 hats industry 2 2 18143 hats industry 1 1 18144 head hobbles 16 2 18 18230 artificial furs 8 8
1,942 144 26 2 - 2,114 19111 tanning 171 13 7 191 19113 leather 12 1 13 19121 suitcases 116 7 123 19122 handbags 88 9 2 99 19123 leather sacks and wallet 3 3 19124 saddle industry 4 4 19129 other leather industries 6 6 19211 men shoes 189 7 5 201 19212 women shoes 10 5 1 16 19213 kids shoes 4 2 6 19214 leather shoes surfaces cutting out 5 5 19215 leather shoes surfaces stitching 15 1 16 19216 sandals & (1) slippers industry 2 2 19230 plastic shoes industry 8 1 1 10 19240 shoes industry from textile materials 2 2 19250 wooden shoes 4 4
639 45 17 - - 701
Number of Factry by Size of Working Stuff
Type of IndustryCode
Type of Industry (19)
Type of Industry (17)
Type of Industry (18)
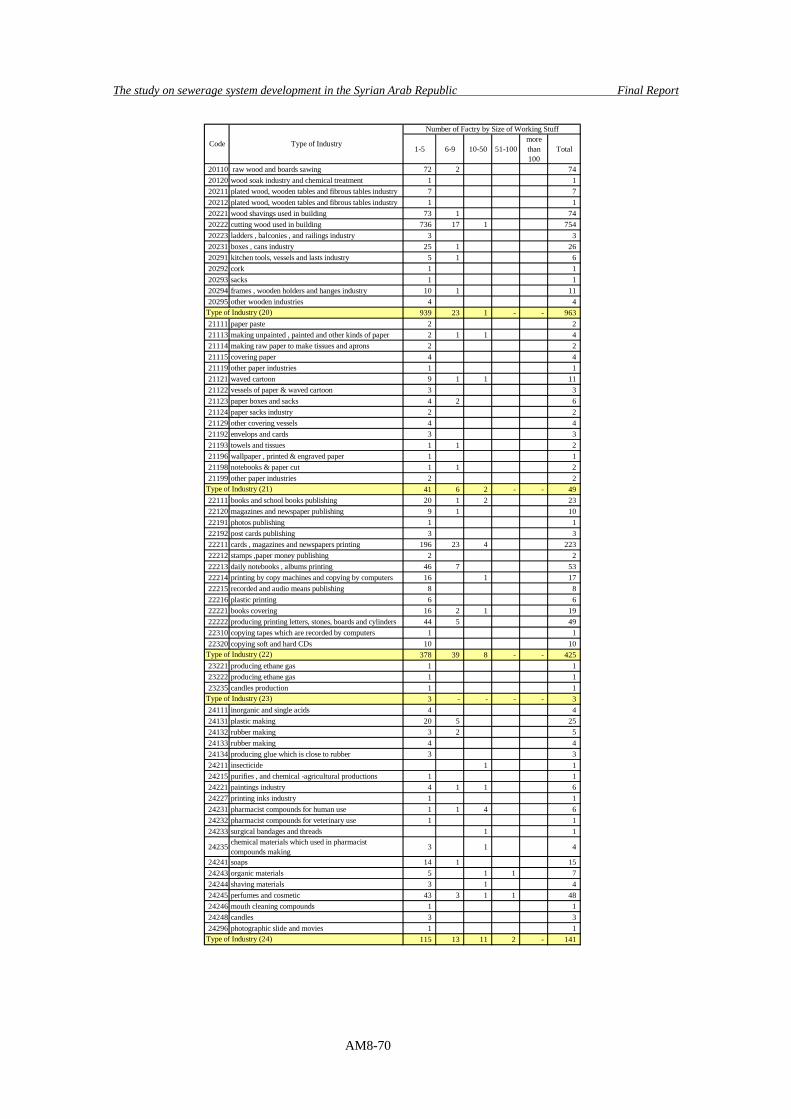
The study on sewerage system development in the Syrian Arab Republic Final Report
AM8-70
1-5 6-9 10-50 51-100morethan100
Total
20110 raw wood and boards sawing 72 2 74 20120 wood soak industry and chemical treatment 1 1 20211 plated wood, wooden tables and fibrous tables industry 7 7 20212 plated wood, wooden tables and fibrous tables industry 1 1 20221 wood shavings used in building 73 1 74 20222 cutting wood used in building 736 17 1 754 20223 ladders , balconies , and railings industry 3 3 20231 boxes , cans industry 25 1 26 20291 kitchen tools, vessels and lasts industry 5 1 6 20292 cork 1 1 20293 sacks 1 1 20294 frames , wooden holders and hanges industry 10 1 11 20295 other wooden industries 4 4
939 23 1 - - 963 21111 paper paste 2 2 21113 making unpainted , painted and other kinds of paper 2 1 1 4 21114 making raw paper to make tissues and aprons 2 2 21115 covering paper 4 4 21119 other paper industries 1 1 21121 waved cartoon 9 1 1 11 21122 vessels of paper & waved cartoon 3 3 21123 paper boxes and sacks 4 2 6 21124 paper sacks industry 2 2 21129 other covering vessels 4 4 21192 envelops and cards 3 3 21193 towels and tissues 1 1 2 21196 wallpaper , printed & engraved paper 1 1 21198 notebooks & paper cut 1 1 2 21199 other paper industries 2 2
41 6 2 - - 49 22111 books and school books publishing 20 1 2 23 22120 magazines and newspaper publishing 9 1 10 22191 photos publishing 1 1 22192 post cards publishing 3 3 22211 cards , magazines and newspapers printing 196 23 4 223 22212 stamps ,paper money publishing 2 2 22213 daily notebooks , albums printing 46 7 53 22214 printing by copy machines and copying by computers 16 1 17 22215 recorded and audio means publishing 8 8 22216 plastic printing 6 6 22221 books covering 16 2 1 19 22222 producing printing letters, stones, boards and cylinders 44 5 49 22310 copying tapes which are recorded by computers 1 1 22320 copying soft and hard CDs 10 10
378 39 8 - - 425 23221 producing ethane gas 1 1 23222 producing ethane gas 1 1 23235 candles production 1 1
3 - - - - 3 24111 inorganic and single acids 4 4 24131 plastic making 20 5 25 24132 rubber making 3 2 5 24133 rubber making 4 4 24134 producing glue which is close to rubber 3 3 24211 insecticide 1 1 24215 purifies , and chemical -agricultural productions 1 1 24221 paintings industry 4 1 1 6 24227 printing inks industry 1 1 24231 pharmacist compounds for human use 1 1 4 6 24232 pharmacist compounds for veterinary use 1 1 24233 surgical bandages and threads 1 1
24235 chemical materials which used in pharmacistcompounds making 3 1 4
24241 soaps 14 1 15 24243 organic materials 5 1 1 7 24244 shaving materials 3 1 4 24245 perfumes and cosmetic 43 3 1 1 48 24246 mouth cleaning compounds 1 1 24248 candles 3 3 24296 photographic slide and movies 1 1
115 13 11 2 - 141
Number of Factry by Size of Working Stuff
Type of IndustryCode
Type of Industry (20)
Type of Industry (21)
Type of Industry (22)
Type of Industry (23)
Type of Industry (24)
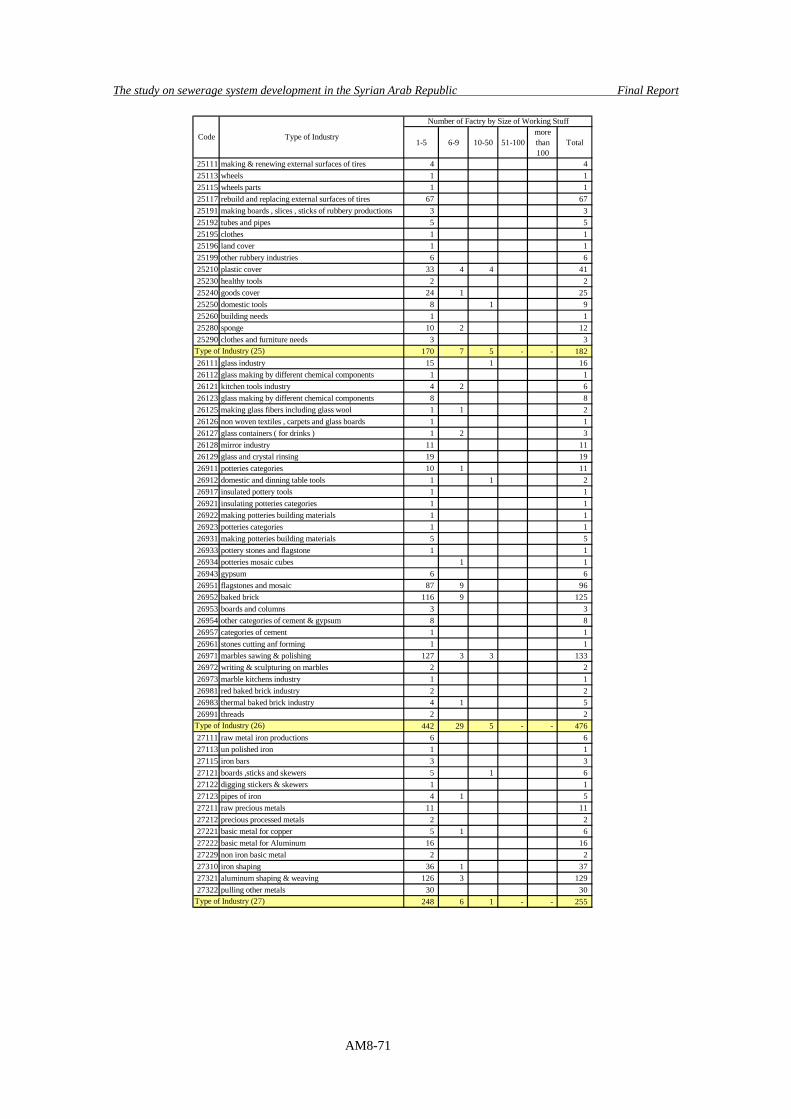
The study on sewerage system development in the Syrian Arab Republic Final Report
AM8-71
1-5 6-9 10-50 51-100morethan100
Total
25111 making & renewing external surfaces of tires 4 4 25113 wheels 1 1 25115 wheels parts 1 1 25117 rebuild and replacing external surfaces of tires 67 67 25191 making boards , slices , sticks of rubbery productions 3 3 25192 tubes and pipes 5 5 25195 clothes 1 1 25196 land cover 1 1 25199 other rubbery industries 6 6 25210 plastic cover 33 4 4 41 25230 healthy tools 2 2 25240 goods cover 24 1 25 25250 domestic tools 8 1 9 25260 building needs 1 1 25280 sponge 10 2 12 25290 clothes and furniture needs 3 3
170 7 5 - - 182 26111 glass industry 15 1 16 26112 glass making by different chemical components 1 1 26121 kitchen tools industry 4 2 6 26123 glass making by different chemical components 8 8 26125 making glass fibers including glass wool 1 1 2 26126 non woven textiles , carpets and glass boards 1 1 26127 glass containers ( for drinks ) 1 2 3 26128 mirror industry 11 11 26129 glass and crystal rinsing 19 19 26911 potteries categories 10 1 11 26912 domestic and dinning table tools 1 1 2 26917 insulated pottery tools 1 1 26921 insulating potteries categories 1 1 26922 making potteries building materials 1 1 26923 potteries categories 1 1 26931 making potteries building materials 5 5 26933 pottery stones and flagstone 1 1 26934 potteries mosaic cubes 1 1 26943 gypsum 6 6 26951 flagstones and mosaic 87 9 96 26952 baked brick 116 9 125 26953 boards and columns 3 3 26954 other categories of cement & gypsum 8 8 26957 categories of cement 1 1 26961 stones cutting anf forming 1 1 26971 marbles sawing & polishing 127 3 3 133 26972 writing & sculpturing on marbles 2 2 26973 marble kitchens industry 1 1 26981 red baked brick industry 2 2 26983 thermal baked brick industry 4 1 5 26991 threads 2 2
442 29 5 - - 476 27111 raw metal iron productions 6 6 27113 un polished iron 1 1 27115 iron bars 3 3 27121 boards ,sticks and skewers 5 1 6 27122 digging stickers & skewers 1 1 27123 pipes of iron 4 1 5 27211 raw precious metals 11 11 27212 precious processed metals 2 2 27221 basic metal for copper 5 1 6 27222 basic metal for Aluminum 16 16 27229 non iron basic metal 2 2 27310 iron shaping 36 1 37 27321 aluminum shaping & weaving 126 3 129 27322 pulling other metals 30 30
248 6 1 - - 255
Number of Factry by Size of Working Stuff
Type of IndustryCode
Type of Industry (25)
Type of Industry (26)
Type of Industry (27)
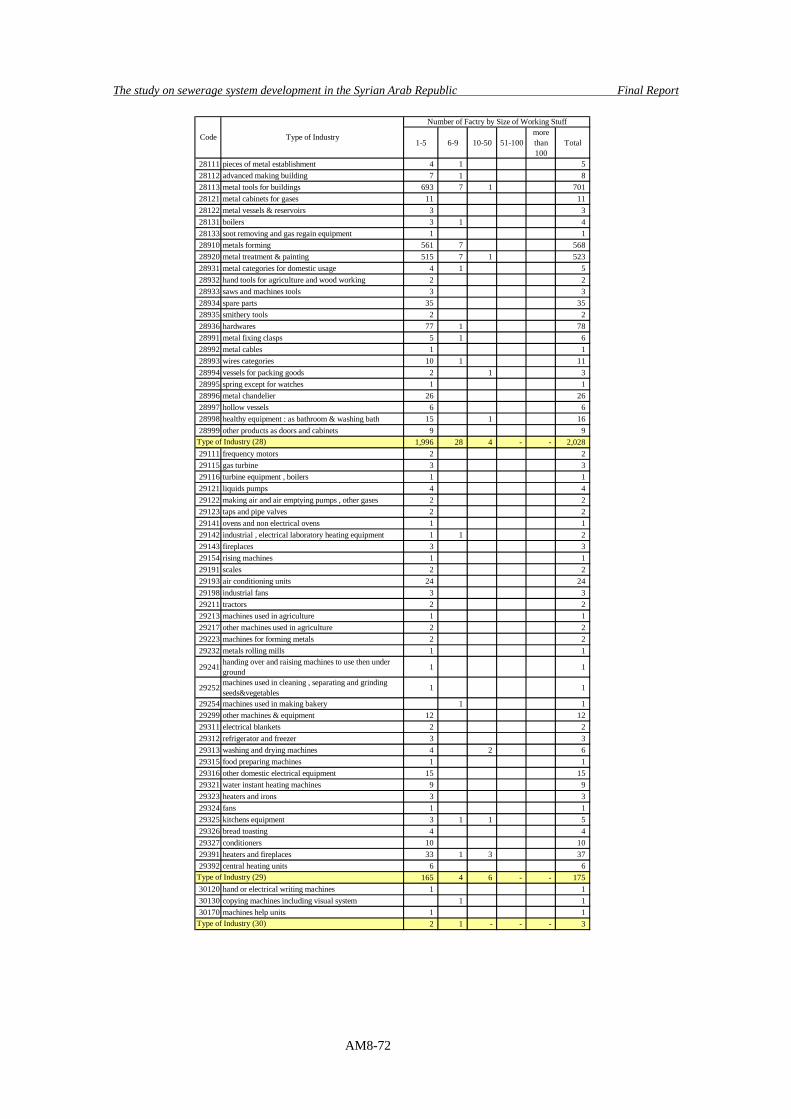
The study on sewerage system development in the Syrian Arab Republic Final Report
AM8-72
1-5 6-9 10-50 51-100morethan100
Total
28111 pieces of metal establishment 4 1 5 28112 advanced making building 7 1 8 28113 metal tools for buildings 693 7 1 701 28121 metal cabinets for gases 11 11 28122 metal vessels & reservoirs 3 3 28131 boilers 3 1 4 28133 soot removing and gas regain equipment 1 1 28910 metals forming 561 7 568 28920 metal treatment & painting 515 7 1 523 28931 metal categories for domestic usage 4 1 5 28932 hand tools for agriculture and wood working 2 2 28933 saws and machines tools 3 3 28934 spare parts 35 35 28935 smithery tools 2 2 28936 hardwares 77 1 78 28991 metal fixing clasps 5 1 6 28992 metal cables 1 1 28993 wires categories 10 1 11 28994 vessels for packing goods 2 1 3 28995 spring except for watches 1 1 28996 metal chandelier 26 26 28997 hollow vessels 6 6 28998 healthy equipment : as bathroom & washing bath 15 1 16 28999 other products as doors and cabinets 9 9
1,996 28 4 - - 2,028 29111 frequency motors 2 2 29115 gas turbine 3 3 29116 turbine equipment , boilers 1 1 29121 liquids pumps 4 4 29122 making air and air emptying pumps , other gases 2 2 29123 taps and pipe valves 2 2 29141 ovens and non electrical ovens 1 1 29142 industrial , electrical laboratory heating equipment 1 1 2 29143 fireplaces 3 3 29154 rising machines 1 1 29191 scales 2 2 29193 air conditioning units 24 24 29198 industrial fans 3 3 29211 tractors 2 2 29213 machines used in agriculture 1 1 29217 other machines used in agriculture 2 2 29223 machines for forming metals 2 2 29232 metals rolling mills 1 1
29241 handing over and raising machines to use then underground 1 1
29252 machines used in cleaning , separating and grindingseeds&vegetables 1 1
29254 machines used in making bakery 1 1 29299 other machines & equipment 12 12 29311 electrical blankets 2 2 29312 refrigerator and freezer 3 3 29313 washing and drying machines 4 2 6 29315 food preparing machines 1 1 29316 other domestic electrical equipment 15 15 29321 water instant heating machines 9 9 29323 heaters and irons 3 3 29324 fans 1 1 29325 kitchens equipment 3 1 1 5 29326 bread toasting 4 4 29327 conditioners 10 10 29391 heaters and fireplaces 33 1 3 37 29392 central heating units 6 6
165 4 6 - - 175 30120 hand or electrical writing machines 1 1 30130 copying machines including visual system 1 1 30170 machines help units 1 1
2 1 - - - 3
Number of Factry by Size of Working Stuff
Type of IndustryCode
Type of Industry (28)
Type of Industry (29)
Type of Industry (30)
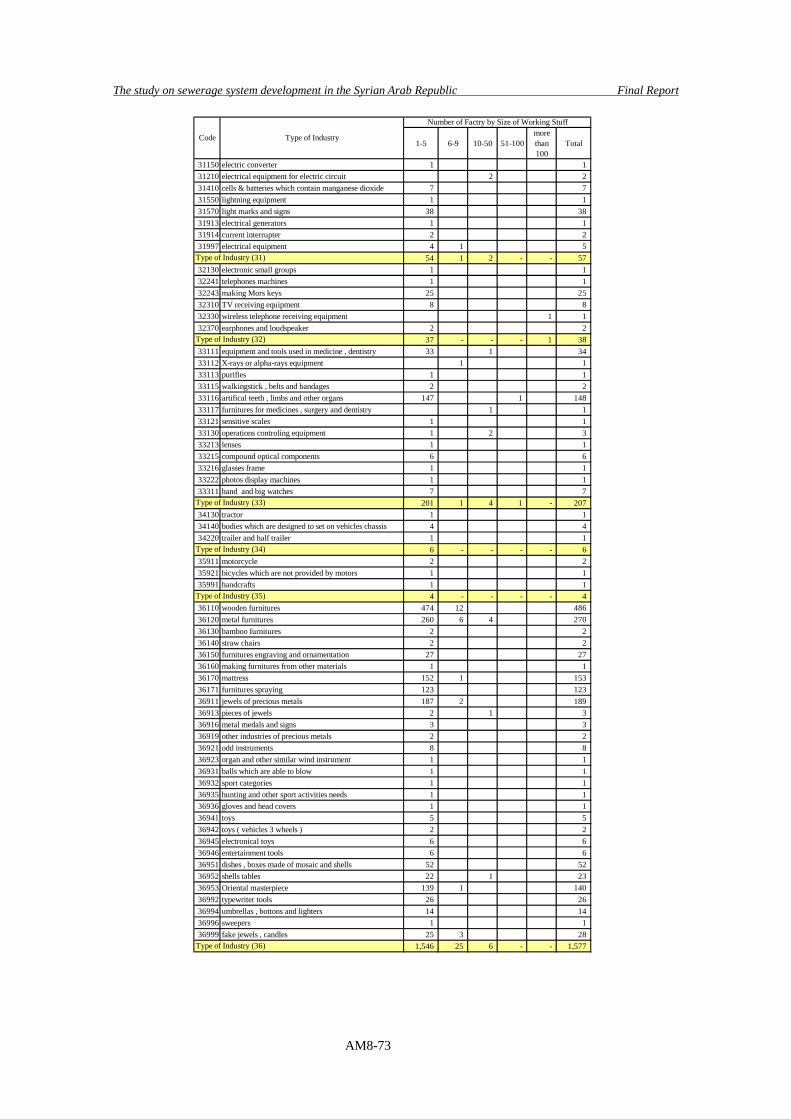
The study on sewerage system development in the Syrian Arab Republic Final Report
AM8-73
1-5 6-9 10-50 51-100morethan100
Total
31150 electric converter 1 1 31210 electrical equipment for electric circuit 2 2 31410 cells & batteries which contain manganese dioxide 7 7 31550 lightning equipment 1 1 31570 light marks and signs 38 38 31913 electrical generators 1 1 31914 current interrupter 2 2 31997 electrical equipment 4 1 5
54 1 2 - - 57 32130 electronic small groups 1 1 32241 telephones machines 1 1 32243 making Mors keys 25 25 32310 TV receiving equipment 8 8 32330 wireless telephone receiving equipment 1 1 32370 earphones and loudspeaker 2 2
37 - - - 1 38 33111 equipment and tools used in medicine , dentistry 33 1 34 33112 X-rays or alpha-rays equipment 1 1 33113 purifies 1 1 33115 walkingstick , belts and bandages 2 2 33116 artifical teeth , limbs and other organs 147 1 148 33117 furnitures for medicines , surgery and dentistry 1 1 33121 sensitive scales 1 1 33130 operations controling equipment 1 2 3 33213 lenses 1 1 33215 compound optical components 6 6 33216 glasses frame 1 1 33222 photos display machines 1 1 33311 hand and big watches 7 7
201 1 4 1 - 207 34130 tractor 1 1 34140 bodies which are designed to set on vehicles chassis 4 4 34220 trailer and half trailer 1 1
6 - - - - 6 35911 motorcycle 2 2 35921 bicycles which are not provided by motors 1 1 35991 handcrafts 1 1
4 - - - - 4 36110 wooden furnitures 474 12 486 36120 metal furnitures 260 6 4 270 36130 bamboo furnitures 2 2 36140 straw chairs 2 2 36150 furnitures engraving and ornamentation 27 27 36160 making furnitures from other materials 1 1 36170 mattress 152 1 153 36171 furnitures spraying 123 123 36911 jewels of precious metals 187 2 189 36913 pieces of jewels 2 1 3 36916 metal medals and signs 3 3 36919 other industries of precious metals 2 2 36921 odd instruments 8 8 36923 organ and other similar wind instrument 1 1 36931 balls which are able to blow 1 1 36932 sport categories 1 1 36935 hunting and other sport activities needs 1 1 36936 gloves and head covers 1 1 36941 toys 5 5 36942 toys ( vehicles 3 wheels ) 2 2 36945 electronical toys 6 6 36946 entertainment tools 6 6 36951 dishes , boxes made of mosaic and shells 52 52 36952 shells tables 22 1 23 36953 Oriental masterpiece 139 1 140 36992 typewriter tools 26 26 36994 umbrellas , bottons and lighters 14 14 36996 sweepers 1 1 36999 fake jewels , candles 25 3 28
1,546 25 6 - - 1,577
Number of Factry by Size of Working Stuff
Type of IndustryCode
Type of Industry (31)
Type of Industry (32)
Type of Industry (33)
Type of Industry (34)
Type of Industry (35)
Type of Industry (36)
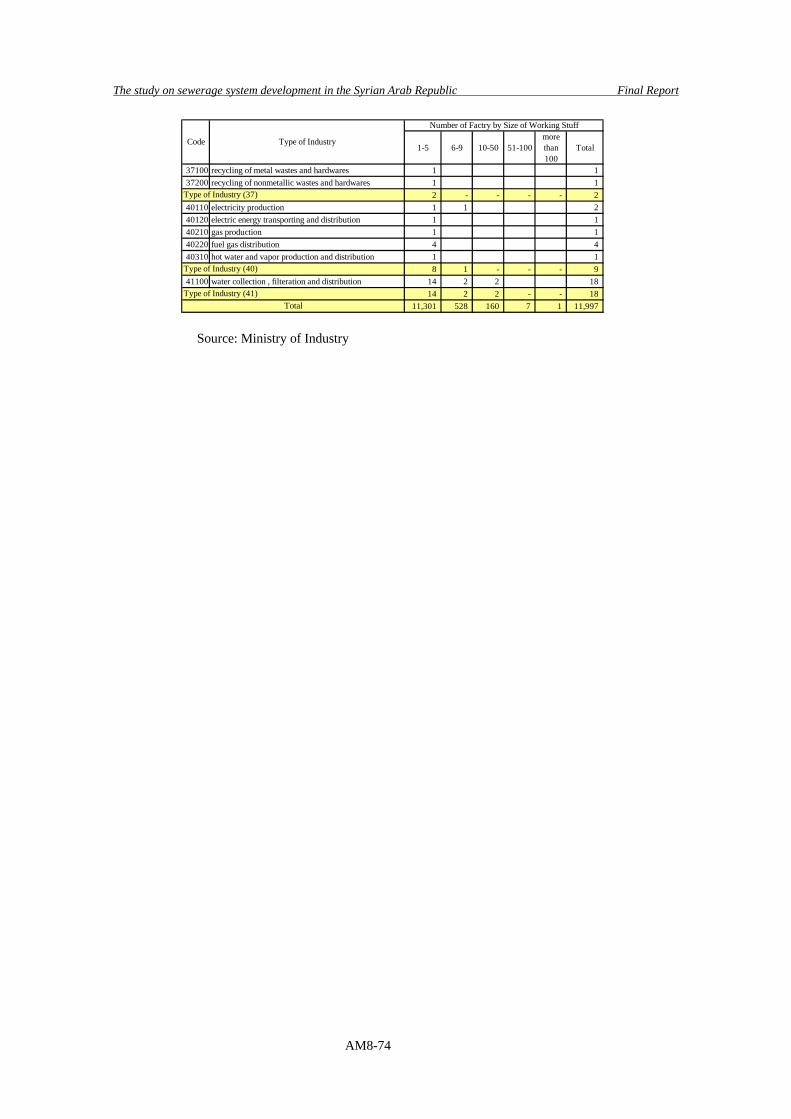
The study on sewerage system development in the Syrian Arab Republic Final Report
AM8-74
1-5 6-9 10-50 51-100morethan100
Total
37100 recycling of metal wastes and hardwares 1 1 37200 recycling of nonmetallic wastes and hardwares 1 1
2 - - - - 2 40110 electricity production 1 1 2 40120 electric energy transporting and distribution 1 1 40210 gas production 1 1 40220 fuel gas distribution 4 4 40310 hot water and vapor production and distribution 1 1
8 1 - - - 9 41100 water collection , filteration and distribution 14 2 2 18
14 2 2 - - 18 11,301 528 160 7 1 11,997
Number of Factry by Size of Working Stuff
Type of IndustryCode
Type of Industry (40)
Type of Industry (41)Total
Type of Industry (37)
Source: Ministry of Industry
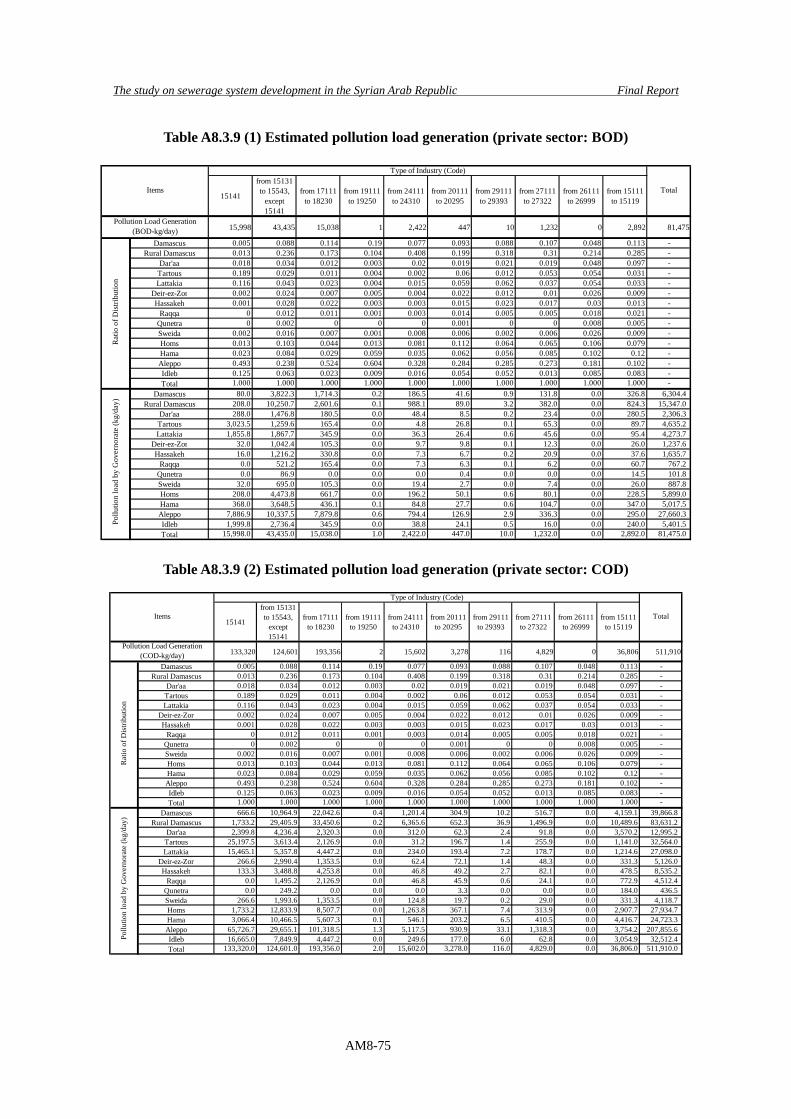
The study on sewerage system development in the Syrian Arab Republic Final Report
AM8-75
Table A8.3.9 (1) Estimated pollution load generation (private sector: BOD)
15141
from 15131to 15543,
except15141
from 17111to 18230
from 19111to 19250
from 24111to 24310
from 20111to 20295
from 29111to 29393
from 27111to 27322
from 26111to 26999
from 15111to 15119
15,998 43,435 15,038 1 2,422 447 10 1,232 0 2,892 81,475
Damascus 0.005 0.088 0.114 0.19 0.077 0.093 0.088 0.107 0.048 0.113 -Rural Damascus 0.013 0.236 0.173 0.104 0.408 0.199 0.318 0.31 0.214 0.285 -
Dar'aa 0.018 0.034 0.012 0.003 0.02 0.019 0.021 0.019 0.048 0.097 -Tartous 0.189 0.029 0.011 0.004 0.002 0.06 0.012 0.053 0.054 0.031 -Lattakia 0.116 0.043 0.023 0.004 0.015 0.059 0.062 0.037 0.054 0.033 -
Deir-ez-Zor 0.002 0.024 0.007 0.005 0.004 0.022 0.012 0.01 0.026 0.009 -Hassakeh 0.001 0.028 0.022 0.003 0.003 0.015 0.023 0.017 0.03 0.013 -
Raqqa 0 0.012 0.011 0.001 0.003 0.014 0.005 0.005 0.018 0.021 -Qunetra 0 0.002 0 0 0 0.001 0 0 0.008 0.005 -Sweida 0.002 0.016 0.007 0.001 0.008 0.006 0.002 0.006 0.026 0.009 -Homs 0.013 0.103 0.044 0.013 0.081 0.112 0.064 0.065 0.106 0.079 -Hama 0.023 0.084 0.029 0.059 0.035 0.062 0.056 0.085 0.102 0.12 -Aleppo 0.493 0.238 0.524 0.604 0.328 0.284 0.285 0.273 0.181 0.102 -Idleb 0.125 0.063 0.023 0.009 0.016 0.054 0.052 0.013 0.085 0.083 -Total 1.000 1.000 1.000 1.000 1.000 1.000 1.000 1.000 1.000 1.000 -
Damascus 80.0 3,822.3 1,714.3 0.2 186.5 41.6 0.9 131.8 0.0 326.8 6,304.4Rural Damascus 208.0 10,250.7 2,601.6 0.1 988.1 89.0 3.2 382.0 0.0 824.3 15,347.0
Dar'aa 288.0 1,476.8 180.5 0.0 48.4 8.5 0.2 23.4 0.0 280.5 2,306.3Tartous 3,023.5 1,259.6 165.4 0.0 4.8 26.8 0.1 65.3 0.0 89.7 4,635.2Lattakia 1,855.8 1,867.7 345.9 0.0 36.3 26.4 0.6 45.6 0.0 95.4 4,273.7
Deir-ez-Zor 32.0 1,042.4 105.3 0.0 9.7 9.8 0.1 12.3 0.0 26.0 1,237.6Hassakeh 16.0 1,216.2 330.8 0.0 7.3 6.7 0.2 20.9 0.0 37.6 1,635.7
Raqqa 0.0 521.2 165.4 0.0 7.3 6.3 0.1 6.2 0.0 60.7 767.2Qunetra 0.0 86.9 0.0 0.0 0.0 0.4 0.0 0.0 0.0 14.5 101.8Sweida 32.0 695.0 105.3 0.0 19.4 2.7 0.0 7.4 0.0 26.0 887.8Homs 208.0 4,473.8 661.7 0.0 196.2 50.1 0.6 80.1 0.0 228.5 5,899.0Hama 368.0 3,648.5 436.1 0.1 84.8 27.7 0.6 104.7 0.0 347.0 5,017.5Aleppo 7,886.9 10,337.5 7,879.8 0.6 794.4 126.9 2.9 336.3 0.0 295.0 27,660.3Idleb 1,999.8 2,736.4 345.9 0.0 38.8 24.1 0.5 16.0 0.0 240.0 5,401.5Total 15,998.0 43,435.0 15,038.0 1.0 2,422.0 447.0 10.0 1,232.0 0.0 2,892.0 81,475.0
Type of Industry (Code)
TotalItems
Pollution Load Generation(BOD-kg/day)
Rat
io o
f Dis
tribu
tion
Pollu
tion
load
by
Gov
erno
rate
(kg/
day)
Table A8.3.9 (2) Estimated pollution load generation (private sector: COD)
15141
from 15131to 15543,
except15141
from 17111to 18230
from 19111to 19250
from 24111to 24310
from 20111to 20295
from 29111to 29393
from 27111to 27322
from 26111to 26999
from 15111to 15119
133,320 124,601 193,356 2 15,602 3,278 116 4,829 0 36,806 511,910
Damascus 0.005 0.088 0.114 0.19 0.077 0.093 0.088 0.107 0.048 0.113 -Rural Damascus 0.013 0.236 0.173 0.104 0.408 0.199 0.318 0.31 0.214 0.285 -
Dar'aa 0.018 0.034 0.012 0.003 0.02 0.019 0.021 0.019 0.048 0.097 -Tartous 0.189 0.029 0.011 0.004 0.002 0.06 0.012 0.053 0.054 0.031 -Lattakia 0.116 0.043 0.023 0.004 0.015 0.059 0.062 0.037 0.054 0.033 -
Deir-ez-Zor 0.002 0.024 0.007 0.005 0.004 0.022 0.012 0.01 0.026 0.009 -Hassakeh 0.001 0.028 0.022 0.003 0.003 0.015 0.023 0.017 0.03 0.013 -
Raqqa 0 0.012 0.011 0.001 0.003 0.014 0.005 0.005 0.018 0.021 -Qunetra 0 0.002 0 0 0 0.001 0 0 0.008 0.005 -Sweida 0.002 0.016 0.007 0.001 0.008 0.006 0.002 0.006 0.026 0.009 -Homs 0.013 0.103 0.044 0.013 0.081 0.112 0.064 0.065 0.106 0.079 -Hama 0.023 0.084 0.029 0.059 0.035 0.062 0.056 0.085 0.102 0.12 -Aleppo 0.493 0.238 0.524 0.604 0.328 0.284 0.285 0.273 0.181 0.102 -Idleb 0.125 0.063 0.023 0.009 0.016 0.054 0.052 0.013 0.085 0.083 -Total 1.000 1.000 1.000 1.000 1.000 1.000 1.000 1.000 1.000 1.000 -
Damascus 666.6 10,964.9 22,042.6 0.4 1,201.4 304.9 10.2 516.7 0.0 4,159.1 39,866.8Rural Damascus 1,733.2 29,405.9 33,450.6 0.2 6,365.6 652.3 36.9 1,496.9 0.0 10,489.6 83,631.2
Dar'aa 2,399.8 4,236.4 2,320.3 0.0 312.0 62.3 2.4 91.8 0.0 3,570.2 12,995.2Tartous 25,197.5 3,613.4 2,126.9 0.0 31.2 196.7 1.4 255.9 0.0 1,141.0 32,564.0Lattakia 15,465.1 5,357.8 4,447.2 0.0 234.0 193.4 7.2 178.7 0.0 1,214.6 27,098.0
Deir-ez-Zor 266.6 2,990.4 1,353.5 0.0 62.4 72.1 1.4 48.3 0.0 331.3 5,126.0Hassakeh 133.3 3,488.8 4,253.8 0.0 46.8 49.2 2.7 82.1 0.0 478.5 8,535.2
Raqqa 0.0 1,495.2 2,126.9 0.0 46.8 45.9 0.6 24.1 0.0 772.9 4,512.4Qunetra 0.0 249.2 0.0 0.0 0.0 3.3 0.0 0.0 0.0 184.0 436.5Sweida 266.6 1,993.6 1,353.5 0.0 124.8 19.7 0.2 29.0 0.0 331.3 4,118.7Homs 1,733.2 12,833.9 8,507.7 0.0 1,263.8 367.1 7.4 313.9 0.0 2,907.7 27,934.7Hama 3,066.4 10,466.5 5,607.3 0.1 546.1 203.2 6.5 410.5 0.0 4,416.7 24,723.3Aleppo 65,726.7 29,655.1 101,318.5 1.3 5,117.5 930.9 33.1 1,318.3 0.0 3,754.2 207,855.6Idleb 16,665.0 7,849.9 4,447.2 0.0 249.6 177.0 6.0 62.8 0.0 3,054.9 32,512.4Total 133,320.0 124,601.0 193,356.0 2.0 15,602.0 3,278.0 116.0 4,829.0 0.0 36,806.0 511,910.0
Items
Type of Industry (Code)
Total
Pollution Load Generation(COD-kg/day)
Rat
io o
f Dis
tribu
tion
Pollu
tion
load
by
Gov
erno
rate
(kg/
day)
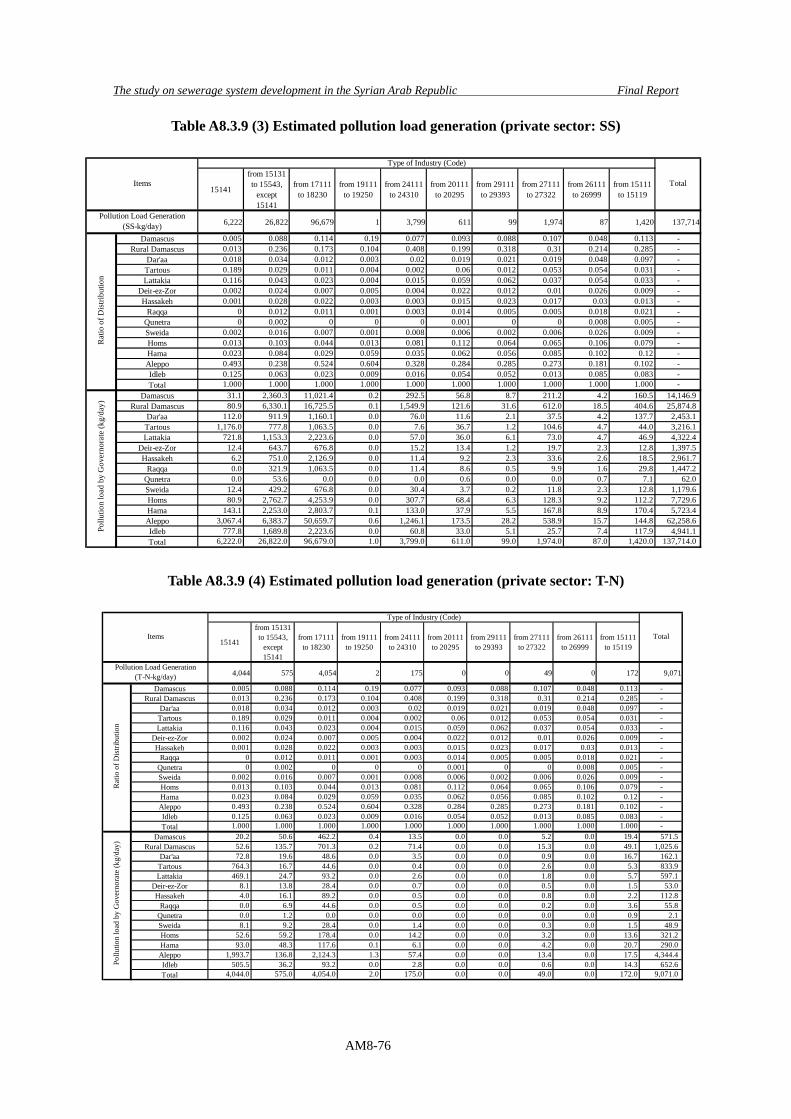
The study on sewerage system development in the Syrian Arab Republic Final Report
AM8-76
Table A8.3.9 (3) Estimated pollution load generation (private sector: SS)
15141
from 15131to 15543,
except15141
from 17111to 18230
from 19111to 19250
from 24111to 24310
from 20111to 20295
from 29111to 29393
from 27111to 27322
from 26111to 26999
from 15111to 15119
6,222 26,822 96,679 1 3,799 611 99 1,974 87 1,420 137,714
Damascus 0.005 0.088 0.114 0.19 0.077 0.093 0.088 0.107 0.048 0.113 -Rural Damascus 0.013 0.236 0.173 0.104 0.408 0.199 0.318 0.31 0.214 0.285 -
Dar'aa 0.018 0.034 0.012 0.003 0.02 0.019 0.021 0.019 0.048 0.097 -Tartous 0.189 0.029 0.011 0.004 0.002 0.06 0.012 0.053 0.054 0.031 -Lattakia 0.116 0.043 0.023 0.004 0.015 0.059 0.062 0.037 0.054 0.033 -
Deir-ez-Zor 0.002 0.024 0.007 0.005 0.004 0.022 0.012 0.01 0.026 0.009 -Hassakeh 0.001 0.028 0.022 0.003 0.003 0.015 0.023 0.017 0.03 0.013 -
Raqqa 0 0.012 0.011 0.001 0.003 0.014 0.005 0.005 0.018 0.021 -Qunetra 0 0.002 0 0 0 0.001 0 0 0.008 0.005 -Sweida 0.002 0.016 0.007 0.001 0.008 0.006 0.002 0.006 0.026 0.009 -Homs 0.013 0.103 0.044 0.013 0.081 0.112 0.064 0.065 0.106 0.079 -Hama 0.023 0.084 0.029 0.059 0.035 0.062 0.056 0.085 0.102 0.12 -Aleppo 0.493 0.238 0.524 0.604 0.328 0.284 0.285 0.273 0.181 0.102 -Idleb 0.125 0.063 0.023 0.009 0.016 0.054 0.052 0.013 0.085 0.083 -Total 1.000 1.000 1.000 1.000 1.000 1.000 1.000 1.000 1.000 1.000 -
Damascus 31.1 2,360.3 11,021.4 0.2 292.5 56.8 8.7 211.2 4.2 160.5 14,146.9Rural Damascus 80.9 6,330.1 16,725.5 0.1 1,549.9 121.6 31.6 612.0 18.5 404.6 25,874.8
Dar'aa 112.0 911.9 1,160.1 0.0 76.0 11.6 2.1 37.5 4.2 137.7 2,453.1Tartous 1,176.0 777.8 1,063.5 0.0 7.6 36.7 1.2 104.6 4.7 44.0 3,216.1Lattakia 721.8 1,153.3 2,223.6 0.0 57.0 36.0 6.1 73.0 4.7 46.9 4,322.4
Deir-ez-Zor 12.4 643.7 676.8 0.0 15.2 13.4 1.2 19.7 2.3 12.8 1,397.5Hassakeh 6.2 751.0 2,126.9 0.0 11.4 9.2 2.3 33.6 2.6 18.5 2,961.7
Raqqa 0.0 321.9 1,063.5 0.0 11.4 8.6 0.5 9.9 1.6 29.8 1,447.2Qunetra 0.0 53.6 0.0 0.0 0.0 0.6 0.0 0.0 0.7 7.1 62.0Sweida 12.4 429.2 676.8 0.0 30.4 3.7 0.2 11.8 2.3 12.8 1,179.6Homs 80.9 2,762.7 4,253.9 0.0 307.7 68.4 6.3 128.3 9.2 112.2 7,729.6Hama 143.1 2,253.0 2,803.7 0.1 133.0 37.9 5.5 167.8 8.9 170.4 5,723.4Aleppo 3,067.4 6,383.7 50,659.7 0.6 1,246.1 173.5 28.2 538.9 15.7 144.8 62,258.6Idleb 777.8 1,689.8 2,223.6 0.0 60.8 33.0 5.1 25.7 7.4 117.9 4,941.1Total 6,222.0 26,822.0 96,679.0 1.0 3,799.0 611.0 99.0 1,974.0 87.0 1,420.0 137,714.0
Items
Type of Industry (Code)
Total
Pollution Load Generation(SS-kg/day)
Rat
io o
f Dis
tribu
tion
Pollu
tion
load
by
Gov
erno
rate
(kg/
day)
Table A8.3.9 (4) Estimated pollution load generation (private sector: T-N)
15141
from 15131to 15543,
except15141
from 17111to 18230
from 19111to 19250
from 24111to 24310
from 20111to 20295
from 29111to 29393
from 27111to 27322
from 26111to 26999
from 15111to 15119
4,044 575 4,054 2 175 0 0 49 0 172 9,071
Damascus 0.005 0.088 0.114 0.19 0.077 0.093 0.088 0.107 0.048 0.113 -Rural Damascus 0.013 0.236 0.173 0.104 0.408 0.199 0.318 0.31 0.214 0.285 -
Dar'aa 0.018 0.034 0.012 0.003 0.02 0.019 0.021 0.019 0.048 0.097 -Tartous 0.189 0.029 0.011 0.004 0.002 0.06 0.012 0.053 0.054 0.031 -Lattakia 0.116 0.043 0.023 0.004 0.015 0.059 0.062 0.037 0.054 0.033 -
Deir-ez-Zor 0.002 0.024 0.007 0.005 0.004 0.022 0.012 0.01 0.026 0.009 -Hassakeh 0.001 0.028 0.022 0.003 0.003 0.015 0.023 0.017 0.03 0.013 -
Raqqa 0 0.012 0.011 0.001 0.003 0.014 0.005 0.005 0.018 0.021 -Qunetra 0 0.002 0 0 0 0.001 0 0 0.008 0.005 -Sweida 0.002 0.016 0.007 0.001 0.008 0.006 0.002 0.006 0.026 0.009 -Homs 0.013 0.103 0.044 0.013 0.081 0.112 0.064 0.065 0.106 0.079 -Hama 0.023 0.084 0.029 0.059 0.035 0.062 0.056 0.085 0.102 0.12 -Aleppo 0.493 0.238 0.524 0.604 0.328 0.284 0.285 0.273 0.181 0.102 -Idleb 0.125 0.063 0.023 0.009 0.016 0.054 0.052 0.013 0.085 0.083 -Total 1.000 1.000 1.000 1.000 1.000 1.000 1.000 1.000 1.000 1.000 -
Damascus 20.2 50.6 462.2 0.4 13.5 0.0 0.0 5.2 0.0 19.4 571.5Rural Damascus 52.6 135.7 701.3 0.2 71.4 0.0 0.0 15.3 0.0 49.1 1,025.6
Dar'aa 72.8 19.6 48.6 0.0 3.5 0.0 0.0 0.9 0.0 16.7 162.1Tartous 764.3 16.7 44.6 0.0 0.4 0.0 0.0 2.6 0.0 5.3 833.9Lattakia 469.1 24.7 93.2 0.0 2.6 0.0 0.0 1.8 0.0 5.7 597.1
Deir-ez-Zor 8.1 13.8 28.4 0.0 0.7 0.0 0.0 0.5 0.0 1.5 53.0Hassakeh 4.0 16.1 89.2 0.0 0.5 0.0 0.0 0.8 0.0 2.2 112.8
Raqqa 0.0 6.9 44.6 0.0 0.5 0.0 0.0 0.2 0.0 3.6 55.8Qunetra 0.0 1.2 0.0 0.0 0.0 0.0 0.0 0.0 0.0 0.9 2.1Sweida 8.1 9.2 28.4 0.0 1.4 0.0 0.0 0.3 0.0 1.5 48.9Homs 52.6 59.2 178.4 0.0 14.2 0.0 0.0 3.2 0.0 13.6 321.2Hama 93.0 48.3 117.6 0.1 6.1 0.0 0.0 4.2 0.0 20.7 290.0Aleppo 1,993.7 136.8 2,124.3 1.3 57.4 0.0 0.0 13.4 0.0 17.5 4,344.4Idleb 505.5 36.2 93.2 0.0 2.8 0.0 0.0 0.6 0.0 14.3 652.6Total 4,044.0 575.0 4,054.0 2.0 175.0 0.0 0.0 49.0 0.0 172.0 9,071.0
Items
Type of Industry (Code)
Total
Pollution Load Generation(T-N-kg/day)
Rat
io o
f Dis
tribu
tion
Pollu
tion
load
by
Gov
erno
rate
(kg/
day)
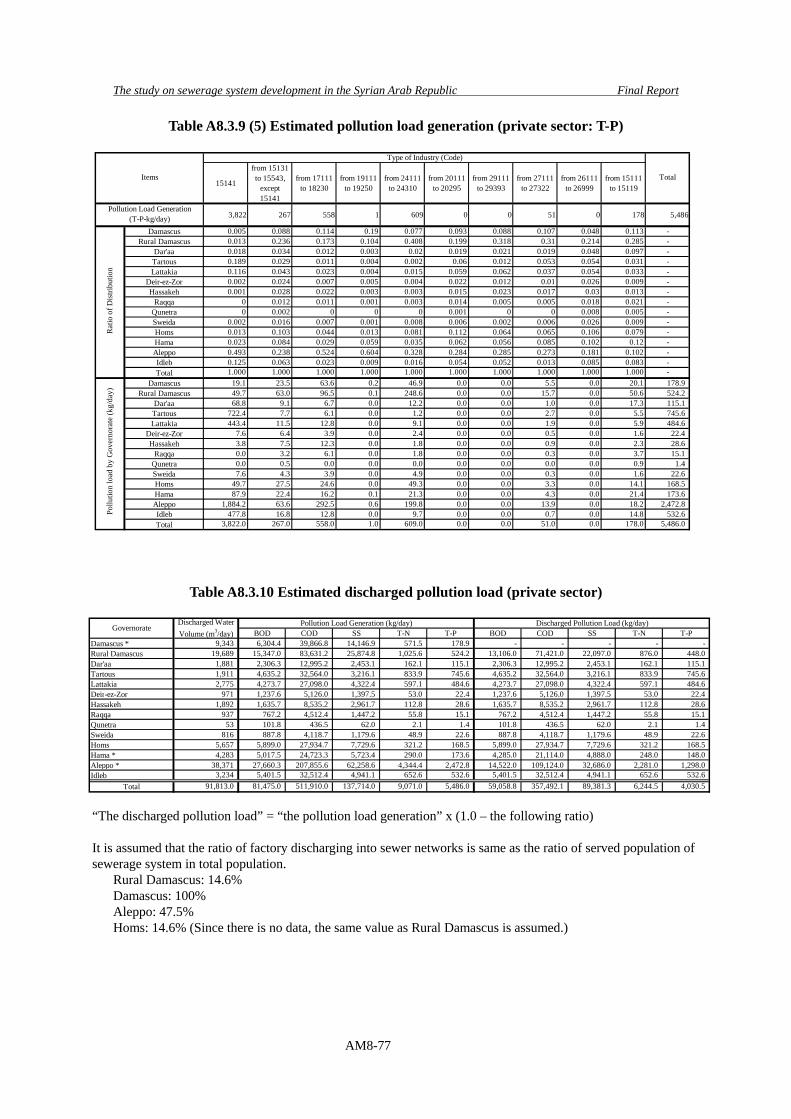
The study on sewerage system development in the Syrian Arab Republic Final Report
AM8-77
Table A8.3.9 (5) Estimated pollution load generation (private sector: T-P)
15141
from 15131to 15543,
except15141
from 17111to 18230
from 19111to 19250
from 24111to 24310
from 20111to 20295
from 29111to 29393
from 27111to 27322
from 26111to 26999
from 15111to 15119
3,822 267 558 1 609 0 0 51 0 178 5,486
Damascus 0.005 0.088 0.114 0.19 0.077 0.093 0.088 0.107 0.048 0.113 -Rural Damascus 0.013 0.236 0.173 0.104 0.408 0.199 0.318 0.31 0.214 0.285 -
Dar'aa 0.018 0.034 0.012 0.003 0.02 0.019 0.021 0.019 0.048 0.097 -Tartous 0.189 0.029 0.011 0.004 0.002 0.06 0.012 0.053 0.054 0.031 -Lattakia 0.116 0.043 0.023 0.004 0.015 0.059 0.062 0.037 0.054 0.033 -
Deir-ez-Zor 0.002 0.024 0.007 0.005 0.004 0.022 0.012 0.01 0.026 0.009 -Hassakeh 0.001 0.028 0.022 0.003 0.003 0.015 0.023 0.017 0.03 0.013 -
Raqqa 0 0.012 0.011 0.001 0.003 0.014 0.005 0.005 0.018 0.021 -Qunetra 0 0.002 0 0 0 0.001 0 0 0.008 0.005 -Sweida 0.002 0.016 0.007 0.001 0.008 0.006 0.002 0.006 0.026 0.009 -Homs 0.013 0.103 0.044 0.013 0.081 0.112 0.064 0.065 0.106 0.079 -Hama 0.023 0.084 0.029 0.059 0.035 0.062 0.056 0.085 0.102 0.12 -Aleppo 0.493 0.238 0.524 0.604 0.328 0.284 0.285 0.273 0.181 0.102 -Idleb 0.125 0.063 0.023 0.009 0.016 0.054 0.052 0.013 0.085 0.083 -Total 1.000 1.000 1.000 1.000 1.000 1.000 1.000 1.000 1.000 1.000 -
Damascus 19.1 23.5 63.6 0.2 46.9 0.0 0.0 5.5 0.0 20.1 178.9Rural Damascus 49.7 63.0 96.5 0.1 248.6 0.0 0.0 15.7 0.0 50.6 524.2
Dar'aa 68.8 9.1 6.7 0.0 12.2 0.0 0.0 1.0 0.0 17.3 115.1Tartous 722.4 7.7 6.1 0.0 1.2 0.0 0.0 2.7 0.0 5.5 745.6Lattakia 443.4 11.5 12.8 0.0 9.1 0.0 0.0 1.9 0.0 5.9 484.6
Deir-ez-Zor 7.6 6.4 3.9 0.0 2.4 0.0 0.0 0.5 0.0 1.6 22.4Hassakeh 3.8 7.5 12.3 0.0 1.8 0.0 0.0 0.9 0.0 2.3 28.6
Raqqa 0.0 3.2 6.1 0.0 1.8 0.0 0.0 0.3 0.0 3.7 15.1Qunetra 0.0 0.5 0.0 0.0 0.0 0.0 0.0 0.0 0.0 0.9 1.4Sweida 7.6 4.3 3.9 0.0 4.9 0.0 0.0 0.3 0.0 1.6 22.6Homs 49.7 27.5 24.6 0.0 49.3 0.0 0.0 3.3 0.0 14.1 168.5Hama 87.9 22.4 16.2 0.1 21.3 0.0 0.0 4.3 0.0 21.4 173.6Aleppo 1,884.2 63.6 292.5 0.6 199.8 0.0 0.0 13.9 0.0 18.2 2,472.8Idleb 477.8 16.8 12.8 0.0 9.7 0.0 0.0 0.7 0.0 14.8 532.6Total 3,822.0 267.0 558.0 1.0 609.0 0.0 0.0 51.0 0.0 178.0 5,486.0
Pollution Load Generation(T-P-kg/day)
Rat
io o
f Dis
tribu
tion
Pollu
tion
load
by
Gov
erno
rate
(kg/
day)
Items
Type of Industry (Code)
Total
Table A8.3.10 Estimated discharged pollution load (private sector)
BOD COD SS T-N T-P BOD COD SS T-N T-PDamascus * 9,343 6,304.4 39,866.8 14,146.9 571.5 178.9 - - - - - Rural Damascus 19,689 15,347.0 83,631.2 25,874.8 1,025.6 524.2 13,106.0 71,421.0 22,097.0 876.0 448.0 Dar'aa 1,881 2,306.3 12,995.2 2,453.1 162.1 115.1 2,306.3 12,995.2 2,453.1 162.1 115.1 Tartous 1,911 4,635.2 32,564.0 3,216.1 833.9 745.6 4,635.2 32,564.0 3,216.1 833.9 745.6 Lattakia 2,775 4,273.7 27,098.0 4,322.4 597.1 484.6 4,273.7 27,098.0 4,322.4 597.1 484.6 Deir-ez-Zor 971 1,237.6 5,126.0 1,397.5 53.0 22.4 1,237.6 5,126.0 1,397.5 53.0 22.4 Hassakeh 1,892 1,635.7 8,535.2 2,961.7 112.8 28.6 1,635.7 8,535.2 2,961.7 112.8 28.6 Raqqa 937 767.2 4,512.4 1,447.2 55.8 15.1 767.2 4,512.4 1,447.2 55.8 15.1 Qunetra 53 101.8 436.5 62.0 2.1 1.4 101.8 436.5 62.0 2.1 1.4 Sweida 816 887.8 4,118.7 1,179.6 48.9 22.6 887.8 4,118.7 1,179.6 48.9 22.6 Homs 5,657 5,899.0 27,934.7 7,729.6 321.2 168.5 5,899.0 27,934.7 7,729.6 321.2 168.5 Hama * 4,283 5,017.5 24,723.3 5,723.4 290.0 173.6 4,285.0 21,114.0 4,888.0 248.0 148.0 Aleppo * 38,371 27,660.3 207,855.6 62,258.6 4,344.4 2,472.8 14,522.0 109,124.0 32,686.0 2,281.0 1,298.0 Idleb 3,234 5,401.5 32,512.4 4,941.1 652.6 532.6 5,401.5 32,512.4 4,941.1 652.6 532.6
Total 91,813.0 81,475.0 511,910.0 137,714.0 9,071.0 5,486.0 59,058.8 357,492.1 89,381.3 6,244.5 4,030.5
GovernorateDischarged WaterVolume (m3/day)
Pollution Load Generation (kg/day) Discharged Pollution Load (kg/day)
“The discharged pollution load” = “the pollution load generation” x (1.0 – the following ratio) It is assumed that the ratio of factory discharging into sewer networks is same as the ratio of served population of sewerage system in total population.
Rural Damascus: 14.6% Damascus: 100% Aleppo: 47.5% Homs: 14.6% (Since there is no data, the same value as Rural Damascus is assumed.)
Related Documents