First half 2014 The Factbook The structured products sector in figures

Welcome message from author
This document is posted to help you gain knowledge. Please leave a comment to let me know what you think about it! Share it to your friends and learn new things together.
Transcript
First half 2014The Factbook
The structured products sector in figures

Dear Reader
Figures give us a nutshell version of events – in the world of finance just as in sport. To find out who has won, you only have to look at the result. Whether you have been following the rises and falls of the markets closely or have only given them an occa-sional glance, the Factbook provides you with a concise summa-ry of important key figures on the overall market, market share and individual product classes as well as other interesting facts about the structured products market. This is all presented in the DDV’s usual clear way. After all, transparency is one of the association’s main concerns, especially for retail investors.
We hope you find the Factbook an interesting and enjoyable read.
Dr Hartmut KnüppelCEO and Member of the Board of Directors
2

Contents
THE STRUCTURED PRODUCTS MARKET IN GERMANY
Product classification 4
Market volume 10
Market performance 10
Market volume by product category 12
Market volume by underlying 13
Market volume by risk category 14
Market share by market volume 16
Number of investment and leverage products 19
Trading turnover by exchange 20
Exchange turnover by product category 22
Exchange turnover by underlying 23
Market share by exchange turnover 24
Performance of structured products 30
THE STRUCTURED PRODUCTS MARKET IN EUROPE
EUSIPA – the European umbrella association 35
EUSIPA Derivatives Map 36
Market volume 38
Exchange turnover 40
DEUTSCHER DERIVATE VERBAND
DDV in brief 42
Members and sponsoring members 43
Governing bodies 44
Publications 46
3

The Deutscher Derivate Verband (DDV), the German Derivatives Association, has launched a number of initiatives to make investment and leverage products more comprehensible and transparent. By doing so, the Association is playing an impor-tant role in the wider effort to protect retail investors. We felt it was essential to provide a clear and simple structure spanning the full range of structured products – one that retail investors could easily follow. To this end, the DDV reached agreement with its members and sponsoring members on a uniform pro-duct classification system – the Derivatives League. This gives investors an overview of the most important and most frequent-ly traded types of structured products and their main charac-teristics – from safe Uncapped Capital Protection Certificates through to more speculative Knock-Out Warrants.
The challenge – to devise a clear and simple structure spanning the entire range of structured products

Product classification the DDV Derivatives League
Investment products with capital protection (100 percent)
Uncapped Capital Protection CertificatesWith Uncapped Capital Protection Certifica-tes, the issuer promises to repay the nomi-nal amount to the investor at maturity. In addition, there is the potential for attractive returns depending on the performance of one or several underlyings.
Capital Protection Products with CouponCapital Protection Products with Coupon are interest-bearing securities with various additional conditions attached. The amount of interest may depend on the performance of the underlying asset. At final maturity the bonds offer 100 percent capital protection.
To ensure that investors were able to under-stand our product classification system, we decided to base it on a real-life scenario. The Derivatives League explains how dif-ferent types of structured products work by comparing the basic categories to the posi-tions of a football team, in each case reflec-ting the level of market risk involved. There are defensive and offensive positions that match the opportunity / risk profile of each structured product. That makes it easier to compare their main characteristics and the associated benefits and disadvantages or opportunities and risks.
The structured products market in Germany | Product classification 5

Discount CertificatesDiscount Certificates give a discount on the current price of the underlying. This discount provides a cushion against potential falls in the price of the underlying. In return, inves-tors accept a cap on profits from potential price rises, and they do not receive any dividends
Credit Linked NotesCredit Linked Notes offer a means of inves-ting in a borrower’s credit rating. The amount of interest and the capital repayment are dependent on the borrower’s credit rating. As long as the borrower does not experience a credit event, the investor will receive inte-rest payments and, when the note matures, the nominal value. If a credit event does occur, however, the note is repaid early. In this case, interest payments cease, and the amount repaid may be significantly below the nominal value.
Reverse ConvertiblesWith Reverse Convertibles, interest is paid regardless of the performance of the under-lying asset. The type and the amount of the repayment at final maturity depend on whether the value of the underlying asset is equal to, above or below the strike price on the valuation date. If the value of the under-lying asset at the valuation date is at least equal to the strike price, the investor recei-ves the nominal value. If the value of the underlying asset is below the strike price, the investor receives either the value of the underlying assets or the underlying assets themselves.
Investment products without capital protection (< 100 percent)
6 The structured products market in Germany | Product classification

Express CertificatesWith Express Certificates, movements in the price of the underlying are monitored at specific intervals (e. g. annually) and com-pared with the initial price. If, at one of the reference dates, the price is higher than the initial price, the investor receives the nomi-nal value of the certificate plus a predefined additional amount before the end of the term. If the price is not higher than the ini-tial price at the reference date, the process is repeated in the next period taking double the additional amount as a basis, and so on. If the price falls, a cushion generally absorbs any price falls up to a predefined value. It is only if the price falls below this predefined value that losses will arise, as they would with a direct investment in the underlying asset.
Bonus CertificatesBonus Certificates pay a bonus amount at final maturity if the underlying does not reach or breach the specified barrier in the relevant monitoring period. The investor does not receive any dividend payments.
Tracker CertificatesTracker Certificates offer exposure to the movements in the price of an underlying instrument. This means that with just one Tracker Certificate, investors can put their money into an asset class, sector or region, optimising and diversifying their portfolio.
Outperformance / Capped Outperformance CertificatesWith Outperformance Certificates, if the price of the underlying asset goes up, inves-tors receive a return equal to a pre-specified multiple of the return on the underlying asset. Capped Outperformance Certificates offer investors the opportunity for leveraged profit from a rise in the price of the underly-ing above the strike price within a specified range. The profit is limited by a cap. With products of this type, the investor’s expo-sure to potential losses below the strike price is limited to any loss in the underlying. There is no entitlement to a dividend.
The structured products market in Germany | Product classification 7
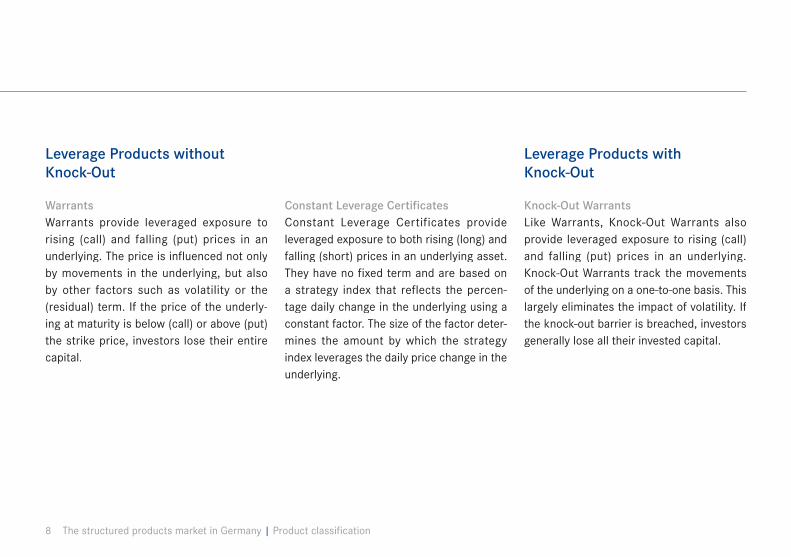
Leverage Products with Knock-Out
Knock-Out WarrantsLike Warrants, Knock-Out Warrants also provide leveraged exposure to rising (call) and falling (put) prices in an underlying. Knock-Out Warrants track the movements of the underlying on a one-to-one basis. This largely eliminates the impact of volatility. If the knock-out barrier is breached, investors generally lose all their invested capital.
Leverage Products without Knock-Out
WarrantsWarrants provide leveraged exposure to rising (call) and falling (put) prices in an underlying. The price is influenced not only by movements in the underlying, but also by other factors such as volatility or the (residual) term. If the price of the underly-ing at maturity is below (call) or above (put) the strike price, investors lose their entire capital.
Constant Leverage CertificatesConstant Leverage Certificates provide leveraged exposure to both rising (long) and falling (short) prices in an underlying asset. They have no fixed term and are based on a strategy index that reflects the percen-tage daily change in the underlying using a constant factor. The size of the factor deter-mines the amount by which the strategy index leverages the daily price change in the underlying.
8 The structured products market in Germany | Product classification

The Derivatives League: DDV’s product classification
With Knock-Out Without Knock-Out Without Capital Protection (< 100 %)With Capital Protection (100 %)
INVESTMENT PRODUCTS LEVERAGE PRODUCTS
DERIVATIVE SECURITIES
Credit Linked Notes
Reverse Convertibles
Discount Certificates Bonus Certificates Outperformance / Capped Outperformance Certificates
Express Certificates Tracker Certificates Warrants
Factor Certificates
Knock-Out Warrants
Uncapped Capital Protection Certificates
Capital Protection Products with Coupon
The structured products market in Germany | Product classification 9
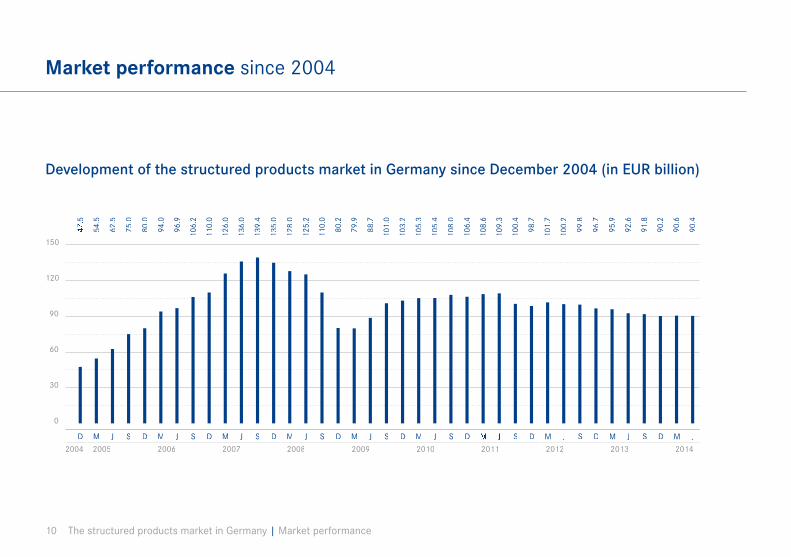
Market performance since 2004
Development of the structured products market in Germany since December 2004 (in EUR billion)
0
30
60
90
120
150
47.5
54.5
62.5
75.0
80.0
94.0
96.9
106.
2
110.
0
126.
0
136.
0
139.
4
135.
0
128.
0
125.
2
110.
0
80.2
79.9
88.7
101.
0
103.
2
105.
3
105.
4
108.
0
106.
4
108.
6
109.
3
100.
4
98.7
101.
7
100.
2
96.7
92.6
90.2
91.8
95.9
99.8
90.6
90.4
D M J S D M J S D M J S D M J S D M J S D M J S D S DM JD SM JD S
2010 2011 20122004 2005 2006 2007 2008 2009
S D S DM J M J M J
2013 2014
10 The structured products market in Germany | Market performance
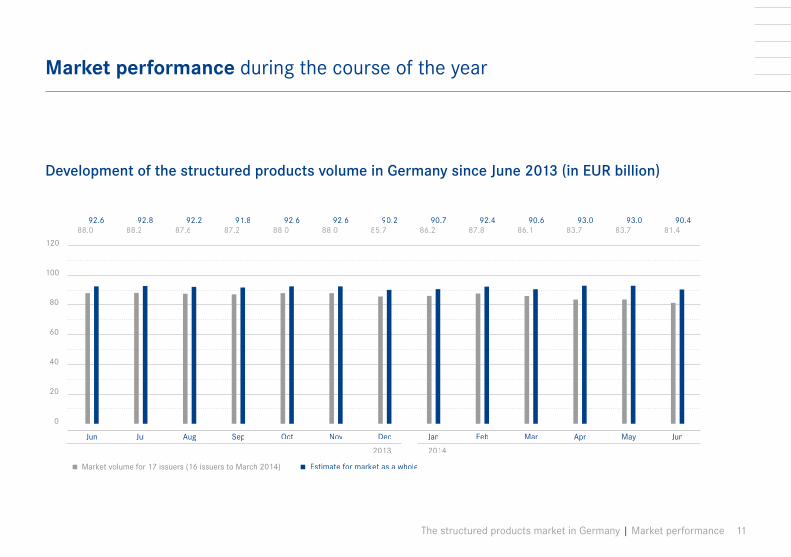
Development of the structured products volume in Germany since June 2013 (in EUR billion)
Market performance during the course of the year
0
20
40
60
80
100
120
Jun Jan Feb Mar Apr May JunJul Aug Sep Oct Nov Dec
20142013
86.2 87.8 86.1 83.7 83.7 81.488.0 88.2 87.6 87.2 88.0 88.0 85.7
Estimate for market as a wholeMarket volume for 17 issuers (16 issuers to March 2014)
90.7 92.4 90.6 93.0 93.0 90.492.6 92.8 92.2 91.8 92.6 92.6 90.2
The structured products market in Germany | Market performance 11
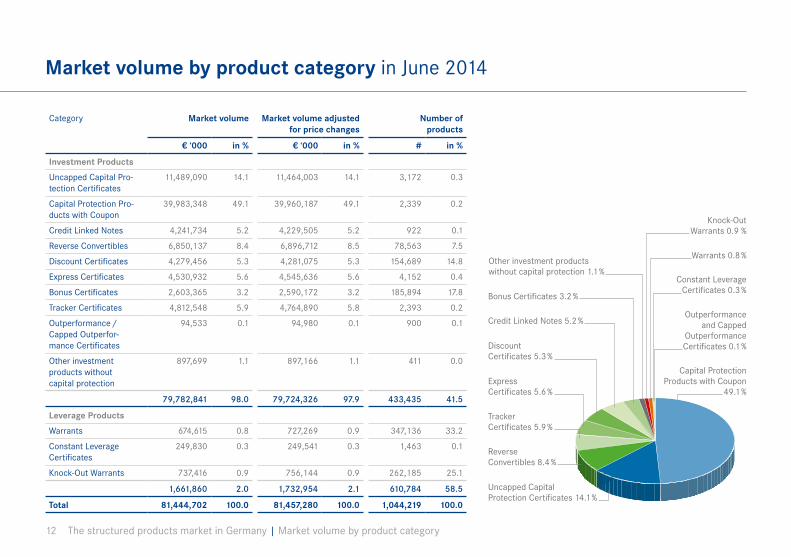
Market volume by product category in June 2014
Capital Protection Products with Coupon
49.1 %
Uncapped Capital Protection Certificates 14.1 %
Tracker Certificates 5.9 %
Warrants 0.8 %
Outperformance and Capped
Outperformance Certificates 0.1 %
Credit Linked Notes 5.2 %
Constant Leverage Certificates 0.3 %
Discount Certificates 5.3 %
Express Certificates 5.6 %
Reverse Convertibles 8.4 %
Other investment products without capital protection 1.1 %
Knock-Out Warrants 0.9 %
Bonus Certificates 3.2 %
Category Market volume Market volume adjusted for price changes
Number of products
€ ‘000 in % € ‘000 in % # in %
Investment Products
Uncapped Capital Pro-tection Certificates
11,489,090 14.1 11,464,003 14.1 3,172 0.3
Capital Protection Pro-ducts with Coupon
39,983,348 49.1 39,960,187 49.1 2,339 0.2
Credit Linked Notes 4,241,734 5.2 4,229,505 5.2 922 0.1
Reverse Convertibles 6,850,137 8.4 6,896,712 8.5 78,563 7.5
Discount Certificates 4,279,456 5.3 4,281,075 5.3 154,689 14.8
Express Certificates 4,530,932 5.6 4,545,636 5.6 4,152 0.4
Bonus Certificates 2,603,365 3.2 2,590,172 3.2 185,894 17.8
Tracker Certificates 4,812,548 5.9 4,764,890 5.8 2,393 0.2
Outperformance / Capped Outperfor-mance Certificates
94,533 0.1 94,980 0.1 900 0.1
Other investment pro ducts without capital protection
897,699 1.1 897,166 1.1 411 0.0
79,782,841 98.0 79,724,326 97.9 433,435 41.5
Leverage Products
Warrants 674,615 0.8 727,269 0.9 347,136 33.2
Constant Leverage Certificates
249,830 0.3 249,541 0.3 1,463 0.1
Knock-Out Warrants 737,416 0.9 756,144 0.9 262,185 25.1
1,661,860 2.0 1,732,954 2.1 610,784 58.5
Total 81,444,702 100.0 81,457,280 100.0 1,044,219 100.0
12 The structured products market in Germany | Market volume by product category

Market volume by underlying in June 2014
Category Market volume Market volume adjusted for price changes
Number of products
€ ‘000 in % € ‘000 in % # in %
Investment Products
Indices 14,340,537 18.0 14,291,953 17.9 100,959 23.3
Equities 17,750,371 22.2 17,821,891 22.4 327,072 75.5
Commodities 1,099,746 1.4 1,058,104 1.3 1,754 0.4
Currencies 102,810 0.1 102,485 0.1 61 0.0
Interest rates 45,710,618 57.3 45,674,050 57.3 3,462 0.8
Investment funds 778,759 1.0 775,844 1.0 127 0.0
79,782,841 100.0 79,724,326 100.0 433,435 100.0
Leverage Products
Indices 614,260 37.0 631,540 36.4 132,121 21.6
Equities 811,472 48.8 878,079 50.7 421,012 68.9
Commodities 176,700 10.6 153,629 8.9 28,176 4.6
Currencies 39,763 2.4 44,879 2.6 27,137 4.4
Interest rates 19,192 1.2 24,380 1.4 2,311 0.4
Investment funds 474 0.0 446 0.0 27 0.0
1,661,860 100.0 1,732,954 100.0 610,784 100.0
Total 81,444,702 100.0 81,457,280 100.0 1,044,219 100.0
Investment products by underlying
Commodities 1.4 %
Equities 22.2 %
Investment funds 1.0 % Currencies 0.1 %
Interest rates 57.3 %
Indices18.0 %
Leverage products by underlying
Currencies 2.4 % Interest rates 1.2 %
Indices 37.0 %
Equities 48.8 %Commodities 10.6 %
The structured products market in Germany | Market volume by underlying 13
Market volume by risk category in June 2014
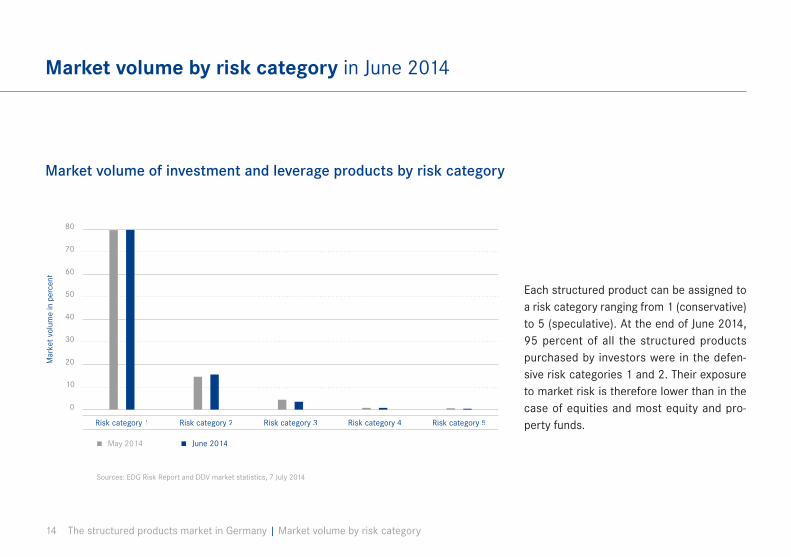
Market volume of investment and leverage products by risk category
0
20
40
60
50
30
10
80
70
Mar
ket v
olum
e in
per
cent
Risk category 5Risk category 4Risk category 3Risk category 2Risk category 1
May 2014 June 2014
Each structured product can be assigned to a risk category ranging from 1 (conservative) to 5 (speculative). At the end of June 2014, 95 percent of all the structured products purchased by investors were in the defen-sive risk categories 1 and 2. Their exposure to market risk is therefore lower than in the case of equities and most equity and pro-perty funds.
Sources: EDG Risk Report and DDV market statistics, 7 July 2014
14 The structured products market in Germany | Market volume by risk category
Market volume by risk category in June 2014
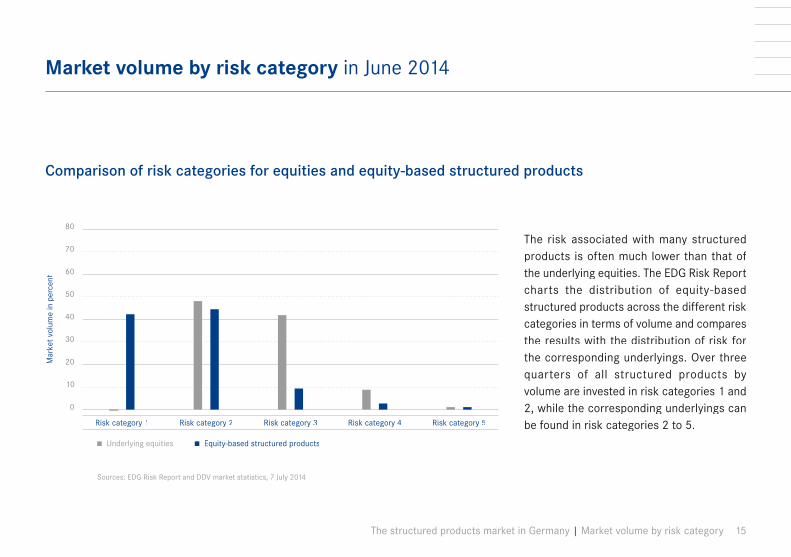
Comparison of risk categories for equities and equity-based structured products
0
20
40
60
50
30
10
80
70
Mar
ket v
olum
e in
per
cent
Risk category 5Risk category 4Risk category 3Risk category 2Risk category 1
Underlying equities Equity-based structured products
Sources: EDG Risk Report and DDV market statistics, 7 July 2014
The risk associated with many structured products is often much lower than that of the underlying equities. The EDG Risk Report charts the distribution of equity-based structured products across the different risk categories in terms of volume and compares the results with the distribution of risk for the corresponding underlyings. Over three quarters of all structured products by volume are invested in risk categories 1 and 2, while the corresponding underlyings can be found in risk categories 2 to 5.
The structured products market in Germany | Market volume by risk category 15

Market share by market volume of investment and leverage products
Deutsche Bank 18.1 %
HypoVereinsbank 10.0 %
Goldman Sachs 0.9 %
LBBW 9.3 %
Bayern LB3.7 %
HSBC Trinkaus 1.4 %
UBS 2.5 %
Société Générale 2.2 %
RBS 2.5 %
BNP Paribas 1.4 % NordLB 1.3 %
WGZ BANK 1.2 %
Vontobel 1.2 %
Citi 0.3 %
Investment and leverage productsMarket share by market volume in percent
Issuer June 2014 March 2014 Difference
Deutsche Bank 18.07 17.59 0.48
Helaba 15.67 15.61 0.06
DZ BANK 14.84 14.66 0.18
Commerzbank 13.60 14.88 –1.28
HypoVereinsbank 10.02 9.99 0.03
LBBW 9.28 9.23 0.05
BayernLB 3.70 3.25 0.45
UBS 2.53 2.40 0.14
RBS 2.48 2.50 –0.02
Société Générale 2.18 2.20 –0.03
HSBC Trinkaus 1.37 1.29 0.07
BNP Paribas 1.35 1.36 –0.01
NordLB 1.29 1.29 0.00
Vontobel 1.23 1.24 –0.01
WGZ BANK 1.18 1.22 –0.04
Goldman Sachs 0.94 1.03 –0.09
Citi 0.26 0.26 0.01
Helaba 15.7 %
Commerzbank 13.6 %
DZ BANK 14.8 %
16 The structured products market in Germany | Market share by market volume

Deutsche Bank 18.0 %
HypoVereinsbank10.2 %
WGZ BANK 1.2 %
LBBW 9.5 %
UBS 2.5 %
BayernLB 3.8 %
Société Générale 2.1 %
RBS 2.5 %
NordLB 1.3 %
BNP Paribas 1.2 %HSBC Trinkaus 1.3 %
Vontobel 1.2 %
Goldman Sachs 0.9 %
Citi 0.1 %
Market share by market volume of investment products
Investment productsMarket share by market volume in percent
Issuer June 2014 March 2014 Difference
Deutsche Bank 17.97 17.47 0.50
Helaba 16.00 15.95 0.05
DZ BANK 14.99 14.83 0.16
Commerzbank 13.33 14.59 –1.26
HypoVereinsbank 10.17 10.14 0.03
LBBW 9.47 9.43 0.04
BayernLB 3.78 3.32 0.46
UBS 2.49 2.34 0.15
RBS 2.45 2.48 –0.03
Société Générale 2.10 2.15 –0.05
NordLB 1.32 1.31 0.00
HSBC Trinkaus 1.26 1.19 0.07
BNP Paribas 1.24 1.25 –0.01
WGZ BANK 1.21 1.25 –0.04
Vontobel 1.18 1.17 0.00
Goldman Sachs 0.91 1.00 –0.09
Citi 0.14 0.13 0.01
Helaba 16.0 %
Commerzbank13.3 %
DZ BANK15.0 %
The structured products market in Germany | Market share by market volume 17

Market share by market volume of leverage products
Leverage productsMarket share by market volume in percent
Issuer June 2014 March 2014 Difference
Commerzbank 26.20 28.27 –2.07
Deutsche Bank 22.90 22.94 –0.04
DZ BANK 7.97 7.03 0.94
BNP Paribas 6.54 6.45 0.10
HSBC Trinkaus 6.39 5.83 0.55
Citi 6.24 6.37 –0.13
Société Générale 6.04 4.86 1.17
UBS 4.75 5.13 –0.38
RBS 3.78 3.37 0.41
Vontobel 3.67 4.15 –0.47
HypoVereinsbank 3.03 3.13 –0.09
Goldman Sachs 2.48 2.47 0.01
LBBW 0.00 0.00 0.00
Helaba 0.00 0.00 0.00
WGZ BANK 0.00 0.00 0.00
BayernLB 0.00 0.00 0.00
NordLB 0.00 0.00 0.00
Commerzbank26.2 %
BNP Paribas 6.5 %
Société Générale 6.0 %
UBS 4.8 %
Citi 6.2 %
RBS 3.8 %
HypoVereinsbank3.0 %
Goldman Sachs 2.5 %
HSBC Trinkaus 6.4 %
Deutsche Bank 22.9 %DZ BANK 8.0 %
Vontobel 3.7 %
18 The structured products market in Germany | Market share by market volume

Number of investment and leverage products
Month
Structured investment products Structured leverage products
Total
with capital protection without capital protection without knock-out with knock-out
Uncapped Capital
Protection Certificates
Capital Protection
Products with Coupon
Credit Linked Notes
Reverse Converti-
blesDiscount
CertificatesExpress
CertificatesBonus
CertificatesTracker
Certificates
Outper-formance /
Capped Out-performance
Certificates Warrants
Constant Leverage
Certifi-cates
Knock-Out Warrants
Jun 2013 3,033 471 – 57,664 173,287 2,249 183,307 4,455 1,917 339,943 1,308 220,816 988,450
Jul 2013 2,993 471 – 59,305 181,217 2,252 184,075 4,458 1,897 355,629 1,317 235,839 1,029,453
Aug 2013 2,965 472 – 63,285 189,638 2,216 198,278 4,512 1,967 369,411 1,330 247,271 1,081,345
Sep 2013 2,957 474 – 61,015 179,170 2,211 181,341 4,500 1,836 339,226 1,388 239,668 1,013,786
Oct 2013 2,944 477 – 65,672 186,199 2,168 202,326 4,360 2,101 370,264 1,422 256,453 1,094,386
Nov 2013 2,921 481 – 71,861 191,773 2,140 217,313 4,154 3,108 381,910 1,422 270,879 1,147,962
Dec 2013 2,907 483 677 65,839 170,984 2,112 201,364 4,123 2,455 337,928 1,439 253,327 1,043,638
Jan 2014 2,753 478 699 73,819 186,154 1,899 230,888 3,892 2,661 393,409 1,438 269,908 1,167,998
Feb 2014 2,751 476 740 78,736 189,075 1,948 238,994 4,091 2,657 399,198 1,504 285,133 1,205,303
Mar 2014 2,787 473 761 75,146 169,850 1,946 224,447 4,097 2,561 359,687 1,685 274,641 1,118,081
Apr 2014 2,773 467 785 79,862 178,041 2,074 236,038 4,115 2,563 371,621 2,011 280,891 1,161,241
May 2014 2,751 468 827 83,169 180,648 2,141 242,862 4,167 2,901 379,554 2,300 289,322 1,191,110
Jun 2014 2,710 466 852 74,463 163,658 1,953 214,323 4,207 2,138 346,579 2,569 282,161 1,096,079
Jun 2014 3,176 461,594 349,148 282,161
1,096,079 464,770 631,309
Number of products from June 2013 to June 2014
The structured products market in Germany | Number of investment and leverage products 19

Trading turnover by exchange
Trading turnover June 2012 to June 2014
Stuttgart Exchange Frankfurt Exchange Stuttgart Exchange Frankfurt Exchange
€ ‘000Number of
orders € ‘000Number of
orders € ‘000Number of
orders € ‘000Number of
orders
June 2012 2,369,700 231,136 1,357,746 136,741 June 2013 2,243,048 248,000 1,214,094 155,472
July 2012 2,434,317 234,458 1,251,315 139,378 July 2013 2,011,090 230,461 1,114,077 149,608
August 2012 2,479,357 230,738 1,270,639 136,799 August 2013 2,193,804 233,696 1,225,708 155,416
September 2012 2,476,875 229,251 1,434,006 137,431 September 2013 2,102,638 216,459 1,215,648 147,109
October 2012 2,175,277 217,803 1,175,614 133,572 October 2013 2,441,821 238,327 1,332,606 158,821
November 2012 2,192,736 223,541 1,232,204 138,550 November 2013 2,486,982 227,367 1,271,403 153,708
December 2012 1,715,464 166,969 955,361 106,408 December 2013 2,173,247 205,284 1,215,286 148,757
January 2013 2,628,399 249,887 1,543,849 163,871 January 2014 3,127,427 303,403 1,748,646 221,300
February 2013 2,468,804 249,237 1,311,727 163,300 February 2014 2,343,479 247,275 1,415,885 184,142
March 2013 2,242,824 235,696 1,237,943 151,937 March 2014 2,524,984 278,708 1,577,497 205,275
April 2013 2,472,618 246,856 1,400,963 158,601 April 2014 2,232,227 235,110 1,202,752 154,055
May 2013 2,504,656 254,557 1,476,337 172,268 May 2014 2,093,811 214,100 1,078,870 130,597
June 2013 2,243,048 248,000 1,214,094 155,472 June 2014 1,950,730 191,928 1,009,364 115,285
20 The structured products market in Germany | Trading turnover by exchange

0
500,000
1,000,000
1,500,000
2,000,000
2,500,000
3,000,000
3,500,000
4,000,000
4,500,000
5,000,000
2012 ‘13 ‘12 ‘13 ‘12 ‘13 ‘12 ‘13 ‘12 ‘13 ‘12 ‘13 ‘12 ‘13 ‘13 ‘14 ‘13 ‘14 ‘13 ‘14 ‘13 ‘14 ‘13 ‘14 ‘13 ‘14
J JF M A MJ J A S O N D
in € ‘000
Stuttgart Exchange 2012 to 2013 Stuttgart Exchange 2013 to 2014 Frankfurt Exchange 2012 to 2013 Frankfurt Exchange 2013 to 2014
The structured products market in Germany | Trading turnover by exchange 21

Tracker Certificates 8.4 %
Exchange turnover by product category from January to June 2014
Category Total exchange turnover
Change on July to
December 2013
Market share
Number of orders
Change on July to
December 2013
Market share
€ ‘000 % % € ‘000 % %
Investment Products
Uncapped Capital Protection Certificates
326,232 –10.9 1.5 16,488 –14.1 0.7
Capital Protection Pro ducts with Coupon
542,011 41.2 2.4 27,531 32.6 1.1
Credit Linked Notes 115,449 – 0.5 5,042 – 0.2
Reverse Convertibles 1,203,659 – 30.8 5.4 68,584 – 5.6 2.8
Discount Certificates 4,110,681 11.8 18.4 111,513 1.3 4.5
Express Certificates 439,155 – 22.7 2.0 21,951 –19.1 0.9
Bonus Certificates 3,022,835 –10.0 13.6 109,917 – 7.3 4.4
Tracker Certificates 1,880,846 – 20.6 8.4 116,821 – 32.1 4.7
Outperformance /Capped Outperfor-mance Certificates
86,116 8.6 0.4 2,917 –14.7 0.1
11,726,984 – 6.7 52.6 480,764 –11.9 19.4
Leverage Products
Warrants 3,111,720 6.8 13.9 607,776 6.8 24.5
Constant Leverage Certificates
1,382,974 305.6 6.2 123,882 260.4 5.0
Knock-Out Warrants 6,085,962 21.3 27.3 1,268,861 13.4 51.1
10,580,656 27.9 47.4 2,000,519 16.1 80.6
Total 22,307,640 7.0 100.0 2,481,283 9.4 100.0 Warrants 13.9 % Discount Certificates 18.4 %
Bonus Certificates 13.6 %
Capital Protection Products with Coupon 2.4 %
Reverse Convertibles 5.4 %
FaktorCertificates 6.2 %
Express Certificates 2.0 %
Uncapped Capital Protection Certificates 1.5 %
Credit Linked Notes 0.5 %
Knock-Out Warrants 27.3 %
Outperformance /Capped Outperfor-mance Certificates
0.4 %
22 The structured products market in Germany | Exchange turnover by product category
Exchange turnover by underlying from January to June 2014
Category Total exchange turnover Change on July to December 2013
Market share
€ ‘000 % %
Investment Products
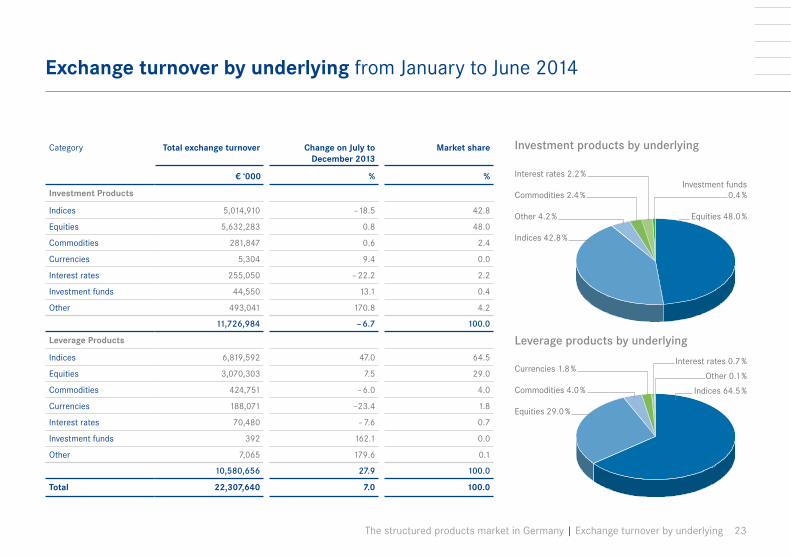
Indices 5,014,910 –18.5 42.8
Equities 5,632,283 0.8 48.0
Commodities 281,847 0.6 2.4
Currencies 5,304 9.4 0.0
Interest rates 255,050 – 22.2 2.2
Investment funds 44,550 13.1 0.4
Other 493,041 170.8 4.2
11,726,984 – 6.7 100.0
Leverage Products
Indices 6,819,592 47.0 64.5
Equities 3,070,303 7.5 29.0
Commodities 424,751 – 6.0 4.0
Currencies 188,071 –23.4 1.8
Interest rates 70,480 – 7.6 0.7
Investment funds 392 162.1 0.0
Other 7,065 179.6 0.1
10,580,656 27.9 100.0
Total 22,307,640 7.0 100.0
Investment products by underlying
Commodities 2.4 %
Indices 42.8 %
Investment funds 0.4 %
Interest rates 2.2 %
Equities 48.0 %Other 4.2 %
Leverage products by underlying
Currencies 1.8 %Interest rates 0.7 %
Equities 29.0 %
Indices 64.5 %
Other 0.1 %
Commodities 4.0 %
The structured products market in Germany | Exchange turnover by underlying 23
Market share by exchange turnover of investment and leverage products
Issuer Exchange turnoverFirst half of 2014
Exchange turnoverFirst half of 2013
€ ‘000 Market share
in %
€ ‘000 Market share
in %
Diffe-rence
in %
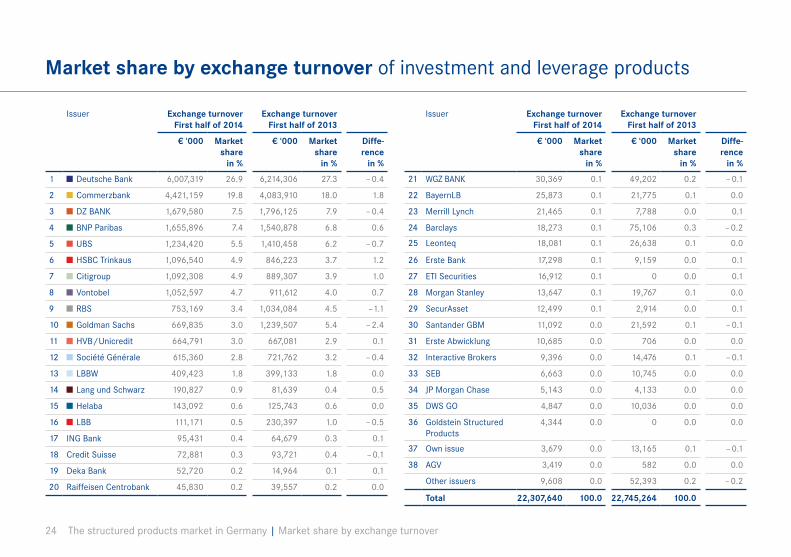
1 Deutsche Bank 6,007,319 26.9 6,214,306 27.3 – 0.4
2 Commerzbank 4,421,159 19.8 4,083,910 18.0 1.8
3 DZ BANK 1,679,580 7.5 1,796,125 7.9 – 0.4
4 BNP Paribas 1,655,896 7.4 1,540,878 6.8 0.6
5 UBS 1,234,420 5.5 1,410,458 6.2 – 0.7
6 HSBC Trinkaus 1,096,540 4.9 846,223 3.7 1.2
7 Citigroup 1,092,308 4.9 889,307 3.9 1.0
8 Vontobel 1,052,597 4.7 911,612 4.0 0.7
9 RBS 753,169 3.4 1,034,084 4.5 –1.1
10 Goldman Sachs 669,835 3.0 1,239,507 5.4 – 2.4
11 HVB / Unicredit 664,791 3.0 667,081 2.9 0.1
12 Société Générale 615,360 2.8 721,762 3.2 – 0.4
13 LBBW 409,423 1.8 399,133 1.8 0.0
14 Lang und Schwarz 190,827 0.9 81,639 0.4 0.5
15 Helaba 143,092 0.6 125,743 0.6 0.0
16 LBB 111,171 0.5 230,397 1.0 – 0.5
17 ING Bank 95,431 0.4 64,679 0.3 0.1
18 Credit Suisse 72,881 0.3 93,721 0.4 – 0.1
19 Deka Bank 52,720 0.2 14,964 0.1 0.1
20 Raiffeisen Centrobank 45,830 0.2 39,557 0.2 0.0
Issuer Exchange turnoverFirst half of 2014
Exchange turnover First half of 2013
€ ‘000 Market share
in %
€ ‘000 Market share
in %
Diffe-rence
in %
21 WGZ BANK 30,369 0.1 49,202 0.2 – 0.1
22 BayernLB 25,873 0.1 21,775 0.1 0.0
23 Merrill Lynch 21,465 0.1 7,788 0.0 0.1
24 Barclays 18,273 0.1 75,106 0.3 – 0.2
25 Leonteq 18,081 0.1 26,638 0.1 0.0
26 Erste Bank 17,298 0.1 9,159 0.0 0.1
27 ETI Securities 16,912 0.1 0 0.0 0.1
28 Morgan Stanley 13,647 0.1 19,767 0.1 0.0
29 SecurAsset 12,499 0.1 2,914 0.0 0.1
30 Santander GBM 11,092 0.0 21,592 0.1 – 0.1
31 Erste Abwicklung 10,685 0.0 706 0.0 0.0
32 Interactive Brokers 9,396 0.0 14,476 0.1 – 0.1
33 SEB 6,663 0.0 10,745 0.0 0.0
34 JP Morgan Chase 5,143 0.0 4,133 0.0 0.0
35 DWS GO 4,847 0.0 10,036 0.0 0.0
36 Goldstein Structured Products
4,344 0.0 0 0.0 0.0
37 Own issue 3,679 0.0 13,165 0.1 – 0.1
38 AGV 3,419 0.0 582 0.0 0.0
Other issuers 9,608 0.0 52,393 0.2 – 0.2
Total 22,307,640 100.0 22,745,264 100.0
24 The structured products market in Germany | Market share by exchange turnover

Deutsche Bank was ranked first in terms of exchange turnover. Commerzbank followed in second place. DZ BANK occupied third place. BNP Paribas came fourth, and UBS fifth. These five issuers together accounted for two-thirds of the exchange turnover for the first half of the year.DZ BANK 7.5 %
Citigroup 4.9 %
BNP Paribas 7.4 %
RBS 3.4 %
Goldman Sachs 3.0 %
HVB / Unicredit 3.0 %
HSBC Trinkaus 4.9 %
Vontobel 4.7 %
Société Générale 2.8 %
Other issuers 2.3 %
Deutsche Bank 26.9 %
LBB 0.5 %
Lang und Schwarz 0.9 %
Helaba 0.6 %
UBS 5.5 % Commerzbank 19.8 %
LBBW 1.8 %
The structured products market in Germany | Market share by exchange turnover 25

Market share by exchange turnover of investment products
Issuer Exchange turnover first half of 2014 Exchange turnover first half of 2013
€ ‘000 Market share in %
€ ‘000 Market share in %
Differencein %
1 Deutsche Bank 3,264,039 27.8 4,259,727 30.5 – 2.7
2 Commerzbank 1,793,057 15.3 2,163,886 15.5 – 0.2
3 DZ BANK 1,068,029 9.1 1,255,776 9.0 0.1
4 BNP Paribas 1,003,314 8.6 846,806 6.1 2.5
5 HSBC Trinkaus 644,929 5.5 485,154 3.5 2.0
6 Vontobel 588,782 5.0 550,168 3.9 1.1
7 UBS 587,007 5.0 717,477 5.1 – 0.1
8 Goldman Sachs 480,180 4.1 1,041,109 7.5 – 3.4
9 Société Générale 425,647 3.6 485,752 3.5 0.1
10 LBBW 409,423 3.5 399,133 2.9 0.6
11 HVB / Unicredit 308,234 2.6 328,117 2.4 0.2
12 RBS 286,249 2.4 513,946 3.7 –1.3
13 Helaba 143,092 1.2 125,704 0.9 0.3
14 Citigroup 126,827 1.1 87,582 0.6 0.5
15 LBB 111,171 0.9 214,596 1.5 – 0.6
16 Lang und Schwarz 103,031 0.9 22,570 0.2 0.7
17 Credit Suisse 72,881 0.6 93,721 0.7 – 0.1
18 Deka Bank 52,720 0.4 14,964 0.1 0.3
19 Raiffeisen Centrobank 33,177 0.3 31,094 0.2 0.1
20 WGZ BANK 30,369 0.3 49,202 0.4 – 0.1
Other issuers 194,825 1.7 260,829 1.9 – 0.2
Total 11,726,984 100.0 13,947,316 100.0
26 The structured products market in Germany | Market share by exchange turnover

DZ BANK 9.1 %BNP Paribas 8.6 %
Vontobel 5.0 %
UBS 5.0 %
Other issuers 1.7 %
Deutsche Bank 27.8 %
Raiffeisen Centrobank 0.3 %
Credit Suisse 0.6 %Citigroup 1.1 %
WGZ BANK 0.3 %
HSBC Trinkaus 5.5 % Commerzbank 15.3 %
Société Générale 3.6 %
Goldman Sachs 4.1 %
LBBW 3.5 %
HVB / Unicredit 2.6 %
RBS 2.4 %
Helaba 1.2 % Deka Bank 0.4 %
Lang und Schwarz 0.9 %LBB 0.9 %
The structured products market in Germany | Market share by exchange turnover 27

Market share by exchange turnover of leverage products
Issuer Exchange turnover First half of 2014 Exchange turnover First half of 2013
€ ‘000 Market share in %
€ ‘000 Market share in %
Difference in %
1 Deutsche Bank 2,743,280 25.9 1,954,579 22.2 3.7
2 Commerzbank 2,628,102 24.8 1,920,023 21.8 3.0
3 Citigroup 965,481 9.1 801,725 9.1 0.0
4 BNP Paribas 652,581 6.2 694,071 7.9 –1.7
5 UBS 647,413 6.1 692,980 7.9 –1.8
6 DZ BANK 611,551 5.8 540,349 6.1 – 0.3
7 RBS 466,920 4.4 520,138 5.9 –1.5
8 Vontobel 463,815 4.4 361,445 4.1 0.3
9 HSBC Trinkaus 451,611 4.3 361,069 4.1 0.2
10 HVB / Unicredit 356,557 3.4 338,963 3.9 – 0.5
11 Société Générale 189,712 1.8 236,010 2.7 – 0.9
12 Goldman Sachs 189,655 1.8 198,398 2.3 – 0.5
13 ING Bank 91,228 0.9 60,104 0.7 0.2
14 Lang und Schwarz 87,796 0.8 59,069 0.7 0.1
15 Raiffeisen Centrobank 12,653 0.1 8,463 0.1 0.0
16 Interactive Brokers 9,396 0.1 14,465 0.2 – 0.1
17 Erste Bank 7,353 0.1 2,884 0.0 0.1
18 Eigenemission 3,679 0.0 13,165 0.1 – 0.1
19 Barclays Bank 1,872 0.0 4,157 0.0 0.0
20 Leonteq 1.4 0.0 0,5 0.0 0.0
Other issuers 0.01 0.0 15,891 0.2 – 0.2
Total 10,580,656 100.0 8,797,948 100.0
28 The structured products market in Germany | Market share by exchange turnover

Citigroup 9.1 %BNP Paribas 6.2 %
DZ BANK 5.8 %
Erste Bank 0.1 %
Deutsche Bank 25.9 %
Raiffeisen Centrobank 0.1 %
Interactive Brokers 0.1 %
UBS 6.1 % Commerzbank 24.8 %
Lang und Schwarz 0.8 %
HSBC Trinkaus 4.3 %
Vontobel 4.4 %
HVB / Unicredit 3.4 %
Société Générale 1.8 %
Goldman Sachs 1.8 %
RBS 4.4 %
ING Bank 0.9 %
The structured products market in Germany | Market share by exchange turnover 29
Performance of structured products
The Deutscher Derivate Verband (DDV), the German Derivatives Association, supports the initiative of the European Derivatives Group (EDG AG) to publish indices for Uncapped Capital Protec-tion Certificates, Bonus Certificates and Reverse Convertibles. The indices show the average performance of popular categories of structured products using a representative selection of prod-ucts, so allowing direct comparisons with the performance of other financial products. This gives investors a transparent meas-ure of how a particular type of structured product has performed in comparison to a direct investment. The movements of the indi-ces for the various structured product categories in the first half of 2014 are shown alongside the EURO STOXX 50 equity index for comparison. This stock index is the most popular underlying in terms of the number of customer orders and volumes invested.
30 The structured products market in Germany | Performance of structured products

Performance of Uncapped Capital Protection Certificates
Retail investors who invest in Uncapped Cap-ital Protection Certificates can rest assured that they are always on safe ground. Whether the underlying goes up or down, these more defensive investors will at least receive their original sum back at maturity.Since it was launched in 2006, the Capital Protection Index has performed conside-rably better than the EURO STOXX 50, with an annual return of 3.25 percent as com-pared with minus 1.29 percent.
Source: EDGAll indices for the various categories of structured products are protected by copyright. They may not be duplicated, distributed, reprinted or circulated in any other way without the express written permission of the EDG.
Capital Protection Index
850
900
950
1,000
1,050
1,100
1,150
Pric
e (in
dexe
d)
2014
EURO STOXX 50 Capital Protection Index
January February March April May June July
The structured products market in Germany | Performance of structured products 31
Performance of Reverse Convertibles
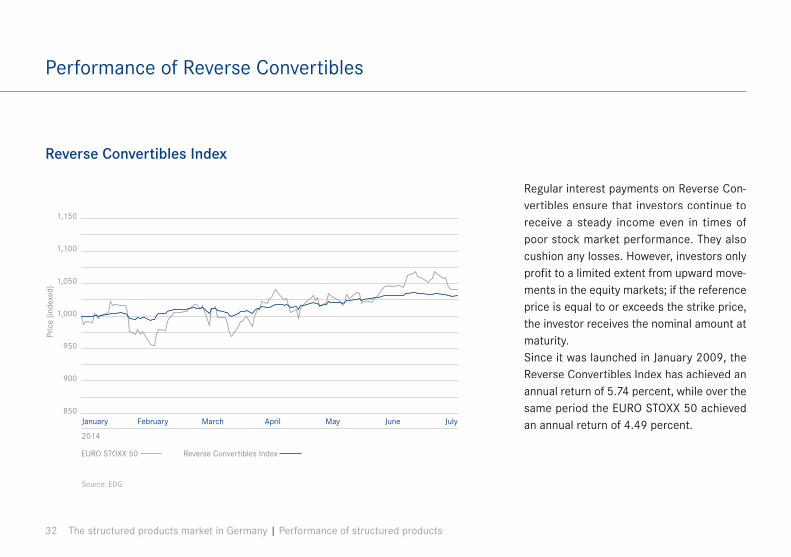
Regular interest payments on Reverse Con-vertibles ensure that investors continue to receive a steady income even in times of poor stock market performance. They also cushion any losses. However, investors only profit to a limited extent from upward move-ments in the equity markets; if the reference price is equal to or exceeds the strike price, the investor receives the nominal amount at maturity.Since it was launched in January 2009, the Reverse Convertibles Index has achieved an annual return of 5.74 percent, while over the same period the EURO STOXX 50 achieved an annual return of 4.49 percent.
Reverse Convertibles Index
850
900
950
1,000
1,050
1,100
1,150
Pric
e (in
dexe
d)
2014
January February March April May June July
EURO STOXX 50 Reverse Convertibles Index
Source: EDG
32 The structured products market in Germany | Performance of structured products

Performance of Bonus Certificates
Bonus Certificates show their strengths mainly when the price of the underlying moves sideways or rises or falls only slightly. However, if the underlying rises very sharply they cannot generally keep up with its price trend.Since it was launched in January 2006, the Bonus Index has generated an average annual return of 1.93 percent. In the same period, the EURO STOXX 50 recorded a loss of 1.29 percent.
Bonus Index
850
900
950
1,000
1,050
1,100
1,150
Pric
e (in
dexe
d)
2014
EURO STOXX 50 Bonus Index
January February March April May June July
Source: EDG
The structured products market in Germany | Performance of structured products 33

As an investment class, structured products are a very recent phenomenon. Europe’s first-ever structured product was a Tracker Certificate based on the DAX, the German blue-chip equities index. It was issued in Germany in 1990. Therefore, it should come as no surprise that the German structured products market is one of the biggest in Europe alongside the Swiss structured products market. The volume of structured products bought by investors is increasing in other countries, too, especially in Austria, Italy, France and Sweden. The respec-tive associations in these countries also belong to the European Structured Investment Products Association (EUSIPA), the sector’s European umbrella organisation.
The structured products market in Europe
EUSIPA – the European umbrella association
The European Structured Investment Pro-ducts Association (EUSIPA) acts as the voice of the structured products sector in Europe. Its main focus is on structured securities such as certificates and warrants. EUSIPA works to bring about an attractive and fair regulatory framework for these financial products.
The European umbrella association main-tains close links with European policymakers and European securities regulators on every aspect of structured products. It provides expert advice and opinions. EUSIPA responds to initiatives of the European Parliament and regulatory proposals of the Commission. It sets out the sector’s position on all issues that could have a significant impact on the European structured products sector.
EUROPEAN STRUCTURED INVESTMENT PRODUCTS ASSOCIATION
SETIPASwedish Exchange Traded Investment Products Association
Board of Directors
Reinhard BelletPresident of EUSIPARoger StuderVice-President of EUSIPAWalther AlmquistSETIPAJan ErftemeijerNEDSIPAThibault GobertAFPDBDr Hartmut KnüppelDDVDario SavoiaACEPIJürg StähelinSVSPFrank WeingartsZFA
General Assembly
Walther AlmquistSETIPAMag. Heike-Dietlind ArbterZFAJan ErftemeijerNEDSIPAThibault GobertAFPDBKlaus OppermannDDVDario SavoiaACEPIRoger StuderSVSP
Secretary General
Thomas Wulf, EUSIPA
The structured products market in Europe | EUSIPA 35
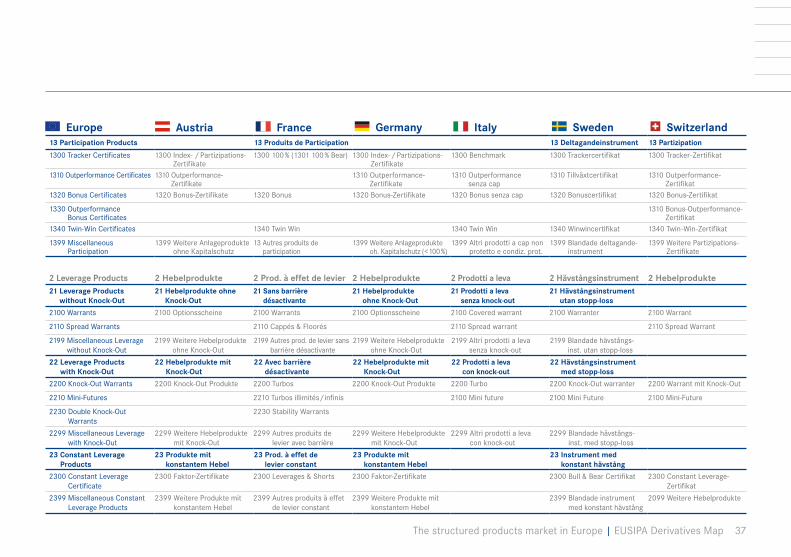
EUSIPA Derivatives Map
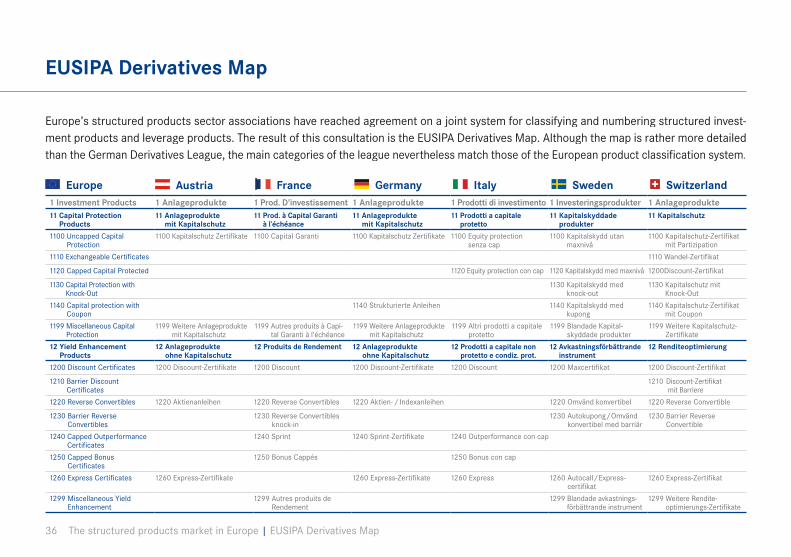
Europe’s structured products sector associations have reached agreement on a joint system for classifying and numbering structured invest-ment products and leverage products. The result of this consultation is the EUSIPA Derivatives Map. Although the map is rather more detailed than the German Derivatives League, the main categories of the league nevertheless match those of the European product classification system.
Europe Austria France Germany Italy Sweden Switzerland1 Investment Products 1 Anlageprodukte 1 Prod. D'investissement 1 Anlageprodukte 1 Prodotti di investimento 1 Investeringsprodukter 1 Anlageprodukte11 Capital Protection
Products11 Anlageprodukte
mit Kapitalschutz11 Prod. à Capital Garanti
à l’échéance11 Anlageprodukte
mit Kapitalschutz11 Prodotti a capitale
protetto11 Kapitalskyddade
produkter11 Kapitalschutz
1100 Uncapped Capital Protection
1100 Kapitalschutz Zertifikate 1100 Capital Garanti 1100 Kapitalschutz Zertifikate 1100 Equity protection senza cap
1100 Kapitalskydd utan maxnivå
1100 Kapitalschutz-Zertifikat mit Partizipation
1110 Exchangeable Certificates 1110 Wandel-Zertifikat
1120 Capped Capital Protected 1120 Equity protection con cap 1120 Kapitalskydd med maxnivå 1200Discount-Zertifikat
1130 Capital Protection with Knock-Out
1130 Kapitalskydd med knock-out
1130 Kapitalschutz mit Knock-Out
1140 Capital protection with Coupon
1140 Strukturierte Anleihen 1140 Kapitalskydd med kupong
1140 Kapitalschutz-Zertifikat mit Coupon
1199 Miscellaneous Capital Protection
1199 Weitere Anlageprodukte mit Kapitalschutz
1199 Autres produits à Capi-tal Garanti à l’échéance
1199 Weitere Anlageprodukte mit Kapitalschutz
1199 Altri prodotti a capitale protetto
1199 Blandade Kapital-skyddade produkter
1199 Weitere Kapitalschutz-Zertifikate
12 Yield Enhancement Products
12 Anlageprodukte ohne Kapitalschutz
12 Produits de Rendement 12 Anlageprodukte ohne Kapitalschutz
12 Prodotti a capitale non protetto e condiz. prot.
12 Avkastningsförbättrande instrument
12 Renditeoptimierung
1200 Discount Certificates 1200 Discount-Zertifikate 1200 Discount 1200 Discount-Zertifikate 1200 Discount 1200 Maxcertifikat 1200 Discount-Zertifikat
1210 Barrier Discount Certificates
1210 Discount-Zertifikat mit Barriere
1220 Reverse Convertibles 1220 Aktienanleihen 1220 Reverse Convertibles 1220 Aktien- / Indexanleihen 1220 Omvänd konvertibel 1220 Reverse Convertible
1230 Barrier Reverse Convertibles
1230 Reverse Convertibles knock-in
1230 Autokupong / Omvänd konvertibel med barriär
1230 Barrier Reverse Convertible
1240 Capped Outperformance Certificates
1240 Sprint 1240 Sprint-Zertifikate 1240 Outperformance con cap
1250 Capped Bonus Certificates
1250 Bonus Cappés 1250 Bonus con cap
1260 Express Certificates 1260 Express-Zertifikate 1260 Express-Zertifikate 1260 Express 1260 Autocall / Express-certifikat
1260 Express-Zertifikat
1299 Miscellaneous Yield Enhancement
1299 Autres produits de Rendement
1299 Blandade avkastnings-förbättrande instrument
1299 Weitere Rendite-optimierungs-Zertifikate
36 The structured products market in Europe | EUSIPA Derivatives Map
Europe Austria France Germany Italy Sweden Switzerland13 Participation Products 13 Produits de Participation 13 Deltagandeinstrument 13 Partizipation
1300 Tracker Certificates 1300 Index- / Partizipations-Zertifikate
1300 100 % (1301 100 % Bear) 1300 Index- / Partizipations-Zertifikate
1300 Benchmark 1300 Trackercertifikat 1300 Tracker-Zertifikat
1310 Outperformance Certificates 1310 Outperformance-Zertifikate
1310 Outperformance-Zertifikate
1310 Outperformance senza cap
1310 Tillväxtcertifikat 1310 Outperformance-Zertifikat
1320 Bonus Certificates 1320 Bonus-Zertifikate 1320 Bonus 1320 Bonus-Zertifikate 1320 Bonus senza cap 1320 Bonuscertifikat 1320 Bonus-Zertifikat
1330 Outperformance Bonus Certificates
1310 Bonus-Outperformance-Zertifikat
1340 Twin-Win Certificates 1340 Twin Win 1340 Twin Win 1340 Winwincertifikat 1340 Twin-Win-Zertifikat
1399 Miscellaneous Participation
1399 Weitere Anlageprodukte ohne Kapitalschutz
13 Autres produits de participation
1399 Weitere Anlageprodukte oh. Kapitalschutz (< 100 %)
1399 Altri prodotti a cap non protetto e condiz. prot.
1399 Blandade deltagande-instrument
1399 Weitere Partizipations-Zertifikate
2 Leverage Products 2 Hebelprodukte 2 Prod. à effet de levier 2 Hebelprodukte 2 Prodotti a leva 2 Hävstångsinstrument 2 Hebelprodukte21 Leverage Products
without Knock-Out21 Hebelprodukte ohne
Knock-Out21 Sans barrière
désactivante21 Hebelprodukte
ohne Knock-Out21 Prodotti a leva
senza knock-out21 Hävstångsinstrument
utan stopp-loss
2100 Warrants 2100 Optionsscheine 2100 Warrants 2100 Optionsscheine 2100 Covered warrant 2100 Warranter 2100 Warrant
2110 Spread Warrants 2110 Cappés & Floorés 2110 Spread warrant 2110 Spread Warrant
2199 Miscellaneous Leverage without Knock-Out
2199 Weitere Hebelprodukte ohne Knock-Out
2199 Autres prod. de levier sans barrière désactivante
2199 Weitere Hebelprodukte ohne Knock-Out
2199 Altri prodotti a leva senza knock-out
2199 Blandade hävstångs-inst. utan stopp-loss
22 Leverage Products with Knock-Out
22 Hebelprodukte mit Knock-Out
22 Avec barrière désactivante
22 Hebelprodukte mit Knock-Out
22 Prodotti a leva con knock-out
22 Hävstångsinstrumentmed stopp-loss
2200 Knock-Out Warrants 2200 Knock-Out Produkte 2200 Turbos 2200 Knock-Out Produkte 2200 Turbo 2200 Knock-Out warranter 2200 Warrant mit Knock-Out
2210 Mini-Futures 2210 Turbos illimités / infinis 2100 Mini future 2100 Mini Future 2100 Mini-Future
2230 Double Knock-Out Warrants
2230 Stability Warrants
2299 Miscellaneous Leverage with Knock-Out
2299 Weitere Hebelprodukte mit Knock-Out
2299 Autres produits de levier avec barrière
2299 Weitere Hebelprodukte mit Knock-Out
2299 Altri prodotti a leva con knock-out
2299 Blandade hävstångs-inst. med stopp-loss
23 Constant Leverage Products
23 Produkte mit konstantem Hebel
23 Prod. à effet de levier constant
23 Produkte mit konstantem Hebel
23 Instrument med konstant hävstång
2300 Constant Leverage Certificate
2300 Faktor-Zertifikate 2300 Leverages & Shorts 2300 Faktor-Zertifikate 2300 Bull & Bear Certifikat 2300 Constant Leverage-Zertifikat
2399 Miscellaneous Constant Leverage Products
2399 Weitere Produkte mit konstantem Hebel
2399 Autres produits à effet de levier constant
2399 Weitere Produkte mit konstantem Hebel
2399 Blandade instrument med konstant hävstång
2099 Weitere Hebelprodukte
The structured products market in Europe | EUSIPA Derivatives Map 37

Market volume in Europe according to EUSIPA classification
Investment and leverage products by product category in June 2014 (in EUR million)
Germany Austria Switzerland EUSIPA
1 Investment Products
11 Capital Protection 51,472 44,346
12 Yield Enhancement 15,661 57,916
13 Participation 7,511 41,493
199 Various 5,139 2,880
79,783 12,400 146,635 238,818
2 Leverage Products
21 without Knock-Out 675
22 with Knock-Out 737
23 Constant Leverage 250
299 Various
1,662 88 11,171 12,920
Total 81,445 12,488 157,806 251,738
In Germany, Austria and Switzerland the outstanding volume at the end of June 2014 was EUR 251.7 billion. The market volume of investment products at the end of the second quarter of 2014 was EUR 238.8 billion, while EUR 12.9 billion was invested in leve-rage products.
38 Structured products market in Europe | Market volume in Europe

Investment products by quarter (in EUR million) Leverage products by quarter (in EUR million )
Market volume in Europe by country and quarter
2013 2014
Q2 Q3 Q4 Q1 Q2
Austria 12,900 12,600 12,500 12,300 12,400
Germany 86,886 85,877 84,196 84,512 79,783
Switzerland 124,871 120,774 137,965 141,619 146,635
Total 224,658 219,251 234,661 238,430 238,818
0
50,000
100,000
150,000
200,000
250,000
2013 2014
Q2 Q3 Q4 Q1 Q2
78 89 88 87 88
1,154 1,287 1,497 1,581 1,662
12,102 6,754 11,820 10,712 11,171
13,333 8,129 13,405 12,380 12,920
0
5,000
2,500
7,500
10,000
12,500
15,000
Structured products market in Europe | Market volume in Europe 39
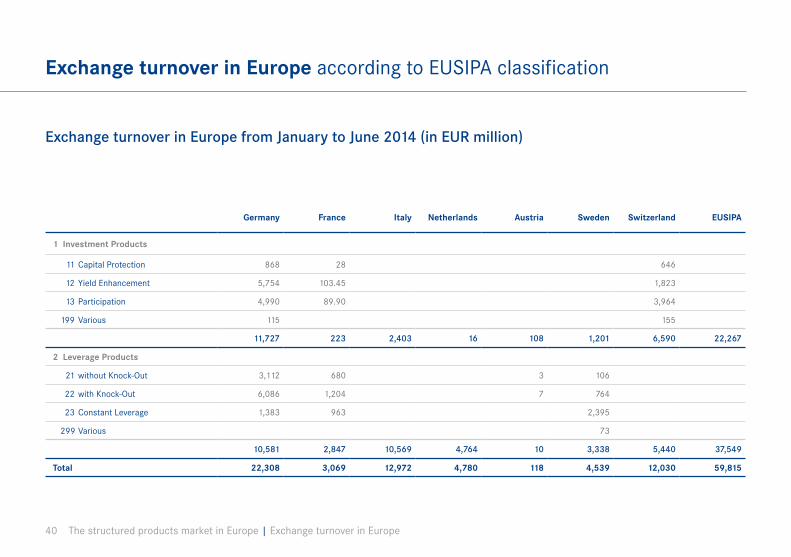
Exchange turnover in Europe according to EUSIPA classification
Exchange turnover in Europe from January to June 2014 (in EUR million)
Germany France Italy Netherlands Austria Sweden Switzerland EUSIPA
1 Investment Products
11 Capital Protection 868 28 646
12 Yield Enhancement 5,754 103.45 1,823
13 Participation 4,990 89.90 3,964
199 Various 115 155
11,727 223 2,403 16 108 1,201 6,590 22,267
2 Leverage Products
21 without Knock-Out 3,112 680 3 106
22 with Knock-Out 6,086 1,204 7 764
23 Constant Leverage 1,383 963 2,395
299 Various 73
10,581 2,847 10,569 4,764 10 3,338 5,440 37,549
Total 22,308 3,069 12,972 4,780 118 4,539 12,030 59,815
40 The structured products market in Europe | Exchange turnover in Europe

2013 2014
Q2 Q3 Q4 Q1 Q2 H1
Netherlands 8 7 9 10 6 16
Austria 55 41 52 61 47 108
France 115 123 115 135 88 223
Italy 999 861 1,185 1,162 1,241 2,403
Sweden 532 394 545 685 516 1,201
Switzerland 4,446 2,615 2,745 4,272 2,318 6,590
Germany 6,858 6,057 6,519 6,559 5,167 11,726
Total 13,013 10,098 11,169 12,884 9,383 22,266
2013 2014
Q2 Q3 Q4 Q1 Q2 H1
2,195 1,943 1,947 2,682 2,082 4,764
6 3 4 6 4 10
1,564 1,507 1,459 1,616 1,231 2,847
3,263 2,934 3,557 5,185 5,384 10,569
1,410 1,303 1,451 1,841 1,497 3,338
3,355 2,558 2,593 3,015 2,425 5,440
4,454 3,806 4,465 6,180 4,400 10,580
16,247 14,055 15,476 20,526 17,023 37,548
Investment products by quarter (in EUR million) Leverage products by quarter (in EUR million)
Exchange turnover in Europe by country and quarter
0
3,000
6,000
9,000
12,000
15,000
0
5,000
10,000
25,000
20,000
15,000
The structured products market in Europe | Exchange turnover in Europe 41

DDV in brief
The Deutscher Derivate Verband (DDV), the German Derivatives Association, is the industry representative body of the leading issuers of derivative securities in Germany. It represents approximately 90 percent of the German structured products market. The DDV serves as a political interest group in Berlin and Brussels. The association was establis-hed on 14 February 2008 and has offices in Berlin, Brussels and Frankfurt am Main.
Political communicationThe active exchange of opinion with political decision-makers and supporting legislative initiatives count among the key tasks of the association. The DDV is a point of contact
for politicians in all matters concerning the structured products industry; offering its expert knowledge, it actively contributes to the shaping of political opinion in both Ger-many and Europe. In addition, the associa-tion conducts intensive discussions with the regulatory authorities such as the Federal Financial Supervisory Authority (BaFin), the European Securities and Markets Authority (ESMA) and the International Organization of Securities Commissions (IOSCO).
Media and public relationsThe DDV’s media and public relations activities involve providing information on important aspects of the structured products market.
The DDV provides comprehensive informa-tion for journalists, multipliers in the fields of politics and business, and individual inves-tors. At the same time, there is always consi-derable interest in the Association’s events, which act as a forum for the exchange of news and views.
Other responsibilitiesThe Association aims to improve the protec-tion available to investors and to increase the transparency and comprehensibility of the sector’s products. Together with its members and sponsoring members, the DDV strives to implement new standards across the sector.
42 Deutscher Derivate Verband | DDV in brief

Members and sponsoring members
Members Sponsoring Members
As at: 30 June 2014
Deutscher Derivate Verband | Members and sponsoring members 43

Board of Directors
Stefan Armbruster is Managing Director at Deutsche Bank AG, responsible for the distribution and marketing of investment certificates and warrants.
Jan Krüger is Head of the Retail Clients division at LBBW and is responsible for product management and the dis-tribution and marketing of structured products and debt instruments to retail customers.
Klaus Oppermann is Head of Public Distribution in the Corporates & Markets division at Commerzbank AG. He is responsible for the public distribution of securitised derivatives in Germany and other European countries.
Grégoire Toublanc is Head of Exchange Traded Solutions at BNP Paribas and is responsible for the distribution and marketing of structured products.
Dr Hartmut Knüppel is CEO and Member of the Board of Directors at the Deutscher Derivate Verband (DDV). He has previously served in various roles in politics and industry.
Management
Dr Hartmut Knüppel is Chief Executive Officer and a Member of the DDV’s Board of Directors. He is also a Member of the Board of EUSIPA, the sector’s European umbrella association.
Lars Brandau holds the position of Managing Director at the DDV. As Head of the Frankfurt Office, he is primarily responsible for the association’s media and public rela-tions activities.
Christian Vollmuth also holds the position of Managing Director. As Head of the Berlin Office, he deals mainly with the legal and regulatory issues of the Association.
44 Deutscher Derivate Verband | Governing bodies

Strategic Board
Dr Jürgen AmendingerUniCredit Bank AGDeputy Global Head of PrivateInvestor Products Global Head of Corporate Investment Products
Frank BurkhardtSociété Générale S. A.Head of Global MarketsGermany and Austria
Serge DemolièreLandesbank BerlinMember of the Board ofManagement
Lars HilleDZ BANK AGMember of the Board of Managing Directors
Philip HolzerGoldman Sachs InternationalPartner
Rainer KrickHelaba - LandesbankHessen-ThüringenMember of the Board of Directors
Torsten MurkeBNP Paribas S. A.Head of Corporate and Investment Banking
Michael ReutherCommerzbank AGMember of the Board of Managing Directors
Carola Gräfin von SchmettowHSBC Trinkaus & Burkhardt AGMember of the ManagementBoard
Dirk SchmitzDeutsche Bank AGManaging DirectorHead of Coverage Germany& Austria
Roger StuderVontobel GroupHead of Investment Banking
Stefan WinterUBS Deutschland AGMember of the Executive Board
Deutscher Derivate Verband | Governing bodies 45
Publications
Free literature such as books, brochures, CDs and DVDs can be requested from our order centre (‘Bestell-Center’) at www.derivateverband.de/DEU/Publikationen/Bestell-Center
The Derivates LeagueStructured products for successful investing.
Fairness CodeVoluntary undertaking by issuers to observe standards with respect to the structuring, issuing, marketing and trading of structured products.
The Fairness Code and corresponding Notes are also available in English and French.
Investor protection in practiceA brochure covering the legal framework for structured products in Germany.
Discount CertificatesA book explaining in detail the classic struc-tured investment products.
Annual report 2013:Committed to fairness and clear rules.
DDV brieflyBrief description of the association’s core tasks and most important activities.
Structured products trainingThe three-level structured products tutorial as a CD.
The Derivates LeagueDVD explaining the product classification, with podcasts on the individual product categories.
Structured products savings plan calculator (CD)The savings plan calculator in CD form. For capital accumulation, pension planning and long-term investing.
46 Deutscher Derivate Verband | Publications

Published by: Deutscher Derivate Verband e. V.Register number at the register of associations: VR 13943
Concept and consultation:IFU Institut für Unternehmenskommunikation GmbH
Design:Liebchen+Liebchen GmbH
Photo credits:Cover: photocase / Gestaltungsart, inkpark, dije, time.Pages 2 to 3: Ihar Balaikin, Chitsanupong Chuenthananont, spirit of america, leungchopanPage 4: Gemenacom, Miyuki Satake; photocase / bauzaun.Page 34: photocase / kemai; Tom Hoenig Westend61
Deutscher Derivate Verband | Publications 47

www.derivateverband.de
BerlinDeutscher Derivate VerbandPariser Platz 310117 BerlinGermanyPhone +49 (30) 4000 475 - [email protected]
Offices
Frankfurt a. M.Deutscher Derivate VerbandFeldbergstraße 3860323 Frankfurt a. M.GermanyPhone +49 (69) 244 33 03 - [email protected]
BrusselsBastion Tower Level 205, place du Champ de Mars1050 BrusselsBelgiumPhone +32 (2) 550 34 [email protected]
Related Documents