
Welcome message from author
This document is posted to help you gain knowledge. Please leave a comment to let me know what you think about it! Share it to your friends and learn new things together.
Transcript
THE STRUCTURE AND EVOLUTION OF EMPLOYMENT IN EGYPT: 1998-2012
Ragui Assaad and Caroline Krafft
Working Paper 805
November 2013
Send correspondence to: Ragui Assaad University of Minnesota [email protected]
First published in 2013 by The Economic Research Forum (ERF) 21 Al-Sad Al-Aaly Street Dokki, Giza Egypt www.erf.org.eg Copyright © The Economic Research Forum, 2013 All rights reserved. No part of this publication may be reproduced in any form or by any electronic or mechanical means, including information storage and retrieval systems, without permission in writing from the publisher. The findings, interpretations and conclusions expressed in this publication are entirely those of the author(s) and should not be attributed to the Economic Research Forum, members of its Board of Trustees, or its donors.
1
Abstract
This paper conducts a detailed analysis of the evolution of the employment situation in Egypt over the period from 1998 to 2012, paying special attention to the impact of the economic crisis accompanying the January 25 th 2011 revolution. Data from the Egypt Labor Market Panel Survey of 2012 is used and compared to the 1998 and 2006 survey rounds. Trends in job creation, employment status, sector, industry, and occupation are examined. This paper also investigates job mobility between statuses from 2006 to 2012 and compares this to patterns of mobility from 1998 to 2006. Additionally, we examine changes in the conditions of work, including characteristics such as stability, formality, hours, benefits, and firm size. Employment in the private sector continues to be dominated by small firms and informal work. Irregular wage work—the type of employment that is most closely associated with vulnerability and poverty—has risen substantially as of 2012. Overall, there appears to have been a substantial deterioration in employment conditions in the private sector, but stability, if not improvement, in conditions for those employed in the public sector.
JEL Classifications: J01, J21, J32, J62
Keywords: Employment Structure, Job Creation, Job Mobility, Employment Conditions, Vulnerable Employment, Egypt
لخصم
الء اھتمام 2012-1998تجري ھذه الورقة تحلیال مفصال لتطور حالة العمالة في مصر خالل الفترة ع إی ة خاص أل ، م ر األزم ث
ة و 2012عام ل ىمصرالسوق العمل التتبعى لمسح البیانات من وباستخدام . 2011ینایر 25ثورة لاالقتصادیة المصاحبة بالمقارن
كما . لمھنةایتم فحص االتجاھات في خلق فرص العمل ، والوضع الوظیفي ، والقطاع ، والصناعة، و 2006و 1998 سوحمجوالت ب
لتنقل بین ال مطنالورقة تبحث ھذه ل تو 2012-2006 راكزما اط التنق درس . 2006-1998قارن ھذا إلى أنم ك، ن ى ذل افة إل باإلض
واصل ی. ، والفوائد، و حجم الشركة العمل، وساعات تاشكلیالخصائص مثل االستقرار، و التغیرات في ظروف العمل ، بما في ذلك
ألجور غیر النظاميابالعمل وقد ارتفع . في القطاع الخاص لتوظیفا لى ع لھیمنة ا ركات الصغیرة و العمل غیر الرسميالشلك من
شكل وثیق وھو 2012اعتبارا من عام ي و. ضعف وال الفقربنوع العمل الذي یرتبط ب ر ف عموما، یبدو أنھ لم یكن ھناك تدھور كبی
.أولئك الذین یعملون في القطاع العاموف ظروف العمل في القطاع الخاص ، ولكن االستقرار ، إن لم یكن التحسن، في ظر
2
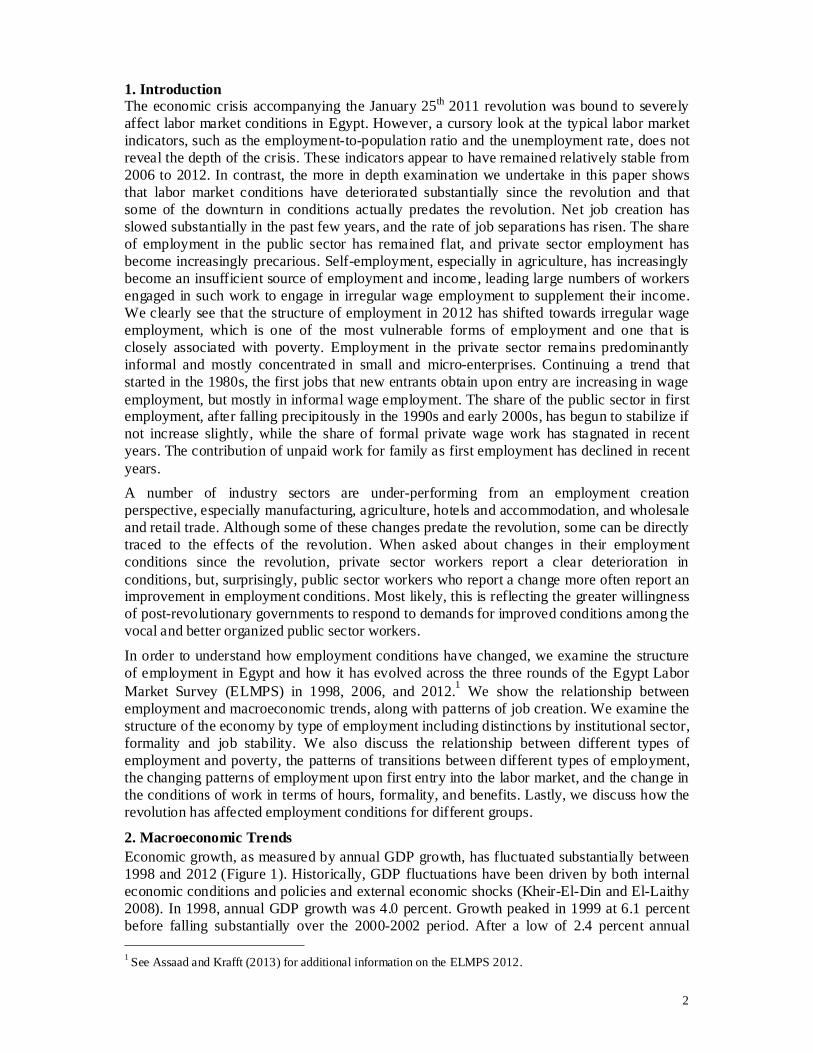
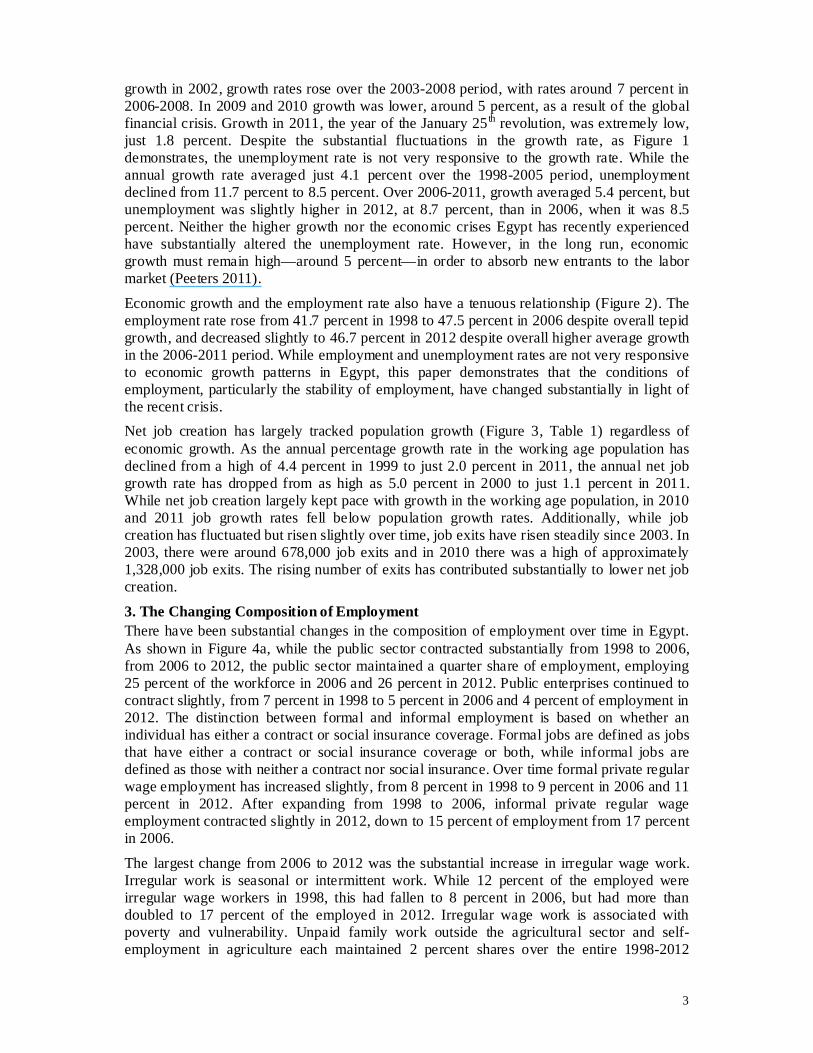
1. Introduction The economic crisis accompanying the January 25th 2011 revolution was bound to severely affect labor market conditions in Egypt. However, a cursory look at the typical labor market indicators, such as the employment-to-population ratio and the unemployment rate, does not reveal the depth of the crisis. These indicators appear to have remained relatively stable from 2006 to 2012. In contrast, the more in depth examination we undertake in this paper shows that labor market conditions have deteriorated substantially since the revolution and that some of the downturn in conditions actually predates the revolution. Net job creation has slowed substantially in the past few years, and the rate of job separations has risen. The share of employment in the public sector has remained flat, and private sector employment has become increasingly precarious. Self-employment, especially in agriculture, has increasingly become an insufficient source of employment and income, leading large numbers of workers engaged in such work to engage in irregular wage employment to supplement their income. We clearly see that the structure of employment in 2012 has shifted towards irregular wage employment, which is one of the most vulnerable forms of employment and one that is closely associated with poverty. Employment in the private sector remains predominantly informal and mostly concentrated in small and micro-enterprises. Continuing a trend that started in the 1980s, the first jobs that new entrants obtain upon entry are increasing in wage employment, but mostly in informal wage employment. The share of the public sector in first employment, after falling precipitously in the 1990s and early 2000s, has begun to stabilize if not increase slightly, while the share of formal private wage work has stagnated in recent years. The contribution of unpaid work for family as first employment has declined in recent years. A number of industry sectors are under-performing from an employment creation perspective, especially manufacturing, agriculture, hotels and accommodation, and wholesale and retail trade. Although some of these changes predate the revolution, some can be directly traced to the effects of the revolution. When asked about changes in their employment conditions since the revolution, private sector workers report a clear deterioration in conditions, but, surprisingly, public sector workers who report a change more often report an improvement in employment conditions. Most likely, this is reflecting the greater willingness of post-revolutionary governments to respond to demands for improved conditions among the vocal and better organized public sector workers.
In order to understand how employment conditions have changed, we examine the structure of employment in Egypt and how it has evolved across the three rounds of the Egypt Labor Market Survey (ELMPS) in 1998, 2006, and 2012.1 We show the relationship between employment and macroeconomic trends, along with patterns of job creation. We examine the structure of the economy by type of employment including distinctions by institutional sector, formality and job stability. We also discuss the relationship between different types of employment and poverty, the patterns of transitions between different types of employment, the changing patterns of employment upon first entry into the labor market, and the change in the conditions of work in terms of hours, formality, and benefits. Lastly, we discuss how the revolution has affected employment conditions for different groups.
2. Macroeconomic Trends Economic growth, as measured by annual GDP growth, has fluctuated substantially between 1998 and 2012 (Figure 1). Historically, GDP fluctuations have been driven by both internal economic conditions and policies and external economic shocks (Kheir-El-Din and El-Laithy 2008). In 1998, annual GDP growth was 4.0 percent. Growth peaked in 1999 at 6.1 percent before falling substantially over the 2000-2002 period. After a low of 2.4 percent annual 1 See Assaad and Krafft (2013) for additional information on the ELMPS 2012.
3
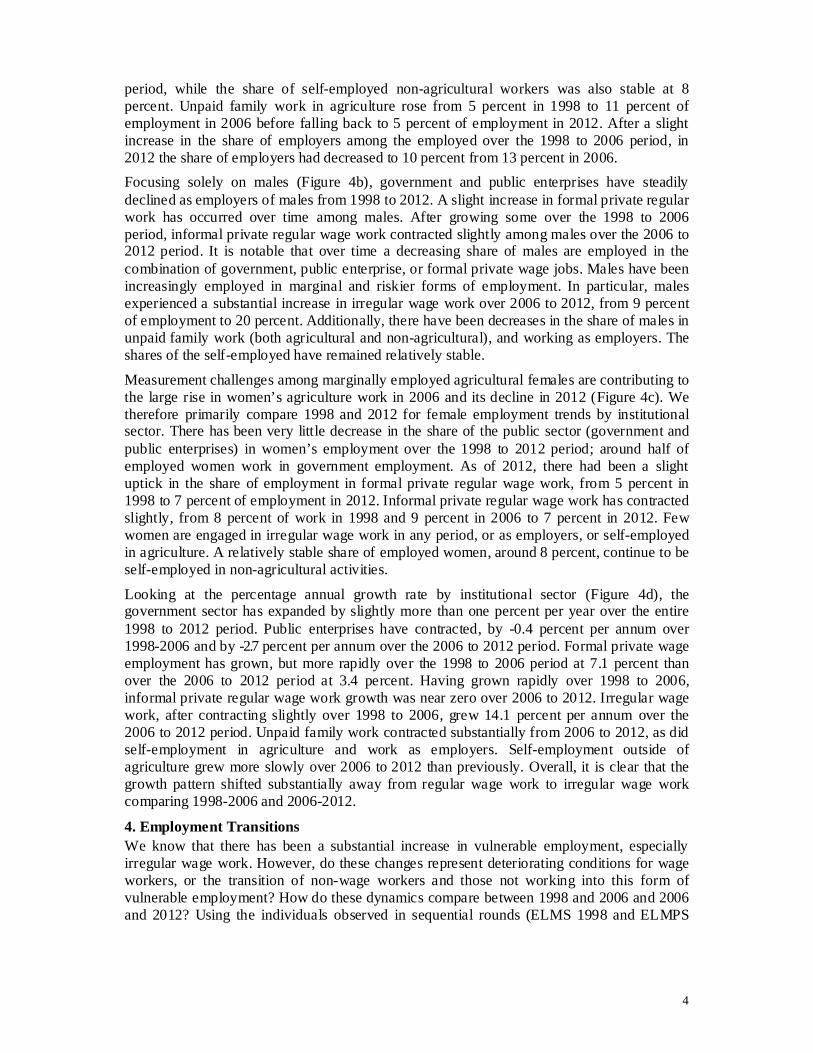
growth in 2002, growth rates rose over the 2003-2008 period, with rates around 7 percent in 2006-2008. In 2009 and 2010 growth was lower, around 5 percent, as a result of the global financial crisis. Growth in 2011, the year of the January 25 th revolution, was extremely low, just 1.8 percent. Despite the substantial fluctuations in the growth rate, as Figure 1 demonstrates, the unemployment rate is not very responsive to the growth rate. While the annual growth rate averaged just 4.1 percent over the 1998-2005 period, unemployment declined from 11.7 percent to 8.5 percent. Over 2006-2011, growth averaged 5.4 percent, but unemployment was slightly higher in 2012, at 8.7 percent, than in 2006, when it was 8.5 percent. Neither the higher growth nor the economic crises Egypt has recently experienced have substantially altered the unemployment rate. However, in the long run, economic growth must remain high—around 5 percent—in order to absorb new entrants to the labor market (Peeters 2011).
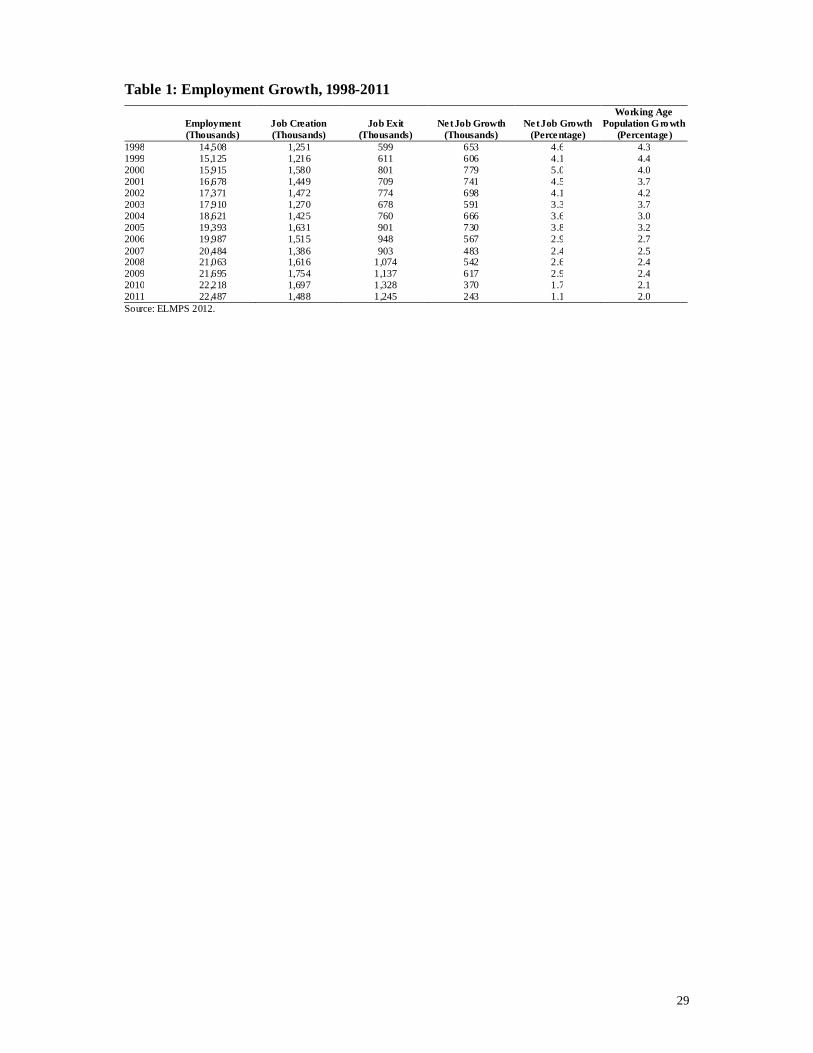
Economic growth and the employment rate also have a tenuous relationship (Figure 2). The employment rate rose from 41.7 percent in 1998 to 47.5 percent in 2006 despite overall tepid growth, and decreased slightly to 46.7 percent in 2012 despite overall higher average growth in the 2006-2011 period. While employment and unemployment rates are not very responsive to economic growth patterns in Egypt, this paper demonstrates that the conditions of employment, particularly the stability of employment, have changed substantially in light of the recent crisis. Net job creation has largely tracked population growth (Figure 3, Table 1) regardless of economic growth. As the annual percentage growth rate in the working age population has declined from a high of 4.4 percent in 1999 to just 2.0 percent in 2011, the annual net job growth rate has dropped from as high as 5.0 percent in 2000 to just 1.1 percent in 2011. While net job creation largely kept pace with growth in the working age population, in 2010 and 2011 job growth rates fell below population growth rates. Additionally, while job creation has fluctuated but risen slightly over time, job exits have risen steadily since 2003. In 2003, there were around 678,000 job exits and in 2010 there was a high of approximately 1,328,000 job exits. The rising number of exits has contributed substantially to lower net job creation.
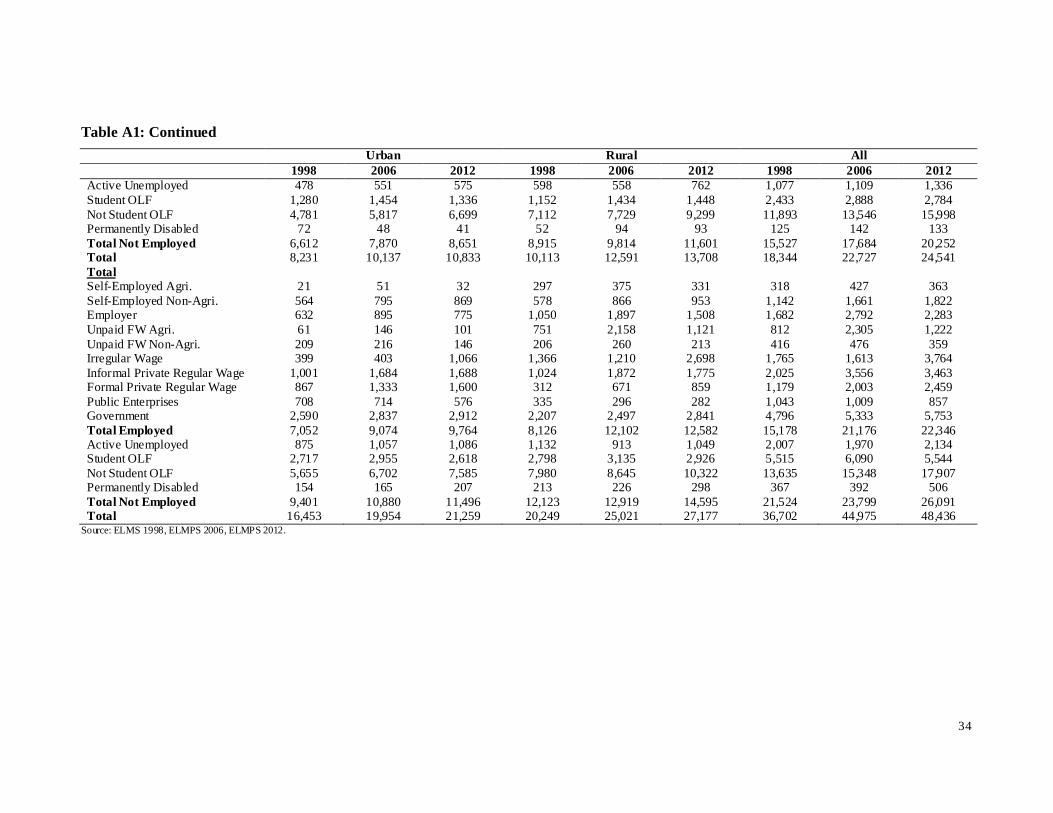
3. The Changing Composition of Employment There have been substantial changes in the composition of employment over time in Egypt. As shown in Figure 4a, while the public sector contracted substantially from 1998 to 2006, from 2006 to 2012, the public sector maintained a quarter share of employment, employing 25 percent of the workforce in 2006 and 26 percent in 2012. Public enterprises continued to contract slightly, from 7 percent in 1998 to 5 percent in 2006 and 4 percent of employment in 2012. The distinction between formal and informal employment is based on whether an individual has either a contract or social insurance coverage. Formal jobs are defined as jobs that have either a contract or social insurance coverage or both, while informal jobs are defined as those with neither a contract nor social insurance. Over time formal private regular wage employment has increased slightly, from 8 percent in 1998 to 9 percent in 2006 and 11 percent in 2012. After expanding from 1998 to 2006, informal private regular wage employment contracted slightly in 2012, down to 15 percent of employment from 17 percent in 2006.
The largest change from 2006 to 2012 was the substantial increase in irregular wage work. Irregular work is seasonal or intermittent work. While 12 percent of the employed were irregular wage workers in 1998, this had fallen to 8 percent in 2006, but had more than doubled to 17 percent of the employed in 2012. Irregular wage work is associated with poverty and vulnerability. Unpaid family work outside the agricultural sector and self-employment in agriculture each maintained 2 percent shares over the entire 1998-2012
4
period, while the share of self-employed non-agricultural workers was also stable at 8 percent. Unpaid family work in agriculture rose from 5 percent in 1998 to 11 percent of employment in 2006 before falling back to 5 percent of employment in 2012. After a slight increase in the share of employers among the employed over the 1998 to 2006 period, in 2012 the share of employers had decreased to 10 percent from 13 percent in 2006. Focusing solely on males (Figure 4b), government and public enterprises have steadily declined as employers of males from 1998 to 2012. A slight increase in formal private regular work has occurred over time among males. After growing some over the 1998 to 2006 period, informal private regular wage work contracted slightly among males over the 2006 to 2012 period. It is notable that over time a decreasing share of males are employed in the combination of government, public enterprise, or formal private wage jobs. Males have been increasingly employed in marginal and riskier forms of employment. In particular, males experienced a substantial increase in irregular wage work over 2006 to 2012, from 9 percent of employment to 20 percent. Additionally, there have been decreases in the share of males in unpaid family work (both agricultural and non-agricultural), and working as employers. The shares of the self-employed have remained relatively stable.
Measurement challenges among marginally employed agricultural females are contributing to the large rise in women’s agriculture work in 2006 and its decline in 2012 (Figure 4c). We therefore primarily compare 1998 and 2012 for female employment trends by institutional sector. There has been very little decrease in the share of the public sector (government and public enterprises) in women’s employment over the 1998 to 2012 period; around half of employed women work in government employment. As of 2012, there had been a slight uptick in the share of employment in formal private regular wage work, from 5 percent in 1998 to 7 percent of employment in 2012. Informal private regular wage work has contracted slightly, from 8 percent of work in 1998 and 9 percent in 2006 to 7 percent in 2012. Few women are engaged in irregular wage work in any period, or as employers, or self-employed in agriculture. A relatively stable share of employed women, around 8 percent, continue to be self-employed in non-agricultural activities.
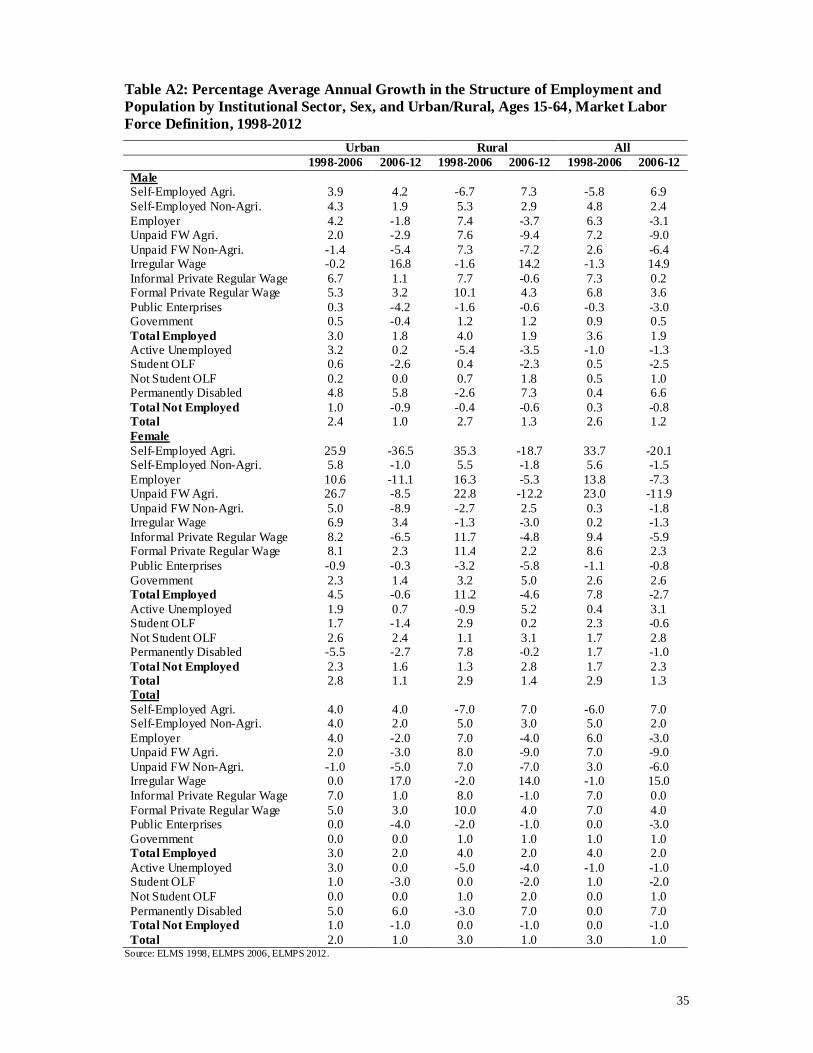
Looking at the percentage annual growth rate by institutional sector (Figure 4d), the government sector has expanded by slightly more than one percent per year over the entire 1998 to 2012 period. Public enterprises have contracted, by -0.4 percent per annum over 1998-2006 and by -2.7 percent per annum over the 2006 to 2012 period. Formal private wage employment has grown, but more rapidly over the 1998 to 2006 period at 7.1 percent than over the 2006 to 2012 period at 3.4 percent. Having grown rapidly over 1998 to 2006, informal private regular wage work growth was near zero over 2006 to 2012. Irregular wage work, after contracting slightly over 1998 to 2006, grew 14.1 percent per annum over the 2006 to 2012 period. Unpaid family work contracted substantially from 2006 to 2012, as did self-employment in agriculture and work as employers. Self-employment outside of agriculture grew more slowly over 2006 to 2012 than previously. Overall, it is clear that the growth pattern shifted substantially away from regular wage work to irregular wage work comparing 1998-2006 and 2006-2012.
4. Employment Transitions We know that there has been a substantial increase in vulnerable employment, especially irregular wage work. However, do these changes represent deteriorating conditions for wage workers, or the transition of non-wage workers and those not working into this form of vulnerable employment? How do these dynamics compare between 1998 and 2006 and 2006 and 2012? Using the individuals observed in sequential rounds (ELMS 1998 and ELMPS
5
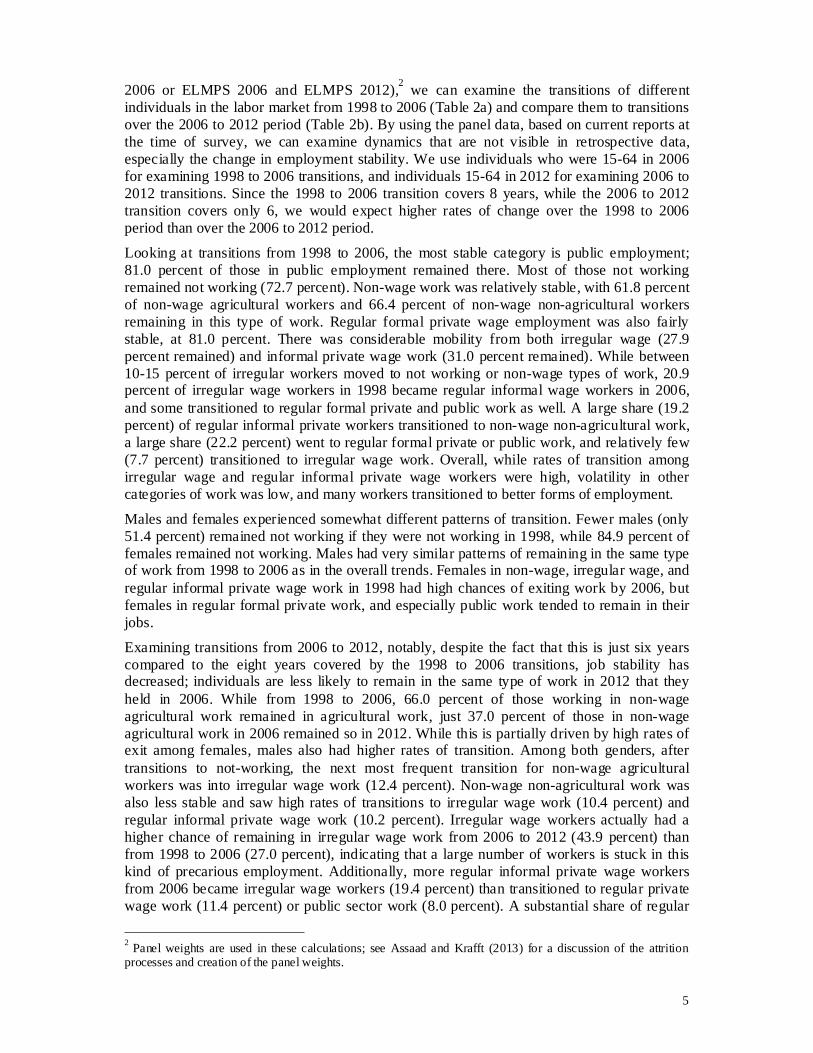
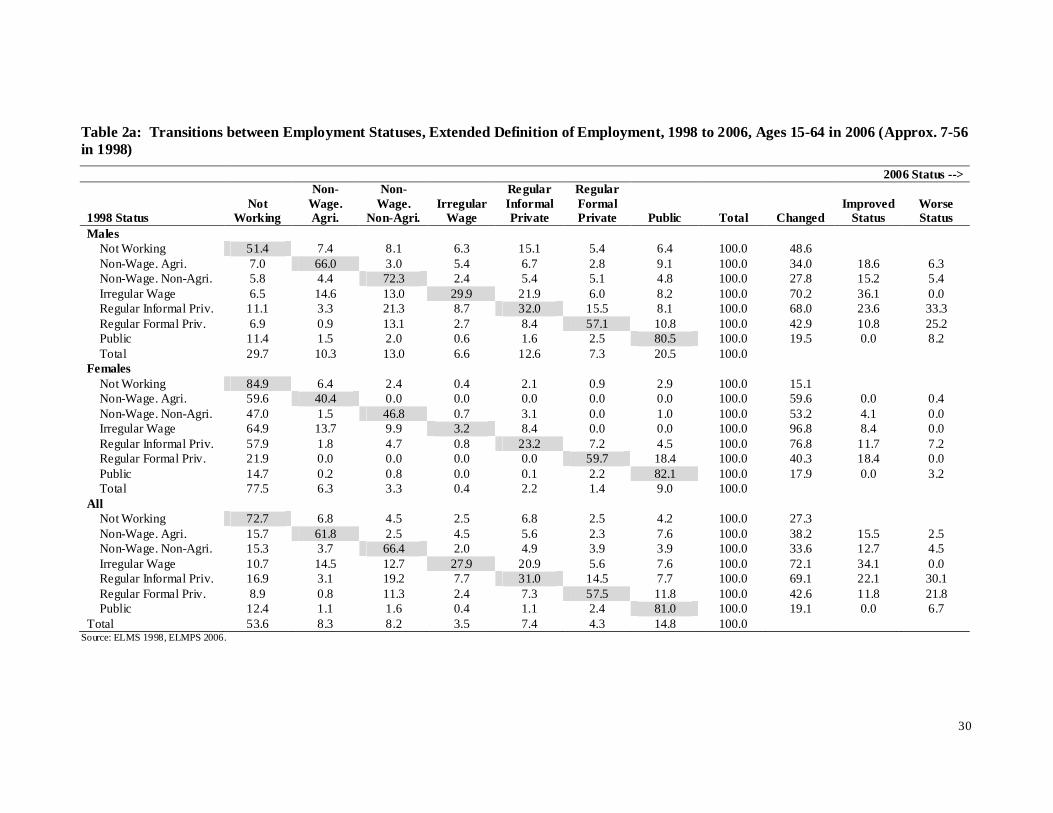
2006 or ELMPS 2006 and ELMPS 2012),2 we can examine the transitions of different individuals in the labor market from 1998 to 2006 (Table 2a) and compare them to transitions over the 2006 to 2012 period (Table 2b). By using the panel data, based on current reports at the time of survey, we can examine dynamics that are not visible in retrospective data, especially the change in employment stability. We use individuals who were 15-64 in 2006 for examining 1998 to 2006 transitions, and individuals 15-64 in 2012 for examining 2006 to 2012 transitions. Since the 1998 to 2006 transition covers 8 years, while the 2006 to 2012 transition covers only 6, we would expect higher rates of change over the 1998 to 2006 period than over the 2006 to 2012 period.
Looking at transitions from 1998 to 2006, the most stable category is public employment; 81.0 percent of those in public employment remained there. Most of those not working remained not working (72.7 percent). Non-wage work was relatively stable, with 61.8 percent of non-wage agricultural workers and 66.4 percent of non-wage non-agricultural workers remaining in this type of work. Regular formal private wage employment was also fairly stable, at 81.0 percent. There was considerable mobility from both irregular wage (27.9 percent remained) and informal private wage work (31.0 percent remained). While between 10-15 percent of irregular workers moved to not working or non-wage types of work, 20.9 percent of irregular wage workers in 1998 became regular informal wage workers in 2006, and some transitioned to regular formal private and public work as well. A large share (19.2 percent) of regular informal private workers transitioned to non-wage non-agricultural work, a large share (22.2 percent) went to regular formal private or public work, and relatively few (7.7 percent) transitioned to irregular wage work. Overall, while rates of transition among irregular wage and regular informal private wage workers were high, volatility in other categories of work was low, and many workers transitioned to better forms of employment.
Males and females experienced somewhat different patterns of transition. Fewer males (only 51.4 percent) remained not working if they were not working in 1998, while 84.9 percent of females remained not working. Males had very similar patterns of remaining in the same type of work from 1998 to 2006 as in the overall trends. Females in non-wage, irregular wage, and regular informal private wage work in 1998 had high chances of exiting work by 2006, but females in regular formal private work, and especially public work tended to remain in their jobs.
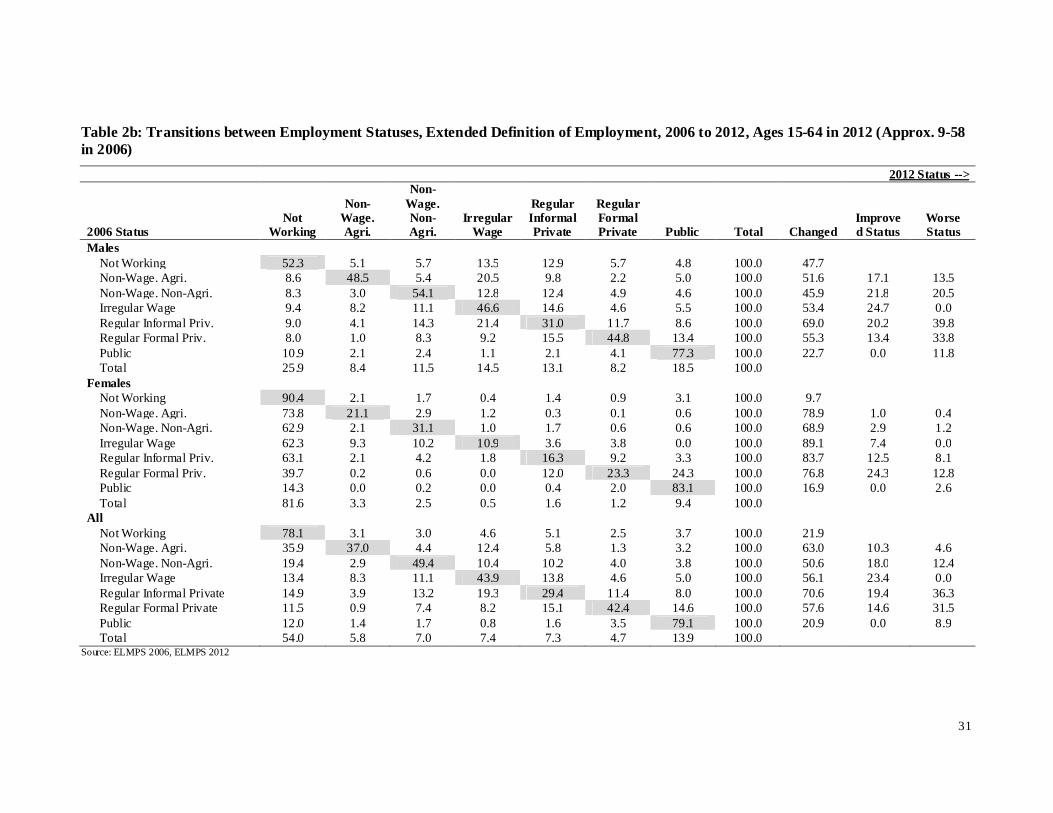
Examining transitions from 2006 to 2012, notably, despite the fact that this is just six years compared to the eight years covered by the 1998 to 2006 transitions, job stability has decreased; individuals are less likely to remain in the same type of work in 2012 that they held in 2006. While from 1998 to 2006, 66.0 percent of those working in non-wage agricultural work remained in agricultural work, just 37.0 percent of those in non-wage agricultural work in 2006 remained so in 2012. While this is partially driven by high rates of exit among females, males also had higher rates of transition. Among both genders, after transitions to not-working, the next most frequent transition for non-wage agricultural workers was into irregular wage work (12.4 percent). Non-wage non-agricultural work was also less stable and saw high rates of transitions to irregular wage work (10.4 percent) and regular informal private wage work (10.2 percent). Irregular wage workers actually had a higher chance of remaining in irregular wage work from 2006 to 2012 (43.9 percent) than from 1998 to 2006 (27.0 percent), indicating that a large number of workers is stuck in this kind of precarious employment. Additionally, more regular informal private wage workers from 2006 became irregular wage workers (19.4 percent) than transitioned to regular private wage work (11.4 percent) or public sector work (8.0 percent). A substantial share of regular
2 Panel weights are used in these calculations; see Assaad and Krafft (2013) for a discussion of the attrition processes and creation of the panel weights.
6
informal private wage workers also transitioned into non-wage non-agricultural work (13.2 percent). While public sector work remained very stable in 2006 to 2012 (79.1 percent of public sector workers remained so over the period), regular formal private work became less stable, with only 42.4 percent of regular formal private workers in 2006 remaining so in 2012. While 14.6 percent of these workers moved into the public sector, 15.1 percent became regular informal private wage workers and 8.2 percent became irregular wage workers, while 7.4 percent became non-wage non-agricultural workers. Overall, work status was more likely to change, and to deteriorate comparing changes from 2006 to 2012 to those from 1998 to 2006. Again, while males tended to follow the overall trends, females had somewhat different patterns of transition. Women in the public sector consistently retained their jobs (83.1 percent). However, less than a third of women in all other sectors of work in 2006 remained in that type of work in 2012. While women in regular formal private wage work often (24.3 percent) successfully transitioned to the public sector, few women in regular informal private work (3.3 percent) did so, although 9.2 percent did move to the regular formal private sector. Overall, women tended to withdraw from work, and only a small share successfully attained more stable or more formal jobs.
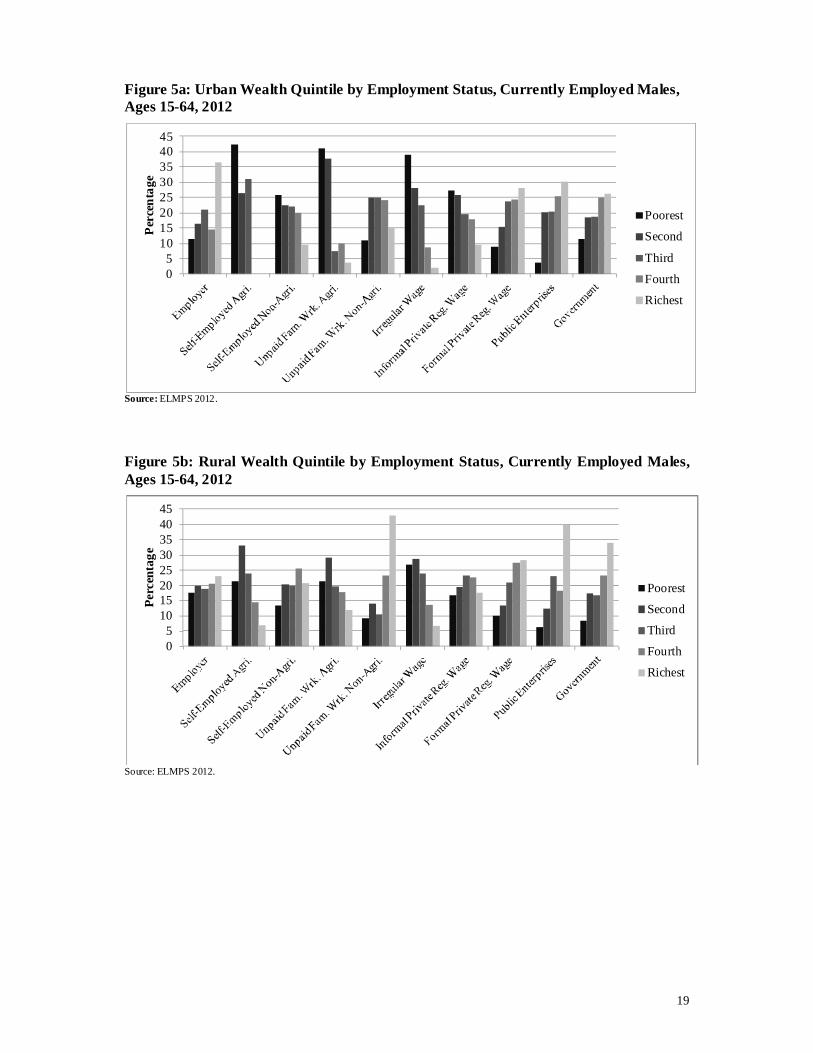
5. Vulnerable Employment and Wealth As well as being an extremely vulnerable form of employment, irregular wage work is associated with lower wealth accumulation and other forms of vulnerability (Figures 5a, 5b, 5c, 5d). Historically non-farm income has been the most important income source for the poor in Egypt (Adams 2002). The poor tend to work for a wage in agriculture (Kheir-El-Din and El-Laithy 2008). Figure 5a shows the household wealth quintile, based on an asset index, for currently employed urban males by employment status. There are very few urban males working in agriculture; outside of agriculture, irregular wage workers are the most likely to be in the poorest quintile, with a probability of 39.5 percent. While regular formal private wage workers, and those working in public enterprises and government are disproportionately likely to be in the richer quintiles, those in irregular wage work are substantially over-represented in the poorest quintiles, as are regular informal private wage workers, although to a lesser extent. Those self-employed outside of agriculture are also more likely to be poor, while employers and unpaid family workers outside of agriculture are a mix of wealth levels.
A similar pattern occurs for currently employed rural males (Figure 5b), where regular formal private, government, and public enterprise workers are disproportionately richer. In rural areas, regular informal private wage work is concentrated in the middle wealth quintiles, and employers, the self-employed, and agricultural family workers are a mix of wealth levels, with those in agricultural work over-represented in the second-poorest wealth quintile in rural areas. In rural areas, again, irregular wage workers are substantially over-represented among the poorest families.
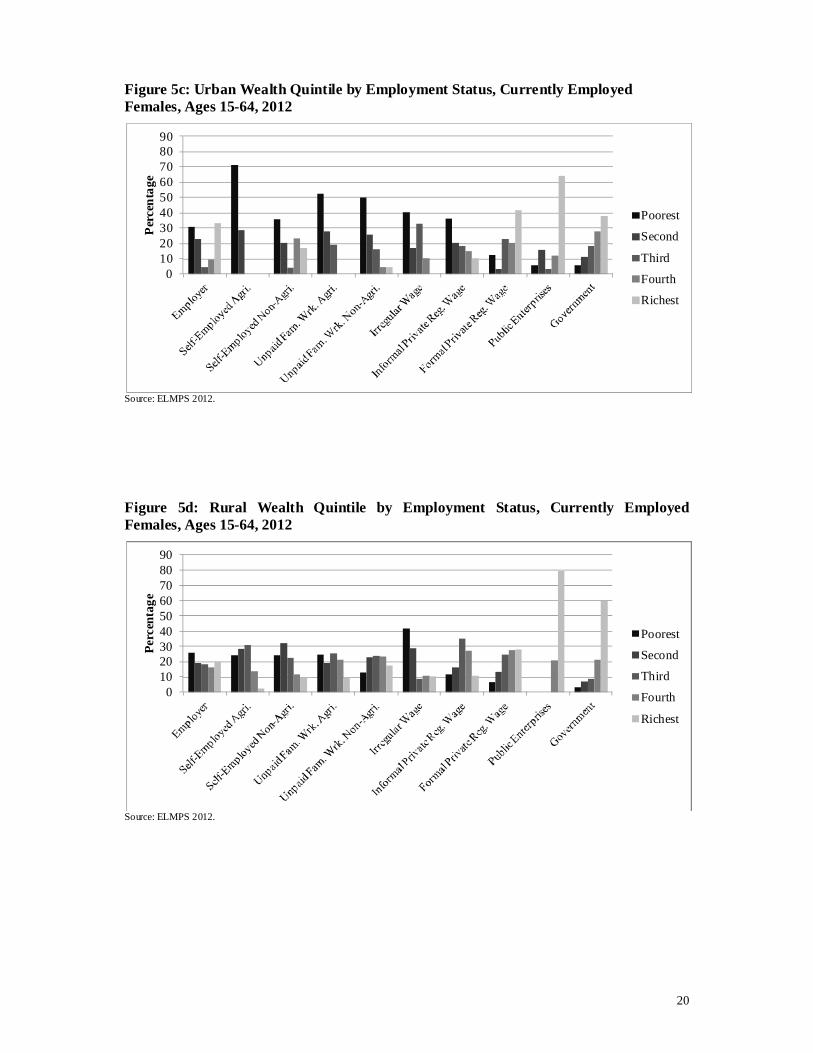
The patterns of employment status and wealth for urban women also show a strong association between employment vulnerability and wealth (Figure 5c). While women in regular private wage work, public enterprise work, and government work are very disproportionately from the wealthiest households, women from all other employment types are disproportionately from the poorest households. While formal employment is the privilege of rich women, all other forms of employment are undertaken by the poorest women, likely out of necessity.
In rural areas, employed women in government and public enterprise jobs are very likely to be from the wealthiest rural households (Figure 5d), with 59.7 percent of rural female government employees from the wealthiest quintile of rural households. Regular formal private wage work is also disproportionately richer, but not to the same extent as public
7
sector work. Rural women engaged in regular informal private wage work tend to be from the middle of the wealth distribution, as are women in unpaid family work outside of agriculture. All other rural women engaged in work tend to be disproportionately poorer, although the differences are less dramatic in rural areas than in urban areas.
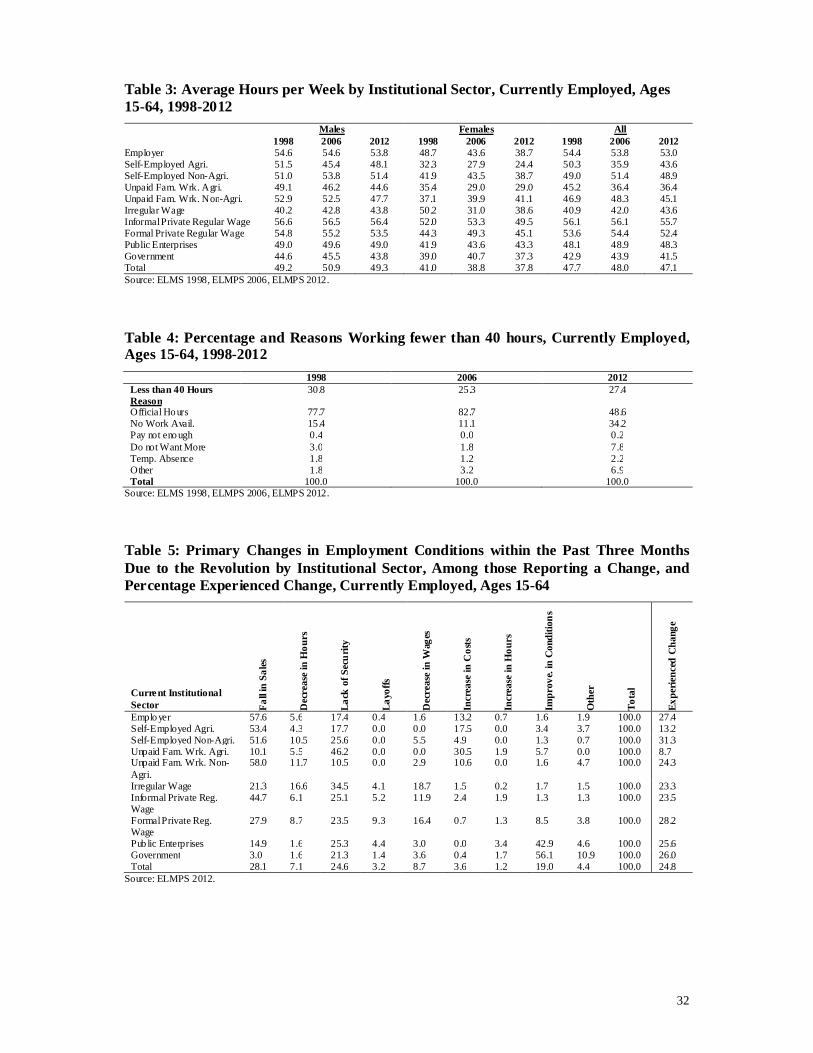
6. Hours of Employment Hours of employment vary substantially by gender and institutional sector (Table 3). Average hours of employment for all workers have been relatively stable over time, at 47.7 hours per week in 1998, 48.0 hours per week in 2006, and 47.1 hours per week in 2012. Employers have had consistently higher average hours per week, at around 53-54 hours. Self-employment in agriculture has experienced substantial fluctuations in hours, from 50.3 hours per week in 1998 to 35.9 hours per week in 2006 and 43.6 hours per week in 2012. The detection of additional marginally employed individuals, especially females in 2006 pulled the average down substantially. Hours for those self-employed outside of agriculture have been relatively stable around 48-51 hours per week; the patterns for unpaid family work are similar to those for the self-employed, although unpaid family workers tend to spend slightly fewer hours per week working. Irregular wage workers in 1998 had the fewest hours per week, 40.9, as a consequence of their irregular employment. Although hours have increased slightly, up to 43.6 hours in 2012, they remain low compared to regular private wage work. Hours per week in informal private regular wage work have remained consistently high at 56 hours per week, and formal private wage work is only slightly lower, between 52-54 hours per week. Workers in public enterprises work 48-49 hours per week. Hours of work in government have declined slightly over time, from 42.8 in 1998 to 41.5 hours per week in 2012. Comparing hours of work in wage work, irregular workers suffer from inadequate hours, while private regular wage workers work a high number of hours and government employees work much fewer hours than other wage workers
There has been a substantial shift in the reasons individuals are working fewer than 40 hours in 2012 (Table 4). While the percentage of the currently employed working fewer than 40 hours has increased only slightly in 2012, the percentage reporting that the reason for working less than 40 hours was no work available has jumped from 11.1 percent in 2006 to 34.2 percent in 2012. This pattern drives the increase in underemployment in 2012.
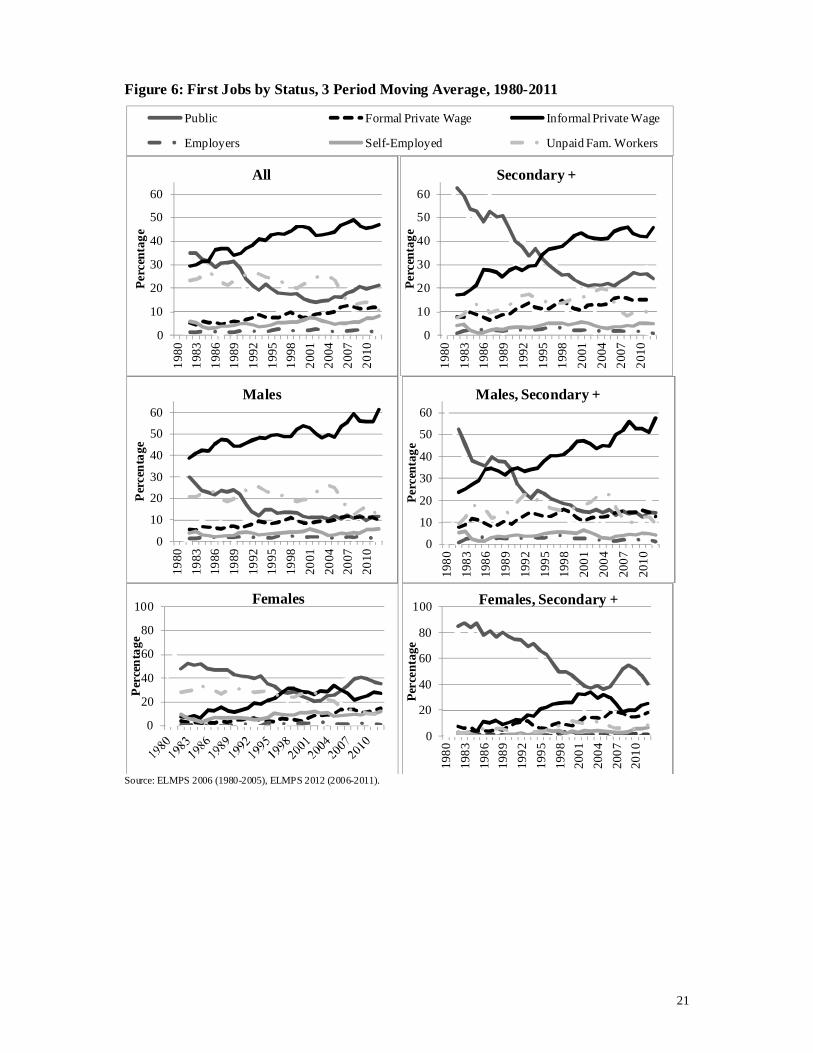
7. The Evolution of the Structure of Employment for New Entrants over Time Unemployment is primarily a labor market insertion problem in Egypt, and the type of first job an individual obtains is closely related to their long-term employment prospects. While highly educated males can successfully transition from informal to formal work, this is not the case for uneducated and female workers (Wahba 2009). There have been substantial changes in individuals’ first jobs over time in Egypt (Figure 6). It is not possible to identify job stability in the retrospective data, because individuals have difficulty recalling their hours of work at a particular point in time, and hours of work often change over the course of a job. Therefore, the figures on first jobs consider irregular jobs to be informal private wage jobs.
In the early 1980s, individuals were nearly equally likely to have a public first job as an informal private wage job (30-35 percent). Starting in the late 1980s, the share of individuals obtaining first jobs in the public sector fell before leveling out in the early 2000s. Over the 2006-2011 period, there has actually been a slight increase in the share of first jobs that are public sector jobs. Very few individuals are employers for their first job, or self-employed, although self-employment has risen slightly in recent years. The share of individuals obtaining a formal private wage position as their first job has doubled over the past several decades, from around 6 percent in the early 1980s to around 12 percent in 2011. The share of individuals with unpaid family worker as their first status was relatively stable through the
8
mid-2000s, but has since dropped from above 20 percent to around 12 percent. Almost half of first jobs in recent years were informal private wage positions. There are substantial differences in first jobs by gender. As Figure 6 shows, males in recent years have more than 60 percent chance of having an informal private wage position as their first job. Since 2005, males have had an equal chance of obtaining a formal private wage or public position as their first job, around a 10 percent chance of each. As Figure 6 demonstrates, after experiencing a decline in their chances of finding a public sector first job from 1980 through the early 2000s, starting in the early 2000s, a rising share of females’ first jobs were in the public sector. However, females are increasingly selecting out of the workforce, so the changing shares of first jobs in the public sector are, at least in part, due to this trend. As public sector jobs declined, informal private sector jobs increased, and have since fallen with the return of public sector jobs, or selection out of the workforce for females who cannot obtain public sector jobs. While unpaid family work has declined substantially in recent years as a first job for females, formal private wage work and self-employment have increased. Education shapes the job opportunities available to young people, particularly in terms of providing access to public sector jobs (Figure 6). While more than 60 percent of secondary educated (and above) individuals obtained their first jobs in the public sector in the early 1980s, this fell to only 20 percent in the mid-2000s, and rose only slightly in the later half of the 2000s. The share of secondary educated individuals obtaining informal private wage jobs rose from less than 20 percent in the early 1980s to more than 40 percent in recent years. Formal private wage employment has risen slightly, but very few secondary educated individuals had first jobs as employers or self-employed, and less than 20 percent worked first as unpaid family workers.
While more than 50 percent of secondary and higher educated males obtained their first jobs in the public sector in the early 1980s, this has dropped to around 15 percent in recent years, and converged with the (increasing) share of secondary educated males obtaining their first job in the formal private sector (Figure 6). However the predominant trend, even for secondary educated males, has been an increase in the share obtaining first jobs in informal private wage positions, now at more than 50 percent. In the early 1980s, more than 80 percent of secondary and higher educated females obtained their first job in the public sector (Figure 6). This fell to below 40 percent in the early 2000s, although it has risen and fluctuated in recent years. As public sector work fell as a share of first jobs for secondary educated females, formal and especially informal private wage work rose. Very few secondary educated females have first jobs as employers, self-employed, or unpaid family workers.
8. Changes in the Structure Employment by Industry The composition of the Egyptian economy, in terms of industry group or economic activity, has been fairly stable over time (Figure 7a). Primarily due to detecting additional marginal agricultural workers in 2006, agriculture appears to have risen and then fallen as a share of the economy. We therefore primarily compare 1998 and 2012. Agriculture has remained as approximately a fifth of total employment in both 1998 and 2012. Manufacturing and mining has contracted slightly, from 16 percent in 1998 to 14 percent of total employment in 2012. Construction has increased over time, from 7 percent of total employment in 1998 to 11 percent in 2012. Wholesale and retail work has also increased slightly from 13 percent of total employment in 1998 to 15 percent in 2012. Transportation and storage has increased from 5 percent of total employment in 1998 to 7 percent in 2012. These increases, especially in construction, are shifts into more volatile economic activities. Public administration has contracted substantially, from 12 percent of total employment to 8 percent, and education has
9
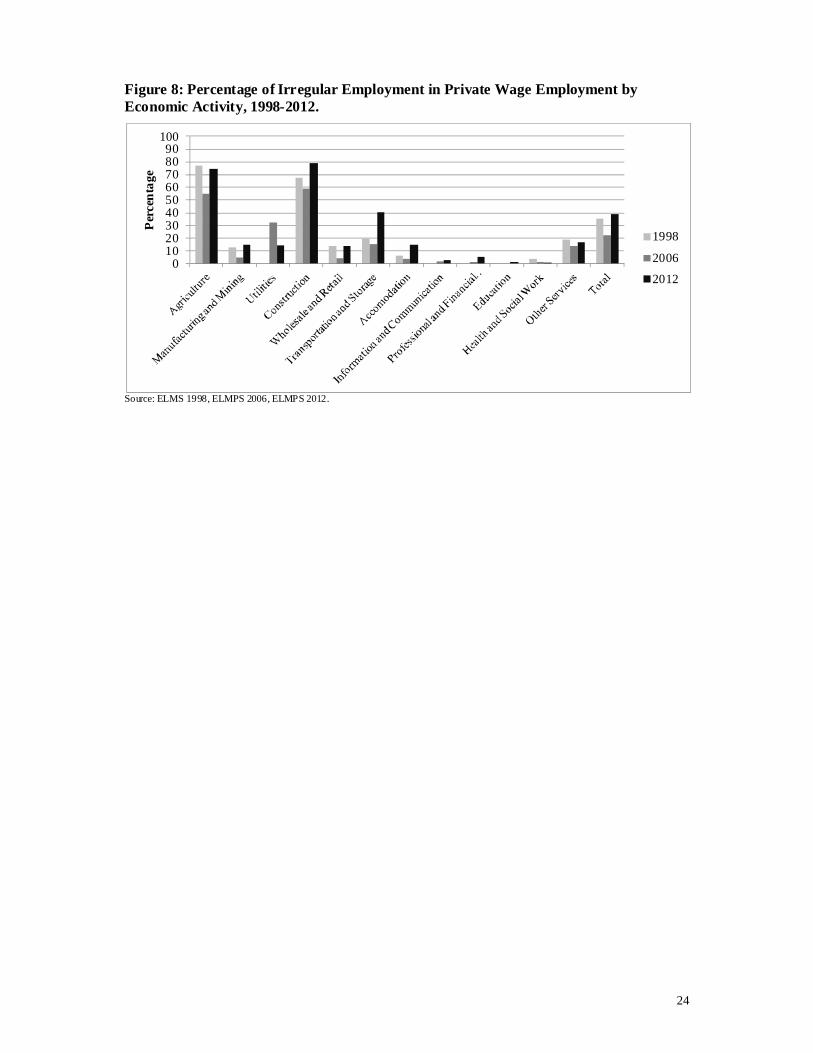
decreased slightly, from 12 percent to 11 percent of employment, a substantial decrease in the more stable forms of economic activity. There have been different changes in the distribution of economic activities by gender (Figures 7b & 7c). Gender segmentation has been a longstanding characteristic of the Egyptian labor market (Nassar 2003). In both 1998 and 2012 more than half of employed women worked in health and social work, education, or public administration. A smaller share of employed males is working in agriculture in 2012 than in 1998 (18 percent vs. 22 percent). Substantially more males are in construction in 2012 (14 percent) than in 1998 (9 percent). A greater share of employed females are in education and health and social work activities in 2012 as compared to 1998, with 39 percent of employed women in these categories in 2012 and 12 percent in public administration. A smaller share of employed women work in wholesale and retail in 2012 (13 percent) than in 1998 (16 percent). A higher share of employed women are working in agriculture in 2012 (20 percent) than were working in agriculture in 1998 (13 percent). However, it must be kept in mind that fewer women are working overall. Different sectors of economic activity have demonstrated very different growth rates comparing 1998-2006 and 2006-2012 (Figure 7d). Overall, employment grew 4.4 percent per year over 1998-2006 and just 0.8 percent per year over 2006-2012. After growing rapidly over 1998-2006, accommodation and wholesale and retail grew much more slowly over 2006-2012. Manufacturing and mining exhibited lackluster growth over the entire 1998-2012 period. Utilities and construction had higher growth, particularly in 2012. Professional and financial services, education, and other services all grew moderately over the 2006-2012 period, while public administration remained essentially stagnant over both periods. Agriculture grew substantially over 1998-2006 and then contracted substantially from 2006-2012, although this may have been driven by detection issues. Vulnerable workers, those engaged in irregular employment, are concentrated in a few sectors. Figure 8 presents the percentage of irregular employment in private wage employment by sector of economic activity. In 2012, more than 70 percent of wage employment in agriculture was irregular, and this had increased from 2006, although remaining below the 1998 share. Although the share remained low, there was an uptick in irregular employment in manufacturing in 2012, along with in wholesale and retail, transportation and storage, accommodation, and other services. Construction in particular had a higher share of irregular employment in 2012, almost 80 percent, higher than any previous year. Overall, after the share of irregular employment in private wage employment declined from 35.6 percent in 1998 to 22.6 percent in 2006, irregular employment rose again to 39.1 percent of private wage employment in 2012. Almost two-fifths of private wage employees are irregular, a status associated with vulnerability and poverty.
9. The Evolution of Private Wage Employment 9.1 The Evolution of the Distribution of Employment by Establishment Size We know that non-wage workers, those working in family businesses and in agriculture, tend to work in very small firms. However, there has been a substantial shift away from non-wage work and into wage work in 2012, as well as a variety of economic crises. Have these affected the structure of wage work, in terms of firm size? As Figure 9a shows, despite substantial macroeconomic changes, there has been very little change in the composition of private wage employment by firm size over 1998-2012. Employment continues to be dominated by firms with 1-4 employees, and this has only decreased slightly, from 47 percent of employment in 1998 to 45 percent of employment in 2012. Firms with 5-9 employees have also contracted slightly, from 19 percent of employment in 1998 to 17 percent in 2012. Firms with 10-24 employees grew slightly in their share from 1998 to 2006 but then shrank slightly
10
from 2006 to 2012 and firms with 30-49 employees have followed a similar pattern. Just 4 percent of employment is in firms with 50-99 employees, and this has remained constant over time. The structure of employment in terms of firm size exhibits a pattern common to developing countries, the “missing middle,” with a large share of employment in micro enterprises and some in large firms, but relatively little employment in small and medium enterprises. Comparing 1998 and 2012, the same share (18 percent) of employment was in firms with 10-99 employees. There has been some growth in larger firms. While in 1998 17 percent of employment was in firms of more than 100 or Don’t Know/Missing category, and 18 percent in 2006, this had risen to 20 percent in 2012. Because of a change in how the question was asked in 2012, allowing for a response of ‘don’t know, very large,’ which we combined with more than 100, it is difficult to identify growth with certainty, but overall the evidence suggests some growth in large firms.
Overall, growth in private wage employment has been relatively stable, at around 5 percent per year, over both 1998-2006 and 2006-2012 (Figure 9b). Growth in small firms was higher in 2006-2012 than in 1998-2006, while growth in mid-size firms with 10-99 employees was higher in 1998-2006 than 2006-2012.
As well as being predominated by small firms, private sector wage work is predominantly informal in Egypt. Firm size is closely connected to the conditions of employment, with smaller firms being more likely to have irregular and informal employees (Figures 10a, 10b, 10c). Figure 10a presents the share of irregular employment in private wage employment by firm size. Overall, irregular employment in private wage employment fell from 36 percent in 1998 to 22 percent in 2006 before rising to 39 percent in 2012. The changes were particularly large for firms with 1-4 employees, where the share of irregular workers more than doubled from 24 percent in 2006 to 50 percent in 2012. There were also steep increases in the 5-9 and 10-24 employee firm sizes, and an uptick in the 30-49 employee firm size as well. Additionally, more medium sized firms, with 50-99 employees use irregular employees; while only 3 percent of employment in this firm size was irregular in 1998, in 2012 12 percent of employment in firms with 50-99 employees was irregular. The deterioration of employment conditions and rise of irregular employment is a problem regardless of firm size. While informal employment as a share of private regular wage work stayed flat or rose slightly in smaller firms, it decreased overall.
Informal employment (which encompasses irregular employment as well) has increased slightly as a share of private wage employment (Figure 10b). After falling from 75 percent of private wage employment in 1998 to 71 percent in 2006, as of 2012 73 percent of private wage employment was informal, with workers having neither social security nor a contract. There were increases in the share of informality in all firm sizes in 2012 as compared to 2006, except for Missing/Don’t Know. Mid-size firms saw particularly large increases in informal employment. A new labor law was adopted in April 2003 and implemented in early 2004. The law made it easier for employers to lay off workers, and allowed for fixed-term employment contracts. It was hoped that this would create incentives for employers to hire workers formally (Assaad 2009). However, given the rise in informal and irregular employment, this has clearly not been the case. Restricting private wage employment to only regular private wage employment, fewer regular employees (58 percent) were informal in 2012 as compared to 2006 (64 percent informal) or 1998 (63 percent informal), which may be in part due to the new labor law, but may also be due to many informal workers becoming irregular.
9.2 The Incidence of Non-Wage Benefits in the Private Sector The vast majority of workers in private wage employment lack benefits such as medical insurance, sick leave, and paid leave. The chances of a worker having such benefits vary
11
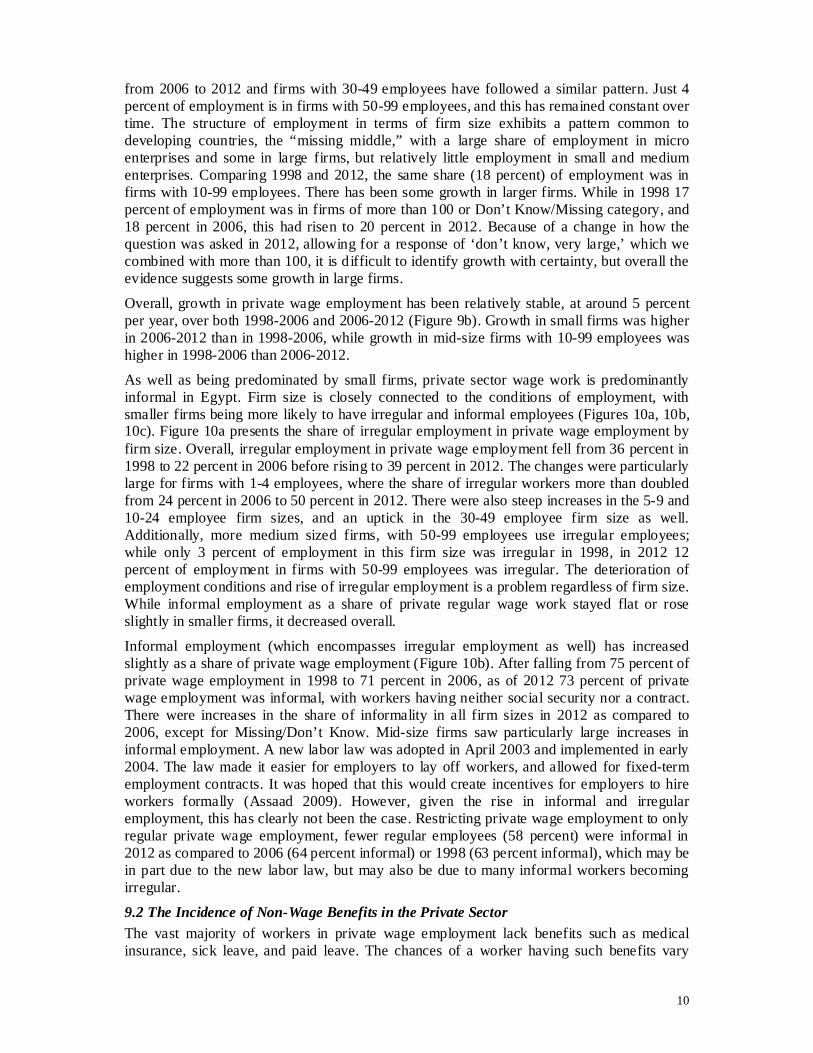
substantially by firm size. As Figure 11 shows, only 17 percent of private wage workers have medical insurance, although this is a substantial increase from 2006, when only 11 percent had insurance. Workers in 1-9 person firms have less than a 5 percent chance of having medical insurance. The chance of having insurance in a 10-24 person firm has actually decreased over time. Insurance rates are highest at firms with more than 100 employees; in 2012, 65 percent of employees in firms with more than 100 employees had medical insurance. Formal private wage workers have higher chances of being medically insured. In 1998, 51 percent of formal private wage workers had medical insurance. In 2006 this had fallen to 40 percent. By 2012, 63 percent of formal private wage workers had medical insurance. While in 2012 there were increases in the chances of a formal private wage worker having medical insurance in all firm size categories, there were particularly large increases in the 1-4 (26 percent medically insured in 2012) and 5-9 worker (38 percent medically insured in 2012) categories.
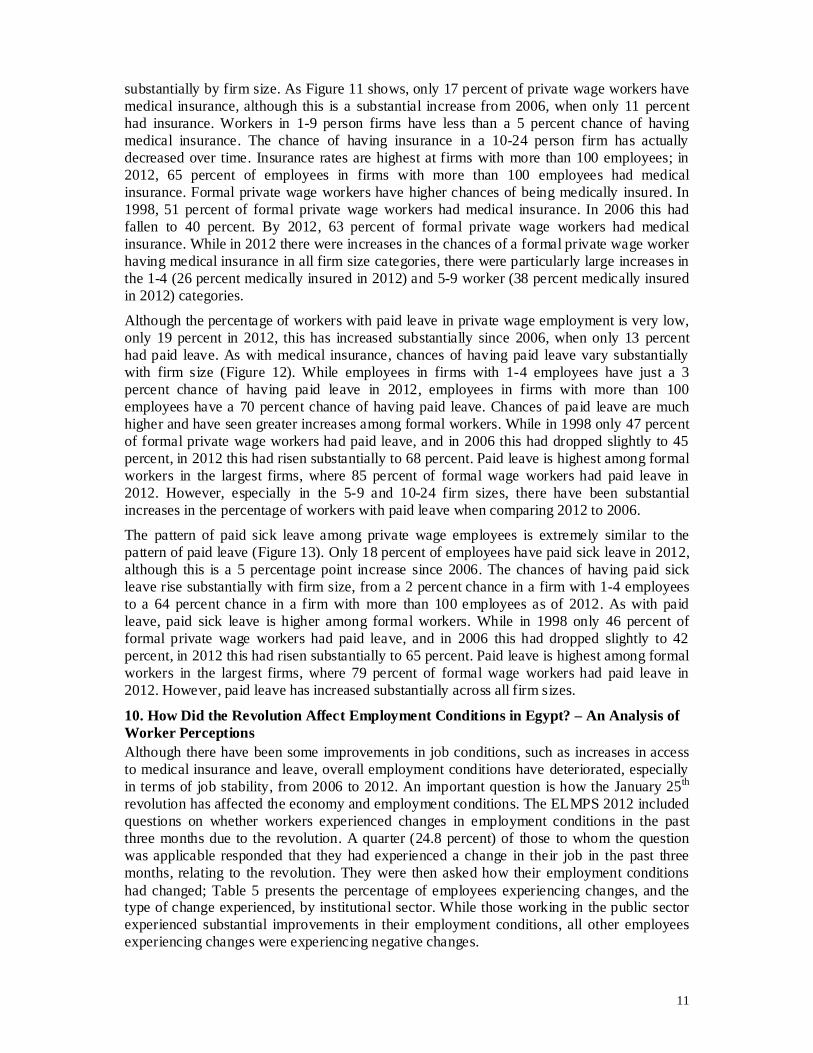
Although the percentage of workers with paid leave in private wage employment is very low, only 19 percent in 2012, this has increased substantially since 2006, when only 13 percent had paid leave. As with medical insurance, chances of having paid leave vary substantially with firm size (Figure 12). While employees in firms with 1-4 employees have just a 3 percent chance of having paid leave in 2012, employees in firms with more than 100 employees have a 70 percent chance of having paid leave. Chances of paid leave are much higher and have seen greater increases among formal workers. While in 1998 only 47 percent of formal private wage workers had paid leave, and in 2006 this had dropped slightly to 45 percent, in 2012 this had risen substantially to 68 percent. Paid leave is highest among formal workers in the largest firms, where 85 percent of formal wage workers had paid leave in 2012. However, especially in the 5-9 and 10-24 firm sizes, there have been substantial increases in the percentage of workers with paid leave when comparing 2012 to 2006.
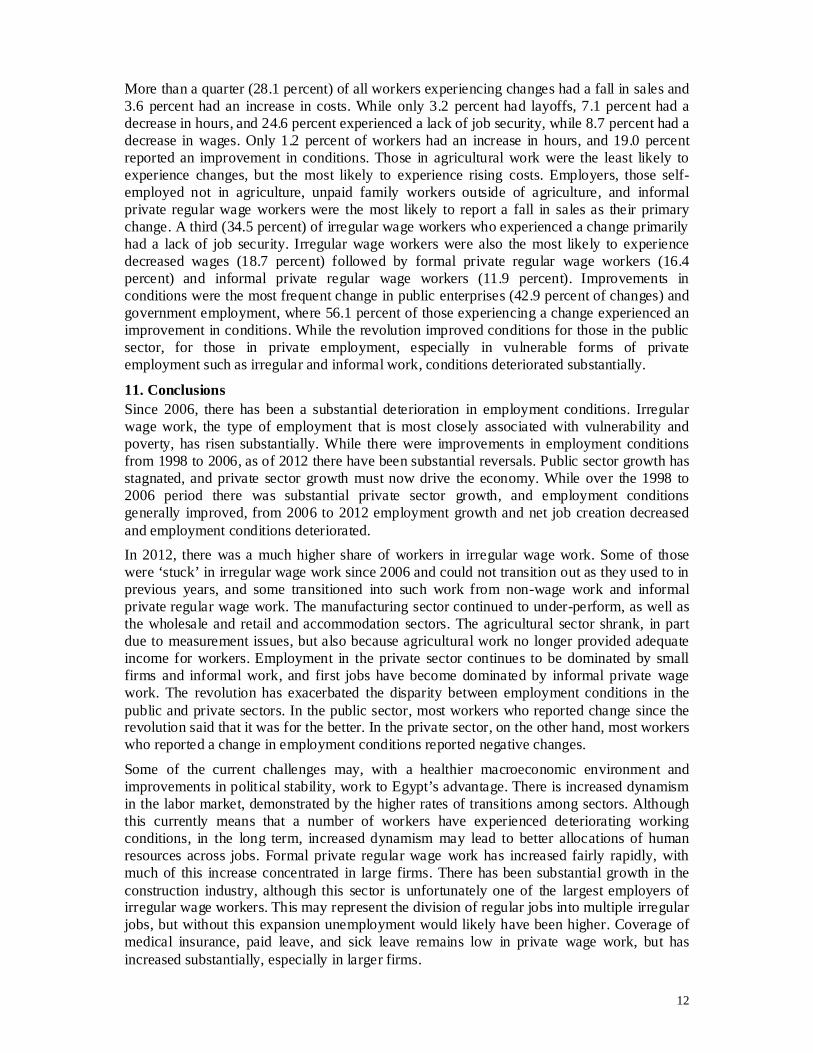
The pattern of paid sick leave among private wage employees is extremely similar to the pattern of paid leave (Figure 13). Only 18 percent of employees have paid sick leave in 2012, although this is a 5 percentage point increase since 2006. The chances of having paid sick leave rise substantially with firm size, from a 2 percent chance in a firm with 1-4 employees to a 64 percent chance in a firm with more than 100 employees as of 2012. As with paid leave, paid sick leave is higher among formal workers. While in 1998 only 46 percent of formal private wage workers had paid leave, and in 2006 this had dropped slightly to 42 percent, in 2012 this had risen substantially to 65 percent. Paid leave is highest among formal workers in the largest firms, where 79 percent of formal wage workers had paid leave in 2012. However, paid leave has increased substantially across all firm sizes.
10. How Did the Revolution Affect Employment Conditions in Egypt? – An Analysis of Worker Perceptions Although there have been some improvements in job conditions, such as increases in access to medical insurance and leave, overall employment conditions have deteriorated, especially in terms of job stability, from 2006 to 2012. An important question is how the January 25th revolution has affected the economy and employment conditions. The ELMPS 2012 included questions on whether workers experienced changes in employment conditions in the past three months due to the revolution. A quarter (24.8 percent) of those to whom the question was applicable responded that they had experienced a change in their job in the past three months, relating to the revolution. They were then asked how their employment conditions had changed; Table 5 presents the percentage of employees experiencing changes, and the type of change experienced, by institutional sector. While those working in the public sector experienced substantial improvements in their employment conditions, all other employees experiencing changes were experiencing negative changes.
12
More than a quarter (28.1 percent) of all workers experiencing changes had a fall in sales and 3.6 percent had an increase in costs. While only 3.2 percent had layoffs, 7.1 percent had a decrease in hours, and 24.6 percent experienced a lack of job security, while 8.7 percent had a decrease in wages. Only 1.2 percent of workers had an increase in hours, and 19.0 percent reported an improvement in conditions. Those in agricultural work were the least likely to experience changes, but the most likely to experience rising costs. Employers, those self-employed not in agriculture, unpaid family workers outside of agriculture, and informal private regular wage workers were the most likely to report a fall in sales as their primary change. A third (34.5 percent) of irregular wage workers who experienced a change primarily had a lack of job security. Irregular wage workers were also the most likely to experience decreased wages (18.7 percent) followed by formal private regular wage workers (16.4 percent) and informal private regular wage workers (11.9 percent). Improvements in conditions were the most frequent change in public enterprises (42.9 percent of changes) and government employment, where 56.1 percent of those experiencing a change experienced an improvement in conditions. While the revolution improved conditions for those in the public sector, for those in private employment, especially in vulnerable forms of private employment such as irregular and informal work, conditions deteriorated substantially.
11. Conclusions Since 2006, there has been a substantial deterioration in employment conditions. Irregular wage work, the type of employment that is most closely associated with vulnerability and poverty, has risen substantially. While there were improvements in employment conditions from 1998 to 2006, as of 2012 there have been substantial reversals. Public sector growth has stagnated, and private sector growth must now drive the economy. While over the 1998 to 2006 period there was substantial private sector growth, and employment conditions generally improved, from 2006 to 2012 employment growth and net job creation decreased and employment conditions deteriorated. In 2012, there was a much higher share of workers in irregular wage work. Some of those were ‘stuck’ in irregular wage work since 2006 and could not transition out as they used to in previous years, and some transitioned into such work from non-wage work and informal private regular wage work. The manufacturing sector continued to under-perform, as well as the wholesale and retail and accommodation sectors. The agricultural sector shrank, in part due to measurement issues, but also because agricultural work no longer provided adequate income for workers. Employment in the private sector continues to be dominated by small firms and informal work, and first jobs have become dominated by informal private wage work. The revolution has exacerbated the disparity between employment conditions in the public and private sectors. In the public sector, most workers who reported change since the revolution said that it was for the better. In the private sector, on the other hand, most workers who reported a change in employment conditions reported negative changes.
Some of the current challenges may, with a healthier macroeconomic environment and improvements in political stability, work to Egypt’s advantage. There is increased dynamism in the labor market, demonstrated by the higher rates of transitions among sectors. Although this currently means that a number of workers have experienced deteriorating working conditions, in the long term, increased dynamism may lead to better allocations of human resources across jobs. Formal private regular wage work has increased fairly rapidly, with much of this increase concentrated in large firms. There has been substantial growth in the construction industry, although this sector is unfortunately one of the largest employers of irregular wage workers. This may represent the division of regular jobs into multiple irregular jobs, but without this expansion unemployment would likely have been higher. Coverage of medical insurance, paid leave, and sick leave remains low in private wage work, but has increased substantially, especially in larger firms.
13
There is no question that conditions in the Egyptian labor market have deteriorated markedly as a result of the economic crisis that accompanied the revolution. However, we argued here that to assess this deterioration, the analysis must move well beyond the unemployment rate, which in Egypt tends to capture structural unemployment among educated youth rather than cyclical changes in employment conditions. These cyclical changes are better captured by measures such as visible underemployment or the share of irregular employment. We have demonstrated here that these measures have increased substantially as many workers now face much more precarious employment conditions. Furthermore, using such measures focuses attention on some of the most vulnerable and poorest workers in the economy rather than an exclusive focus on the plight of the relatively more privileged educated workers who suffer from high open unemployment rates. We also showed that the typically very vocal public sector workers who have gotten a lot of policy attention since the revolution are far from being the most vulnerable. They are disproportionately from the richest wealth quintiles, they have a much more stable employment situation than their private sector counterparts, better working conditions as measured by social protection and benefits, and, by their own admission, experienced far fewer of the adverse consequences of the economic crisis.
14
References Adams, R. 2002. Nonfarm income, inequality, and land in rural Egypt. Economic
Development and Cultural Change 50(2): 339–63.
Assaad, R. 2009. Labor supply, employment, and unemployment in the Egyptian economy, 1988-2006. In The Egyptian labor market revisited, ed. R. Assaad , 1–52. Cairo: The American University in Cairo Press.
Assaad, R., and C. Krafft. 2013. The Egypt Labor Market Panel Survey: Introducing the 2012 round. IZA Journal of Labor and Development 2(8): 1–30.
ELMPS. 2006. Egypt Labor Market Panel Survey of 2006. Publicly Accessible Database, Economic Research Forum, Cairo, Egypt (www.erfdataportal.com).
ELMPS. 2012. Egypt Labor Market Panel Survey of 2012. Publicly Accessible Database, Economic Research Forum, Cairo, Egypt (www.erfdataportal.com).
ELMS. 1998. Egypt Labor Market Survey of 1998. Publicly Accessible Database, Economic Research Forum, Cairo, Egypt (www.erfdataportal.com).
Kheir-El-Din, H., and H. El-Laithy. 2008. An assessment of growth, distribution, and poverty in Egypt. In The Egyptian economy: Current challenges and future prospects, ed. H. Kheir-El-Din, 13–52. Cairo: The American University in Cairo Press.
Nassar, H. 2003. Egypt: Structural adjustment and women’s employment. In Women and globalization in the Arab Middle East: gender, economy, and society, ed. E. A. Doumato & M. P. Posusney, 95–118. Lynne Rienner Publishers.
Peeters, M. 2011. Modelling unemployment in the presence of excess labour supply-An application to Egypt. Journal of Economics and Econometrics 54(2): 58–92.
Wahba, J. 2009. Informality in Egypt: A stepping stone or a dead end? Economic Research Forum Working Paper Series no. 456).
World Bank. 2013. World Development Indicators. World Bank Databank. Retrieved May 16, 2013, from http://databank.worldbank.org/data/home.aspx
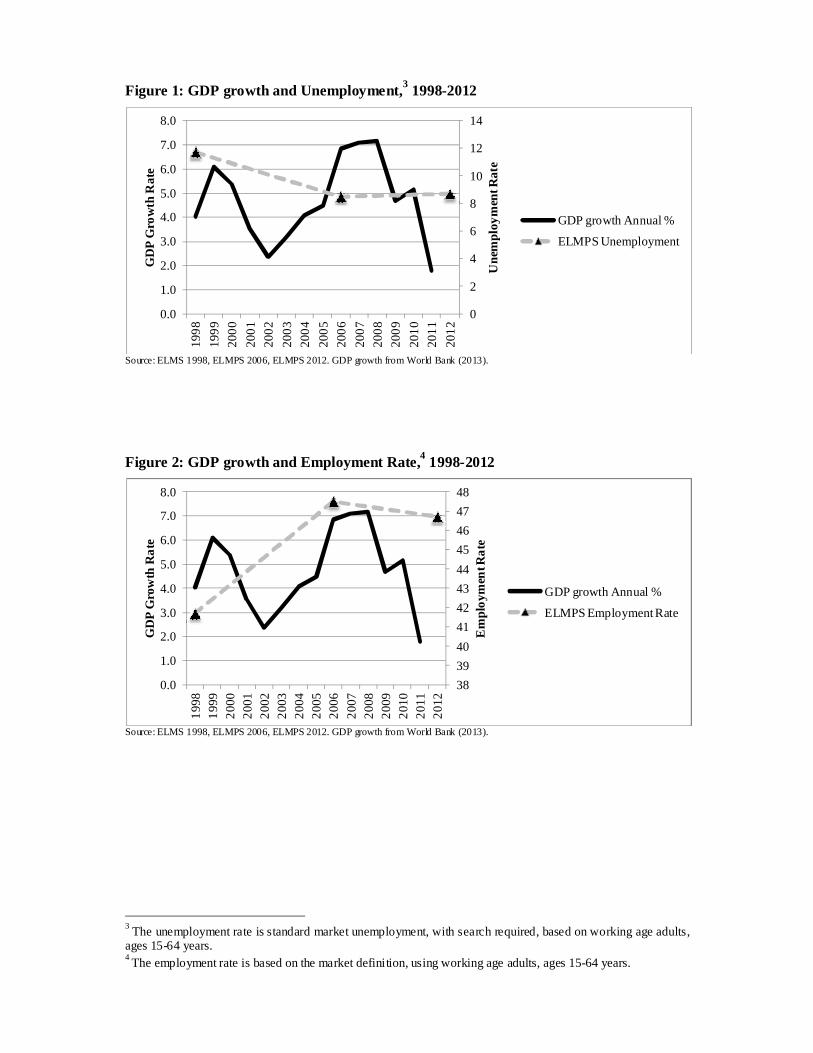
Figure 1: GDP growth and Unemployment,3 1998-2012
Source: ELMS 1998, ELMPS 2006, ELMPS 2012. GDP growth from World Bank (2013).
Figure 2: GDP growth and Employment Rate,4 1998-2012
Source: ELMS 1998, ELMPS 2006, ELMPS 2012. GDP growth from World Bank (2013).
3 The unemployment rate is standard market unemployment, with search required, based on working age adults, ages 15-64 years. 4 The employment rate is based on the market definition, using working age adults, ages 15-64 years.
0
2
4
6
8
10
12
14
0.0
1.0
2.0
3.0
4.0
5.0
6.0
7.0
8.0
1998
1999
2000
2001
2002
2003
2004
2005
2006
2007
2008
2009
2010
2011
2012
Une
mpl
oym
ent R
ate
GD
P G
row
th R
ate
GDP growth Annual %
ELMPS Unemployment
3839404142434445464748
0.0
1.0
2.0
3.0
4.0
5.0
6.0
7.0
8.0
1998
1999
2000
2001
2002
2003
2004
2005
2006
2007
2008
2009
2010
2011
2012
Em
ploy
men
t Rat
e
GD
P G
row
th R
ate
GDP growth Annual %
ELMPS Employment Rate
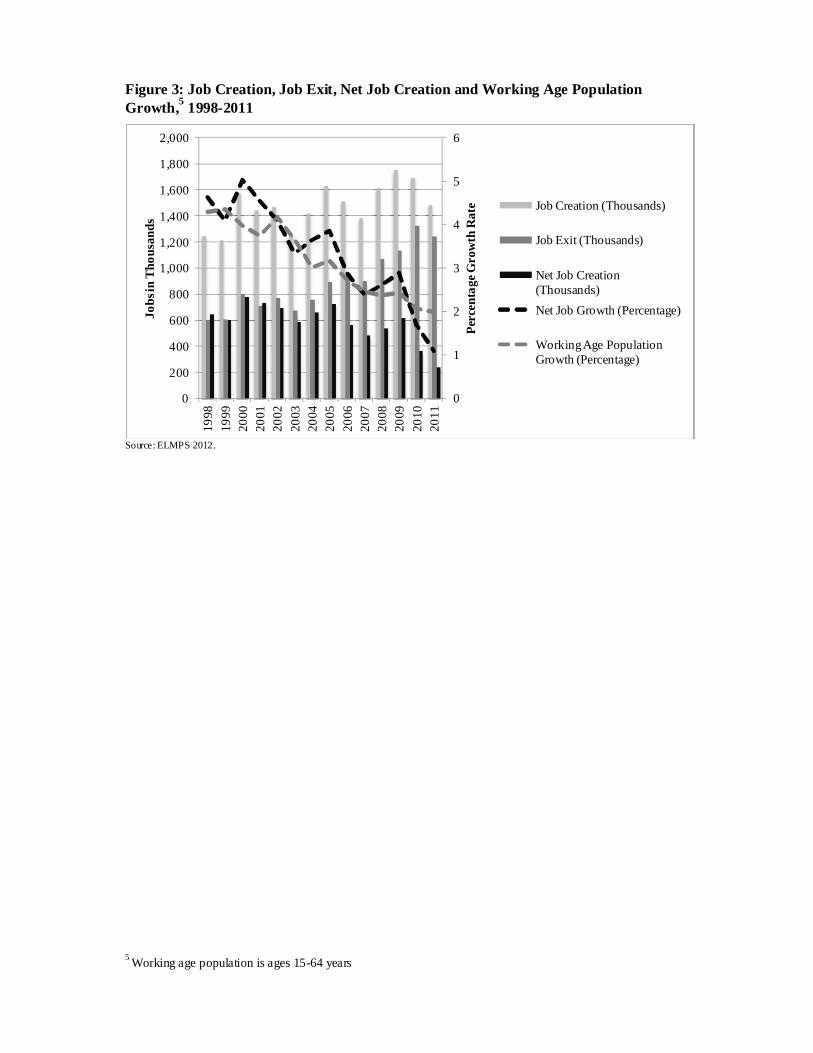
Figure 3: Job Creation, Job Exit, Net Job Creation and Working Age Population Growth,5 1998-2011
Source: ELMPS 2012.
5 Working age population is ages 15-64 years
0
1
2
3
4
5
6
0
200
400
600
800
1,000
1,200
1,400
1,600
1,800
2,000
1998
1999
2000
2001
2002
2003
2004
2005
2006
2007
2008
2009
2010
2011
Perc
enta
ge G
row
th R
ate
Jobs
in T
hous
ands
Job Creation (Thousands)
Job Exit (Thousands)
Net Job Creation (Thousands)Net Job Growth (Percentage)
Working Age Population Growth (Percentage)
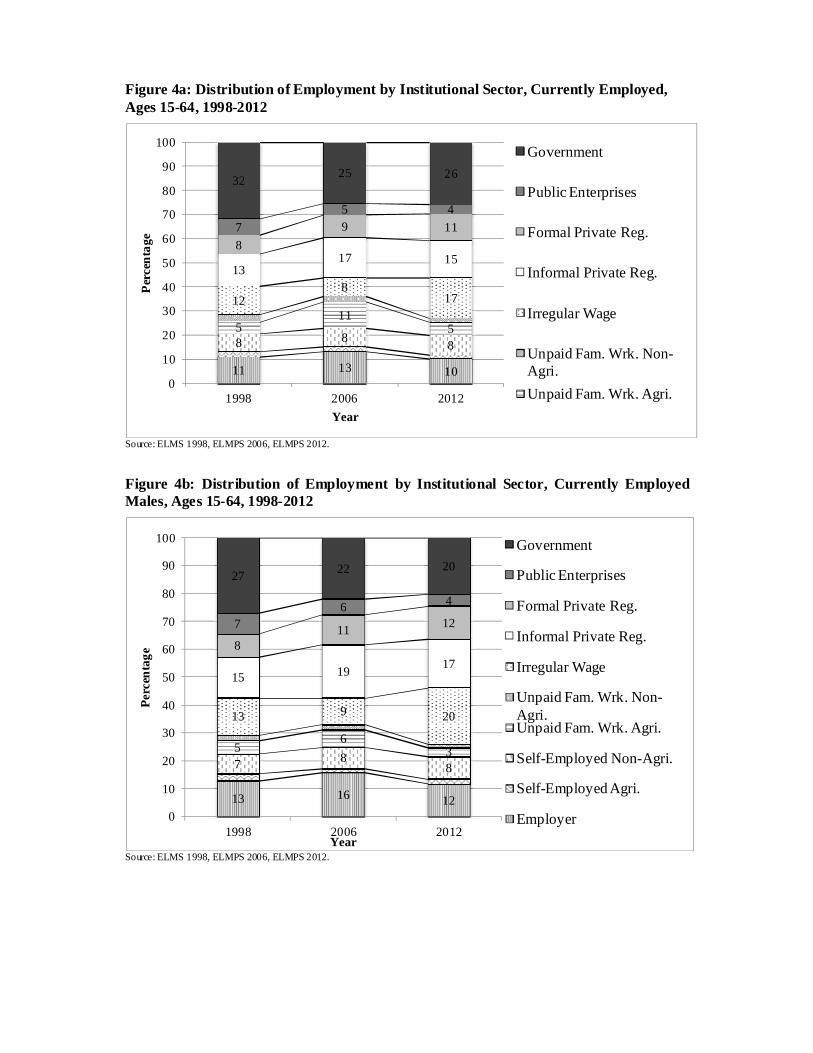
Figure 4a: Distribution of Employment by Institutional Sector, Currently Employed, Ages 15-64, 1998-2012
Source: ELMS 1998, ELMPS 2006, ELMPS 2012.
Figure 4b: Distribution of Employment by Institutional Sector, Currently Employed Males, Ages 15-64, 1998-2012
Source: ELMS 1998, ELMPS 2006, ELMPS 2012.
11 13 10
8 8 85
115
128
17
1317 15
89 1175 4
32 25 26
0
10
20
30
40
50
60
70
80
90
100
1998 2006 2012
Perc
enta
ge
Year
Government
Public Enterprises
Formal Private Reg.
Informal Private Reg.
Irregular Wage
Unpaid Fam. Wrk. Non-Agri.Unpaid Fam. Wrk. Agri.
13 16 12
7 88
56
3
13 9 20
15 19 178
11 1276 4
27 22 20
0
10
20
30
40
50
60
70
80
90
100
1998 2006 2012
Perc
enta
ge
Year
Government
Public Enterprises
Formal Private Reg.
Informal Private Reg.
Irregular Wage
Unpaid Fam. Wrk. Non-Agri.Unpaid Fam. Wrk. Agri.
Self-Employed Non-Agri.
Self-Employed Agri.
Employer
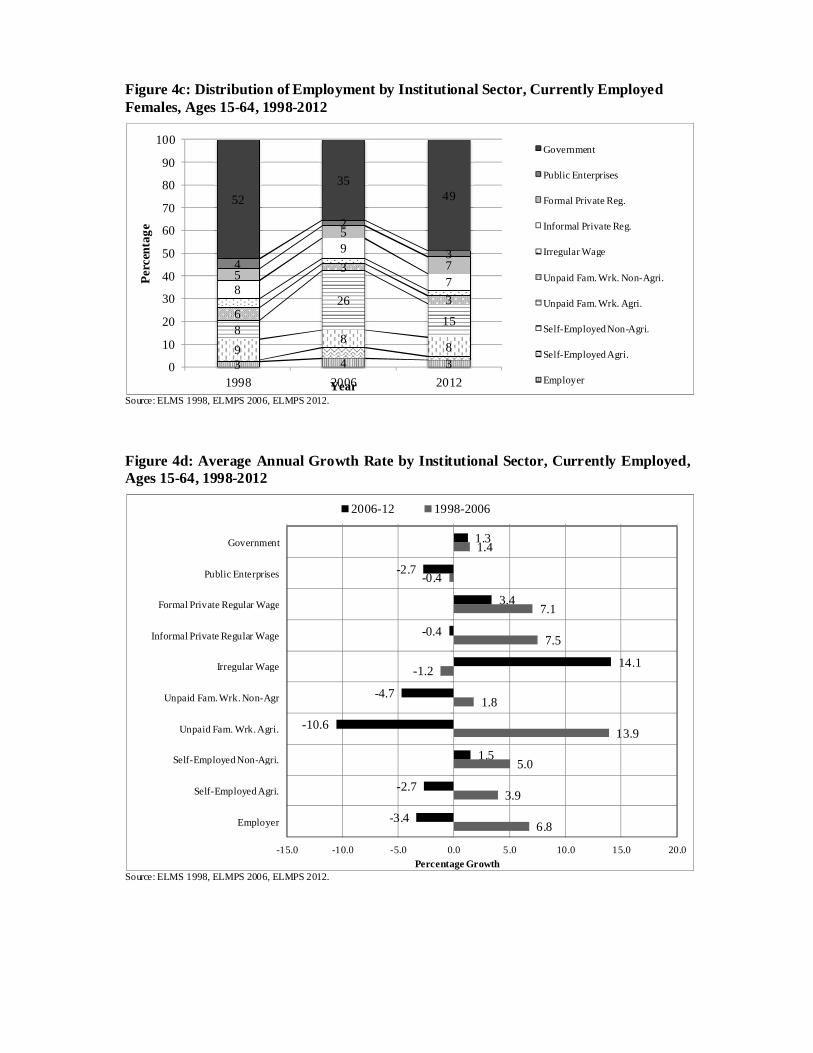
Figure 4c: Distribution of Employment by Institutional Sector, Currently Employed Females, Ages 15-64, 1998-2012
Source: ELMS 1998, ELMPS 2006, ELMPS 2012. Figure 4d: Average Annual Growth Rate by Institutional Sector, Currently Employed, Ages 15-64, 1998-2012
Source: ELMS 1998, ELMPS 2006, ELMPS 2012.
3 4 39
88
8
26156
3
38
9
75
5
74
2
3
5235
49
0
10
20
30
40
50
60
70
80
90
100
1998 2006 2012
Perc
enta
ge
Year
Government
Public Enterprises
Formal Private Reg.
Informal Private Reg.
Irregular Wage
Unpaid Fam. Wrk. Non-Agri.
Unpaid Fam. Wrk. Agri.
Self-Employed Non-Agri.
Self-Employed Agri.
Employer
6.8
3.9
5.0
13.9
1.8
-1.2
7.5
7.1
-0.4
1.4
-3.4
-2.7
1.5
-10.6
-4.7
14.1
-0.4
3.4
-2.7
1.3
Employer
Self-Employed Agri.
Self-Employed Non-Agri.
Unpaid Fam. Wrk. Agri.
Unpaid Fam. Wrk. Non-Agr
Irregular Wage
Informal Private Regular Wage
Formal Private Regular Wage
Public Enterprises
Government
-15.0 -10.0 -5.0 0.0 5.0 10.0 15.0 20.0Percentage Growth
2006-12 1998-2006
19
Figure 5a: Urban Wealth Quintile by Employment Status, Currently Employed Males, Ages 15-64, 2012
Source: ELMPS 2012.
Figure 5b: Rural Wealth Quintile by Employment Status, Currently Employed Males, Ages 15-64, 2012
Source: ELMPS 2012.
05
1015202530354045
Perc
enta
ge
Poorest
Second
Third
Fourth
Richest
05
1015202530354045
Perc
enta
ge
Poorest
Second
Third
Fourth
Richest
20
Figure 5c: Urban Wealth Quintile by Employment Status, Currently Employed Females, Ages 15-64, 2012
Source: ELMPS 2012.
Figure 5d: Rural Wealth Quintile by Employment Status, Currently Employed Females, Ages 15-64, 2012
Source: ELMPS 2012.
0102030405060708090
Perc
enta
ge
Poorest
Second
Third
Fourth
Richest
0102030405060708090
Perc
enta
ge
Poorest
Second
Third
Fourth
Richest
21
Figure 6: First Jobs by Status, 3 Period Moving Average, 1980-2011
Source: ELMPS 2006 (1980-2005), ELMPS 2012 (2006-2011).
Public Formal Private Wage Informal Private Wage
Employers Self-Employed Unpaid Fam. Workers
0
10
20
30
40
50
6019
8019
8319
8619
8919
9219
9519
9820
0120
0420
0720
10
Perc
enta
ge
All
0
10
20
30
40
50
60
1980
1983
1986
1989
1992
1995
1998
2001
2004
2007
2010
Perc
enta
ge
Secondary +
0
10
20
30
40
50
60
1980
1983
1986
1989
1992
1995
1998
2001
2004
2007
2010
Perc
enta
ge
Males
0
10
20
30
40
50
60
1980
1983
1986
1989
1992
1995
1998
2001
2004
2007
2010
Perc
enta
geMales, Secondary +
0
20
40
60
80
100
Perc
enta
ge
Females
0
20
40
60
80
100
1980
1983
1986
1989
1992
1995
1998
2001
2004
2007
2010
Perc
enta
ge
Females, Secondary +
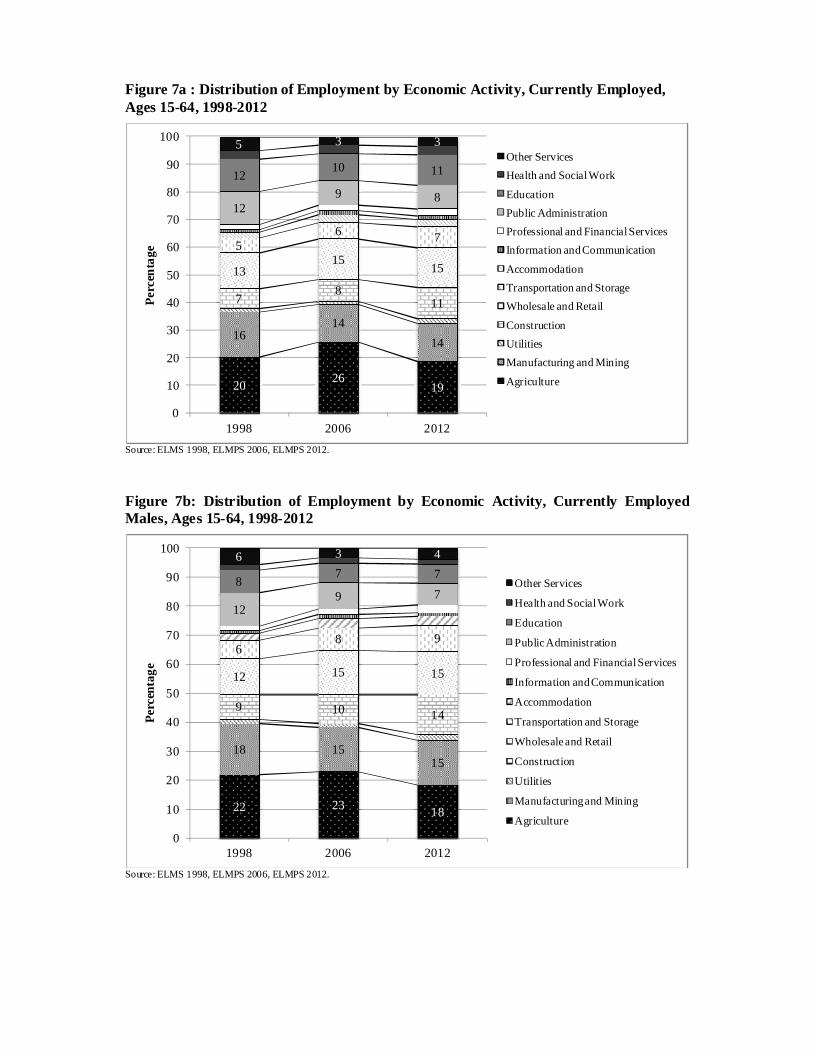
Figure 7a : Distribution of Employment by Economic Activity, Currently Employed, Ages 15-64, 1998-2012
Source: ELMS 1998, ELMPS 2006, ELMPS 2012.
Figure 7b: Distribution of Employment by Economic Activity, Currently Employed Males, Ages 15-64, 1998-2012
Source: ELMS 1998, ELMPS 2006, ELMPS 2012.
20 2619
1614
14
78
11
1315
15
56 7
129 8
1210 11
5 3 3
0
10
20
30
40
50
60
70
80
90
100
1998 2006 2012
Perc
enta
geOther ServicesHealth and Social Work
EducationPublic AdministrationProfessional and Financial ServicesInformation and Communication
AccommodationTransportation and StorageWholesale and Retail
ConstructionUtilitiesManufacturing and Mining
Agriculture
22 23 18
18 1515
9 10 14
12 15 15
68 9
129 7
87 7
6 3 4
0
10
20
30
40
50
60
70
80
90
100
1998 2006 2012
Perc
enta
ge
Other Services
Health and Social Work
Education
Public Administration
Professional and Financial Services
Information and Communication
Accommodation
Transportation and Storage
Wholesale and Retail
Construction
Utilities
Manufacturing and Mining
Agriculture
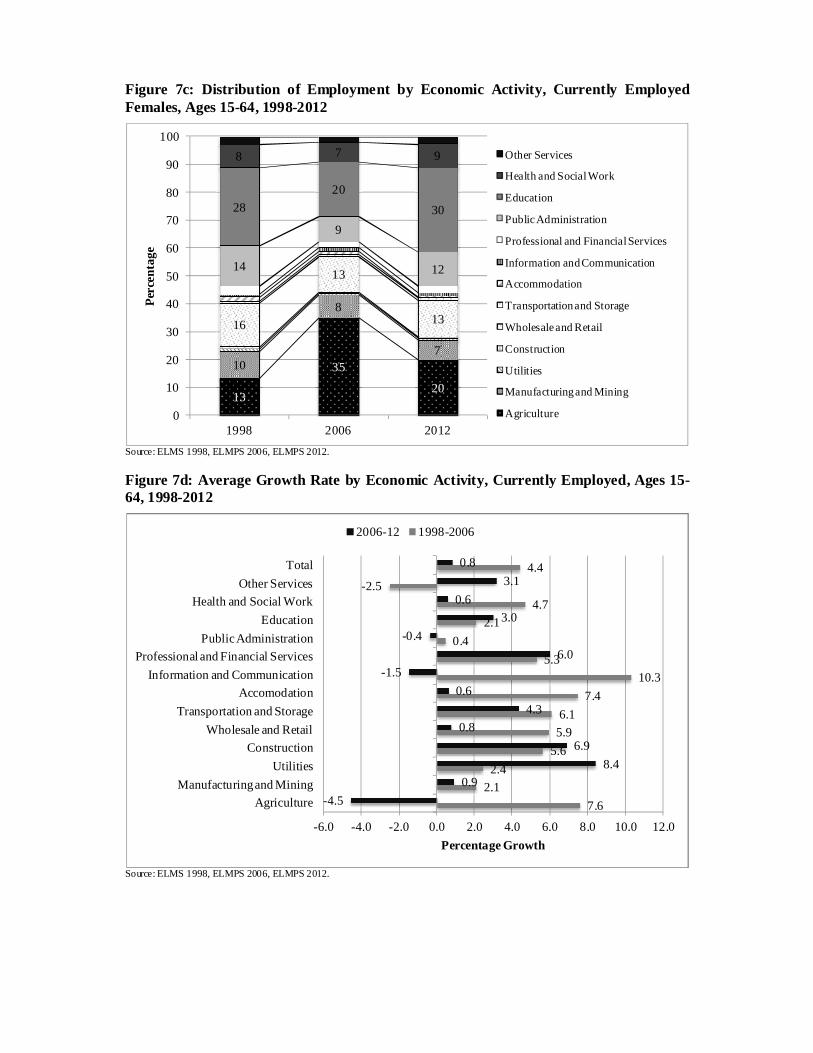
Figure 7c: Distribution of Employment by Economic Activity, Currently Employed Females, Ages 15-64, 1998-2012
Source: ELMS 1998, ELMPS 2006, ELMPS 2012.
Figure 7d: Average Growth Rate by Economic Activity, Currently Employed, Ages 15-64, 1998-2012
Source: ELMS 1998, ELMPS 2006, ELMPS 2012.
13
35
20
10
8
7
16
13
13
14
9
12
2820
30
8 7 9
0
10
20
30
40
50
60
70
80
90
100
1998 2006 2012
Perc
enta
geOther Services
Health and Social Work
Education
Public Administration
Professional and Financial Services
Information and Communication
Accommodation
Transportation and Storage
Wholesale and Retail
Construction
Utilities
Manufacturing and Mining
Agriculture
7.62.1
2.45.65.96.1
7.410.3
5.30.4
2.14.7
-2.54.4
-4.50.9
8.46.9
0.84.3
0.6-1.5
6.0-0.4
3.00.6
3.10.8
-6.0 -4.0 -2.0 0.0 2.0 4.0 6.0 8.0 10.0 12.0
AgricultureManufacturing and Mining
UtilitiesConstruction
Wholesale and RetailTransportation and Storage
AccomodationInformation and Communication
Professional and Financial ServicesPublic Administration
EducationHealth and Social Work
Other ServicesTotal
Percentage Growth
2006-12 1998-2006
24
Figure 8: Percentage of Irregular Employment in Private Wage Employment by Economic Activity, 1998-2012.
Source: ELMS 1998, ELMPS 2006, ELMPS 2012.
0102030405060708090
100Pe
rcen
tage
1998
2006
2012
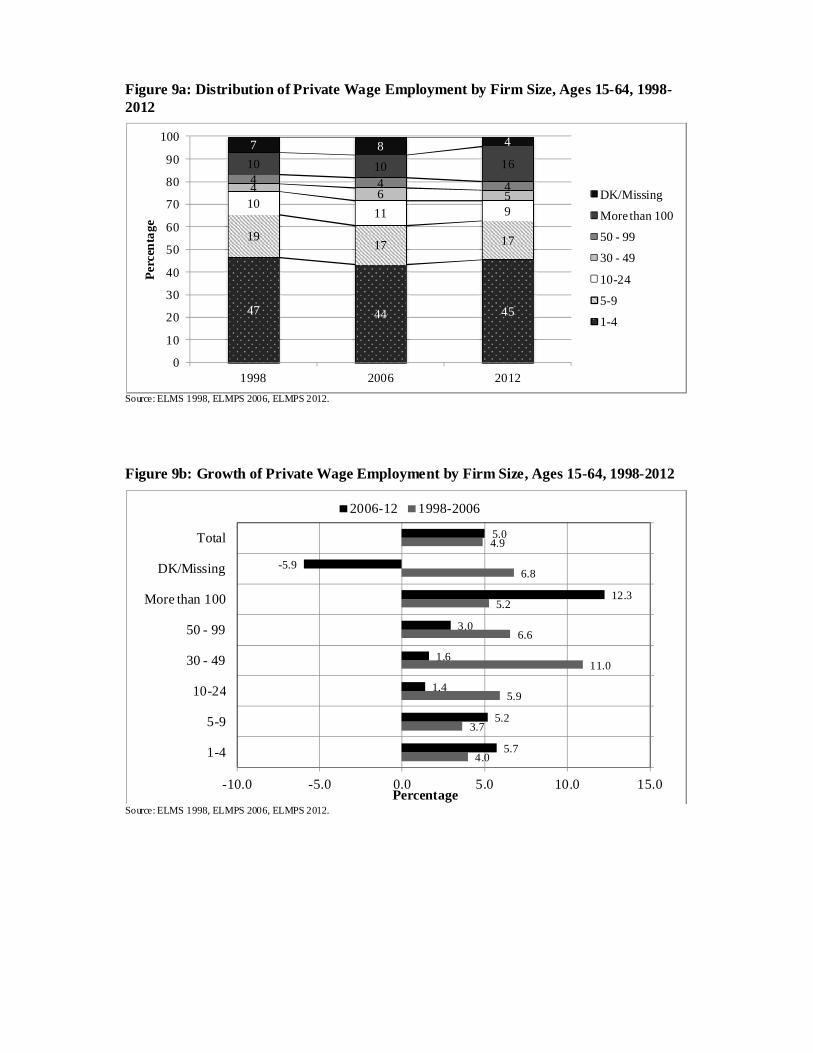
Figure 9a: Distribution of Private Wage Employment by Firm Size, Ages 15-64, 1998-2012
Source: ELMS 1998, ELMPS 2006, ELMPS 2012.
Figure 9b: Growth of Private Wage Employment by Firm Size, Ages 15-64, 1998-2012
Source: ELMS 1998, ELMPS 2006, ELMPS 2012.
47 44 45
1917 17
1011 9
4 6 54 4 4
10 10 167 8 4
0
10
20
30
40
50
60
70
80
90
100
1998 2006 2012
Perc
enta
ge
DK/Missing
More than 100
50 - 99
30 - 49
10-24
5-9
1-4
4.0
3.7
5.9
11.0
6.6
5.2
6.8
4.9
5.7
5.2
1.4
1.6
3.0
12.3
-5.9
5.0
-10.0 -5.0 0.0 5.0 10.0 15.0
1-4
5-9
10-24
30 - 49
50 - 99
More than 100
DK/Missing
Total
Percentage
2006-12 1998-2006
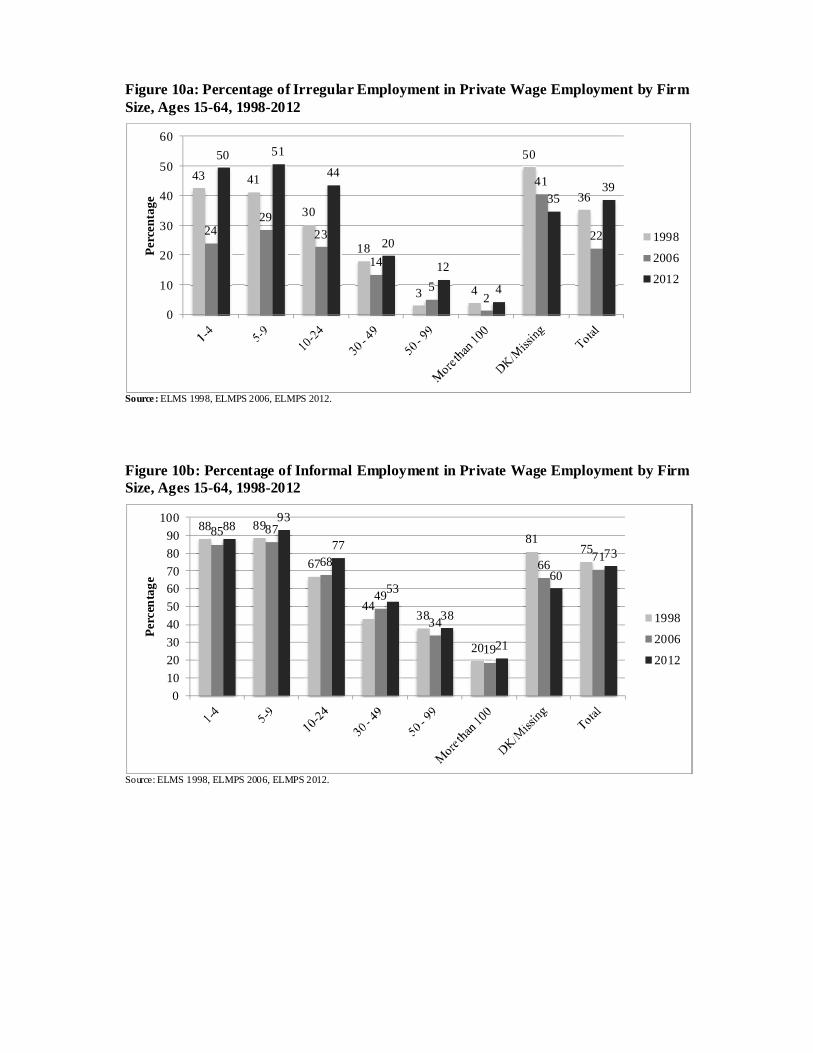
Figure 10a: Percentage of Irregular Employment in Private Wage Employment by Firm Size, Ages 15-64, 1998-2012
Source : ELMS 1998, ELMPS 2006, ELMPS 2012.
Figure 10b: Percentage of Informal Employment in Private Wage Employment by Firm Size, Ages 15-64, 1998-2012
Source: ELMS 1998, ELMPS 2006, ELMPS 2012.
43 41
30
18
3 4
50
36
2429
23
14
52
41
22
50 51
44
20
12
4
3539
0
10
20
30
40
50
60Pe
rcen
tage
1998
2006
2012
88 89
67
4438
20
8175
85 87
68
49
34
19
6671
8893
77
53
38
21
60
73
0102030405060708090
100
Perc
enta
ge
1998
2006
2012
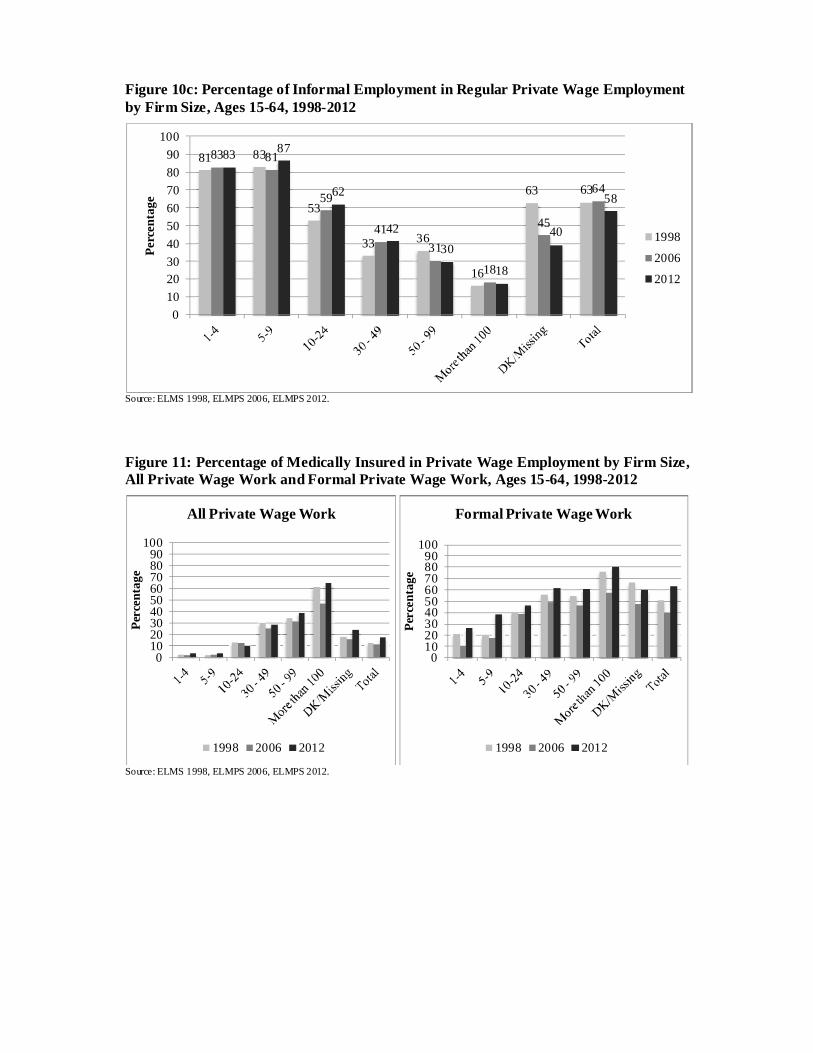
Figure 10c: Percentage of Informal Employment in Regular Private Wage Employment by Firm Size, Ages 15-64, 1998-2012
Source: ELMS 1998, ELMPS 2006, ELMPS 2012.
Figure 11: Percentage of Medically Insured in Private Wage Employment by Firm Size, All Private Wage Work and Formal Private Wage Work, Ages 15-64, 1998-2012
Source: ELMS 1998, ELMPS 2006, ELMPS 2012.
81 83
53
33 36
16
63 63
83 81
59
4131
18
45
64
83 87
62
4230
18
40
58
0102030405060708090
100Pe
rcen
tage
1998
2006
2012
0102030405060708090
100
Perc
enta
ge
All Private Wage Work
1998 2006 2012
0102030405060708090
100
Perc
enta
ge
Formal Private Wage Work
1998 2006 2012
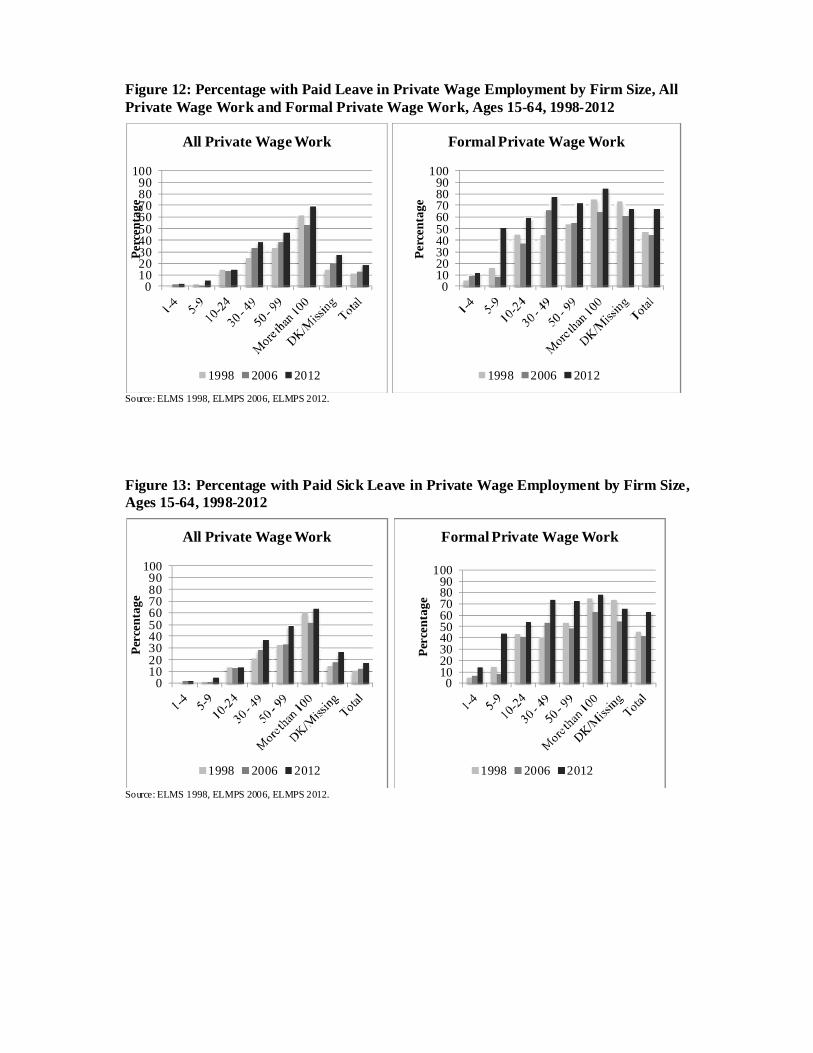
Figure 12: Percentage with Paid Leave in Private Wage Employment by Firm Size, All Private Wage Work and Formal Private Wage Work, Ages 15-64, 1998-2012
Source: ELMS 1998, ELMPS 2006, ELMPS 2012.
Figure 13: Percentage with Paid Sick Leave in Private Wage Employment by Firm Size, Ages 15-64, 1998-2012
Source: ELMS 1998, ELMPS 2006, ELMPS 2012.
0102030405060708090
100
Perc
enta
geAll Private Wage Work
1998 2006 2012
0102030405060708090
100
Perc
enta
ge
Formal Private Wage Work
1998 2006 2012
0102030405060708090
100
Perc
enta
ge
All Private Wage Work
1998 2006 2012
0102030405060708090
100
Perc
enta
ge
Formal Private Wage Work
1998 2006 2012
29
Table 1: Employment Growth, 1998-2011
Employment (Thousands)
Job Creation (Thousands)
Job Exit (Thousands)
Net Job Growth (Thousands)
Net Job Growth (Percentage)
Working Age Population Gro wth
(Percentage ) 1998 14,508 1,251 599 653 4.6 4.3 1999 15,125 1,216 611 606 4.1 4.4 2000 15,915 1,580 801 779 5.0 4.0 2001 16,678 1,449 709 741 4.5 3.7 2002 17,371 1,472 774 698 4.1 4.2 2003 17,910 1,270 678 591 3.3 3.7 2004 18,621 1,425 760 666 3.6 3.0 2005 19,393 1,631 901 730 3.8 3.2 2006 19,987 1,515 948 567 2.9 2.7 2007 20,484 1,386 903 483 2.4 2.5 2008 21,063 1,616 1,074 542 2.6 2.4 2009 21,695 1,754 1,137 617 2.9 2.4 2010 22,218 1,697 1,328 370 1.7 2.1 2011 22,487 1,488 1,245 243 1.1 2.0 Source: ELMPS 2012.
30
Table 2a: Transitions between Employment Statuses, Extended Definition of Employment, 1998 to 2006, Ages 15-64 in 2006 (Approx. 7-56 in 1998) 2006 Status -->
1998 Status Not
Working
Non-Wage. Agri.
Non-Wage.
Non-Agri. Irregular
Wage
Regular Informal Private
Regular Formal Private Public Total Changed
Improved Status
Worse Status
Males Not Working 51.4 7.4 8.1 6.3 15.1 5.4 6.4 100.0 48.6 Non-Wage. Agri. 7.0 66.0 3.0 5.4 6.7 2.8 9.1 100.0 34.0 18.6 6.3 Non-Wage. Non-Agri. 5.8 4.4 72.3 2.4 5.4 5.1 4.8 100.0 27.8 15.2 5.4 Irregular Wage 6.5 14.6 13.0 29.9 21.9 6.0 8.2 100.0 70.2 36.1 0.0 Regular Informal Priv. 11.1 3.3 21.3 8.7 32.0 15.5 8.1 100.0 68.0 23.6 33.3 Regular Formal Priv. 6.9 0.9 13.1 2.7 8.4 57.1 10.8 100.0 42.9 10.8 25.2 Public 11.4 1.5 2.0 0.6 1.6 2.5 80.5 100.0 19.5 0.0 8.2 Total 29.7 10.3 13.0 6.6 12.6 7.3 20.5 100.0
Females Not Working 84.9 6.4 2.4 0.4 2.1 0.9 2.9 100.0 15.1 Non-Wage. Agri. 59.6 40.4 0.0 0.0 0.0 0.0 0.0 100.0 59.6 0.0 0.4 Non-Wage. Non-Agri. 47.0 1.5 46.8 0.7 3.1 0.0 1.0 100.0 53.2 4.1 0.0 Irregular Wage 64.9 13.7 9.9 3.2 8.4 0.0 0.0 100.0 96.8 8.4 0.0 Regular Informal Priv. 57.9 1.8 4.7 0.8 23.2 7.2 4.5 100.0 76.8 11.7 7.2 Regular Formal Priv. 21.9 0.0 0.0 0.0 0.0 59.7 18.4 100.0 40.3 18.4 0.0 Public 14.7 0.2 0.8 0.0 0.1 2.2 82.1 100.0 17.9 0.0 3.2 Total 77.5 6.3 3.3 0.4 2.2 1.4 9.0 100.0
All Not Working 72.7 6.8 4.5 2.5 6.8 2.5 4.2 100.0 27.3 Non-Wage. Agri. 15.7 61.8 2.5 4.5 5.6 2.3 7.6 100.0 38.2 15.5 2.5 Non-Wage. Non-Agri. 15.3 3.7 66.4 2.0 4.9 3.9 3.9 100.0 33.6 12.7 4.5 Irregular Wage 10.7 14.5 12.7 27.9 20.9 5.6 7.6 100.0 72.1 34.1 0.0 Regular Informal Priv. 16.9 3.1 19.2 7.7 31.0 14.5 7.7 100.0 69.1 22.1 30.1 Regular Formal Priv. 8.9 0.8 11.3 2.4 7.3 57.5 11.8 100.0 42.6 11.8 21.8 Public 12.4 1.1 1.6 0.4 1.1 2.4 81.0 100.0 19.1 0.0 6.7
Total 53.6 8.3 8.2 3.5 7.4 4.3 14.8 100.0 Source: ELMS 1998, ELMPS 2006.
31
Table 2b: Transitions between Employment Statuses, Extended Definition of Employment, 2006 to 2012, Ages 15-64 in 2012 (Approx. 9-58 in 2006) 2012 Status -->
2006 Status Not
Working
Non-Wage. Agri.
Non-Wage. Non-Agri.
Irregular Wage
Regular Informal Private
Regular Formal Private Public Total Changed
Improved Status
Worse Status
Males Not Working 52.3 5.1 5.7 13.5 12.9 5.7 4.8 100.0 47.7 Non-Wage. Agri. 8.6 48.5 5.4 20.5 9.8 2.2 5.0 100.0 51.6 17.1 13.5 Non-Wage. Non-Agri. 8.3 3.0 54.1 12.8 12.4 4.9 4.6 100.0 45.9 21.8 20.5 Irregular Wage 9.4 8.2 11.1 46.6 14.6 4.6 5.5 100.0 53.4 24.7 0.0 Regular Informal Priv. 9.0 4.1 14.3 21.4 31.0 11.7 8.6 100.0 69.0 20.2 39.8 Regular Formal Priv. 8.0 1.0 8.3 9.2 15.5 44.8 13.4 100.0 55.3 13.4 33.8 Public 10.9 2.1 2.4 1.1 2.1 4.1 77.3 100.0 22.7 0.0 11.8 Total 25.9 8.4 11.5 14.5 13.1 8.2 18.5 100.0
Females Not Working 90.4 2.1 1.7 0.4 1.4 0.9 3.1 100.0 9.7 Non-Wage. Agri. 73.8 21.1 2.9 1.2 0.3 0.1 0.6 100.0 78.9 1.0 0.4 Non-Wage. Non-Agri. 62.9 2.1 31.1 1.0 1.7 0.6 0.6 100.0 68.9 2.9 1.2 Irregular Wage 62.3 9.3 10.2 10.9 3.6 3.8 0.0 100.0 89.1 7.4 0.0 Regular Informal Priv. 63.1 2.1 4.2 1.8 16.3 9.2 3.3 100.0 83.7 12.5 8.1 Regular Formal Priv. 39.7 0.2 0.6 0.0 12.0 23.3 24.3 100.0 76.8 24.3 12.8 Public 14.3 0.0 0.2 0.0 0.4 2.0 83.1 100.0 16.9 0.0 2.6 Total 81.6 3.3 2.5 0.5 1.6 1.2 9.4 100.0
All Not Working 78.1 3.1 3.0 4.6 5.1 2.5 3.7 100.0 21.9 Non-Wage. Agri. 35.9 37.0 4.4 12.4 5.8 1.3 3.2 100.0 63.0 10.3 4.6 Non-Wage. Non-Agri. 19.4 2.9 49.4 10.4 10.2 4.0 3.8 100.0 50.6 18.0 12.4 Irregular Wage 13.4 8.3 11.1 43.9 13.8 4.6 5.0 100.0 56.1 23.4 0.0 Regular Informal Private 14.9 3.9 13.2 19.3 29.4 11.4 8.0 100.0 70.6 19.4 36.3 Regular Formal Private 11.5 0.9 7.4 8.2 15.1 42.4 14.6 100.0 57.6 14.6 31.5 Public 12.0 1.4 1.7 0.8 1.6 3.5 79.1 100.0 20.9 0.0 8.9 Total 54.0 5.8 7.0 7.4 7.3 4.7 13.9 100.0
Source: ELMPS 2006, ELMPS 2012
32
Table 3: Average Hours per Week by Institutional Sector, Currently Employed, Ages 15-64, 1998-2012
Males Females All
1998 2006 2012 1998 2006 2012 1998 2006 2012
Employer 54.6 54.6 53.8 48.7 43.6 38.7 54.4 53.8 53.0 Self-Employed Agri. 51.5 45.4 48.1 32.3 27.9 24.4 50.3 35.9 43.6 Self-Employed Non-Agri. 51.0 53.8 51.4 41.9 43.5 38.7 49.0 51.4 48.9 Unpaid Fam. Wrk. Agri. 49.1 46.2 44.6 35.4 29.0 29.0 45.2 36.4 36.4 Unpaid Fam. Wrk. Non-Agri. 52.9 52.5 47.7 37.1 39.9 41.1 46.9 48.3 45.1 Irregular Wage 40.2 42.8 43.8 50.2 31.0 38.6 40.9 42.0 43.6 Informal Private Regular Wage 56.6 56.5 56.4 52.0 53.3 49.5 56.1 56.1 55.7 Formal Private Regular Wage 54.8 55.2 53.5 44.3 49.3 45.1 53.6 54.4 52.4 Public Enterprises 49.0 49.6 49.0 41.9 43.6 43.3 48.1 48.9 48.3 Government 44.6 45.5 43.8 39.0 40.7 37.3 42.9 43.9 41.5 Total 49.2 50.9 49.3 41.0 38.8 37.8 47.7 48.0 47.1 Source: ELMS 1998, ELMPS 2006, ELMPS 2012.
Table 4: Percentage and Reasons Working fewer than 40 hours, Currently Employed, Ages 15-64, 1998-2012
1998 2006 2012 Less than 40 Hours 30.8 25.3 27.4 Reason Official Ho urs 77.7 82.7 48.6 No Work Avail. 15.4 11.1 34.2 Pay not eno ugh 0.4 0.0 0.2 Do not Want More 3.0 1.8 7.8 Temp. Absence 1.8 1.2 2.2 Other 1.8 3.2 6.9 Total 100.0 100.0 100.0
Source: ELMS 1998, ELMPS 2006, ELMPS 2012.
Table 5: Primary Changes in Employment Conditions within the Past Three Months Due to the Revolution by Institutional Sector, Among those Reporting a Change, and Percentage Experienced Change, Currently Employed, Ages 15-64
Current Institutional Sector Fa
ll in
Sal
es
Dec
reas
e in
Hou
rs
Lack
of S
ecur
ity
Layo
ffs
Dec
reas
e in
Wag
es
Incr
ease
in C
osts
Incr
ease
in H
ours
Impr
ove.
in C
ondi
tions
Oth
er
Tota
l
Expe
rienc
ed C
hang
e
Emplo yer 57.6 5.6 17.4 0.4 1.6 13.2 0.7 1.6 1.9 100.0 27.4 Self-Employed Agri. 53.4 4.3 17.7 0.0 0.0 17.5 0.0 3.4 3.7 100.0 13.2 Self-Employed Non-Agri. 51.6 10.5 25.6 0.0 5.5 4.9 0.0 1.3 0.7 100.0 31.3 Unpaid Fam. Wrk. Agri. 10.1 5.5 46.2 0.0 0.0 30.5 1.9 5.7 0.0 100.0 8.7 Unpaid Fam. Wrk. Non-Agri.
58.0 11.7 10.5 0.0 2.9 10.6 0.0 1.6 4.7 100.0 24.3
Irregular Wage 21.3 16.6 34.5 4.1 18.7 1.5 0.2 1.7 1.5 100.0 23.3 Informal Private Reg. Wage
44.7 6.1 25.1 5.2 11.9 2.4 1.9 1.3 1.3 100.0 23.5
Formal Private Reg. Wage
27.9 8.7 23.5 9.3 16.4 0.7 1.3 8.5 3.8 100.0 28.2
Pub lic Enterprises 14.9 1.6 25.3 4.4 3.0 0.0 3.4 42.9 4.6 100.0 25.6 Government 3.0 1.6 21.3 1.4 3.6 0.4 1.7 56.1 10.9 100.0 26.0 Total 28.1 7.1 24.6 3.2 8.7 3.6 1.2 19.0 4.4 100.0 24.8
Source: ELMPS 2012.
33
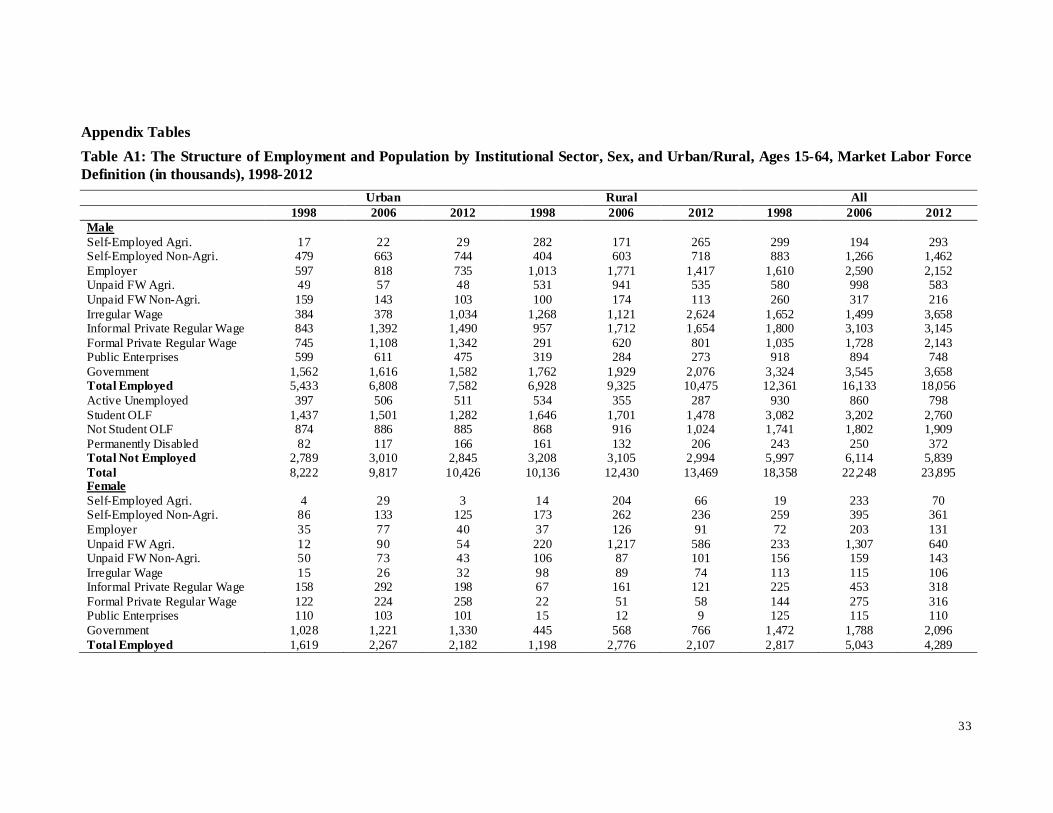
Appendix Tables Table A1: The Structure of Employment and Population by Institutional Sector, Sex, and Urban/Rural, Ages 15-64, Market Labor Force Definition (in thousands), 1998-2012 Urban Rural All 1998 2006 2012 1998 2006 2012 1998 2006 2012 Male Self-Employed Agri. 17 22 29 282 171 265 299 194 293 Self-Employed Non-Agri. 479 663 744 404 603 718 883 1,266 1,462 Employer 597 818 735 1,013 1,771 1,417 1,610 2,590 2,152 Unpaid FW Agri. 49 57 48 531 941 535 580 998 583 Unpaid FW Non-Agri. 159 143 103 100 174 113 260 317 216 Irregular Wage 384 378 1,034 1,268 1,121 2,624 1,652 1,499 3,658 Informal Private Regular Wage 843 1,392 1,490 957 1,712 1,654 1,800 3,103 3,145 Formal Private Regular Wage 745 1,108 1,342 291 620 801 1,035 1,728 2,143 Public Enterprises 599 611 475 319 284 273 918 894 748 Government 1,562 1,616 1,582 1,762 1,929 2,076 3,324 3,545 3,658 Total Employed 5,433 6,808 7,582 6,928 9,325 10,475 12,361 16,133 18,056 Active Unemployed 397 506 511 534 355 287 930 860 798 Student OLF 1,437 1,501 1,282 1,646 1,701 1,478 3,082 3,202 2,760 Not Student OLF 874 886 885 868 916 1,024 1,741 1,802 1,909 Permanently Disabled 82 117 166 161 132 206 243 250 372 Total Not Employed 2,789 3,010 2,845 3,208 3,105 2,994 5,997 6,114 5,839 Total 8,222 9,817 10,426 10,136 12,430 13,469 18,358 22,248 23,895 Female Self-Employed Agri. 4 29 3 14 204 66 19 233 70 Self-Employed Non-Agri. 86 133 125 173 262 236 259 395 361 Employer 35 77 40 37 126 91 72 203 131 Unpaid FW Agri. 12 90 54 220 1,217 586 233 1,307 640 Unpaid FW Non-Agri. 50 73 43 106 87 101 156 159 143 Irregular Wage 15 26 32 98 89 74 113 115 106 Informal Private Regular Wage 158 292 198 67 161 121 225 453 318 Formal Private Regular Wage 122 224 258 22 51 58 144 275 316 Public Enterprises 110 103 101 15 12 9 125 115 110 Government 1,028 1,221 1,330 445 568 766 1,472 1,788 2,096 Total Employed 1,619 2,267 2,182 1,198 2,776 2,107 2,817 5,043 4,289
34
Table A1: Continued Urban Rural All 1998 2006 2012 1998 2006 2012 1998 2006 2012 Active Unemployed 478 551 575 598 558 762 1,077 1,109 1,336 Student OLF 1,280 1,454 1,336 1,152 1,434 1,448 2,433 2,888 2,784 Not Student OLF 4,781 5,817 6,699 7,112 7,729 9,299 11,893 13,546 15,998 Permanently Disabled 72 48 41 52 94 93 125 142 133 Total Not Employed 6,612 7,870 8,651 8,915 9,814 11,601 15,527 17,684 20,252 Total 8,231 10,137 10,833 10,113 12,591 13,708 18,344 22,727 24,541 Total Self-Employed Agri. 21 51 32 297 375 331 318 427 363 Self-Employed Non-Agri. 564 795 869 578 866 953 1,142 1,661 1,822 Employer 632 895 775 1,050 1,897 1,508 1,682 2,792 2,283 Unpaid FW Agri. 61 146 101 751 2,158 1,121 812 2,305 1,222 Unpaid FW Non-Agri. 209 216 146 206 260 213 416 476 359 Irregular Wage 399 403 1,066 1,366 1,210 2,698 1,765 1,613 3,764 Informal Private Regular Wage 1,001 1,684 1,688 1,024 1,872 1,775 2,025 3,556 3,463 Formal Private Regular Wage 867 1,333 1,600 312 671 859 1,179 2,003 2,459 Public Enterprises 708 714 576 335 296 282 1,043 1,009 857 Government 2,590 2,837 2,912 2,207 2,497 2,841 4,796 5,333 5,753 Total Employed 7,052 9,074 9,764 8,126 12,102 12,582 15,178 21,176 22,346 Active Unemployed 875 1,057 1,086 1,132 913 1,049 2,007 1,970 2,134 Student OLF 2,717 2,955 2,618 2,798 3,135 2,926 5,515 6,090 5,544 Not Student OLF 5,655 6,702 7,585 7,980 8,645 10,322 13,635 15,348 17,907 Permanently Disabled 154 165 207 213 226 298 367 392 506 Total Not Employed 9,401 10,880 11,496 12,123 12,919 14,595 21,524 23,799 26,091 Total 16,453 19,954 21,259 20,249 25,021 27,177 36,702 44,975 48,436
Source: ELMS 1998, ELMPS 2006, ELMPS 2012.
35
Table A2: Percentage Average Annual Growth in the Structure of Employment and Population by Institutional Sector, Sex, and Urban/Rural, Ages 15-64, Market Labor Force Definition, 1998-2012 Urban Rural All 1998-2006 2006-12 1998-2006 2006-12 1998-2006 2006-12 Male Self-Employed Agri. 3.9 4.2 -6.7 7.3 -5.8 6.9 Self-Employed Non-Agri. 4.3 1.9 5.3 2.9 4.8 2.4 Employer 4.2 -1.8 7.4 -3.7 6.3 -3.1 Unpaid FW Agri. 2.0 -2.9 7.6 -9.4 7.2 -9.0 Unpaid FW Non-Agri. -1.4 -5.4 7.3 -7.2 2.6 -6.4 Irregular Wage -0.2 16.8 -1.6 14.2 -1.3 14.9 Informal Private Regular Wage 6.7 1.1 7.7 -0.6 7.3 0.2 Formal Private Regular Wage 5.3 3.2 10.1 4.3 6.8 3.6 Public Enterprises 0.3 -4.2 -1.6 -0.6 -0.3 -3.0 Government 0.5 -0.4 1.2 1.2 0.9 0.5 Total Employed 3.0 1.8 4.0 1.9 3.6 1.9 Active Unemployed 3.2 0.2 -5.4 -3.5 -1.0 -1.3 Student OLF 0.6 -2.6 0.4 -2.3 0.5 -2.5 Not Student OLF 0.2 0.0 0.7 1.8 0.5 1.0 Permanently Disabled 4.8 5.8 -2.6 7.3 0.4 6.6 Total Not Employed 1.0 -0.9 -0.4 -0.6 0.3 -0.8 Total 2.4 1.0 2.7 1.3 2.6 1.2 Female Self-Employed Agri. 25.9 -36.5 35.3 -18.7 33.7 -20.1 Self-Employed Non-Agri. 5.8 -1.0 5.5 -1.8 5.6 -1.5 Employer 10.6 -11.1 16.3 -5.3 13.8 -7.3 Unpaid FW Agri. 26.7 -8.5 22.8 -12.2 23.0 -11.9 Unpaid FW Non-Agri. 5.0 -8.9 -2.7 2.5 0.3 -1.8 Irregular Wage 6.9 3.4 -1.3 -3.0 0.2 -1.3 Informal Private Regular Wage 8.2 -6.5 11.7 -4.8 9.4 -5.9 Formal Private Regular Wage 8.1 2.3 11.4 2.2 8.6 2.3 Public Enterprises -0.9 -0.3 -3.2 -5.8 -1.1 -0.8 Government 2.3 1.4 3.2 5.0 2.6 2.6 Total Employed 4.5 -0.6 11.2 -4.6 7.8 -2.7 Active Unemployed 1.9 0.7 -0.9 5.2 0.4 3.1 Student OLF 1.7 -1.4 2.9 0.2 2.3 -0.6 Not Student OLF 2.6 2.4 1.1 3.1 1.7 2.8 Permanently Disabled -5.5 -2.7 7.8 -0.2 1.7 -1.0 Total Not Employed 2.3 1.6 1.3 2.8 1.7 2.3 Total 2.8 1.1 2.9 1.4 2.9 1.3 Total Self-Employed Agri. 4.0 4.0 -7.0 7.0 -6.0 7.0 Self-Employed Non-Agri. 4.0 2.0 5.0 3.0 5.0 2.0 Employer 4.0 -2.0 7.0 -4.0 6.0 -3.0 Unpaid FW Agri. 2.0 -3.0 8.0 -9.0 7.0 -9.0 Unpaid FW Non-Agri. -1.0 -5.0 7.0 -7.0 3.0 -6.0 Irregular Wage 0.0 17.0 -2.0 14.0 -1.0 15.0 Informal Private Regular Wage 7.0 1.0 8.0 -1.0 7.0 0.0 Formal Private Regular Wage 5.0 3.0 10.0 4.0 7.0 4.0 Public Enterprises 0.0 -4.0 -2.0 -1.0 0.0 -3.0 Government 0.0 0.0 1.0 1.0 1.0 1.0 Total Employed 3.0 2.0 4.0 2.0 4.0 2.0 Active Unemployed 3.0 0.0 -5.0 -4.0 -1.0 -1.0 Student OLF 1.0 -3.0 0.0 -2.0 1.0 -2.0 Not Student OLF 0.0 0.0 1.0 2.0 0.0 1.0 Permanently Disabled 5.0 6.0 -3.0 7.0 0.0 7.0 Total Not Employed 1.0 -1.0 0.0 -1.0 0.0 -1.0 Total 2.0 1.0 3.0 1.0 3.0 1.0
Source: ELMS 1998, ELMPS 2006, ELMPS 2012.
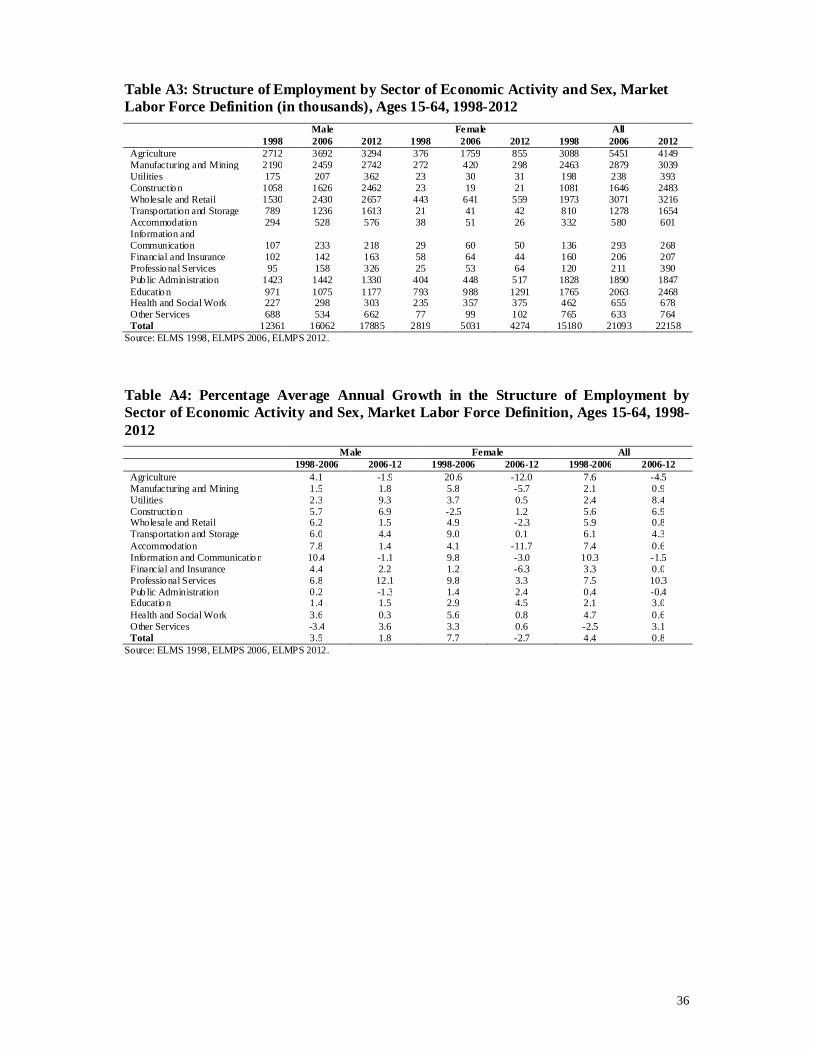
36
Table A3: Structure of Employment by Sector of Economic Activity and Sex, Market Labor Force Definition (in thousands), Ages 15-64, 1998-2012
Male
Female
All 1998 2006 2012 1998 2006 2012 1998 2006 2012
Agriculture 2712 3692 3294 376 1759 855 3088 5451 4149 Manufacturing and Mining 2190 2459 2742 272 420 298 2463 2879 3039 Utilities 175 207 362 23 30 31 198 238 393 Constructio n 1058 1626 2462 23 19 21 1081 1646 2483 Wholesale and Retail 1530 2430 2657 443 641 559 1973 3071 3216 Transportation and Storage 789 1236 1613 21 41 42 810 1278 1654 Accommodation 294 528 576 38 51 26 332 580 601 Information and Communication 107 233 218 29 60 50 136 293 268 Financial and Insurance 102 142 163 58 64 44 160 206 207 Professio nal Services 95 158 326 25 53 64 120 211 390 Pub lic Administration 1423 1442 1330 404 448 517 1828 1890 1847 Educatio n 971 1075 1177 793 988 1291 1765 2063 2468 Health and Social Work 227 298 303 235 357 375 462 655 678 Other Services 688 534 662 77 99 102 765 633 764 Total 12361 16062 17885 2819 5031 4274 15180 21093 22158
Source: ELMS 1998, ELMPS 2006, ELMPS 2012.
Table A4: Percentage Average Annual Growth in the Structure of Employment by Sector of Economic Activity and Sex, Market Labor Force Definition, Ages 15-64, 1998-2012
Male Female All 1998-2006 2006-12 1998-2006 2006-12 1998-2006 2006-12 Agriculture 4.1 -1.9 20.6 -12.0 7.6 -4.5 Manufacturing and Mining 1.5 1.8 5.8 -5.7 2.1 0.9 Utilities 2.3 9.3 3.7 0.5 2.4 8.4 Constructio n 5.7 6.9 -2.5 1.2 5.6 6.9 Wholesale and Retail 6.2 1.5 4.9 -2.3 5.9 0.8 Transportation and Storage 6.0 4.4 9.0 0.1 6.1 4.3 Accommodation 7.8 1.4 4.1 -11.7 7.4 0.6 Information and Communicatio n 10.4 -1.1 9.8 -3.0 10.3 -1.5 Financial and Insurance 4.4 2.2 1.2 -6.3 3.3 0.0 Professio nal Services 6.8 12.1 9.8 3.3 7.5 10.3 Pub lic Administration 0.2 -1.3 1.4 2.4 0.4 -0.4 Educatio n 1.4 1.5 2.9 4.5 2.1 3.0 Health and Social Work 3.6 0.3 5.6 0.8 4.7 0.6 Other Services -3.4 3.6 3.3 0.6 -2.5 3.1 Total 3.5 1.8 7.7 -2.7 4.4 0.8
Source: ELMS 1998, ELMPS 2006, ELMPS 2012.
Related Documents


![Employment Equity Act [No. 55 of 1998] · Title: Employment Equity Act [No. 55 of 1998] Author: Government Gazette, Vol. 400, No. 19370 Subject: 19/10/1998 Created Date: 11/25/1998](https://static.cupdf.com/doc/110x72/604152f0f42b243336750918/employment-equity-act-no-55-of-1998-title-employment-equity-act-no-55-of-1998.jpg)


