The steady-state visual evoked potential reveals neural correlates of the items encoded into visual working memory Dwight J. Peterson a,b,n , Gennadiy Gurariy a , Gabriella G. Dimotsantos a , Hector Arciniega a , Marian E. Berryhill a , Gideon P. Caplovitz a a Program in Cognitive and Brain Sciences, Department of Psychology, University of Nevada, Reno, NV 89557, United States b Department of Psychological Sciences, University of Missouri-Columbia, 9J McAlester Hall, Columbia, MO 65211-2500, United States article info Article history: Received 11 April 2014 Received in revised form 15 August 2014 Accepted 19 August 2014 Available online 28 August 2014 Keywords: Visual working memory Visual attention Steady-state visual evoked potential abstract Visual working memory (VWM) capacity limitations are estimated to be 4 items. Yet, it remains unclear why certain items from a given memory array may be successfully retrieved from VWM and others are lost. Existing measures of the neural correlates of VWM cannot address this question because they measure the aggregate processing of the entire stimulus array rather than neural signatures of individual items. Moreover, this cumulative processing is usually measured during the delay period, thereby reflecting the allocation of neural resources during VWM maintenance. Here, we use the steady- state visual evoked potential (SSVEP) to identify the neural correlates of individual stimuli at VWM encoding and test two distinct hypotheses: the focused-resource hypothesis and the diffuse-resource hypothesis, for how the allocation of neural resources during VWM encoding may contribute to VWM capacity limitations. First, we found that SSVEP amplitudes were larger for stimuli that were later remembered than for items that were subsequently forgotten. Second, this pattern generalized so that the SSVEP amplitudes were also larger for the unprobed stimuli in correct compared to incorrect trials. These data are consistent with the diffuse-resource view in which attentional resources are broadly allocated across the whole stimulus array. These results illustrate the important role encoding mechanisms play in limiting the capacity of VWM. & 2014 Elsevier Ltd. All rights reserved. 1. Introduction The goal of the current experiment was to elucidate why we are able to retrieve certain items from visual working memory while others are forgotten. Visual working memory (VWM) refers to the encoding, maintenance, manipulation and retrieval of visual repre- sentations for immediate use. Despite the importance of VWM in both simple and complex cognitive tasks, capacity limitations associated with VWM are well documented (Cowan, 2001; Luck & Vogel, 2013). In addition, VWM capacity is further constrained by stimulus factors such as complexity (Alvarez & Cavanagh, 2004), saliency (Melcher & Piazza, 2011), similarity (Awh, Barton, & Vogel, 2007), and set size (Anderson, Vogel, & Awh, 2011; Bays & Husain, 2008; Bays, Catalao, & Husain, 2009; Fukuda, Awh, & Vogel, 2010). At a basic level, these capacity limitations indicate that when trying to encode, maintain, and retrieve a set of items in and from VWM, only a subset will ultimately be accessible. Although progress has been made in recent years, much remains unknown regarding the origins of this capacity limitation. In the current paper, we propose that constraints on capacity may manifest, in part, during the allocation of VWM resources at the time of encoding. We examine this hypothesis by examining neural signals associated with indivi- dual items during VWM encoding, and investigate whether mod- ulations in these signals correlate with the success or failure of the corresponding item being subsequently retrieved from VWM. Much of the existing research examining the neural correlates of VWM has focused on the delay-period or maintenance-phase of VWM tasks. Electrophysiological and neuroimaging findings indi- cate that VWM is mediated in part by elevated and sustained neural activity during the delay-period of VWM tasks. Evidence in support of this view emerged from electrophysiological recordings from the prefrontal cortex (PFC) of nonhuman primates. PFC neurons increase firing rates during stimulus presentation and maintain elevated firing rates during the VWM maintenance period of delayed response tasks (e.g., Fuster & Alexander, 1971; Funahashi, Bruce, & Goldman-Rakic, 1990). Neuroimaging studies in humans have identified sustained neural activity during the Contents lists available at ScienceDirect journal homepage: www.elsevier.com/locate/neuropsychologia Neuropsychologia http://dx.doi.org/10.1016/j.neuropsychologia.2014.08.020 0028-3932/& 2014 Elsevier Ltd. All rights reserved. n Corresponding author at: Department of Psychological Sciences, University of Missouri-Columbia, 9J McAlester Hall, Columbia, MO 65211-2500, United States. Tel.: þ1 573 882 8123. E-mail address: [email protected] (D.J. Peterson). Neuropsychologia 63 (2014) 145–153

Welcome message from author
This document is posted to help you gain knowledge. Please leave a comment to let me know what you think about it! Share it to your friends and learn new things together.
Transcript
The steady-state visual evoked potential reveals neural correlatesof the items encoded into visual working memory
Dwight J. Peterson a,b,n, Gennadiy Gurariy a, Gabriella G. Dimotsantos a, Hector Arciniega a,Marian E. Berryhill a, Gideon P. Caplovitz a
a Program in Cognitive and Brain Sciences, Department of Psychology, University of Nevada, Reno, NV 89557, United Statesb Department of Psychological Sciences, University of Missouri-Columbia, 9J McAlester Hall, Columbia, MO 65211-2500, United States
a r t i c l e i n f o
Article history:Received 11 April 2014Received in revised form15 August 2014Accepted 19 August 2014Available online 28 August 2014
Keywords:Visual working memoryVisual attentionSteady-state visual evoked potential
a b s t r a c t
Visual working memory (VWM) capacity limitations are estimated to be �4 items. Yet, it remainsunclear why certain items from a given memory array may be successfully retrieved from VWM andothers are lost. Existing measures of the neural correlates of VWM cannot address this question becausethey measure the aggregate processing of the entire stimulus array rather than neural signatures ofindividual items. Moreover, this cumulative processing is usually measured during the delay period,thereby reflecting the allocation of neural resources during VWM maintenance. Here, we use the steady-state visual evoked potential (SSVEP) to identify the neural correlates of individual stimuli at VWMencoding and test two distinct hypotheses: the focused-resource hypothesis and the diffuse-resourcehypothesis, for how the allocation of neural resources during VWM encoding may contribute to VWMcapacity limitations. First, we found that SSVEP amplitudes were larger for stimuli that were laterremembered than for items that were subsequently forgotten. Second, this pattern generalized so thatthe SSVEP amplitudes were also larger for the unprobed stimuli in correct compared to incorrect trials.These data are consistent with the diffuse-resource view in which attentional resources are broadlyallocated across the whole stimulus array. These results illustrate the important role encodingmechanisms play in limiting the capacity of VWM.
& 2014 Elsevier Ltd. All rights reserved.
1. Introduction
The goal of the current experiment was to elucidate why we areable to retrieve certain items from visual working memory whileothers are forgotten. Visual working memory (VWM) refers to theencoding, maintenance, manipulation and retrieval of visual repre-sentations for immediate use. Despite the importance of VWM inboth simple and complex cognitive tasks, capacity limitationsassociated with VWM are well documented (Cowan, 2001; Luck &Vogel, 2013). In addition, VWM capacity is further constrained bystimulus factors such as complexity (Alvarez & Cavanagh, 2004),saliency (Melcher & Piazza, 2011), similarity (Awh, Barton, & Vogel,2007), and set size (Anderson, Vogel, & Awh, 2011; Bays & Husain,2008; Bays, Catalao, & Husain, 2009; Fukuda, Awh, & Vogel, 2010).At a basic level, these capacity limitations indicate that when tryingto encode, maintain, and retrieve a set of items in and from VWM,
only a subset will ultimately be accessible. Although progress hasbeen made in recent years, much remains unknown regarding theorigins of this capacity limitation. In the current paper, we proposethat constraints on capacity may manifest, in part, during theallocation of VWM resources at the time of encoding. We examinethis hypothesis by examining neural signals associated with indivi-dual items during VWM encoding, and investigate whether mod-ulations in these signals correlate with the success or failure of thecorresponding item being subsequently retrieved from VWM.
Much of the existing research examining the neural correlatesof VWM has focused on the delay-period or maintenance-phase ofVWM tasks. Electrophysiological and neuroimaging findings indi-cate that VWM is mediated in part by elevated and sustainedneural activity during the delay-period of VWM tasks. Evidence insupport of this view emerged from electrophysiological recordingsfrom the prefrontal cortex (PFC) of nonhuman primates. PFCneurons increase firing rates during stimulus presentation andmaintain elevated firing rates during the VWM maintenanceperiod of delayed response tasks (e.g., Fuster & Alexander, 1971;Funahashi, Bruce, & Goldman-Rakic, 1990). Neuroimaging studiesin humans have identified sustained neural activity during the
Contents lists available at ScienceDirect
journal homepage: www.elsevier.com/locate/neuropsychologia
Neuropsychologia
http://dx.doi.org/10.1016/j.neuropsychologia.2014.08.0200028-3932/& 2014 Elsevier Ltd. All rights reserved.
n Corresponding author at: Department of Psychological Sciences, University ofMissouri-Columbia, 9J McAlester Hall, Columbia, MO 65211-2500, United States.Tel.: þ1 573 882 8123.
E-mail address: [email protected] (D.J. Peterson).
Neuropsychologia 63 (2014) 145–153

delay-period of VWM tasks (fMRI: Magen, Emmanouil, McMains,Kastner, & Treisman, 2009; Todd & Marois, 2004; Xu & Chun,2006); event-related potentials (ERP: Vogel & Machizawa, 2004;Vogel, McCollough, & Machizawa, 2005). Moreover, in regions suchas the intraparietal sulcus, the magnitude of the delay-periodactivity increases parametrically with set size (Todd & Marois,2004; Xu & Chun, 2006) and asymptotes at an individual's VWMcapacity limit (Todd & Marois, 2005). Similarly, ERP studiesderiving the contralateral delay activity (CDA) from posteriorelectrode sites show sustained maintenance-phase activity thatparametrically varies in amplitude with set size and asymptotesas capacity limits are reached (Vogel & Machizawa, 2004).These converging patterns of evidence are consistent with neuralmodels of VWM that emphasize the importance of sustainedmaintenance-related patterns of elevated activity within posteriorparietal cortex (PPC) and PFC regions. Moreover, these perspec-tives implicitly and explicitly suggest that the VWM capacitylimitation arises due to these maintenance-phase processes.
An alternative view of VWM is sometimes termed the sensory-recruitment model of VWM (Awh & Jonides, 2001; D’Esposito,2007; Postle, 2006). This view is derived from a recent wealth ofevidence that cortical regions involved during perception arereactivated to aid in the storage and retrieval of stimuli encodedinto VWM (e.g., (Albers, Kok, Toni, Dijkerman, & de Lange, 2013;Ester, Serences, & Awh, 2009; Emrich, Riggall, LaRocque, & Postle,2013; Ester, Anderson, Serences, & Awh, 2013; Harrison & Tong,2009; Serences, Ester, Vogel, & Awh, 2009). To examine thesensory-recruitment perspective, recent fMRI experiments haveleveraged univariate and multivariate (multivoxel pattern analysis,MVPA) techniques to measure BOLD responses and decode sub-threshold activation patterns to improve our understanding of themechanisms underlying VWM. Even in the absence of sustained,elevated patterns of maintenance-related activity in visual cortex(e.g., V1–V4, hMTþ), decoding procedures reveal that the samesensory regions (e.g., V1–V4, hMTþ) that are initially engaged instimulus perception are involved in storing representations ofthose task relevant features during the delay-period of VWM tasks(Ester et al., 2009; Emrich et al., 2013; Ester et al., 2013; Harrison &Tong, 2009; Offen, Schuppeck, & Heeger, 2009; Riggall & Postle,2012; Serences et al., 2009). In addition to the role of early visualregions, intermediate dorsal (V3a/b) and ventral (LO1/2) visualareas become significantly more active when engaged in effortfulVWM encoding (Sneve, Alnaes, Endestad, Greenlee, & Magnussen,2012). Thus, according to this view, limitations in VWM capacitymay arise due to the inability to reactivate and maintain theperceptual representations of the multiple items present in thestimulus display. Experiments examining the sensory-recruitmentmodel largely focus on the maintenance phase of VWM tasks.However, to maintain a representation of a stimulus in VWM itmust first be encoded. As such, capacity limitations that ariseduring encoding may become apparent during the maintenancephase and contribute in general to the overall capacity limitationof VWM.
Several studies have examined the correspondence betweenencoding and maintenance related VWM activity within bothvisual cortex and higher-order regions of the brain. Successfulencoding and maintenance of visual information relies on intra-cortical communication (e.g., Fuster, Bauer, & Jervey, 1985;Gazzaley, Rissman, & D’Esposito, 2004; McIntosh, Grady, Haxby,Ungerleider, & Horwitz, 1996). Recent fMRI evidence shows thatgreater correspondence in neural activity between encoding andmaintenance processes in cortical regions (e.g., lateral PFC) isassociated with successful VWM performance (Cohen,Sreenivasan, & D’Esposito, 2012). Importantly, enhanced functionalconnectivity between the lateral PFC and extrastriate cortex (EC)during VWM encoding and maintenance is associated with
successful VWM performance (Cohen et al., 2012). These findingsfurther stress the importance of accurate perceptual representa-tions and successful encoding of the items to be maintained in andretrieved from VWM. Any limitation in the capacity to representand encode the to-be-retrieved items will necessarily contribute tothe overall capacity limitation of VWM.
In the current investigation of VWM, we were concerned withthe fundamental question of why certain stimulus items areselected and subsequently retrieved from VWM while others areforgotten. This selection process must begin during encoding andimpose a fundamental limitation in our ability to subsequentlymaintain and successfully retrieve information from VWM. Theexperiment described below reveals that neural processing asso-ciated with the encoding of a specific item in a VWM display canindeed influence whether or not that item will be subsequentlyretrieved. Moreover, the experiment tests two alternative hypoth-eses for how and why some items are successfully encoded whileothers may not be (Fig. 1A). First, participants may deliberatelyattempt to encode only a subset of items in a given memory array.This could happen, for example, if participants selectively allocateattentional resources to a subset of items in the display. We termthis the focused-resource hypothesis. It predicts that if one of theitems from the encoded subset is later probed, attempts atretrieval will be successful, but if the probed item was not in thesubset at encoding, a retrieval failure will occur. The intuitionbehind this hypothesis is similar to the notion that providing apredictive attentional pre-cue would facilitate the VWM encoding,maintenance, and retrieval of the cued item. In this case, one maypredict that neural signatures at the time of encoding of probeditems successfully retrieved from working memory will be greaterthan those that are forgotten. In contrast, neural signatures ofunprobed items would be expected to be greater on trials in whichthe probed item was forgotten than when it was successfullyretrieved (Fig. 1A).
Alternatively, it may be the case that observers attempt toencode all of the items in a VWM display, but on a trial-by-trialbasis they will not always succeed. This diffuse-resource hypothesisproposes that participants try to encode all items, but sometimes,due to distraction, lower motivation, or fluctuation in the overallamount of available attentional resources on a given trial, VWMperformance suffers. According to this hypothesis, neural signals ofboth probed and unprobed items should be greater when theprobed item is subsequently remembered than when it is for-gotten (Fig. 1B).
We investigated these hypotheses using the steady-state visualevoked potential (SSVEP: Regan, 1989). The SSVEP is an electro-physiological signal derived from the EEG in response totemporally-periodic stimuli (i.e., stimuli flickering at a specificrate). In research investigating human cognition (e.g., visualattention), the SSVEP has been most commonly considered inthe frequency domain and is used specifically when analyzingsignal power in the EEG at frequencies associated with the flickerrates of experimental stimuli (Appelbaum & Norcia, 2009; Hillyardet al. 1997; Morgan, Hansen, & Hillyard, 1996; Muller et al. 1998;Muller & Hubner, 2002). One simple way to conceptualize theSSVEP is that a flickering stimulus will produce an EEG signal withincreased power at the flicker frequency and/or one of itsharmonics.
In the current experiment, we investigated the hypothesesdescribed above by examining SSVEPs in response to the itemspresent at the encoding phase of a VWM change detection task.This was accomplished by having the to-be-remembered itemsflicker at unique frequencies (3 Hz, 5 Hz, 12 Hz, 20 Hz). Thisallowed us to examine power in the SSVEP at frequencies corre-sponding to each item (1f1¼3 Hz; 1f2¼5 Hz, 1f3¼12 Hz,1f4¼20 Hz) and their second harmonics (2f1¼6 Hz, 2f2¼10 Hz,
D.J. Peterson et al. / Neuropsychologia 63 (2014) 145–153146

2f3¼24 Hz, 2f4¼40 Hz) independently (e.g., see Fig. 2) and sort thedata according to whether a given stimulus was later probed orunprobed and whether or not the probed item was successfullyretrieved from VWM. As described above, the hypotheses dis-cussed above make specific predictions about how the SSVEP mayreflect neural processes and their capacity limitations, operating atthe encoding stage of VWM. In the following sections, we describethis novel approach for studying encoding in detail and interpretthe findings in terms of the role that perceptual and cognitiveprocesses (e.g., attention) may play in determining which itemsare successfully encoded into VWM.
2. Materials and methods
2.1. Participants
Twenty-three, right-handed, neurologically normal adults with normal orcorrected-to-normal visual acuity participated in the current experiment (14female, mean age: 24). The Institutional Review Board at the University of Nevada,Reno approved all experimental protocols and participants provided writteninformed consent.
2.2. Stimulus presentation
Stimuli were displayed on a 120-Hz CRT monitor (Dell Trinitron P991, 19 in.,1024�768) running via a 2.6 MHz MacMini and were presented using thePsychophysics Toolbox (Brainard, 1997; Pelli, 1997) for MATLAB (MathWorks Inc.,Natick, MA). Each participant viewed the stimuli from a distance of 57 cm.
2.3. Electrophysiological recordings
The electroencephalogram (EEG) was collected from seven sites: O1, O2, Oz, P1,P2, C1, C2 (referenced to Fz, grounded to the forehead) according to the standard 10/20 electrode system (Jasper, 1958; Klem, Luders, Jasper, & Elger, 1999) using GrassInstrumentss Ag/Ag electrodes. Electrode impedance was kept below 5 kΩ at 30 Hz.The EEG was amplified using an SA Instrumentss Bio Amplifier with a gain factor of50 K and bandpass analog filter of 0.3–500 Hz. The amplified signal was digitized
using an eight channel Swissonic AD24 24-bit analog to digital converter with asampling rate of 48 kHz per channel. The digital data were recorded using theAudacitys software package running on a 2.6 MHz MacMini workstation. A photo-diode was attached to the CRT monitor and used to temporally synchronize thestimulus presentation onset with the recorded EEG. Photodiode output wasamplified using a transimpedance amplifier and digitized with the EEG data viaone channel of the AD converter.
2.4. Experimental procedure
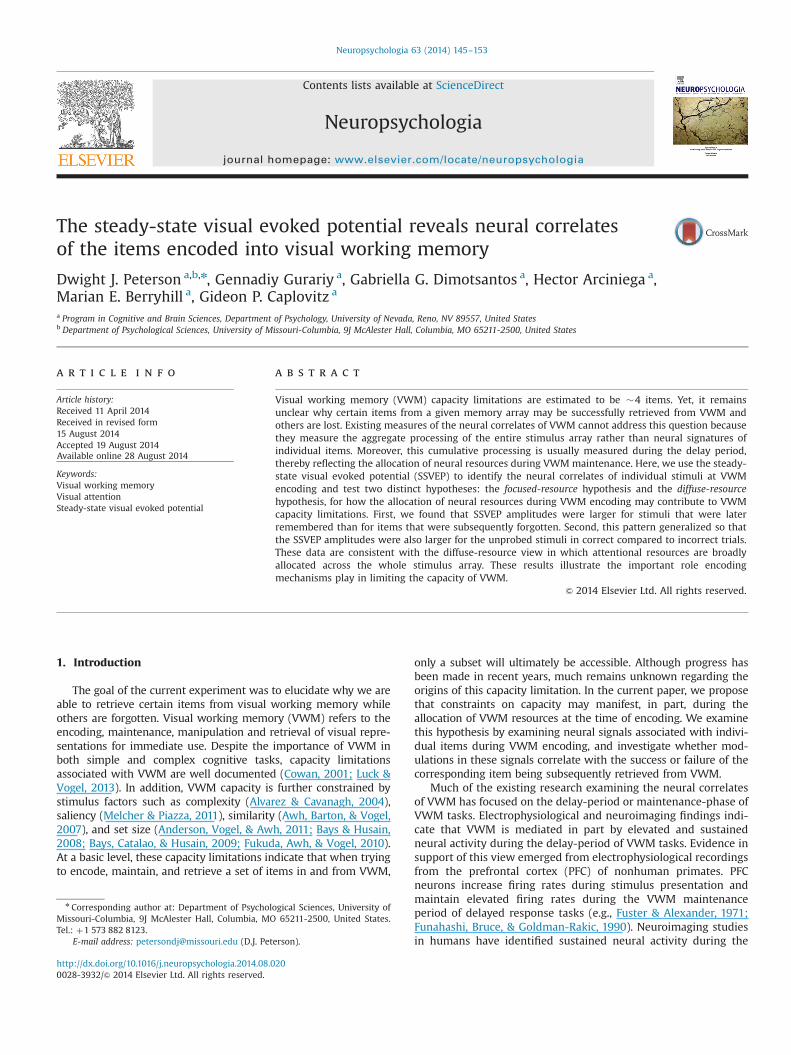
Participants performed a VWM change detection task with a set size of fouritems, see Fig. 3. Trials began with a black central fixation point (0.351�0.351) on aneutral gray background (500 ms). Next, four shapes (randomly selected withoutreplacement from a set of ten) were presented (1000 ms). Stimuli were bilaterallysymmetrical abstract shapes (71�71) generated by a computer algorithm describedpreviously (e.g., (Berryhill & Olson, 2008; Jiang, Olson, & Chun, 2000). Each shapereversed contrast (black, white) at one of four distinct temporal frequencies: 3 Hz,5 Hz, 12 Hz, and 20 Hz. Thus, a shape flickering at 20 Hz would reverse contrast
Fig. 2. Fundamental and second harmonic frequencies of interest. Fundamental(red) and second harmonic frequencies (green) of interest that were detectablefrom the SSVEP in the current experiment. The y-axis depicts the amplitude scale(microvolts) of the SSVEP. The x-axis depicts a subset of the fundamental andsecond harmonic frequencies (Hz) that were detectable from the SSVEP. (Forinterpretation of the references to color in this figure legend, the reader is referredto the web version of this article.)
Fig. 1. Hypotheses related to the deployment of VWM resources during encoding. Schematic depictions of our predictions regarding two possible routes for the deploymentof neural resources during VWM encoding. (A) According to the focused-resource hypothesis, encoding resources are deployed to a subset of the items within the memoryarray. (B) In contrast, the diffuse-resource hypothesis predicts that VWM resources are distributed across all of the items in the array during encoding. Each of thesehypotheses predicts a different pattern of encoding-related neural activity during correct compared to incorrect trials for both the probed and unprobed items within thememory array.
D.J. Peterson et al. / Neuropsychologia 63 (2014) 145–153 147
every 25 ms. Each shape was presented within one of the four quadrants of thevisual field. The locations of stimuli within each quadrant were randomlydetermined (potential jitter of 1–31 from each quadrant center). Stimulus flickerfrequencies and shapes were randomized with respect to stimulus location. Inother words, any shape could have been presented in any of the four quadrants andcould have flickered at any of the four stimulus frequencies on any given trial.
Frequencies of 3 Hz, 5 Hz, 12 Hz, and 20 Hz were chosen because stimulusduration (1000 ms) allowed for exact periods of stimulation using a 120 Hz framerefresh rate on the CRT monitor. In addition, this approach allowed linearlyindependent frequencies for each stimulus to be recorded up to and includingthe 3rd harmonic of each fundamental frequency. Stimulus offset was followed by aVWM delay period (1000 ms). At test, a single, static probe image appeared at apreviously occupied location. Participants responded using their right ring finger topress the “o” key if the item in the probed location was old or their right indexfinger to press the “n” key if the item was new. For old trials (50% of trials), theshape presented in the probed location did not change from sample to test. For newtrials (50% of trials), the shape presented in the probed location changed fromsample to test. Finally, participants made confidence judgments regarding theirresponse using a Likert-type scale ranging from 1 (low confidence) to 6 (highconfidence). A blank inter-stimulus interval varying in duration (1000–1500 ms)followed each confidence judgment. Participants were instructed to maintaincentral fixation throughout the trial with explicit instruction to not blink or breakfixation while stimuli were on the screen (i.e., the encoding phase).
Prior to the experiment, participants completed 20 practice trials to familiarizethemselves with the change detection task. Each participant completed theexperiment in 10 separate blocks consisting of 40 trials per block for a total of400 randomized trials such that an equal number of probed locations correspondedto each stimulus flicker rate (i.e., the location of the 20 Hz stimulus was probed 100total times: 50 on new trials and 50 on old trials). At the end of each block,participants were prompted to take a break, prior to continuing on to the nextblock of trials.
2.5. Electrophysiological data processing and analysis
The digitized EEG data for all 23 participants were processed and analyzedusing custom scripts written in MATLAB. Data from each channel were firstdownsampled from 48 kHz to 1000 Hz. Four hundred epochs, time-locked to theonset of the stimulus array (1000 ms in duration), were extracted from theunfiltered, continuous EEG. A Fourier transform was then applied to each epochso that the SSVEP amplitudes of the fundamental and second order harmonicfrequencies, corresponding to each item in the memory array, could be measured;see Fig. 3. Individual trials were then sorted according to trial accuracy and theflicker frequency of the to-be-probed item (3 Hz-correct, 3 Hz-incorrect, 5 Hz-correct, 5 Hz-incorrect, 12 Hz-correct, 12 Hz-incorrect, 20 Hz-correct, 20 Hz-incor-rect). Event-related averages and amplitude spectra were computed for eachcondition.
Given the relatively high VWM accuracy across participants (M¼0.78), therewere many more correct than incorrect trials. To ensure fair comparisons using anequal number of epochs, average responses were computed on the basis of thesmaller number of incorrect responses. This was done independently for eachparticipant and each frequency through permutation analysis. A random subset ofcorrect trials was selected that equaled the number of incorrect trials (e.g., if therewere only 30 incorrect and 70 correct trials in the 3 Hz condition, 30 of the 70 werepicked during each permutation). The amplitude spectrum was then computedbased on this average. To avoid the random selection of an outlier subset of trials,this permutation test process was repeated 100,000 times.
For each condition the amplitudes of the fundamental frequencies “1f” (i.e., 3, 5,12, 20 Hz) and second harmonics “2f” (i.e., 6, 10, 24, 40 Hz) were extracted from theamplitude spectrum. For example, for correct and incorrect trials in which theprobed item initially flickered at 3 Hz during encoding, the 3 Hz (1f1) and 6 Hz (2f1)amplitudes were used to index neural activity related to the encoding of the probeditem. The amplitudes of the “unprobed” frequencies 5 Hz, 12 Hz, 20 Hz (1f2, 1f3, 1f4)and their second harmonics (2f2, 2f3, 2f4) were used to index neural activity relatedto the encoding of the unprobed items. Given that the power of the SSVEP signaldecreases at higher frequencies (e.g., 20 Hz compared to 3 Hz), for each conditionwe normalized the SSVEP amplitudes across our stimulus frequencies of interest forcorrect and incorrect trials and averaged across the four frequencies for both thefundamental (1f) and second harmonic (2f) frequency using the formulas:
Correct1f probed ¼14∑4
i ¼ 1
1f iprobedcorrect1f iprobedcorrect þ1f iprobedincorrect
Incorrect1f probed ¼14∑4
i ¼ 1
1f iprobedincorrect1f iprobedcorrect þ1f iprobedincorrect
Correct2f probed ¼14∑4
i ¼ 1
2f iprobedcorrect2f iprobedcorrect þ2f iprobedincorrect
Incorrect2f probed ¼14∑4
i ¼ 1
2f iprobedincorrect2f iprobedcorrect þ2f iprobedincorrect
We used the same basic formulas to compute normalized SSVEP amplitudes forthe unprobed items. However, for each frequency of the probed item, there arethree corresponding unprobed frequencies. Thus, the normalized SSVEP amplitudesfor the corresponding unprobed items were based on the average amplitudes ofthese three remaining unprobed frequencies. For example, on trials in which the3 Hz item was later probed, the stimuli that flickered at 5 Hz, 12 Hz, and 20 Hzwould be considered “unprobed” items, thus:
Correct1f unprobed ¼14∑4
i ¼ 1
1f iunprobedcorrect1f iunprobedcorrect þ1f iunprobedincorrect
Incorrect1f unprobed ¼14∑4
i ¼ 1
1f iunprobedincorrect1f iunprobedcorrect þ1f iunprobedincorrect
Correct2f unprobed ¼14∑4
i ¼ 1
2f iunprobedcorrect2f iunprobedcorrect þ2f iunprobedincorrect
Incorrect2f unprobed ¼14∑4
i ¼ 1
2f iunprobedincorrect2f iunprobedcorrect þ2f iunprobedincorrect
where
1f iunprobed ¼13
∑j ¼ f1 2 3 4g\i
1f j
2f iunprobed ¼13
∑j ¼ f1 2 3 4g\i
2f j
As such, for each participant, 28 values were computed for the fundamentalfrequency and second harmonic: 2 accuracy: correct and incorrect; �2 probestatus: probed and unprobed; �7 electrode: O1, O2, Oz, P1, P2, C1, C2.
Fig. 3. Visual working memory task and data processing sequence. The visualworking memory change-detection task and data processing sequence for each trialused in the current experiment. Participants viewed a fixation cross (500 ms),followed by a memory array (1000 ms) in which each item flickered at a distinctfrequency (3 Hz, 5 Hz, 12 Hz, and 20 Hz). Following stimulus presentation, a delayperiod occurred. Finally, a single static probe stimulus appeared in one of thepreviously presented locations and remained until the participant decided whetherit matched the stimulus shape presented in that location in the memory array bypressing the “o” (old) or “n” (new) key. Participants rated their confidence in theirdecision on each trial using a Likert-type scale ranging from 1 (low confidence) to 6(high confidence). Epochs time-locked to the onset of the stimulus array (1000 msin duration), were extracted from the unfiltered, continuous EEG. A Fouriertransform was then applied to each epoch such that the SSVEP amplitudes of thefundamental (red) and second order harmonic (green) frequencies, correspondingto each item in the memory array (probed: solid lines; unprobed: dashed lines),could be measured. A 3-Hz correct trial in which the probed stimulus, previouslyflickering at 3-Hz during encoding, changed shape from sample to test and theparticipant responded “new” is depicted. (For interpretation of the references tocolor in this figure legend, the reader is referred to the web version of this article.)
D.J. Peterson et al. / Neuropsychologia 63 (2014) 145–153148
3. Results
3.1. Behavioral accuracy
First, we tested whether flicker frequency influenced perfor-mance. The mean accuracy (proportion of correct trials) across allparticipants collapsed across the four frequencies was M¼0.78.Performance did not significantly vary as a function of probedfrequency (Means: 3 Hz: 0.78; 5 Hz: 0.81; 12 Hz: 0.77; 20 Hz:0.78), single factor repeated-measures ANOVA (F(3,66)¼2.48,p¼0.07). Unfortunately, because there were too few low confi-dence trials per frequency we were unable to conduct analysesincorporating confidence judgments.
3.2. SSVEP amplitude as a function of VWM accuracy and probestatus
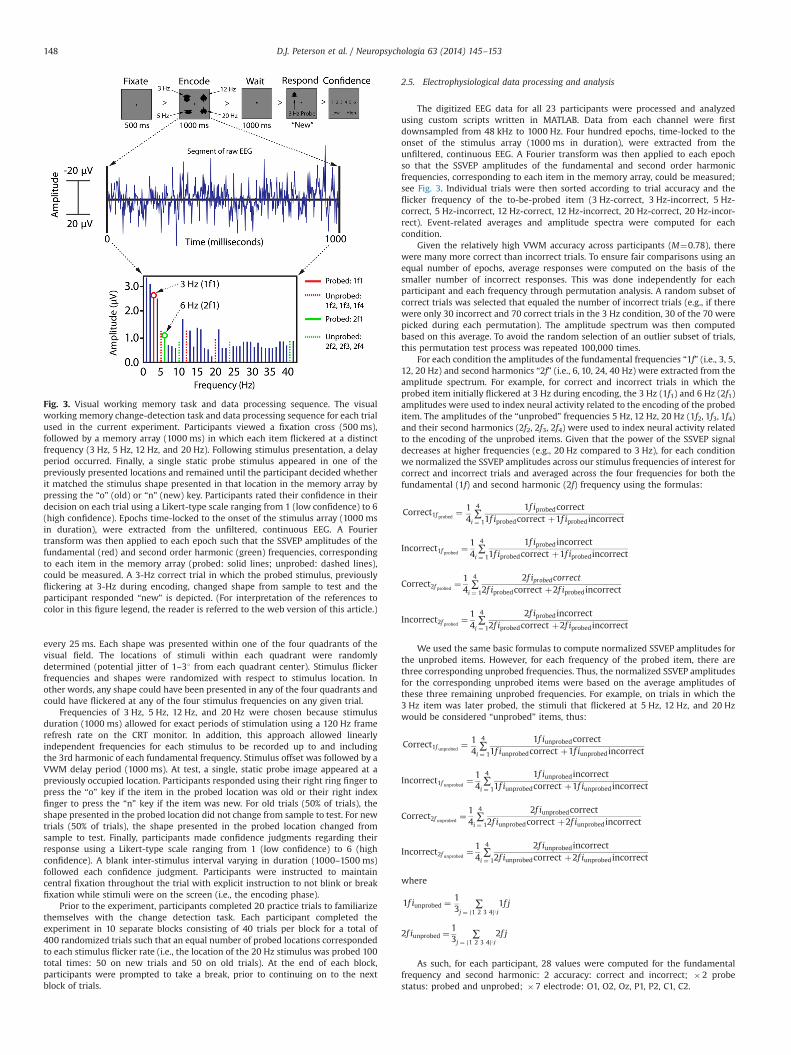
Across all electrodes the mean normalized SSVEP amplitudevalues (see Table 1 and Fig. 4) corresponding to the fundamental
frequency (e.g., 3 Hz, 5 Hz, 12 Hz, 20 Hz) of the probed items werelarger for correct compared to incorrect trials. This was true forboth probed and unprobed items. The statistical significance ofthese results was analyzed with a 2�2�7 repeated measuresANOVA including the factors of accuracy (correct and incorrect),probe status (probed and unprobed), and electrode site (O1, O2,Oz, P1, P2, C1, C2). The main effect of accuracy approachedsignificance (F(1,22)¼3.99, MSE¼0.13, p¼0.058, ηp2¼0.15); how-ever, no other main effects or interactions between any of thethree factors included in the ANOVAwere significant. We note thatthe formula used to normalize the SSVEP amplitudes acrossfrequency precludes analysis of the main effect of probe statusor the interaction between electrode and probe status.
The analysis of the SSVEP amplitudes corresponding to thesecond harmonic (e.g., 6 Hz, 10 Hz, 24 Hz, 40 Hz) revealed thesame general pattern just described, but to a greater degree; seeTable 2 and Fig. 5. Again, across all electrodes the mean normal-ized SSVEP amplitudes were greater for the correct than incorrecttrials. This was the case for both the probed and unprobed items.
Table 1Mean normalized SSVEP amplitudes by accuracy and probe type (1f).
Electrode Correctprobed
Incorrectprobed
Correctunprobed
Incorrectunprobed
O1 0.51 (0.01) 0.49 (0.01) 0.51 (0.007) 0.49 (0.007)O2 0.51 (0.01) 0.49 (0.01) 0.50 (0.006) 0.50 (0.006)Oz 0.51 (0.01) 0.49 (0.01) 0.51 (0.007) 0.49 (0.007)P1 0.52 (0.02) 0.48 (0.02) 0.51 (0.008) 0.49 (0.008)P2 0.52 (0.02) 0.48 (0.02) 0.51 (0.007) 0.49 (0.007)C1 0.54 (0.02) 0.46 (0.02) 0.52 (0.01) 0.48 (0.01)C2 0.53 (0.02) 0.47 (0.02) 0.51 (0.009) 0.49 (0.009)
Fig. 4. SSVEP amplitudes as a function of accuracy and probe status at each electrode. SSVEP amplitudes for the fundamental frequencies (1f) computed from the steady-state visual evoked potentials corresponding to electrode sites O1, O2, Oz, P1, P2, C1, and C2. The y-axes indicate the mean normalized SSVEP amplitudes for the fundamentalfrequencies (1f). Error bars represent the standard errors of the means.
Table 2Mean normalized SSVEP amplitudes by accuracy and probe type (2f).
Electrode Correctprobed
Incorrectprobed
Correctunprobed
Incorrectunprobed
O1 0.53 (0.02) 0.47 (0.02) 0.51 (0.009) 0.49 (0.009)O2 0.52 (0.01) 0.48 (0.01) 0.51 (0.009) 0.49 (0.009)Oz 0.53 (0.01) 0.47 (0.01) 0.51 (0.01) 0.49 (0.01)P1 0.53 (0.02) 0.47 (0.02) 0.52 (0.01) 0.48 (0.01)P2 0.52 (0.02) 0.48 (0.02) 0.51 (0.009) 0.49 (0.009)C1 0.53 (0.01) 0.47 (0.01) 0.52 (0.009) 0.48 (0.009)C2 0.54 (0.02) 0.46 (0.02) 0.52 (0.009) 0.48 (0.009)
D.J. Peterson et al. / Neuropsychologia 63 (2014) 145–153 149
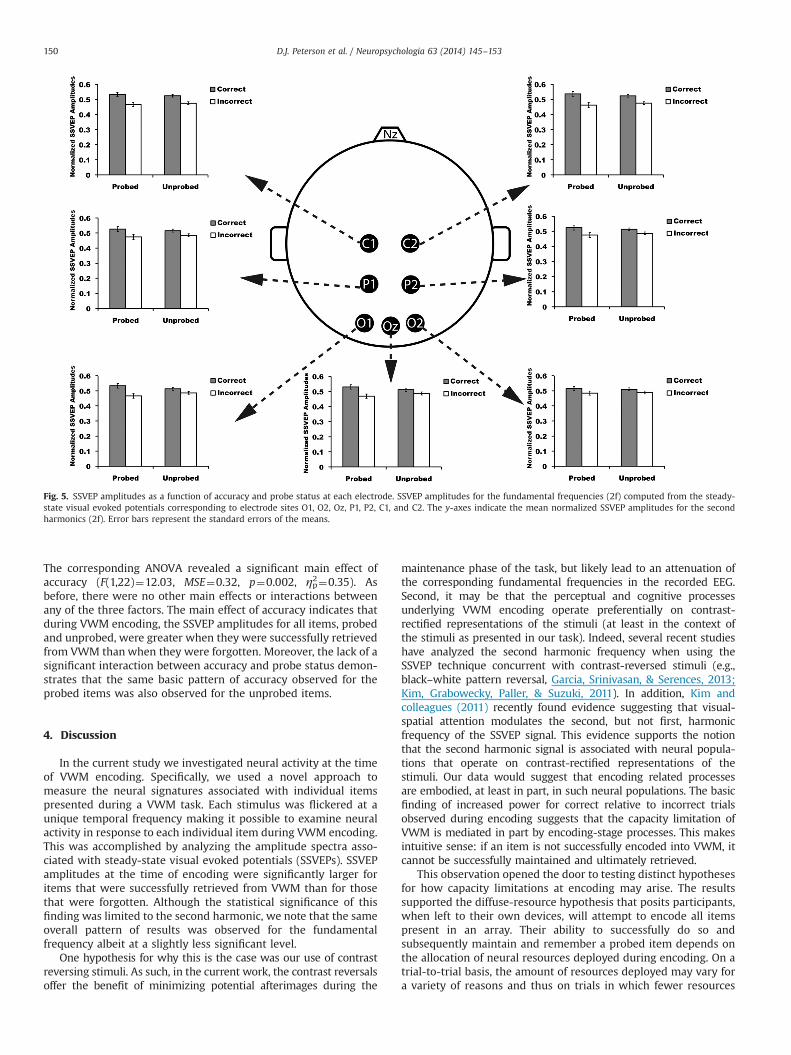
The corresponding ANOVA revealed a significant main effect ofaccuracy (F(1,22)¼12.03, MSE¼0.32, p¼0.002, ηp2¼0.35). Asbefore, there were no other main effects or interactions betweenany of the three factors. The main effect of accuracy indicates thatduring VWM encoding, the SSVEP amplitudes for all items, probedand unprobed, were greater when they were successfully retrievedfrom VWM than when they were forgotten. Moreover, the lack of asignificant interaction between accuracy and probe status demon-strates that the same basic pattern of accuracy observed for theprobed items was also observed for the unprobed items.
4. Discussion
In the current study we investigated neural activity at the timeof VWM encoding. Specifically, we used a novel approach tomeasure the neural signatures associated with individual itemspresented during a VWM task. Each stimulus was flickered at aunique temporal frequency making it possible to examine neuralactivity in response to each individual item during VWM encoding.This was accomplished by analyzing the amplitude spectra asso-ciated with steady-state visual evoked potentials (SSVEPs). SSVEPamplitudes at the time of encoding were significantly larger foritems that were successfully retrieved from VWM than for thosethat were forgotten. Although the statistical significance of thisfinding was limited to the second harmonic, we note that the sameoverall pattern of results was observed for the fundamentalfrequency albeit at a slightly less significant level.
One hypothesis for why this is the case was our use of contrastreversing stimuli. As such, in the current work, the contrast reversalsoffer the benefit of minimizing potential afterimages during the
maintenance phase of the task, but likely lead to an attenuation ofthe corresponding fundamental frequencies in the recorded EEG.Second, it may be that the perceptual and cognitive processesunderlying VWM encoding operate preferentially on contrast-rectified representations of the stimuli (at least in the context ofthe stimuli as presented in our task). Indeed, several recent studieshave analyzed the second harmonic frequency when using theSSVEP technique concurrent with contrast-reversed stimuli (e.g.,black–white pattern reversal, Garcia, Srinivasan, & Serences, 2013;Kim, Grabowecky, Paller, & Suzuki, 2011). In addition, Kim andcolleagues (2011) recently found evidence suggesting that visual-spatial attention modulates the second, but not first, harmonicfrequency of the SSVEP signal. This evidence supports the notionthat the second harmonic signal is associated with neural popula-tions that operate on contrast-rectified representations of thestimuli. Our data would suggest that encoding related processesare embodied, at least in part, in such neural populations. The basicfinding of increased power for correct relative to incorrect trialsobserved during encoding suggests that the capacity limitation ofVWM is mediated in part by encoding-stage processes. This makesintuitive sense: if an item is not successfully encoded into VWM, itcannot be successfully maintained and ultimately retrieved.
This observation opened the door to testing distinct hypothesesfor how capacity limitations at encoding may arise. The resultssupported the diffuse-resource hypothesis that posits participants,when left to their own devices, will attempt to encode all itemspresent in an array. Their ability to successfully do so andsubsequently maintain and remember a probed item depends onthe allocation of neural resources deployed during encoding. On atrial-to-trial basis, the amount of resources deployed may vary fora variety of reasons and thus on trials in which fewer resources
Fig. 5. SSVEP amplitudes as a function of accuracy and probe status at each electrode. SSVEP amplitudes for the fundamental frequencies (2f) computed from the steady-state visual evoked potentials corresponding to electrode sites O1, O2, Oz, P1, P2, C1, and C2. The y-axes indicate the mean normalized SSVEP amplitudes for the secondharmonics (2f). Error bars represent the standard errors of the means.
D.J. Peterson et al. / Neuropsychologia 63 (2014) 145–153150
were deployed, the participant will be less likely to successfullyencode the items in the array. The diffuse-resource hypothesis isconsistent with recent behavioral reports of so-called full andpartial “lapses” (Mance, Adam, Fukuda, & Vogel, 2014). Full andpartial lapses are revealed in full report recall paradigms anddescribe trials in which participants fail to retrieve any of theitems from VWM. These lapses can account for individual differ-ences in overall VWM capacity. Our data would suggest that theselapses might be occurring at the time of encoding rather than laterphases of the VWM process; however, future SSVEP studies willneed to use a recall paradigm to confirm that this is the case.
Intriguingly, these accuracy dependent modulations of theevoked potential are not readily observable in the time-domain,with correct and incorrect trials producing nearly identical onsetVEPs. Moreover, the same overall pattern of results was obtainedwhen the frequency domain analysis was restricted to the final750 ms of the encoding period, omitting any contribution from thetransient onset of the stimulus array (see Supplemental material).Indeed, when limited to the final 750 ms, the main effect ofaccuracy was statistically significant even for the fundamentalfrequencies. This suggests that the relatively low frequency powerof the onset VEP may have been obscuring accuracy modulationsat the fundamental frequencies in the full 1000 ms analysisdescribed above. These additional observations suggest our resultsrepresent an index of ongoing encoding related processes thatoperate while the stimuli are on the screen and are not represen-tative of a pre-stimulus state of the observer (i.e., generalizedreadiness or arousal).
We note that SSVEPs have been used in previous studies toprobe VWM (Ellis, Silberstein, & Nathan, 2006; Perlstein et al.2003; Silberstein, Nunez, Pipingas, Harris, & Danieli, 2001).In these studies participants performed VWM tasks while a task-irrelevant background stimulus was flickered at a single frequency.This flickering stimulus elicits the SSVEP, the amplitude of whichduring the maintenance-phase of a VWM task is modulated as afunction of VWM load. Similar to those presented here, these pastfindings demonstrate the effectiveness of using the SSVEP to indexthe capacity limitation of VWM.
However, the approach we employed here differs from thesepast SSVEP investigations of VWM in several important respects.First and foremost, the SSVEPs presented here were elicited byindividual items in the VWM displays rather than by a task-irrelevant stimulus. This is important because it allowed us toexamine the unique SSVEP produced in response to each indivi-dual item, rather than an indirect measure of the aggregateprocessing of the entire memory array. In doing so, we were notonly able to examine modulations in the SSVEP as a function ofcorrect and incorrect trials, but to do so for both probed andunprobed items. Second, we examined the SSVEP amplitudescorresponding to the presentation of each individual item duringthe encoding period of a VWM task. Examining SSVEPs or anyneuronally correlated activity during maintenance is no doubtimportant for examining the overall capacity limitation of VWM.However, the data presented here suggest that observations ofcapacity limitations observed during the maintenance phase maybe in part manifestations of failures that originate during encod-ing. Future work will obviously be necessary to fully characterizeand dissociate sources of capacity limitations that arise during thedistinct stages of VWM.
Thus far we have discussed the results in terms of the deploy-ment of neural resources at the time of encoding without beingspecific as to what these neural resources might represent.Although the present data do not allow us to provide an empiri-cally derived answer to this question, the most likely case is thatthese neural resources represent visual attention. Attention plays acritical role in the selection of items during VWM encoding
(Caplovitz, Fendrich, & Hughes, 2008; Hughes, Caplovitz, Loucks,& Fendrich, 2012; O’Regan, Deubel, Clark, & Rensink, 2000;Rensink, O’Regan, & Clark, 1997; Simons & Levin, 1997). In addi-tion, attention enhances change detection (Hollingworth, 2004;Irwin & Zelinsky, 2002; Rensink et al., 1997; Scholl, 2000; Wolfe,Reinecke, & Brawn, 2006). Moreover, many studies have demon-strated that the amplitude of visual evoked potentials and SSVEPwaveforms can be modulated by attention (Anllo-Vento & Hillyard,1996; Appelbaum, Wade, Pettet, Vildavski and Norcia, 2008;Appelbaum & Norcia, 2009; Hillyard et al., 1997; Mangun, 1995;Morgan et al., 1996; Müller & Hillyard, 2000). Importantly, withinthe VWM literature, several experiments have directly examinedthe influence of attention during VWM encoding (for recentreviews see Gazzaley (2011) and Gazzaley and Nobre (2012)).Findings from several recent experiments indicate that selectivelyattending to task relevant information during encoding modulatesthe amplitude of various ERP components and is predictive ofsubsequent success when retrieving representations from VWM(Murray, Nobre, & Stokes, 2011; Rutman, Clapp, Chadick, &Gazzaley, 2010; Zanto & Gazzaley, 2009). These studies highlightthe importance of directing attention to task relevant informationduring VWM encoding to facilitate successful VWM performance.
Although factors such as explicit attentional guidance, cognitivestrategy, or bottom-up saliency could influence how participantsallocate their attention during encoding, we did not explicitly directattention to any particular item or location within the stimulusdisplays. The locations and frequencies of the probed items werealso randomized across trials. Under these circumstances, it isreasonable that participants may have adopted a diffuse-resourceapproach to VWM encoding. This strategy may change as a functionof task demands. For example, future experiments explicitly provid-ing spatial cues might expect to observe higher SSVEP amplitudesfor the item in the cued location compared to other items. Thispattern of evidence would be consistent with the predictions of thefocused-resource hypothesis. The novel SSVEP approach used in thecurrent experiment would be ideal for future investigations thatinvolve explicitly guiding attention toward task relevant features,objects, or locations.
In summary, by examining SSVEPs we are able to infer thatwhen individuals are presented with a set of items in a VWM task,they will likely attempt to encode all of the items and not just aselect subset. The ability to do so will depend on the amount ofneural resources (i.e., attention) that are deployed at the time ofencoding. If insufficient resources are allocated, then a probeditem will be more likely to be forgotten than remembered. Thesefindings highlight the important role encoding processes play inmediating the overall capacity limitation of VWM.
Acknowledgments
The authors declare no competing financial interests. This workwas funded by NEI R15EY022775 to M.E.B. and G.P.C., NIGMS1P20GM103650-01 to Michael Webster (PI), M.E.B. and G.P.C.(project leaders), and generous startup funds provided by theUniversity of Nevada. The content is solely the responsibility of theauthors and does not necessarily represent the official views of theNIH, NIGMS or NEI. We would like to thank Dr. Don L. Jewett forhis generous support of this project.
Appendix A. Supplementary material
Supplementary data associated with this article can be found inthe online version at http://dx.doi.org/10.1016/j.neuropsychologia.2014.08.020.
D.J. Peterson et al. / Neuropsychologia 63 (2014) 145–153 151

References
Albers, A. M., Kok, P., Toni, I., Dijkerman, H. C., & de Lange, F. P. (2013). Sharedrepresentations for working memory and mental imagery in early visual cortex.Current Biology, 23(15), 1427–1431.
Alvarez, G. A., & Cavanagh, P. (2004). The capacity of visual short-term memory isset both by visual information load and by number of objects. PsychologicalScience, 15(2), 106–111.
Anderson, D. E., Vogel, E. K., & Awh, E. (2011). Precision in visual working memoryreaches a stable plateau when individual item limits are exceeded. Journal ofNeuroscience, 31(3), 1128–1138.
Anllo-Vento, L., & Hillyard, S. A. (1996). Selective attention to the color and directionof moving stimuli: electrophysiological correlates of hierarchical feature selec-tion. Perception and Psychophysics, 58(2), 191–206.
Appelbaum, L. G., & Norcia, A. M. (2009). Attentive and pre-attentive aspects offigural processing. Journal of Vision, 9(11), 1–12.
Appelbaum, L. G., Wade, A. R., Pettet, M. W., Vildavski, V. Y., & Norcia, A. M. (2008).Figure-ground interactions in the human visual cortex. Journal of Vision, 8(9),1–19.
Awh, E., Barton, B., & Vogel, E. K. (2007). Visual working memory represents a fixednumber of items regardless of complexity. Psychological Science, 18(7),622–628.
Awh, E., & Jonides, J. (2001). Overlapping mechanisms of attention and spatialworking memory. Trends in Cognitive Sciences, 5(3), 119–126.
Bays, P. M., Catalao, R. F., & Husain, M. (2009). The precision of visual workingmemory is set by allocation of a shared resource. Journal of Vision, 9(10), 7 1–11.
Bays, P. M., & Husain, M. (2008). Dynamic shifts of limited working memoryresources in human vision. Science, 321(5890), 851–854.
Berryhill, M. E., & Olson, I. R. (2008). Is the posterior parietal lobe involved inworking memory retrieval? Evidence from patients with bilateral parietal lobedamage. Neuropsychologia, 46(7), 1775–1786.
Brainard, D. H. (1997). The psychophysics toolbox. Spatial Vision, 10(4), 433–436.Caplovitz, G. P., Fendrich, R., & Hughes, H. C. (2008). Failures to see: attentive blank
stares revealed by change blindness. Consciousness and Cognition, 17(3),877–886.
Cohen, J. R., Sreenivasan, K. K., & D’Esposito, M. (2012). Correspondence betweenstimulus encoding- and maintenance-related neural processes underlies suc-cessful working memory. Cerebral Cortex, 24, 593–599.
Cowan, N. (2001). The magical number 4 in short-term memory: a reconsiderationof mental storage capacity. Behavioral and Brain Sciences, 24(1), 87–114(discussion 114-185).
D’Esposito, M. (2007). From cognitive to neural models of working memory.Philosophical Transactions of the Royal Society of London: B Biological Sciences,362(1481), 761–772.
Ellis, K. A., Silberstein, R. B., & Nathan, P. J. (2006). Exploring the temporal dynamicsof the spatial working memory n-back task using steady state visual evokedpotentials (SSVEP). Neuroimage, 31(4), 1741–1751.
Emrich, S. M., Riggall, A. C., LaRocque, J. J., & Postle, B. R. (2013). Distributed patternsof activity in sensory cortex reflect the precision of multiple items maintainedin visual short-term memory. Journal of Neuroscience, 33(15), 6516–6523.
Ester, E. F., Anderson, D. E., Serences, J. T., & Awh, E. (2013). A neural measure ofprecision in visual working memory. Journal of Cognitive Neuroscience, 25(5),754–761.
Ester, E. F., Serences, J. T., & Awh, E. (2009). Spatially global representations inhuman primary visual cortex during working memory maintenance. Journal ofNeuroscience, 29(48), 15258–15265.
Fukuda, K., Awh, E., & Vogel, E. K. (2010). Discrete capacity limits in visual workingmemory. Current Opinion in Neurobiology, 20(2), 177–182.
Funahashi, S., Bruce, C. J., & Goldman-Rakic, P. S. (1990). Visuospatial coding inprimate prefrontal neurons revealed by oculomotor paradigms. Journal ofNeurophysiology, 63(4), 814–831.
Fuster, J. M., & Alexander, G. E. (1971). Neuron activity related to short-termmemory. Science, 173(3997), 652–654.
Fuster, J. M., Bauer, R. H., & Jervey, J. P. (1985). Functional interactions betweeninferotemporal and prefrontal cortex in a cognitive task. Brain Research, 330(2),299–307.
Garcia, J. O., Srinivasan, R., & Serences, J. T. (2013). Near-real-time feature-selectivemodulations in human cortex. Current Biology, 23(6), 515–522.
Gazzaley, A. (2011). Influence of early attentional modulation on working memory.Neuropsychologia, 49(6), 1410–1424.
Gazzaley, A., & Nobre, A. C. (2012). Top-down modulation: bridging selectiveattention and working memory. Trends in Cognitive Sciences, 16(2), 129–135.
Gazzaley, A., Rissman, J., & D’Esposito, M. (2004). Functional connectivity duringworking memory maintenance. Cognitive, Affective, and Behavioral Neuroscience,4(4), 580–599.
Harrison, S. A., & Tong, F. (2009). Decoding reveals the contents of visual workingmemory in early visual areas. Nature, 458(7238), 632–635.
Hillyard, S. A., Hinrichs, H., Tempelmann, C., Morgan, S. T., Hansen, J. C., Scheich, H.,et al. (1997). Combining steady-state visual evoked potentials and f MRI tolocalize brain activity during selective attention. Human Brain Mapping, 5(4),287–292.
Hollingworth, A. (2004). Constructing visual representations of natural scenes: theroles of short- and long-term visual memory. The Journal of ExperimentalPsychology: Human Perception and Performance, 30(3), 519–537.
Hughes, H. C., Caplovitz, G. P., Loucks, R. A., & Fendrich, R. (2012). Attentive andpre-attentive processes in change detection and identification. PLoS ONE, 7(8),e42851.
Irwin, D. E., & Zelinsky, G. J. (2002). Eye movements and scene perception: memoryfor things observed. Perception and Psychophysics, 64(6), 882–895.
Jasper, H. H. (1958). The ten-twenty electrode system of the International Federa-tion. Electroencephalography and Clinical Neurophysiology, 10, 371–375.
Jiang, Y., Olson, I. R., & Chun, M. M. (2000). Organization of visual short-termmemory. Journal of Experimental Psychology Learning Memory and Cognition, 26(3), 683–702.
Kim, Y. J., Grabowecky, M., Paller, K. A., & Suzuki, S. (2011). Differential roles offrequency-following and frequency-doubling visual responses revealed byevoked neural harmonics. Journal of Cognitive Neuroscience, 23(8), 1875–1886.
Klem, G. H., Luders, H. O., Jasper, H. H., & Elger, C. (1999). The ten-twenty electrodesystem of the International Federation. The International Federation of ClinicalNeurophysiology. Electroencephalography and Clinical Neurophysiology Supple-ment, 52, 3–6.
Luck, S. J., & Vogel, E. K. (2013). Visual working memory capacity: from psycho-physics and neurobiology to individual differences. Trends in Cognitive Sciences,17(8), 391–400.
Magen, H., Emmanouil, T. A., McMains, S. A., Kastner, S., & Treisman, A. (2009).Attentional demands predict short-term memory load response in posteriorparietal cortex. Neuropsychologia, 47(8–9), 1790–1798.
Mance, I., Adam, K., Fukuda, K., & Vogel, E. K. (2014). The contribution of attentionallapses to estimates of individual differences in working memory capacity. In:Proceedings of the Vision Sciences Society Conference.
Mangun, G. R. (1995). Neural mechanisms of visual selective attention. Psychophy-siology, 32(1), 4–18.
McIntosh, A. R., Grady, C. L., Haxby, J. V., Ungerleider, L. G., & Horwitz, B. (1996).Changes in limbic and prefrontal functional interactions in a working memorytask for faces. Cerebral Cortex, 6(4), 571–584.
Melcher, D., & Piazza, M. (2011). The role of attentional priority and saliency indetermining capacity limits in enumeration and visual working memory. PLoSONE, 6(12), e29296.
Morgan, S. T., Hansen, J. C., & Hillyard, S. A. (1996). Selective attention to stimuluslocation modulates the steady-state visual evoked potential. The Proceedings ofthe National Academy of Sciences of the United States of America, 93(10),4770–4774.
Müller, M. M., & Hillyard, S. (2000). Concurrent recording of steady-state andtransient event-related potentials as indices of visual-spatial selective atten-tion. Clinical Neurophysiology, 111(9), 1544–1552.
Muller, M. M., & Hubner, R. (2002). Can the spotlight of attention be shaped like adoughnut? Evidence from steady-state visual evoked potentials. PsychologicalScience, 13(2), 119–124.
Muller, M. M., Picton, T. W., Valdes-Sosa, P., Riera, J., Teder-Salejarvi, W. A., &Hillyard, S. A. (1998). Effects of spatial selective attention on the steady-statevisual evoked potential in the 20–28 Hz range. Brain Research Cognitive BrainResearch, 6(4), 249–261.
Murray, A. M., Nobre, A. C., & Stokes, M. G. (2011). Markers of preparatory attentionpredict visual short-term memory performance. Neuropsychologia, 49(6),1458–1465.
O’Regan, J. K., Deubel, H., Clark, J. J., & Rensink, R. A. (2000). Picture changes duringblinks: looking without seeing and seeing without looking. Visual Cognition, 7,191–212.
Offen, S., Schuppeck, D., & Heeger, D. J. (2009). The role of early visual cortex invisual short-term memory and visual attention. Vision Research, 49(10),1352–1362.
Pelli, D. G. (1997). The VideoToolbox software for visual psychophysics: transform-ing numbers into movies. Spatial Vision, 10(4), 437–442.
Perlstein, W. M., Cole, M. A., Larson, M., Kelly, K., Seignourel, P., & Keil, A. (2003).Steady-state visual evoked potentials reveal frontally-mediated working mem-ory activity in humans. Neuroscience Letters, 342(3), 191–195.
Postle, B. R. (2006). Working memory as an emergent property of the mind andbrain. Neuroscience, 139(1), 23–38.
Regan, D. (1989). Human brain electrophysiology: evoked potentials and evokedmagnetic fields in science and medicine. New York: Elsevier.
Rensink, R. A., O’Regan, J. K., & Clark, J. J. (1997). To see or not to see: the need forattention to perceive changes in scenes. Psychological Science, 8, 368–373.
Riggall, A. C., & Postle, B. R. (2012). The relationship between working memorystorage and elevated activity as measured with functional magnetic resonanceimaging. Journal of Neuroscience, 32(38), 12990–12998.
Rutman, A. M., Clapp, W. C., Chadick, J. Z., & Gazzaley, A. (2010). Early top-downcontrol of visual processing predicts working memory performance. Journal ofCognitive Neuroscience, 22(6), 1224–1234.
Scholl, B. J. (2000). Attenuated change blindness for exogenously attended items ina flicker paradigm. Visual Cognition, 7, 377–396.
Serences, J. T., Ester, E. F., Vogel, E. K., & Awh, E. (2009). Stimulus-specific delayactivity in human primary visual cortex. Psychological Science, 20(2),207–214.
Silberstein, R. B., Nunez, P. L., Pipingas, A., Harris, P., & Danieli, F. (2001). Steady statevisually evoked potential (SSVEP) topography in a graded working memorytask. The International Journal of Psychophysiology, 42(2), 219–232.
Simons, D. J., & Levin, D. T. (1997). Change blindness. Trends in Cognitive Sciences1(7), 261–267.
D.J. Peterson et al. / Neuropsychologia 63 (2014) 145–153152

Sneve, M. H., Alnaes, D., Endestad, T., Greenlee, M. W., & Magnussen, S. (2012).Visual short-term memory: activity supporting encoding and maintenance inretinotopic visual cortex. Neuroimage, 63(1), 166–178.
Todd, J. J., & Marois, R. (2004). Capacity limit of visual short-termmemory in humanposterior parietal cortex. Nature, 428(6984), 751–754.
Todd, J. J., & Marois, R. (2005). Posterior parietal cortex activity predicts individualdifferences in visual short-term memory capacity. Cognitive, Affective, andBehavioral Neuroscience, 5(2), 144–155.
Vogel, E. K., & Machizawa, M. G. (2004). Neural activity predicts individualdifferences in visual working memory capacity. Nature, 428(6984), 748–751.
Vogel, E. K., McCollough, A. W., & Machizawa, M. G. (2005). Neural measures revealindividual differences in controlling access to working memory. Nature, 438(7067), 500–503.
Wolfe, J., Reinecke, A., & Brawn, P. (2006). Why don't we see changes? The role ofattentional bottlenecks and limited visual memory. Visual Cognition, 14, 749–780.
Xu, Y., & Chun, M. M. (2006). Dissociable neural mechanisms supporting visualshort-term memory for objects. Nature, 440(7080), 91–95.
Zanto, T. P., & Gazzaley, A. (2009). Neural suppression of irrelevant informationunderlies optimal working memory performance. Journal of Neuroscience, 29(10), 3059–3066.
D.J. Peterson et al. / Neuropsychologia 63 (2014) 145–153 153
Related Documents