PENNSYLVANIA’S STATE SYSTEM OF HIGHER EDUCATION CLARION UNIVERSITY on the Commonwealth of Pennsylvania The State System’s Economic and Employment Impact Released April 15, 2015

Welcome message from author
This document is posted to help you gain knowledge. Please leave a comment to let me know what you think about it! Share it to your friends and learn new things together.
Transcript
P E N N S Y L V A N I A ’ S S T A T E S Y S T E M O F H I G H E R E D U C A T I O N
CLARIONUNIVERSITY
on the Commonwealth of Pennsylvania
The State System’sEconomic and Employment Impact
Released April 15, 2015
TABLE OF CONTENTS I. INTRODUCTION ............................................................................................................. 2
II. EXECUTIVE SUMMARY ................................................................................................. 3III. ECONOMIC AND EMPLOYMENT IMPACT OF PENNSYLVANIA’S STATE SYSTEM OF
HIGHER EDUCATION ON THE COMMONWEALTH OF PENNSYLVANIA ........................ 9
IV. CONCLUSION .............................................................................................................. 30V. APPENDICES
A. ECONOMIC IMPACT BACKGROUND
B. ECONOMIC OVERVIEW OF PENNSYLVANIA AND STATE SYSTEM COUNTIES
C. INDIVIDUAL UNIVERSITY ECONOMIC AND EMPLOYMENT IMPACT ANALYSIS
D. ECONOMIC IMPACT OF VISITOR SPENDING
E. DATA ANALYSIS METHODOLOGIES
F. INFORMATION RELIED ON
G. SUPPORTING GEOGRAPHIC DATA
H. ABOUT BAKER TILLY AND THE PREPARERS OF THE REPORT
State System Economic and Employment Impact Study Page 1
I. INTRODUCTION
Pennsylvania’s State System of Higher Education (“State System”) contracted with Baker Tilly
Virchow Krause, LLP (“Baker Tilly”) to determine the economic and employment impact of the
State System and its universities on the Commonwealth of Pennsylvania (“Commonwealth”).
Therefore, the purpose of this report is to quantify and describe the impact the State System has
on the Commonwealth’s economy.
The State System includes 14 universities, four branch campuses, several regional centers, and
the McKeever Environmental Learning Center.1 The universities are all located in rural,
suburban and small-town settings around Pennsylvania. The Center offers academic programs
through a consortium of public and private colleges and universities. Per Act 188 of 1982, the
State System’s mission “is the provision of instruction for undergraduate and graduate students
to and beyond the master’s degree in the liberal arts and sciences, and in the applied fields,
including the teaching profession.” In doing so, the State System’s purpose is “to provide high
quality education at the lowest possible cost to students.”
Economic growth can, in part, be traced back to investments in higher education. University,
faculty and staff, and student spending stem from investments which in turn, creates economic
development in the form of jobs, income, and increased economic activity within the university’s
region. Economic impact studies help to quantify this impact which is generated by higher
education institutions.
The intention of this report is to measure the economic impact of the 14 universities and the
related entities of the State System on the Commonwealth. The State System receives funding
from various sources such as: state appropriations, revenues from tuition and fees, federal and
research grants, private donations and revenues provided by services that each university offers.
From this funding, an impact, attributable to the purchasing of goods and services during the
1 One of the State System’s entities, System-wide Functions and Services, is primarily located at the Dixon University Center in Harrisburg and include: System-wide shared administrative services; System leadership functions of the Chancellor and Board of Governors; some System-wide initiatives and grants managed on behalf of the universities; and the academic, student, and facilities support for the multi-university sites in Harrisburg and Philadelphia.
State System Economic and Employment Impact Study Page 2
fiscal year 2013-2014, can be determined. In aggregate, the universities within the State System
expend and consume billions of dollars during operations each year which greatly impact the
counties in which each campus is located. Additionally, the impact resulting from the
expenditures made by the State System’s faculty and staff, and students can be measured.
Methodology Applied to the State System Economic Impact Study:
Common to many economic impact studies, the basis of methodology was rooted in the
utilization of multipliers which were then applied to produce total impact numbers for each
campus. This particular methodology was selected and utilized because it is considered by
numerous economists to provide highly accurate and valid results.2 The multipliers used were
formulated from the Regional Input-Output Modeling System (“RIMS II”) of the Bureau of
Economic Analysis (“BEA”).
The BEA established a method of estimating regional multipliers (RIMS II) which is a valuable
tool for estimating the total economic impact of a project, or in this case, institution, on a region.
This Input-Output Modeling System provides multipliers that are intended to capture both the
direct and indirect effects on the defined region. Specific to this study, the multiplier is used to
calculate direct and indirect economic impacts and employment impacts of each institution, as
well as the impacts of faculty and staff, student, and capital expenditures. The analysis is
focused on the counties in which a State System university has a presence, whether that is a main
campus or satellite, and on an overall state-level.
II. EXECUTIVE SUMMARY
Pennsylvania’s State System of Higher Education is the 18th largest employer in Pennsylvania
and as of fall 2014, enrolled 109,606 students across the 14 universities.3 In the 67 counties of
Pennsylvania, the State System has a direct presence in 20 of them, varying from urban to rural
locations. As a result of a large geographic reach across the state, the State System plays a key
2 Similar economic studies include visitor spending, alumni spending, and activities associated with athletics, affiliates, student governments and other 501-C3 organizations as a factors of the total economic impact. These were excluded from the State System’s analysis based on our discretion. 3 Employer ranking for the State System obtained from Pennsylvania’s Department of Labor and Industry Center for Workforce Information and Analysis.
State System Economic and Employment Impact Study Page 3
role in stimulating the economies of the counties that each university resides in. The State
System directly impacts the regional economies by injecting millions of dollars into
Pennsylvania’s economy on local, county, and state levels. Additionally, the presence of the
State System universities enhances workforce development and therefore impacts employment
opportunities, not only for the students, but also for those who reside in the surrounding
communities.
Pennsylvania’s State System commissioned an economic and employment impact study in order
to determine an estimate of their economic contribution to the Commonwealth. Baker Tilly has
completed the study utilizing data from the 2013-2014 fiscal year and, as a result, found the
estimated combined economic and employment contribution of the State System on the
Commonwealth was approximately $6.7 billion.
Key features of the State System’s Economic and Employment Impact Study include:
• Computation of the direct, indirect, induced, and total economic impact of the State
System’s universities upon the Commonwealth, shown in Table 1. The $4.4 billion total
economic impact can be broken down into four categories:
Institutional spending which constitutes 35 percent of the total economic impact;
Faculty and staff spending which constitutes 23.4 percent of the total economic
impact;
Student spending which constitutes 32.6 percent of the total economic impact; and
Capital expenditures which constitutes 9 percent of the total economic impact.
• Computation of the employment impact of the State System’s universities upon the
Commonwealth:
The State System is one of the top 10 employers in seven of the 20 counties in
which a State System university is located;
Approximately 61,853 jobs were supported by Pennsylvania’s State System of Higher
Education;
It is estimated that jobs supported by the State System produced an additional $2.3
billion in economic benefits to the Commonwealth of Pennsylvania; and
State System Economic and Employment Impact Study Page 4

The combined economic and employment impact is $6.7 billion, as shown in Table 2.
• Computation of the return on appropriations:
As shown in Table 3 below, the State System received a total of $412.8 million in
state appropriations during the 2013-2014 fiscal year;
Also shown in Table 3, on average, the Commonwealth received a 14.8 percent
return through taxes paid by employees.4
Each dollar invested by the Commonwealth to one of the universities produced an
average return of $10.61 in economic impact, as shown in Table 4; and
• An analysis of the economic development impacts stemming from State System
universities; and
• Geographic Information System (“GIS”) analysis of State System employees, students,
and alumni.
4 Taxes paid by students employed by a State System university included.
State System Economic and Employment Impact Study Page 5
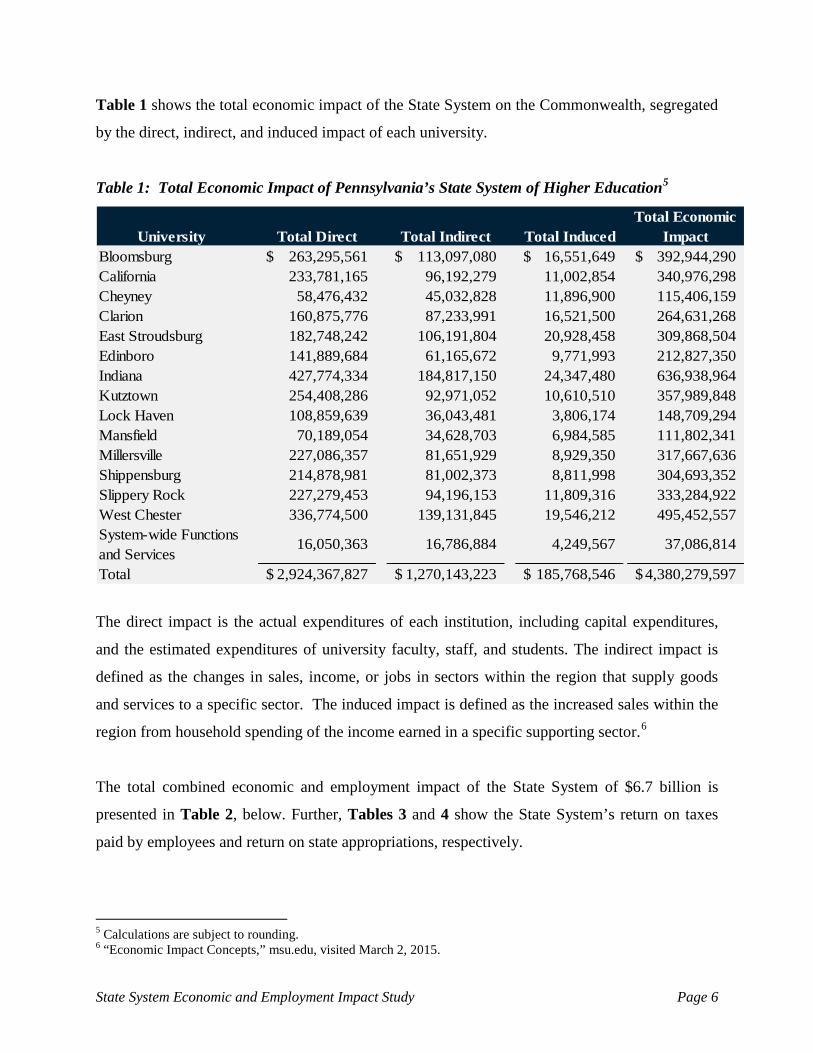
Table 1 shows the total economic impact of the State System on the Commonwealth, segregated
by the direct, indirect, and induced impact of each university.
Table 1: Total Economic Impact of Pennsylvania’s State System of Higher Education5
University Total Direct Total Indirect Total InducedTotal Economic
ImpactBloomsburg 263,295,561$ 113,097,080$ 16,551,649$ 392,944,290$ California 233,781,165 96,192,279 11,002,854 340,976,298 Cheyney 58,476,432 45,032,828 11,896,900 115,406,159 Clarion 160,875,776 87,233,991 16,521,500 264,631,268 East Stroudsburg 182,748,242 106,191,804 20,928,458 309,868,504 Edinboro 141,889,684 61,165,672 9,771,993 212,827,350 Indiana 427,774,334 184,817,150 24,347,480 636,938,964 Kutztown 254,408,286 92,971,052 10,610,510 357,989,848 Lock Haven 108,859,639 36,043,481 3,806,174 148,709,294 Mansfield 70,189,054 34,628,703 6,984,585 111,802,341 Millersville 227,086,357 81,651,929 8,929,350 317,667,636 Shippensburg 214,878,981 81,002,373 8,811,998 304,693,352 Slippery Rock 227,279,453 94,196,153 11,809,316 333,284,922 West Chester 336,774,500 139,131,845 19,546,212 495,452,557 System-wide Functions and Services
16,050,363 16,786,884 4,249,567 37,086,814
Total 2,924,367,827$ 1,270,143,223$ 185,768,546$ 4,380,279,597$
The direct impact is the actual expenditures of each institution, including capital expenditures,
and the estimated expenditures of university faculty, staff, and students. The indirect impact is
defined as the changes in sales, income, or jobs in sectors within the region that supply goods
and services to a specific sector. The induced impact is defined as the increased sales within the
region from household spending of the income earned in a specific supporting sector.6
The total combined economic and employment impact of the State System of $6.7 billion is
presented in Table 2, below. Further, Tables 3 and 4 show the State System’s return on taxes
paid by employees and return on state appropriations, respectively.
5 Calculations are subject to rounding. 6 “Economic Impact Concepts,” msu.edu, visited March 2, 2015.
State System Economic and Employment Impact Study Page 6
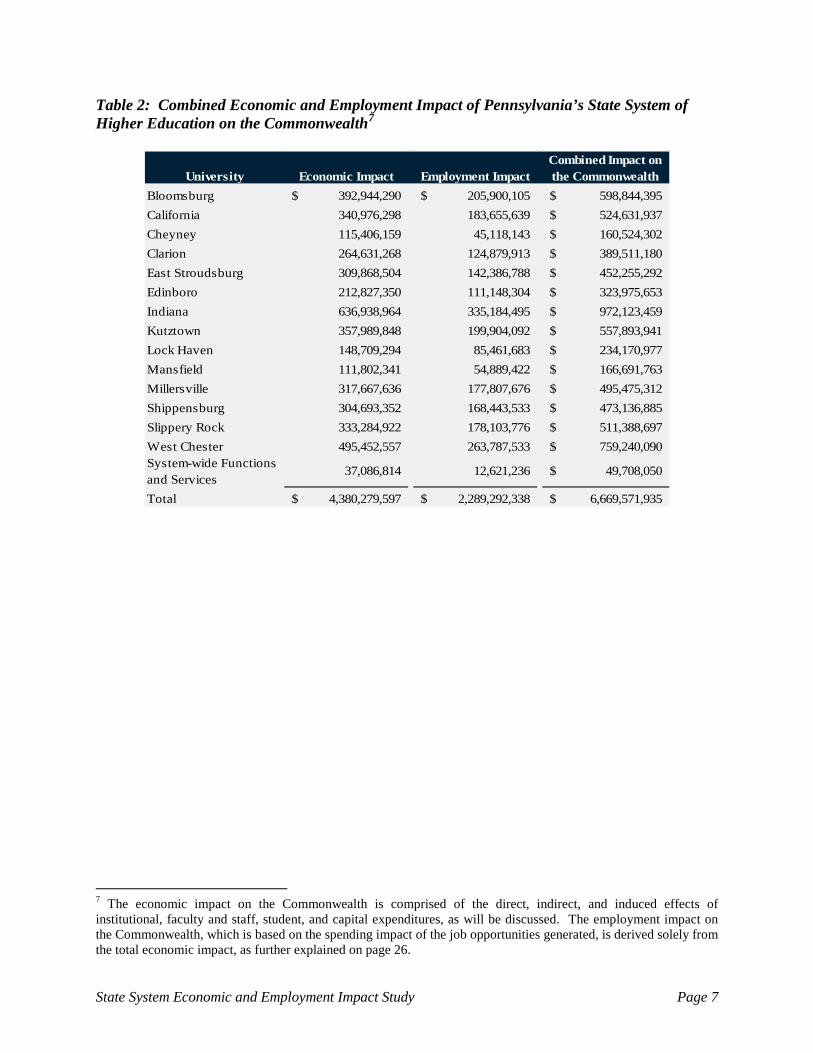
Table 2: Combined Economic and Employment Impact of Pennsylvania’s State System of Higher Education on the Commonwealth7
University Economic Impact Employment ImpactCombined Impact on the Commonwealth
Bloomsburg 392,944,290$ 205,900,105$ 598,844,395$ California 340,976,298 183,655,639 524,631,937$ Cheyney 115,406,159 45,118,143 160,524,302$ Clarion 264,631,268 124,879,913 389,511,180$ East Stroudsburg 309,868,504 142,386,788 452,255,292$ Edinboro 212,827,350 111,148,304 323,975,653$ Indiana 636,938,964 335,184,495 972,123,459$ Kutztown 357,989,848 199,904,092 557,893,941$ Lock Haven 148,709,294 85,461,683 234,170,977$ Mansfield 111,802,341 54,889,422 166,691,763$ Millersville 317,667,636 177,807,676 495,475,312$ Shippensburg 304,693,352 168,443,533 473,136,885$ Slippery Rock 333,284,922 178,103,776 511,388,697$ West Chester 495,452,557 263,787,533 759,240,090$ System-wide Functions and Services
37,086,814 12,621,236 49,708,050$
Total 4,380,279,597$ 2,289,292,338$ 6,669,571,935$
7 The economic impact on the Commonwealth is comprised of the direct, indirect, and induced effects of institutional, faculty and staff, student, and capital expenditures, as will be discussed. The employment impact on the Commonwealth, which is based on the spending impact of the job opportunities generated, is derived solely from the total economic impact, as further explained on page 26.
State System Economic and Employment Impact Study Page 7

Table 3: The State System’s Return on Appropriations8
UniversityState Tax
WithholdingsSales Tax Revenue
Total Tax Revenues
State Appropriations
Return on Appropriations
Bloomsburg 2,292,524$ 3,110,977$ 5,403,501$ 32,994,559$ 16.38%California 1,787,436 3,149,730 4,937,166 29,751,310 16.59%Cheyney 488,093 444,381 932,473 13,098,158 7.12%Clarion 1,420,794 1,802,653 3,223,447 22,261,739 14.48%East Stroudsburg 1,482,286 2,127,487 3,609,773 21,160,935 17.06%Edinboro 1,542,094 1,579,519 3,121,613 24,963,085 12.50%Indiana 3,455,150 5,524,239 8,979,390 52,382,984 17.14%Kutztown 2,022,440 3,047,576 5,070,017 33,105,442 15.31%Lock Haven 1,200,846 1,218,457 2,419,303 19,963,187 12.12%Mansfield 833,113 678,459 1,511,573 16,702,905 9.05%Millersville 2,018,212 2,686,387 4,704,599 30,872,019 15.24%Shippensburg 1,787,469 2,690,257 4,477,727 28,164,791 15.90%Slippery Rock 1,897,186 2,901,430 4,798,616 32,576,803 14.73%West Chester 3,349,207 3,973,093 7,322,299 49,914,169 14.67%System-wide Functions and Services
390,398 216,509 606,906 4,838,914 12.54%
Total 25,967,248$ 35,151,153$ 61,118,401$ 412,751,000$ 14.81%
Table 4: Economic Impact to State Appropriations Ratio
UniversityTotal Economic
Impact State Appropriations RatioBloomsburg 392,944,290$ 32,994,559$ 11.91California 340,976,298 29,751,310 11.46Cheyney 115,406,159 13,098,158 8.81Clarion 264,631,268 22,261,739 11.89East Stroudsburg 309,868,504 21,160,935 14.64Edinboro 212,827,350 24,963,085 8.53Indiana 636,938,964 52,382,984 12.16Kutztown 357,989,848 33,105,442 10.81Lock Haven 148,709,294 19,963,187 7.45Mansfield 111,802,341 16,702,905 6.69Millersville 317,667,636 30,872,019 10.29Shippensburg 304,693,352 28,164,791 10.82Slippery Rock 333,284,922 32,576,803 10.23West Chester 495,452,557 49,914,169 9.93System-wide Functions and Services
37,086,814 4,838,914 7.66
Total 4,380,279,597$ 412,751,000$ 10.61
8 Sales tax revenue is calculated by applying the percentage of state gross domestic product that is taxable by the total faculty and staff and student spending.
State System Economic and Employment Impact Study Page 8
III. ECONOMIC AND EMPLOYMENT IMPACT OF PENNSYLVANIA’S STATE
SYSTEM OF HIGHER EDUCATION ON THE COMMONWEALTH OF
PENNSYLVANIA
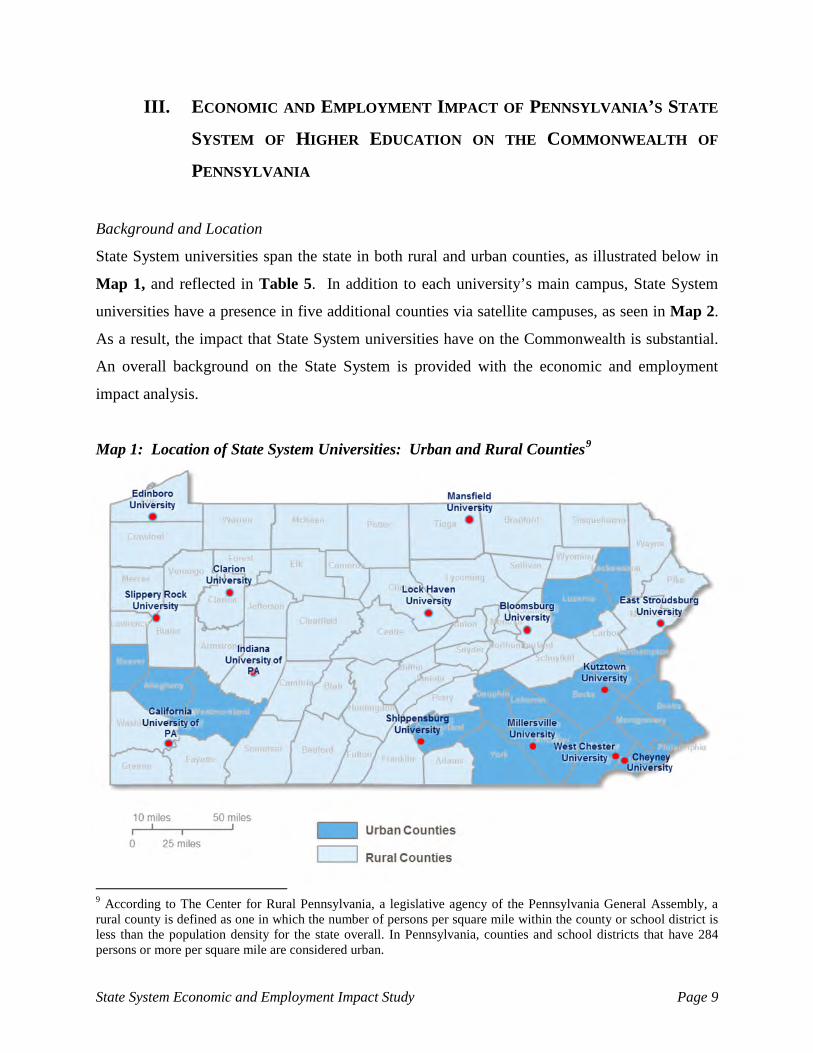
Background and Location
State System universities span the state in both rural and urban counties, as illustrated below in
Map 1, and reflected in Table 5. In addition to each university’s main campus, State System
universities have a presence in five additional counties via satellite campuses, as seen in Map 2.
As a result, the impact that State System universities have on the Commonwealth is substantial.
An overall background on the State System is provided with the economic and employment
impact analysis.
Map 1: Location of State System Universities: Urban and Rural Counties9
9 According to The Center for Rural Pennsylvania, a legislative agency of the Pennsylvania General Assembly, a rural county is defined as one in which the number of persons per square mile within the county or school district is less than the population density for the state overall. In Pennsylvania, counties and school districts that have 284 persons or more per square mile are considered urban.
State System Economic and Employment Impact Study Page 9
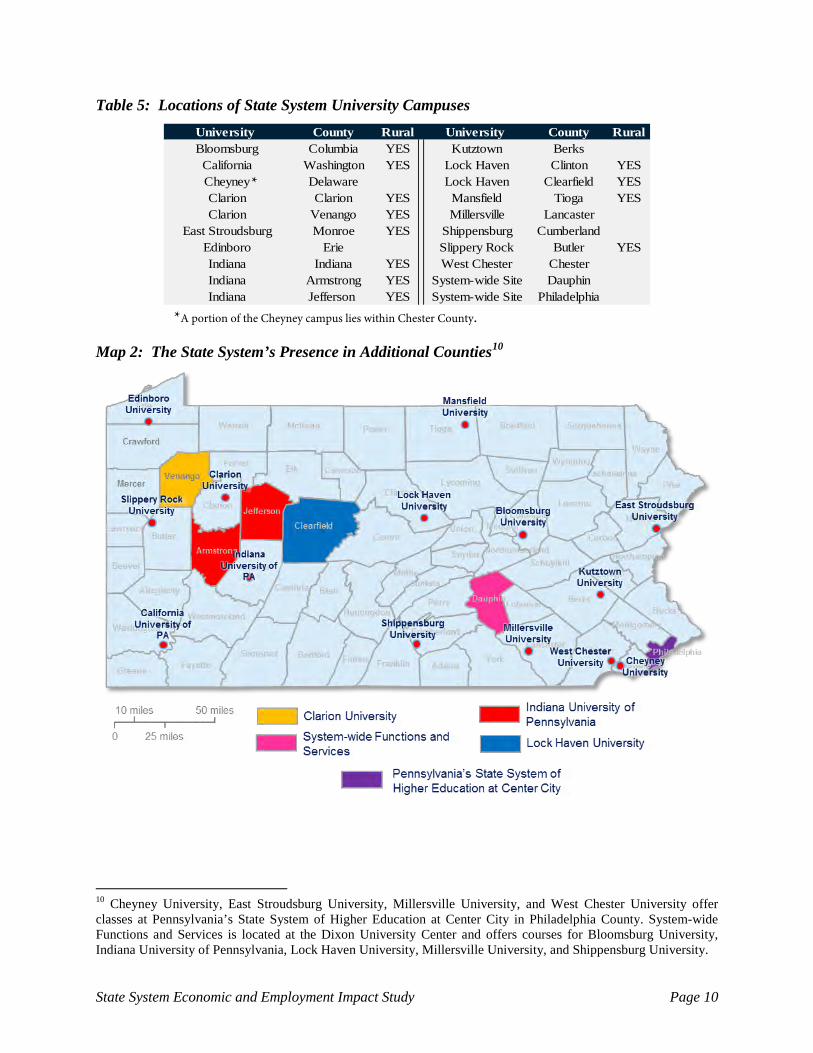
Table 5: Locations of State System University Campuses University County Rural University County RuralBloomsburg Columbia YES Kutztown BerksCalifornia Washington YES Lock Haven Clinton YESCheyney Delaware Lock Haven Clearfield YESClarion Clarion YES Mansfield Tioga YESClarion Venango YES Millersville Lancaster
East Stroudsburg Monroe YES Shippensburg CumberlandEdinboro Erie Slippery Rock Butler YESIndiana Indiana YES West Chester ChesterIndiana Armstrong YES System-wide Site DauphinIndiana Jefferson YES System-wide Site Philadelphia
Map 2: The State System’s Presence in Additional Counties10
10 Cheyney University, East Stroudsburg University, Millersville University, and West Chester University offer classes at Pennsylvania’s State System of Higher Education at Center City in Philadelphia County. System-wide Functions and Services is located at the Dixon University Center and offers courses for Bloomsburg University, Indiana University of Pennsylvania, Lock Haven University, Millersville University, and Shippensburg University.
State System Economic and Employment Impact Study Page 10
*
*A portion of the Cheyney campus lies within Chester County.

As of the 2014 fall semester, 109,606 students enrolled in undergraduate and graduate programs
at one of the 14 State System universities, a 2.2 percent decrease from the 2013 fall semester
(112,028 enrollments). Of the students enrolled, 87.7 percent are residents of Pennsylvania, as
shown in Map 3.11 Map 4 shows the locations of the State System alumni who still reside in
Pennsylvania.
Map 3: State System Student Locations
Total State System Students Living in Pennsylvania: 96,07412
11 Student locations are based on student permanent addresses. 12 Refer to Appendix G for county totals.
State System Economic and Employment Impact Study Page 11
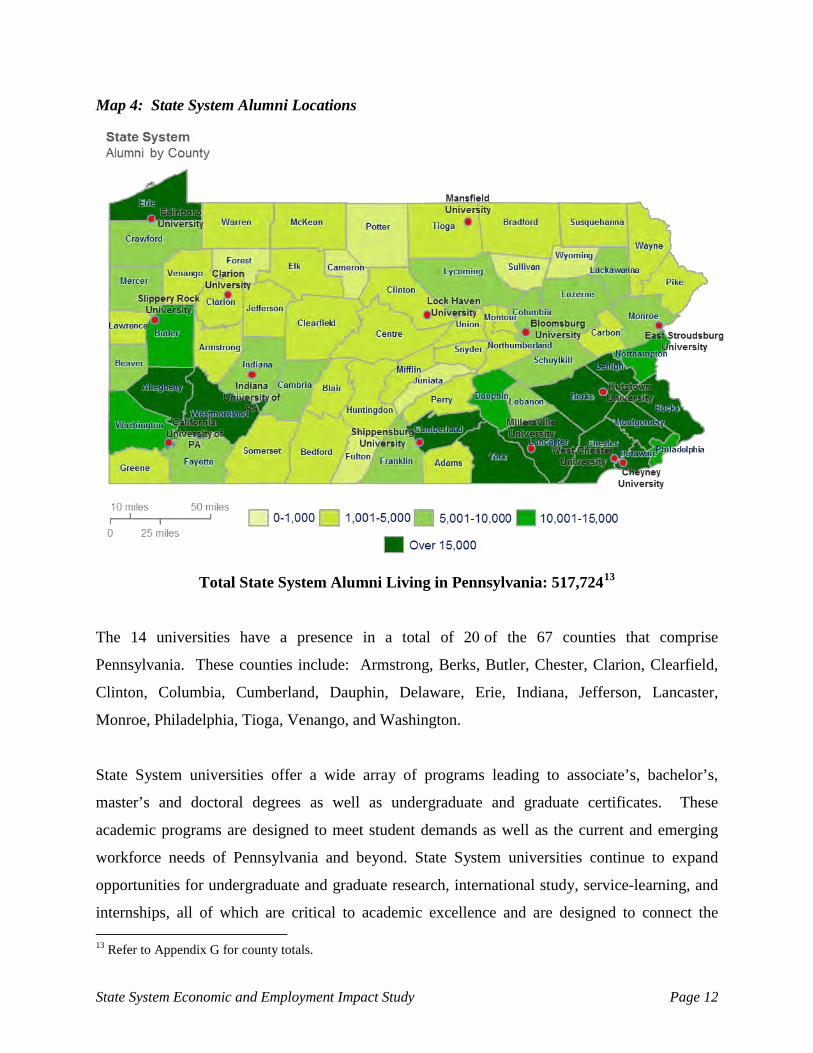
Map 4: State System Alumni Locations
Total State System Alumni Living in Pennsylvania: 517,72413
The 14 universities have a presence in a total of 20 of the 67 counties that comprise
Pennsylvania. These counties include: Armstrong, Berks, Butler, Chester, Clarion, Clearfield,
Clinton, Columbia, Cumberland, Dauphin, Delaware, Erie, Indiana, Jefferson, Lancaster,
Monroe, Philadelphia, Tioga, Venango, and Washington.
State System universities offer a wide array of programs leading to associate’s, bachelor’s,
master’s and doctoral degrees as well as undergraduate and graduate certificates. These
academic programs are designed to meet student demands as well as the current and emerging
workforce needs of Pennsylvania and beyond. State System universities continue to expand
opportunities for undergraduate and graduate research, international study, service-learning, and
internships, all of which are critical to academic excellence and are designed to connect the
13 Refer to Appendix G for county totals.
State System Economic and Employment Impact Study Page 12

classroom to the community. Collectively, more than 2,300 degree and certificate programs are
offered in more than 530 academic areas. Over 110 of these academic programs are available
online. The top three program areas of study by enrollment include Business, STEM (Science,
Technology, Engineering and Mathematics), and Health Professions.
While graduate instruction at the Ph.D. level is available at Indiana University of Pennsylvania,
any State System university can offer an applied/professional doctoral program. Currently, nine
State System universities offer applied/professional doctoral degree programs. The universities
are fully accredited by the Middle States Association of Colleges and Schools. In addition, many
specific academic programs have also received specialized national discipline specific
accreditation.
The total of all university campuses comprises more than 4,698 acres and a total of 862 buildings
(24,999,533 square feet) that house classrooms, residences, administrative offices, and student
support services. The libraries on each campus provide resource support for academic programs
and are connected electronically by the Keystone Library Network (“KLN”). The KLN provides
students and staff access to the combined holdings of the 14 universities’ libraries, which number
in the millions, and allows them to use the Internet to conduct research day or night from any
location. It also gives them access to library assistance late into the evening through e-mail and a
toll-free number.14
Base tuition at State System universities is $6,820 per year for Pennsylvania resident
undergraduate students and from $10,230 to $17,050 per year for nonresident students for the
2014-2015 fiscal year.15 The regular graduate student tuition is $454 per credit hour, for
Pennsylvania residents, and $681 per credit for out-of-state students. Both resident and non-
residents have to pay an annual instructional technology fee. Room and board charges vary, as
do local fees. Students may apply for a variety of state and federal financial assistance programs,
university and private scholarships, grants, and loans.
14 Data obtained from Pennsylvania’s State System of Higher Education Fact Sheet. 15 Several State System universities are testing various new pricing models through a Board of Governors’ pricing flexibility pilot program, which began January 2014. For example, Millersville University implemented a per-credit tuition pilot beginning fiscal year 2014-2015. Tuition rates listed above are regular tuition rates, excluding alternative rates used in pilots.
State System Economic and Employment Impact Study Page 13
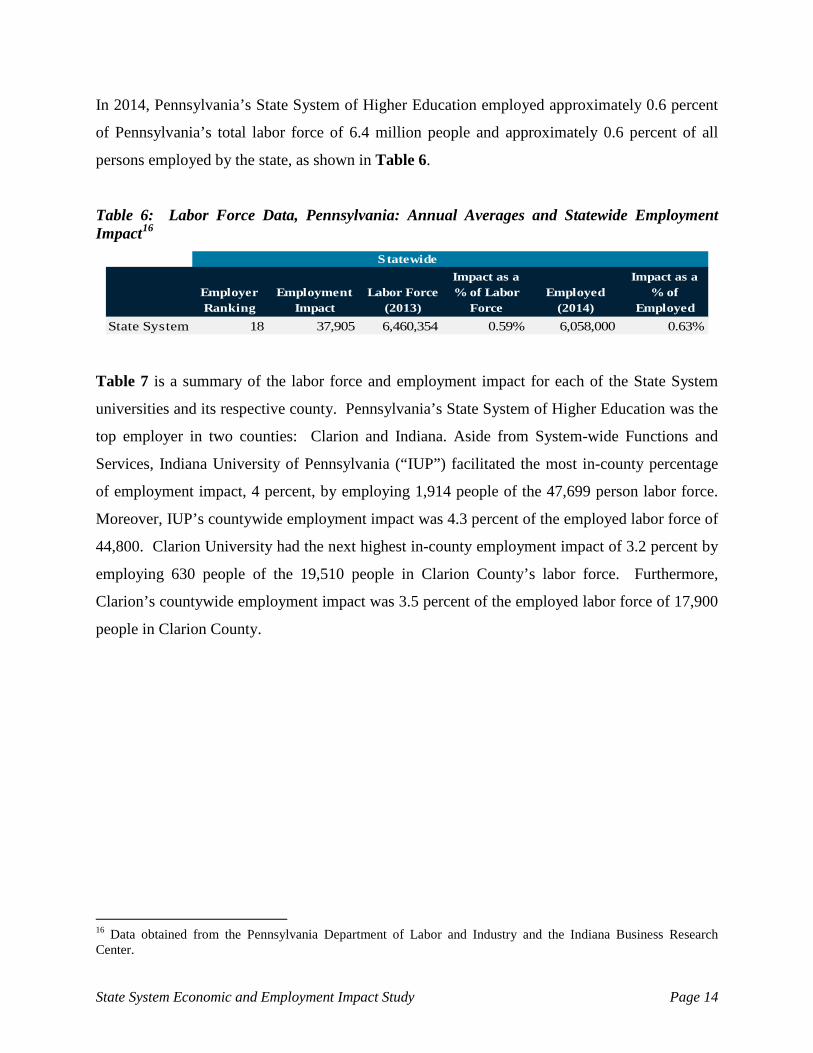
In 2014, Pennsylvania’s State System of Higher Education employed approximately 0.6 percent
of Pennsylvania’s total labor force of 6.4 million people and approximately 0.6 percent of all
persons employed by the state, as shown in Table 6.
Table 6: Labor Force Data, Pennsylvania: Annual Averages and Statewide Employment Impact16
Statewide
Employer Ranking
Employment Impact
Labor Force (2013)
Impact as a % of Labor
ForceEmployed
(2014)
Impact as a % of
EmployedState System 18 37,905 6,460,354 0.59% 6,058,000 0.63%
Table 7 is a summary of the labor force and employment impact for each of the State System
universities and its respective county. Pennsylvania’s State System of Higher Education was the
top employer in two counties: Clarion and Indiana. Aside from System-wide Functions and
Services, Indiana University of Pennsylvania (“IUP”) facilitated the most in-county percentage
of employment impact, 4 percent, by employing 1,914 people of the 47,699 person labor force.
Moreover, IUP’s countywide employment impact was 4.3 percent of the employed labor force of
44,800. Clarion University had the next highest in-county employment impact of 3.2 percent by
employing 630 people of the 19,510 people in Clarion County’s labor force. Furthermore,
Clarion’s countywide employment impact was 3.5 percent of the employed labor force of 17,900
people in Clarion County.
16 Data obtained from the Pennsylvania Department of Labor and Industry and the Indiana Business Research Center.
State System Economic and Employment Impact Study Page 14

Table 7: Labor Force Data by County, Pennsylvania Counties: Annual Averages and Countywide Employment Impact17
Countywide Impact
University County
Employer Ranking
(2014)Employee
Count
Labor Force (2013)
% of Labor Force
Employed (2014)
% of Employed
Bloomsburg Columbia 2 525 37,648 1.39% 36,200 1.45%California Washington 7 663 108,858 0.61% 103,200 0.64%Cheyney Delaware N/A 105 282,071 0.04% 263,600 0.04%Clarion Clarion 1 630 19,510 3.23% 17,900 3.52%East Stroudsburg Monroe 11 854 80,185 1.07% 74,400 1.15%Edinboro Erie 22 795 139,619 0.57% 130,500 0.61%Indiana Indiana 1 1,914 47,699 4.01% 44,800 4.27%Kutztown Berks 18 935 204,705 0.46% 189,500 0.49%Lock Haven Clinton 3 465 19,944 2.33% 19,200 2.42%Mansfield Tioga 4 415 21,875 1.90% 20,300 2.04%Millersville Lancaster 26 1,481 268,570 0.55% 254,300 0.58%Shippensburg Cumberland 22 935 124,890 0.75% 119,200 0.78%Slippery Rock Butler 9 774 101,382 0.76% 96,800 0.80%West Chester Chester 14 1,635 271,793 0.60% 258,800 0.63%System-wide Site Dauphin N/A 69 139,052 5.00% 131,800 0.05%
Total Economic Impact of State System Universities upon the Commonwealth
The total economic impact of the State System is compromised of the following:
Direct Impact
• Actual expenditures of each institution;
• Estimated expenditures of university faculty, staff, and students;18 and
• Capital expenditures of each university.
Indirect Impact
• Economic benefit within the industry, as a result of the goods and services provided
by the State System universities;19 and
• Comprised of institutional, faculty, staff, student, and capital expenditures.
Induced Impact
• The additional economic benefit to the Commonwealth, as a result of the State
System universities’ presence; and
• Compromised of institutional and capital expenditures.
17 Data obtained from the Pennsylvania Department of Labor and Industry and the Indiana Business Research Center. 18 Institutional spending is exclusive of salary and wages paid to faculty and staff to avoid double-counting. However, institutional spending does include employee benefits. 19 Specifically the economic benefit within the junior college, colleges, universities, and professional schools industry. The industry is classified per the North American Industry Classification System (NAICS).
State System Economic and Employment Impact Study Page 15

Both the indirect and induced effects were calculated using the direct effect and applying the
RIMS II multipliers. Refer to Appendix E for further detail regarding the methodology used to
attain this value. The State System universities had a combined total economic impact of $4.4
billion on the Commonwealth in the fiscal year 2013-2014, as shown in Table 8.
Table 8: Direct, Indirect, Induced, and Total Economic Impact upon the Commonwealth
University Total Direct Total Indirect Total InducedTotal Economic
ImpactBloomsburg 263,295,561$ 113,097,080$ 16,551,649$ 392,944,290$ California 233,781,165 96,192,279 11,002,854 340,976,298 Cheyney 58,476,432 45,032,828 11,896,900 115,406,159 Clarion 160,875,776 87,233,991 16,521,500 264,631,268 East Stroudsburg 182,748,242 106,191,804 20,928,458 309,868,504 Edinboro 141,889,684 61,165,672 9,771,993 212,827,350 Indiana 427,774,334 184,817,150 24,347,480 636,938,964 Kutztown 254,408,286 92,971,052 10,610,510 357,989,848 Lock Haven 108,859,639 36,043,481 3,806,174 148,709,294 Mansfield 70,189,054 34,628,703 6,984,585 111,802,341 Millersville 227,086,357 81,651,929 8,929,350 317,667,636 Shippensburg 214,878,981 81,002,373 8,811,998 304,693,352 Slippery Rock 227,279,453 94,196,153 11,809,316 333,284,922 West Chester 336,774,500 139,131,845 19,546,212 495,452,557 System-wide Functions and Services
16,050,363 16,786,884 4,249,567 37,086,814
Total 2,924,367,827$ 1,270,143,223$ 185,768,546$ 4,380,279,597$
Indiana University of Pennsylvania and West Chester University had the largest statewide
economic impacts, $636.9 million and $495.5 million, respectively. System-wide Functions and
Services had a total statewide economic impact of $37.1 million.20 The average statewide
economic impact of each State System university was approximately $310.2 million, as shown
below.21
20 System-wide Functions and Services are primarily located at the Dixon University Center in Harrisburg and include: System-wide shared administrative services; System leadership functions of the Chancellor and Board of Governors; some System-wide initiatives and grants managed on behalf of the universities; and the academic, student, and facilities support for the multi-university sites in Harrisburg and Philadelphia. 21 To find the average of just the 14 universities, the System-wide Functions and Services impact was removed from the calculation.
State System Economic and Employment Impact Study Page 16
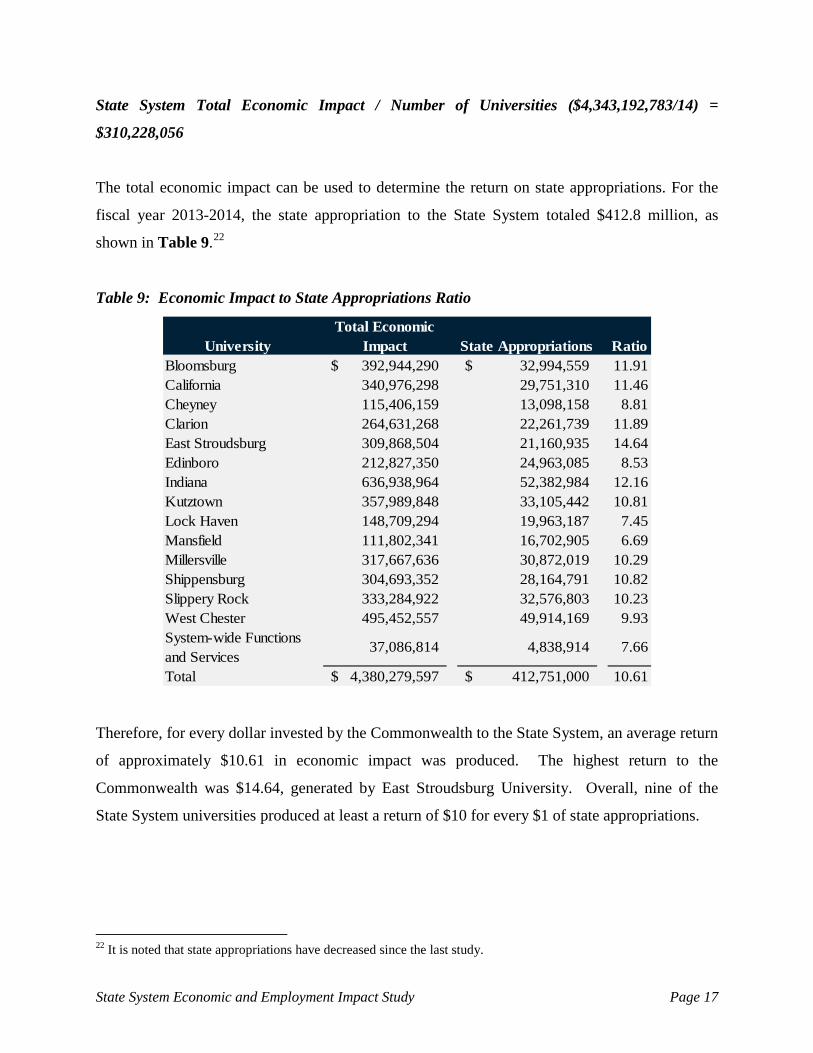
State System Total Economic Impact / Number of Universities ($4,343,192,783/14) =
$310,228,056
The total economic impact can be used to determine the return on state appropriations. For the
fiscal year 2013-2014, the state appropriation to the State System totaled $412.8 million, as
shown in Table 9.22
Table 9: Economic Impact to State Appropriations Ratio
UniversityTotal Economic
Impact State Appropriations RatioBloomsburg 392,944,290$ 32,994,559$ 11.91California 340,976,298 29,751,310 11.46Cheyney 115,406,159 13,098,158 8.81Clarion 264,631,268 22,261,739 11.89East Stroudsburg 309,868,504 21,160,935 14.64Edinboro 212,827,350 24,963,085 8.53Indiana 636,938,964 52,382,984 12.16Kutztown 357,989,848 33,105,442 10.81Lock Haven 148,709,294 19,963,187 7.45Mansfield 111,802,341 16,702,905 6.69Millersville 317,667,636 30,872,019 10.29Shippensburg 304,693,352 28,164,791 10.82Slippery Rock 333,284,922 32,576,803 10.23West Chester 495,452,557 49,914,169 9.93System-wide Functions and Services
37,086,814 4,838,914 7.66
Total 4,380,279,597$ 412,751,000$ 10.61
Therefore, for every dollar invested by the Commonwealth to the State System, an average return
of approximately $10.61 in economic impact was produced. The highest return to the
Commonwealth was $14.64, generated by East Stroudsburg University. Overall, nine of the
State System universities produced at least a return of $10 for every $1 of state appropriations.
22 It is noted that state appropriations have decreased since the last study.
State System Economic and Employment Impact Study Page 17

Employment Impact of State System upon the Commonwealth
In addition to the economic impact of $4.4 billion, there is also a substantial direct employment
impact that arises from the State System’s economic activity. The direct employment impact
consist of the job opportunities that are created from the direct spending of each institution,
faculty and staff, students, or direct composite spending. A direct employment impact also arises
from capital expenditures. By applying a multiplier to the total amount spent on the direct
composite spending and the direct capital expenditures, the employment impact can be
calculated, as shown in Table 10.
Table 10: Pennsylvania’s State System of Higher Education Total Jobs Supported
UniversityComposite Direct
SpendingJobs
Output
Composite Jobs
Supported
Direct Capital
ExpendituresJobs
Output
Capital Expenditures
Jobs Supported
Total Jobs Supported
Bloomsburg $ 253,092,889 21.26 5,380 $ 10,202,671 17.94 183 5,563 California 231,632,596 21.26 4,924 2,148,569 17.94 39 4,962 Cheyney 51,381,828 21.26 1,092 7,094,604 17.94 127 1,219 Clarion 147,038,947 21.26 3,126 13,836,830 17.94 248 3,374 East Stroudsburg 171,508,729 21.26 3,646 11,239,513 17.94 202 3,847 Edinboro 138,081,494 21.26 2,935 3,808,190 17.94 68 3,003 Indiana 416,620,691 21.26 8,856 11,153,643 17.94 200 9,056 Kutztown 252,317,521 21.26 5,363 2,090,765 17.94 38 5,401 Lock Haven 107,230,841 21.26 2,279 1,628,798 17.94 29 2,309 Mansfield 67,380,028 21.26 1,432 2,809,026 17.94 50 1,483 Millersville 220,155,852 21.26 4,680 6,930,505 17.94 124 4,804 Shippensburg 210,039,779 21.26 4,465 4,839,202 17.94 87 4,551 Slippery Rock 221,506,534 21.26 4,708 5,772,919 17.94 104 4,812 West Chester 327,310,802 21.26 6,957 9,463,698 17.94 170 7,127 System-wide Functions and Services
16,050,363 21.26 341 - - - 341
Total $ 2,831,348,894 60,184 $ 93,018,933 1,669 61,853
The multiplier indicated that for each additional million dollars of direct composite spending by
a State System university, approximately 21.3 jobs were supported. Therefore, the total
employment impact resulting from the composite direct spending of the State System is 60,184
jobs. A separate multiplier was used to calculate the employment impact resulting from direct
capital expenditures; for each additional million dollars of capital spending by a State System
university, approximately 17.9 jobs were supported.23 Thus, a total of 1,669 jobs were supported
by capital expenditures alone. In total, approximately 61,853 jobs were supported by
23 Refer to Appendix E regarding the use of RIMS II multipliers.
State System Economic and Employment Impact Study Page 18
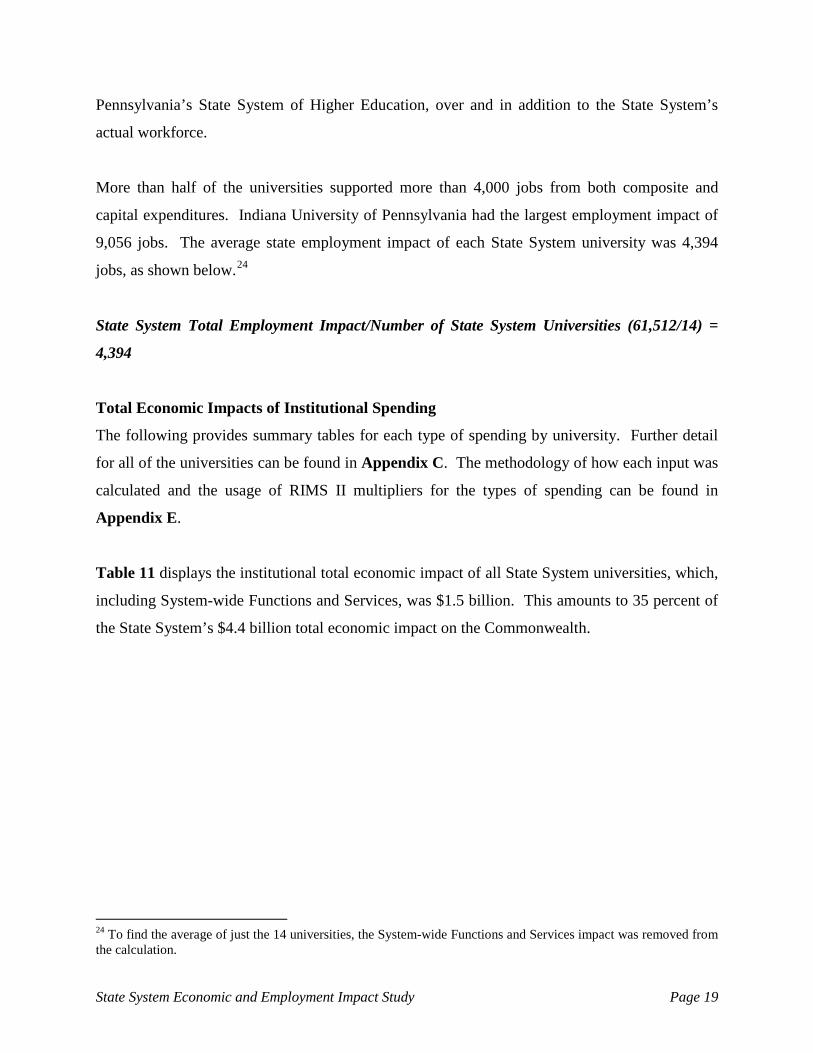
Pennsylvania’s State System of Higher Education, over and in addition to the State System’s
actual workforce.
More than half of the universities supported more than 4,000 jobs from both composite and
capital expenditures. Indiana University of Pennsylvania had the largest employment impact of
9,056 jobs. The average state employment impact of each State System university was 4,394
jobs, as shown below.24
State System Total Employment Impact/Number of State System Universities (61,512/14) =
4,394
Total Economic Impacts of Institutional Spending
The following provides summary tables for each type of spending by university. Further detail
for all of the universities can be found in Appendix C. The methodology of how each input was
calculated and the usage of RIMS II multipliers for the types of spending can be found in
Appendix E.
Table 11 displays the institutional total economic impact of all State System universities, which,
including System-wide Functions and Services, was $1.5 billion. This amounts to 35 percent of
the State System’s $4.4 billion total economic impact on the Commonwealth.
24 To find the average of just the 14 universities, the System-wide Functions and Services impact was removed from the calculation.
State System Economic and Employment Impact Study Page 19

Table 11: Direct, Indirect, Induced, and Total Economic Impact of Institutional Spending
Economic Impact of Institutional SpendingUniversity Direct Indirect Induced Total
Bloomsburg 98,937,876$ 25,061,544$ 8,581,322$ 132,580,742$ California 75,557,322 27,231,662 9,324,392 112,113,376 Cheyney 29,361,898 18,558,443 6,354,596 54,274,937 Clarion 57,713,979 16,682,250 5,712,168 80,108,397 East Stroudsburg 66,087,600 35,478,382 12,148,151 113,714,133 Edinboro 59,813,241 19,850,577 6,797,035 86,460,853 Indiana 142,883,831 45,659,463 15,634,255 204,177,549 Kutztown 101,304,151 26,217,708 8,977,204 136,499,063 Lock Haven 46,853,937 7,399,777 2,533,757 56,787,472 Mansfield 33,761,049 13,989,587 4,790,174 52,540,810 Millersville 87,040,126 10,266,170 3,515,239 100,821,535 Shippensburg 76,732,275 14,694,705 5,031,613 96,458,594 Slippery Rock 77,735,028 21,318,047 7,299,511 106,352,586 West Chester 130,436,302 35,493,043 12,153,171 178,082,516 System-wide Functions and Services
5,321,938 12,410,759 4,249,567 21,982,265
Total 1,089,540,553$ 330,312,119$ 113,102,156$ 1,532,954,828$
The two State System universities with the largest institutional impact on the Commonwealth
were Indiana University of Pennsylvania and West Chester University, with institutional impacts
of $204.2 and $178.1 million, respectively. The average institutional total impact of each State
System university was approximately $107.9 million, as shown below.25
State System Total Institutional Spending Economic Impact/Number of Universities
($1,510,972,563/14= $107,926,612)
Total Economic Impact of Faculty and Staff Spending
The majority of the State System’s faculty and staff live and spend their disposable income in
Pennsylvania, thus creating an economic impact on the Commonwealth.
25 To find the average of just the 14 universities, the System-wide Functions and Services impact was removed from the calculation.
State System Economic and Employment Impact Study Page 20

An analysis of personal consumption was conducted to determine the effect of the spending done
by faculty and staff. Data obtained from the Bureau of Labor Statistics was taken into
consideration and the analysis was broken down in to the following categories:
Type of Expenditure Definition
Food Groceries, convenience store purchases, restaurants
Apparel and Services Buying clothes, dry cleaning, laundromat services
Transportation Fuel, public transportation
Healthcare Money spent on healthcare
Entertainment Movies, special events, sports equipment and activities
Cash Contributions Churches, local communities, and organizations
Personal Insurance and Pensions Auto insurance, personal pension plans
Table 12 shows that Pennsylvania’s State System of Higher Education had a total faculty and
staff economic impact of $1 billion during the 2013-2014 fiscal year.
Table 12: Direct, Indirect, and Total Economic Impact of Faculty and Staff Spending
Economic Impact of Faculty and Staff Spending
University Direct Indirect Total Bloomsburg 63,882,803$ 26,057,796$ 89,940,599$ California 49,281,008 20,101,723 69,382,731 Cheyney 14,857,838 6,060,512 20,918,350 Clarion 40,236,304 16,412,388 56,648,692 East Stroudsburg 44,487,540 18,146,468 62,634,008 Edinboro 43,084,313 17,574,091 60,658,404 Indiana 92,656,902 37,794,750 130,451,652 Kutztown 57,311,502 23,377,362 80,688,864 Lock Haven 33,051,326 13,481,636 46,532,962 Mansfield 24,177,795 9,862,123 34,039,918 Millersville 54,725,709 22,322,617 77,048,326 Shippensburg 50,567,912 20,626,651 71,194,563 Slippery Rock 52,359,620 21,357,489 73,717,109 West Chester 95,434,848 38,927,874 134,362,722 System-wide Functions and Services
10,728,425 4,376,125 15,104,550
Total 726,843,845$ 296,479,604$ 1,023,323,449$
State System Economic and Employment Impact Study Page 21
Out of the State System’s total economic impact of $4.5 billion on the Commonwealth, the
faculty and staff spending constitutes 23.4 percent of it. West Chester University and Indiana
University of Pennsylvania were the two State System universities with the largest employee
total impact of $134.4 and $130.5 million, respectively. These two universities alone account for
approximately one-quarter of the total faculty and staff spending economic impact. The average
faculty and staff spending per university was $72 million, as shown below.26
State System Total Faculty and Staff Spending Economic Impact/Number of Universities
($1,008,218,899/14= $72,015,636).
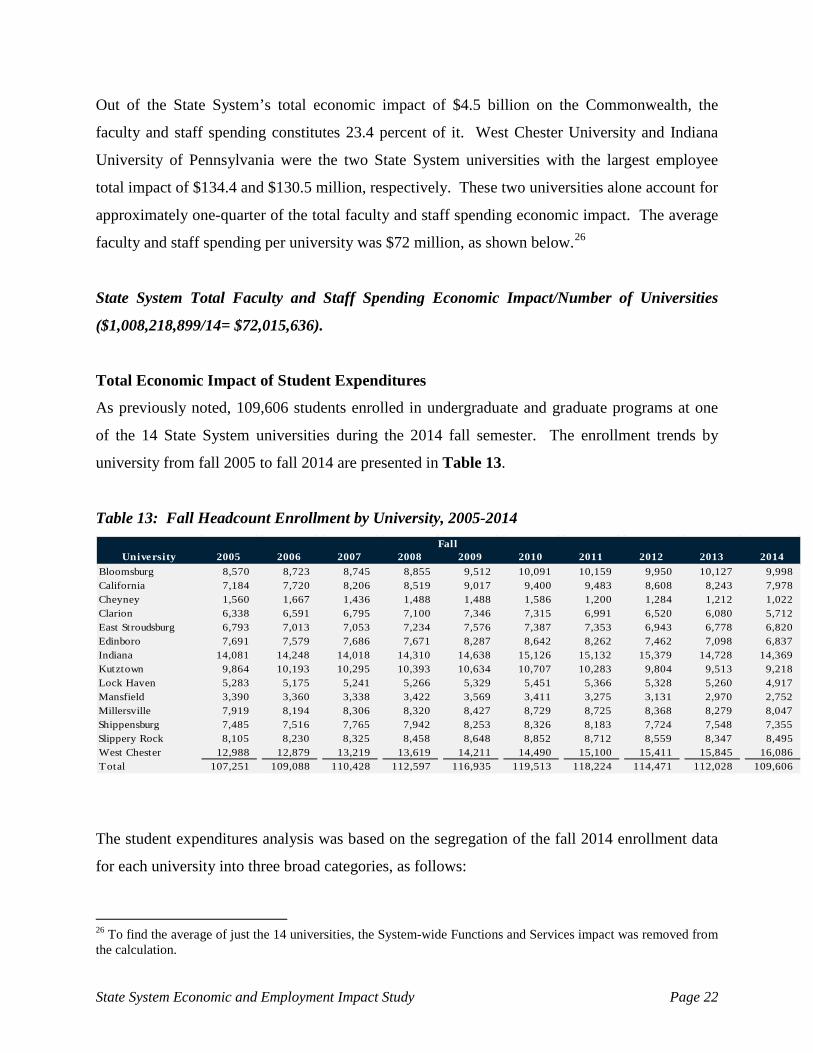
Total Economic Impact of Student Expenditures
As previously noted, 109,606 students enrolled in undergraduate and graduate programs at one
of the 14 State System universities during the 2014 fall semester. The enrollment trends by
university from fall 2005 to fall 2014 are presented in Table 13.
Table 13: Fall Headcount Enrollment by University, 2005-2014
University 2005 2006 2007 2008 2009 2010 2011 2012 2013 2014Bloomsburg 8,570 8,723 8,745 8,855 9,512 10,091 10,159 9,950 10,127 9,998 California 7,184 7,720 8,206 8,519 9,017 9,400 9,483 8,608 8,243 7,978 Cheyney 1,560 1,667 1,436 1,488 1,488 1,586 1,200 1,284 1,212 1,022 Clarion 6,338 6,591 6,795 7,100 7,346 7,315 6,991 6,520 6,080 5,712 East Stroudsburg 6,793 7,013 7,053 7,234 7,576 7,387 7,353 6,943 6,778 6,820 Edinboro 7,691 7,579 7,686 7,671 8,287 8,642 8,262 7,462 7,098 6,837 Indiana 14,081 14,248 14,018 14,310 14,638 15,126 15,132 15,379 14,728 14,369 Kutztown 9,864 10,193 10,295 10,393 10,634 10,707 10,283 9,804 9,513 9,218 Lock Haven 5,283 5,175 5,241 5,266 5,329 5,451 5,366 5,328 5,260 4,917 Mansfield 3,390 3,360 3,338 3,422 3,569 3,411 3,275 3,131 2,970 2,752 Millersville 7,919 8,194 8,306 8,320 8,427 8,729 8,725 8,368 8,279 8,047 Shippensburg 7,485 7,516 7,765 7,942 8,253 8,326 8,183 7,724 7,548 7,355 Slippery Rock 8,105 8,230 8,325 8,458 8,648 8,852 8,712 8,559 8,347 8,495 West Chester 12,988 12,879 13,219 13,619 14,211 14,490 15,100 15,411 15,845 16,086 Total 107,251 109,088 110,428 112,597 116,935 119,513 118,224 114,471 112,028 109,606
Fall
The student expenditures analysis was based on the segregation of the fall 2014 enrollment data
for each university into three broad categories, as follows:
26 To find the average of just the 14 universities, the System-wide Functions and Services impact was removed from the calculation.
State System Economic and Employment Impact Study Page 22

• Students living on campus in university housing or university affiliated private housing;
• Students living off campus in private, non-affiliated housing; and
• Students living off campus with parents.
In order to capture the amount of student spending resulting from students who live in affiliated
university housing, an aggregate of privatized replacement housing fees for each university was
obtained. A percent was then calculated to determine the amount of room and board fees that
were collected by affiliates, rather than the universities, and subsequently applied to the total
number of students living in affiliated university housing. Average cost estimates for room,
board, books and supplies, and other expenses were then applied to the students who live off-
campus and pay for room and board to parties other than the university directly.27 In the other
instances in which students lived in on-campus housing or with a parent, only books and supplies
and other expenses were included in the aggregated total. This was done in order to avoid
double counting room and board expenditures that have already been accounted for in other
aspects of the analysis.
The estimated spending of these students contributed to the economic impact of the State
System, as shown in table in Table 14.
27 Average cost estimates were supplied on a university by university basis by the State System.
State System Economic and Employment Impact Study Page 23
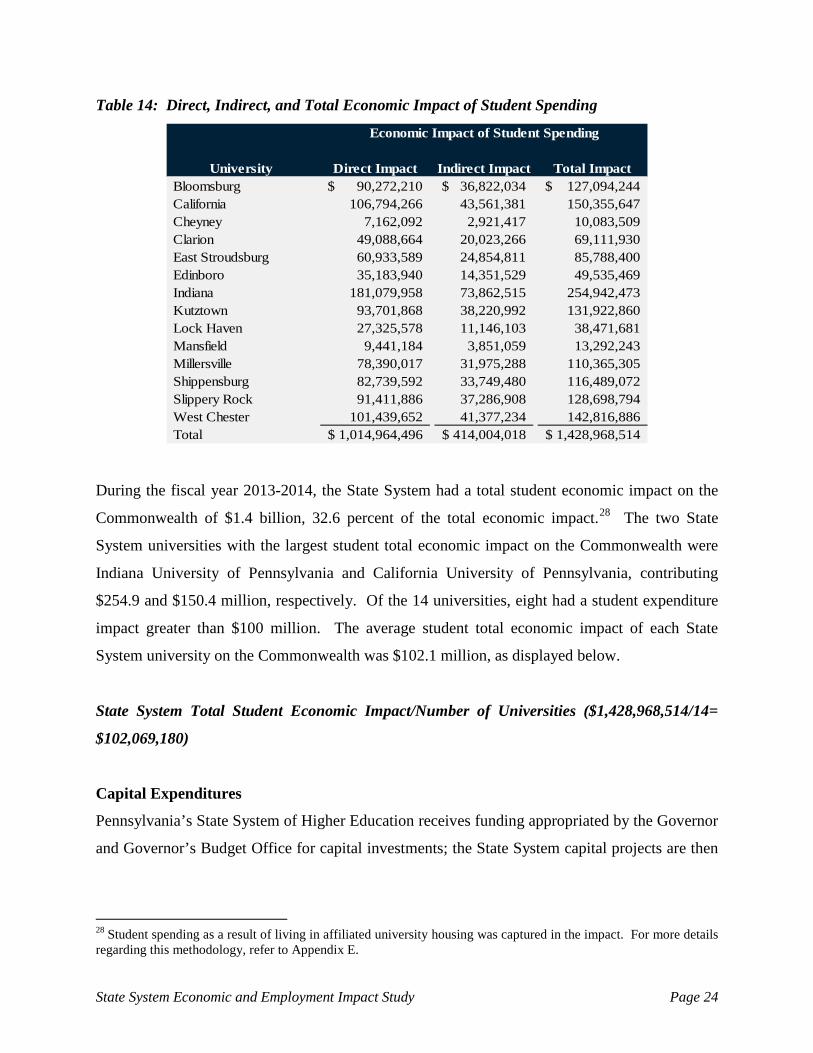
Table 14: Direct, Indirect, and Total Economic Impact of Student Spending
Economic Impact of Student Spending
University Direct Impact Indirect Impact Total ImpactBloomsburg 90,272,210$ 36,822,034$ 127,094,244$ California 106,794,266 43,561,381 150,355,647 Cheyney 7,162,092 2,921,417 10,083,509 Clarion 49,088,664 20,023,266 69,111,930 East Stroudsburg 60,933,589 24,854,811 85,788,400 Edinboro 35,183,940 14,351,529 49,535,469 Indiana 181,079,958 73,862,515 254,942,473 Kutztown 93,701,868 38,220,992 131,922,860 Lock Haven 27,325,578 11,146,103 38,471,681 Mansfield 9,441,184 3,851,059 13,292,243 Millersville 78,390,017 31,975,288 110,365,305 Shippensburg 82,739,592 33,749,480 116,489,072 Slippery Rock 91,411,886 37,286,908 128,698,794 West Chester 101,439,652 41,377,234 142,816,886 Total 1,014,964,496$ 414,004,018$ 1,428,968,514$
During the fiscal year 2013-2014, the State System had a total student economic impact on the
Commonwealth of $1.4 billion, 32.6 percent of the total economic impact.28 The two State
System universities with the largest student total economic impact on the Commonwealth were
Indiana University of Pennsylvania and California University of Pennsylvania, contributing
$254.9 and $150.4 million, respectively. Of the 14 universities, eight had a student expenditure
impact greater than $100 million. The average student total economic impact of each State
System university on the Commonwealth was $102.1 million, as displayed below.
State System Total Student Economic Impact/Number of Universities ($1,428,968,514/14=
$102,069,180)
Capital Expenditures
Pennsylvania’s State System of Higher Education receives funding appropriated by the Governor
and Governor’s Budget Office for capital investments; the State System capital projects are then
28 Student spending as a result of living in affiliated university housing was captured in the impact. For more details regarding this methodology, refer to Appendix E.
State System Economic and Employment Impact Study Page 24
executed by the Department of General Services.29 In the 2013-2014 fiscal year, the State
System received $65.2 million in capital investment appropriations. Additionally, the State
System receives funding through the Annual Key ‘93 Deferred Maintenance Appropriation
authorized by the Keystone Recreation, Parks, and Conservation Fund Act of 1993 and funded
through the realty transfer tax. In the 2013-2014 fiscal year, the State System received $13.6
million in Key ‘93 Deferred Maintenance appropriations. The total economic impact these funds
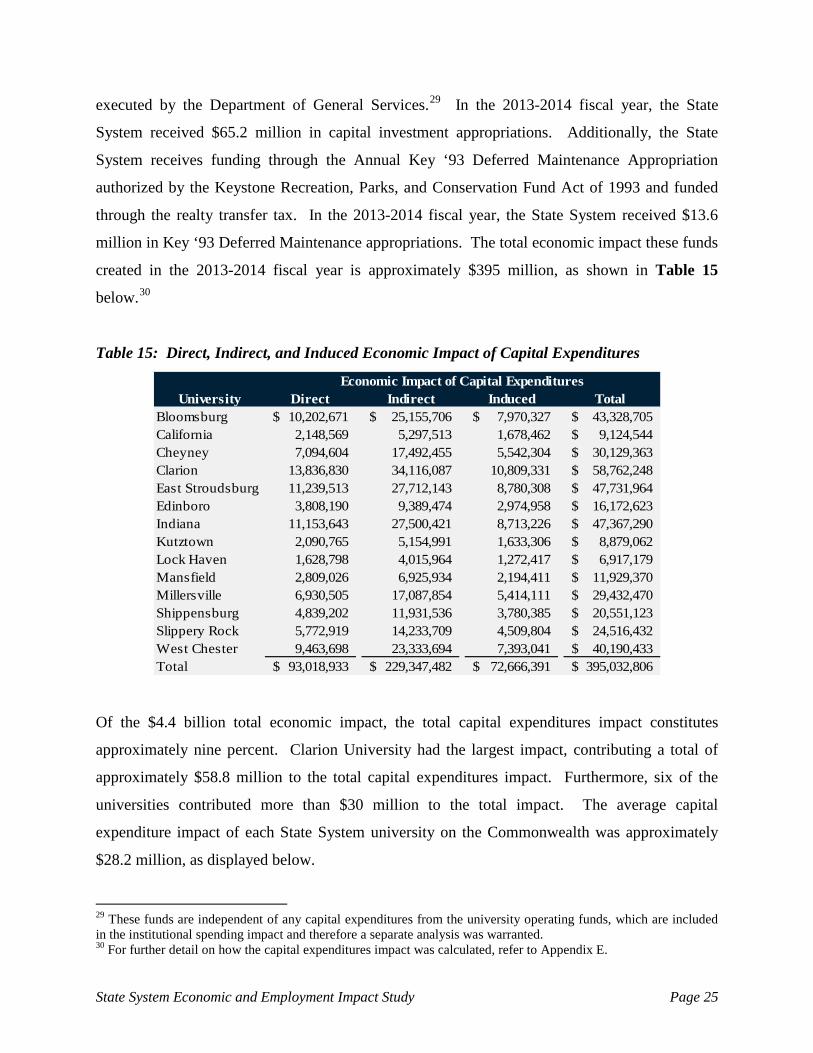
created in the 2013-2014 fiscal year is approximately $395 million, as shown in Table 15
below.30
Table 15: Direct, Indirect, and Induced Economic Impact of Capital Expenditures
Economic Impact of Capital ExpendituresUniversity Direct Indirect Induced Total
Bloomsburg 10,202,671$ 25,155,706$ 7,970,327$ 43,328,705$ California 2,148,569 5,297,513 1,678,462 9,124,544$ Cheyney 7,094,604 17,492,455 5,542,304 30,129,363$ Clarion 13,836,830 34,116,087 10,809,331 58,762,248$ East Stroudsburg 11,239,513 27,712,143 8,780,308 47,731,964$ Edinboro 3,808,190 9,389,474 2,974,958 16,172,623$ Indiana 11,153,643 27,500,421 8,713,226 47,367,290$ Kutztown 2,090,765 5,154,991 1,633,306 8,879,062$ Lock Haven 1,628,798 4,015,964 1,272,417 6,917,179$ Mansfield 2,809,026 6,925,934 2,194,411 11,929,370$ Millersville 6,930,505 17,087,854 5,414,111 29,432,470$ Shippensburg 4,839,202 11,931,536 3,780,385 20,551,123$ Slippery Rock 5,772,919 14,233,709 4,509,804 24,516,432$ West Chester 9,463,698 23,333,694 7,393,041 40,190,433$ Total 93,018,933$ 229,347,482$ 72,666,391$ 395,032,806$
Of the $4.4 billion total economic impact, the total capital expenditures impact constitutes
approximately nine percent. Clarion University had the largest impact, contributing a total of
approximately $58.8 million to the total capital expenditures impact. Furthermore, six of the
universities contributed more than $30 million to the total impact. The average capital
expenditure impact of each State System university on the Commonwealth was approximately
$28.2 million, as displayed below.
29 These funds are independent of any capital expenditures from the university operating funds, which are included in the institutional spending impact and therefore a separate analysis was warranted. 30 For further detail on how the capital expenditures impact was calculated, refer to Appendix E.
State System Economic and Employment Impact Study Page 25

State System Total Capital Expenditure Impact/Number of Universities ($395,032,806/14=
$28,216,629)
Visitor Spending
The applicable data for visitor spending analysis was limited and therefore subjective inputs had
to be utilized. For this reason, visitor spending has been excluded from the final economic
impact of the State System in light of possible significant over or understatement. Refer to
Appendix D for an alternative analysis regarding the effects of visitor spending.
Employment Impact of Jobs Supported as a Result of State System Spending
Additional economic benefit, resulting from the total direct spending attributed to the State
System universities to the Commonwealth, can be quantified. As shown in Table 10 of this
report, the total direct spending attributed to each university generates an employment impact.
The aggregate result of total direct spending supports approximately 61,853 jobs within the
Commonwealth, in addition to the State System employees.
The additional jobs supported by the existence of the State System universities results in
increased consumption of good and services within Pennsylvania. Further, these jobs and
corresponding consumption of good and services provide an additional source of revenues to the
Commonwealth in the form of increased sales and taxes, as demonstrated in Tables 16 and 17.
State System Economic and Employment Impact Study Page 26

Table 16: Consumption Attributable to the Employment Impact of Pennsylvania’s State System of Higher Education 31,32
UniversityTotal Jobs Supported
Per Capita Income
Estimated Wages
Consumption Factor
Estimated Consumption
Bloomsburg 5,563 $ 46,202 $ 257,021,726 80.11% $ 205,900,105 California 4,962 46,202 229,254,324 80.11% 183,655,639 Cheyney 1,219 46,202 56,320,238 80.11% 45,118,143 Clarion 3,374 46,202 155,885,548 80.11% 124,879,913 East Stroudsburg 3,847 46,202 177,739,094 80.11% 142,386,788 Edinboro 3,003 46,202 138,744,606 80.11% 111,148,304 Indiana 9,056 46,202 418,405,312 80.11% 335,184,495 Kutztown 5,401 46,202 249,537,002 80.11% 199,904,092 Lock Haven 2,309 46,202 106,680,418 80.11% 85,461,683 Mansfield 1,483 46,202 68,517,566 80.11% 54,889,422 Millersville 4,804 46,202 221,954,408 80.11% 177,807,676 Shippensburg 4,551 46,202 210,265,302 80.11% 168,443,533 Slippery Rock 4,812 46,202 222,324,024 80.11% 178,103,776 West Chester 7,127 46,202 329,281,654 80.11% 263,787,533 System-wide Functions and Services
341 46,202 15,754,882 80.11% 12,621,236
Total 61,853 $ 2,857,686,104 $2,289,292,338
All but three universities, and System-wide Functions and Services, contributed over $100
million additional impact by way of estimated consumption. An aggregation of the total
economic impact resulting from the State System supported jobs is an estimated $2.3 billion in
additional consumption.
In addition to the revenue generated by State System employees, total income tax revenue and
sales tax revenue attributed to jobs supported by State System universities is shown in Table 17.
For the purposes of this analysis, local earned income taxes, local services tax, and payments to
the unemployment trust fund were not considered.
31 2013 annual per capita income for Pennsylvania was obtained from the Bureau of Economic Analysis. 32 The consumption factor is the average total consumption as a percentage of revenue for all income ranges obtained from Bureau of Labor Statistics.
State System Economic and Employment Impact Study Page 27

Table 17: Sales, Income, and Total State Tax Revenue of Jobs Supported Attributable to Pennsylvania’s State System of Higher Education 33,34
UniversityEstimated
Wages
Estimated Income Tax
RevenueEstimated
Consumption
Estmated Taxable
Spending
Estimated Sales Tax Revenue
Total Tax Payments
Bloomsburg $257,021,726 $7,890,567 $205,900,105 $49,189,535 $2,951,372 $10,841,939California 229,254,324 $7,038,108 183,655,639 43,875,332 2,632,520 9,670,628Cheyney 56,320,238 $1,729,031 45,118,143 10,778,724 646,723 2,375,755Clarion 155,885,548 $4,785,686 124,879,913 29,833,811 1,790,029 6,575,715East Stroudsburg 177,739,094 $5,456,590 142,386,788 34,016,204 2,040,972 7,497,562Edinboro 138,744,606 $4,259,459 111,148,304 26,553,330 1,593,200 5,852,659Indiana 418,405,312 $12,845,043 335,184,495 80,075,576 4,804,535 17,649,578Kutztown 249,537,002 $7,660,786 199,904,092 47,757,088 2,865,425 10,526,211Lock Haven 106,680,418 $3,275,089 85,461,683 20,416,796 1,225,008 4,500,097Mansfield 68,517,566 $2,103,489 54,889,422 13,113,083 786,785 2,890,274Millersville 221,954,408 $6,814,000 177,807,676 42,478,254 2,548,695 9,362,696Shippensburg 210,265,302 $6,455,145 168,443,533 40,241,160 2,414,470 8,869,614Slippery Rock 222,324,024 $6,825,348 178,103,776 42,548,992 2,552,940 9,378,287West Chester 329,281,654 $10,108,947 263,787,533 63,018,842 3,781,130 13,890,077Systen-wide Functions and Services
15,754,882 $483,675 12,621,236 3,015,213 180,913 664,588
Total $2,857,686,104 $87,730,963 $2,289,292,338 $546,911,940 $32,814,716 $120,545,680
In the aggregate, the revenues realized by the Commonwealth in terms of payroll tax
withholdings and sales tax receipts for the jobs supported by the State System were
approximately $120.5 million or approximately 29.2 percent of the Commonwealth’s
appropriations for the State System for fiscal year 2013-2014.
Tax Revenues Allocable to State System Universities
Income tax payments made to the Commonwealth, in the form of payroll withholdings from
employees of State System universities, represent a significant revenue stream flowing to the
Commonwealth on a year-over-year basis. The total state income tax revenue, on a university by
university basis, is presented in Table 18.
33 Pennsylvania’s sales tax rate is six percent and income taxes are based on Pennsylvania’s 3.07 percent flat tax rate. 34 Taxable consumption calculated at 23.89 percent of total consumption; refer to Appendix E for additional detail.
State System Economic and Employment Impact Study Page 28

Table 18: Income Tax Revenue Attributable to Employees of the State System
UniversityState Tax
Withholdings Local EIT
Local Services
TaxUnemployment
TaxTotal Tax Payments
Bloomsburg 2,292,524$ 1,158,465$ 77,722$ 50,794$ 3,579,505$ California 1,787,436 663,336 92,342 39,812 2,582,926 Cheyney 488,093 250,803 55 11,401 750,352 Clarion 1,420,794 479,413 57,192 32,025 1,989,425 East Stroudsburg 1,482,286 566,449 46,416 34,538 2,129,689 Edinboro 1,542,094 572,167 61,702 34,775 2,210,738 Indiana 3,455,150 1,415,326 120,124 76,292 5,066,892 Kutztown 2,022,440 753,672 88,707 45,600 2,910,419 Lock Haven 1,200,846 602,999 38,157 26,821 1,868,823 Mansfield 833,113 408,587 34,338 18,729 1,294,767 Millersville 2,018,212 698,065 81,976 44,270 2,842,524 Shippensburg 1,787,469 888,275 65,008 41,300 2,782,053 Slippery Rock 1,897,186 689,468 58,764 42,715 2,688,133 West Chester 3,349,207 1,348,667 126,464 76,982 4,901,319 System-wide Functions and Services
390,398 200,864 7,946 8,396 607,604
Total 25,967,248$ 10,696,556$ 956,914$ 584,451$ 38,205,169$
The State System provides an added benefit to the local municipalities in the form of local
earned income taxes and local services taxes. State System employees also help to fund the
unemployment trust fund through payroll withholdings, helping to strengthen the
Commonwealth’s social safety net available to displaced workers.
In addition to the payroll tax withholdings to the Commonwealth and to local municipalities, the
State System, through the spending of its employees and students, generates sales tax revenue for
the Commonwealth through the consumption of taxable goods and services. The total state sales
tax revenue, attributed to State System universities, is presented in Table 19.
State System Economic and Employment Impact Study Page 29
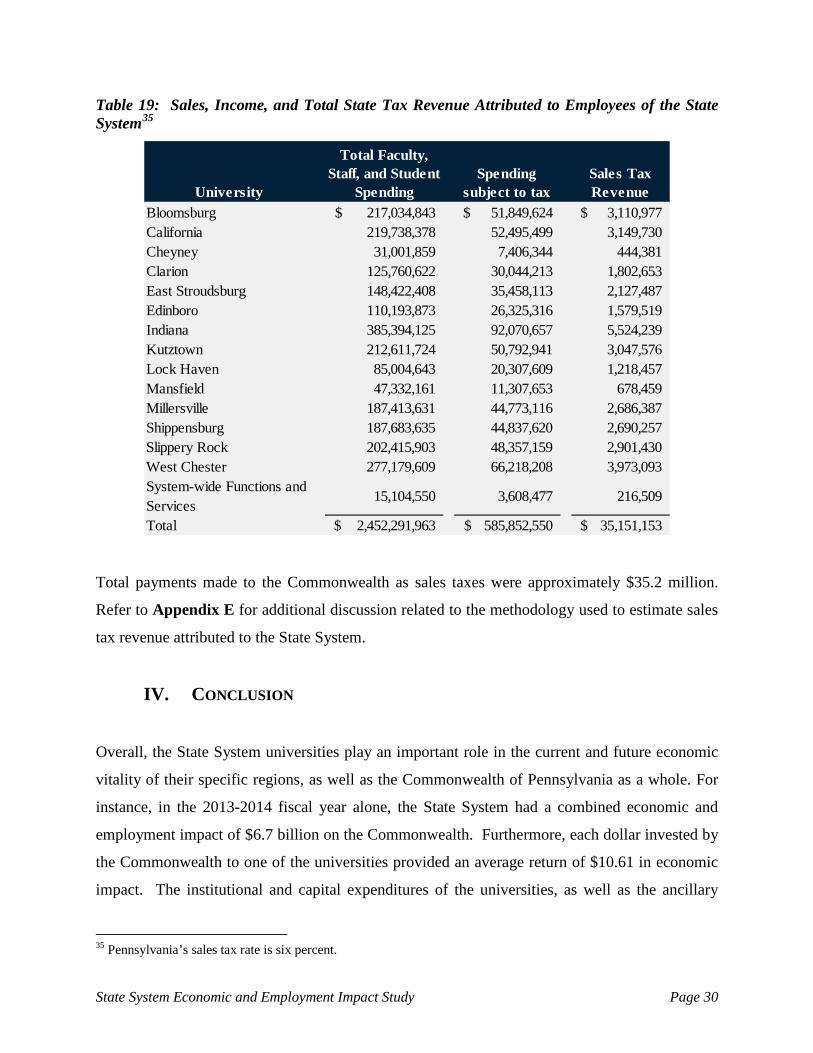
Table 19: Sales, Income, and Total State Tax Revenue Attributed to Employees of the State System35
University
Total Faculty, Staff, and Student
SpendingSpending
subject to taxSales Tax Revenue
Bloomsburg 217,034,843$ 51,849,624$ 3,110,977$ California 219,738,378 52,495,499 3,149,730 Cheyney 31,001,859 7,406,344 444,381 Clarion 125,760,622 30,044,213 1,802,653 East Stroudsburg 148,422,408 35,458,113 2,127,487 Edinboro 110,193,873 26,325,316 1,579,519 Indiana 385,394,125 92,070,657 5,524,239 Kutztown 212,611,724 50,792,941 3,047,576 Lock Haven 85,004,643 20,307,609 1,218,457 Mansfield 47,332,161 11,307,653 678,459 Millersville 187,413,631 44,773,116 2,686,387 Shippensburg 187,683,635 44,837,620 2,690,257 Slippery Rock 202,415,903 48,357,159 2,901,430 West Chester 277,179,609 66,218,208 3,973,093 System-wide Functions and Services
15,104,550 3,608,477 216,509
Total 2,452,291,963$ 585,852,550$ 35,151,153$
Total payments made to the Commonwealth as sales taxes were approximately $35.2 million.
Refer to Appendix E for additional discussion related to the methodology used to estimate sales
tax revenue attributed to the State System.
IV. CONCLUSION
Overall, the State System universities play an important role in the current and future economic
vitality of their specific regions, as well as the Commonwealth of Pennsylvania as a whole. For
instance, in the 2013-2014 fiscal year alone, the State System had a combined economic and
employment impact of $6.7 billion on the Commonwealth. Furthermore, each dollar invested by
the Commonwealth to one of the universities provided an average return of $10.61 in economic
impact. The institutional and capital expenditures of the universities, as well as the ancillary
35 Pennsylvania’s sales tax rate is six percent.
State System Economic and Employment Impact Study Page 30
spending by the university’s faculty, staff, and students, provided a significant direct economic
impact totaling $4.4 billion. The institutional spending of each university also produced an
employment impact; in aggregate, 61,853 jobs were supported by Pennsylvania’s State System
of Higher Education. As a result of these jobs, there was an additional estimated $2.3 billion in
economic benefit to the Commonwealth. The State System also acts as a source of tax revenues;
total payments made to the Commonwealth via income and sales taxes were an estimated $120.5
million in the 2013-2014 fiscal year. Lastly, as institutions of higher education, the State System
universities supply the demand of highly skilled workers to ensure that the Commonwealth of
Pennsylvania remains a competitive contributor to the national and international economy.
State System Economic and Employment Impact Study Page 31

Appendix A: Economic Impact Background
Economic growth can, in part, be traced back to investments in higher education. University,
faculty and staff, and student spending stem from investments which in turn, creates economic
development in the form of jobs, income, and increased economic activity within the university’s
region. Economic impact studies help to quantify this impact which is generated by higher
education institutions.
The intention of this report is to measure the economic impact of the 14 universities and the
related entities of the State System on the Commonwealth. The State System receives funding
from various sources such as: state appropriations, revenues from tuition and fees, federal and
research grants, private donations and revenues provided by services that each university offers.
From this funding, an impact, attributable to the purchasing of goods and services during the
fiscal year 2013-2014, can be determined. All of the universities within the State System spend
billions of dollars on an annual basis, which greatly impacts the counties in which each campus
is located. Additionally, the impact resulting from the expenditures made by the State System’s
faculty and staff, and students can be measured.
Not only do State System universities impact economic growth, but the universities also improve
economic development within their respective regions; each university has taken on initiatives in
the form of human capital and workforce development programs or entrepreneurial assistance
programs to do so. An Economic Development Report was furnished for the 2013-2014 year
assessing all economic, workforce, and community involvement activities for the State System
universities to assist with this aspect of the study.1
1 Millersville University did not provide an Economic Development Report for 2013-2014.
Appendix A Page 1

The State System as an Employer
Table A.1 provides a summary of how Pennsylvania’s State System of Higher Education acts as
a major employer in many of the counties in which a State System university is present.2
Important findings to note:
• The State System was the 18th largest employer in the Commonwealth;
• The State System was ranked as one of the top 10 employers in seven counties in which a
university is located; and
• Clarion University and Indiana University of Pennsylvania are the top employer in
Clarion and Indiana County, respectively.
Table A.1: State System Employer Rankings, 2nd quarter, 2014
2 Employer ranking for the State System obtained from Pennsylvania’s Department of Labor and Industry Center for Workforce Information and Analysis. Only the top 50 employers in each county were ranked.
University CountyEmployerRanking
Bloomsburg Columbia 2California Washington 7Cheyney Delaware N/AClarion Clarion 1East Stroudsburg Monroe 11Edinboro Erie 22Indiana Indiana 1Kutztown Berks 18Lock Haven Clinton 3Mansfield Tioga 4Millersville Lancaster 26Shippensburg Cumberland 22Slippery Rock Butler 9West Chester Chester 14System-wide Site Dauphin N/ASystem-wide Site Philadelphia N/AState System Totals Pennsylvania 18
Appendix A Page 2
*
*A portion of the Cheyney campus lies within Chester County.
Human Capital and Workforce Development Training
An overall objective of any university is to provide the necessary education and training
to students in order for them to have the tools to become productive and tax-paying members of
their communities; the State System schools are no exception. The universities within the State
System are engaged in various programs to help increase workforce knowledge and skills, as
well as job productivity. To do so, the universities pair up with local businesses. As a
result, the businesses have the potential to experience economic growth and may consider
operating within the vicinity of a State System university.
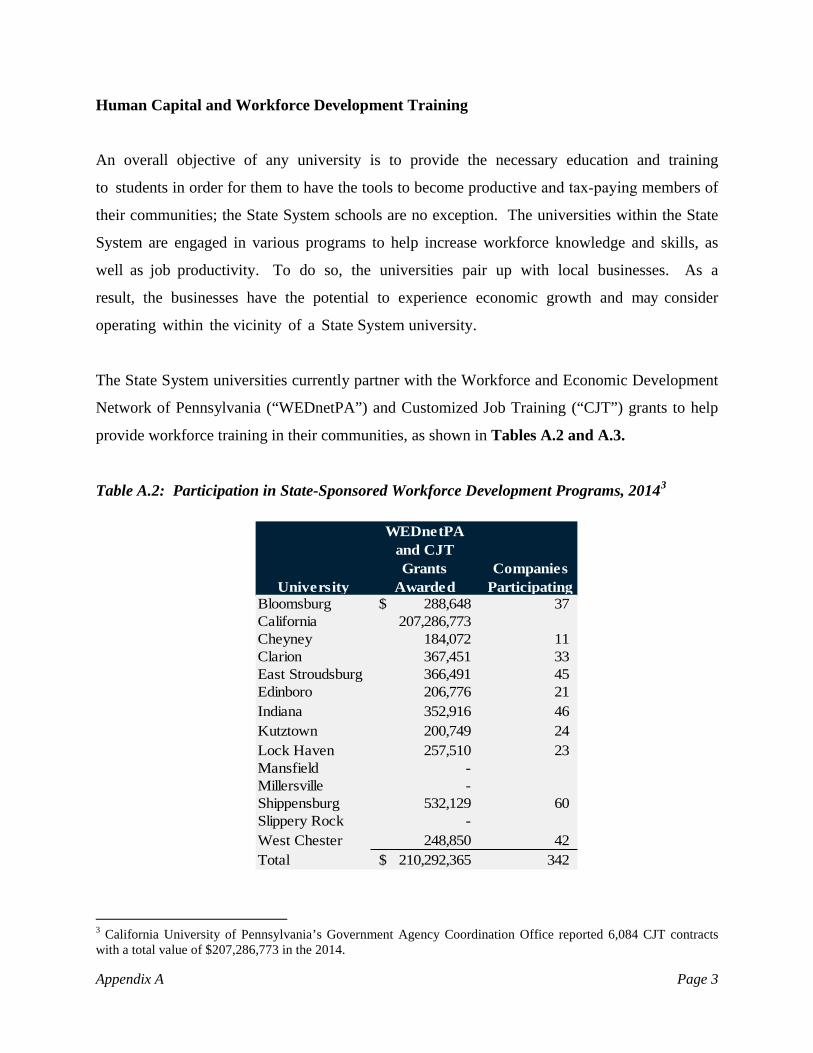
The State System universities currently partner with the Workforce and Economic Development
Network of Pennsylvania (“WEDnetPA”) and Customized Job Training (“CJT”) grants to help
provide workforce training in their communities, as shown in Tables A.2 and A.3.
Table A.2: Participation in State-Sponsored Workforce Development Programs, 20143
3 California University of Pennsylvania’s Government Agency Coordination Office reported 6,084 CJT contracts with a total value of $207,286,773 in the 2014.
University
WEDnetPA and CJT Grants
AwardedCompanies
ParticipatingBloomsburg 288,648$ 37 California 207,286,773 Cheyney 184,072 11 Clarion 367,451 33 East Stroudsburg 366,491 45 Edinboro 206,776 21 Indiana 352,916 46 Kutztown 200,749 24 Lock Haven 257,510 23 Mansfield - Millersville - Shippensburg 532,129 60 Slippery Rock - West Chester 248,850 42 Total 210,292,365$ 342
Appendix A Page 3

Table A.3: State System Participation in Economic Development Initiatives by University
University WEDnetPA
and CJT SBDCBusiness
IncubatorsBloomsburg XCalifornia XCheyney XClarion X X XEast Stroudsburg X XEdinboro X XIndiana X X XKutztown X X XLock Haven X XMansfieldMillersvilleShippensburg X XSlippery Rock XWest Chester XState System 11 5 6
By having these affiliates, the State System received a total of $210 million in funds to direct
towards workforce development. Additionally, the universities were able to establish
relationships with a total of 342 local businesses.
For students who take advantage of these opportunities and improve their workforce skills,
higher income is likely to result, as shown in Table A.4.
Table A.4: Pennsylvania Educational Attainment and Median Earnings, 20134
DescriptionUnited States Pennsylvania
Difference between
PA and US
Difference between PA HS
Graduate and Post-Secondary Education (%)
Population 25 years and over with earningsLess than high school graduate 20,149 21,014 865 High school graduate (includes equivalency) 27,350 29,018 1,668 Some college or associate's degree 32,387 34,605 2,218 19.25%Bachelor degree 50,050 49,661 (389) 71.14%Graduate or professional degree 65,565 66,359 794 128.68%
4 Data obtained from the 2013 American Community Survey conducted by the US Census Bureau.
Appendix A Page 4
In 2013, a Pennsylvania resident who obtained a bachelor’s degree earned on average $49,661.
On average, by obtaining a bachelor’s degree, a Pennsylvania resident earned approximately
71percent more than a high school graduate.
Entrepreneurial Business Assistance
The State System universities also support economic development in their regions through
Entrepreneurial Business programs and Small Business Development Centers (“SBDC”). These
programs educate students through curricular offerings but also extend services to the citizens of
the Commonwealth who are looking for assistance. By doing so, a vast amount of networking
occurs resulting in research and business opportunities for those involved. As demonstrated by
Table A.3, State System universities are involved in wide array of these programs.
Intellectual Property Creation and Commercialization of Innovation
Universities provide an important source of innovation, and thus are key factors of economic
development. Furthermore the commercialization of ideas that result from the research
conducted at these universities increases economic productivity. As shown in Table A.3, six of
the State System universities are collaborating to commercialize ideas by partnering with
businesses through the use of business incubators.
For more detail regarding economic development, refer to the individual narratives for each
university in Appendix C.
Appendix A Page 5
Appendix B: Economic Overview of Pennsylvania and State System Counties
The following is an overall economic profile of the United States, Pennsylvania, and the
20 Pennsylvania counties in which a State System university has a presence. Included
are comparative tables of key demographics which also provide an overview at the county
level. Thus, the purpose of the economic data analysis is to provide fundamental facts
that the existence of the State System contributes positively to each county.
Table B.1 includes population projections for the United States, Pennsylvania, and counties with
a State System university presence.1 Some important projections for 2010 to 2030 are:
• Pennsylvania’s growth is projected to be 8.3 percent;
• Lancaster County (Millersville University) is projected to have the largest population
increase of 15.9 percent; and
• Armstrong County (Indiana University of Pennsylvania’s satellite campus) is projected to
decrease the most in population by 5.7 percent.
1 According to 2010 Census Data, StatsAmerica data provided by the Indiana Business Research Center and Pennsylvania Abstract: A Statistical Fact Book.
Appendix B Page 1
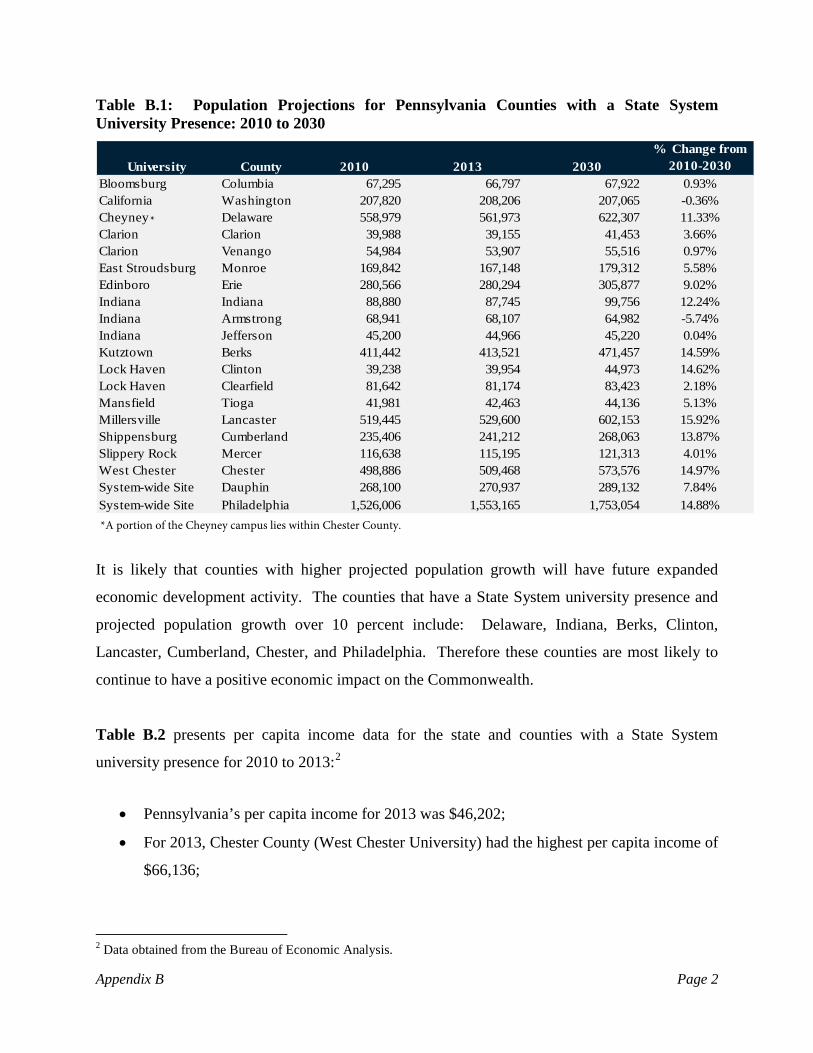
Table B.1: Population Projections for Pennsylvania Counties with a State System University Presence: 2010 to 2030
University County 2010 2013 2030% Change from
2010-2030Bloomsburg Columbia 67,295 66,797 67,922 0.93%California Washington 207,820 208,206 207,065 -0.36%Cheyney Delaware 558,979 561,973 622,307 11.33%Clarion Clarion 39,988 39,155 41,453 3.66%Clarion Venango 54,984 53,907 55,516 0.97%East Stroudsburg Monroe 169,842 167,148 179,312 5.58%Edinboro Erie 280,566 280,294 305,877 9.02%Indiana Indiana 88,880 87,745 99,756 12.24%Indiana Armstrong 68,941 68,107 64,982 -5.74%Indiana Jefferson 45,200 44,966 45,220 0.04%Kutztown Berks 411,442 413,521 471,457 14.59%Lock Haven Clinton 39,238 39,954 44,973 14.62%Lock Haven Clearfield 81,642 81,174 83,423 2.18%Mansfield Tioga 41,981 42,463 44,136 5.13%Millersville Lancaster 519,445 529,600 602,153 15.92%Shippensburg Cumberland 235,406 241,212 268,063 13.87%Slippery Rock Mercer 116,638 115,195 121,313 4.01%West Chester Chester 498,886 509,468 573,576 14.97%System-wide Site Dauphin 268,100 270,937 289,132 7.84%System-wide Site Philadelphia 1,526,006 1,553,165 1,753,054 14.88%
It is likely that counties with higher projected population growth will have future expanded
economic development activity. The counties that have a State System university presence and
projected population growth over 10 percent include: Delaware, Indiana, Berks, Clinton,
Lancaster, Cumberland, Chester, and Philadelphia. Therefore these counties are most likely to
continue to have a positive economic impact on the Commonwealth.
Table B.2 presents per capita income data for the state and counties with a State System
university presence for 2010 to 2013:2
• Pennsylvania’s per capita income for 2013 was $46,202;
• For 2013, Chester County (West Chester University) had the highest per capita income of
$66,136;
2 Data obtained from the Bureau of Economic Analysis.
Appendix B Page 2
*
*A portion of the Cheyney campus lies within Chester County.
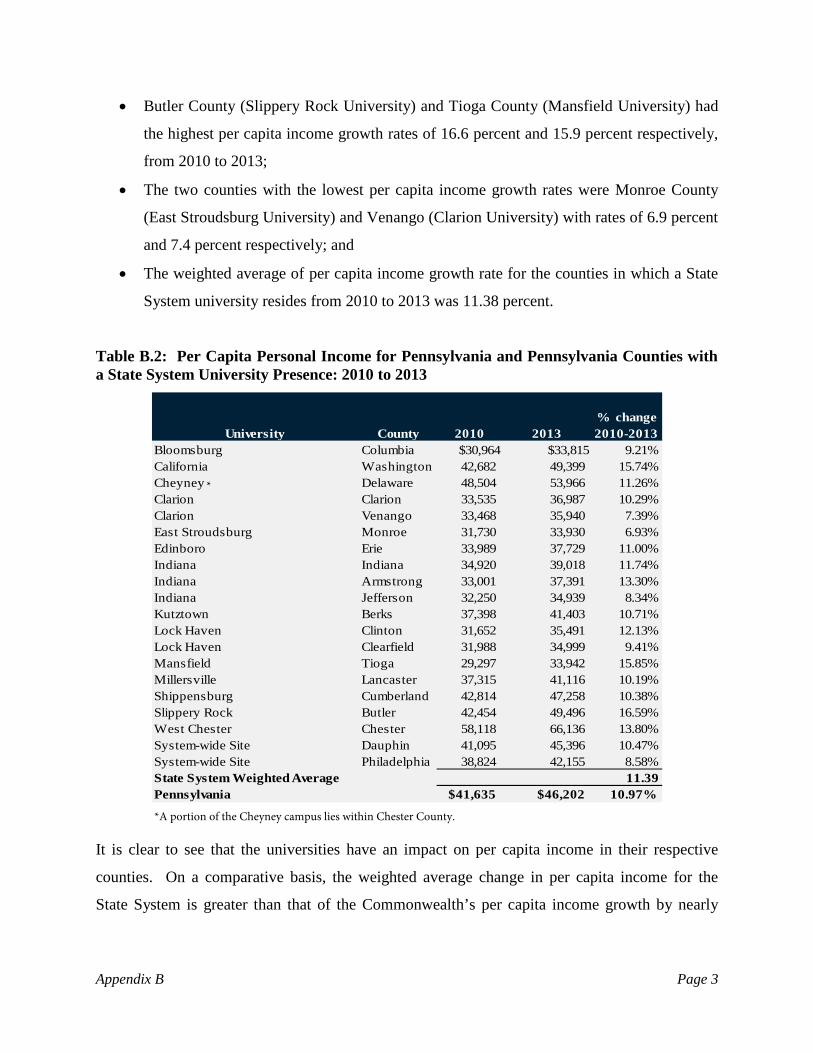
• Butler County (Slippery Rock University) and Tioga County (Mansfield University) had
the highest per capita income growth rates of 16.6 percent and 15.9 percent respectively,
from 2010 to 2013;
• The two counties with the lowest per capita income growth rates were Monroe County
(East Stroudsburg University) and Venango (Clarion University) with rates of 6.9 percent
and 7.4 percent respectively; and
• The weighted average of per capita income growth rate for the counties in which a State
System university resides from 2010 to 2013 was 11.38 percent.
Table B.2: Per Capita Personal Income for Pennsylvania and Pennsylvania Counties with a State System University Presence: 2010 to 2013
University County 2010 2013% change 2010-2013
Bloomsburg Columbia $30,964 $33,815 9.21%California Washington 42,682 49,399 15.74%Cheyney Delaware 48,504 53,966 11.26%Clarion Clarion 33,535 36,987 10.29%Clarion Venango 33,468 35,940 7.39%East Stroudsburg Monroe 31,730 33,930 6.93%Edinboro Erie 33,989 37,729 11.00%Indiana Indiana 34,920 39,018 11.74%Indiana Armstrong 33,001 37,391 13.30%Indiana Jefferson 32,250 34,939 8.34%Kutztown Berks 37,398 41,403 10.71%Lock Haven Clinton 31,652 35,491 12.13%Lock Haven Clearfield 31,988 34,999 9.41%Mansfield Tioga 29,297 33,942 15.85%Millersville Lancaster 37,315 41,116 10.19%Shippensburg Cumberland 42,814 47,258 10.38%Slippery Rock Butler 42,454 49,496 16.59%West Chester Chester 58,118 66,136 13.80%System-wide Site Dauphin 41,095 45,396 10.47%System-wide Site Philadelphia 38,824 42,155 8.58%State System Weighted Average 11.39Pennsylvania $41,635 $46,202 10.97%
It is clear to see that the universities have an impact on per capita income in their respective
counties. On a comparative basis, the weighted average change in per capita income for the
State System is greater than that of the Commonwealth’s per capita income growth by nearly
Appendix B Page 3
*
*A portion of the Cheyney campus lies within Chester County.

half a percent.3 Furthermore, counties with higher per capita income growth rates, such as these,
are likely to have increased economic development activities. Therefore, the State System is
favorably impacting the counties in which they have a direct physical presence.
Various demographics were selected from the economic profiles for each county with a State
System university presence, provided in Table B.3.4 Some important facts to note:
• Philadelphia (Pennsylvania’s State System of Higher Education at Center City) had the
highest population, number of households, and also the highest unemployment rate in
2013;
• Clarion (Clarion University) had the smallest population and therefore the smallest labor
force;
• Cumberland (Shippensburg University) had the most growth in population since 2010;
• Chester County (West Chester University) had the lowest unemployment rate during
2013 of 5.8 percent; and
• Tioga County (Mansfield University) had the largest growth in labor force since 2010.
3 Per capita income for the Commonwealth grew approximately 11 percent from 2010 to 2013. 4 Population, population growth, labor force and the 2013 unemployment rate obtained from StatsAmerica provided by the Indiana Business Research Center. The change in labor force from 2010 to 2013 was calculated using an average of historical data from the Federal Reserve Bank of St. Louis. The change in unemployment rate since 2010 was calculated using historical data obtained from the Bureau of Labor Statistics.
Appendix B Page 4

Table B.3: Overview of Population by Pennsylvania Counties with a State System University Presence
University CountyPopulation
(2013)
Pop. growth (%) since
2010
Labor force (persons)
(2013)
Labor force growth (%) since 2010
Unemployment Rate (2013)
Unemployment Rate (%) since
2010Bloomsburg Columbia 66,797 -0.75% 37,648 2.58% 7.10% -1.10%California Washington 208,206 0.19% 108,858 2.35% 6.90% -0.50%Cheyney Delaware 561,973 0.60% 282,071 0.91% 7.50% -0.10%Clarion Clarion 39,155 -2.13% 19,510 -4.52% 8.00% -2.20%Clarion Venango 53,907 -2.00% 25,657 -3.20% 7.90% 0.10%East Stroudsburg Monroe 167,148 -1.61% 80,185 -2.53% 9.40% 0.10%Edinboro Erie 280,294 -0.10% 139,619 0.18% 7.30% -1.10%Edinboro Crawford 87,376 -1.60% 42,948 -0.29% 7.10% -1.10%Indiana Indiana 87,745 -1.29% 47,699 -0.26% 7.30% -0.10%Indiana Allegheny 1,231,527 0.70% 657,757 2.37% 6.50% -0.30%Indiana Armstrong 68,107 -1.20% 33,724 0.92% 8.00% -1.20%Indiana Jefferson 44,966 -0.50% 22,524 -2.63% 7.70% -1.50%Kutztown Berks 413,521 0.50% 204,705 0.20% 7.40% -0.60%Lock Haven Clinton 39,954 1.79% 19,944 2.72% 8.60% 0.20%Lock Haven Clearfield 81,174 -0.60% 40,924 -0.45% 8.40% -1.40%Mansfield Tioga 42,463 1.14% 21,875 4.75% 8.30% 1.20%Millersville Lancaster 529,600 2.00% 268,570 -0.30% 6.10% -0.50%Shippensburg Cumberland 241,212 2.50% 124,890 1.71% 6.10% -0.20%Slippery Rock Butler 185,476 0.87% 101,382 2.56% 6.30% -0.50%Slippery Rock Mercer 115,195 -1.20% 54,245 0.63% 8.00% -1.20%West Chester Chester 509,468 2.08% 271,793 2.23% 5.80% 0.10%System-wide Site Dauphin 270,937 1.10% 139,052 0.56% 6.90% -0.70%System-wide Site Philadelphia 1,553,165 1.80% 656,484 1.92% 10.00% -0.30%
It is important to note the instances in which population was decreasing but the labor force
increased and therefore the unemployment rate decreased. This trend is seen in Columbia
County (Bloomsburg University) and Erie County (Edinboro University). In some measure, this
can be attributed to employment impact of the State System universities in these counties.
Appendix B Page 5

Appendix C: Individual University Economic and Employment Impact
Analysis
The following provides a detailed analysis of each university. Refer to Appendix E for the
methodology utilized to calculate each university’s economic and employment impact.
Bloomsburg University of Pennsylvania Columbia County, PA
Founded in 1839, Bloomsburg University is built on a rich history of academic excellence as one
of 14 public universities in Pennsylvania’s State System of Higher Education (“State System”).
As the largest comprehensive university in Northeastern and North central Pennsylvania,
Bloomsburg University offers 54 undergraduate majors, 44 undergraduate minors, and 20
graduate programs. Bloomsburg has an alumni base of more than 60,000 which enables students
to network throughout the eastern US and beyond. Bloomsburg University prepares and inspires
students to become dynamic and confident leaders. In fall 2014, the University enrolled 9,319
undergraduate students and 679 graduate students.
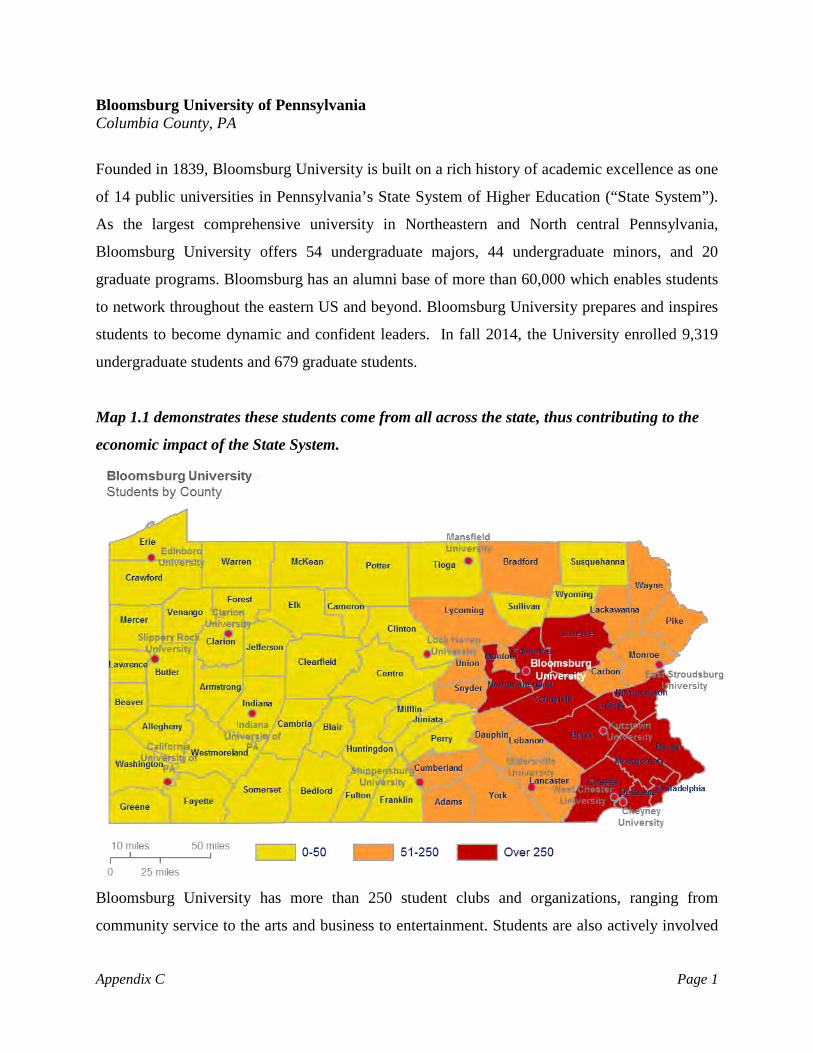
Map 1.1 demonstrates these students come from all across the state, thus contributing to the
economic impact of the State System.
Bloomsburg University has more than 250 student clubs and organizations, ranging from
community service to the arts and business to entertainment. Students are also actively involved
Appendix C Page 1
within the community with more than 62,000 hours dedicated to volunteerism each year. David
L. Soltz, Ph.D., became Bloomsburg University’s president in January 2008.1
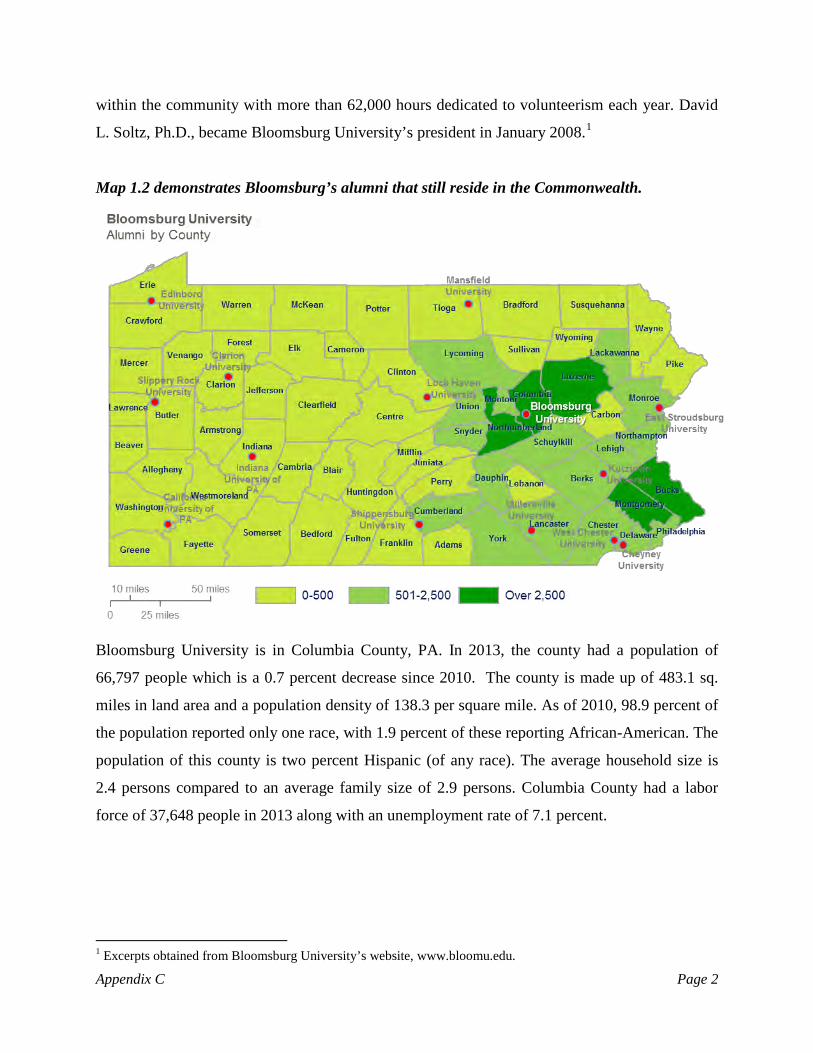
Map 1.2 demonstrates Bloomsburg’s alumni that still reside in the Commonwealth.
Bloomsburg University is in Columbia County, PA. In 2013, the county had a population of
66,797 people which is a 0.7 percent decrease since 2010. The county is made up of 483.1 sq.
miles in land area and a population density of 138.3 per square mile. As of 2010, 98.9 percent of
the population reported only one race, with 1.9 percent of these reporting African-American. The
population of this county is two percent Hispanic (of any race). The average household size is
2.4 persons compared to an average family size of 2.9 persons. Columbia County had a labor
force of 37,648 people in 2013 along with an unemployment rate of 7.1 percent.
1 Excerpts obtained from Bloomsburg University’s website, www.bloomu.edu.
Appendix C Page 2
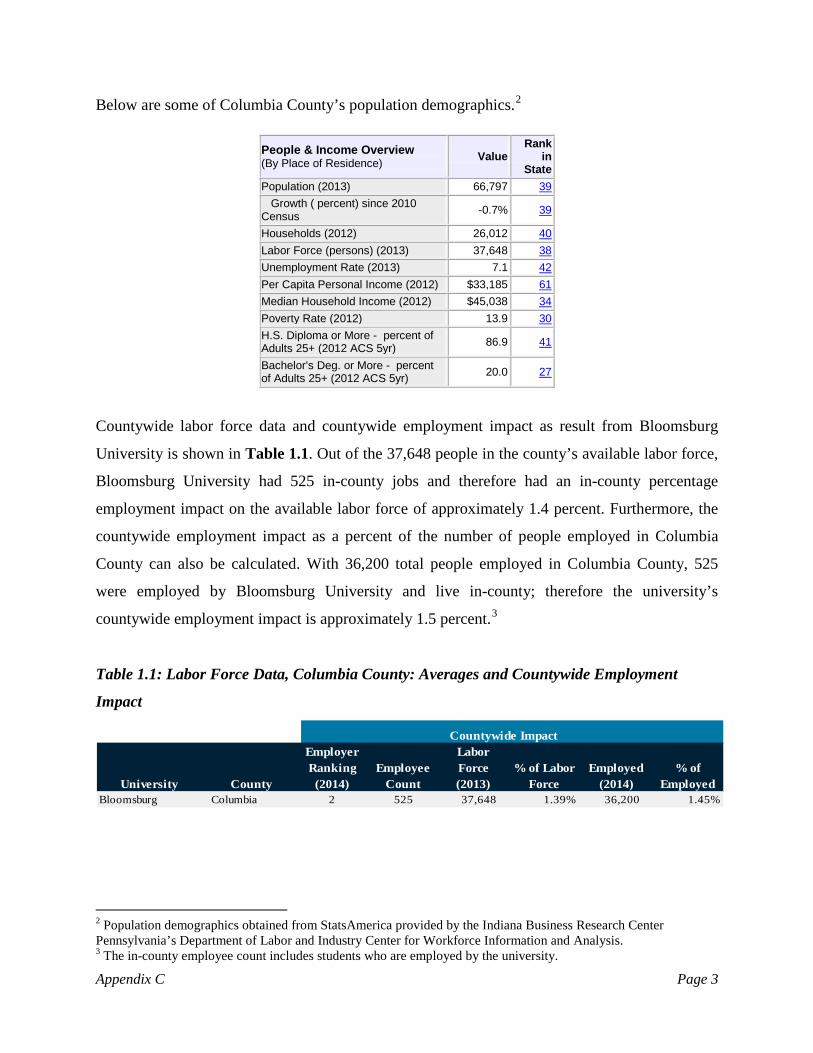
Below are some of Columbia County’s population demographics.2
Countywide labor force data and countywide employment impact as result from Bloomsburg
University is shown in Table 1.1. Out of the 37,648 people in the county’s available labor force,
Bloomsburg University had 525 in-county jobs and therefore had an in-county percentage
employment impact on the available labor force of approximately 1.4 percent. Furthermore, the
countywide employment impact as a percent of the number of people employed in Columbia
County can also be calculated. With 36,200 total people employed in Columbia County, 525
were employed by Bloomsburg University and live in-county; therefore the university’s
countywide employment impact is approximately 1.5 percent.3
Table 1.1: Labor Force Data, Columbia County: Averages and Countywide Employment
Impact
Countywide Impact
University County
Employer Ranking (2014)
Employee Count
Labor Force (2013)
% of Labor Force
Employed (2014)
% of Employed
Bloomsburg Columbia 2 525 37,648 1.39% 36,200 1.45%
2 Population demographics obtained from StatsAmerica provided by the Indiana Business Research Center Pennsylvania’s Department of Labor and Industry Center for Workforce Information and Analysis. 3 The in-county employee count includes students who are employed by the university.
People & Income Overview (By Place of Residence) Value
Rank in
State Population (2013) 66,797 39
Growth ( percent) since 2010 Census -0.7% 39
Households (2012) 26,012 40
Labor Force (persons) (2013) 37,648 38
Unemployment Rate (2013) 7.1 42
Per Capita Personal Income (2012) $33,185 61
Median Household Income (2012) $45,038 34
Poverty Rate (2012) 13.9 30
H.S. Diploma or More - percent of Adults 25+ (2012 ACS 5yr) 86.9 41
Bachelor's Deg. or More - percent of Adults 25+ (2012 ACS 5yr) 20.0 27
Appendix C Page 3
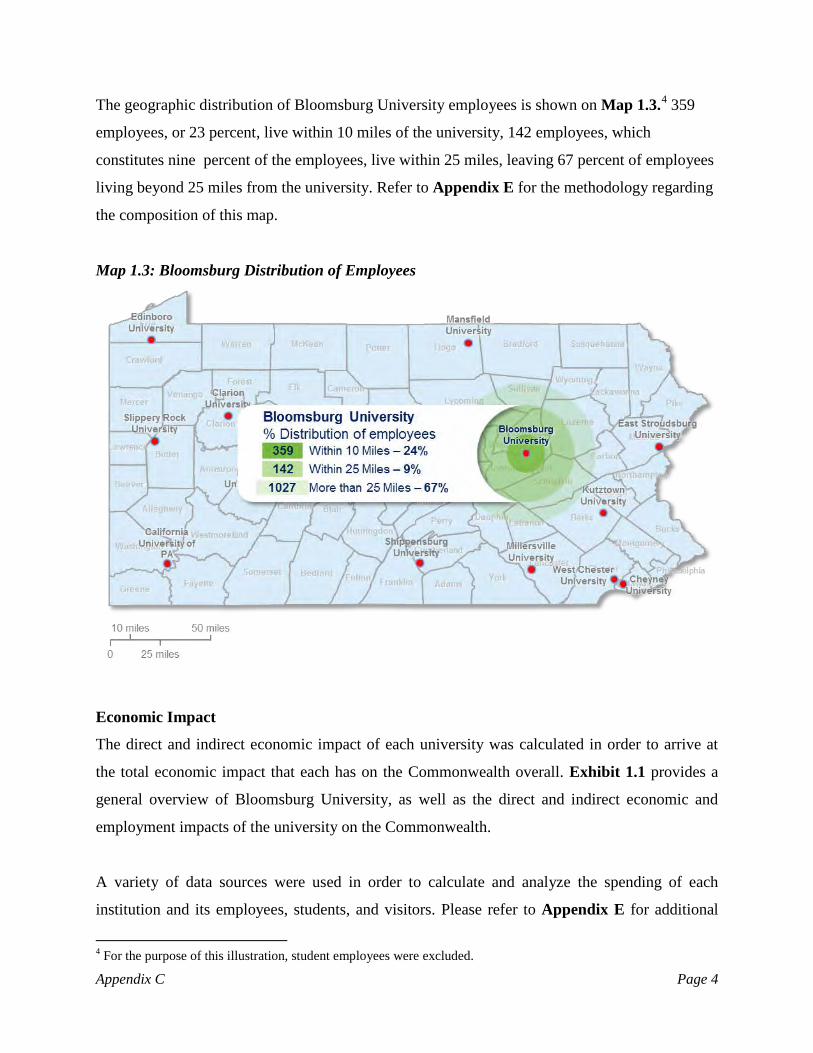
The geographic distribution of Bloomsburg University employees is shown on Map 1.3.4 359
employees, or 23 percent, live within 10 miles of the university, 142 employees, which
constitutes nine percent of the employees, live within 25 miles, leaving 67 percent of employees
living beyond 25 miles from the university. Refer to Appendix E for the methodology regarding
the composition of this map.
Map 1.3: Bloomsburg Distribution of Employees
Economic Impact
The direct and indirect economic impact of each university was calculated in order to arrive at
the total economic impact that each has on the Commonwealth overall. Exhibit 1.1 provides a
general overview of Bloomsburg University, as well as the direct and indirect economic and
employment impacts of the university on the Commonwealth.
A variety of data sources were used in order to calculate and analyze the spending of each
institution and its employees, students, and visitors. Please refer to Appendix E for additional
4 For the purpose of this illustration, student employees were excluded.
Appendix C Page 4
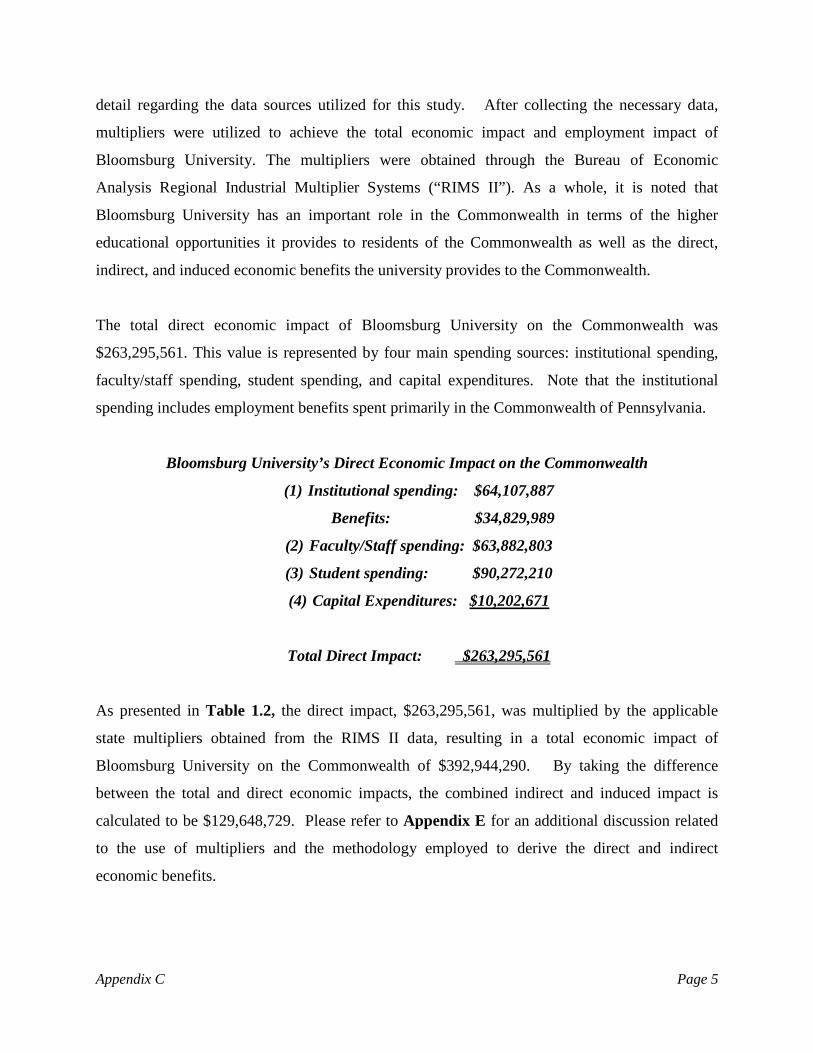
detail regarding the data sources utilized for this study. After collecting the necessary data,
multipliers were utilized to achieve the total economic impact and employment impact of
Bloomsburg University. The multipliers were obtained through the Bureau of Economic
Analysis Regional Industrial Multiplier Systems (“RIMS II”). As a whole, it is noted that
Bloomsburg University has an important role in the Commonwealth in terms of the higher
educational opportunities it provides to residents of the Commonwealth as well as the direct,
indirect, and induced economic benefits the university provides to the Commonwealth.
The total direct economic impact of Bloomsburg University on the Commonwealth was
$263,295,561. This value is represented by four main spending sources: institutional spending,
faculty/staff spending, student spending, and capital expenditures. Note that the institutional
spending includes employment benefits spent primarily in the Commonwealth of Pennsylvania.
Bloomsburg University’s Direct Economic Impact on the Commonwealth
(1) Institutional spending: $64,107,887
Benefits: $34,829,989
(2) Faculty/Staff spending: $63,882,803
(3) Student spending: $90,272,210
(4) Capital Expenditures: $10,202,671
Total Direct Impact: $263,295,561
As presented in Table 1.2, the direct impact, $263,295,561, was multiplied by the applicable
state multipliers obtained from the RIMS II data, resulting in a total economic impact of
Bloomsburg University on the Commonwealth of $392,944,290. By taking the difference
between the total and direct economic impacts, the combined indirect and induced impact is
calculated to be $129,648,729. Please refer to Appendix E for an additional discussion related
to the use of multipliers and the methodology employed to derive the direct and indirect
economic benefits.
Appendix C Page 5

Table 1.2: Total Economic Impact of Bloomsburg University on the Commonwealth
University Total Direct Total Indirect Total Induced Total ImpactBloomsburg 263,295,561$ 113,097,080$ 16,551,649$ 392,944,290$
Chart 1.1: Total Economic Impact (Direct + Indirect + Induced): $392,944,290
The resulting return of taxpayer dollars via the Commonwealth’s appropriations has a significant
and measurable economic impact on the Commonwealth as a whole. Specifically, the
appropriation to Bloomsburg University made by the Commonwealth of Pennsylvania, and
allocated by the State System, for fiscal year 2013-2014 was $32,994,559. Therefore, each dollar
invested in Bloomsburg University by the Commonwealth via appropriations yielded a return of
approximately $11.91 in total economic impact, as is shown on Table 1.3.
Table 1.3: Statewide Economic Impact of Bloomsburg University Appropriations
University Total ImpactState
Appropriations RatioBloomsburg 392,944,289$ 32,994,559$ 11.91
University spending in addition to the ancillary spending (faculty and students) yielded income
tax revenues to the Commonwealth, as well as to local municipalities and the state
$263,295,561
$113,097,080
$16,551,649
Total Direct
Total Indirect
Total Induced
Appendix C Page 6

unemployment trust fund. Table 1.4 illustrates the benefits provided by the university’s payroll
expenditures.
Table 1.4: Statewide Economic Impact of Bloomsburg Payroll Tax Withholdings
UniversityState Tax
Withholdings Local EIT
Local Services
TaxUnemployment
TaxTotal Tax Payments
Bloomsburg 2,292,524$ 1,158,465$ 77,722$ 50,794$ 3,579,505$
In addition, sales tax revenue was collected by the Commonwealth as a result of the consumption
of taxable goods and services by the university’s faculty and staff as well as students. Table 1.5
illustrates the sales tax revenue collected by the Commonwealth. Please refer to Appendix E for
an additional discussion of the methodology employed to estimate the sale tax revenue collected
by the Commonwealth.
Table 1.5: Statewide Economic Impact of Bloomsburg Sales Tax Revenue Collections
University Total Faculty and Student Spending
% of State GDP taxable
Spending subject to tax
Sales Tax Rate
Sales Tax Revenue
Bloomsburg 217,034,843$ 23.89% 51,849,624$ 6.00% 3,110,977$
In the aggregate, the revenues realized by the Commonwealth in terms of payroll tax
withholdings and sales tax receipts for Bloomsburg University were $5,403,501 or 16.4 percent
of the Commonwealth’s appropriations for fiscal year 2013-2014.
The composite spending activity of the university also has a measureable effect on employment
in the Commonwealth.5 Specifically the direct spending of three categories enumerated above
helps to create jobs. The employment impact of the aggregate spending of the university and the
ancillary spending of the faculty/staff and students is measured by the RIMS II multiplier which
estimates the number of jobs created per every additional million in spending.6 Specifically, the
RIMS II state multiplier for Pennsylvania indicated that for each additional million dollars of
output by the State System universities, approximately 21.3 jobs were created or supported. In
5 Composite spending activity includes institutional, faculty and staff and student spending. 6 Please refer to Appendix E for additional information related to the RIMS II multipliers.
Appendix C Page 7

this manner, the employment impact of Bloomsburg University on the Commonwealth
approximated 5,380 jobs, as is shown in Table 1.6.
Table 1.6: Statewide Employment Impact of Bloomsburg University on the Commonwealth as
a Result of Direct Composite Spending: 5,380 Jobs
University
Direct Composite Spending
Jobs Output
Employment Impact
Bloomsburg 253,092,889 21.26 5,380
The capital expenditures of the university also help to support jobs in the region. This
employment impact is again measured using RIMS II multipliers by estimating the number of
jobs created for every additional million spent on capital expenditures. Specifically, the RIMS II
construction multiplier for Pennsylvania indicated that per each additional million dollars of
output, approximately 17.9 jobs were created or supported. In this manner, the employment
impact of Bloomsburg University on the Commonwealth approximated 183 more jobs, as shown
in Table 1.7. Therefore, the total employment impact of Bloomsburg University is 5,563 jobs.
Table 1.7: Statewide Employment Impact of Bloomsburg University on the Commonwealth as
a Result of Direct Capital Expenditures: 183 Jobs
UniversityDirect Capital Expenditures
Jobs Output
Employment Impact
Bloomsburg $ 10,202,671 17.94 183
The final quantified measure of economic impact would be that of volunteer hours contributed
by faculty and staff. While faculty and staff hours were not tracked by the university, students
did devote their time to helping the community. Bloomsburg students spent a total of 64,500 and
82,000 hours by volunteering, in 2013 and 2014 respectively. It is likely that the students’
participation was required by university curricular and co-curricular programs, some of which
either required supervision or a faculty team leader.
Appendix C Page 8

Economic Development
Economic development involves improvements to the standard of living through the creation of
jobs and the support of innovation and new research in a community’s region, state, or nation.
The State System plays a role in enhancing the economic development of the regions in which
the individual universities reside by assisting in the development and growth of new and existing
businesses, as well as increasing the employment opportunities, both of which increase economic
activity in the respective areas. The universities accomplish this in various ways, such as
partnering with local businesses, providing education and job skills training, providing an outlet
for research and development through incubators, and by providing financial and technical
assistance.
The goal of Pennsylvania’s State System of Higher Education and its fourteen universities is
fundamentally to educate the citizens of the Commonwealth. By providing higher education, the
universities are not only helping to improve the economic development in the short-term, but in
the long-run as well. Therefore, by way of establishing and accomplishing its mission,
Pennsylvania’s State System is benefiting the economic advancement of the Commonwealth.
Primarily, the State System does this through the granting of undergraduate and graduate
degrees, but also does so indirectly through its purchasing, expenditures, services, and by
employing hundreds, even thousands, of people.
Overall, Pennsylvania’s State System of Higher Education is a key player in supporting the
economic development and growth of communities, counties, regions, and the Commonwealth
overall. By providing sources of innovation and entrepreneurial assistance, the State System
supplies economic growth to local businesses along with highly skilled and educated candidate
employees. Through its various economic development activities, Bloomsburg University
successfully provides an economic competitive advantage for the county and the Commonwealth
as a whole.
Bloomsburg University’s participation in WEDnetPA program has over 2,700 participants and
had a total of $288,648 funds awarded in 2014. Additionally, Bloomsburg University maintains
an Entrepreneurial Leadership Center in which 67 members worked with 6 local businesses. The
Appendix C Page 9
center fosters a positive entrepreneurial climate by enhancing the engagement of students and
faculty in innovation activities with regional entrepreneurs and other stakeholders in the Greater
Susquehanna Keystone Innovation Zone. As a result, the university and its students promote
economic development in northeastern and central Pennsylvania.
Appendix C Page 10
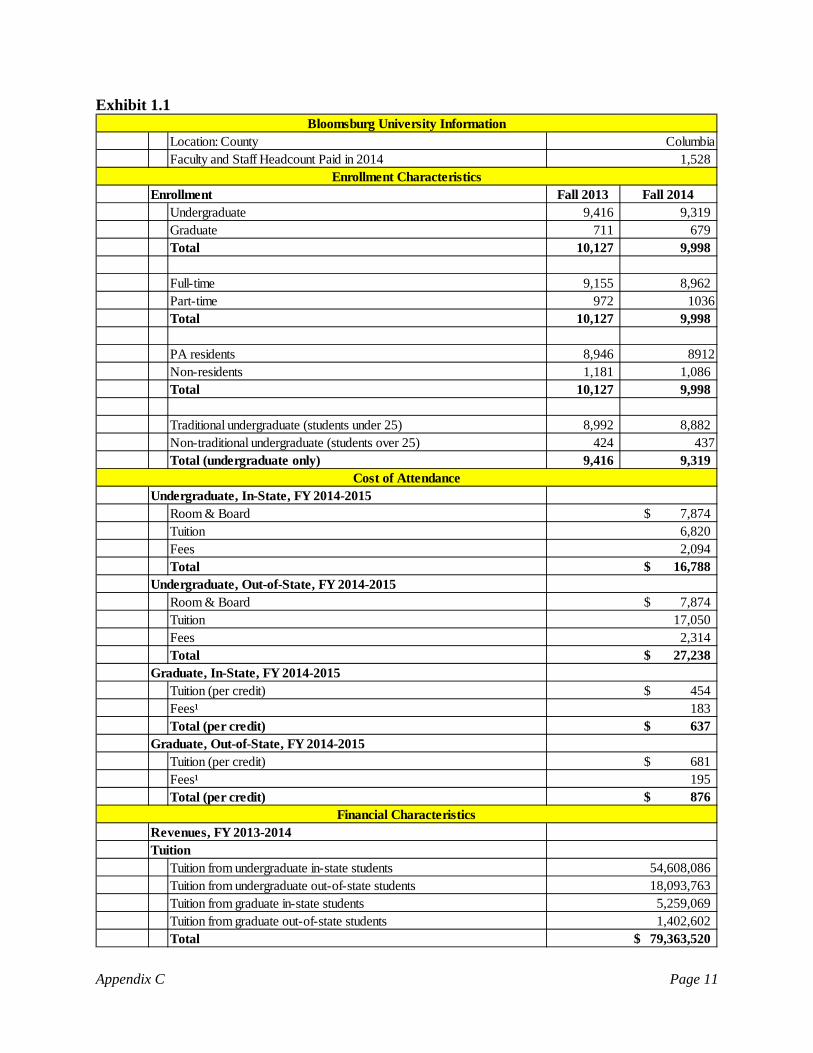
Exhibit 1.1
Location: CountyFaculty and Staff Headcount Paid in 2014
Fall 2013 Fall 2014Undergraduate 9,416 9,319 Graduate 711 679 Total 10,127 9,998
Full-time 9,155 8,962 Part-time 972 1036Total 10,127 9,998
PA residents 8,946 8912Non-residents 1,181 1,086 Total 10,127 9,998
Traditional undergraduate (students under 25) 8,992 8,882 Non-traditional undergraduate (students over 25) 424 437Total (undergraduate only) 9,416 9,319
Room & BoardTuitionFeesTotal
Room & BoardTuitionFeesTotal
Tuition (per credit)Fees¹Total (per credit)
Tuition (per credit)Fees¹Total (per credit)
Tuition from undergraduate in-state studentsTuition from undergraduate out-of-state studentsTuition from graduate in-state studentsTuition from graduate out-of-state studentsTotal
Enrollment
Cost of AttendanceUndergraduate, In-State, FY 2014-2015
7,874$
2,094
Graduate, Out-of-State, FY 2014-2015
Undergraduate, Out-of-State, FY 2014-20157,874$
17,050 2,314
27,238$
16,788$
18,093,763
Bloomsburg University InformationColumbia
1,528 Enrollment Characteristics
6,820
681$ 195 876$
Financial CharacteristicsRevenues, FY 2013-2014
Graduate, In-State, FY 2014-2015454$ 183 637$
Tuition54,608,086
5,259,069 1,402,602
79,363,520$
Appendix C Page 11

Technology, Academic/Instruction, and Other Mandatory Fees
Non-Mandatory FeesTotal 18,274,646$
Total from Tuition & Fees 97,638,166$
2,650,786$
32,994,559$
Federal 14,955,597$ State 9,359,104 Local/Other/Private 1,010,571 System Transfer Awards 10,324 Total grants and contracts 25,335,596$
35,924,648$ Total Revenues (from sources above) 194,543,755$
690,081$ 31,349,919$
933,300,000$
Institutional ExpendituresInstitutional spending (excluding payroll) 61,695,020$ Capital Improvements 2,412,867 Employee Benefits 34,829,989
Total Direct Institutional Spending 98,937,876 Institutional spending prorated by 10.86% of out of state students 10,746,803 Type 1 Multiplier 1.53
Type 1 Effect (total indirect - induced) 16,480,222 Type 2 Multiplier 2.33
Type 2 Effect (total indirect) 25,061,544 Induced Effect (type 2 effect - type 1 effect) 8,581,322 Total Impact of Institutional Spending 132,580,742$
Faculty and Staff ExpendituresFaculty and staff spending (direct) 63,882,803$ Household multiplier 1.41 Total Impact of Faculty and Staff Spending 89,940,599$
Financial Characteristics
861,956 Non-Mandatory Fees
Fees
17,412,690$ Mandatory Fees
Total Replacement Value of Physical Plant
Sales and Services
Education and General Appropriations
Grants and Contracts
Other Revenues (net of scholarship discounts and allowances)
Funds Raised by University (private giving)Market Value of Endowment
The Institution as a Consumer in the State
Appendix C Page 12

Student ExpendituresStudent spending (direct) 90,272,210$ Household multiplier 1.41 Total Impact of Student Spending 127,094,244$
Capital ExpendituresCapital Improvements - 5 year weighted average 9,165,333$ Deferred Maintenance 1,037,338
Total Direct Capital Expenditures 10,202,671 Type 1 Multiplier 1.68
Type 1 Effect (total indirect - induced) 17,185,380 Type 2 Multiplier 2.47
Type 2 Effect (total indirect) 25,155,706 Induced Effect (type 2 effect - type 1 effect) 7,970,327 Total Impact of Capital Expenditures 43,328,705$
Employment impact for the CommonwealthDirect composite expenditures for the Commonwealth 253,092,889$ State multiplier 21.26Statewide Employment Impact based on Composite Spending (jobs) 5,380 Direct capital expenditures for the Commonwealth 10,202,671$ State multiplier 17.94Statewide Employment Impact based on Direct Expenditures (jobs) 183 Total Employment Impact 5,563
In-Kind (Volunteer) Contributions to Regional EconomyAnnual volunteer hours of faculty and staff N/AAverage market value of volunteer hours (per hour) N/AEstimated total contribution of faculty and staff N/AAnnual volunteer hours of students (2014) 82,000
Small Business IncubatorSmall Business Development CenterPatents filed since January 1, 2010
Sales TaxTotal Faculty and Staff and Student Spending 217,034,843$ Imputed % of taxable spending 23.89%Spending subject to tax 51,849,624 Sales tax rate 6%Total State Sales Tax Revenue Generation 3,110,977$
The Institution as a Consumer in the State
The Institution as an Employer
The University as a Center for Volunteerism
Business and Economic Development Services
The University as a Generator of State Government Revenue
NoNo
0
Appendix C Page 13

Payroll TaxTotal payroll 76,735,175$ State tax withholdings 2,292,524 Local EIT 1,158,465 Local Services Tax 77,722 Unemployment tax 50,794 Total Payroll Tax Payments 3,579,505$
The University as a Generator of State Government Revenue
¹Fees prorated on a per credit basis; all fees included.
Appendix C Page 14
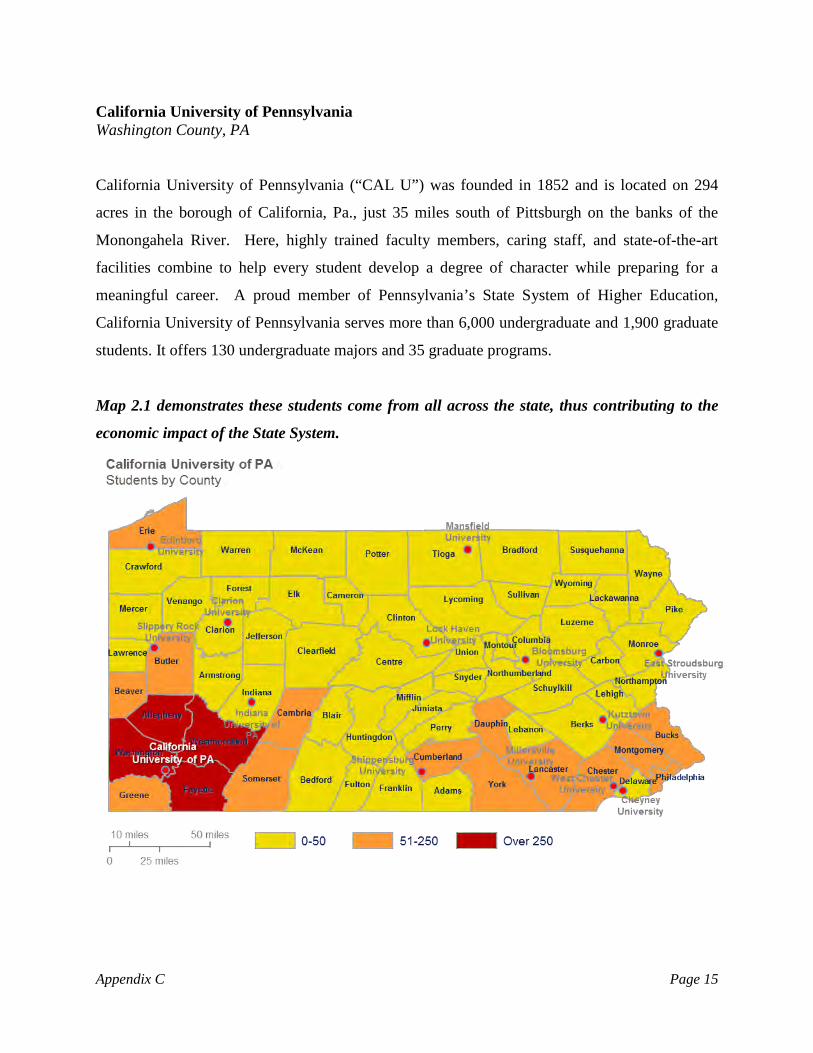
California University of Pennsylvania Washington County, PA
California University of Pennsylvania (“CAL U”) was founded in 1852 and is located on 294
acres in the borough of California, Pa., just 35 miles south of Pittsburgh on the banks of the
Monongahela River. Here, highly trained faculty members, caring staff, and state-of-the-art
facilities combine to help every student develop a degree of character while preparing for a
meaningful career. A proud member of Pennsylvania’s State System of Higher Education,
California University of Pennsylvania serves more than 6,000 undergraduate and 1,900 graduate
students. It offers 130 undergraduate majors and 35 graduate programs.
Map 2.1 demonstrates these students come from all across the state, thus contributing to the
economic impact of the State System.
Appendix C Page 15

The university employs about 420 faculty members, of whom 81 percent have a doctorate or
other post-graduate degree. It is a part of the Pennsylvania State Athletic Conference and is a
NCAA Division II school offering 16 varsity sports. Additionally, the university has more than
100 clubs and organizations for students to join. Geraldine M. Jones was named the acting
president of California University of Pennsylvania in May 2012.1
Map 2.2 demonstrates California University of Pennsylvania’s alumni that still reside in the
Commonwealth.
California University of Pennsylvania is located in Washington County, PA. This county has a
population of 208,206 people, 857.0 sq. miles in land area and a population density of 242.9 per
square mile. The population has grown 0.2 percent since the last census in 2010. The average
household size is 2.4 persons compared to an average family size of 2.9 persons. On the most
recent census form, 98.5 percent of the population reported only one race, with 3.3 percent of
these reporting African-American. The population of this county is 1.1 percent Hispanic (of any
1 Excerpts obtained from California University of Pennsylvania’s website, www.calu.edu. Appendix C Page 16
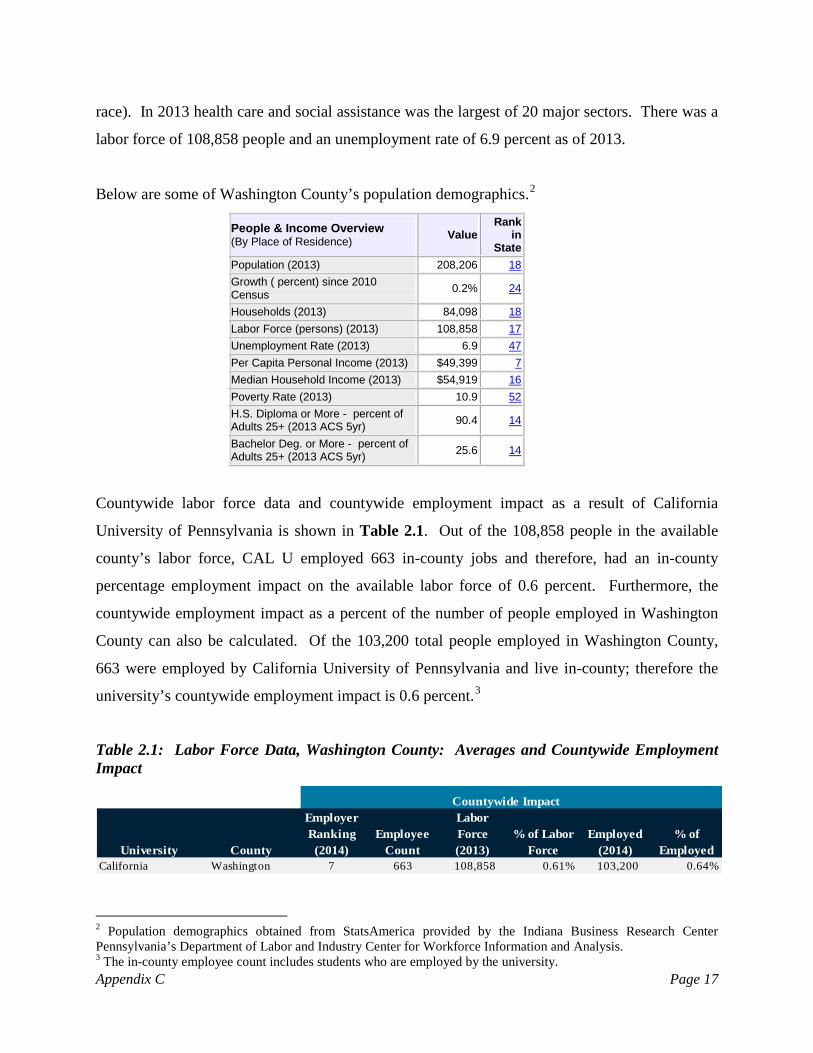
race). In 2013 health care and social assistance was the largest of 20 major sectors. There was a
labor force of 108,858 people and an unemployment rate of 6.9 percent as of 2013.
Below are some of Washington County’s population demographics.2
People & Income Overview (By Place of Residence) Value
Rank in
State Population (2013) 208,206 18
Growth ( percent) since 2010 Census 0.2% 24
Households (2013) 84,098 18
Labor Force (persons) (2013) 108,858 17
Unemployment Rate (2013) 6.9 47
Per Capita Personal Income (2013) $49,399 7
Median Household Income (2013) $54,919 16
Poverty Rate (2013) 10.9 52
H.S. Diploma or More - percent of Adults 25+ (2013 ACS 5yr) 90.4 14
Bachelor Deg. or More - percent of Adults 25+ (2013 ACS 5yr) 25.6 14
Countywide labor force data and countywide employment impact as a result of California
University of Pennsylvania is shown in Table 2.1. Out of the 108,858 people in the available
county’s labor force, CAL U employed 663 in-county jobs and therefore, had an in-county
percentage employment impact on the available labor force of 0.6 percent. Furthermore, the
countywide employment impact as a percent of the number of people employed in Washington
County can also be calculated. Of the 103,200 total people employed in Washington County,
663 were employed by California University of Pennsylvania and live in-county; therefore the
university’s countywide employment impact is 0.6 percent.3
Table 2.1: Labor Force Data, Washington County: Averages and Countywide Employment Impact
` Countywide Impact
University County
Employer Ranking
(2014)Employee
Count
Labor Force (2013)
% of Labor Force
Employed (2014)
% of Employed
California Washington 7 663 108,858 0.61% 103,200 0.64%
2 Population demographics obtained from StatsAmerica provided by the Indiana Business Research Center Pennsylvania’s Department of Labor and Industry Center for Workforce Information and Analysis. 3 The in-county employee count includes students who are employed by the university. Appendix C Page 17
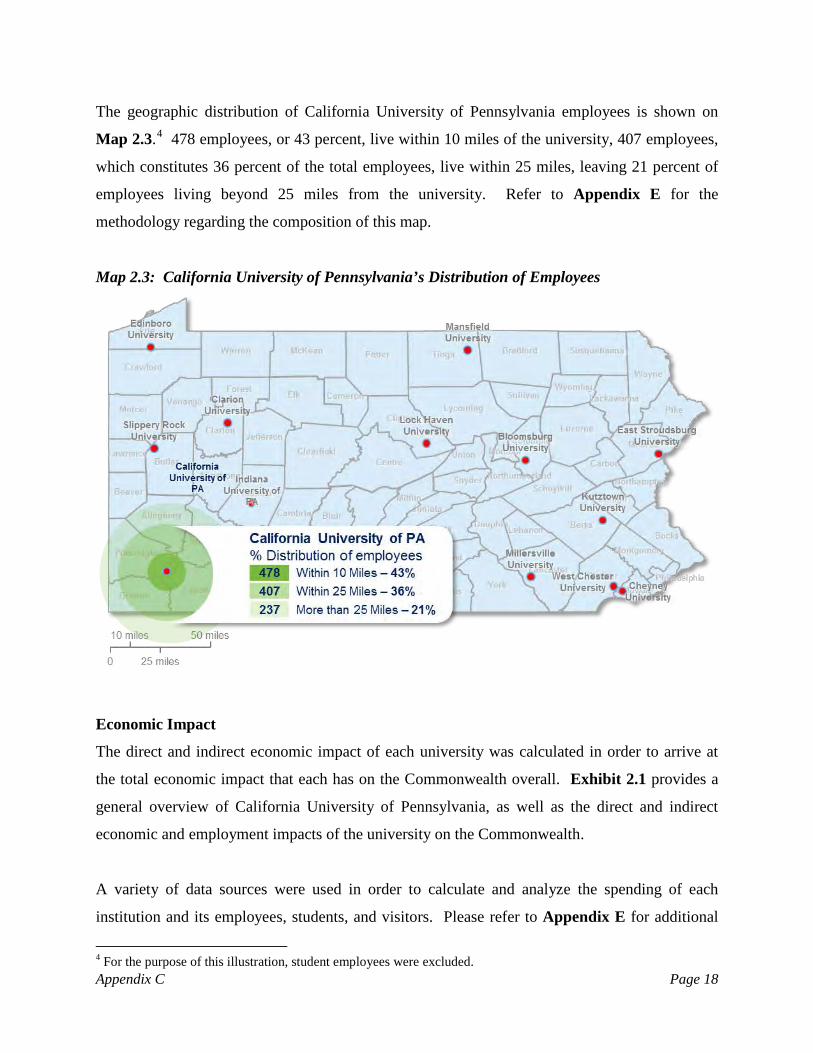
The geographic distribution of California University of Pennsylvania employees is shown on
Map 2.3.4 478 employees, or 43 percent, live within 10 miles of the university, 407 employees,
which constitutes 36 percent of the total employees, live within 25 miles, leaving 21 percent of
employees living beyond 25 miles from the university. Refer to Appendix E for the
methodology regarding the composition of this map.
Map 2.3: California University of Pennsylvania’s Distribution of Employees
Economic Impact
The direct and indirect economic impact of each university was calculated in order to arrive at
the total economic impact that each has on the Commonwealth overall. Exhibit 2.1 provides a
general overview of California University of Pennsylvania, as well as the direct and indirect
economic and employment impacts of the university on the Commonwealth.
A variety of data sources were used in order to calculate and analyze the spending of each
institution and its employees, students, and visitors. Please refer to Appendix E for additional
4 For the purpose of this illustration, student employees were excluded. Appendix C Page 18
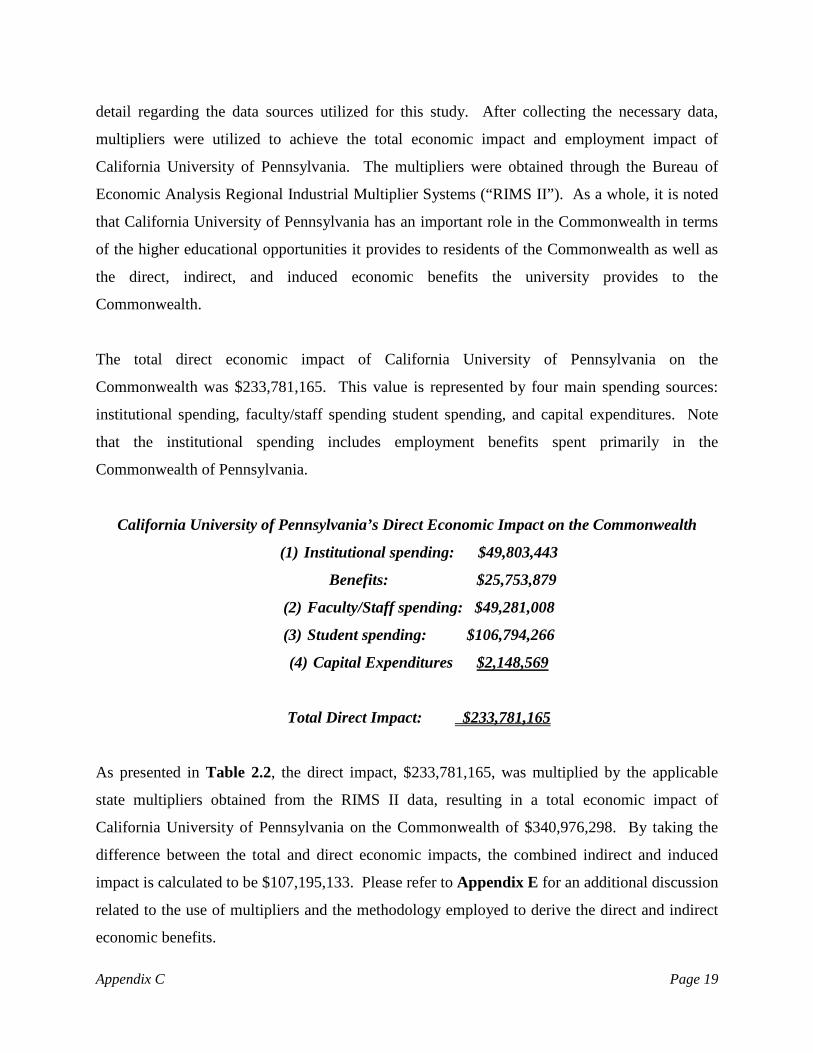
detail regarding the data sources utilized for this study. After collecting the necessary data,
multipliers were utilized to achieve the total economic impact and employment impact of
California University of Pennsylvania. The multipliers were obtained through the Bureau of
Economic Analysis Regional Industrial Multiplier Systems (“RIMS II”). As a whole, it is noted
that California University of Pennsylvania has an important role in the Commonwealth in terms
of the higher educational opportunities it provides to residents of the Commonwealth as well as
the direct, indirect, and induced economic benefits the university provides to the
Commonwealth.
The total direct economic impact of California University of Pennsylvania on the
Commonwealth was $233,781,165. This value is represented by four main spending sources:
institutional spending, faculty/staff spending student spending, and capital expenditures. Note
that the institutional spending includes employment benefits spent primarily in the
Commonwealth of Pennsylvania.
California University of Pennsylvania’s Direct Economic Impact on the Commonwealth
(1) Institutional spending: $49,803,443
Benefits: $25,753,879
(2) Faculty/Staff spending: $49,281,008
(3) Student spending: $106,794,266
(4) Capital Expenditures $2,148,569
Total Direct Impact: $233,781,165
As presented in Table 2.2, the direct impact, $233,781,165, was multiplied by the applicable
state multipliers obtained from the RIMS II data, resulting in a total economic impact of
California University of Pennsylvania on the Commonwealth of $340,976,298. By taking the
difference between the total and direct economic impacts, the combined indirect and induced
impact is calculated to be $107,195,133. Please refer to Appendix E for an additional discussion
related to the use of multipliers and the methodology employed to derive the direct and indirect
economic benefits.
Appendix C Page 19

Table 2.2: Total Economic Impact of California University of Pennsylvania on the Commonwealth
University Total Direct Total Indirect Total Induced Total ImpactCalifornia 233,781,165$ 96,192,279$ 11,002,854$ 340,976,298$
Chart 2.1: Total Economic Impact (Direct + Indirect + Induced): $340,976,298
The resulting return of taxpayer dollars via the Commonwealth’s appropriations has a significant
and measurable economic impact on the Commonwealth as a whole. Specifically, the
appropriation to California University of Pennsylvania made by the Commonwealth of
Pennsylvania, and allocated by the State System, for fiscal year 2013-2015 was $29,751,310.
Therefore, each dollar invested in California University of Pennsylvania by the Commonwealth
via appropriations yielded a return of approximately $11.46 in total economic impact, as is
shown on Table 2.3.
Table 2.3: Statewide Economic Impact of California University of Pennsylvania
Appropriations
University Total ImpactState
Appropriations RatioCalifornia 340,976,298$ 29,751,310$ 11.46
$233,781,165
$96,192,279
$11,002,854
Total Direct
Total Indirect
Total Induced
Appendix C Page 20

University spending in addition to the ancillary spending (faculty and students) yielded income
tax revenues to the Commonwealth, as well as to local municipalities and the state
unemployment trust fund. Table 2.4 illustrates the benefits provided by the university’s payroll
expenditures.
Table 2.4: Statewide Economic Impact of California University of Pennsylvania Payroll Tax Withholdings
UniversityState Tax
Withholdings Local EIT
Local Services
TaxUnemployment
TaxTotal Tax Payments
California 1,787,436$ 663,336$ 92,342$ 39,812$ 2,582,926$
In addition, sales tax revenue was collected by the Commonwealth as a result of the consumption
of taxable goods and services by the university’s faculty and staff as well as students. Table 2.5
illustrates the sales tax revenue collected by the Commonwealth. Please refer to Appendix E for
an additional discussion of the methodology employed to estimate the sale tax revenue collected
by the Commonwealth.
Table 2.5: Statewide Economic Impact of California University of Pennsylvania Sales Tax Revenue Collections
University Total Faculty and Student Spending
Spending subject to tax
Sales Tax Rate
Sales Tax Revenue
California 219,738,378$ 52,495,499$ 6.00% 3,149,730$
In the aggregate, the revenues realized by the Commonwealth in terms of payroll tax
withholdings and sales tax receipts for California University of Pennsylvania were $4,937,166 or
16.6 percent of the Commonwealth’s appropriations for fiscal year 2013-2014.
The composite spending activity of the university also has a measureable effect on employment
in the Commonwealth.5 Specifically the direct spending of three categories enumerated above
helps to create jobs. The employment impact of the aggregate spending of the university and the
ancillary spending of the faculty/staff and students is measured by the RIMS II multiplier which
5 Composite spending activity includes institutional, faculty and staff, and student spending. Appendix C Page 21
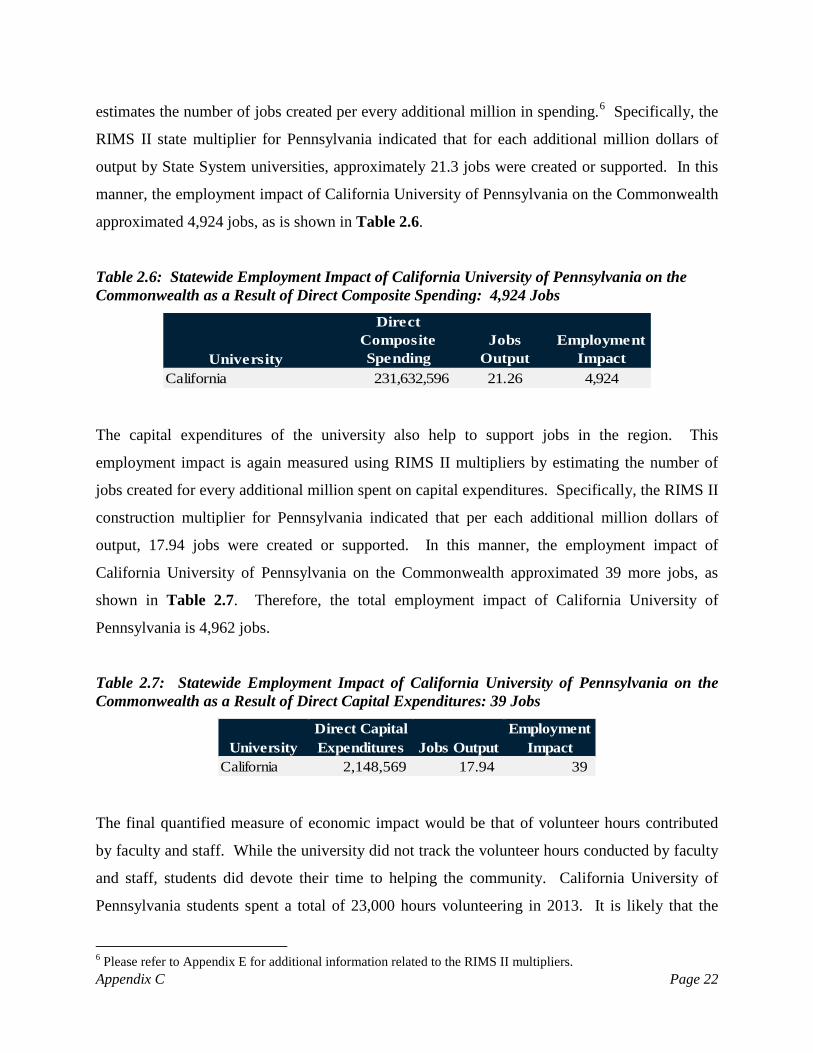
estimates the number of jobs created per every additional million in spending.6 Specifically, the
RIMS II state multiplier for Pennsylvania indicated that for each additional million dollars of
output by State System universities, approximately 21.3 jobs were created or supported. In this
manner, the employment impact of California University of Pennsylvania on the Commonwealth
approximated 4,924 jobs, as is shown in Table 2.6.
Table 2.6: Statewide Employment Impact of California University of Pennsylvania on the Commonwealth as a Result of Direct Composite Spending: 4,924 Jobs
University
Direct Composite Spending
Jobs Output
Employment Impact
California 231,632,596 21.26 4,924
The capital expenditures of the university also help to support jobs in the region. This
employment impact is again measured using RIMS II multipliers by estimating the number of
jobs created for every additional million spent on capital expenditures. Specifically, the RIMS II
construction multiplier for Pennsylvania indicated that per each additional million dollars of
output, 17.94 jobs were created or supported. In this manner, the employment impact of
California University of Pennsylvania on the Commonwealth approximated 39 more jobs, as
shown in Table 2.7. Therefore, the total employment impact of California University of
Pennsylvania is 4,962 jobs.
Table 2.7: Statewide Employment Impact of California University of Pennsylvania on the Commonwealth as a Result of Direct Capital Expenditures: 39 Jobs
UniversityDirect Capital Expenditures Jobs Output
Employment Impact
California 2,148,569 17.94 39
The final quantified measure of economic impact would be that of volunteer hours contributed
by faculty and staff. While the university did not track the volunteer hours conducted by faculty
and staff, students did devote their time to helping the community. California University of
Pennsylvania students spent a total of 23,000 hours volunteering in 2013. It is likely that the
6 Please refer to Appendix E for additional information related to the RIMS II multipliers. Appendix C Page 22
students’ participation was required by university curricular and co-curricular programs, some of
which either required supervision or a faculty team leader.
Economic Development
Economic development involves improvements to the standard of living through the creation of
jobs and the support of innovation and new research in a community’s region, state, or nation.
The State System plays a role in enhancing the economic development of the regions in which
the individual universities reside by assisting in the development and growth of new and existing
businesses, as well as increasing the employment opportunities, both of which increase economic
activity in the respective areas. The universities accomplish this in various ways, such as
partnering with local businesses, providing education and job skills training, providing an outlet
for research and development through incubators, and by providing financial and technical
assistance.
The goal of Pennsylvania’s State System of Higher Education and its 14 universities is
fundamentally to educate the citizens of the Commonwealth. By providing higher education, the
universities are not only helping to improve the economic development in the short-term, but in
the long-run as well. Therefore, by way of establishing and accomplishing its mission,
Pennsylvania’s State System is benefiting the economic advancement of the Commonwealth.
Primarily, the State System does this through the granting of undergraduate and graduate
degrees, but also does so indirectly through its purchasing, expenditures, services, and by
employing hundreds, even thousands, of people.
Overall, Pennsylvania’s State System of Higher Education is a key player in supporting the
economic development and growth of communities, counties, regions, and the Commonwealth
overall. By providing sources of innovation and entrepreneurial assistance, the State System
supplies economic growth to local businesses along with highly skilled and educated candidate
employees. Through its various economic development activities, California University of
Pennsylvania successfully provides an economic competitive advantage for the county and the
Commonwealth as a whole.
Appendix C Page 23
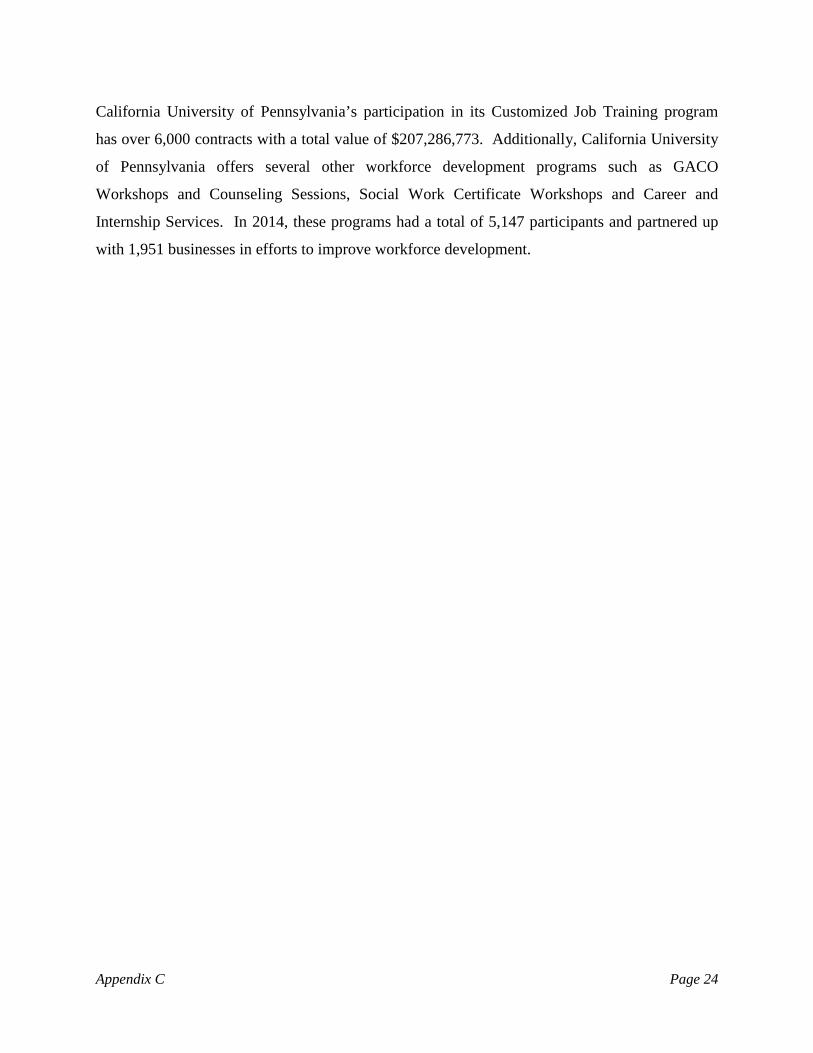
California University of Pennsylvania’s participation in its Customized Job Training program
has over 6,000 contracts with a total value of $207,286,773. Additionally, California University
of Pennsylvania offers several other workforce development programs such as GACO
Workshops and Counseling Sessions, Social Work Certificate Workshops and Career and
Internship Services. In 2014, these programs had a total of 5,147 participants and partnered up
with 1,951 businesses in efforts to improve workforce development.
Appendix C Page 24

Exhibit 2.1
Location: CountyFaculty and Staff Headcount Paid in 2014
Fall 2013 Fall 2014Undergraduate 6,450 6,076 Graduate 1,793 1,902 Total 8,243 7,978
Full-time 6,527 6,191 Part-time 1,716 1,787 Total 8,243 7,978
PA residents 6,982 6,745 Non-residents 1,261 1,233 Total 8,243 7,978
Traditional undergraduate (students under 25) 5,266 4950Non-traditional undergraduate (students over 25) 1,184 1125Total (undergraduate only)¹ 6,450 6,075
Room & BoardTuitionFeesTotal
Room & BoardTuition FeesTotal
Tuition (full-time)FeesTotal
Tuition (full-time)FeesTotal
Tuition from undergraduate in-state studentsTuition from undergraduate out-of-state studentsTuition from graduate in-state studentsTuition from graduate out-of-state studentsTotal
California University of Pennsylvania InformationWashington
1,122 Enrollment Characteristics
Enrollment
Cost of AttendanceUndergraduate, In-State, FY 2014-2015
10,086$ 6,820 2,737
19,643$ Undergraduate, Out-of-State, FY 2014-2015
10,086$ 10,230 3,319
23,635$ Graduate, In-State, FY 2014-2015
10,782$ 150
10,932$ Graduate, Out-of-State, FY 2014-2015
15,474$ 150
15,624$ Financial Characteristics
Revenues, FY 2013-2014Tuition
36,821,770$ 6,943,793
12,772,719 9,161,073
65,699,355$
Appendix C Page 25

Technology, Academic/Instruction, and Other Mandatory Fees
Non-Mandatory FeesTotal
Total from Tuition and Fees
2,518,563$
29,751,310$
Federal 13,312,444$ State 6,846,345 Local/Other/Private 382,115 System Transfer Awards 37,142 Total grants and contracts 20,578,046$
16,277,823$ Total Revenues (from sources above) 147,049,179$
1,191,138$ 29,577,549$
710,700,000$
Institutional ExpendituresInstitutional spending (excluding payroll) 49,646,866$ Capital Improvements 156,577 Employee Benefits 25,753,879
Total Direct Institutional Spending 75,557,322 Institutional spending prorated by 15.46% of out of state students 11,677,385 Type 1 Multiplier 1.53
Type 1 Effect (total indirect - induced) 17,907,270 Type 2 Multiplier 2.33
Type 2 Effect (total indirect) 27,231,662 Induced Effect (type 2 effect - type 1 effect) 9,324,392 Total Impact of Institutional Spending 112,113,376$
Faculty and Staff ExpendituresFaculty and staff spending (direct) 49,281,008$ Household multiplier 1.41 Total Impact of Faculty and Staff Spending 69,382,731$
77,923,437$
Total Replacement Value of Physical Plant
Sales and Services
Education and General Appropriations
Grants and Contracts
Other Revenues (net of scholarship discounts and allowances)
Funds Raised by University (private giving)Market Value of Endowment
The Institution as a Consumer in the State
11,822,108 Non-Mandatory Fees
401,974 12,224,082$
FeesMandatory Fees
Financial Characteristics
Appendix C Page 26
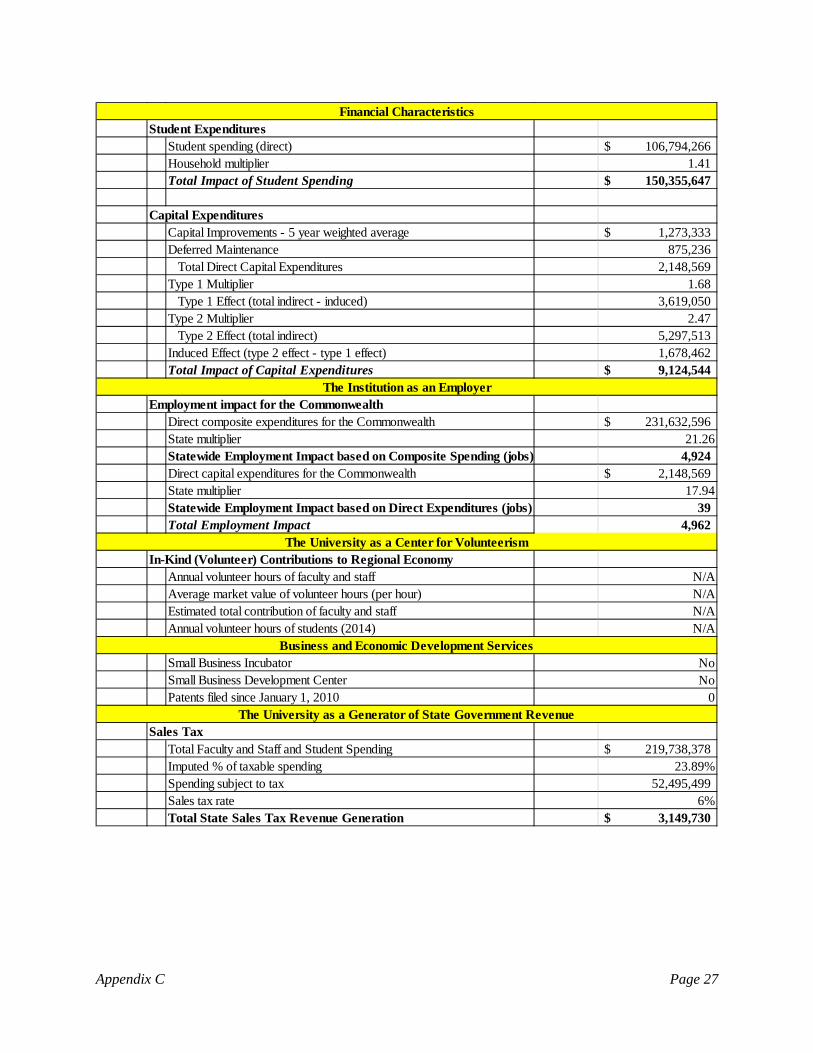
Student ExpendituresStudent spending (direct) 106,794,266$ Household multiplier 1.41 Total Impact of Student Spending 150,355,647$
Capital ExpendituresCapital Improvements - 5 year weighted average 1,273,333$ Deferred Maintenance 875,236
Total Direct Capital Expenditures 2,148,569 Type 1 Multiplier 1.68
Type 1 Effect (total indirect - induced) 3,619,050 Type 2 Multiplier 2.47
Type 2 Effect (total indirect) 5,297,513 Induced Effect (type 2 effect - type 1 effect) 1,678,462 Total Impact of Capital Expenditures 9,124,544$
Employment impact for the CommonwealthDirect composite expenditures for the Commonwealth 231,632,596$ State multiplier 21.26Statewide Employment Impact based on Composite Spending (jobs) 4,924 Direct capital expenditures for the Commonwealth 2,148,569$ State multiplier 17.94Statewide Employment Impact based on Direct Expenditures (jobs) 39 Total Employment Impact 4,962
In-Kind (Volunteer) Contributions to Regional EconomyAnnual volunteer hours of faculty and staff N/AAverage market value of volunteer hours (per hour) N/AEstimated total contribution of faculty and staff N/AAnnual volunteer hours of students (2014) N/A
Small Business IncubatorSmall Business Development CenterPatents filed since January 1, 2010
Sales TaxTotal Faculty and Staff and Student Spending 219,738,378$ Imputed % of taxable spending 23.89%Spending subject to tax 52,495,499 Sales tax rate 6%Total State Sales Tax Revenue Generation 3,149,730$
The Institution as an Employer
The University as a Center for Volunteerism
Business and Economic Development Services
The University as a Generator of State Government Revenue
NoNo
0
Financial Characteristics
Appendix C Page 27
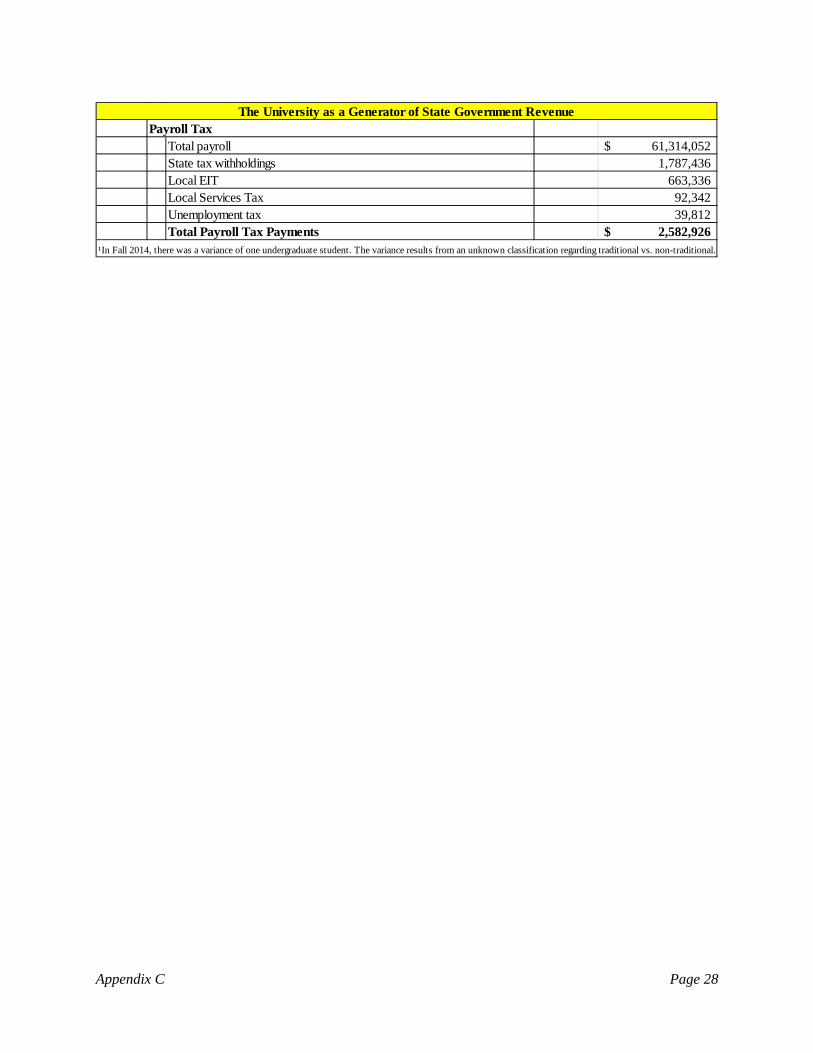
Payroll TaxTotal payroll 61,314,052$ State tax withholdings 1,787,436 Local EIT 663,336 Local Services Tax 92,342 Unemployment tax 39,812 Total Payroll Tax Payments 2,582,926$
¹In Fall 2014, there was a variance of one undergraduate student. The variance results from an unknown classification regarding traditional vs. non-traditional.
The University as a Generator of State Government Revenue
Appendix C Page 28
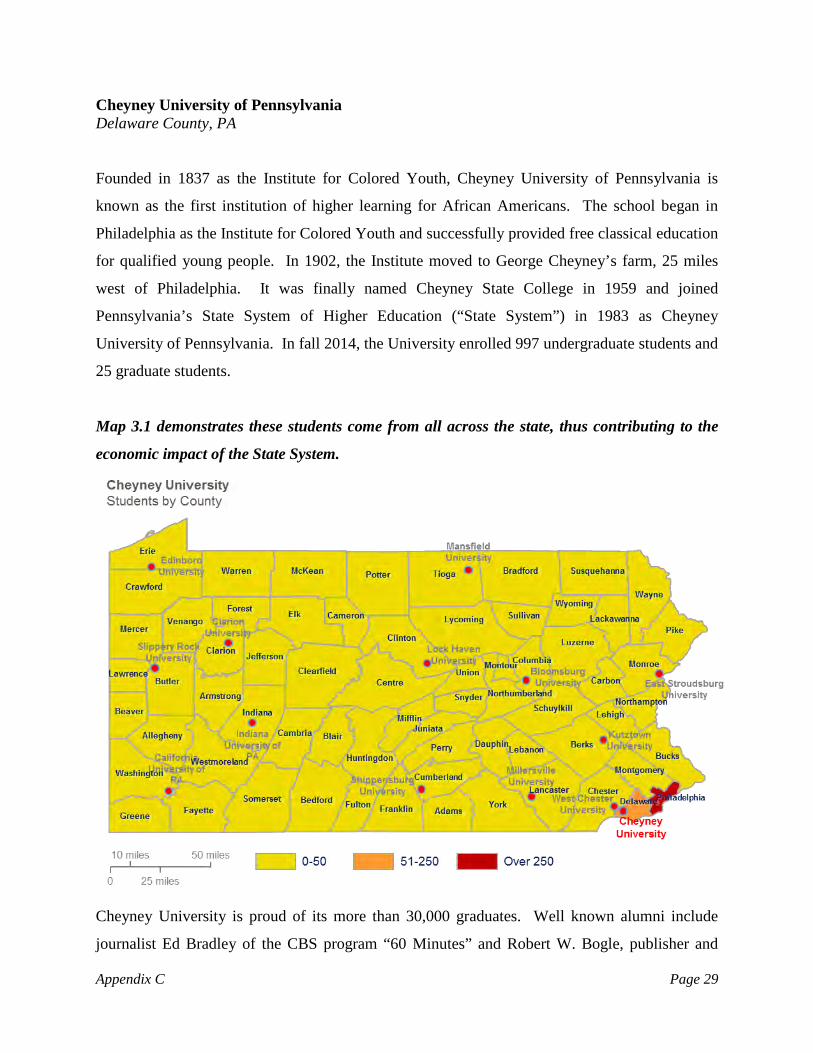
Cheyney University of Pennsylvania Delaware County, PA
Founded in 1837 as the Institute for Colored Youth, Cheyney University of Pennsylvania is
known as the first institution of higher learning for African Americans. The school began in
Philadelphia as the Institute for Colored Youth and successfully provided free classical education
for qualified young people. In 1902, the Institute moved to George Cheyney’s farm, 25 miles
west of Philadelphia. It was finally named Cheyney State College in 1959 and joined
Pennsylvania’s State System of Higher Education (“State System”) in 1983 as Cheyney
University of Pennsylvania. In fall 2014, the University enrolled 997 undergraduate students and
25 graduate students.
Map 3.1 demonstrates these students come from all across the state, thus contributing to the
economic impact of the State System.
Cheyney University is proud of its more than 30,000 graduates. Well known alumni include
journalist Ed Bradley of the CBS program “60 Minutes” and Robert W. Bogle, publisher and
Appendix C Page 29
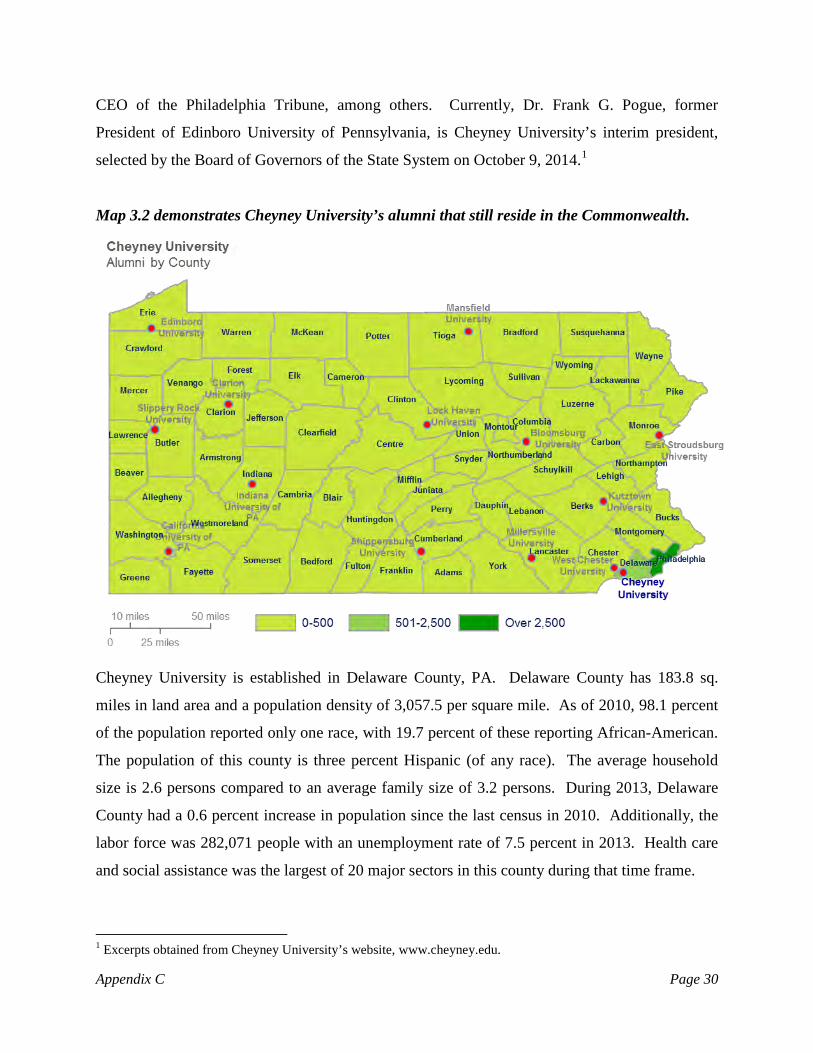
CEO of the Philadelphia Tribune, among others. Currently, Dr. Frank G. Pogue, former
President of Edinboro University of Pennsylvania, is Cheyney University’s interim president,
selected by the Board of Governors of the State System on October 9, 2014.1
Map 3.2 demonstrates Cheyney University’s alumni that still reside in the Commonwealth.
Cheyney University is established in Delaware County, PA. Delaware County has 183.8 sq.
miles in land area and a population density of 3,057.5 per square mile. As of 2010, 98.1 percent
of the population reported only one race, with 19.7 percent of these reporting African-American.
The population of this county is three percent Hispanic (of any race). The average household
size is 2.6 persons compared to an average family size of 3.2 persons. During 2013, Delaware
County had a 0.6 percent increase in population since the last census in 2010. Additionally, the
labor force was 282,071 people with an unemployment rate of 7.5 percent in 2013. Health care
and social assistance was the largest of 20 major sectors in this county during that time frame.
1 Excerpts obtained from Cheyney University’s website, www.cheyney.edu.
Appendix C Page 30
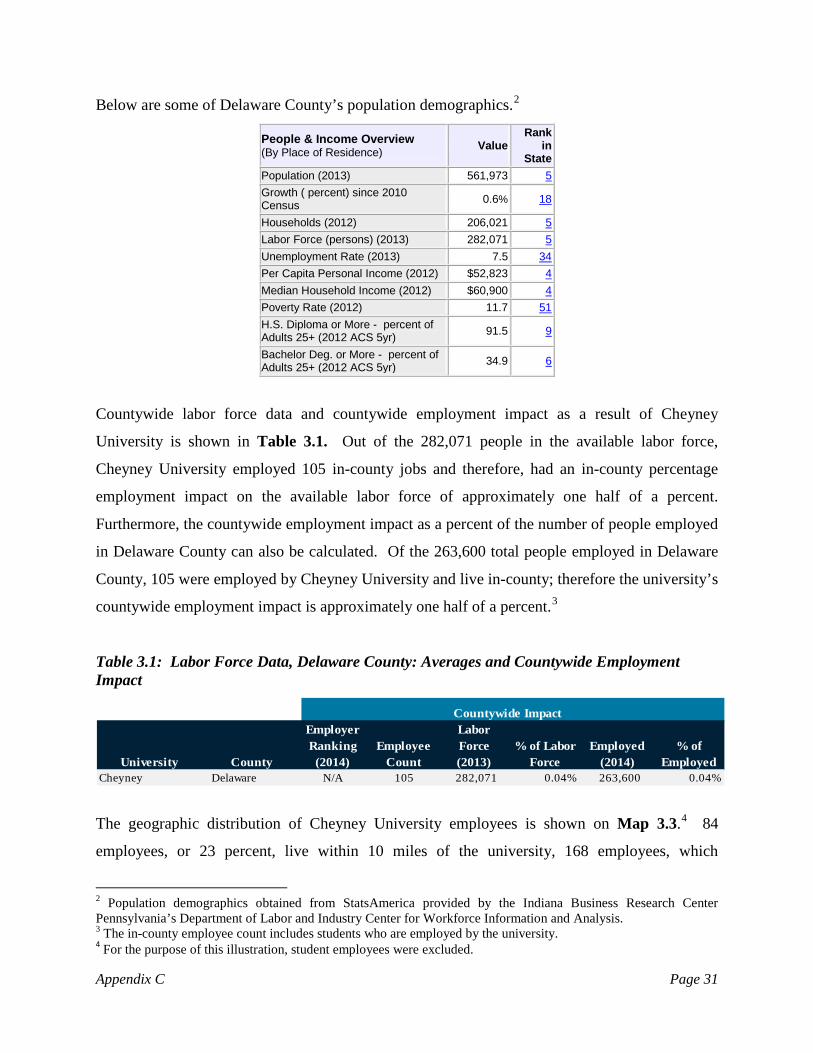
Below are some of Delaware County’s population demographics.2
People & Income Overview (By Place of Residence) Value
Rank in
State Population (2013) 561,973 5
Growth ( percent) since 2010 Census 0.6% 18
Households (2012) 206,021 5
Labor Force (persons) (2013) 282,071 5
Unemployment Rate (2013) 7.5 34
Per Capita Personal Income (2012) $52,823 4
Median Household Income (2012) $60,900 4
Poverty Rate (2012) 11.7 51
H.S. Diploma or More - percent of Adults 25+ (2012 ACS 5yr) 91.5 9
Bachelor Deg. or More - percent of Adults 25+ (2012 ACS 5yr) 34.9 6
Countywide labor force data and countywide employment impact as a result of Cheyney
University is shown in Table 3.1. Out of the 282,071 people in the available labor force,
Cheyney University employed 105 in-county jobs and therefore, had an in-county percentage
employment impact on the available labor force of approximately one half of a percent.
Furthermore, the countywide employment impact as a percent of the number of people employed
in Delaware County can also be calculated. Of the 263,600 total people employed in Delaware
County, 105 were employed by Cheyney University and live in-county; therefore the university’s
countywide employment impact is approximately one half of a percent.3
Table 3.1: Labor Force Data, Delaware County: Averages and Countywide Employment Impact
Countywide Impact
University County
Employer Ranking (2014)
Employee Count
Labor Force (2013)
% of Labor Force
Employed (2014)
% of Employed
Cheyney Delaware N/A 105 282,071 0.04% 263,600 0.04%
The geographic distribution of Cheyney University employees is shown on Map 3.3.4 84
employees, or 23 percent, live within 10 miles of the university, 168 employees, which
2 Population demographics obtained from StatsAmerica provided by the Indiana Business Research Center Pennsylvania’s Department of Labor and Industry Center for Workforce Information and Analysis. 3 The in-county employee count includes students who are employed by the university. 4 For the purpose of this illustration, student employees were excluded.
Appendix C Page 31
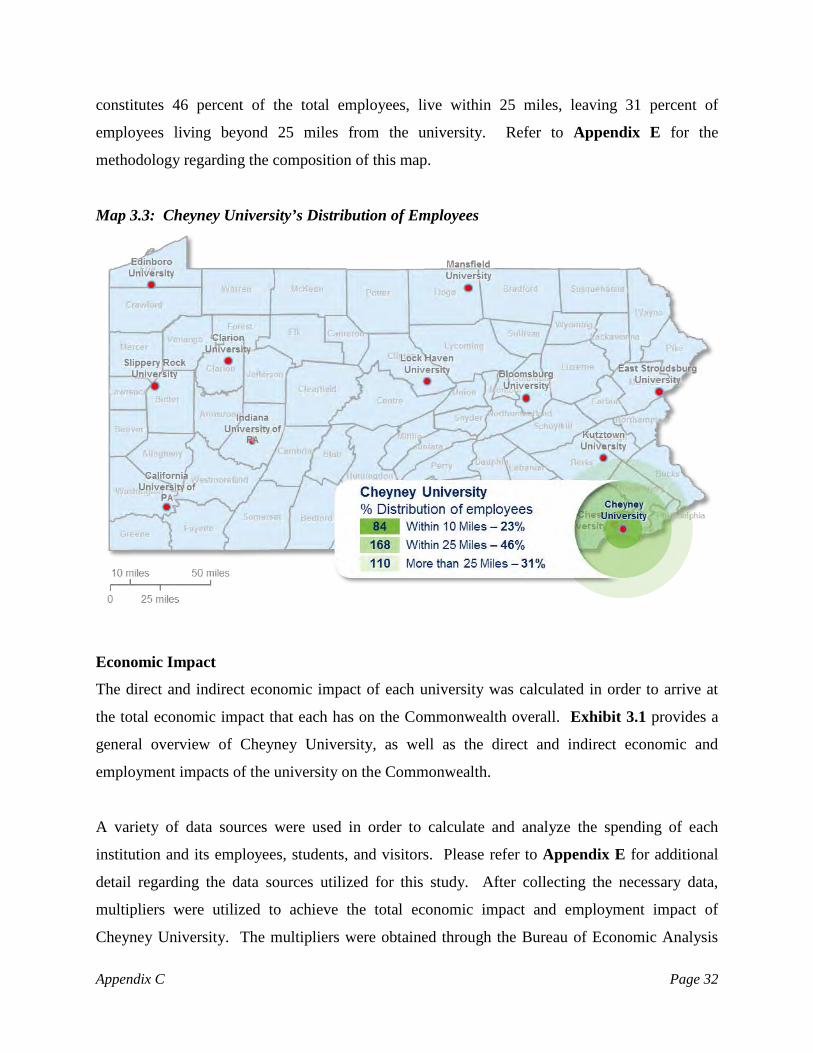
constitutes 46 percent of the total employees, live within 25 miles, leaving 31 percent of
employees living beyond 25 miles from the university. Refer to Appendix E for the
methodology regarding the composition of this map.
Map 3.3: Cheyney University’s Distribution of Employees
Economic Impact
The direct and indirect economic impact of each university was calculated in order to arrive at
the total economic impact that each has on the Commonwealth overall. Exhibit 3.1 provides a
general overview of Cheyney University, as well as the direct and indirect economic and
employment impacts of the university on the Commonwealth.
A variety of data sources were used in order to calculate and analyze the spending of each
institution and its employees, students, and visitors. Please refer to Appendix E for additional
detail regarding the data sources utilized for this study. After collecting the necessary data,
multipliers were utilized to achieve the total economic impact and employment impact of
Cheyney University. The multipliers were obtained through the Bureau of Economic Analysis
Appendix C Page 32

Regional Industrial Multiplier Systems (“RIMS II”). As a whole, it is noted that Cheyney
University has an important role in the Commonwealth in terms of the higher educational
opportunities it provides to residents of the Commonwealth as well as the direct, indirect, and
induced economic benefits the university provides to the Commonwealth.
The total direct economic impact of Cheyney University on the Commonwealth was
$58,476,432. This value is represented by four main spending sources: institutional spending,
faculty/staff spending, student spending, and capital expenditures. Note that the institutional
spending includes employment benefits spent primarily in the Commonwealth of Pennsylvania.
Cheyney University’s Direct Economic Impact on the Commonwealth
(1) Institutional spending: $21,706,150
Benefits: $7,655,748
(2) Faculty/Staff spending: $14,857,838
(3) Student spending: $7,162,092
(4) Capital Expenditures: $7,094,604
Total Direct Impact: $58,476,432
As presented in Table 3.2, the direct impact, $58,476,432, was multiplied by the applicable state
multipliers obtained from the RIMS II data, resulting in a total economic impact of Cheyney
University on the Commonwealth of $115,406,159. By taking the difference between the total
and direct economic impacts, the combined indirect and induced impact is calculated to be
$56,929,728. Please refer to Appendix E for an additional discussion related to the use of
multipliers and the methodology employed to derive the direct and indirect economic benefits.
Table 3.2: Total Economic Impact of Cheyney University on the Commonwealth
University Total Direct Total Indirect Total Induced Total ImpactCheyney 58,476,432$ 45,032,828$ 11,896,900$ 115,406,159$
Appendix C Page 33

Chart 3.1: Total Economic Impact (Direct + Indirect + Induced): $115,406,159
The resulting return of taxpayer dollars via the Commonwealth’s appropriations has a significant
and measurable economic impact on the Commonwealth as a whole. Specifically, the
appropriation to Cheyney University made by the Commonwealth of Pennsylvania, and allocated
by the State System, for fiscal year 2013-2014 was $13,098,158. Therefore, each dollar invested
in Cheyney University by the Commonwealth via appropriations yielded a return of $8.81 in
total economic impact, as is shown on Table 3.3.
Table 3.3: Statewide Economic Impact of Cheyney University Appropriations
University Total ImpactState
Appropriations RatioCheyney 115,406,159$ 13,098,158$ 8.81
University spending in addition to the ancillary spending (faculty and students) yielded income
tax revenues to the Commonwealth, as well as to local municipalities and the state
unemployment trust fund. Table 3.4 illustrates the benefits provided by the university’s payroll
expenditures.
$58,476,432
$45,032,828
$11,896,900
Total Direct
Total Indirect
Total Induced
Appendix C Page 34
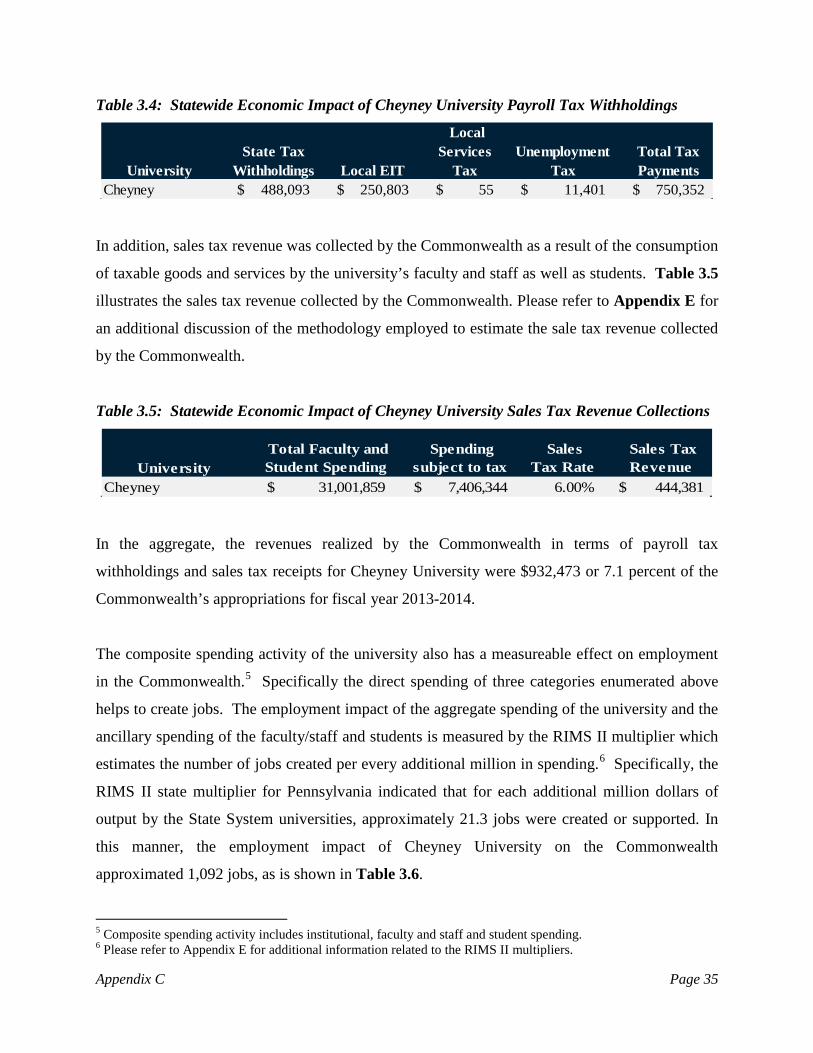
Table 3.4: Statewide Economic Impact of Cheyney University Payroll Tax Withholdings
UniversityState Tax
Withholdings Local EIT
Local Services
TaxUnemployment
TaxTotal Tax Payments
Cheyney 488,093$ 250,803$ 55$ 11,401$ 750,352$
In addition, sales tax revenue was collected by the Commonwealth as a result of the consumption
of taxable goods and services by the university’s faculty and staff as well as students. Table 3.5
illustrates the sales tax revenue collected by the Commonwealth. Please refer to Appendix E for
an additional discussion of the methodology employed to estimate the sale tax revenue collected
by the Commonwealth.
Table 3.5: Statewide Economic Impact of Cheyney University Sales Tax Revenue Collections
University Total Faculty and Student Spending
Spending subject to tax
Sales Tax Rate
Sales Tax Revenue
Cheyney 31,001,859$ 7,406,344$ 6.00% 444,381$
In the aggregate, the revenues realized by the Commonwealth in terms of payroll tax
withholdings and sales tax receipts for Cheyney University were $932,473 or 7.1 percent of the
Commonwealth’s appropriations for fiscal year 2013-2014.
The composite spending activity of the university also has a measureable effect on employment
in the Commonwealth.5 Specifically the direct spending of three categories enumerated above
helps to create jobs. The employment impact of the aggregate spending of the university and the
ancillary spending of the faculty/staff and students is measured by the RIMS II multiplier which
estimates the number of jobs created per every additional million in spending.6 Specifically, the
RIMS II state multiplier for Pennsylvania indicated that for each additional million dollars of
output by the State System universities, approximately 21.3 jobs were created or supported. In
this manner, the employment impact of Cheyney University on the Commonwealth
approximated 1,092 jobs, as is shown in Table 3.6.
5 Composite spending activity includes institutional, faculty and staff and student spending. 6 Please refer to Appendix E for additional information related to the RIMS II multipliers.
Appendix C Page 35

Table 3.6: Statewide Employment Impact of Cheyney University on the Commonwealth as Result of Direct Composite Spending: 1,092 Jobs
University
Direct Composite Spending
Jobs Output
Employment Impact
Cheyney 51,381,828 21.26 1,092
The capital expenditures of the university also help to support jobs in the region. This
employment impact is again measured using RIMS II multipliers by estimating the number of
jobs created for every additional million spent on capital expenditures. Specifically, the RIMS II
construction multiplier for Pennsylvania indicated that per each additional million dollars of
output, approximately 17.9 jobs were created or supported. In this manner, the employment
impact of Cheyney University on the Commonwealth approximated 127 more jobs, as shown in
Table 3.7. Therefore, the total employment impact of Cheyney University is 1,219 jobs.
Table 3.7: Statewide Employment Impact of Cheyney University on the Commonwealth as a Result of Direct Capital Expenditures: 127 Jobs
UniversityDirect Capital Expenditures Jobs Output
Employment Impact
Cheyney 7,094,604 17.84 127
The final quantified measure of economic impact would be that of volunteer hours contributed
by faculty and staff. However, Cheyney University does not formally track the amount of
volunteerism conducted by students, faculty, or staff. It is important to note that it is likely that
the student participation is required by university curricular and co-curricular programs, some of
which either required supervision or a faculty team leader.
Economic Development
Economic development involves improvements to the standard of living through the creation of
jobs and the support of innovation and new research in a community’s region, state, or nation.
The State System plays a role in enhancing the economic development of the regions in which
the individual universities reside by assisting in the development and growth of new and existing
businesses, as well as increasing the employment opportunities, both of which increase economic
activity in the respective areas. The universities accomplish this in various ways, such as
Appendix C Page 36

partnering with local businesses, providing education and job skills training, providing an outlet
for research and development through incubators, and by providing financial and technical
assistance.
The goal of Pennsylvania’s State System of Higher Education and its 14 universities is
fundamentally to educate the citizens of the Commonwealth. By providing higher education, the
universities are not only helping to improve the economic development in the short-term, but in
the long-run as well. Therefore, by way of establishing and accomplishing its mission,
Pennsylvania’s State System is benefiting the economic advancement of the Commonwealth.
Primarily, the State System does this through the granting of undergraduate and graduate
degrees, but also does so indirectly through its purchasing, expenditures, services, and by
employing hundreds, even thousands, of people.
Overall, Pennsylvania’s State System of Higher Education is a key player in supporting the
economic development and growth of communities, counties, regions, and the Commonwealth
overall. By providing sources of innovation and entrepreneurial assistance, the State System
supplies economic growth to local businesses along with highly skilled and educated candidate
employees. Through its various economic development activities, Cheyney University
successfully provides an economic competitive advantage for the county and the Commonwealth
as a whole.
Cheyney University’s participation in WEDnetPA program has over 900 participants and had a
total of $184,072 funds awarded in 2014. Additionally, Cheyney University has a Small
Business Enterprise Supportive Services Center, as well as a Disadvantaged Business Enterprise
Supportive Services Center that counseled over 475 individuals and over 500 businesses in 2014.
In other words, Cheyney University contributed over 4,700 hours to the institution’s economic
development efforts.
Appendix C Page 37
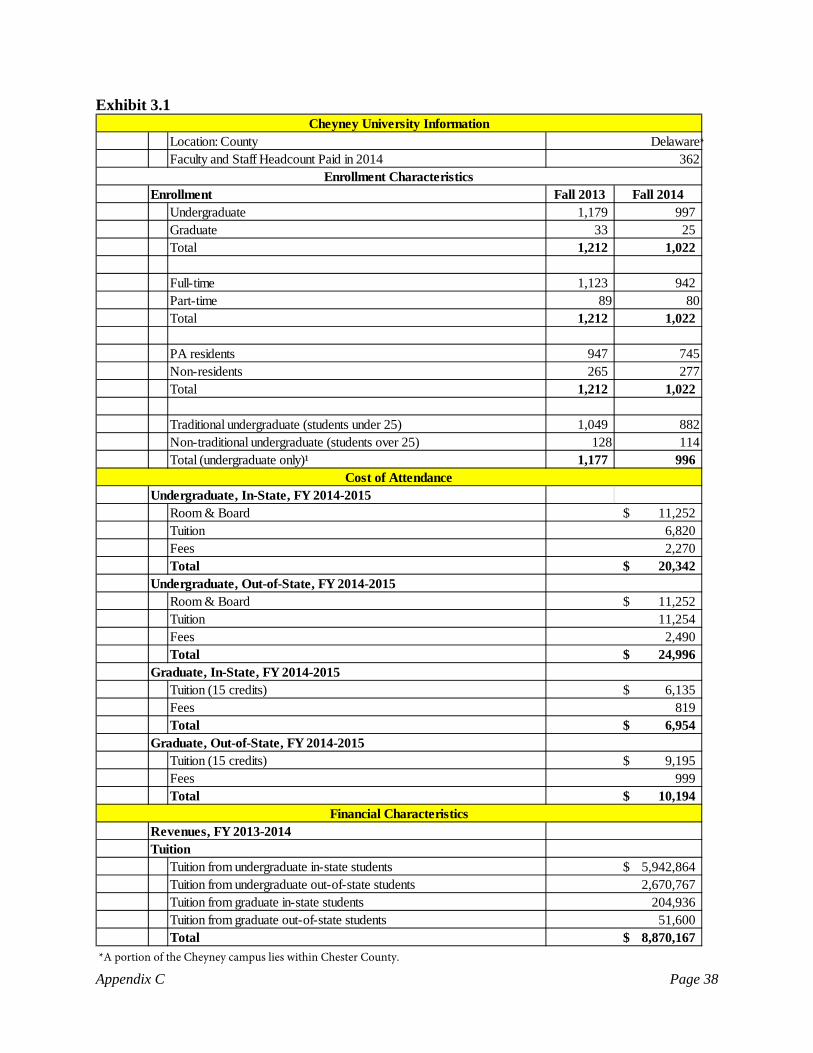
Exhibit 3.1
Location: CountyFaculty and Staff Headcount Paid in 2014
Fall 2013 Fall 2014Undergraduate 1,179 997 Graduate 33 25 Total 1,212 1,022
Full-time 1,123 942 Part-time 89 80Total 1,212 1,022
PA residents 947 745Non-residents 265 277Total 1,212 1,022
Traditional undergraduate (students under 25) 1,049 882Non-traditional undergraduate (students over 25) 128 114Total (undergraduate only)¹ 1,177 996
Room & BoardTuitionFeesTotal
Room & BoardTuitionFeesTotal
Tuition (15 credits)FeesTotal
Tuition (15 credits)FeesTotal
Tuition from undergraduate in-state studentsTuition from undergraduate out-of-state studentsTuition from graduate in-state studentsTuition from graduate out-of-state studentsTotal
51,600 8,870,167$
Tuition5,942,864$ 2,670,767
204,936
999 10,194$
Financial CharacteristicsRevenues, FY 2013-2014
819 6,954$
Graduate, Out-of-State, FY 2014-20159,195$
2,490 24,996$
Graduate, In-State, FY 2014-20156,135$
Cheyney University InformationDelaware
362Enrollment Characteristics
Enrollment
Cost of AttendanceUndergraduate, In-State, FY 2014-2015
11,252$ 6,820 2,270
20,342$ Undergraduate, Out-of-State, FY 2014-2015
11,252$ 11,254
Appendix C Page 38
*
*A portion of the Cheyney campus lies within Chester County.
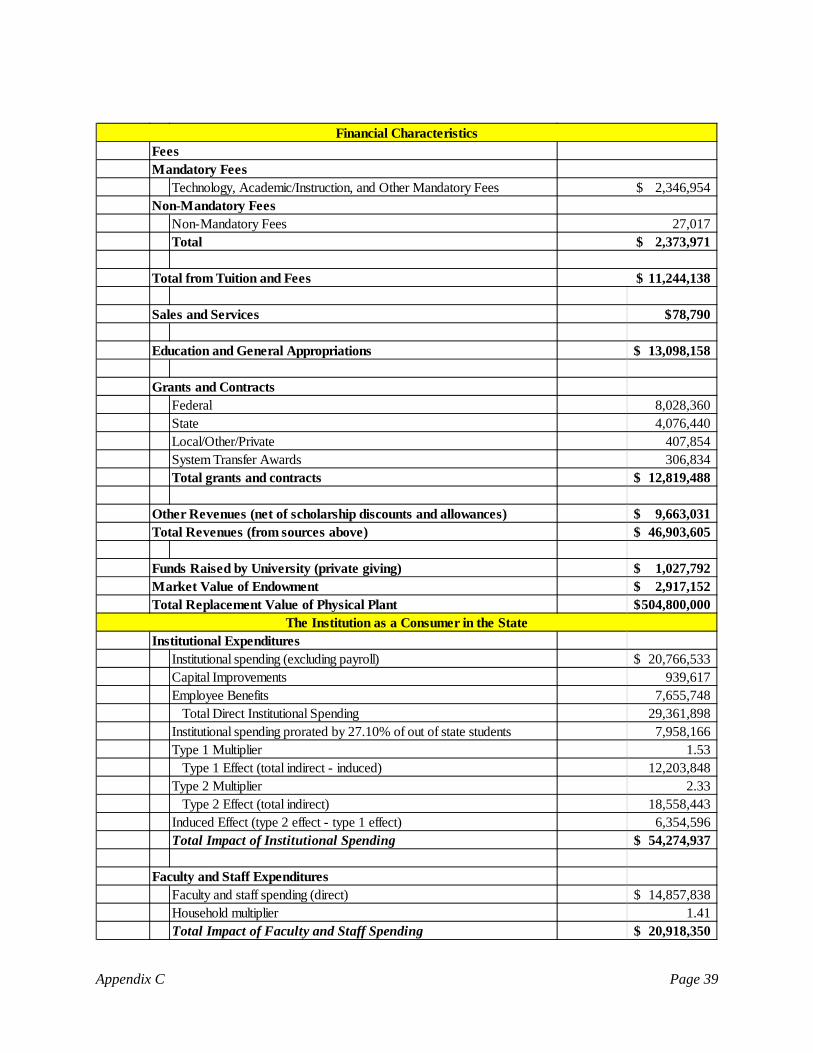
Technology, Academic/Instruction, and Other Mandatory Fees
Non-Mandatory FeesTotal
Total from Tuition and Fees
78,790$
13,098,158$
Federal 8,028,360 State 4,076,440 Local/Other/Private 407,854 System Transfer Awards 306,834 Total grants and contracts 12,819,488$
9,663,031$ Total Revenues (from sources above) 46,903,605$
1,027,792$ 2,917,152$
504,800,000$
Institutional ExpendituresInstitutional spending (excluding payroll) 20,766,533$ Capital Improvements 939,617 Employee Benefits 7,655,748
Total Direct Institutional Spending 29,361,898 Institutional spending prorated by 27.10% of out of state students 7,958,166 Type 1 Multiplier 1.53
Type 1 Effect (total indirect - induced) 12,203,848 Type 2 Multiplier 2.33
Type 2 Effect (total indirect) 18,558,443 Induced Effect (type 2 effect - type 1 effect) 6,354,596 Total Impact of Institutional Spending 54,274,937$
Faculty and Staff ExpendituresFaculty and staff spending (direct) 14,857,838$ Household multiplier 1.41 Total Impact of Faculty and Staff Spending 20,918,350$
The Institution as a Consumer in the State
Financial CharacteristicsFeesMandatory Fees
2,346,954$ Non-Mandatory Fees
27,017 2,373,971$
11,244,138$
Total Replacement Value of Physical Plant
Sales and Services
Education and General Appropriations
Grants and Contracts
Other Revenues (net of scholarship discounts and allowances)
Funds Raised by University (private giving)Market Value of Endowment
Appendix C Page 39

Student ExpendituresStudent spending (direct) 7,162,092$ Household multiplier 1.41 Total Impact of Student Spending 10,083,509$
Capital ExpendituresCapital Improvements - 5 year weighted average 6,606,667$ Deferred Maintenance 487,937
Total Direct Capital Expenditures 7,094,604 Type 1 Multiplier 1.68
Type 1 Effect (total indirect - induced) 11,950,150 Type 2 Multiplier 2.47
Type 2 Effect (total indirect) 17,492,455 Induced Effect (type 2 effect - type 1 effect) 5,542,304 Total Impact of Capital Expenditures 30,129,363$
Employment impact for the CommonwealthDirect composite expenditures for the Commonwealth 51,381,828$ State multiplier 21.26Statewide Employment Impact based on Composite Spending (jobs) 1,092 Direct capital expenditures for the Commonwealth 7,094,604$ State multiplier 17.94Statewide Employment Impact based on Direct Expenditures (jobs) 127Total Employment Impact 1,219
In-Kind (Volunteer) Contributions to Regional EconomyAnnual volunteer hours of faculty and staff N/AAverage market value of volunteer hours (per hour) N/AEstimated total contribution of faculty and staff N/AAnnual volunteer hours of students (2014) N/A
Small Business IncubatorSmall Business Development CenterPatents filed since January 1, 2010
Sales TaxTotal Faculty and Staff and Student Spending 31,001,859$ Imputed % of taxable spending 23.89%Spending subject to tax 7,406,344 Sales tax rate 6%Total State Tax Revenue Generation 444,381$
The Institution as an Employer
The University as a Center for Volunteerism
Business and Economic Development Services
The University as a Generator of State Government Revenue
YesYes
0
The Institution as a Consumer in the State
Appendix C Page 40

Payroll TaxTotal payroll 16,537,354$ State tax withholdings 488,093 Local EIT 250,803 Local Services Tax 55 Unemployment tax 11,401 Total Payroll Tax Payments 750,352$
¹For Fall 2013 and Fall 2014, there were variances of 2 and 1 students, respectively. The variance results from unknown classifications regarding
traditional vs. non-traditional undergraduate students.
The University as a Generator of State Government Revenue
Appendix C Page 41
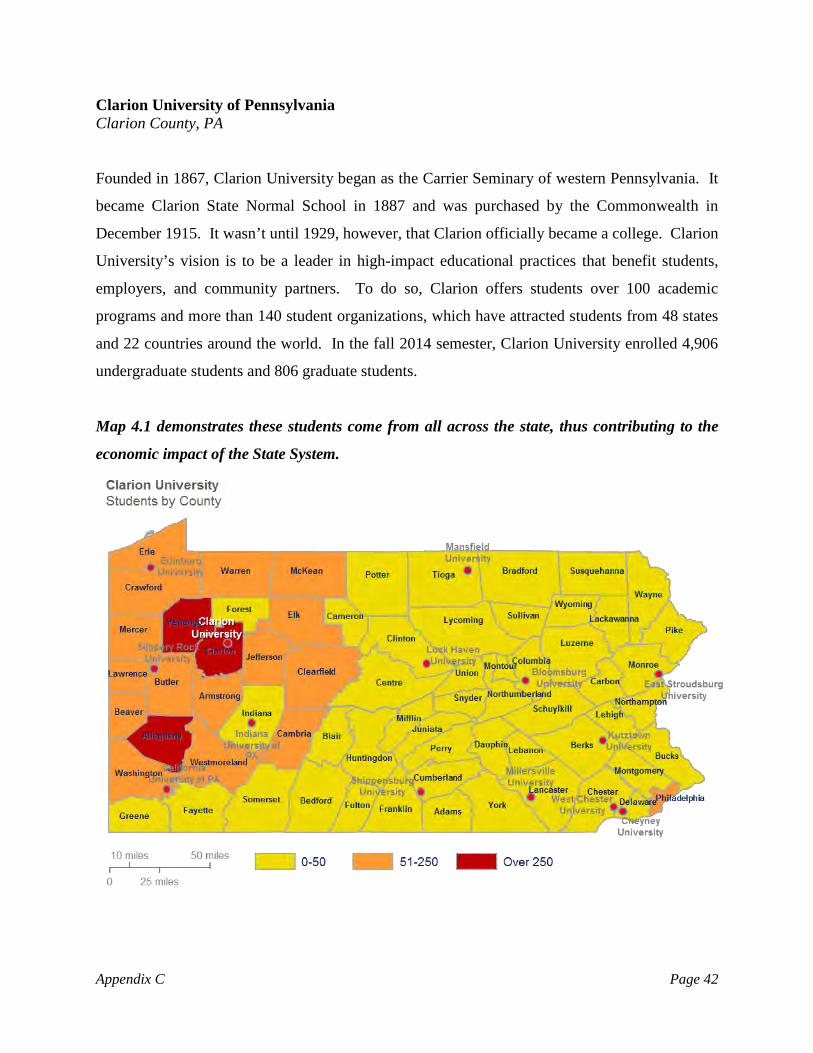
Clarion University of Pennsylvania Clarion County, PA
Founded in 1867, Clarion University began as the Carrier Seminary of western Pennsylvania. It
became Clarion State Normal School in 1887 and was purchased by the Commonwealth in
December 1915. It wasn’t until 1929, however, that Clarion officially became a college. Clarion
University’s vision is to be a leader in high-impact educational practices that benefit students,
employers, and community partners. To do so, Clarion offers students over 100 academic
programs and more than 140 student organizations, which have attracted students from 48 states
and 22 countries around the world. In the fall 2014 semester, Clarion University enrolled 4,906
undergraduate students and 806 graduate students.
Map 4.1 demonstrates these students come from all across the state, thus contributing to the
economic impact of the State System.
Appendix C Page 42

The University also partners with the University of Pittsburgh Medical Center, National Fuel
Company, and the Biotech Business Development Center. Clarion has a second campus in the
historic Oil Valley region, Venango College, which grants two-year, stand-alone and associate
degrees in 11 academic disciplines. Additionally Venango also offers select baccalaureate and
master degrees and provides students an opportunity to begin any of Clarion University’s 90-plus
bachelor degree programs. In July 2010, Clarion University welcomed Dr. Karen M. Whitney as
its 16th president.1
Map 4.2 demonstrates Clarion University’s alumni that still reside in the Commonwealth.
Clarion’s main campus is in Clarion County, PA. It has 600.8 sq. miles in land area and a
population density of 65.2 per square mile. Population in Clarion County has decreased 2.1
percent since in the last census in 2010 to 39,155. In this county, 99.2 percent of the population
reported only one race, with 1.2 percent of these reporting African-American in 2010.
Additionally, the population in Clarion is 0.6 percent Hispanic (of any race). The average
1 Excerpts obtained from Clarion University’s website, www.clarion.edu.
Appendix C Page 43
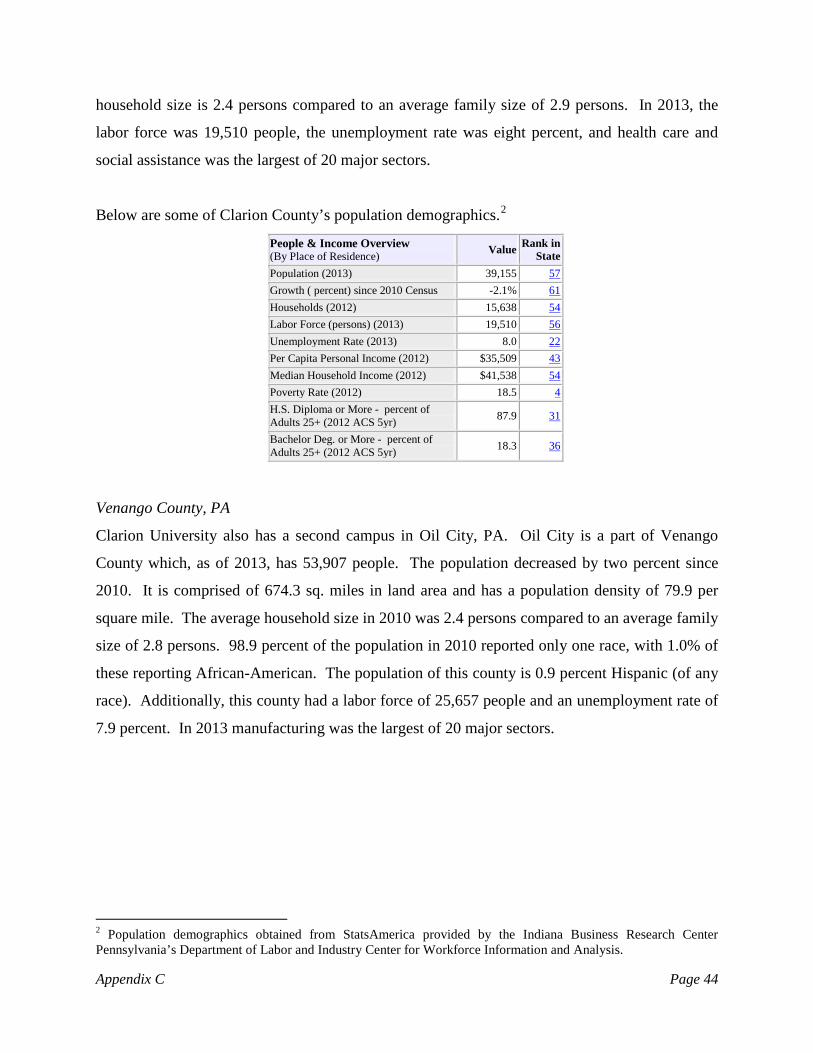
household size is 2.4 persons compared to an average family size of 2.9 persons. In 2013, the
labor force was 19,510 people, the unemployment rate was eight percent, and health care and
social assistance was the largest of 20 major sectors.
Below are some of Clarion County’s population demographics.2
People & Income Overview (By Place of Residence) Value Rank in
State Population (2013) 39,155 57
Growth ( percent) since 2010 Census -2.1% 61
Households (2012) 15,638 54
Labor Force (persons) (2013) 19,510 56
Unemployment Rate (2013) 8.0 22
Per Capita Personal Income (2012) $35,509 43
Median Household Income (2012) $41,538 54
Poverty Rate (2012) 18.5 4
H.S. Diploma or More - percent of Adults 25+ (2012 ACS 5yr) 87.9 31
Bachelor Deg. or More - percent of Adults 25+ (2012 ACS 5yr) 18.3 36
Venango County, PA
Clarion University also has a second campus in Oil City, PA. Oil City is a part of Venango
County which, as of 2013, has 53,907 people. The population decreased by two percent since
2010. It is comprised of 674.3 sq. miles in land area and has a population density of 79.9 per
square mile. The average household size in 2010 was 2.4 persons compared to an average family
size of 2.8 persons. 98.9 percent of the population in 2010 reported only one race, with 1.0% of
these reporting African-American. The population of this county is 0.9 percent Hispanic (of any
race). Additionally, this county had a labor force of 25,657 people and an unemployment rate of
7.9 percent. In 2013 manufacturing was the largest of 20 major sectors.
2 Population demographics obtained from StatsAmerica provided by the Indiana Business Research Center Pennsylvania’s Department of Labor and Industry Center for Workforce Information and Analysis.
Appendix C Page 44

Below are some of Venango County’s population demographics.
Countywide labor force data and countywide employment impact as a result of Clarion
University in Clarion County is shown in Table 4.1.3 Out of the 19,510 people in the available
labor force, Clarion University employed 630 in-county jobs and therefore, had an in-county
percentage employment impact on the available labor force of 3.2 percent. Furthermore, the
countywide employment impact as a percent of the number of people employed in Clarion
County can also be calculated. Of the 17,900 total people employed in Clarion County, 630
were employed by Clarion University and live in-county; therefore the university’s countywide
employment impact is 3.5 percent.4
Table 4.1: Labor Force Data, Clarion County: Averages and Countywide Employment Impact
Countywide Impact
University County
Employer Ranking (2014)
Employee Count
Labor Force (2013)
% of Labor Force
Employed (2014)
% of Employed
Clarion Clarion 1 630 19,510 3.23% 17,900 3.52%
The geographic distribution of Clarion University’s employees is shown on Map 4.3.5 366
employees, or 41 percent, live within 10 miles of the university, 251 employees, which
3 For the purpose of our analysis, the focus was on the amount of in-county jobs at Clarion University’s main campus in Clarion County. It is noted that Clarion University has a branch, Venango College, in Venango County where there is also an employment impact. 4 The in-county employee count includes students who are employed by the university. 5 For the purpose of this illustration, student employees were excluded.
People & Income Overview (By Place of Residence) Value Rank in
State Population (2013) 53,907 43
Growth (%) since 2010 Census -2.0% 60
Households (2012) 22,525 42
Labor Force (persons) (2013) 25,657 43
Unemployment Rate (2013) 7.9 25
Per Capita Personal Income (2012) $35,548 42
Median Household Income (2012) $38,351 64
Poverty Rate (2012) 17.5 5
H.S. Diploma or More - % of Adults 25+ (2012 ACS 5yr) 88.5 23
Bachelor Deg. or More - % of Adults 25+ (2012 ACS 5yr) 14.7 51
Appendix C Page 45
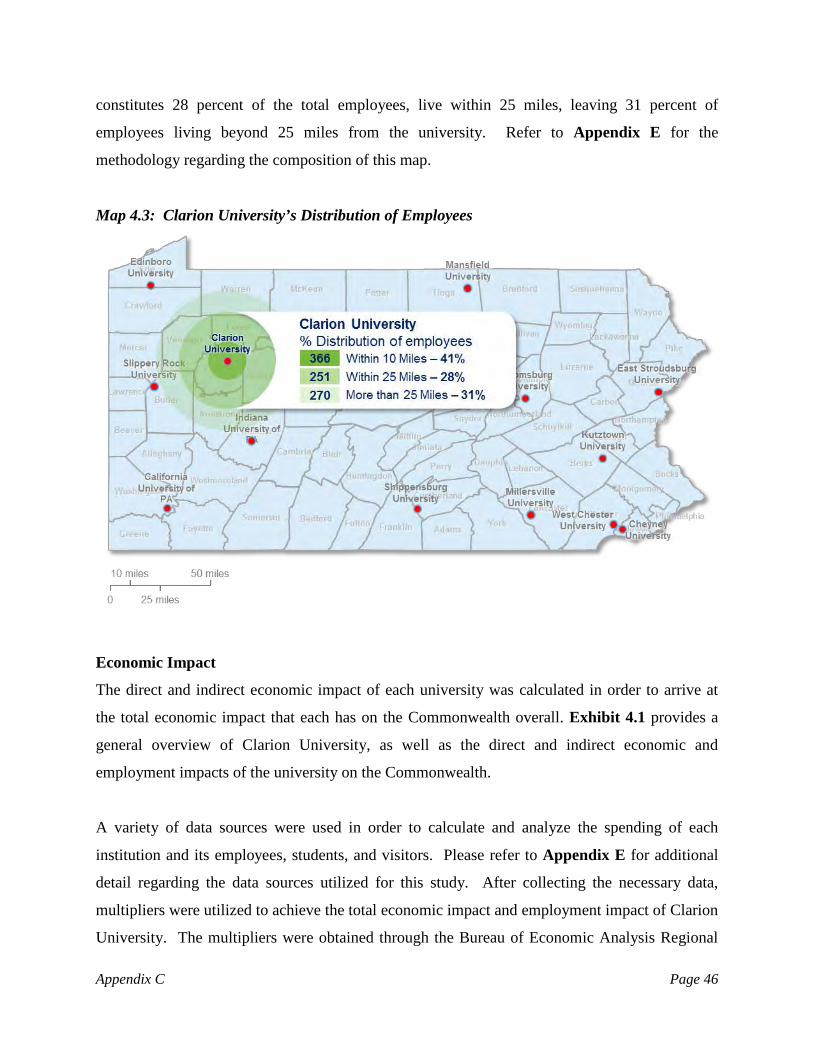
constitutes 28 percent of the total employees, live within 25 miles, leaving 31 percent of
employees living beyond 25 miles from the university. Refer to Appendix E for the
methodology regarding the composition of this map.
Map 4.3: Clarion University’s Distribution of Employees
Economic Impact
The direct and indirect economic impact of each university was calculated in order to arrive at
the total economic impact that each has on the Commonwealth overall. Exhibit 4.1 provides a
general overview of Clarion University, as well as the direct and indirect economic and
employment impacts of the university on the Commonwealth.
A variety of data sources were used in order to calculate and analyze the spending of each
institution and its employees, students, and visitors. Please refer to Appendix E for additional
detail regarding the data sources utilized for this study. After collecting the necessary data,
multipliers were utilized to achieve the total economic impact and employment impact of Clarion
University. The multipliers were obtained through the Bureau of Economic Analysis Regional
Appendix C Page 46
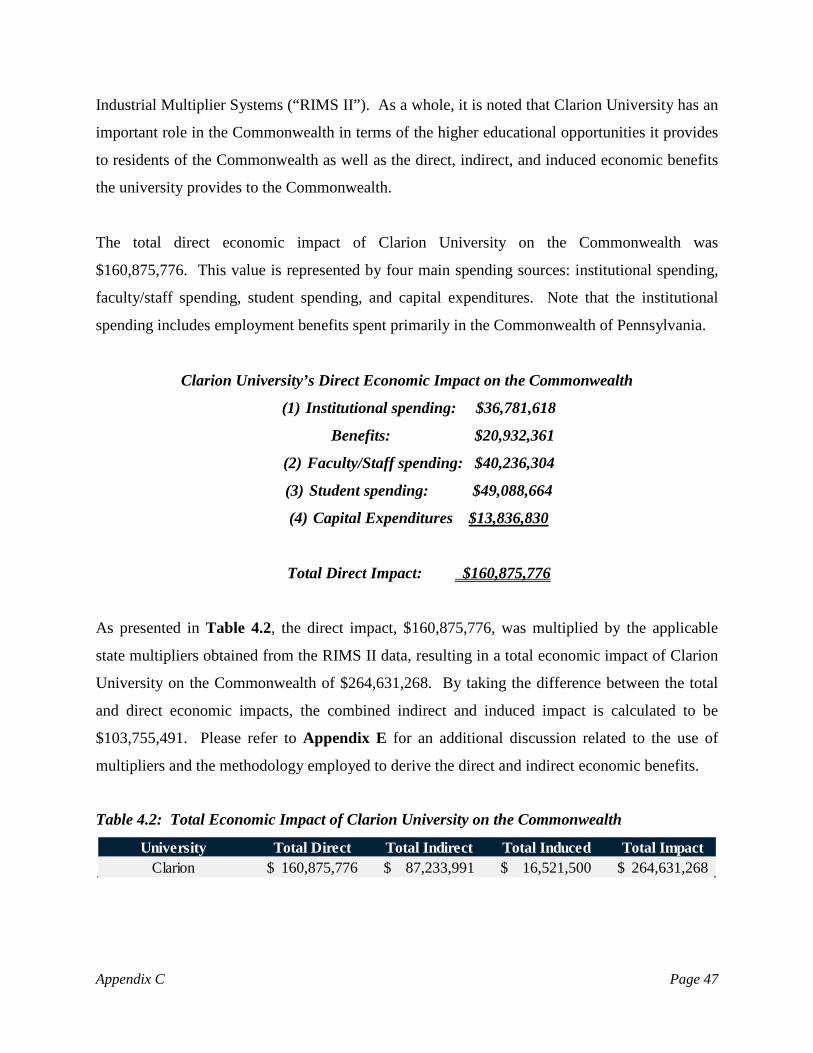
Industrial Multiplier Systems (“RIMS II”). As a whole, it is noted that Clarion University has an
important role in the Commonwealth in terms of the higher educational opportunities it provides
to residents of the Commonwealth as well as the direct, indirect, and induced economic benefits
the university provides to the Commonwealth.
The total direct economic impact of Clarion University on the Commonwealth was
$160,875,776. This value is represented by four main spending sources: institutional spending,
faculty/staff spending, student spending, and capital expenditures. Note that the institutional
spending includes employment benefits spent primarily in the Commonwealth of Pennsylvania.
Clarion University’s Direct Economic Impact on the Commonwealth
(1) Institutional spending: $36,781,618
Benefits: $20,932,361
(2) Faculty/Staff spending: $40,236,304
(3) Student spending: $49,088,664
(4) Capital Expenditures $13,836,830
Total Direct Impact: $160,875,776
As presented in Table 4.2, the direct impact, $160,875,776, was multiplied by the applicable
state multipliers obtained from the RIMS II data, resulting in a total economic impact of Clarion
University on the Commonwealth of $264,631,268. By taking the difference between the total
and direct economic impacts, the combined indirect and induced impact is calculated to be
$103,755,491. Please refer to Appendix E for an additional discussion related to the use of
multipliers and the methodology employed to derive the direct and indirect economic benefits.
Table 4.2: Total Economic Impact of Clarion University on the Commonwealth
University Total Direct Total Indirect Total Induced Total ImpactClarion 160,875,776$ 87,233,991$ 16,521,500$ 264,631,268$
Appendix C Page 47

Chart 4.1: Total Economic Impact (Direct + Indirect + Induced): $264,631,268
The resulting return of taxpayer dollars via the Commonwealth’s appropriations has a significant
and measurable economic impact on the Commonwealth as a whole. Specifically, the
appropriation to Clarion University made by the Commonwealth of Pennsylvania, and allocated
by the State System, for fiscal year 2013-2014 was $22,261,739. Therefore, each dollar invested
in Clarion University by the Commonwealth via appropriations yielded a return of approximately
$11.89 in total economic impact, as is shown on Table 4.3.
Table 4.3: State Economic Impact of Clarion University Appropriations
University Total ImpactState
Appropriations RatioClarion 264,631,268$ 22,261,739$ 11.89
University spending in addition to the ancillary spending (faculty and students) yielded income
tax revenues to the Commonwealth, as well as to local municipalities and the state
unemployment trust fund. Table 4.4 illustrates the benefits provided by the university’s payroll
expenditures.
$160,875,776
$87,233,991
$16,521,500
Total Direct
Total Indirect
Total Induced
Appendix C Page 48

Table 4.4: State Economic Impact of Clarion University Payroll Tax Withholdings
UniversityState Tax
Withholdings Local EIT
Local Services
TaxUnemployment
TaxTotal Tax Payments
Clarion 1,420,794$ 479,413$ 57,192$ 32,025$ 1,989,425$
In addition, sales tax revenue was collected by the Commonwealth as a result of the consumption
of taxable goods and services by the university’s faculty and staff as well as students. Table 4.5
illustrates the sales tax revenue collected by the Commonwealth. Please refer to Appendix E for
an additional discussion of the methodology employed to estimate the sale tax revenue collected
by the Commonwealth.
Table 4.5: State Economic Impact of Clarion University Sales Tax Revenue Collections
University Total Faculty and Student Spending
Spending subject to tax
Sales Tax Rate
Sales Tax Revenue
Clarion 125,760,622$ 30,044,213$ 6.00% 1,802,653$
In the aggregate, the revenues realized by the Commonwealth in terms of payroll tax
withholdings and sales tax receipts for Clarion University were $3,223,447 or 14.5 percent of the
Commonwealth’s appropriations for fiscal year 2013-2014.
The composite spending activity of the university also has a measureable effect on employment
in the Commonwealth.6 Specifically the direct spending of three categories enumerated above
helps to create jobs. The employment impact of the aggregate spending of the university and the
ancillary spending of the faculty/staff and students is measured by the RIMS II multiplier which
estimates the number of jobs created per every additional million in spending.7 Specifically, the
RIMS II state multiplier for Pennsylvania indicated that for each additional million dollars of
output by the State System universities, approximately 21.3 jobs were created or supported. In
this manner, the employment impact of Clarion University on the Commonwealth approximately
3,126 jobs, as is shown in Table 4.6.
6 Composite spending activity includes institutional, faculty and staff and student spending. 7 Please refer to Appendix E for additional information related to the RIMS II multipliers.
Appendix C Page 49
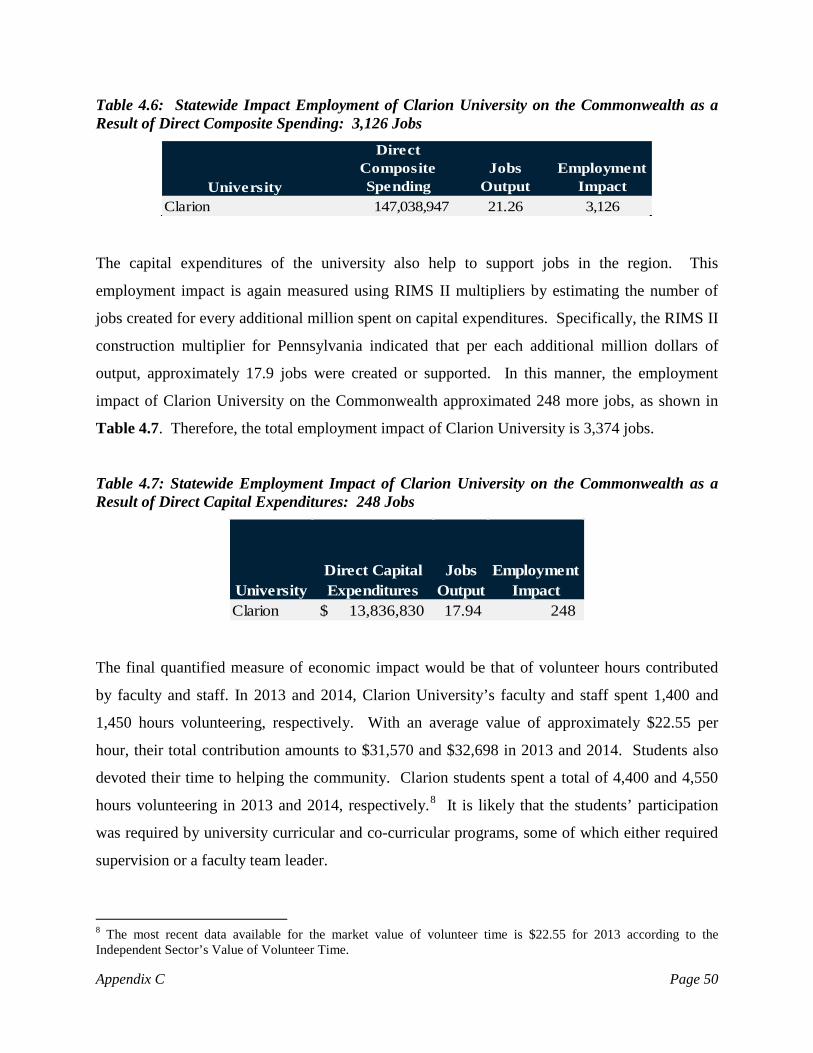
Table 4.6: Statewide Impact Employment of Clarion University on the Commonwealth as a Result of Direct Composite Spending: 3,126 Jobs
University
Direct Composite Spending
Jobs Output
Employment Impact
Clarion 147,038,947 21.26 3,126
The capital expenditures of the university also help to support jobs in the region. This
employment impact is again measured using RIMS II multipliers by estimating the number of
jobs created for every additional million spent on capital expenditures. Specifically, the RIMS II
construction multiplier for Pennsylvania indicated that per each additional million dollars of
output, approximately 17.9 jobs were created or supported. In this manner, the employment
impact of Clarion University on the Commonwealth approximated 248 more jobs, as shown in
Table 4.7. Therefore, the total employment impact of Clarion University is 3,374 jobs.
Table 4.7: Statewide Employment Impact of Clarion University on the Commonwealth as a Result of Direct Capital Expenditures: 248 Jobs
UniversityDirect Capital Expenditures
Jobs Output
Employment Impact
Clarion $ 13,836,830 17.94 248
The final quantified measure of economic impact would be that of volunteer hours contributed
by faculty and staff. In 2013 and 2014, Clarion University’s faculty and staff spent 1,400 and
1,450 hours volunteering, respectively. With an average value of approximately $22.55 per
hour, their total contribution amounts to $31,570 and $32,698 in 2013 and 2014. Students also
devoted their time to helping the community. Clarion students spent a total of 4,400 and 4,550
hours volunteering in 2013 and 2014, respectively.8 It is likely that the students’ participation
was required by university curricular and co-curricular programs, some of which either required
supervision or a faculty team leader.
8 The most recent data available for the market value of volunteer time is $22.55 for 2013 according to the Independent Sector’s Value of Volunteer Time.
Appendix C Page 50

Economic Development
Economic development involves improvements to the standard of living through the creation of
jobs and the support of innovation and new research in a community’s region, state, or nation.
The State System plays a role in enhancing the economic development of the regions in which
the individual universities reside by assisting in the development and growth of new and existing
businesses, as well as increasing the employment opportunities, both of which increase economic
activity in the respective areas. The universities accomplish this in various ways, such as
partnering with local businesses, providing education and job skills training, providing an outlet
for research and development through incubators, and by providing financial and technical
assistance.
The goal of Pennsylvania’s State System of Higher Education and its 14 universities is
fundamentally to educate the citizens of the Commonwealth. By providing higher education, the
universities are not only helping to improve the economic development in the short-term, but in
the long-run as well. Therefore, by way of establishing and accomplishing its mission,
Pennsylvania’s State System is benefiting the economic advancement of the Commonwealth.
Primarily, the State System does this through the granting of undergraduate and graduate
degrees, but also does so indirectly through its purchasing, expenditures, services, and by
employing hundreds, even thousands, of people.
Overall, Pennsylvania’s State System of Higher Education is a key player in supporting the
economic development and growth of communities, counties, regions, and the Commonwealth
overall. By providing sources of innovation and entrepreneurial assistance, the State System
supplies economic growth to local businesses along with highly skilled and educated candidate
employees. Through its various economic development activities, Clarion University
successfully provides an economic competitive advantage for the county and the Commonwealth
as a whole.
Clarion University’s participation in WEDnetPA program has over 950 participants and had a
total of $367,451 funds awarded in 2014. Additionally, Clarion University has a Small Business
Development Center (“SBDC”) which helps in the growth of its ten-county region in western
Appendix C Page 51
Pennsylvania by providing entrepreneurs with the education, information and tools necessary to
build successful businesses. During 2013, Clarion’s SBDC provided approximately 7,522 hours
of consulting to about 524 entrepreneurs, mostly regarding start-up assistance. Furthermore in
total, $11,927,503 was approved in client financing. As a result, the SBDC is positively
affecting the 10 counties it reaches, especially Venango County, where most of the resources in
2013 were directed.9 Lastly, Clarion University has established the Gregory Barnes Center for
Biotechnical Business Development. The Gregory Barnes Center is home to the Center for
Applied Research & Intellectual Property Development (“CARIPD”) and the SBDC. Inside are
the Innovation Laboratories which are designed to be a versatile one-stop shop. They include a
centralized, shared laboratory, 200-, 500- and 2,500-square-foot, private, wet laboratories. Since
its inauguration, CARIPD has conducted contract research and grant-supported research with 11
companies and six individual entrepreneurs, and provided initial consultations for an additional
eight potential entrepreneurs. More than $300,000 has been brought in through grants to support
applied research for them. All of the equipment in the Innovation Laboratories is research or
industry caliber.10 By way of these efforts, it is clear that Clarion University has successfully
impacted the economic development of Clarion County.
9 “Clarion University SBDC Services Summary,” Clarion.edu, visited January 26, 2015. 10 “Innovation Incubation”, Clarion.edu, visited February 24, 2015.
Appendix C Page 52

Exhibit 4.1
Location: CountyFaculty and Staff Headcount Paid in 2014
Fall 2013 Fall 2014Undergraduate 5,199 4,906 Graduate 881 806Total 6,080 5,712
Full-time 4,580 4,194 Part-time 1,500 1,518 Total 6,080 5,712
PA residents 5,411 4,996 Non-residents 669 716Total 6,080 5,712
Traditional undergraduate (students under 25) 4,336 4,051 Non-traditional undergraduate (students over 25) 859 846Total (undergraduate only)¹ 5,195 4,897
Room & BoardTuitionFeesTotal
Room & BoardTuitionFeesTotal
Tuition (per credit)FeesTotal
Tuition (per credit)FeesTotal
Tuition from undergraduate in-state studentsTuition from undergraduate out-of-state studentsTuition from graduate in-state studentsTuition from graduate out-of-state studentsTotal
Clarion University InformationClarion
887Enrollment Characteristics
Enrollment
Cost of AttendanceUndergraduate, In-State, FY 2014-2015
8,152$ 6,820 2,968
17,940$ Undergraduate, Out-of-State, FY 2014-2015
8,152$ 10,230
3,530 21,912$
Graduate, In-State, FY 2014-2015454$ 197 651$
Graduate, Out-of-State, FY 2014-2015681$ 236 917$
Financial CharacteristicsRevenues, FY 2013-2014Tuition
30,214,524$ 3,077,715 3,997,566 2,048,860
39,338,665$
Appendix C Page 53

Technology, Academic/Instruction, and Other Mandatory Fees
Non-Mandatory FeesTotal
Total from Tuition and Fees
3,639,638$
22,261,739$
Federal 12,457,084$ State 7,322,322 Local/Other/Private 708,613 System Transfer Awards 251,389 Total grants and contracts 20,739,408$
11,567,064$ Total Revenues (from sources above) 112,282,657$
940,630$ 30,712,875$
546,700,000$
Institutional ExpendituresInstitutional spending (excluding payroll) 35,689,156$ Capital Improvements 1,092,462 Employee Benefits 20,932,361
Total Direct Institutional Spending 57,713,979 Institutional spending prorated by 12.39% of out of state students 7,153,623 Type 1 Multiplier 1.53
Type 1 Effect (total indirect - induced) 10,970,082 Type 2 Multiplier 2.33
Type 2 Effect (total indirect) 16,682,250 Induced Effect (type 2 effect - type 1 effect) 5,712,168 Total Impact of Institutional Spending 80,108,397$
Faculty and Staff ExpendituresFaculty and staff spending (direct) 40,236,304 Household multiplier 1.41 Total Impact of Faculty and Staff Spending 56,648,692$
The Institution as a Consumer in the State
Financial Characteristics
14,736,143$
54,074,808$
FeesMandatory Fees
489,053
Total Replacement Value of Physical Plant (main campus)
14,247,090$
Sales and Services
Education and General Appropriations
Grants and Contracts
Other Revenues (net of scholarship discounts and allowances)
Funds Raised by University (private giving)Market Value of Endowment
Non-Mandatory Fees
Appendix C Page 54
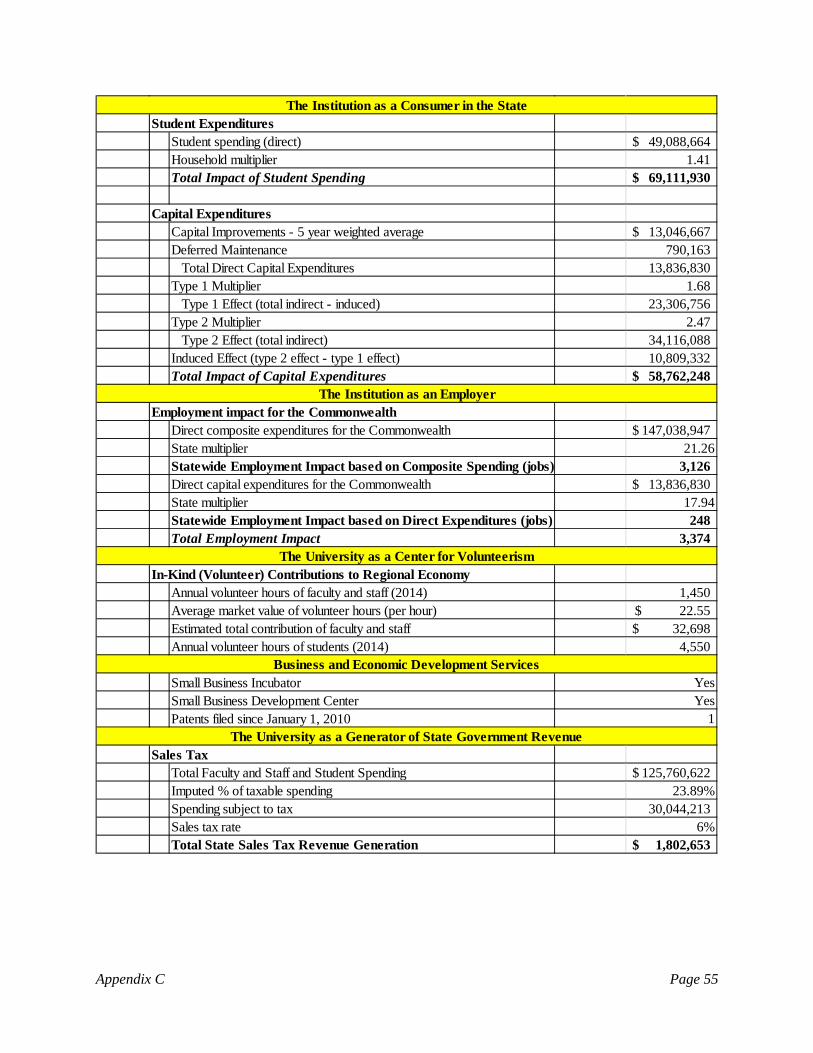
Student ExpendituresStudent spending (direct) 49,088,664$ Household multiplier 1.41 Total Impact of Student Spending 69,111,930$
Capital ExpendituresCapital Improvements - 5 year weighted average 13,046,667$ Deferred Maintenance 790,163
Total Direct Capital Expenditures 13,836,830 Type 1 Multiplier 1.68
Type 1 Effect (total indirect - induced) 23,306,756 Type 2 Multiplier 2.47
Type 2 Effect (total indirect) 34,116,088 Induced Effect (type 2 effect - type 1 effect) 10,809,332 Total Impact of Capital Expenditures 58,762,248$
Employment impact for the CommonwealthDirect composite expenditures for the Commonwealth 147,038,947$ State multiplier 21.26Statewide Employment Impact based on Composite Spending (jobs) 3,126 Direct capital expenditures for the Commonwealth 13,836,830$ State multiplier 17.94Statewide Employment Impact based on Direct Expenditures (jobs) 248 Total Employment Impact 3,374
In-Kind (Volunteer) Contributions to Regional EconomyAnnual volunteer hours of faculty and staff (2014) 1,450 Average market value of volunteer hours (per hour) 22.55$ Estimated total contribution of faculty and staff 32,698$ Annual volunteer hours of students (2014) 4,550
Small Business IncubatorSmall Business Development CenterPatents filed since January 1, 2010
Sales TaxTotal Faculty and Staff and Student Spending 125,760,622$ Imputed % of taxable spending 23.89%Spending subject to tax 30,044,213 Sales tax rate 6%Total State Sales Tax Revenue Generation 1,802,653$
The Institution as a Consumer in the State
The Institution as an Employer
The University as a Center for Volunteerism
Business and Economic Development Services
The University as a Generator of State Government Revenue
YesYes
1
Appendix C Page 55

Payroll TaxTotal payroll 47,353,736$ State tax withholdings 1,420,794 Local EIT 479,413 Local Services Tax 57,192 Unemployment tax 32,025 Total Payroll Tax Payments 1,989,425$
¹For Fall 2013 and Fall 2014, there were variances of 4 and 9 students, respectively. The variance results from unknown classifications regarding
traditional vs. non-traditional undergraduate students.
The University as a Generator of State Government Revenue
Appendix C Page 56
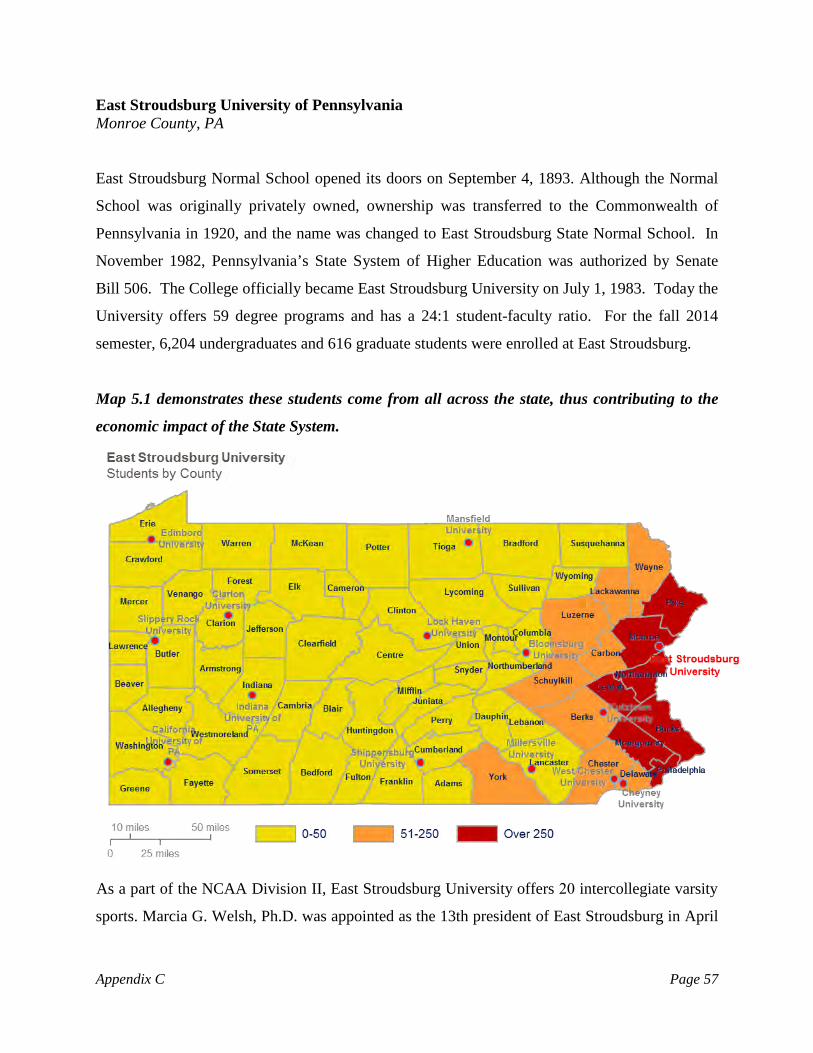
East Stroudsburg University of Pennsylvania Monroe County, PA
East Stroudsburg Normal School opened its doors on September 4, 1893. Although the Normal
School was originally privately owned, ownership was transferred to the Commonwealth of
Pennsylvania in 1920, and the name was changed to East Stroudsburg State Normal School. In
November 1982, Pennsylvania’s State System of Higher Education was authorized by Senate
Bill 506. The College officially became East Stroudsburg University on July 1, 1983. Today the
University offers 59 degree programs and has a 24:1 student-faculty ratio. For the fall 2014
semester, 6,204 undergraduates and 616 graduate students were enrolled at East Stroudsburg.
Map 5.1 demonstrates these students come from all across the state, thus contributing to the
economic impact of the State System.
As a part of the NCAA Division II, East Stroudsburg University offers 20 intercollegiate varsity
sports. Marcia G. Welsh, Ph.D. was appointed as the 13th president of East Stroudsburg in April
Appendix C Page 57
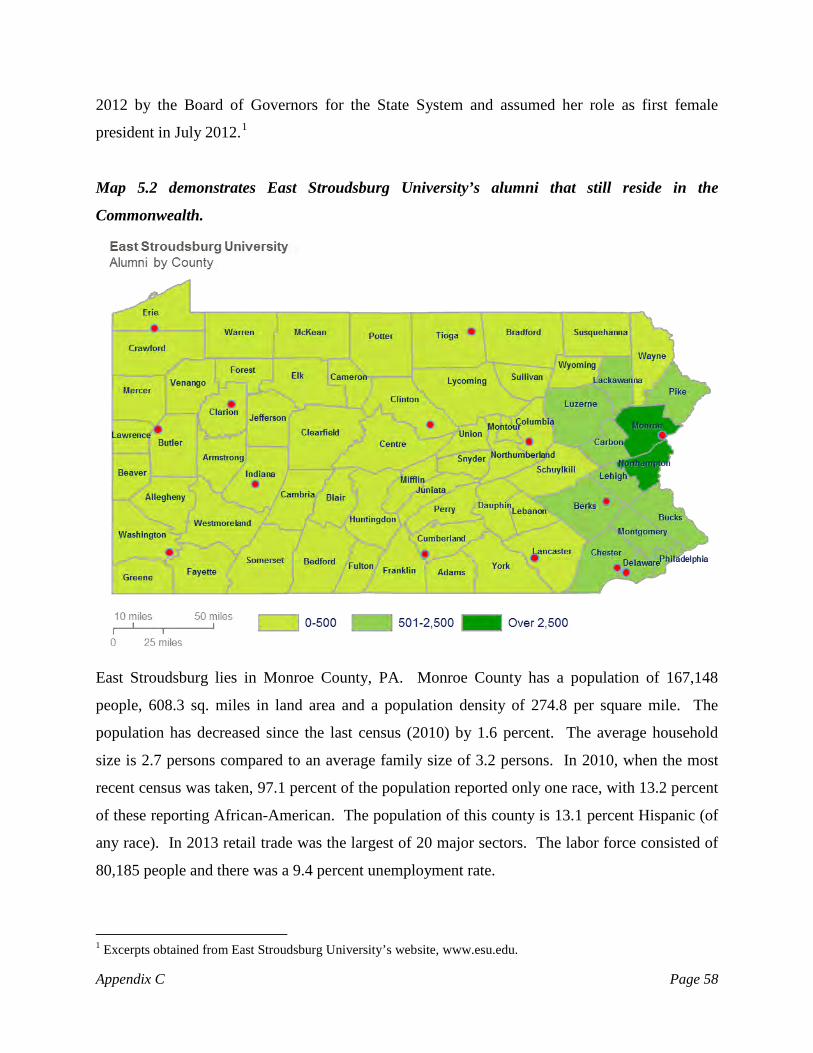
2012 by the Board of Governors for the State System and assumed her role as first female
president in July 2012.1
Map 5.2 demonstrates East Stroudsburg University’s alumni that still reside in the
Commonwealth.
East Stroudsburg lies in Monroe County, PA. Monroe County has a population of 167,148
people, 608.3 sq. miles in land area and a population density of 274.8 per square mile. The
population has decreased since the last census (2010) by 1.6 percent. The average household
size is 2.7 persons compared to an average family size of 3.2 persons. In 2010, when the most
recent census was taken, 97.1 percent of the population reported only one race, with 13.2 percent
of these reporting African-American. The population of this county is 13.1 percent Hispanic (of
any race). In 2013 retail trade was the largest of 20 major sectors. The labor force consisted of
80,185 people and there was a 9.4 percent unemployment rate.
1 Excerpts obtained from East Stroudsburg University’s website, www.esu.edu.
Appendix C Page 58
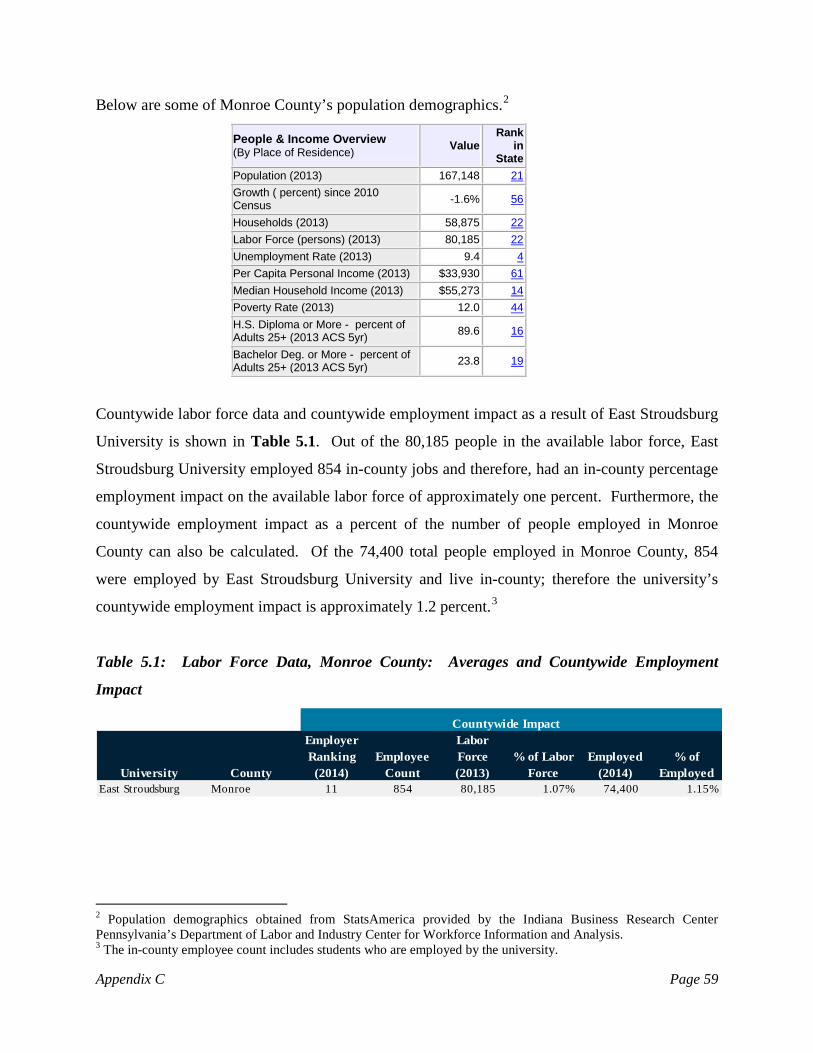
Below are some of Monroe County’s population demographics.2
People & Income Overview (By Place of Residence) Value
Rank in
State Population (2013) 167,148 21Growth ( percent) since 2010 Census -1.6% 56
Households (2013) 58,875 22Labor Force (persons) (2013) 80,185 22Unemployment Rate (2013) 9.4 4
Per Capita Personal Income (2013) $33,930 61Median Household Income (2013) $55,273 14Poverty Rate (2013) 12.0 44H.S. Diploma or More - percent of Adults 25+ (2013 ACS 5yr) 89.6 16
Bachelor Deg. or More - percent of Adults 25+ (2013 ACS 5yr) 23.8 19
Countywide labor force data and countywide employment impact as a result of East Stroudsburg
University is shown in Table 5.1. Out of the 80,185 people in the available labor force, East
Stroudsburg University employed 854 in-county jobs and therefore, had an in-county percentage
employment impact on the available labor force of approximately one percent. Furthermore, the
countywide employment impact as a percent of the number of people employed in Monroe
County can also be calculated. Of the 74,400 total people employed in Monroe County, 854
were employed by East Stroudsburg University and live in-county; therefore the university’s
countywide employment impact is approximately 1.2 percent.3
Table 5.1: Labor Force Data, Monroe County: Averages and Countywide Employment
Impact
Countywide Impact
University County
Employer Ranking
(2014)Employee
Count
Labor Force (2013)
% of Labor Force
Employed (2014)
% of Employed
East Stroudsburg Monroe 11 854 80,185 1.07% 74,400 1.15%
2 Population demographics obtained from StatsAmerica provided by the Indiana Business Research Center Pennsylvania’s Department of Labor and Industry Center for Workforce Information and Analysis. 3 The in-county employee count includes students who are employed by the university.
Appendix C Page 59

The geographic distribution of East Stroudsburg University’s employees is shown on Map 5.3.4
339 employees, or 32 percent, live within 10 miles of the university, 368 employees, which
constitutes 35 percent of the total employees, live within 25 miles, leaving 33 percent of
employees living beyond 25 miles from the university. Refer to Appendix E for the
methodology regarding the composition of this map.
Map 5.3: East Stroudsburg University’s Distribution of Employees
Economic Impact
The direct and indirect economic impact of each university was calculated in order to arrive at
the total economic impact that each has on the Commonwealth overall. Exhibit 5.1 provides a
general overview of East Stroudsburg University, as well as the direct and indirect economic and
employment impacts of the university on the Commonwealth.
A variety of data sources were used in order to calculate and analyze the spending of each
institution and its employees, students, and visitors. Please refer to Appendix E for additional
4 For the purpose of this illustration, student employees were excluded.
Appendix C Page 60

detail regarding the data sources utilized for this study. After collecting the necessary data,
multipliers were utilized to achieve the total economic impact and employment impact of East
Stroudsburg University. The multipliers were obtained through the Bureau of Economic
Analysis Regional Industrial Multiplier Systems (“RIMS II”). As a whole, it is noted that East
Stroudsburg University has an important role in the Commonwealth in terms of the higher
educational opportunities it provides to residents of the Commonwealth as well as the direct,
indirect, and induced economic benefits the university provides to the Commonwealth.
The total direct economic impact of East Stroudsburg University on the Commonwealth was
$182,748,242. This value is represented by four main spending sources: institutional spending,
faculty/staff spending, student spending, and capital expenditures. Note that the institutional
spending includes employment benefits spent primarily in the Commonwealth of Pennsylvania.
East Stroudsburg University’s Direct Economic Impact on the Commonwealth
(1) Institutional spending: $44,154,348
Benefits: $21,933,252
(2) Faculty/Staff spending: $44,487,540
(3) Student spending: $60,933,589
(4) Capital Expenditures $11,239,513
Total Direct Impact: $182,748,242
As presented in Table 5.2, the direct impact, $182,748,242, was multiplied by the applicable
state multipliers obtained from the RIMS II data, resulting in a total economic impact of East
Stroudsburg University on the Commonwealth of $309,868,504. By taking the difference
between the total and direct economic impacts, the combined indirect and induced impact is
calculated to be $127,120,262. Please refer to Appendix E for an additional discussion related
to the use of multipliers and the methodology employed to derive the direct and indirect
economic benefits.
Appendix C Page 61
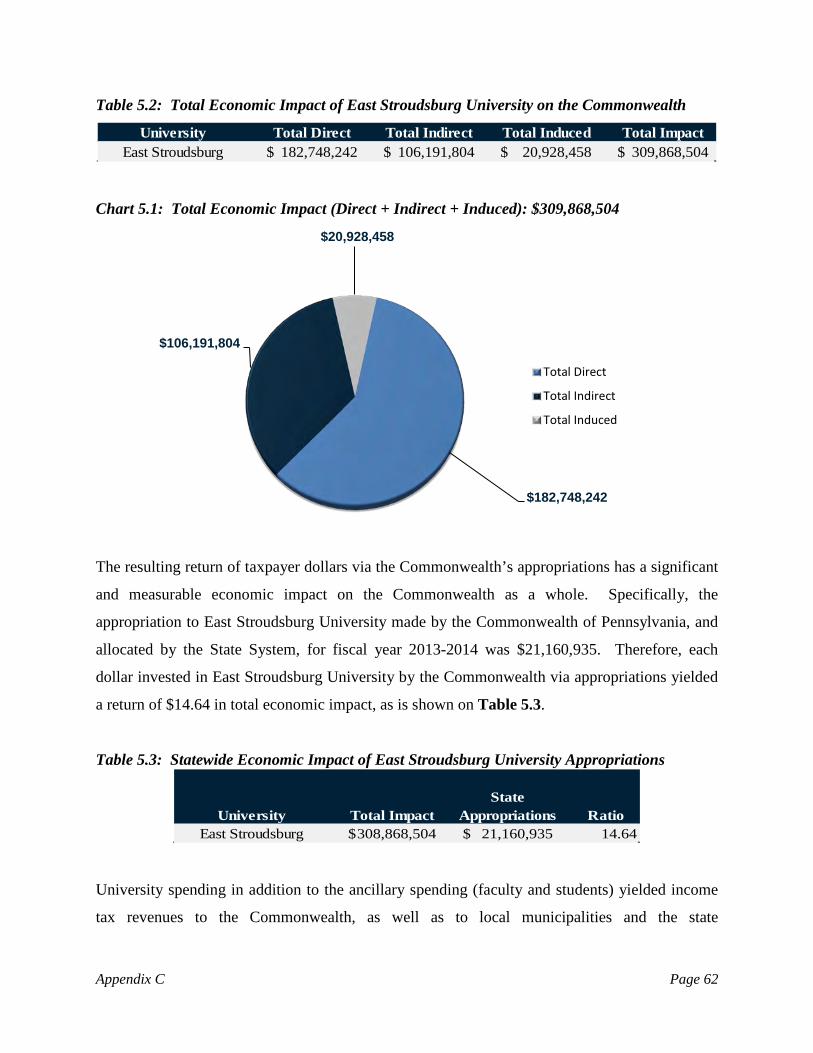
Table 5.2: Total Economic Impact of East Stroudsburg University on the Commonwealth
University Total Direct Total Indirect Total Induced Total ImpactEast Stroudsburg 182,748,242$ 106,191,804$ 20,928,458$ 309,868,504$
Chart 5.1: Total Economic Impact (Direct + Indirect + Induced): $309,868,504
The resulting return of taxpayer dollars via the Commonwealth’s appropriations has a significant
and measurable economic impact on the Commonwealth as a whole. Specifically, the
appropriation to East Stroudsburg University made by the Commonwealth of Pennsylvania, and
allocated by the State System, for fiscal year 2013-2014 was $21,160,935. Therefore, each
dollar invested in East Stroudsburg University by the Commonwealth via appropriations yielded
a return of $14.64 in total economic impact, as is shown on Table 5.3.
Table 5.3: Statewide Economic Impact of East Stroudsburg University Appropriations
University Total ImpactState
Appropriations RatioEast Stroudsburg 308,868,504$ 21,160,935$ 14.64
University spending in addition to the ancillary spending (faculty and students) yielded income
tax revenues to the Commonwealth, as well as to local municipalities and the state
$182,748,242
$106,191,804
$20,928,458
Total Direct
Total Indirect
Total Induced
Appendix C Page 62
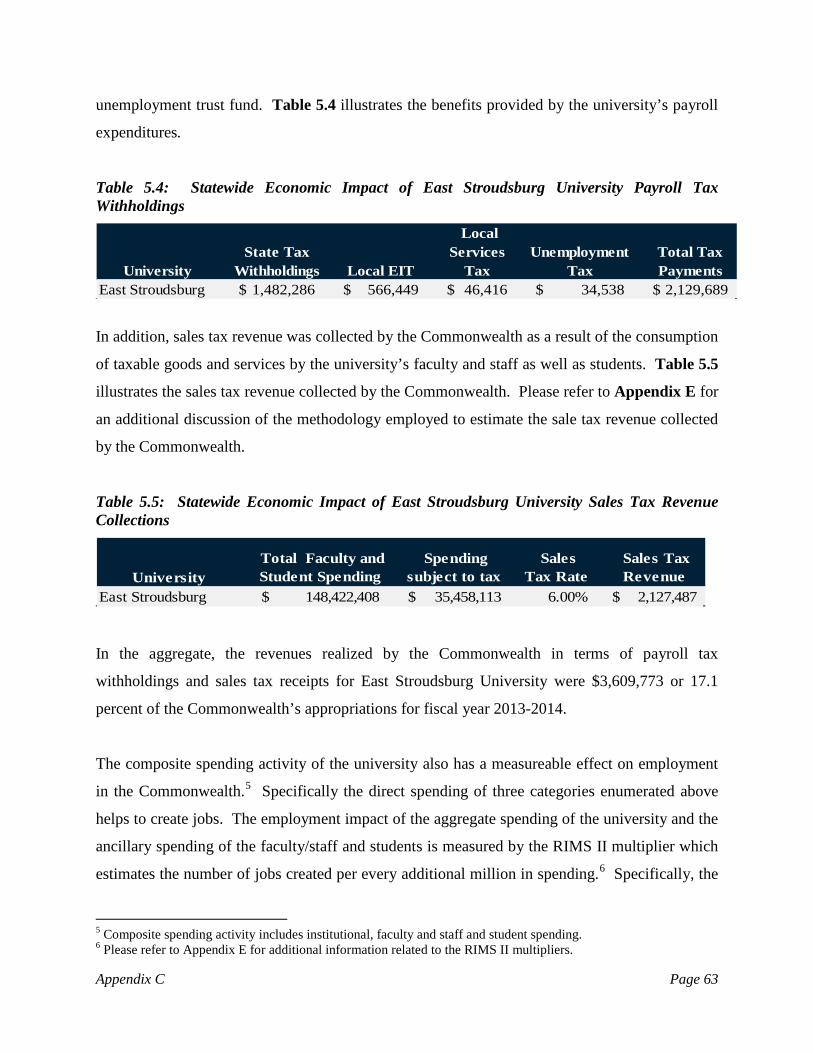
unemployment trust fund. Table 5.4 illustrates the benefits provided by the university’s payroll
expenditures.
Table 5.4: Statewide Economic Impact of East Stroudsburg University Payroll Tax Withholdings
UniversityState Tax
Withholdings Local EIT
Local Services
TaxUnemployment
TaxTotal Tax Payments
East Stroudsburg 1,482,286$ 566,449$ 46,416$ 34,538$ 2,129,689$
In addition, sales tax revenue was collected by the Commonwealth as a result of the consumption
of taxable goods and services by the university’s faculty and staff as well as students. Table 5.5
illustrates the sales tax revenue collected by the Commonwealth. Please refer to Appendix E for
an additional discussion of the methodology employed to estimate the sale tax revenue collected
by the Commonwealth.
Table 5.5: Statewide Economic Impact of East Stroudsburg University Sales Tax Revenue Collections
University Total Faculty and Student Spending
Spending subject to tax
Sales Tax Rate
Sales Tax Revenue
East Stroudsburg 148,422,408$ 35,458,113$ 6.00% 2,127,487$
In the aggregate, the revenues realized by the Commonwealth in terms of payroll tax
withholdings and sales tax receipts for East Stroudsburg University were $3,609,773 or 17.1
percent of the Commonwealth’s appropriations for fiscal year 2013-2014.
The composite spending activity of the university also has a measureable effect on employment
in the Commonwealth.5 Specifically the direct spending of three categories enumerated above
helps to create jobs. The employment impact of the aggregate spending of the university and the
ancillary spending of the faculty/staff and students is measured by the RIMS II multiplier which
estimates the number of jobs created per every additional million in spending.6 Specifically, the
5 Composite spending activity includes institutional, faculty and staff and student spending. 6 Please refer to Appendix E for additional information related to the RIMS II multipliers.
Appendix C Page 63
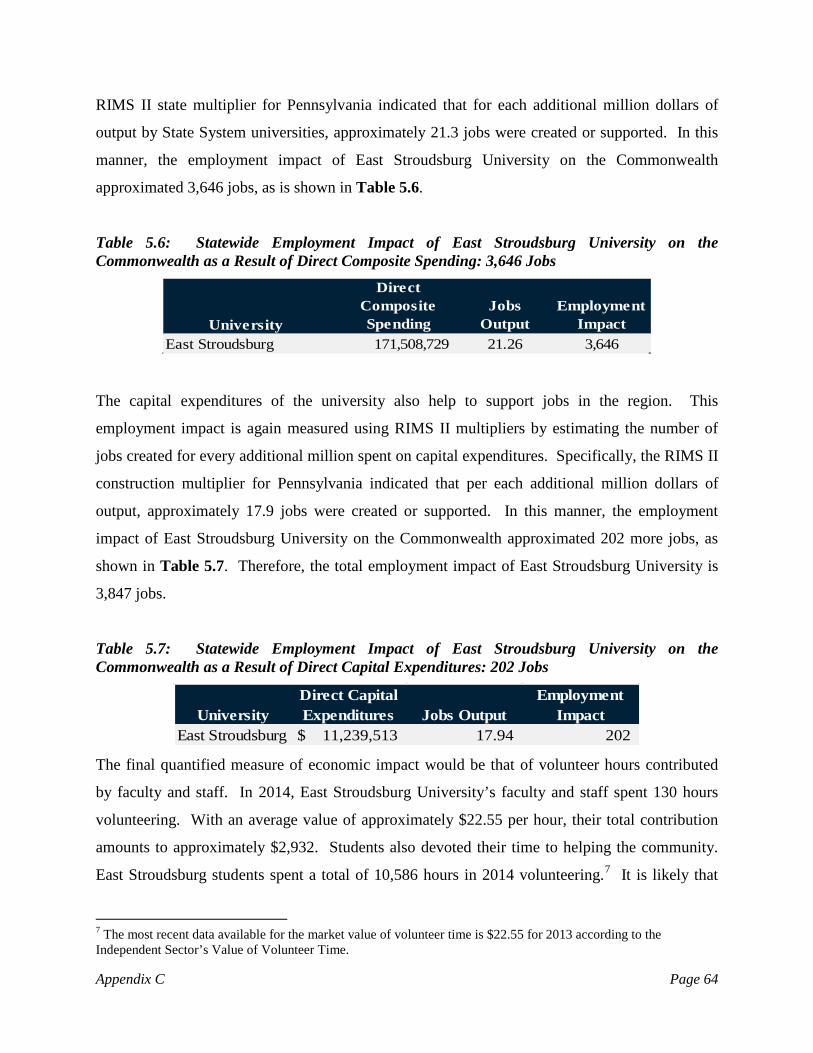
RIMS II state multiplier for Pennsylvania indicated that for each additional million dollars of
output by State System universities, approximately 21.3 jobs were created or supported. In this
manner, the employment impact of East Stroudsburg University on the Commonwealth
approximated 3,646 jobs, as is shown in Table 5.6.
Table 5.6: Statewide Employment Impact of East Stroudsburg University on the Commonwealth as a Result of Direct Composite Spending: 3,646 Jobs
University
Direct Composite Spending
Jobs Output
Employment Impact
East Stroudsburg 171,508,729 21.26 3,646
The capital expenditures of the university also help to support jobs in the region. This
employment impact is again measured using RIMS II multipliers by estimating the number of
jobs created for every additional million spent on capital expenditures. Specifically, the RIMS II
construction multiplier for Pennsylvania indicated that per each additional million dollars of
output, approximately 17.9 jobs were created or supported. In this manner, the employment
impact of East Stroudsburg University on the Commonwealth approximated 202 more jobs, as
shown in Table 5.7. Therefore, the total employment impact of East Stroudsburg University is
3,847 jobs.
Table 5.7: Statewide Employment Impact of East Stroudsburg University on the Commonwealth as a Result of Direct Capital Expenditures: 202 Jobs
UniversityDirect Capital Expenditures Jobs Output
Employment Impact
East Stroudsburg $ 11,239,513 17.94 202
The final quantified measure of economic impact would be that of volunteer hours contributed
by faculty and staff. In 2014, East Stroudsburg University’s faculty and staff spent 130 hours
volunteering. With an average value of approximately $22.55 per hour, their total contribution
amounts to approximately $2,932. Students also devoted their time to helping the community.
East Stroudsburg students spent a total of 10,586 hours in 2014 volunteering.7 It is likely that
7 The most recent data available for the market value of volunteer time is $22.55 for 2013 according to the Independent Sector’s Value of Volunteer Time.
Appendix C Page 64
the students’ participation was required by university curricular and co-curricular programs,
some of which either required supervision or a faculty team leader.
Economic Development
Economic development involves improvements to the standard of living through the creation of
jobs and the support of innovation and new research in a community’s region, state, or nation.
The State System plays a role in enhancing the economic development of the regions in which
the individual universities reside by assisting in the development and growth of new and existing
businesses, as well as increasing the employment opportunities, both of which increase economic
activity in the respective areas. The universities accomplish this in various ways, such as
partnering with local businesses, providing education and job skills training, providing an outlet
for research and development through incubators, and by providing financial and technical
assistance.
The goal of Pennsylvania’s State System of Higher Education and its 14 universities is
fundamentally to educate the citizens of the Commonwealth. By providing higher education, the
universities are not only helping to improve the economic development in the short-term, but in
the long-run as well. Therefore, by way of establishing and accomplishing its mission,
Pennsylvania’s State System is benefiting the economic advancement of the Commonwealth.
Primarily, the State System does this through the granting of undergraduate and graduate
degrees, but also does so indirectly through its purchasing, expenditures, services, and by
employing hundreds, even thousands, of people.
Overall, Pennsylvania’s State System of Higher Education is a key player in supporting the
economic development and growth of communities, counties, regions, and the Commonwealth
overall. By providing sources of innovation and entrepreneurial assistance, the State System
supplies economic growth to local businesses along with highly skilled and educated candidate
employees. Through its various economic development activities, East Stroudsburg University
successfully provides an economic competitive advantage for the county and the Commonwealth
as a whole.
Appendix C Page 65
East Stroudsburg’s participation in WEDnetPA program has over 1,400 participants, 45
participating businesses, and had a total of $366,491 funds awarded in 2014. Additionally, East
Stroudsburg has a business incubator and holds workforce training sessions. The incubator
has 19 businesses and 25 employees in the facility. Furthermore, the incubator captures
the involvement of eight undergraduate students and nine East Stroudsburg University staff
members. The workforce training sessions are aimed at training industry personnel through
three workshops: training within the industry, balance scorecard, and technology boot camp.
During 2014, these three workshops had a total of 38 participants and paired up with 16
businesses in effort to improve workforce development.
Appendix C Page 66

Exhibit 5.1
Location: CountyFaculty and Staff Headcount Paid in 2014
Fall 2013 Fall 2014Undergraduate 6,186 6,204 Graduate 592 616Total 6,778 6,820
Full-time 5794 5,943 Part-time 984 877Total 6,778 6,820
PA residents 5,096 5,250 Non-residents 1,682 1,570 Total 6,778 6,820
Traditional undergraduate (students under 25) 5,652 5,631 Non-traditional undergraduate (students over 25) 534 573Total (undergraduate only) 6,186 6,204
Room & BoardTuitionFeesTotal
Room & Board TuitionFeesTotal
Tuition (15 credits)FeesTotal
Tuition (15 credits)FeesTotal
Tuition from undergraduate in-state studentsTuition from undergraduate out-of-state studentsTuition from graduate in-state studentsTuition from graduate out-of-state studentsTotal
East Stroudsburg University InformationMonroe1,056
Enrollment CharacteristicsEnrollment
Cost of AttendanceUndergraduate, In-State, FY 2014-2015
7,980$ 6,820 2,556
17,356$ Undergraduate, Out-of-State, FY 2014-2015
7,980$ 17,050 2,776
27,806$ Graduate, In-State, FY 2014-2015
6,810$ 931
7,741$ Graduate, Out-of-State, FY 2014-2015
10,215$ 931
11,146$ Financial Characteristics
Revenues, FY 2013-2014Tuition
30,001,668$ 24,195,262 3,777,930 1,995,608
59,970,468$
Appendix C Page 67

Technology, Academic/Instruction, and Other Mandatory Fees
Non-Mandatory FeesTotal
Total from Tuition, Fees, Room & Board
21,160,935$
FederalStateLocal/Other/PrivateSystem Transfer AwardsTotal grants and contracts
21,101,053$ Total Revenues (from sources above) 131,869,915$
2,869,061$ 16,835,716$
693,700,000$
Institutional ExpendituresInstitutional spending (excluding payroll) 43,648,066 Capital Improvements 506,282 Employee Benefits 21,933,252
Total Direct Institutional spending 66,087,600 Institutional spending prorated by 23.02% of out of state students 15,213,714 Type 1 Multiplier 1.53
Type 1 Effect (total indirect - induced) 23,330,231 Type 2 Multiplier 2.33
Type 2 Effect (total indirect) 35,478,382 Induced Effect (type 2 effect - type 1 effect) 12,148,151 Total Impact of Institutional Spending 113,714,133$
Faculty and Staff ExpendituresFaculty and staff spending (direct) 44,487,540$ Household multiplier 1.41 Total Impact of Faculty and Staff Spending 62,634,008$
Total Replacement Value of Physical Plant
1,698,997$
10,110,821$ 5,383,046
109,237 39,653
15,642,757$
Sales and Services
Education and General Appropriations
Grants and Contracts
Other Revenues (net of scholarship discounts and allowances)
Funds Raised by University (private giving)Market Value of Endowment
72,266,173$
FeesMandatory Fees
11,260,113$ Non-Mandatory Fees
1,035,592 12,295,705$
Financial Characteristics
The Institution as a Consumer in the State
Appendix C Page 68
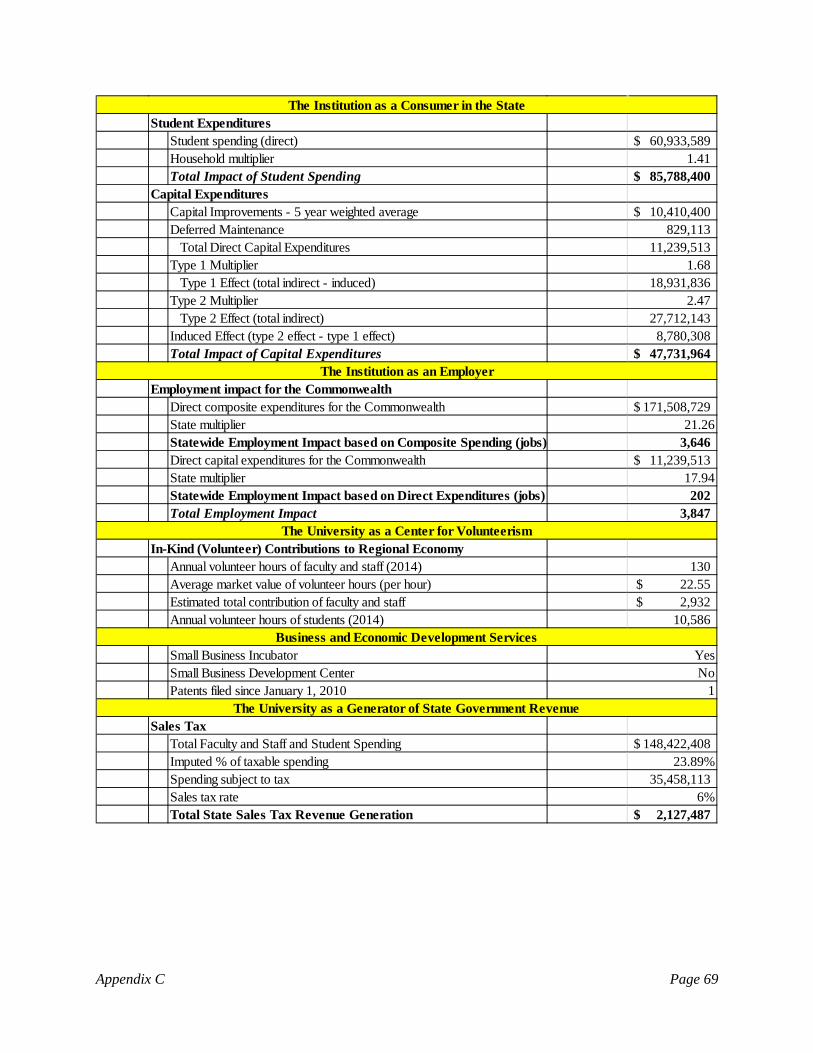
Student ExpendituresStudent spending (direct) 60,933,589$ Household multiplier 1.41 Total Impact of Student Spending 85,788,400$
Capital ExpendituresCapital Improvements - 5 year weighted average 10,410,400$ Deferred Maintenance 829,113
Total Direct Capital Expenditures 11,239,513 Type 1 Multiplier 1.68
Type 1 Effect (total indirect - induced) 18,931,836 Type 2 Multiplier 2.47
Type 2 Effect (total indirect) 27,712,143 Induced Effect (type 2 effect - type 1 effect) 8,780,308 Total Impact of Capital Expenditures 47,731,964$
Employment impact for the CommonwealthDirect composite expenditures for the Commonwealth 171,508,729$ State multiplier 21.26Statewide Employment Impact based on Composite Spending (jobs) 3,646 Direct capital expenditures for the Commonwealth 11,239,513$ State multiplier 17.94Statewide Employment Impact based on Direct Expenditures (jobs) 202Total Employment Impact 3,847
In-Kind (Volunteer) Contributions to Regional EconomyAnnual volunteer hours of faculty and staff (2014) 130 Average market value of volunteer hours (per hour) 22.55$ Estimated total contribution of faculty and staff 2,932$ Annual volunteer hours of students (2014) 10,586
Small Business IncubatorSmall Business Development CenterPatents filed since January 1, 2010
Sales TaxTotal Faculty and Staff and Student Spending 148,422,408$ Imputed % of taxable spending 23.89%Spending subject to tax 35,458,113 Sales tax rate 6%Total State Sales Tax Revenue Generation 2,127,487$
The Institution as a Consumer in the State
The Institution as an Employer
The University as a Center for Volunteerism
Business and Economic Development Services
The University as a Generator of State Government Revenue
YesNo
1
Appendix C Page 69
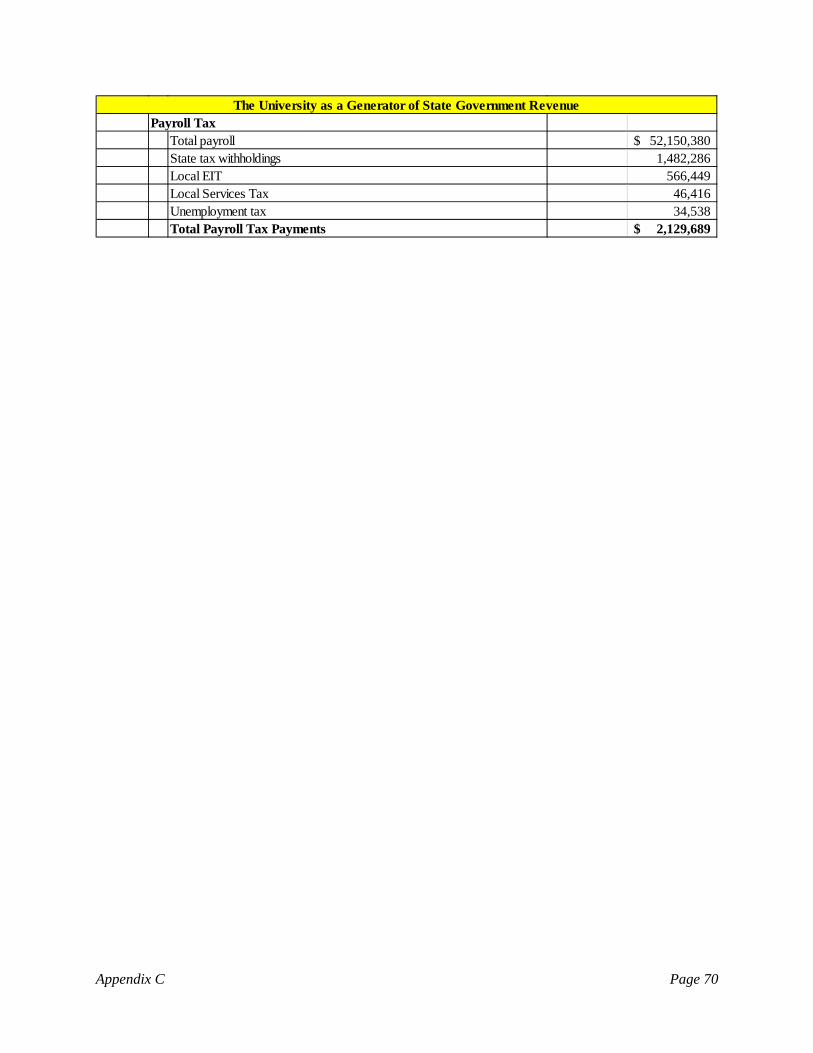
Payroll TaxTotal payroll 52,150,380$ State tax withholdings 1,482,286 Local EIT 566,449 Local Services Tax 46,416 Unemployment tax 34,538 Total Payroll Tax Payments 2,129,689$
The University as a Generator of State Government Revenue
Appendix C Page 70
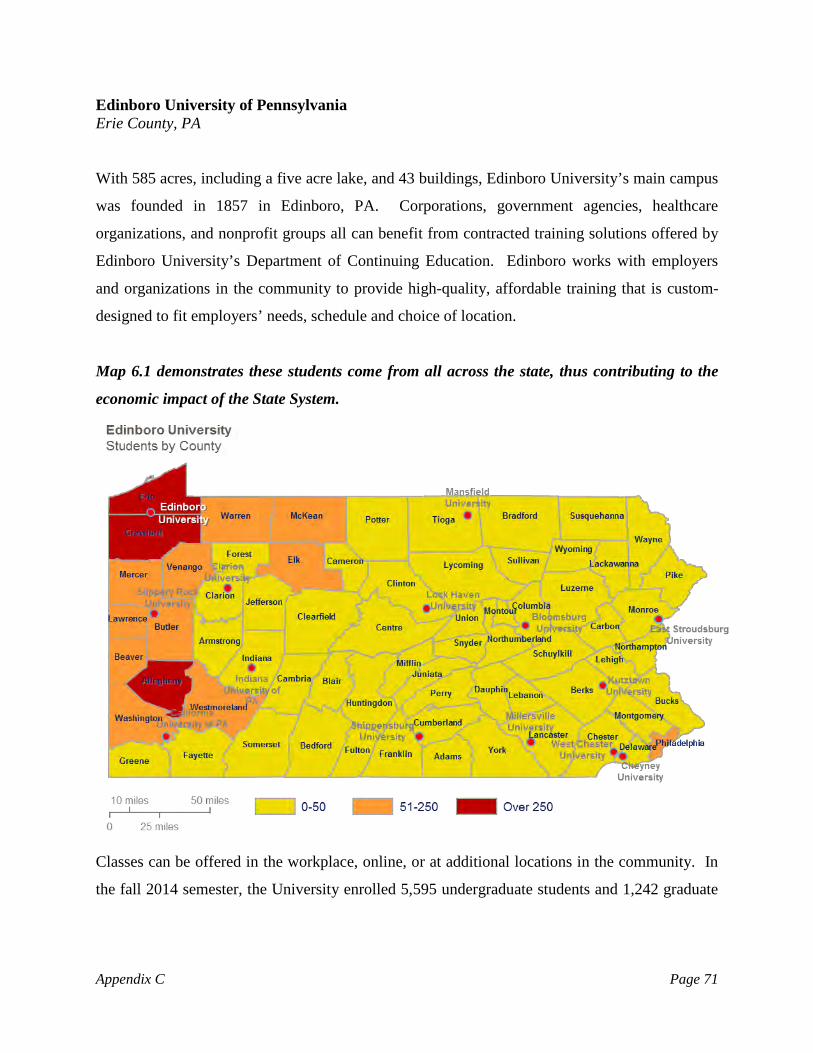
Edinboro University of Pennsylvania Erie County, PA
With 585 acres, including a five acre lake, and 43 buildings, Edinboro University’s main campus
was founded in 1857 in Edinboro, PA. Corporations, government agencies, healthcare
organizations, and nonprofit groups all can benefit from contracted training solutions offered by
Edinboro University’s Department of Continuing Education. Edinboro works with employers
and organizations in the community to provide high-quality, affordable training that is custom-
designed to fit employers’ needs, schedule and choice of location.
Map 6.1 demonstrates these students come from all across the state, thus contributing to the
economic impact of the State System.
Classes can be offered in the workplace, online, or at additional locations in the community. In
the fall 2014 semester, the University enrolled 5,595 undergraduate students and 1,242 graduate
Appendix C Page 71

students. Edinboro University is currently under the leadership of the first woman President, Dr.
Julie E. Wollman.1
Map 6.2 demonstrates Edinboro University’s alumni that still reside in the Commonwealth.
Erie County, where Edinboro University is located, has 799.2 sq. miles in land area and a
population density of 350.7 per square mile. The average household size is 2.4 persons
compared to an average family size of three persons. As of the most recent census in 2010,
approximately 98 percent of the population reported only one race, with 7.2 percent of these
reporting African-American. Since the last census, the population of Erie County has decreased
by 0.1 percent, to 280,294. The population of this county is 3.4 percent Hispanic (of any race).
In 2013 the labor force was 139,619 people and the unemployment rate was 7.3 percent. Also, in
2013 health care and social assistance was the largest of 20 major sectors.
1 Excerpts obtained from Edinboro University’s website, www.edinboro.edu.
Appendix C Page 72

Below are some of Erie County’s population demographics.2
People & Income Overview (By Place of Residence) Value
Rank in
State Population (2013) 280,294 14Growth ( percent) since 2010 Census -0.1% 27
Households (2013) 109,675 14Labor Force (persons) (2013) 139,619 14Unemployment Rate (2013) 7.3 38Per Capita Personal Income (2013) $37,729 34Median Household Income (2013) $44,223 44Poverty Rate (2013) 17.9 7
H.S. Diploma or More - percent of Adults 25+ (2013 ACS 5yr) 89.9 15
Bachelor Deg. or More - percent of Adults 25+ (2013 ACS 5yr) 24.8 16
Countywide labor force data and countywide employment impact as a result of Edinboro
University in Erie County is shown in Table 6.1. Out of the 139,619 people in the available
labor force, Edinboro University employed 795 in-county jobs and therefore, had an in-county
percentage employment impact on the available labor force of approximately 0.6 percent.
Furthermore, the countywide employment impact as a percent of the number of people employed
in Erie County can also be calculated. Of the 130,500 total people employed in Erie County, 795
were employed by Edinboro University and live in-county; therefore the university’s countywide
employment impact is 0.6 percent.3
Table 6.1: Labor Force Data, Erie County: Averages and Countywide Employment Impact
Countywide Impact
University County
Employer Ranking (2014)
Employee Count
Labor Force (2013)
% of Labor Force
Employed (2014)
% of Employed
Edinboro Erie 22 795 139,619 0.57% 130,500 0.61%
The geographic distribution of Edinboro University’s employees is shown on Map 6.3.4 372
employees, or 42 percent, live within 10 miles of the university, 329 employees, which
constitutes 37 percent of the total employees, live within 25 miles, leaving 21 percent of
2 Population demographics obtained from StatsAmerica provided by the Indiana Business Research Center Pennsylvania’s Department of Labor and Industry Center for Workforce Information and Analysis. 3 The in-county employee count includes students who are employed by the university. 4 For the purpose of this illustration, student employees were excluded.
Appendix C Page 73

employees living beyond 25 miles from the university. Refer to Appendix E for the
methodology regarding the composition of this map.
Map 6.3: Edinboro University’s Distribution of Employees
Economic Impact
The direct and indirect economic impact of each university was calculated in order to arrive at
the total economic impact that each has on the Commonwealth overall. Exhibit 6.1 provides a
general overview of Edinboro University, as well as the direct and indirect economic and
employment impacts of the university on the Commonwealth.
A variety of data sources were used in order to calculate and analyze the spending of each
institution and its employees, students, and visitors. Please refer to Appendix E for additional
detail regarding the data sources utilized for this study. After collecting the necessary data,
multipliers were utilized to achieve the total economic impact and employment impact of
Edinboro University. The multipliers were obtained through the Bureau of Economic Analysis
Appendix C Page 74

Regional Industrial Multiplier Systems (“RIMS II”). As a whole, it is noted that Edinboro
University has an important role in the Commonwealth in terms of the higher educational
opportunities it provides to residents of the Commonwealth as well as the direct, indirect, and
induced economic benefits the university provides to the Commonwealth.
The total direct economic impact of Edinboro University on the Commonwealth was
$141,889,684. This value is represented by four main spending sources: institutional spending,
faculty/staff spending, student spending, and capital expenditures. Note that the institutional
spending includes employment benefits spent primarily in the Commonwealth of Pennsylvania.
Edinboro University’s Direct Economic Impact on the Commonwealth
(1) Institutional spending: $34,841,996
Benefits: $24,971,245
(2) Faculty/Staff spending: $43,084,313
(3) Student spending: $35,183,940
(4) Capital Expenditures: $3,808,190
Total Direct Impact: $141,889,684
As presented in Table 6.2, the direct impact, $141,889,684, was multiplied by the applicable
state multipliers obtained from the RIMS II data, resulting in a total economic impact of
Edinboro University on the Commonwealth of $212,827,350. By taking the difference between
the total and direct economic impacts, the combined indirect and induced impact is calculated to
be $70,937,665. Please refer to Appendix E for an additional discussion related to the use of
multipliers and the methodology employed to derive the direct and indirect economic benefits.
Table 6.2: Total Economic Impact of Edinboro University on the Commonwealth
University Total Direct Total Indirect Total Induced Total ImpactEdinboro 141,889,684$ 61,165,672$ 9,771,993$ 212,827,350$
Appendix C Page 75

Chart 6.1: Total Economic Impact (Direct + Indirect + Induced): $212,827,350
The resulting return of taxpayer dollars via the Commonwealth’s appropriations has a significant
and measurable economic impact on the Commonwealth as a whole. Specifically, the
appropriation to Edinboro University made by the Commonwealth of Pennsylvania, and
allocated by the State System, for fiscal year 2013-2014 was $24,963,085. Therefore, each
dollar invested in Edinboro University by the Commonwealth via appropriations yielded a return
of $8.53 in total economic impact, as is shown on Table 6.3.
Table 6.3: State Economic Impact of Edinboro University Appropriations
University Total ImpactState
Appropriations RatioEdinboro 212,827,350$ 24,963,085$ 8.53
University spending in addition to the ancillary spending (faculty and students) yielded income
tax revenues to the Commonwealth, as well as to local municipalities and the state
unemployment trust fund. Table 6.4 illustrates the benefits provided by the university’s payroll
expenditures.
$141,889,684
$62,736,132
$9,771,993
Total Direct
Total Indirect
Total Induced
Appendix C Page 76
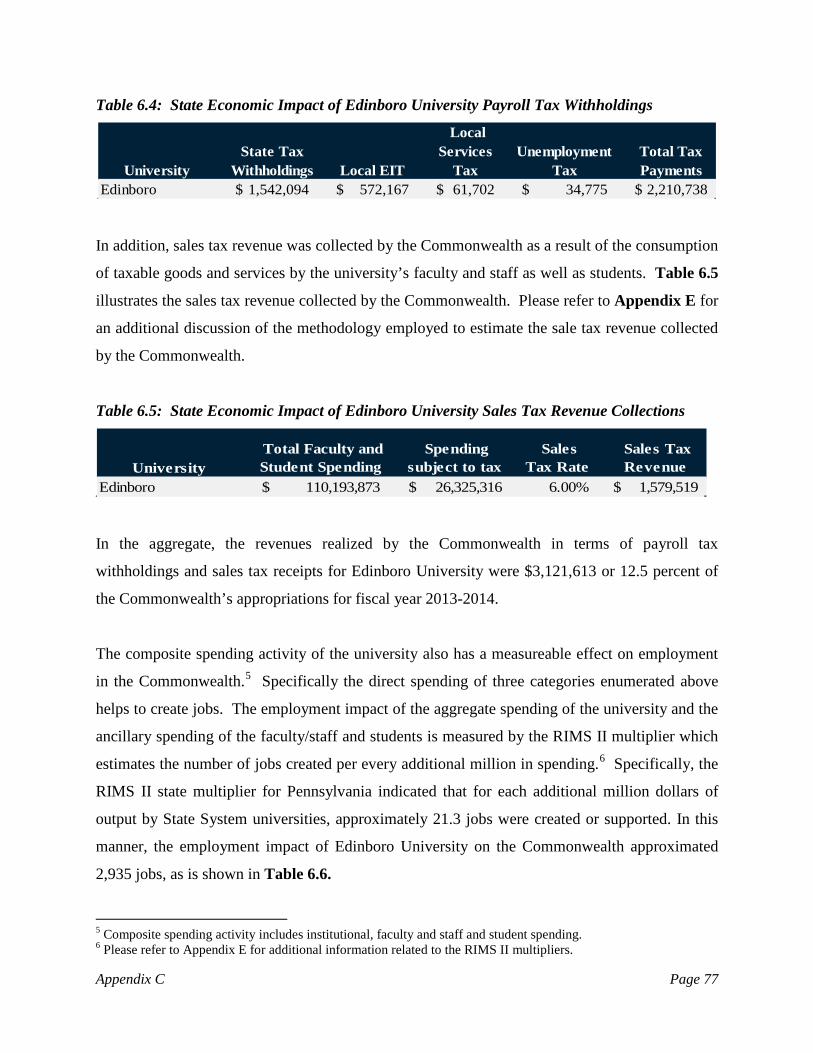
Table 6.4: State Economic Impact of Edinboro University Payroll Tax Withholdings
UniversityState Tax
Withholdings Local EIT
Local Services
TaxUnemployment
TaxTotal Tax Payments
Edinboro 1,542,094$ 572,167$ 61,702$ 34,775$ 2,210,738$
In addition, sales tax revenue was collected by the Commonwealth as a result of the consumption
of taxable goods and services by the university’s faculty and staff as well as students. Table 6.5
illustrates the sales tax revenue collected by the Commonwealth. Please refer to Appendix E for
an additional discussion of the methodology employed to estimate the sale tax revenue collected
by the Commonwealth.
Table 6.5: State Economic Impact of Edinboro University Sales Tax Revenue Collections
University Total Faculty and Student Spending
Spending subject to tax
Sales Tax Rate
Sales Tax Revenue
Edinboro 110,193,873$ 26,325,316$ 6.00% 1,579,519$
In the aggregate, the revenues realized by the Commonwealth in terms of payroll tax
withholdings and sales tax receipts for Edinboro University were $3,121,613 or 12.5 percent of
the Commonwealth’s appropriations for fiscal year 2013-2014.
The composite spending activity of the university also has a measureable effect on employment
in the Commonwealth.5 Specifically the direct spending of three categories enumerated above
helps to create jobs. The employment impact of the aggregate spending of the university and the
ancillary spending of the faculty/staff and students is measured by the RIMS II multiplier which
estimates the number of jobs created per every additional million in spending.6 Specifically, the
RIMS II state multiplier for Pennsylvania indicated that for each additional million dollars of
output by State System universities, approximately 21.3 jobs were created or supported. In this
manner, the employment impact of Edinboro University on the Commonwealth approximated
2,935 jobs, as is shown in Table 6.6.
5 Composite spending activity includes institutional, faculty and staff and student spending. 6 Please refer to Appendix E for additional information related to the RIMS II multipliers.
Appendix C Page 77

Table 6.6: Statewide Employment Impact of Edinboro University on the Commonwealth as a Result of Direct Composite Spending: 2,935 Jobs
University
Direct Composite Spending
Jobs Output
Employment Impact
Edinboro 138,081,494 21.26 2,935
The capital expenditures of the university also help to support jobs in the region. This
employment impact is again measured using RIMS II multipliers by estimating the number of
jobs created for every additional million spent on capital expenditures. Specifically, the RIMS II
construction multiplier for Pennsylvania indicated that per each additional million dollars of
output, approximately 17.9 jobs were created or supported. In this manner, the employment
impact of Edinboro University on the Commonwealth approximated 68 more jobs, as shown in
Table 6.7. Therefore, the total employment impact of Edinboro University is 3,003 jobs.
Table 6.7: Statewide Employment Impact of Edinboro University on the Commonwealth as a Result of Direct Capital Expenditures: 68 Jobs
UniversityDirect Capital Expenditures Jobs Output
Employment Impact
Edinboro $ 3,808,190 17.94 68
The final quantified measure of economic impact would be that of volunteer hours contributed
by faculty and staff. Edinboro University’s faculty and staff spent 732 and 2,281 hours
volunteering in 2013 and 2014, respectively. With an average value of approximately $22.55 per
hour, their total contribution amounts to approximately $67,943. Students also devoted their
time to helping the community. Edinboro students spent a total of 27,200 and 26,665 hours in
2013 and 2014 volunteering.7 It is likely that the students’ participation was required by
university curricular and co-curricular programs, some of which either required supervision or a
faculty team leader.
7 The most recent data available for the market value of volunteer time is $22.55 for 2013 according to the Independent Sector’s Value of Volunteer Time.
Appendix C Page 78

Economic Development
Economic development involves improvements to the standard of living through the creation of
jobs and the support of innovation and new research in a community’s region, state, or nation.
The State System plays a role in enhancing the economic development of the regions in which
the individual universities reside by assisting in the development and growth of new and existing
businesses, as well as increasing the employment opportunities, both of which increase economic
activity in the respective areas. The universities accomplish this in various ways, such as
partnering with local businesses, providing education and job skills training, providing an outlet
for research and development through incubators, and by providing financial and technical
assistance.
The goal of Pennsylvania’s State System of Higher Education and its 14 universities is
fundamentally to educate the citizens of the Commonwealth. By providing higher education, the
universities are not only helping to improve the economic development in the short-term, but in
the long-run as well. Therefore, by way of establishing and accomplishing its mission,
Pennsylvania’s State System is benefiting the economic advancement of the Commonwealth.
Primarily, the State System does this through the granting of undergraduate and graduate
degrees, but also does so indirectly through its purchasing, expenditures, services, and by
employing hundreds, even thousands, of people.
Overall, Pennsylvania’s State System of Higher Education is a key player in supporting the
economic development and growth of communities, counties, regions, and the Commonwealth
overall. By providing sources of innovation and entrepreneurial assistance, the State System
supplies economic growth to local businesses along with highly skilled and educated candidate
employees. Through its various economic development activities, Edinboro University
successfully provides an economic competitive advantage for county and the Commonwealth as
a whole.
Edinboro University’s participation in WEDnetPA program had over 450 participants and had a
total of $206,776 funds awarded in 2014. Additionally, Edinboro University’s Tax Assistance
Center spent 5,168 hours counseling individuals during 2014. Edinboro also has an
Appendix C Page 79

Entrepreneurial Learning Center that provides mini-grants for students for a paid 1-year
membership to their Startup Incubator program. Through these efforts, Edinboro University is
contributing to Erie County’s overall economic development.
Appendix C Page 80

Exhibit 6.1
Location: CountyFaculty and Staff Headcount Paid in 2014
Fall 2013 Fall 2014Undergraduate 5,864 5,595 Graduate 1,234 1,242 Total 7,098 6,837
Full-time 5,770 5,604 Part-time 1,328 1,233 Total 7,098 6,837
PA residents 6,097 5,864 Non-residents 1,001 973 Total 7,098 6,837
Traditional undergraduate (students under 25) 5,084 4,864 Non-traditional undergraduate (students over 25) 780 731 Total (undergraduate only) 5,864 5,595
Room & BoardTuitionFeesTotal
Room & BoardTuitionFeesTotal
Tuition (full-time) and feesTotal
Tuition (full-time) and feesTotal
Tuition from undergraduate in-state studentsTuition from undergraduate out-of-state studentsTuition from graduate in-state studentsTuition from graduate out-of-state studentsTotal
32,107,862$ 7,777,353 7,720,594 2,198,749
49,804,558$
16,848$ Financial Characteristics
Revenues, FY 2013-2014Tuition
3,019
10,644$ Graduate, Out-of-State, FY 2014-2015
16,848
21,861$ Graduate, In-State, FY 2014-2015
10,644
Edinboro University InformationErie889
Enrollment CharacteristicsEnrollment
Cost of AttendanceUndergraduate, In-State, FY 2014-2015
8,612$ 6,820 2,436
17,868$ Undergraduate, Out-of-State, FY 2014-2015
8,612$ 10,230
Appendix C Page 81
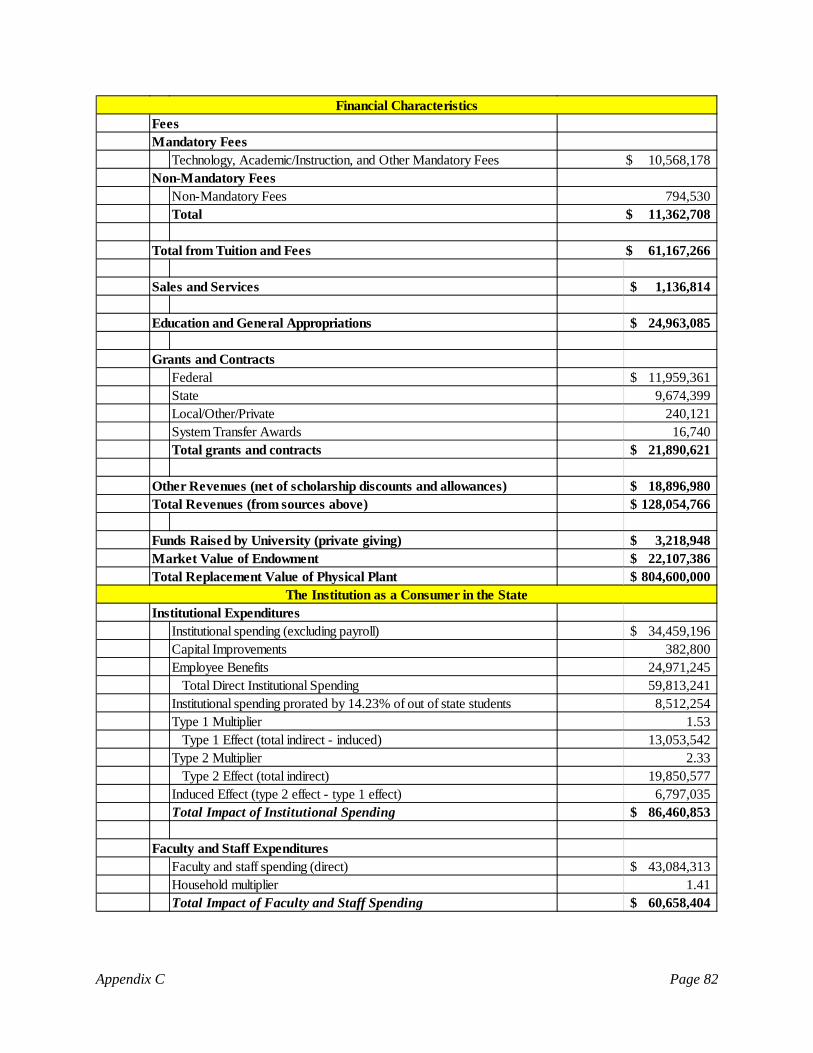
Technology, Academic/Instruction, and Other Mandatory Fees
Non-Mandatory FeesTotal
Total from Tuition and Fees
1,136,814$
24,963,085$
Federal 11,959,361$ State 9,674,399 Local/Other/Private 240,121 System Transfer Awards 16,740 Total grants and contracts 21,890,621$
18,896,980$ Total Revenues (from sources above) 128,054,766$
3,218,948$ 22,107,386$
804,600,000$
Institutional ExpendituresInstitutional spending (excluding payroll) 34,459,196$ Capital Improvements 382,800 Employee Benefits 24,971,245
Total Direct Institutional Spending 59,813,241 Institutional spending prorated by 14.23% of out of state students 8,512,254 Type 1 Multiplier 1.53
Type 1 Effect (total indirect - induced) 13,053,542 Type 2 Multiplier 2.33
Type 2 Effect (total indirect) 19,850,577 Induced Effect (type 2 effect - type 1 effect) 6,797,035 Total Impact of Institutional Spending 86,460,853$
Faculty and Staff ExpendituresFaculty and staff spending (direct) 43,084,313$ Household multiplier 1.41 Total Impact of Faculty and Staff Spending 60,658,404$
The Institution as a Consumer in the State
Financial CharacteristicsFeesMandatory Fees
10,568,178$ Non-Mandatory Fees
794,530 11,362,708$
61,167,266$
Total Replacement Value of Physical Plant
Sales and Services
Education and General Appropriations
Grants and Contracts
Other Revenues (net of scholarship discounts and allowances)
Funds Raised by University (private giving)Market Value of Endowment
Appendix C Page 82
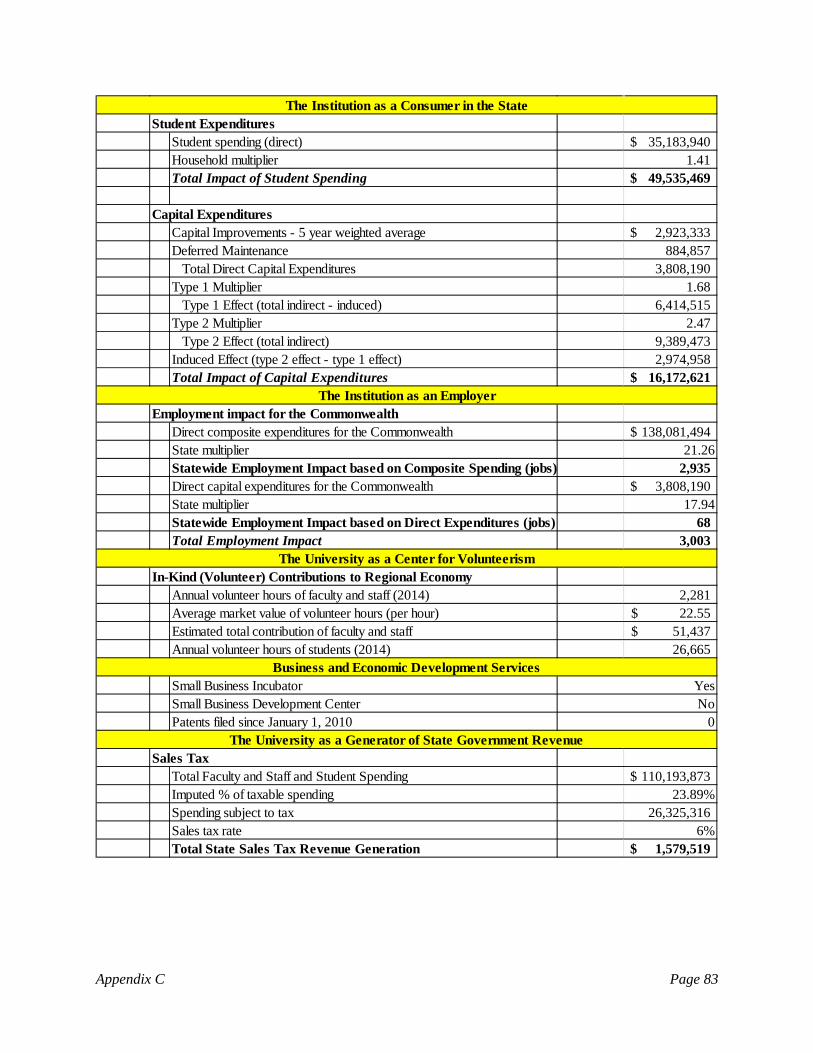
Student ExpendituresStudent spending (direct) 35,183,940$ Household multiplier 1.41 Total Impact of Student Spending 49,535,469$
Capital ExpendituresCapital Improvements - 5 year weighted average 2,923,333$ Deferred Maintenance 884,857
Total Direct Capital Expenditures 3,808,190 Type 1 Multiplier 1.68
Type 1 Effect (total indirect - induced) 6,414,515 Type 2 Multiplier 2.47
Type 2 Effect (total indirect) 9,389,473 Induced Effect (type 2 effect - type 1 effect) 2,974,958 Total Impact of Capital Expenditures 16,172,621$
Employment impact for the CommonwealthDirect composite expenditures for the Commonwealth 138,081,494$ State multiplier 21.26Statewide Employment Impact based on Composite Spending (jobs) 2,935 Direct capital expenditures for the Commonwealth 3,808,190$ State multiplier 17.94Statewide Employment Impact based on Direct Expenditures (jobs) 68 Total Employment Impact 3,003
In-Kind (Volunteer) Contributions to Regional EconomyAnnual volunteer hours of faculty and staff (2014) 2,281 Average market value of volunteer hours (per hour) 22.55$ Estimated total contribution of faculty and staff 51,437$ Annual volunteer hours of students (2014) 26,665
Small Business IncubatorSmall Business Development CenterPatents filed since January 1, 2010
Sales TaxTotal Faculty and Staff and Student Spending 110,193,873$ Imputed % of taxable spending 23.89%Spending subject to tax 26,325,316 Sales tax rate 6%Total State Sales Tax Revenue Generation 1,579,519$
The Institution as a Consumer in the State
The Institution as an Employer
The University as a Center for Volunteerism
Business and Economic Development Services
The University as a Generator of State Government Revenue
YesNo
0
Appendix C Page 83
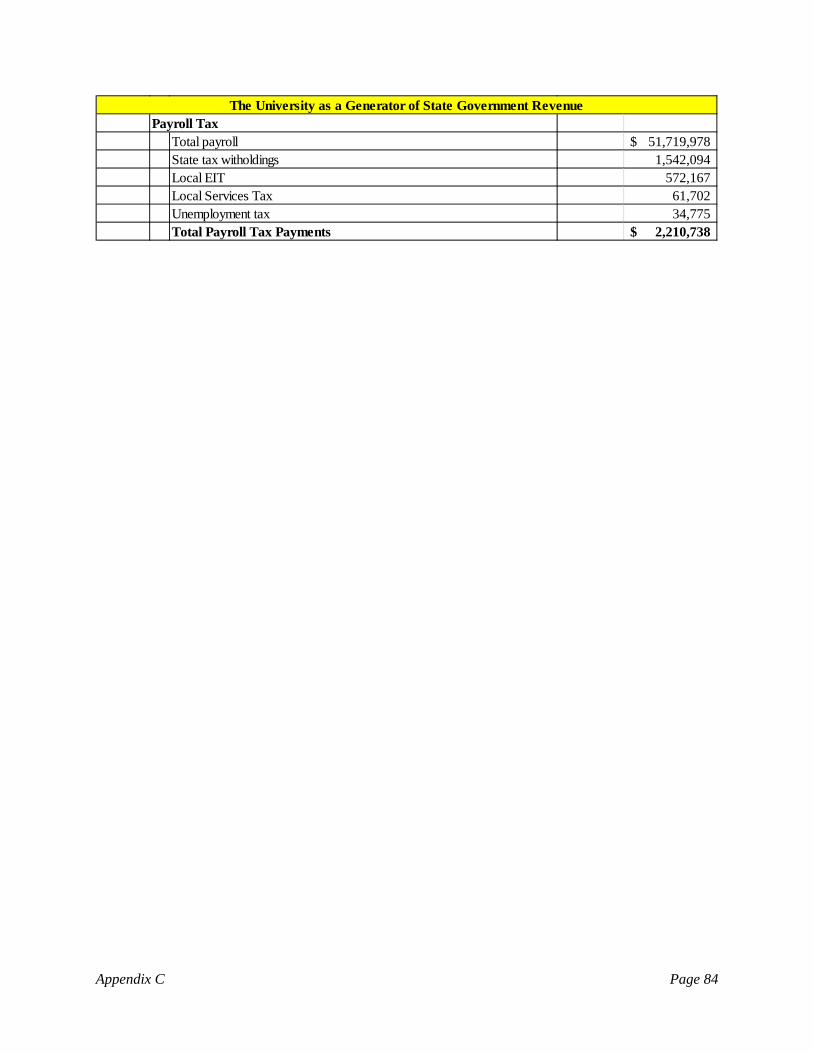
Payroll TaxTotal payroll 51,719,978$ State tax witholdings 1,542,094 Local EIT 572,167 Local Services Tax 61,702 Unemployment tax 34,775 Total Payroll Tax Payments 2,210,738$
The University as a Generator of State Government Revenue
Appendix C Page 84

Indiana University of Pennsylvania Indiana County, PA
Founded in 1875, Indiana University of Pennsylvania (“IUP”) is a vibrant, comprehensive,
research-based, teaching-focused, student-centered learning community. IUP’s main campus is
located in Indiana, Pa., and spans 374 acres. A combination of historical charm and state-of-the-
art facilities, it includes 59 major buildings and 11 athletic fields. Indiana University of
Pennsylvania has affiliate campuses which are located in Freeport and Punxsutawney, PA.
Additionally, nine master programs and one doctoral program are offered at IUP’s Monroeville
Graduate and Professional Center located near Monroeville. IUP also offers courses through the
State System’s Dixon Center in Harrisburg and through distance education. In fall 2014, the
University enrolled 12,130 undergraduate students and 2,239 graduate students. The student
body represented 44 states and 66 countries. Students at IUP enjoy an 18:1 student to faculty
ratio.
Map 7.1 demonstrates these students come from all across the state, thus contributing to the
economic impact of the State System.
Appendix C Page 85

As of 2012, Indiana University of Pennsylvania professors have won more than 60 Fulbright
scholarships since the program’s inception in 1946, the most of any university in the
Pennsylvania’s State System of Higher Education. IUP is known for having the number one
ROTC cadet program in the nation and also offers eight Varsity NCAA sports for men and 11 for
women. Alumni of IUP live in every state and in roughly 90 countries around the world. They
have included university presidents and state system chancellors, chief executives of leading
companies and industries, playwrights and authors, and luminaries of the sports world. President
Michael Driscoll took office on July 1, 2012, selected by the Board of Governors of the State
System.1
Map 7.2 demonstrates Indiana University of Pennsylvania’s alumni that still reside in the
Commonwealth.
IUP’s main campus is located in Indiana County of Pennsylvania. It has 827.0 sq. miles in land
area and a population density of 106.1 per square mile. The average household size is 2.40
1 Excerpts obtained from Indiana University of Pennsylvania’s website, www.iup.edu.
Appendix C Page 86
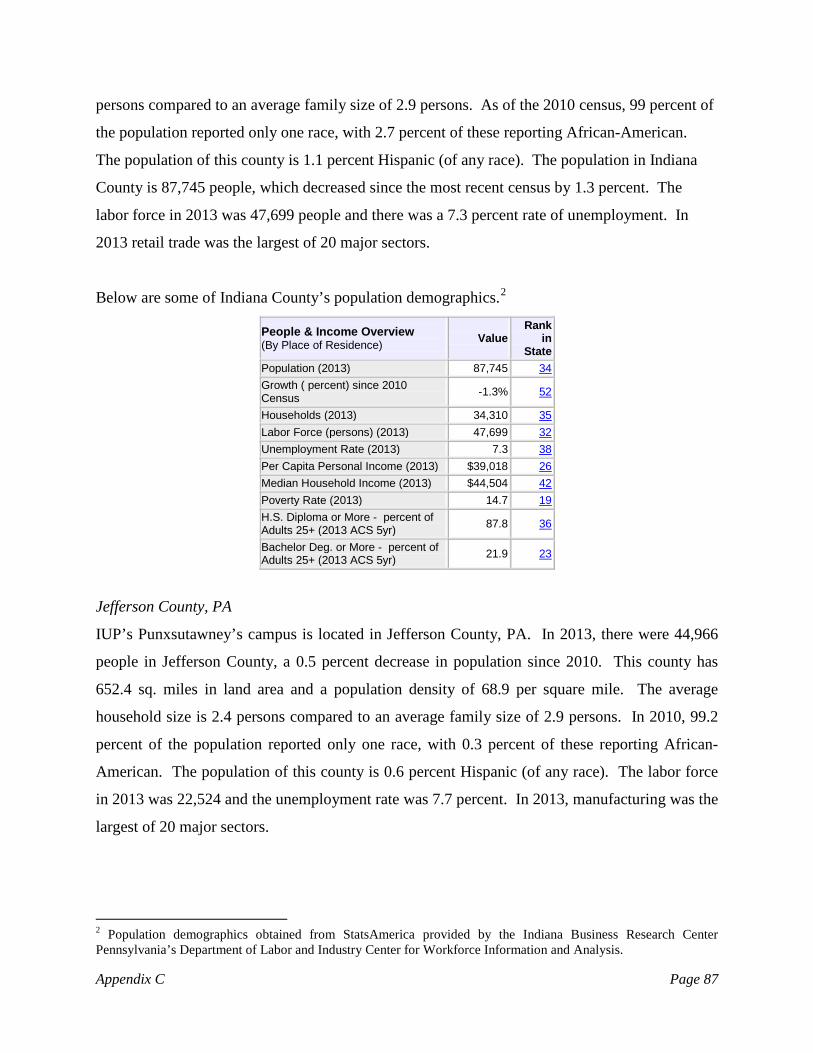
persons compared to an average family size of 2.9 persons. As of the 2010 census, 99 percent of
the population reported only one race, with 2.7 percent of these reporting African-American.
The population of this county is 1.1 percent Hispanic (of any race). The population in Indiana
County is 87,745 people, which decreased since the most recent census by 1.3 percent. The
labor force in 2013 was 47,699 people and there was a 7.3 percent rate of unemployment. In
2013 retail trade was the largest of 20 major sectors.
Below are some of Indiana County’s population demographics.2
People & Income Overview (By Place of Residence) Value
Rank in
State Population (2013) 87,745 34
Growth ( percent) since 2010 Census -1.3% 52
Households (2013) 34,310 35
Labor Force (persons) (2013) 47,699 32
Unemployment Rate (2013) 7.3 38
Per Capita Personal Income (2013) $39,018 26
Median Household Income (2013) $44,504 42
Poverty Rate (2013) 14.7 19
H.S. Diploma or More - percent of Adults 25+ (2013 ACS 5yr) 87.8 36
Bachelor Deg. or More - percent of Adults 25+ (2013 ACS 5yr) 21.9 23
Jefferson County, PA
IUP’s Punxsutawney’s campus is located in Jefferson County, PA. In 2013, there were 44,966
people in Jefferson County, a 0.5 percent decrease in population since 2010. This county has
652.4 sq. miles in land area and a population density of 68.9 per square mile. The average
household size is 2.4 persons compared to an average family size of 2.9 persons. In 2010, 99.2
percent of the population reported only one race, with 0.3 percent of these reporting African-
American. The population of this county is 0.6 percent Hispanic (of any race). The labor force
in 2013 was 22,524 and the unemployment rate was 7.7 percent. In 2013, manufacturing was the
largest of 20 major sectors.
2 Population demographics obtained from StatsAmerica provided by the Indiana Business Research Center Pennsylvania’s Department of Labor and Industry Center for Workforce Information and Analysis.
Appendix C Page 87
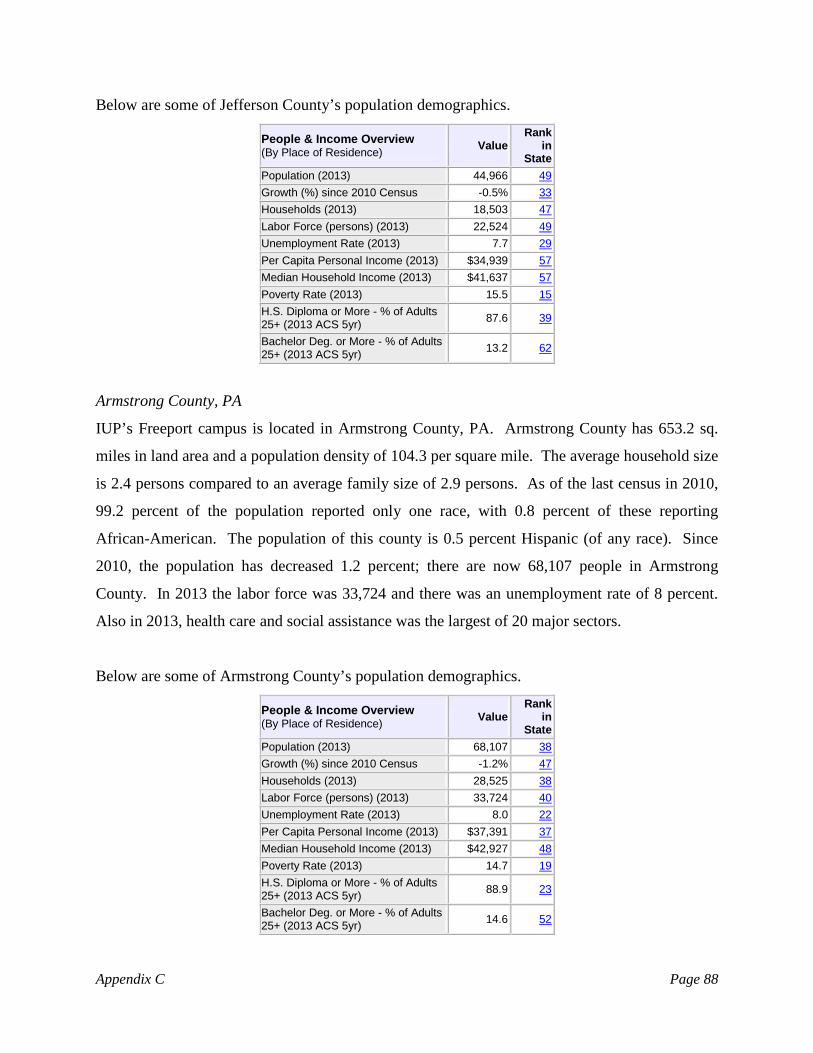
Below are some of Jefferson County’s population demographics.
People & Income Overview (By Place of Residence) Value
Rank in
State Population (2013) 44,966 49
Growth (%) since 2010 Census -0.5% 33
Households (2013) 18,503 47
Labor Force (persons) (2013) 22,524 49
Unemployment Rate (2013) 7.7 29
Per Capita Personal Income (2013) $34,939 57
Median Household Income (2013) $41,637 57
Poverty Rate (2013) 15.5 15
H.S. Diploma or More - % of Adults 25+ (2013 ACS 5yr) 87.6 39
Bachelor Deg. or More - % of Adults 25+ (2013 ACS 5yr) 13.2 62
Armstrong County, PA
IUP’s Freeport campus is located in Armstrong County, PA. Armstrong County has 653.2 sq.
miles in land area and a population density of 104.3 per square mile. The average household size
is 2.4 persons compared to an average family size of 2.9 persons. As of the last census in 2010,
99.2 percent of the population reported only one race, with 0.8 percent of these reporting
African-American. The population of this county is 0.5 percent Hispanic (of any race). Since
2010, the population has decreased 1.2 percent; there are now 68,107 people in Armstrong
County. In 2013 the labor force was 33,724 and there was an unemployment rate of 8 percent.
Also in 2013, health care and social assistance was the largest of 20 major sectors.
Below are some of Armstrong County’s population demographics.
People & Income Overview (By Place of Residence) Value
Rank in
State Population (2013) 68,107 38
Growth (%) since 2010 Census -1.2% 47
Households (2013) 28,525 38
Labor Force (persons) (2013) 33,724 40
Unemployment Rate (2013) 8.0 22
Per Capita Personal Income (2013) $37,391 37
Median Household Income (2013) $42,927 48
Poverty Rate (2013) 14.7 19
H.S. Diploma or More - % of Adults 25+ (2013 ACS 5yr) 88.9 23
Bachelor Deg. or More - % of Adults 25+ (2013 ACS 5yr) 14.6 52
Appendix C Page 88

Countywide labor force data and countywide employment impact as result of Indiana University
of Pennsylvania in Indiana County is shown in Table 7.1.3 Out of the 47,699 people in the
available labor force, Indiana University of Pennsylvania employed 1,914 in-county jobs and
therefore, had an in-county percentage employment impact on the available labor force of four
percent. Furthermore, the countywide employment impact as a percent of the number of people
employed in Indiana County can also be calculated. Of the 44,800 total people employed in
Indiana County, 1,914 were employed by IUP and live in-county; therefore the university’s
countywide employment impact is approximately 4.3 percent.4
Table 7.1: Labor Force Data, Indiana County: Averages and Countywide Employment Impact
Countywide Impact
University County
Employer Ranking (2014)
Employee Count
Labor Force (2013)
% of Labor Force
Employed (2014)
% of Employed
Indiana Indiana 1 1,914 47,699 4.01% 44,800 4.27%
The geographic distribution of Indiana University of Pennsylvania employees is shown on Map
7.3.5 1,037 employees, or 53 percent, live within 10 miles of the university, 324 employees,
which constitutes 17 percent of the total employees, live within 25 miles, leaving 30 percent of
employees living beyond 25 miles from the university. Refer to Appendix E for the
methodology regarding the composition of this map.
3 For the purpose of this analysis, the focus was the amount of in-county jobs at Indiana University’s main campus in Indiana County. It is noted that Indiana has two other campuses in Armstrong County and Jefferson County. 4 The in-county employee count includes students who are employed by the university. 5 For the purpose of this illustration, student employees were excluded.
Appendix C Page 89
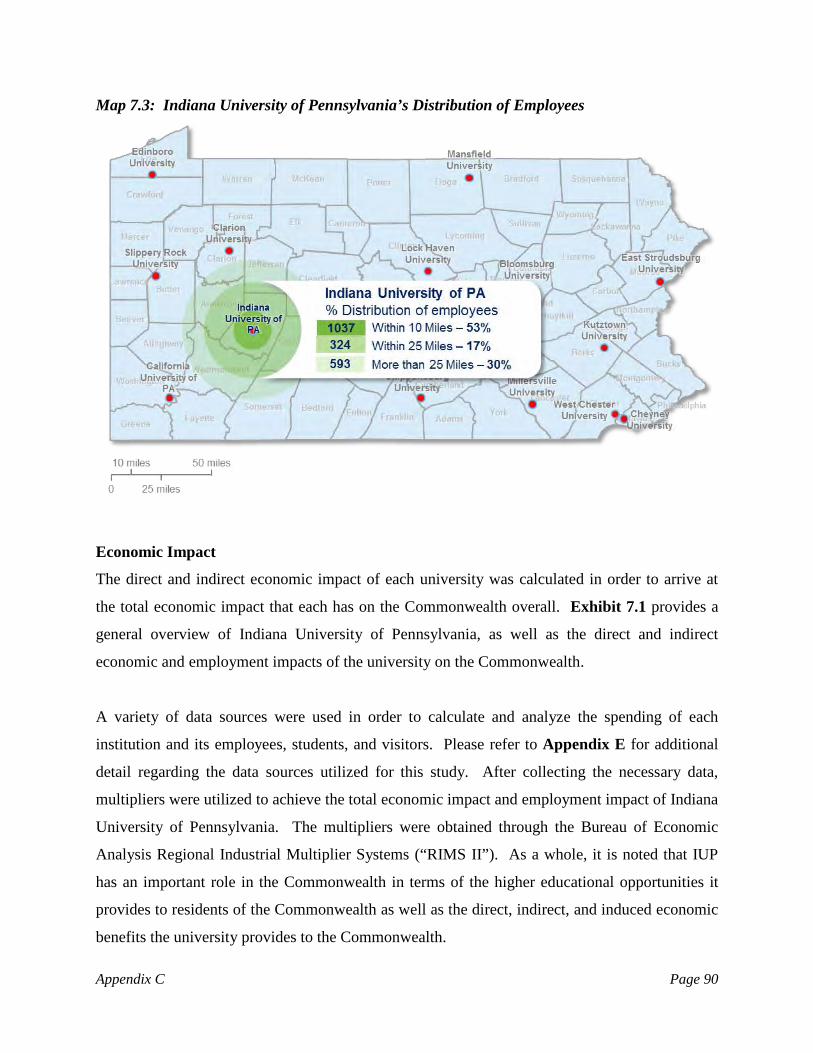
Map 7.3: Indiana University of Pennsylvania’s Distribution of Employees
Economic Impact
The direct and indirect economic impact of each university was calculated in order to arrive at
the total economic impact that each has on the Commonwealth overall. Exhibit 7.1 provides a
general overview of Indiana University of Pennsylvania, as well as the direct and indirect
economic and employment impacts of the university on the Commonwealth.
A variety of data sources were used in order to calculate and analyze the spending of each
institution and its employees, students, and visitors. Please refer to Appendix E for additional
detail regarding the data sources utilized for this study. After collecting the necessary data,
multipliers were utilized to achieve the total economic impact and employment impact of Indiana
University of Pennsylvania. The multipliers were obtained through the Bureau of Economic
Analysis Regional Industrial Multiplier Systems (“RIMS II”). As a whole, it is noted that IUP
has an important role in the Commonwealth in terms of the higher educational opportunities it
provides to residents of the Commonwealth as well as the direct, indirect, and induced economic
benefits the university provides to the Commonwealth.
Appendix C Page 90

The total direct economic impact of IUP on the Commonwealth was $427,774,334. This value is
represented by four main spending sources: institutional spending, faculty/staff spending,
student spending, and capital expenditures. Note that the institutional spending includes
employment benefits spent primarily in the Commonwealth of Pennsylvania.
Indiana University of Pennsylvania’s Direct Economic Impact on the Commonwealth\
(1) Institutional spending: $90,980,132
Benefits: $51,903,699
(2) Faculty/Staff spending: $92,656,902
(3) Student spending: $181,079,958
(4) Capital Expenditures: $11,153,643
Total Direct Impact: $427,774,334
As presented in Table 7.2, the direct impact, $427,774,334, was multiplied by the applicable
state multipliers obtained from the RIMS II data, resulting in a total economic impact of IUP on
the Commonwealth of $636,938,964. By taking the difference between the total and direct
economic impacts, the combined indirect and induced impact is calculated to be $209,164,630.
Please refer to Appendix E for an additional discussion related to the use of multipliers and the
methodology employed to derive the direct and indirect economic benefits.
Table 7.2: Total Economic Impact of Indiana University of Pennsylvania on the Commonwealth
University Total Direct Total Indirect Total Induced Total ImpactIndiana 427,774,334$ 184,817,150$ 24,347,480$ 636,938,964$
Appendix C Page 91
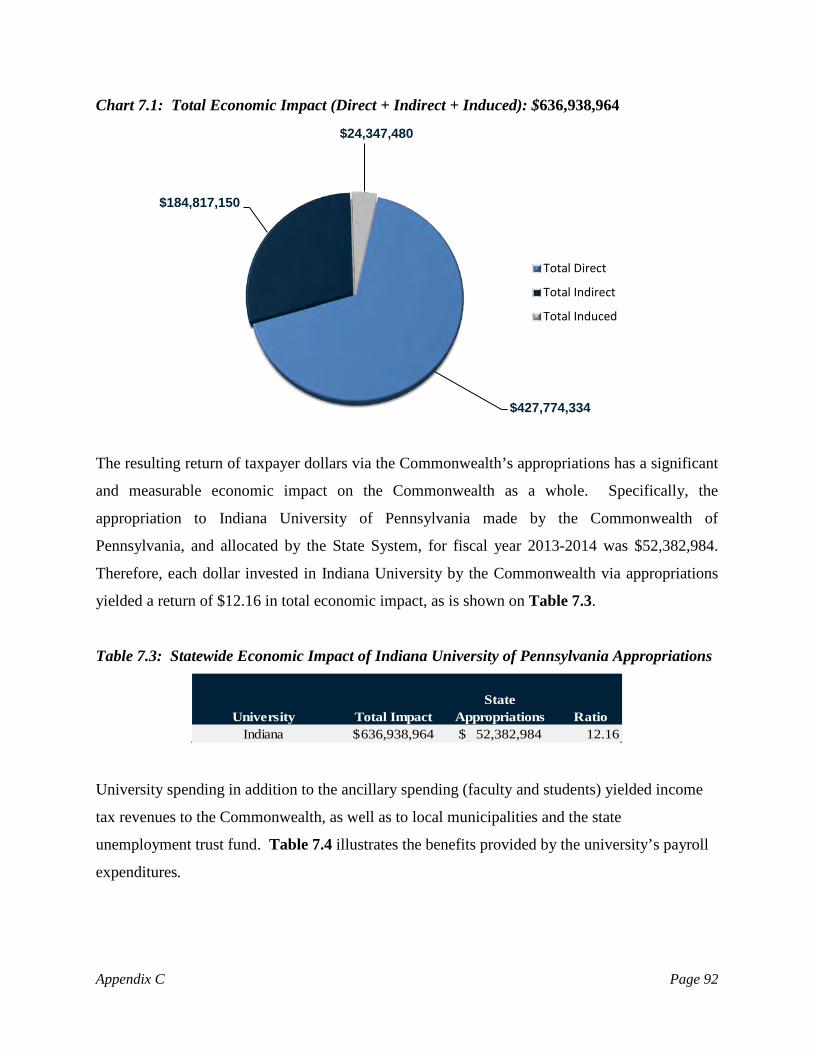
Chart 7.1: Total Economic Impact (Direct + Indirect + Induced): $636,938,964
The resulting return of taxpayer dollars via the Commonwealth’s appropriations has a significant
and measurable economic impact on the Commonwealth as a whole. Specifically, the
appropriation to Indiana University of Pennsylvania made by the Commonwealth of
Pennsylvania, and allocated by the State System, for fiscal year 2013-2014 was $52,382,984.
Therefore, each dollar invested in Indiana University by the Commonwealth via appropriations
yielded a return of $12.16 in total economic impact, as is shown on Table 7.3.
Table 7.3: Statewide Economic Impact of Indiana University of Pennsylvania Appropriations
University Total ImpactState
Appropriations RatioIndiana 636,938,964$ 52,382,984$ 12.16
University spending in addition to the ancillary spending (faculty and students) yielded income
tax revenues to the Commonwealth, as well as to local municipalities and the state
unemployment trust fund. Table 7.4 illustrates the benefits provided by the university’s payroll
expenditures.
$427,774,334
$184,817,150
$24,347,480
Total Direct
Total Indirect
Total Induced
Appendix C Page 92

Table 7.4: Statewide Economic Impact of Indiana University of Pennsylvania Payroll Tax Withholdings
UniversityState Tax
Withholdings Local EIT
Local Services
TaxUnemployment
TaxTotal Tax Payments
Indiana 3,455,150$ 1,415,326$ 120,124$ 76,292$ 5,066,892$
In addition, sales tax revenue was collected by the Commonwealth as a result of the consumption
of taxable goods and services by the university’s faculty and staff as well as students. Table 7.5
illustrates the sales tax revenue collected by the Commonwealth. Please refer to Appendix E for
an additional discussion of the methodology employed to estimate the sale tax revenue collected
by the Commonwealth.
Table 7.5: Statewide Economic Impact of Indiana University of Pennsylvania Sales Tax Revenue Collections
University Total Faculty and Student Spending
Spending subject to tax
Sales Tax Rate
Sales Tax Revenue
Indiana 385,394,125$ 92,070,657$ 6.00% 5,524,239$
In the aggregate, the revenues realized by the Commonwealth in terms of payroll tax
withholdings and sales tax receipts for IUP were $8,979,390 or 17.1 percent of the
Commonwealth’s appropriations for fiscal year 2013-2014.
The composite spending activity of the university also has a measureable effect on employment
in the Commonwealth.6 Specifically the direct spending of three categories enumerated above
helps to create jobs. The employment impact of the aggregate spending of the university and the
ancillary spending of the faculty/staff and students is measured by the the RIMS II multiplier
which estimates the number of jobs created per every additional million in spending.7
Specifically, the RIMS II state multiplier for Pennsylvania indicated that for each additional
million dollars of output by the State System universities, approximately 21.3 jobs were created
6 Composite spending activity includes institutional, faculty and staff and student spending. 7 Please refer to Appendix E for additional information related to the RIMS II multipliers.
Appendix C Page 93
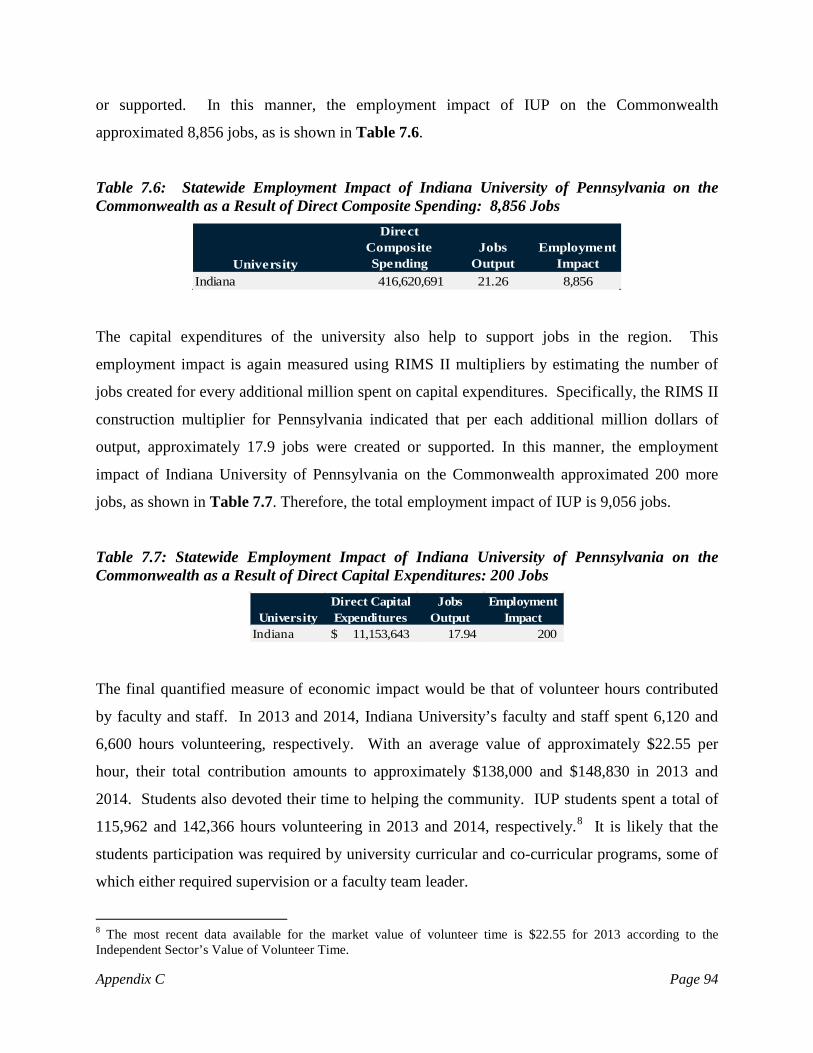
or supported. In this manner, the employment impact of IUP on the Commonwealth
approximated 8,856 jobs, as is shown in Table 7.6.
Table 7.6: Statewide Employment Impact of Indiana University of Pennsylvania on the Commonwealth as a Result of Direct Composite Spending: 8,856 Jobs
University
Direct Composite Spending
Jobs Output
Employment Impact
Indiana 416,620,691 21.26 8,856
The capital expenditures of the university also help to support jobs in the region. This
employment impact is again measured using RIMS II multipliers by estimating the number of
jobs created for every additional million spent on capital expenditures. Specifically, the RIMS II
construction multiplier for Pennsylvania indicated that per each additional million dollars of
output, approximately 17.9 jobs were created or supported. In this manner, the employment
impact of Indiana University of Pennsylvania on the Commonwealth approximated 200 more
jobs, as shown in Table 7.7. Therefore, the total employment impact of IUP is 9,056 jobs.
Table 7.7: Statewide Employment Impact of Indiana University of Pennsylvania on the Commonwealth as a Result of Direct Capital Expenditures: 200 Jobs
UniversityDirect Capital Expenditures
Jobs Output
Employment Impact
Indiana $ 11,153,643 17.94 200
The final quantified measure of economic impact would be that of volunteer hours contributed
by faculty and staff. In 2013 and 2014, Indiana University’s faculty and staff spent 6,120 and
6,600 hours volunteering, respectively. With an average value of approximately $22.55 per
hour, their total contribution amounts to approximately $138,000 and $148,830 in 2013 and
2014. Students also devoted their time to helping the community. IUP students spent a total of
115,962 and 142,366 hours volunteering in 2013 and 2014, respectively.8 It is likely that the
students participation was required by university curricular and co-curricular programs, some of
which either required supervision or a faculty team leader.
8 The most recent data available for the market value of volunteer time is $22.55 for 2013 according to the Independent Sector’s Value of Volunteer Time.
Appendix C Page 94

Economic Development
Economic development involves improvements to the standard of living through the creation of
jobs and the support of innovation and new research in a community’s region, state, or nation.
The State System plays a role in enhancing the economic development of the regions in which
the individual universities reside by assisting in the development and growth of new and existing
businesses, as well as increasing the employment opportunities, both of which increase economic
activity in the respective areas. The universities accomplish this in various ways, such as
partnering with local businesses, providing education and job skills training, providing an outlet
for research and development through incubators, and by providing financial and technical
assistance.
The goal of Pennsylvania’s State System of Higher Education and its 14 universities is
fundamentally to educate the citizens of the Commonwealth. By providing higher education, the
universities are not only helping to improve the economic development in the short-term, but in
the long-run as well. Therefore, by way of establishing and accomplishing its mission,
Pennsylvania’s State System is benefiting the economic advancement of the Commonwealth.
Primarily, the State System does this through the granting of undergraduate and graduate
degrees, but also does so indirectly through its purchasing, expenditures, services, and by
employing hundreds, even thousands, of people.
Overall, Pennsylvania’s State System of Higher Education is a key player in supporting the
economic development and growth of communities, counties, regions, and the Commonwealth
overall. By providing sources of innovation and entrepreneurial assistance, the State System
supplies economic growth to local businesses along with highly skilled and educated candidate
employees. Through its various economic development activities, Indiana University of
Pennsylvania successfully provides an economic competitive advantage for the county and the
Commonwealth as a whole.
Indiana University of Pennsylvania’s participation in WEDnetPA program had over 2,900
participants and had a total of $352,916 funds awarded in 2014. Additionally, Indiana
University of Pennsylvania also has several other workforce development programs such as: the
Appendix C Page 95
Culinary Academy, the IUP Highway Safety Project, Physical Fitness for IUP Policy Academy,
amongst many others. These programs drew in over 6,000 participants in 2014. IUP also has an
affiliated business incubator and a Small Business Development Center (“SBDC”). The SBDC
provides entrepreneurs and small business with the tools they require to build and grow a
successful business. In 2014, more than 166 clients received 4,305 hours of counseling from
experienced faculty, professional staff, and students. With these efforts, Indiana University of
Pennsylvania is positively impacting the economic development in all of the counties it reaches
and beyond.
Appendix C Page 96

Exhibit 7.1
Location: CountyFaculty and Staff Headcount Paid in 2014
Fall 2013 Fall 2014Undergraduate 12,668 12,130 Graduate 2,257 2,239 Total 14,925 14,369
Full-time 12,965 12,165 Part-time 1,960 2,204 Total 14,925 14,369
PA residents 12,828 12,400 Non-residents 2,097 1,969 Total 14,925 14,369
Traditional undergraduate (students under 25) 11,853 11,346 Non-traditional undergraduate (students over 25) 811 782 Total (undergraduate only)¹ 12,664 12,128
Room & BoardTuitionFees Total
Room & BoardTuitionFees Total
Tuition (per credit)Fees (per credit)Total
Tuition (per credit)Fees (per credit)Total (per credit)
Tuition from undergraduate in-state studentsTuition from undergraduate out-of-state studentsTuition from graduate in-state studentsTuition from graduate out-of-state studentsTotal 108,039,338$
223 677$
8,079,279
681$ 271 952$
Financial CharacteristicsRevenues, FY 2013-2014Tuition
74,795,940$ 14,215,214 10,948,905
Cost of AttendanceUndergraduate, In-State, FY 2014-2015
11,346$ 6,820 2,650
Indiana University of Pennsylvania InformationIndiana2,129
Enrollment CharacteristicsEnrollment
20,816$
Graduate, Out-of-State, FY 2014-2015
Undergraduate, Out-of-State, FY 2014-201511,346$ 17,050
3,915 32,311$
Graduate, In-State, FY 2014-2015454$
Appendix C Page 97

Technology, Academic/Instruction, and Other Mandatory Fees
Non-Mandatory FeesTotal
Total from Tuition and Fees 141,435,678$
6,072,897$
52,382,984$
Federal 26,627,284$ State 15,384,618 Local/Other/Private 4,449,815 System Transfer Awards 985,226 Total grants and contracts 47,446,943$
38,286,964$ Total Revenues (from sources above) 285,625,466$
2,098,427$ 61,172,865$
1,356,100,000$
Institutional ExpendituresInstitutional spending (excluding payroll) 82,011,382$ Capital Improvements 8,968,750 Employee Benefits 51,903,699
Total Direct Institutional Spending 142,883,831 Institutional spending prorated by 13.70% of out of state students 19,579,530 Type 1 Multiplier 1.53
Type 1 Effect (total indirect - induced) 29,956,681 Type 2 Multiplier 2.330
Type 2 Effect (total indirect) 45,659,463 Induced Effect (type 2 effect - type 1 effect) 15,634,255 Total Impact of Institutional Spending 204,177,549$
Faculty and Staff ExpendituresFaculty and staff spending (direct) 92,656,902$ Household multiplier 1.4100 Total Impact of Faculty and Staff Spending 130,451,652$
The Institution as a Consumer in the State
Financial CharacteristicsFeesMandatory Fees
31,103,460$ Non-Mandatory Fees
2,292,880 33,396,340$
Total Replacement Value of Physical Plant (main campus)
Sales and Services
Education and General Appropriations
Grants and Contracts
Other Revenues (net of scholarship discounts and allowances)
Funds Raised by University (private giving)Market Value of Endowment
Appendix C Page 98
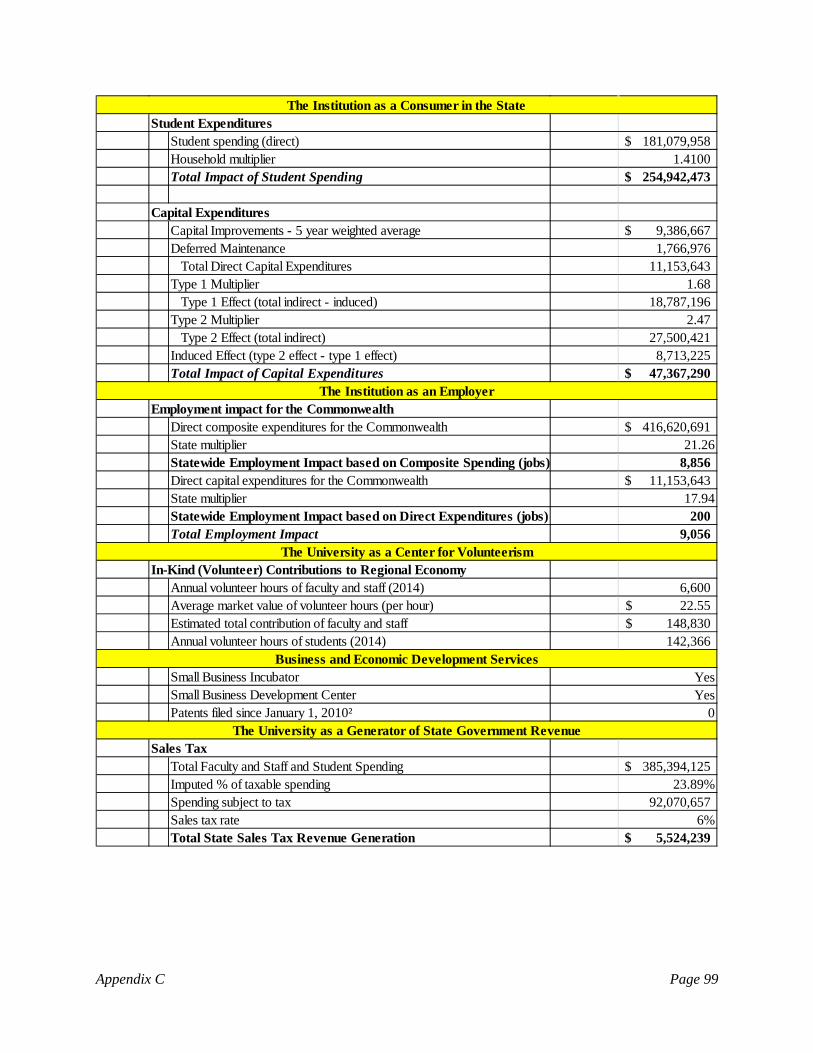
Student ExpendituresStudent spending (direct) 181,079,958$ Household multiplier 1.4100 Total Impact of Student Spending 254,942,473$
Capital ExpendituresCapital Improvements - 5 year weighted average 9,386,667$ Deferred Maintenance 1,766,976
Total Direct Capital Expenditures 11,153,643 Type 1 Multiplier 1.68
Type 1 Effect (total indirect - induced) 18,787,196 Type 2 Multiplier 2.47
Type 2 Effect (total indirect) 27,500,421 Induced Effect (type 2 effect - type 1 effect) 8,713,225 Total Impact of Capital Expenditures 47,367,290$
Employment impact for the CommonwealthDirect composite expenditures for the Commonwealth 416,620,691$ State multiplier 21.26Statewide Employment Impact based on Composite Spending (jobs) 8,856 Direct capital expenditures for the Commonwealth 11,153,643$ State multiplier 17.94Statewide Employment Impact based on Direct Expenditures (jobs) 200 Total Employment Impact 9,056
In-Kind (Volunteer) Contributions to Regional EconomyAnnual volunteer hours of faculty and staff (2014) 6,600 Average market value of volunteer hours (per hour) 22.55$ Estimated total contribution of faculty and staff 148,830$ Annual volunteer hours of students (2014) 142,366
Small Business IncubatorSmall Business Development CenterPatents filed since January 1, 2010²
Sales TaxTotal Faculty and Staff and Student Spending 385,394,125$ Imputed % of taxable spending 23.89%Spending subject to tax 92,070,657 Sales tax rate 6%Total State Sales Tax Revenue Generation 5,524,239$
The University as a Generator of State Government Revenue
YesYes
0
The Institution as a Consumer in the State
The Institution as an Employer
The University as a Center for Volunteerism
Business and Economic Development Services
Appendix C Page 99
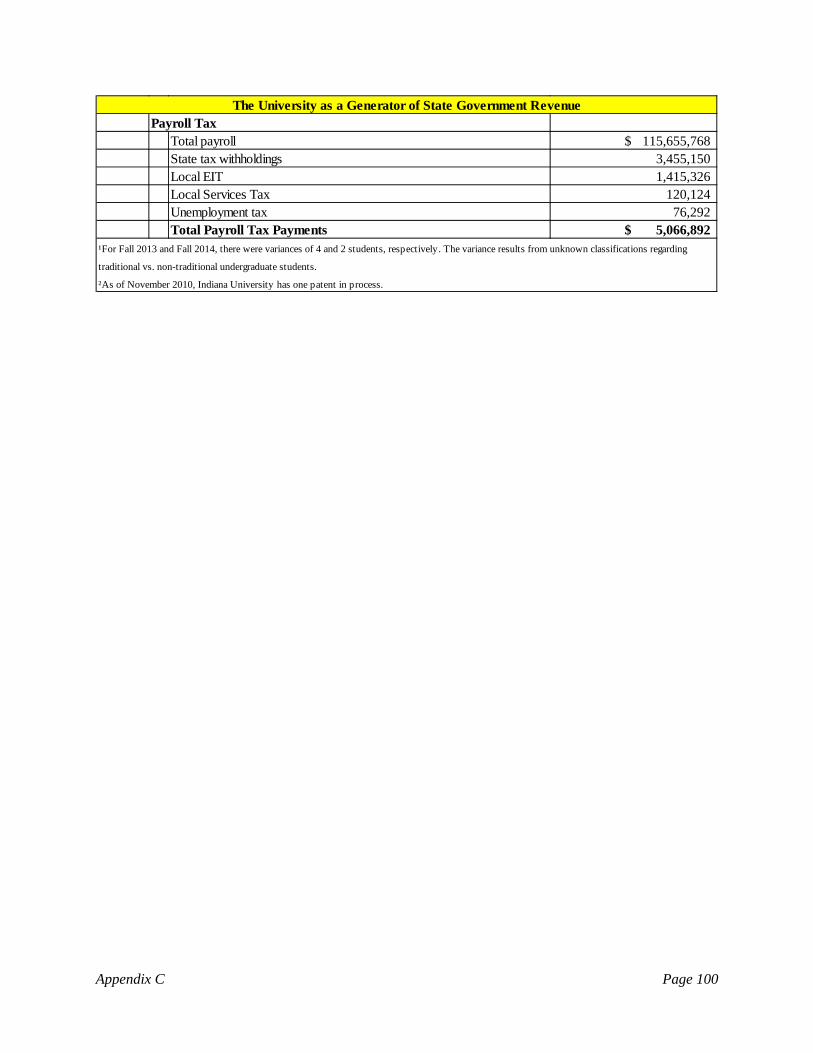
Payroll TaxTotal payroll 115,655,768$ State tax withholdings 3,455,150 Local EIT 1,415,326 Local Services Tax 120,124 Unemployment tax 76,292 Total Payroll Tax Payments 5,066,892$
¹For Fall 2013 and Fall 2014, there were variances of 4 and 2 students, respectively. The variance results from unknown classifications regarding
traditional vs. non-traditional undergraduate students.
²As of November 2010, Indiana University has one patent in process.
The University as a Generator of State Government Revenue
Appendix C Page 100

Kutztown University of Pennsylvania Berks County, PA
Kutztown University was originally founded in 1866 as Kutztown State Normal School; it
became known as Kutztown University in 1983. In July of 1983, Kutztown then became one
of the 14 state-owned universities within Pennsylvania’s State System of Higher Education
(“State System”). The University’s mission is to provide a high quality education at the
undergraduate and graduate levels in order to prepare students to meet lifelong
intellectual, ethical, social, and career challenges. At Kutztown University, 87 percent tenured
or tenured-track instructional faculty has doctorates or terminal degrees. Additionally, the
student to faculty ratio is 20:1. Kutztown also has an alumni network of about 72,500 graduates
that can be found across the US and beyond. As of fall 2014 semester, there were 8562
undergraduate and 656 graduate students enrolled within the institution. As of July 1, 2015,
Dr. Kenneth Hawkinson will take over as 12th president of the university.1
Map 8.1 demonstrates these students come from all across the state, thus contributing to the economic impact of the State System.
1 Excerpts obtained from Kutztown University’s website, www2.kutztown.edu. Appendix C Page 101
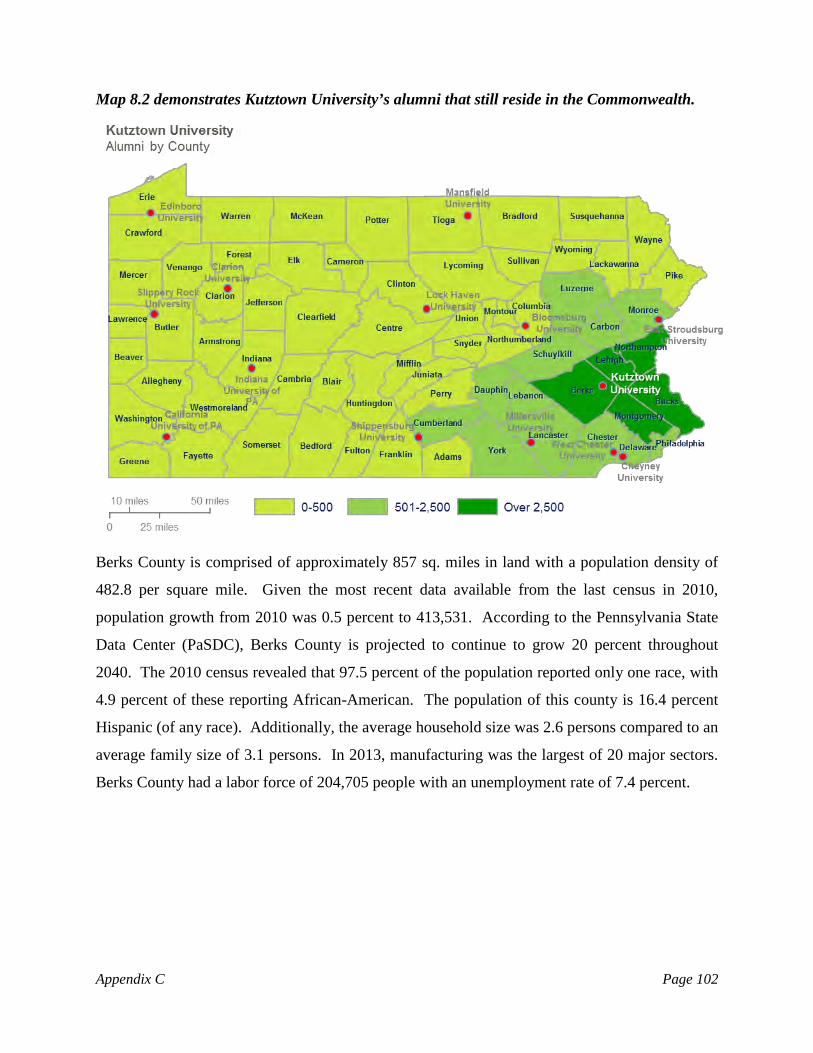
Map 8.2 demonstrates Kutztown University’s alumni that still reside in the Commonwealth.
Berks County is comprised of approximately 857 sq. miles in land with a population density of
482.8 per square mile. Given the most recent data available from the last census in 2010,
population growth from 2010 was 0.5 percent to 413,531. According to the Pennsylvania State
Data Center (PaSDC), Berks County is projected to continue to grow 20 percent throughout
2040. The 2010 census revealed that 97.5 percent of the population reported only one race, with
4.9 percent of these reporting African-American. The population of this county is 16.4 percent
Hispanic (of any race). Additionally, the average household size was 2.6 persons compared to an
average family size of 3.1 persons. In 2013, manufacturing was the largest of 20 major sectors.
Berks County had a labor force of 204,705 people with an unemployment rate of 7.4 percent.
Appendix C Page 102
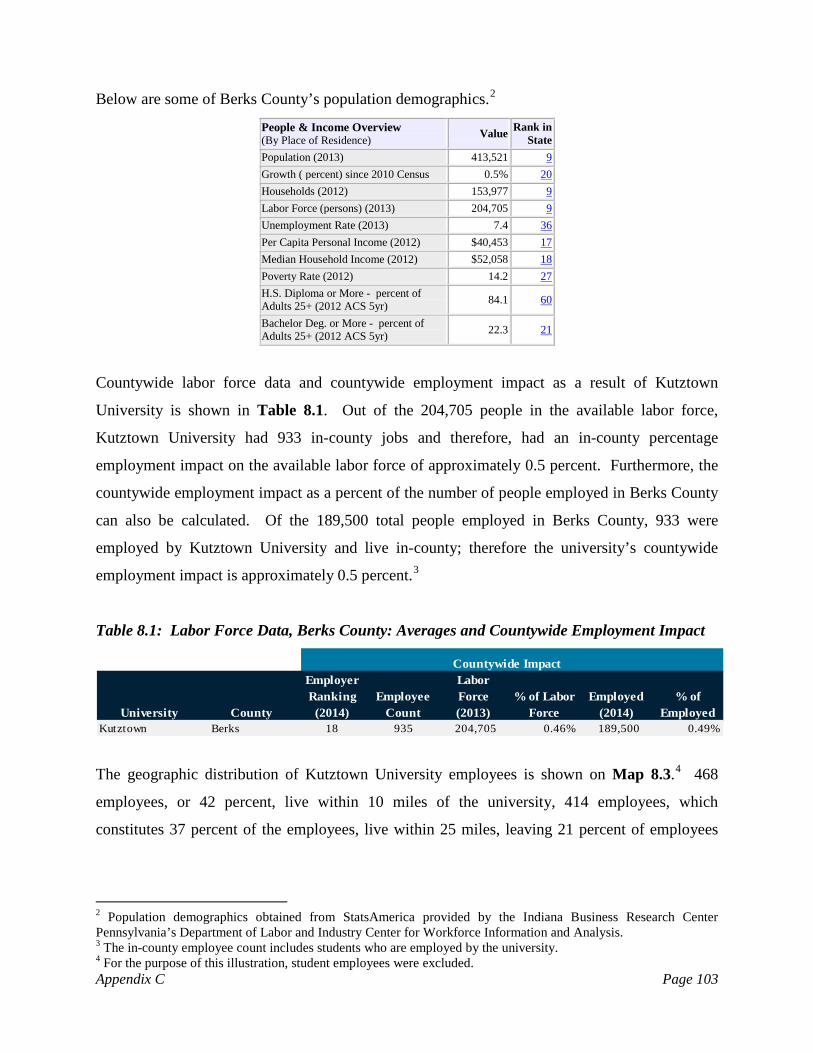
Below are some of Berks County’s population demographics.2
People & Income Overview (By Place of Residence) Value Rank in
State Population (2013) 413,521 9
Growth ( percent) since 2010 Census 0.5% 20
Households (2012) 153,977 9
Labor Force (persons) (2013) 204,705 9
Unemployment Rate (2013) 7.4 36
Per Capita Personal Income (2012) $40,453 17
Median Household Income (2012) $52,058 18
Poverty Rate (2012) 14.2 27
H.S. Diploma or More - percent of Adults 25+ (2012 ACS 5yr) 84.1 60
Bachelor Deg. or More - percent of Adults 25+ (2012 ACS 5yr) 22.3 21
Countywide labor force data and countywide employment impact as a result of Kutztown
University is shown in Table 8.1. Out of the 204,705 people in the available labor force,
Kutztown University had 933 in-county jobs and therefore, had an in-county percentage
employment impact on the available labor force of approximately 0.5 percent. Furthermore, the
countywide employment impact as a percent of the number of people employed in Berks County
can also be calculated. Of the 189,500 total people employed in Berks County, 933 were
employed by Kutztown University and live in-county; therefore the university’s countywide
employment impact is approximately 0.5 percent.3
Table 8.1: Labor Force Data, Berks County: Averages and Countywide Employment Impact
Countywide Impact
University County
Employer Ranking (2014)
Employee Count
Labor Force (2013)
% of Labor Force
Employed (2014)
% of Employed
Kutztown Berks 18 935 204,705 0.46% 189,500 0.49%
The geographic distribution of Kutztown University employees is shown on Map 8.3.4 468
employees, or 42 percent, live within 10 miles of the university, 414 employees, which
constitutes 37 percent of the employees, live within 25 miles, leaving 21 percent of employees
2 Population demographics obtained from StatsAmerica provided by the Indiana Business Research Center Pennsylvania’s Department of Labor and Industry Center for Workforce Information and Analysis. 3 The in-county employee count includes students who are employed by the university. 4 For the purpose of this illustration, student employees were excluded. Appendix C Page 103

living beyond 25 miles from the university. Refer to Appendix E for the methodology regarding
the composition of this map.
Map 8.3: Kutztown University’s Distribution of Employees
Economic Impact
The direct and indirect economic impact of each university was calculated in order to arrive at
the total economic impact that each has on the Commonwealth overall. Exhibit 8.1 provides a
general overview of Kutztown University, as well as the direct and indirect economic and
employment impacts of the university on the Commonwealth.
A variety of data sources were used in order to calculate and analyze the spending of each
institution and its employees, students, and visitors. Please refer to Appendix E for additional
detail regarding the data sources utilized for this study. After collecting the necessary data,
multipliers were utilized to achieve the total economic impact and employment impact of
Kutztown University. The multipliers were obtained through the Bureau of Economic Analysis
Regional Industrial Multiplier Systems (“RIMS II”). As a whole, it is noted that Kutztown
University has an important role in the Commonwealth in terms of the higher educational Appendix C Page 104

opportunities it provides to residents of the Commonwealth as well as the direct, indirect, and
induced economic benefits the university provides to the Commonwealth.
The total direct economic impact of Kutztown University on the Commonwealth was
$254,408,286. This value is represented by four main spending sources: institutional spending,
faculty/staff spending, student spending, and capital expenditures. Note that the institutional
spending includes employment benefits spent primarily in the Commonwealth of Pennsylvania.
Kutztown University’s Direct Economic Impact on the Commonwealth
(1) Institutional spending: $70,455,902
Benefits: $30,848,249
(2) Faculty/Staff spending: $57,311,502
(3) Student spending: $93,701,868
(4) Capital Expenditures $2,090,765
Total Direct Impact: $254,408,286
As presented in Table 8.2, the direct impact, $254,408,286, was multiplied by the applicable
state multipliers obtained from the RIMS II data, resulting in a total economic impact of
Kutztown University on the Commonwealth of $357,989,848. By taking the difference between
the total and direct economic impacts, the combined indirect and induced impact is calculated to
be $103,581,562. Please refer to Appendix E for an additional discussion related to the use of
multipliers and the methodology employed to derive the direct and indirect economic benefits.
Table 8.2: Total Economic Impact of Kutztown University on the Commonwealth
University Total Direct Total Indirect Total Induced Total ImpactKutztown 254,408,286$ 92,971,052$ 10,610,510$ 357,989,848$
Appendix C Page 105

Chart 8.1: Total Economic Impact (Direct + Indirect + Induced): $357,989,848
The resulting return of taxpayer dollars via the Commonwealth’s appropriations has a significant
and measurable economic impact on the Commonwealth as a whole. Specifically, the
appropriation to Kutztown University made by the Commonwealth of Pennsylvania, and
allocated by the State System, for fiscal year 2013-2014 was $33,105,442. Therefore, each
dollar invested in Kutztown University by the Commonwealth via appropriations yielded a return
of approximately $10.81 in total economic impact, as is shown on Table 8.3.
Table 8.3: Statewide Economic Impact of Kutztown University Appropriations
University Total ImpactState
Appropriations RatioKutztown 357,989,848$ 33,105,442$ 10.81
University spending in addition to the ancillary spending (faculty and students) yielded income
tax revenues to the Commonwealth, as well as to local municipalities and the state
unemployment trust fund. Table 8.4 illustrates the benefits provided by the university’s payroll
expenditures.
$254,408,286
$92,971,052
$10,610,510
Total Direct
Total Indirect
Total Induced
Appendix C Page 106
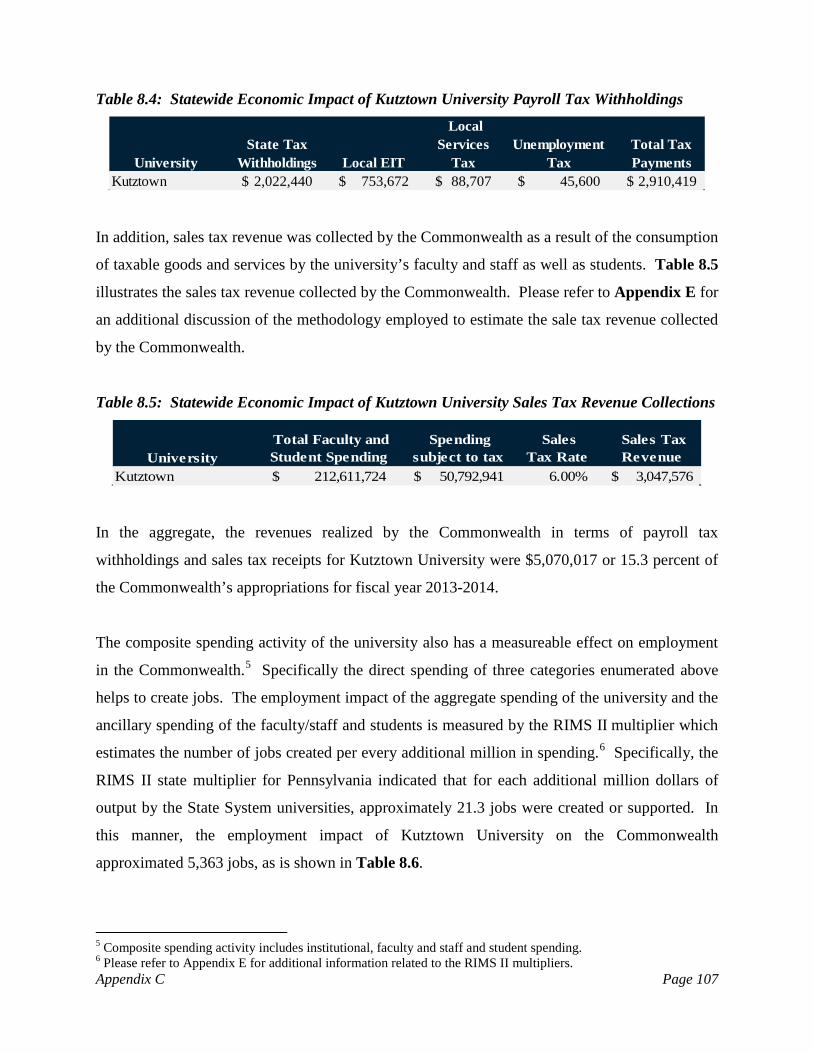
Table 8.4: Statewide Economic Impact of Kutztown University Payroll Tax Withholdings
UniversityState Tax
Withholdings Local EIT
Local Services
TaxUnemployment
TaxTotal Tax Payments
Kutztown 2,022,440$ 753,672$ 88,707$ 45,600$ 2,910,419$
In addition, sales tax revenue was collected by the Commonwealth as a result of the consumption
of taxable goods and services by the university’s faculty and staff as well as students. Table 8.5
illustrates the sales tax revenue collected by the Commonwealth. Please refer to Appendix E for
an additional discussion of the methodology employed to estimate the sale tax revenue collected
by the Commonwealth.
Table 8.5: Statewide Economic Impact of Kutztown University Sales Tax Revenue Collections
University Total Faculty and Student Spending
Spending subject to tax
Sales Tax Rate
Sales Tax Revenue
Kutztown 212,611,724$ 50,792,941$ 6.00% 3,047,576$
In the aggregate, the revenues realized by the Commonwealth in terms of payroll tax
withholdings and sales tax receipts for Kutztown University were $5,070,017 or 15.3 percent of
the Commonwealth’s appropriations for fiscal year 2013-2014.
The composite spending activity of the university also has a measureable effect on employment
in the Commonwealth.5 Specifically the direct spending of three categories enumerated above
helps to create jobs. The employment impact of the aggregate spending of the university and the
ancillary spending of the faculty/staff and students is measured by the RIMS II multiplier which
estimates the number of jobs created per every additional million in spending.6 Specifically, the
RIMS II state multiplier for Pennsylvania indicated that for each additional million dollars of
output by the State System universities, approximately 21.3 jobs were created or supported. In
this manner, the employment impact of Kutztown University on the Commonwealth
approximated 5,363 jobs, as is shown in Table 8.6.
5 Composite spending activity includes institutional, faculty and staff and student spending. 6 Please refer to Appendix E for additional information related to the RIMS II multipliers. Appendix C Page 107
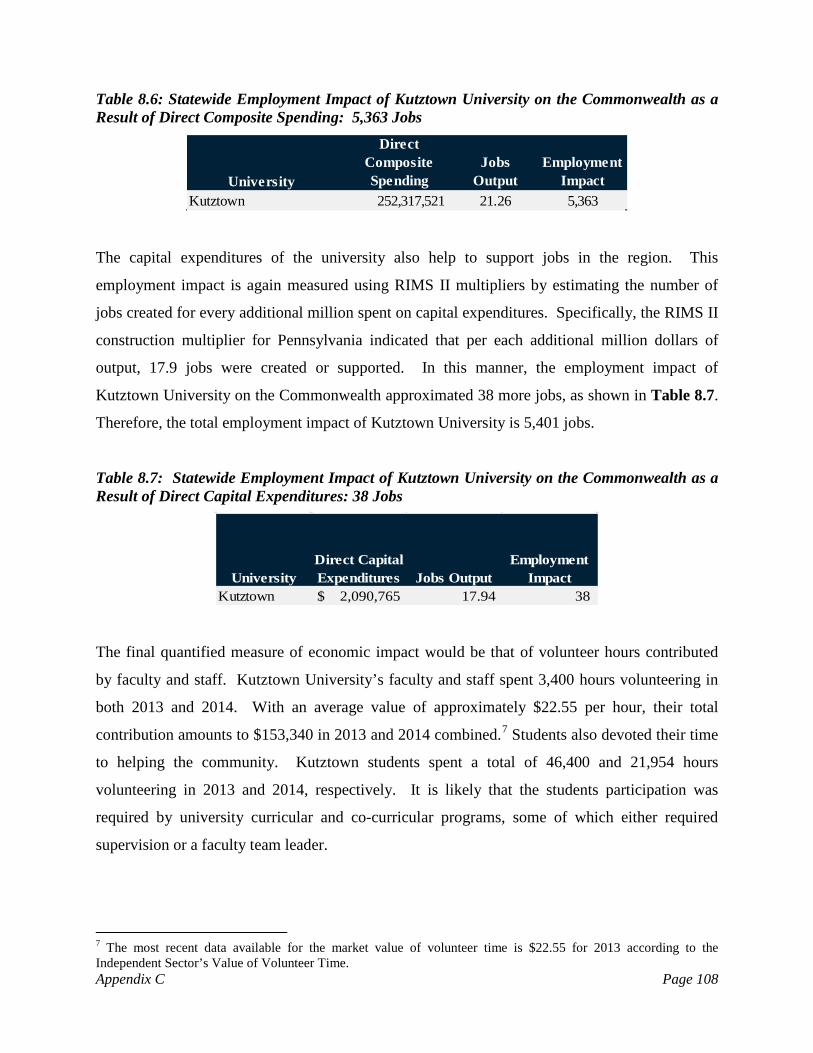
Table 8.6: Statewide Employment Impact of Kutztown University on the Commonwealth as a Result of Direct Composite Spending: 5,363 Jobs
University
Direct Composite Spending
Jobs Output
Employment Impact
Kutztown 252,317,521 21.26 5,363
The capital expenditures of the university also help to support jobs in the region. This
employment impact is again measured using RIMS II multipliers by estimating the number of
jobs created for every additional million spent on capital expenditures. Specifically, the RIMS II
construction multiplier for Pennsylvania indicated that per each additional million dollars of
output, 17.9 jobs were created or supported. In this manner, the employment impact of
Kutztown University on the Commonwealth approximated 38 more jobs, as shown in Table 8.7.
Therefore, the total employment impact of Kutztown University is 5,401 jobs.
Table 8.7: Statewide Employment Impact of Kutztown University on the Commonwealth as a Result of Direct Capital Expenditures: 38 Jobs
UniversityDirect Capital Expenditures Jobs Output
Employment Impact
Kutztown $ 2,090,765 17.94 38
The final quantified measure of economic impact would be that of volunteer hours contributed
by faculty and staff. Kutztown University’s faculty and staff spent 3,400 hours volunteering in
both 2013 and 2014. With an average value of approximately $22.55 per hour, their total
contribution amounts to $153,340 in 2013 and 2014 combined.7 Students also devoted their time
to helping the community. Kutztown students spent a total of 46,400 and 21,954 hours
volunteering in 2013 and 2014, respectively. It is likely that the students participation was
required by university curricular and co-curricular programs, some of which either required
supervision or a faculty team leader.
7 The most recent data available for the market value of volunteer time is $22.55 for 2013 according to the Independent Sector’s Value of Volunteer Time. Appendix C Page 108
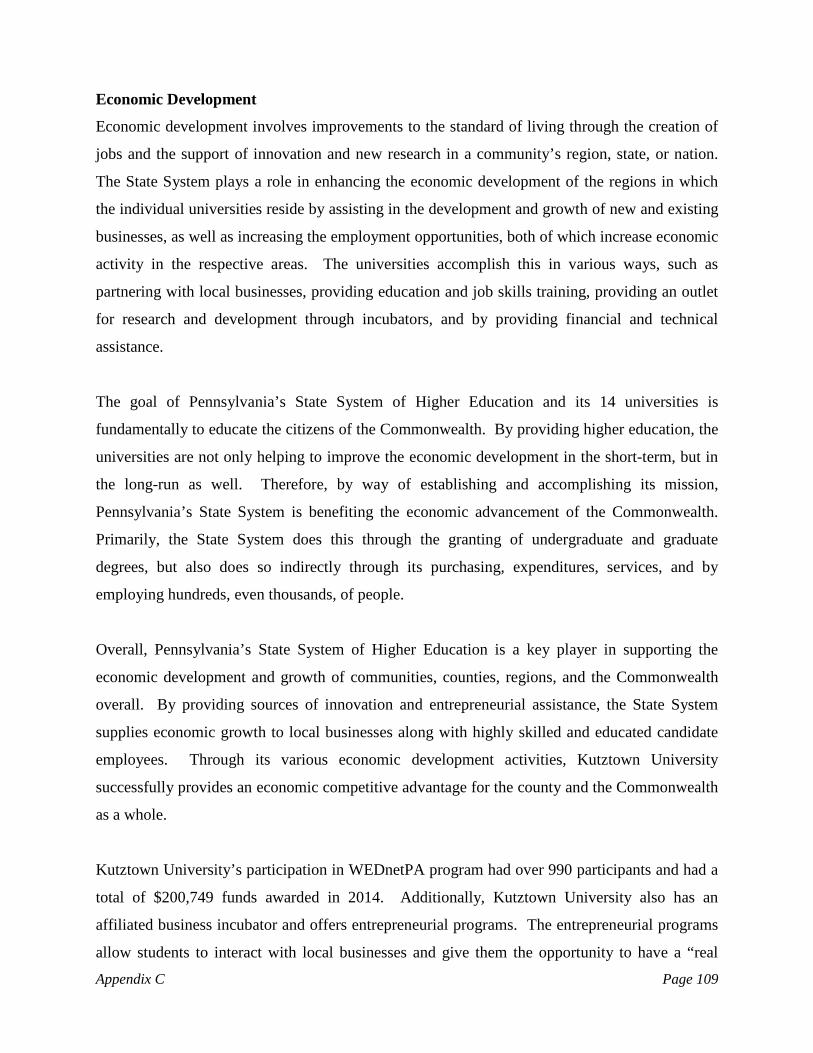
Economic Development
Economic development involves improvements to the standard of living through the creation of
jobs and the support of innovation and new research in a community’s region, state, or nation.
The State System plays a role in enhancing the economic development of the regions in which
the individual universities reside by assisting in the development and growth of new and existing
businesses, as well as increasing the employment opportunities, both of which increase economic
activity in the respective areas. The universities accomplish this in various ways, such as
partnering with local businesses, providing education and job skills training, providing an outlet
for research and development through incubators, and by providing financial and technical
assistance.
The goal of Pennsylvania’s State System of Higher Education and its 14 universities is
fundamentally to educate the citizens of the Commonwealth. By providing higher education, the
universities are not only helping to improve the economic development in the short-term, but in
the long-run as well. Therefore, by way of establishing and accomplishing its mission,
Pennsylvania’s State System is benefiting the economic advancement of the Commonwealth.
Primarily, the State System does this through the granting of undergraduate and graduate
degrees, but also does so indirectly through its purchasing, expenditures, services, and by
employing hundreds, even thousands, of people.
Overall, Pennsylvania’s State System of Higher Education is a key player in supporting the
economic development and growth of communities, counties, regions, and the Commonwealth
overall. By providing sources of innovation and entrepreneurial assistance, the State System
supplies economic growth to local businesses along with highly skilled and educated candidate
employees. Through its various economic development activities, Kutztown University
successfully provides an economic competitive advantage for the county and the Commonwealth
as a whole.
Kutztown University’s participation in WEDnetPA program had over 990 participants and had a
total of $200,749 funds awarded in 2014. Additionally, Kutztown University also has an
affiliated business incubator and offers entrepreneurial programs. The entrepreneurial programs
allow students to interact with local businesses and give them the opportunity to have a “real
Appendix C Page 109
world experience,” if selected. Through these programs, about 116 participants got the chance to
interact with and learn from approximately eight local businesses. Kutztown also has a Small
Business Development Center (“SBDC”). The mission of the SBDC, as one of 18 in
Pennsylvania, is to grow the economy of South Eastern and South Central Pennsylvania. The
consultants there can offer assistance in various areas including, but not limited to: evaluating or
refining business plans, incorporating new technology to a business, conducting market research,
identifying funding resources, and weighing sales opportunities or franchise options.8 By way of
the WEDnetPA and entrepreneurial programs, along with the SBDC, Kutztown University
certainly helps the economic development of Berks County, as well as many others.
8 ‘Kutztown SBDC: About the KU SBDC”, kutztownsbdc.org, visited February 25, 2015. Appendix C Page 110

Exhibit 8.1
Location: CountyFaculty and Staff Headcount Paid in 2014
Fall 2013 Fall 2014Undergraduate 8,815 8,562 Graduate 698 656 Total 9,513 9,218
Full-time 8,548 8,319 Part-time 965 899 Total 9,513 9,218
PA residents 8,451 8,195 Non-residents 1,062 1,023 Total 9,513 9,218
Traditional undergraduate (students under 25) 8,284 8,061 Non-traditional undergraduate (students over 25) 531 500 Total (undergraduate only)¹ 8,815 8,561
Room & BoardTuition FeesTotal
Room & BoardTuition FeesTotal
Tuition (per credit)Fees (per credit)Total (per credit)
Tuition (per credit)Fees (per credit)Total (per credit)
Tuition from undergraduate in-state studentsTuition from undergraduate out-of-state studentsTuition from graduate in-state studentsTuition from graduate out-of-state studentsTotal
Cost of Attendance
8,430$
801$
17,050
454$ 85
539$
681$ 120
Financial CharacteristicsRevenues, FY 2013-2014
Graduate, Out-of-State, FY 2014-2015
71,397,189$
50,421,791$ 15,819,406 4,853,693
302,299
Berks1,114
Kutztown University Information
Tuition
2,499 27,979$
Undergraduate, In-State, FY 2014-2015
Graduate, In-State, FY 2014-2015
EnrollmentEnrollment Characteristics
Undergraduate, Out-of-State, FY 2014-2015
8,430$ 6,820 2,279
17,529$
Appendix C Page 111
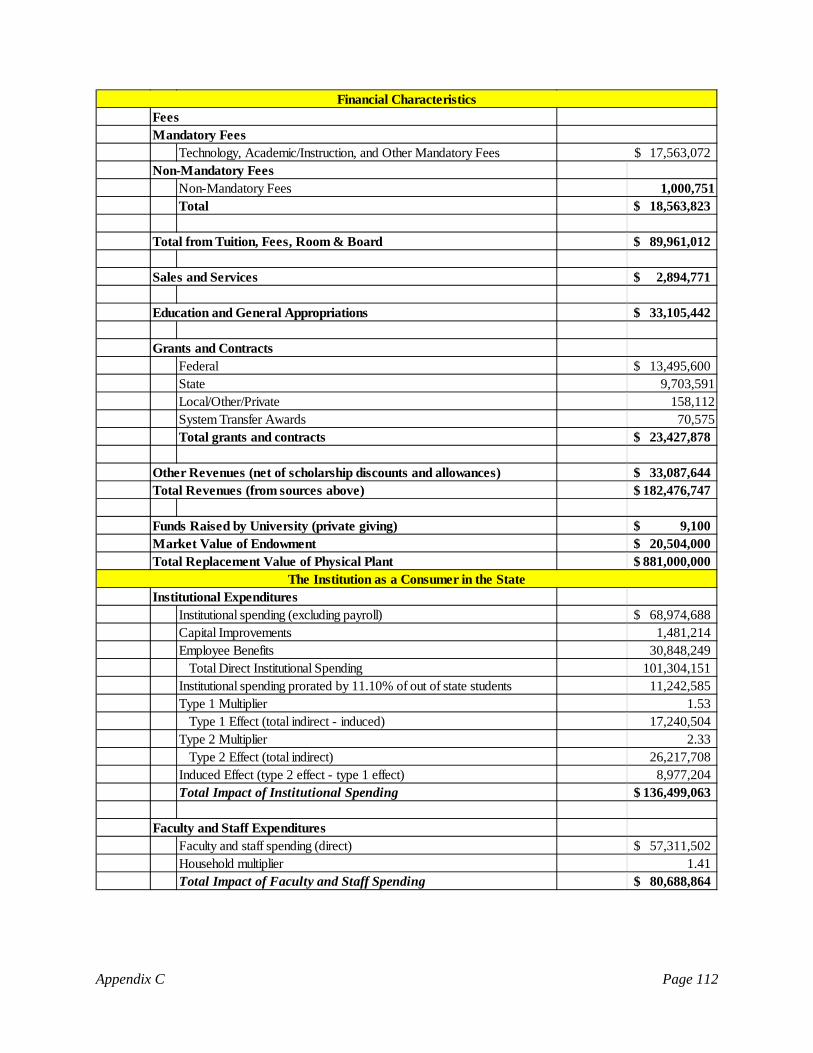
Technology, Academic/Instruction, and Other Mandatory Fees
Non-Mandatory Fees 1,000,751Total 18,563,823$
Total from Tuition, Fees, Room & Board 89,961,012$
2,894,771$
33,105,442$
Federal 13,495,600$ State 9,703,591Local/Other/Private 158,112System Transfer Awards 70,575Total grants and contracts 23,427,878$
33,087,644$ Total Revenues (from sources above) 182,476,747$
9,100$ 20,504,000$
881,000,000$
Institutional ExpendituresInstitutional spending (excluding payroll) 68,974,688$ Capital Improvements 1,481,214 Employee Benefits 30,848,249
Total Direct Institutional Spending 101,304,151 Institutional spending prorated by 11.10% of out of state students 11,242,585 Type 1 Multiplier 1.53
Type 1 Effect (total indirect - induced) 17,240,504 Type 2 Multiplier 2.33
Type 2 Effect (total indirect) 26,217,708 Induced Effect (type 2 effect - type 1 effect) 8,977,204 Total Impact of Institutional Spending 136,499,063$
Faculty and Staff ExpendituresFaculty and staff spending (direct) 57,311,502$ Household multiplier 1.41 Total Impact of Faculty and Staff Spending 80,688,864$
Fees
Funds Raised by University (private giving)Market Value of Endowment
Non-Mandatory Fees17,563,072$
Financial Characteristics
Mandatory Fees
The Institution as a Consumer in the StateTotal Replacement Value of Physical Plant
Sales and Services
Education and General Appropriations
Grants and Contracts
Other Revenues (net of scholarship discounts and allowances)
Appendix C Page 112

Student ExpendituresStudent spending (direct) 93,701,868$ Household multiplier 1.41 Total Impact of Student Spending 131,922,860$
Capital ExpendituresCapital Improvements - 5 year weighted average 1,013,333$ Deferred Maintenance 1,077,432
Total Direct Capital Expenditures 2,090,765 Type 1 Multiplier 1.68
Type 1 Effect (total indirect - induced) 3,521,685 Type 2 Multiplier 2.47
Type 2 Effect (total indirect) 5,154,991 Induced Effect (type 2 effect - type 1 effect) 1,633,306 Total Impact of Capital Expenditures 8,879,062$
Employment impact for the CommonwealthDirect composite expenditures for the Commonwealth 252,317,521$ State multiplier 21.26Statewide Employment Impact based on Composite Spending (jobs) 5,363 Direct capital expenditures for the Commonwealth 2,090,765$ State multiplier 17.94Statewide Employment Impact based on Direct Expenditures (jobs) 38 Total Employment Impact 5,401
In-Kind (Volunteer) Contributions to Regional EconomyAnnual volunteer hours of faculty and staff (2014) 3,400 Average market value of volunteer hours (per hour) 22.55$ Estimated total contribution of faculty and staff 76,670$ Annual volunteer hours of students (2014) 21,954
Small Business IncubatorSmall Business Development CenterPatents filed since January 1, 2010
Sales TaxTotal Faculty and Staff and Student Spending 212,611,724$ Imputed % of taxable spending 23.89%Spending subject to tax 50,792,941 Sales tax rate 6%Total State Sales Tax Revenue Generation 3,047,576$
The Institution as a Consumer in the State
The Institution as an Employer
The University as a Center for Volunteerism
Business and Economic Development Services
The University as a Generator of State Government Revenue
YesYes
0
Appendix C Page 113
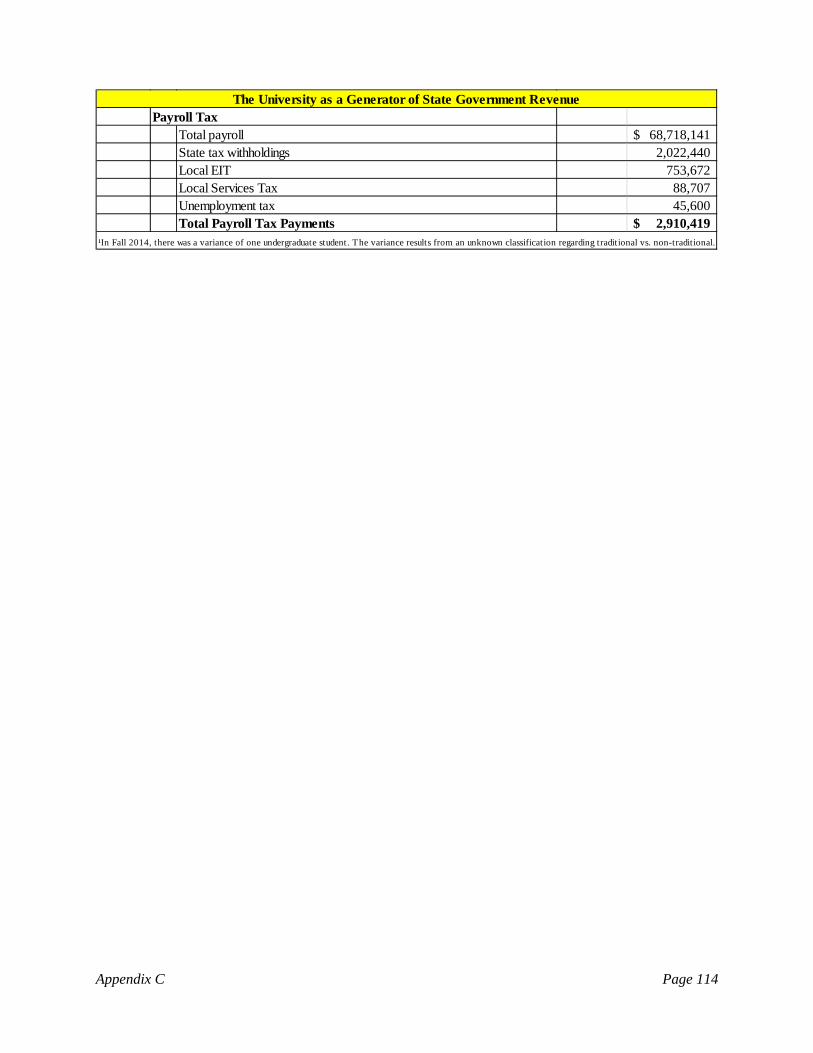
Payroll TaxTotal payroll 68,718,141$ State tax withholdings 2,022,440 Local EIT 753,672 Local Services Tax 88,707 Unemployment tax 45,600 Total Payroll Tax Payments 2,910,419$
¹In Fall 2014, there was a variance of one undergraduate student. The variance results from an unknown classification regarding traditional vs. non-traditional.
The University as a Generator of State Government Revenue
Appendix C Page 114
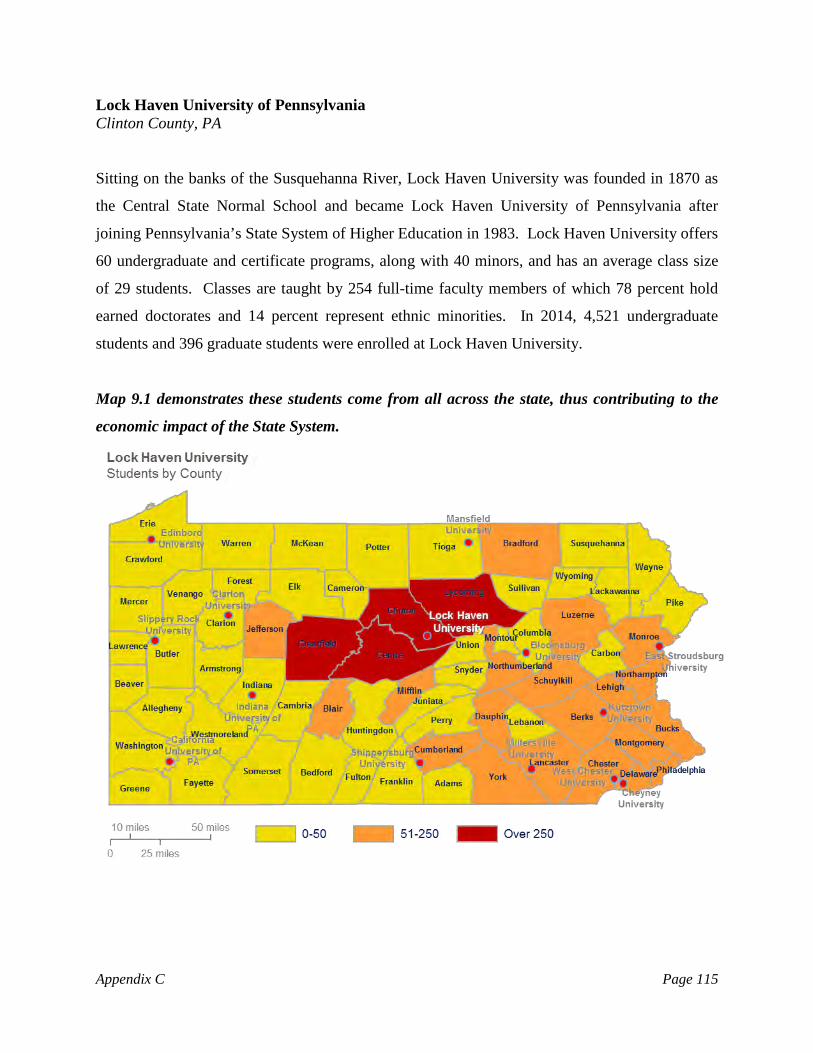
Lock Haven University of Pennsylvania Clinton County, PA
Sitting on the banks of the Susquehanna River, Lock Haven University was founded in 1870 as
the Central State Normal School and became Lock Haven University of Pennsylvania after
joining Pennsylvania’s State System of Higher Education in 1983. Lock Haven University offers
60 undergraduate and certificate programs, along with 40 minors, and has an average class size
of 29 students. Classes are taught by 254 full-time faculty members of which 78 percent hold
earned doctorates and 14 percent represent ethnic minorities. In 2014, 4,521 undergraduate
students and 396 graduate students were enrolled at Lock Haven University.
Map 9.1 demonstrates these students come from all across the state, thus contributing to the
economic impact of the State System.
Appendix C Page 115

According to the most recent data, 96 percent of 2011-2012 graduates were employed, in the
military or pursuing further education six months after graduation; 58 percent of those employed
were working in their chosen fields. Dr. Michael Fiorentino has been serving as the university’s
president since July 2011.1
Map 9.2 demonstrates Lock Haven University’s alumni that still reside in the Commonwealth.
Lock Haven University is in Clinton County, PA. Clinton County has a population of
approximately 39,954 people, which is a 1.8 percent increase from 2010 to 2013. It has 888 sq.
miles in land area and a population density of 45 per square mile. In 2013, Clinton County had a
labor force of 19,944 people and an unemployment rate of 8.6 percent, with manufacturing as the
largest of 20 major sectors in 2013.
1 Excerpts obtained from Lock Haven University’s website, www.lhup.edu. Appendix C Page 116

Below are some of Clinton County’s population demographics.2
People & Income Overview (By Place of Residence) Value Rank in
State Population (2013) 39,954 55
Growth ( percent) since 2010 Census 1.8% 4
Households (2012) 15,286 56
Labor Force (persons) (2013) 19,944 55
Unemployment Rate (2013) 8.6 14
Per Capita Personal Income (2012) $34,819 49
Median Household Income (2012) $41,949 50
Poverty Rate (2012) 15.7 14
H.S. Diploma or More - percent of Adults 25+ (2012 ACS 5yr) 86.4 46
Bachelor Deg. or More - percent of Adults 25+ (2012 ACS 5yr) 17.1 42
Clearfield County, PA
Lock Haven’s second campus is located in Clearfield County, PA. Clearfield has 1,444.7 sq.
miles in land area and a population density of 70.9 persons per square mile. There was a
population of 81,174 people in 2013, which was a 0.6% decrease in population since 2010. In
2013, Clearfield County had a labor force of 40,924 people and an unemployment rate of 8.4%.
During this time, health care and social assistance was the largest of 20 major sectors.
Below are some of Clearfield County’s population demographics.
People & Income Overview (By Place of Residence) Value Rank in
State Population (2013) 81,174 36
Growth (%) since 2010 Census -0.6% 37
Households (2012) 32,435 36
Labor Force (persons) (2013) 40,924 36
Unemployment Rate (2013) 8.4 20
Per Capita Personal Income (2012) $34,718 51
Median Household Income (2012) $41,519 55
Poverty Rate (2012) 14.6 22
H.S. Diploma or More - % of Adults 25+ (2012 ACS 5yr) 86.6 44
Bachelor Deg. or More - % of Adults 25+ (2012 ACS 5yr) 12.9 61
Countywide labor force data and countywide employment impact as a result of Lock Haven
University in Clinton County is shown in Table 9.1.3 Out of the 19,944 people in the available
2 Population demographics obtained from StatsAmerica provided by the Indiana Business Research Center Pennsylvania’s Department of Labor and Industry Center for Workforce Information and Analysis. Appendix C Page 117
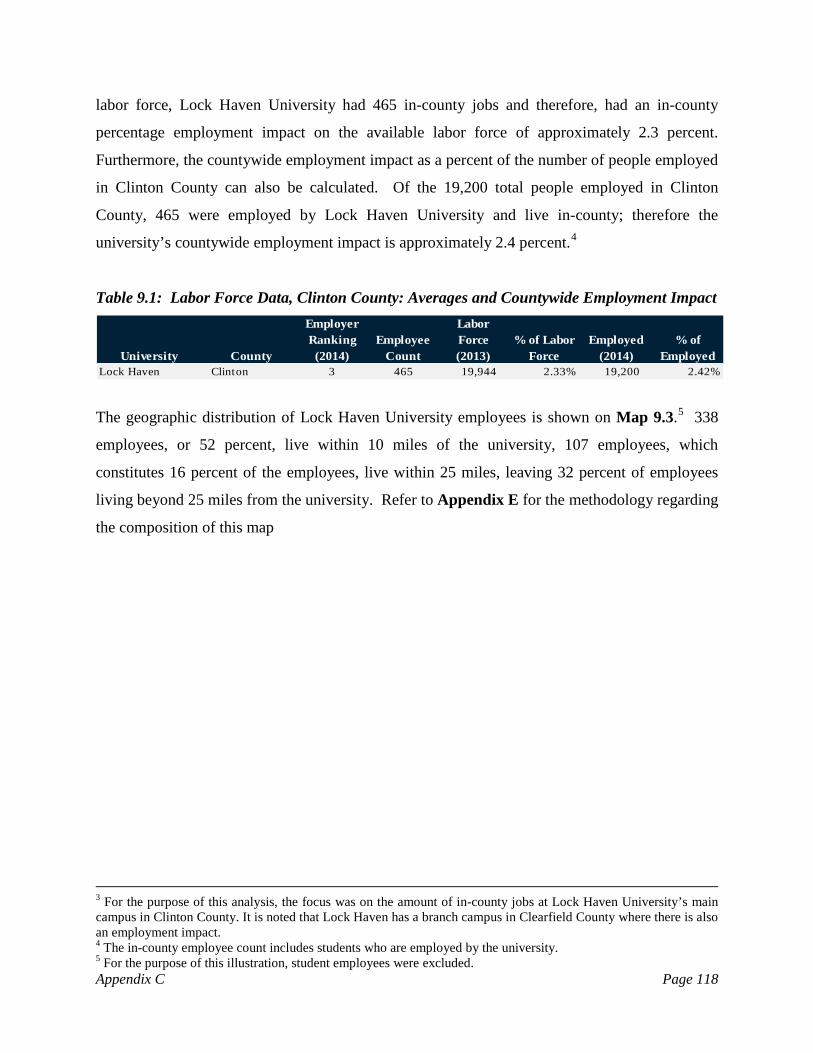
labor force, Lock Haven University had 465 in-county jobs and therefore, had an in-county
percentage employment impact on the available labor force of approximately 2.3 percent.
Furthermore, the countywide employment impact as a percent of the number of people employed
in Clinton County can also be calculated. Of the 19,200 total people employed in Clinton
County, 465 were employed by Lock Haven University and live in-county; therefore the
university’s countywide employment impact is approximately 2.4 percent.4
Table 9.1: Labor Force Data, Clinton County: Averages and Countywide Employment Impact
University County
Employer Ranking (2014)
Employee Count
Labor Force (2013)
% of Labor Force
Employed (2014)
% of Employed
Lock Haven Clinton 3 465 19,944 2.33% 19,200 2.42%
The geographic distribution of Lock Haven University employees is shown on Map 9.3.5 338
employees, or 52 percent, live within 10 miles of the university, 107 employees, which
constitutes 16 percent of the employees, live within 25 miles, leaving 32 percent of employees
living beyond 25 miles from the university. Refer to Appendix E for the methodology regarding
the composition of this map
3 For the purpose of this analysis, the focus was on the amount of in-county jobs at Lock Haven University’s main campus in Clinton County. It is noted that Lock Haven has a branch campus in Clearfield County where there is also an employment impact. 4 The in-county employee count includes students who are employed by the university. 5 For the purpose of this illustration, student employees were excluded. Appendix C Page 118
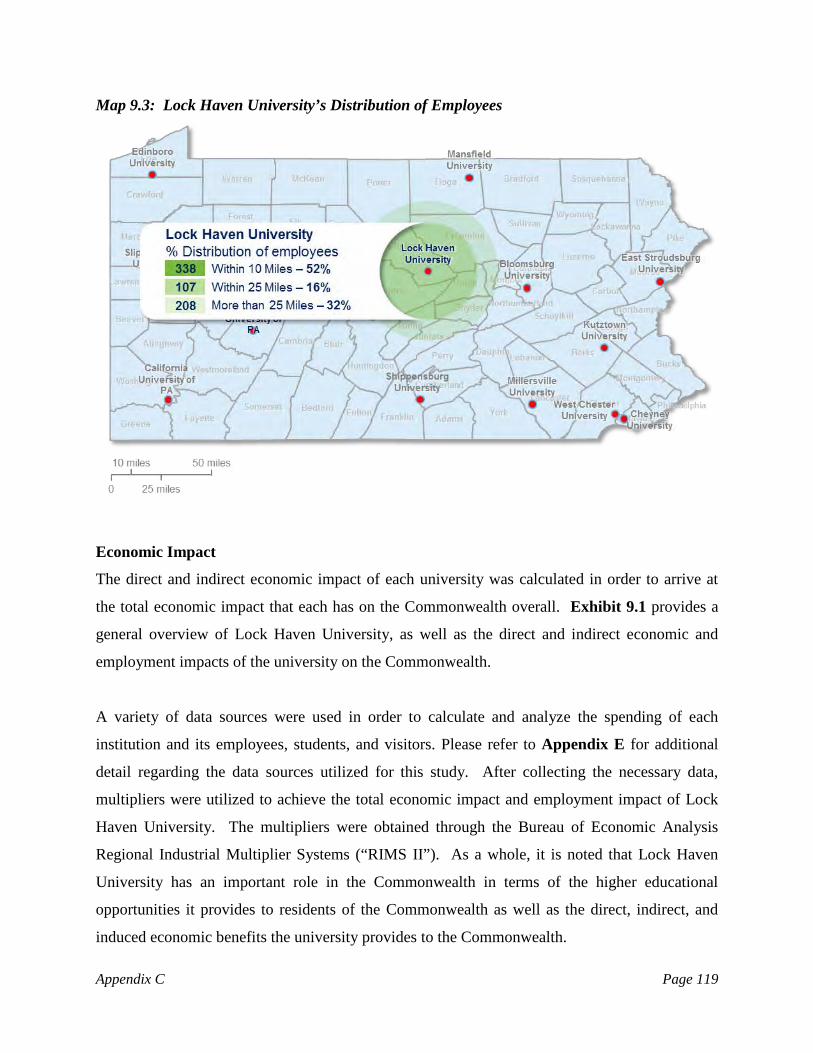
Map 9.3: Lock Haven University’s Distribution of Employees
Economic Impact
The direct and indirect economic impact of each university was calculated in order to arrive at
the total economic impact that each has on the Commonwealth overall. Exhibit 9.1 provides a
general overview of Lock Haven University, as well as the direct and indirect economic and
employment impacts of the university on the Commonwealth.
A variety of data sources were used in order to calculate and analyze the spending of each
institution and its employees, students, and visitors. Please refer to Appendix E for additional
detail regarding the data sources utilized for this study. After collecting the necessary data,
multipliers were utilized to achieve the total economic impact and employment impact of Lock
Haven University. The multipliers were obtained through the Bureau of Economic Analysis
Regional Industrial Multiplier Systems (“RIMS II”). As a whole, it is noted that Lock Haven
University has an important role in the Commonwealth in terms of the higher educational
opportunities it provides to residents of the Commonwealth as well as the direct, indirect, and
induced economic benefits the university provides to the Commonwealth.
Appendix C Page 119
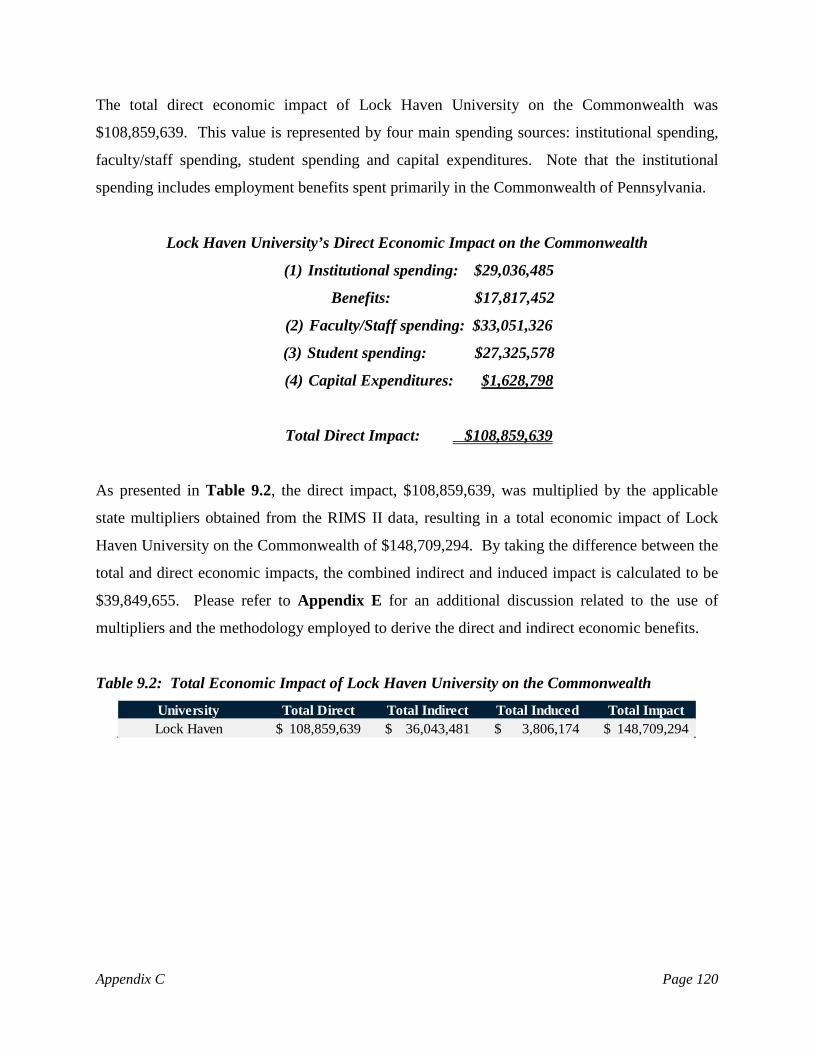
The total direct economic impact of Lock Haven University on the Commonwealth was
$108,859,639. This value is represented by four main spending sources: institutional spending,
faculty/staff spending, student spending and capital expenditures. Note that the institutional
spending includes employment benefits spent primarily in the Commonwealth of Pennsylvania.
Lock Haven University’s Direct Economic Impact on the Commonwealth
(1) Institutional spending: $29,036,485
Benefits: $17,817,452
(2) Faculty/Staff spending: $33,051,326
(3) Student spending: $27,325,578
(4) Capital Expenditures: $1,628,798
Total Direct Impact: $108,859,639
As presented in Table 9.2, the direct impact, $108,859,639, was multiplied by the applicable
state multipliers obtained from the RIMS II data, resulting in a total economic impact of Lock
Haven University on the Commonwealth of $148,709,294. By taking the difference between the
total and direct economic impacts, the combined indirect and induced impact is calculated to be
$39,849,655. Please refer to Appendix E for an additional discussion related to the use of
multipliers and the methodology employed to derive the direct and indirect economic benefits.
Table 9.2: Total Economic Impact of Lock Haven University on the Commonwealth
University Total Direct Total Indirect Total Induced Total ImpactLock Haven 108,859,639$ 36,043,481$ 3,806,174$ 148,709,294$
Appendix C Page 120
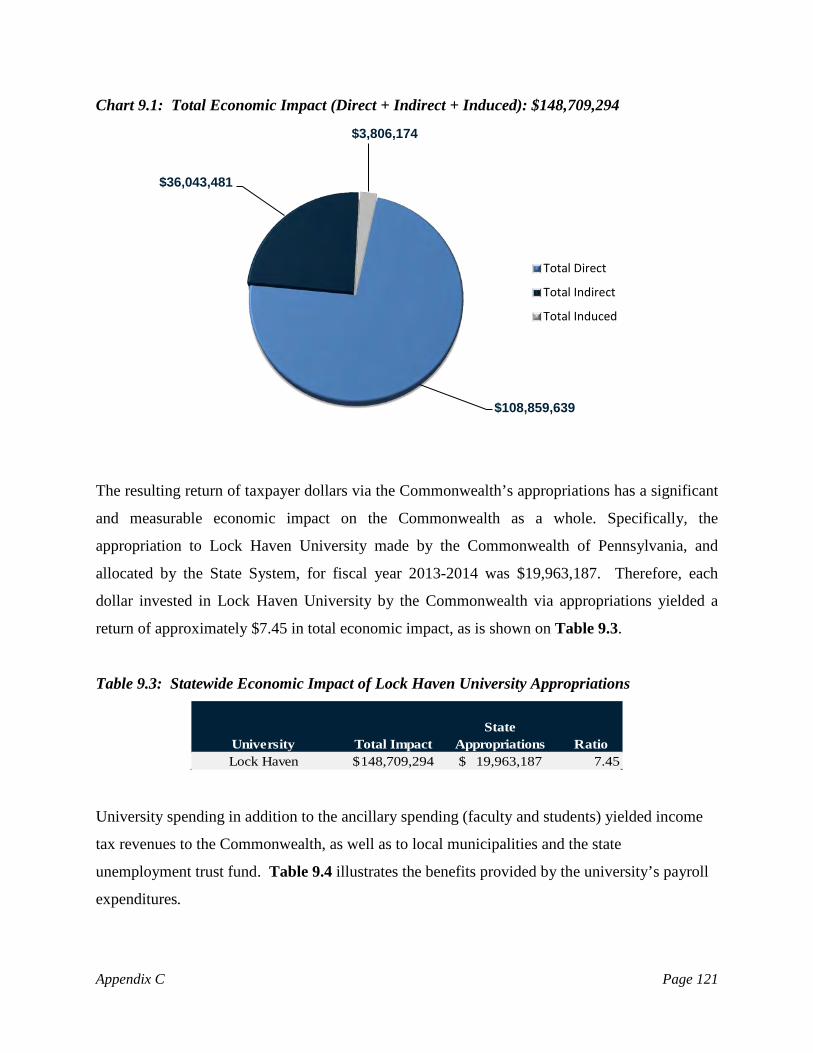
Chart 9.1: Total Economic Impact (Direct + Indirect + Induced): $148,709,294
The resulting return of taxpayer dollars via the Commonwealth’s appropriations has a significant
and measurable economic impact on the Commonwealth as a whole. Specifically, the
appropriation to Lock Haven University made by the Commonwealth of Pennsylvania, and
allocated by the State System, for fiscal year 2013-2014 was $19,963,187. Therefore, each
dollar invested in Lock Haven University by the Commonwealth via appropriations yielded a
return of approximately $7.45 in total economic impact, as is shown on Table 9.3.
Table 9.3: Statewide Economic Impact of Lock Haven University Appropriations
University Total ImpactState
Appropriations RatioLock Haven 148,709,294$ 19,963,187$ 7.45
University spending in addition to the ancillary spending (faculty and students) yielded income
tax revenues to the Commonwealth, as well as to local municipalities and the state
unemployment trust fund. Table 9.4 illustrates the benefits provided by the university’s payroll
expenditures.
$108,859,639
$36,043,481
$3,806,174
Total Direct
Total Indirect
Total Induced
Appendix C Page 121

Table 9.4: Statewide Economic Impact of Lock Haven University Payroll Tax Withholdings
UniversityState Tax
Withholdings Local EIT
Local Services
TaxUnemployment
TaxTotal Tax Payments
Lock Haven 1,200,846$ 602,999$ 38,157$ 26,821$ 1,868,823$
In addition, sales tax revenue was collected by the Commonwealth as a result of the consumption
of taxable goods and services by the university’s faculty and staff as well as students. Table 9.5
illustrates the sales tax revenue collected by the Commonwealth. Please refer to Appendix E for
an additional discussion of the methodology employed to estimate the sale tax revenue collected
by the Commonwealth.
Table 9.5: Statewide Economic Impact of Lock Haven University Sales Tax Revenue Collections
University Total Faculty and Student Spending
Spending subject to tax
Sales Tax Rate
Sales Tax Revenue
Lock Haven 85,004,643$ 20,307,609$ 6.00% 1,218,457$
In the aggregate, the revenues realized by the Commonwealth in terms of payroll tax
withholdings and sales tax receipts for Lock Haven University were $2,419,303 or 12.1 percent
of the Commonwealth’s appropriations for fiscal year 2013-2014.
The composite spending activity of the university also has a measureable effect on employment
in the Commonwealth.6 Specifically the direct spending of three categories enumerated above
helps to create jobs. The employment impact of the aggregate spending of the university and the
ancillary spending of the faculty/staff and students is measured by the RIMS II multiplier which
estimates the number of jobs created per every additional million in spending.7 Specifically, the
RIMS II state multiplier for Pennsylvania indicated that for each additional million dollars of
output by the State System universities, approximately 21.3 jobs were created or supported. In
this manner, the employment impact of Lock Haven University on the Commonwealth was
approximately 2,279 jobs, as is shown in Table 9.6.
6 Composite spending activity includes institutional, faculty and staff and student spending. 7 Please refer to Appendix E for additional information related to the RIMS II multipliers. Appendix C Page 122

Table 9.6: Statewide Employment Impact of Lock Haven University on the Commonwealth as a Result of Direct Composite Spending: 2,279 Jobs
University
Direct Composite Spending
Jobs Output
Employment Impact
Lock Haven 107,230,841 21.26 2,279
The capital expenditures of the university also help to support jobs in the region. This
employment impact is again measured using RIMS II multipliers by estimating the number of
jobs created for every additional million spent on capital expenditures. Specifically, the RIMS II
construction multiplier for Pennsylvania indicated that per each additional million dollars of
output, approximately 17.9 jobs were created or supported. In this manner, the employment
impact of Lock Haven University on the Commonwealth approximated 29 more jobs, as shown
in Table 9.7. Therefore, the total employment impact of Lock Haven University is 2,309 jobs.
Table 9.7: Statewide Employment Impact of Lock Haven University on the Commonwealth as a Result of Direct Capital Expenditures: 29 Jobs
UniversityDirect Capital Expenditures Jobs Output
Employment Impact
Lock Haven $ 1,628,798 17.94 29
The final quantified measure of economic impact would be that of volunteer hours contributed
by faculty and staff. While faculty and staff hours were not tracked, students did devote their
time to helping the community. Lock Haven students spent a total of 59,189 and 58,065 hours
volunteering, in 2013 and 2014, respectively. It is likely that the students’ participation was
required by university curricular and co-curricular programs, some of which either required
supervision or a faculty team leader.
Economic Development
Economic development involves improvements to the standard of living through the creation of
jobs and the support of innovation and new research in a community’s region, state, or nation.
The State System plays a role in enhancing the economic development of the regions in which
the individual universities reside by assisting in the development and growth of new and existing
businesses, as well as increasing the employment opportunities, both of which increase economic
Appendix C Page 123

activity in the respective areas. The universities accomplish this in various ways, such as
partnering with local businesses, providing education and job skills training, providing an outlet
for research and development through incubators, and by providing financial and technical
assistance.
The goal of Pennsylvania’s State System of Higher Education and its 14 universities is
fundamentally to educate the citizens of the Commonwealth. By providing higher education, the
universities are not only helping to improve the economic development in the short-term, but in
the long-run as well. Therefore, by way of establishing and accomplishing its mission,
Pennsylvania’s State System is benefiting the economic advancement of the Commonwealth.
Primarily, the State System does this through the granting of undergraduate and graduate
degrees, but also does so indirectly through its purchasing, expenditures, services, and by
employing hundreds, even thousands, of people.
Overall, Pennsylvania’s State System of Higher Education is a key player in supporting the
economic development and growth of communities, counties, regions, and the Commonwealth
overall. By providing sources of innovation and entrepreneurial assistance, the State System
supplies economic growth to local businesses along with highly skilled and educated candidate
employees. Through its various economic development activities, Lock Haven University
successfully provides an economic competitive advantage for the county and the Commonwealth
as a whole.
Lock Haven University’s participation in WEDnetPA program had over 5,300 participants and
had a total of $257,510 funds awarded in 2014. Additionally, Lock Haven University has a
Small Business Development Center (SBDC). It was established to promote growth, expansion,
innovation, increased productivity and management improvement in existing small businesses in
Clinton and Lycoming Counties. Along with consulting services, Lock Haven’s SBDC offers
training seminars, which aim to teach small businesses owners and their employees about topics
they would use daily to strengthen their ability to compete in today’s highly competitive business
Appendix C Page 124
world.8 Through these efforts, Lock Haven University is positively impacting the economic
development in its home county, Clinton County, and many other surrounding counties.
8 “Small Business Development Center: Lock Haven University”, ihup.edu, visited February 25, 2015. Appendix C Page 125

Exhibit 9.1
Location: CountyFaculty and Staff Headcount Paid in 2014
Fall 2013 Fall 2014Undergraduate 4,855 4,521 Graduate 405 396 Total 5,260 4,917
Full-time 4,723 4,381 Part-time 537 536 Total 5,260 4,917
PA residents 4,890 4,584 Non-residents 370 333 Total 5,260 4,917
Traditional undergraduate (students under 25) 4,430 4,124 Non-traditional undergraduate (students over 25) 425 397 Total (undergraduate only) 4,855 4,521
Room & BoardTuition FeesTotal
Room & BoardTuitionFeesTotal
Tuition (per 3 credits)Fees (per 3 credits)¹Total
Tuition (per 3 credits)Fees (per 3 credits)Total
Tuition from undergraduate in-state studentsTuition from undergraduate out-of-state studentsTuition from graduate in-state studentsTuition from graduate out-of-state studentsTotal
EnrollmentEnrollment Characteristics
Undergraduate, Out-of-State, FY 2014-2015
8,752$ 6,820 2,457
18,029$
Cost of AttendanceUndergraduate, In-State, FY 2014-2015
8,752$
2,647$
15,050
1,362$ 437
Lock Haven University Information
Tuition29,772,250$ 4,549,406 3,730,198 1,355,322
2,677 26,479$
Graduate, Out-of-State, FY 2014-2015
Graduate, In-State, FY 2014-2015
39,407,176$
1,799$
Clinton653
2,043$ 604
Financial CharacteristicsRevenues, FY 2013-2014
Appendix C Page 126
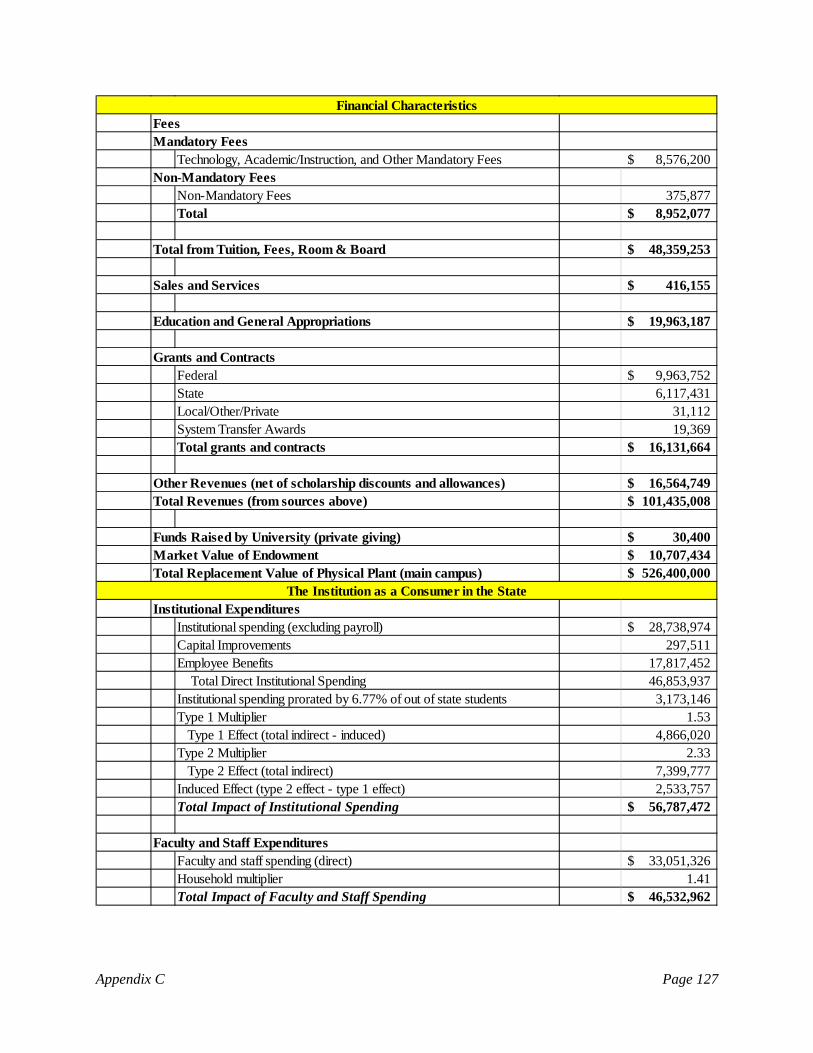
Technology, Academic/Instruction, and Other Mandatory Fees
Non-Mandatory Fees 375,877 Total 8,952,077$
Total from Tuition, Fees, Room & Board 48,359,253$
416,155$
19,963,187$
Federal 9,963,752$ State 6,117,431 Local/Other/Private 31,112 System Transfer Awards 19,369 Total grants and contracts 16,131,664$
16,564,749$ Total Revenues (from sources above) 101,435,008$
30,400$ 10,707,434$
526,400,000$
Institutional ExpendituresInstitutional spending (excluding payroll) 28,738,974$ Capital Improvements 297,511 Employee Benefits 17,817,452
Total Direct Institutional Spending 46,853,937 Institutional spending prorated by 6.77% of out of state students 3,173,146 Type 1 Multiplier 1.53
Type 1 Effect (total indirect - induced) 4,866,020 Type 2 Multiplier 2.33
Type 2 Effect (total indirect) 7,399,777 Induced Effect (type 2 effect - type 1 effect) 2,533,757 Total Impact of Institutional Spending 56,787,472$
Faculty and Staff ExpendituresFaculty and staff spending (direct) 33,051,326$ Household multiplier 1.41 Total Impact of Faculty and Staff Spending 46,532,962$
The Institution as a Consumer in the State
Non-Mandatory Fees8,576,200$
Financial Characteristics
Mandatory Fees
Total Replacement Value of Physical Plant (main campus)
Fees
Market Value of Endowment
Sales and Services
Education and General Appropriations
Grants and Contracts
Other Revenues (net of scholarship discounts and allowances)
Funds Raised by University (private giving)
Appendix C Page 127

Student ExpendituresStudent spending (direct) 27,325,578$ Household multiplier 1.41 Total Impact of Student Spending 38,471,681
Capital ExpendituresCapital Improvements - 5 year weighted average 900,000$ Deferred Maintenance 728,798
Total Direct Capital Expenditures 1,628,798 Type 1 Multiplier 1.68
Type 1 Effect (total indirect - induced) 2,743,547 Type 2 Multiplier 2.47
Type 2 Effect (total indirect) 4,015,964 Induced Effect (type 2 effect - type 1 effect) 1,272,417 Total Impact of Capital Expenditures 6,917,179$
Employment impact for the CommonwealthDirect composite expenditures for the Commonwealth 107,230,841$ State multiplier 21.26Statewide Employment Impact based on Composite Spending (jobs) 2,279 Direct capital expenditures for the Commonwealth 1,628,798$ State multiplier 17.94Statewide Employment Impact based on Direct Expenditures (jobs) 29Total Employment Impact 2,309
In-Kind (Volunteer) Contributions to Regional EconomyAnnual volunteer hours of faculty and staff N/AAverage market value of volunteer hours (per hour) N/AEstimated total contribution of faculty and staff N/AAnnual volunteer hours of students (2014) 58,065
Small Business IncubatorSmall Business Development CenterPatents filed since January 1, 2010¹
Sales TaxTotal Faculty and Staff and Student Spending 85,004,643$ Imputed % of taxable spending 23.89%Spending subject to tax 20,307,609 Sales tax rate 6%Total State Sales Tax Revenue Generation 1,218,457$
The Institution as a Consumer in the State
The Institution as an Employer
The University as a Center for Volunteerism
Business and Economic Development Services
The University as a Generator of State Government Revenue
NoYes
1
Appendix C Page 128

Payroll TaxTotal payroll 40,061,321$ State tax withholdings 1,200,846 Local EIT 602,999 Local Services Tax 38,157 Unemployment tax 26,821 Total Payroll Tax Payments 1,868,823$
¹As of March 2013, Lock Haven University has an additional patent in process.
The University as a Generator of State Government Revenue
Appendix C Page 129

Mansfield University of Pennsylvania Tioga County, PA
Mansfield University is a small, rural, public, liberal arts institution located in the beautiful
mountains of North Central Pennsylvania. Mansfield Classical Seminary opened its doors in
January, 1857, four years before the beginning of the Civil War. Over the next 157 years, the
institution has thrived, experiencing five name changes in three centuries. Mansfield University
prides itself on developing leaders by focusing on four core values: Character, Scholarship,
Culture, and Service by incorporating them into the institution’s creed, which reads: “Character
as the essential, Scholarship as the means, Culture as the enrichment, and Service as the end of
all worthy endeavors.” For the 2014-2015 academic year, the university has 2,752 total students
enrolled, of which 2,587 are undergraduates.
Map 10.1 demonstrates these students come from all across the state, thus contributing to the economic impact of the State System.
Appendix C Page 130

Mansfield University is renowned for playing the first-ever college football game at night in
1892. Today, it is the only public university to compete in the Collegiate Sprint Football
League. Brigadier General Francis L. Hendricks, who served for five years as commander and
deputy commander of the Army and Air Force Exchange Service in Dallas, TX, was selected by
the Board of Governors of Pennsylvania’s State System of Higher Education to be the president
of Mansfield University in October 2012.1
Map 10.2 demonstrates Mansfield University’s alumni that still reside in the Commonwealth.
Mansfield University is located in Tioga County, PA which has 1,133.8 sq. miles in land area
and a population density of 37.5 per square mile. In 2013, 42,463 lived in Tioga, which was a
1.1 percent increase in population since the last census in 2010. The average household size is
2.4 persons compared to an average family size of 2.8 persons. In 2010, 99 percent of the
population reported only one race on the census, with 0.8 percent of these reporting African-
American. The population of this county is one percent Hispanic (of any race). In 2013,
1 Excerpts obtained from Mansfield University’s website, www.mansfield.edu. Appendix C Page 131
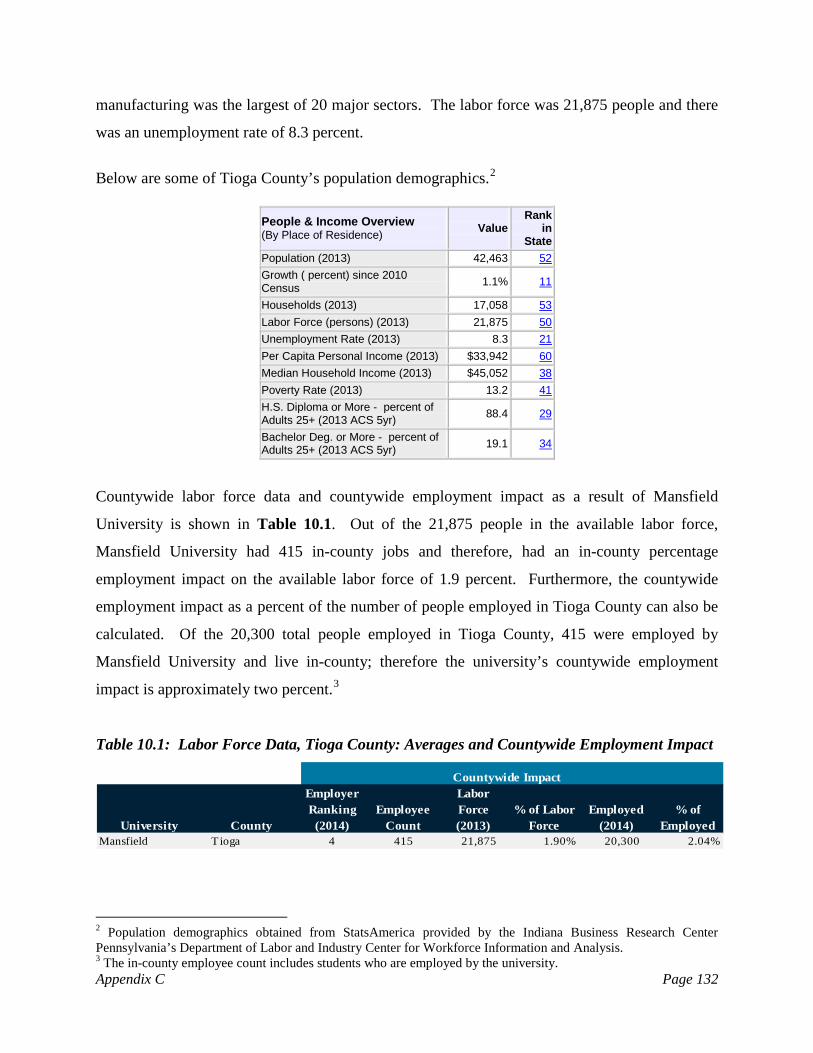
manufacturing was the largest of 20 major sectors. The labor force was 21,875 people and there
was an unemployment rate of 8.3 percent.
Below are some of Tioga County’s population demographics.2
People & Income Overview (By Place of Residence) Value
Rank in
State Population (2013) 42,463 52
Growth ( percent) since 2010 Census 1.1% 11
Households (2013) 17,058 53
Labor Force (persons) (2013) 21,875 50
Unemployment Rate (2013) 8.3 21
Per Capita Personal Income (2013) $33,942 60
Median Household Income (2013) $45,052 38
Poverty Rate (2013) 13.2 41
H.S. Diploma or More - percent of Adults 25+ (2013 ACS 5yr) 88.4 29
Bachelor Deg. or More - percent of Adults 25+ (2013 ACS 5yr) 19.1 34
Countywide labor force data and countywide employment impact as a result of Mansfield
University is shown in Table 10.1. Out of the 21,875 people in the available labor force,
Mansfield University had 415 in-county jobs and therefore, had an in-county percentage
employment impact on the available labor force of 1.9 percent. Furthermore, the countywide
employment impact as a percent of the number of people employed in Tioga County can also be
calculated. Of the 20,300 total people employed in Tioga County, 415 were employed by
Mansfield University and live in-county; therefore the university’s countywide employment
impact is approximately two percent.3
Table 10.1: Labor Force Data, Tioga County: Averages and Countywide Employment Impact
Countywide Impact
University County
Employer Ranking (2014)
Employee Count
Labor Force (2013)
% of Labor Force
Employed (2014)
% of Employed
Mansfield Tioga 4 415 21,875 1.90% 20,300 2.04%
2 Population demographics obtained from StatsAmerica provided by the Indiana Business Research Center Pennsylvania’s Department of Labor and Industry Center for Workforce Information and Analysis. 3 The in-county employee count includes students who are employed by the university. Appendix C Page 132
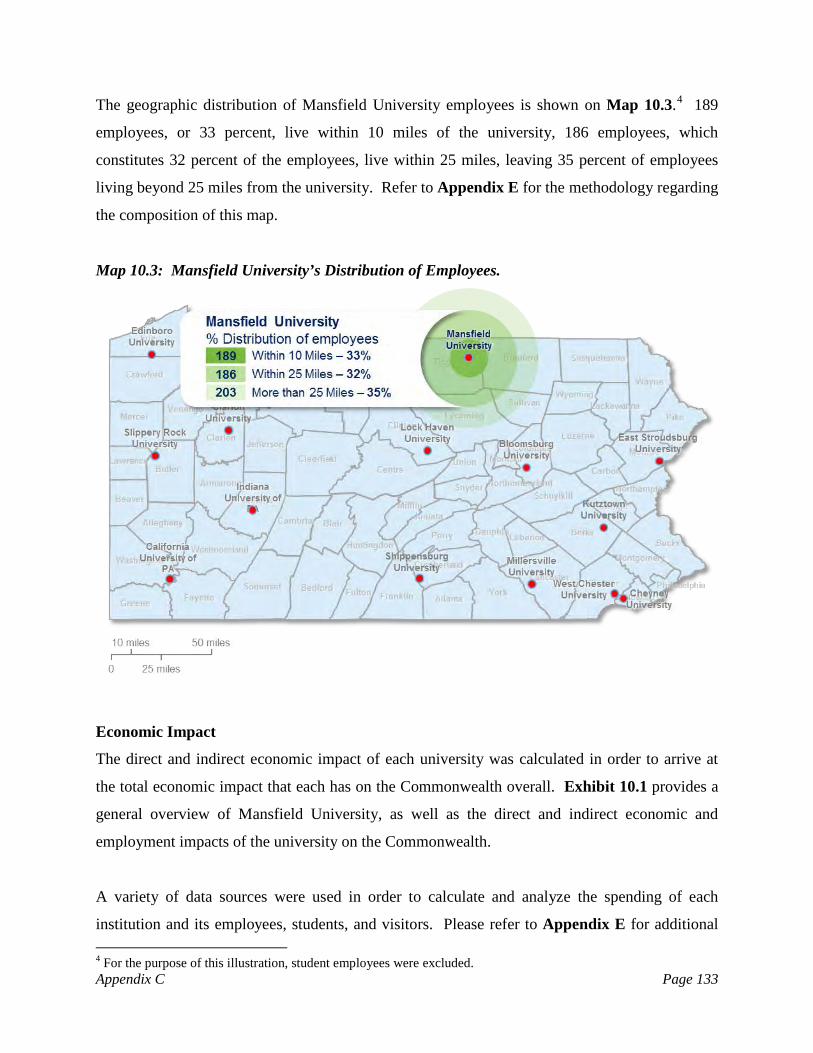
The geographic distribution of Mansfield University employees is shown on Map 10.3.4 189
employees, or 33 percent, live within 10 miles of the university, 186 employees, which
constitutes 32 percent of the employees, live within 25 miles, leaving 35 percent of employees
living beyond 25 miles from the university. Refer to Appendix E for the methodology regarding
the composition of this map.
Map 10.3: Mansfield University’s Distribution of Employees.
Economic Impact
The direct and indirect economic impact of each university was calculated in order to arrive at
the total economic impact that each has on the Commonwealth overall. Exhibit 10.1 provides a
general overview of Mansfield University, as well as the direct and indirect economic and
employment impacts of the university on the Commonwealth.
A variety of data sources were used in order to calculate and analyze the spending of each
institution and its employees, students, and visitors. Please refer to Appendix E for additional
4 For the purpose of this illustration, student employees were excluded. Appendix C Page 133

detail regarding the data sources utilized for this study. After collecting the necessary data,
multipliers were utilized to achieve the total economic impact and employment impact of
Mansfield University. The multipliers were obtained through the Bureau of Economic Analysis
Regional Industrial Multiplier Systems (“RIMS II”). As a whole, it is noted that Mansfield
University has an important role in the Commonwealth in terms of the higher educational
opportunities it provides to residents of the Commonwealth as well as the direct, indirect, and
induced economic benefits the university provides to the Commonwealth.
The total direct economic impact of Mansfield University on the Commonwealth was
$70,189,054. This value is represented by four main spending sources: institutional spending,
faculty/staff spending, student spending, and capital expenditures. Note that the institutional
spending includes employment benefits spent primarily in the Commonwealth of Pennsylvania.
Mansfield University’s Direct Economic Impact on the Commonwealth
(1) Institutional spending: $20,281,855
Benefits: $13,479,194
(2) Faculty/Staff spending: $24,177,795
(3) Student spending: $9,441,184
(4) Capital Expenditures: $2,809,026
Total Direct Impact: $70,189,054
As presented in Table 10.2, the direct impact, $70,189,054, was multiplied by the applicable
state multipliers obtained from the RIMS II data, resulting in a total economic impact of
Mansfield University on the Commonwealth of $111,802,341. By taking the difference between
the total and direct economic impacts, the combined indirect and induced impact is calculated to
be $41,613,287. Please refer to Appendix E for an additional discussion related to the use of
multipliers and the methodology employed to derive the direct and indirect economic benefits.
Table 10.2: Total Economic Impact of Mansfield University on the Commonwealth University Total Direct Total Indirect Total Induced Total ImpactMansfield 70,189,054$ 34,628,703$ 6,984,585$ 111,802,341$
Appendix C Page 134

Chart 10.1: Total Economic Impact (Direct + Indirect + Induced): $111,802,341
The resulting return of taxpayer dollars via the Commonwealth’s appropriations has a significant
and measurable economic impact on the Commonwealth as a whole. Specifically, the
appropriations to Mansfield University made by the Commonwealth of Pennsylvania, and
allocated by the State System, for fiscal year 2013-2014 was $16,702,905. Therefore, each
dollar invested in Mansfield University by the Commonwealth via appropriations yielded a
return of approximately $6.69 in total economic impact, as is shown on Table 10.3.
Table 10.3: Statewide Economic Impact of Mansfield University Appropriations
University Total ImpactState
Appropriations RatioMansfield 111,802,341$ 16,702,905$ 6.69
University spending in addition to the ancillary spending (faculty and students) yielded income
tax revenues to the Commonwealth, as well as to local municipalities and the state
unemployment trust fund. Table 10.4 illustrates the benefits provided by the university’s payroll
expenditures.
$70,189,054
$34,628,703
$6,984,585
Total Direct
Total Indirect
Total Induced
Appendix C Page 135

Table 10.4: Statewide Economic Impact of Mansfield University Payroll Tax Withholdings
UniversityState Tax
Withholdings Local EIT
Local Services
TaxUnemployment
TaxTotal Tax Payments
Mansfield 833,113$ 408,587$ 34,338$ 18,729$ 1,294,767$
In addition, sales tax revenue was collected by the Commonwealth as a result of the consumption
of taxable goods and services by the university’s faculty and staff, as well as students. Table
10.5 illustrates the sales tax revenue collected by the Commonwealth. Please refer to Appendix
E for an additional discussion of the methodology employed to estimate the sale tax revenue
collected by the Commonwealth.
Table 10.5: Statewide Economic Impact of Mansfield University Sales Tax Revenue Collections
University Total Faculty and Student Spending
Spending subject to tax
Sales Tax Rate
Sales Tax Revenue
Mansfield 41,332,161$ 11,307,653$ 6.00% 678,459$
In the aggregate, the revenues realized by the Commonwealth in terms of payroll tax
withholdings and sales tax receipts for Mansfield University were $1,511,573 or nine percent of
the Commonwealth’s appropriations for fiscal year 2013-2014.
The composite spending activity of the university also has a measureable effect on employment
in the Commonwealth.5 Specifically the direct spending of three categories enumerated above
helps to create jobs. The employment impact of the aggregate spending of the university and the
ancillary spending of the faculty/staff and students is measured by the RIMS II multiplier which
estimates the number of jobs created per every additional million in spending.6 Specifically, the
RIMS II state multiplier for Pennsylvania indicated that for each additional million dollars of
output by the State System universities, approximately 21.3 jobs were created or supported. In
this manner, the employment impact of Mansfield University on the Commonwealth
approximated 1,432 jobs, as is shown in Table 10.6.
5 Composite spending activity includes institutional, faculty and staff and student spending. 6 Please refer to Appendix E for additional information related to the RIMS II multipliers. Appendix C Page 136
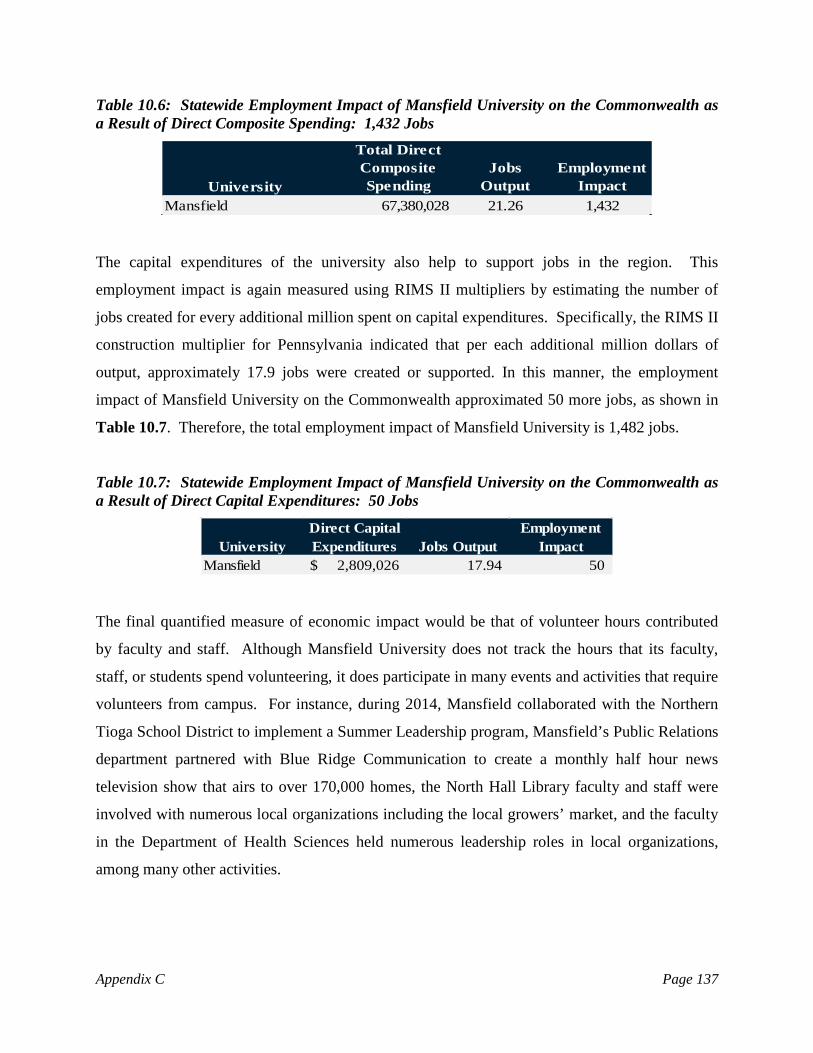
Table 10.6: Statewide Employment Impact of Mansfield University on the Commonwealth as a Result of Direct Composite Spending: 1,432 Jobs
University
Total Direct Composite Spending
Jobs Output
Employment Impact
Mansfield 67,380,028 21.26 1,432
The capital expenditures of the university also help to support jobs in the region. This
employment impact is again measured using RIMS II multipliers by estimating the number of
jobs created for every additional million spent on capital expenditures. Specifically, the RIMS II
construction multiplier for Pennsylvania indicated that per each additional million dollars of
output, approximately 17.9 jobs were created or supported. In this manner, the employment
impact of Mansfield University on the Commonwealth approximated 50 more jobs, as shown in
Table 10.7. Therefore, the total employment impact of Mansfield University is 1,482 jobs.
Table 10.7: Statewide Employment Impact of Mansfield University on the Commonwealth as a Result of Direct Capital Expenditures: 50 Jobs
UniversityDirect Capital Expenditures Jobs Output
Employment Impact
Mansfield $ 2,809,026 17.94 50
The final quantified measure of economic impact would be that of volunteer hours contributed
by faculty and staff. Although Mansfield University does not track the hours that its faculty,
staff, or students spend volunteering, it does participate in many events and activities that require
volunteers from campus. For instance, during 2014, Mansfield collaborated with the Northern
Tioga School District to implement a Summer Leadership program, Mansfield’s Public Relations
department partnered with Blue Ridge Communication to create a monthly half hour news
television show that airs to over 170,000 homes, the North Hall Library faculty and staff were
involved with numerous local organizations including the local growers’ market, and the faculty
in the Department of Health Sciences held numerous leadership roles in local organizations,
among many other activities.
Appendix C Page 137

Economic Development
Economic development involves improvements to the standard of living through the creation of
jobs and the support of innovation and new research in a community’s region, state, or nation.
The State System plays a role in enhancing the economic development of the regions in which
the individual universities reside by assisting in the development and growth of new and existing
businesses, as well as increasing the employment opportunities, both of which increase economic
activity in the respective areas. The universities accomplish this in various ways, such as
partnering with local businesses, providing education and job skills training, providing an outlet
for research and development through incubators, and by providing financial and technical
assistance.
The goal of Pennsylvania’s State System of Higher Education and its fourteen universities is
fundamentally to educate the citizens of the Commonwealth. By providing higher education, the
universities are not only helping to improve the economic development in the short-term, but in
the long-run as well. Therefore, by way of establishing and accomplishing its mission,
Pennsylvania’s State System is benefiting the economic advancement of the Commonwealth.
Primarily, the State System does this through the granting of undergraduate and graduate
degrees, but also does so indirectly through its purchasing, expenditures, services, and by
employing hundreds, even thousands, of people.
Overall, Pennsylvania’s State System of Higher Education is a key player in supporting the
economic development and growth of communities, counties, regions, and the Commonwealth
overall. By providing sources of innovation and entrepreneurial assistance, the State System
supplies economic growth to local businesses along with highly skilled and educated candidate
employees. Through its various economic development activities, Mansfield University
successfully provides an economic competitive advantage for the county and the Commonwealth
as a whole.
While Mansfield University does not participate in the WEDnetPA program, the university
offers other workforce development programs to help stimulate economic development.
Mansfield partakes in job fairs, holds a business expo, and has a camp aimed at teaching students
about shale gas development and the job opportunities available. By way of these efforts, Appendix C Page 138

Mansfield University is contributing to the economic development of Tioga County, as well as
the counties that surround it.
Appendix C Page 139

Exhibit 10.1
Location: CountyFaculty and Staff Headcount Paid in 2014
Fall 2013 Fall 2014Undergraduate 2,717 2,587 Graduate 253 165 Total 2,970 2,752
Full-time 2,477 2,354 Part-time 493 398 Total 2,970 2,752
PA residents 2,309 2,263 Non-residents 661 489 Total 2,970 2,752
Traditional undergraduate (students under 25) 2,388 2,274 Non-traditional undergraduate (students over 25) 329 312 Total (undergraduate only)¹ 2,717 2,586
Room & BoardTuitionFeesTotal
Room & BoardTuitionFeesTotal
Tuition (per credit)Fees (per credit)²Total
Tuition (per credit)Fees (per credit)²Total
Tuition from undergraduate in-state studentsTuition from undergraduate out-of-state studentsTuition from graduate in-state studentsTuition from graduate out-of-state studentsTotal
Tioga578
Mansfield University Information
Tuition13,928,151$ 6,275,994
785,936 704,727
2,926 30,558$
Graduate, Out-of-State, FY 2014-2015
Graduate, In-State, FY 2014-2015
21,694,808$
865$
681$ 423
Financial CharacteristicsRevenues, FY 2013-2014
Enrollment Characteristics
Undergraduate, Out-of-State, FY 2014-2015
10,582$ 6,820 2,706
20,108$
10,582$
1,104$
17,050
454$ 411
Cost of Attendance
Enrollment
Undergraduate, In-State, FY 2014-2015
Appendix C Page 140
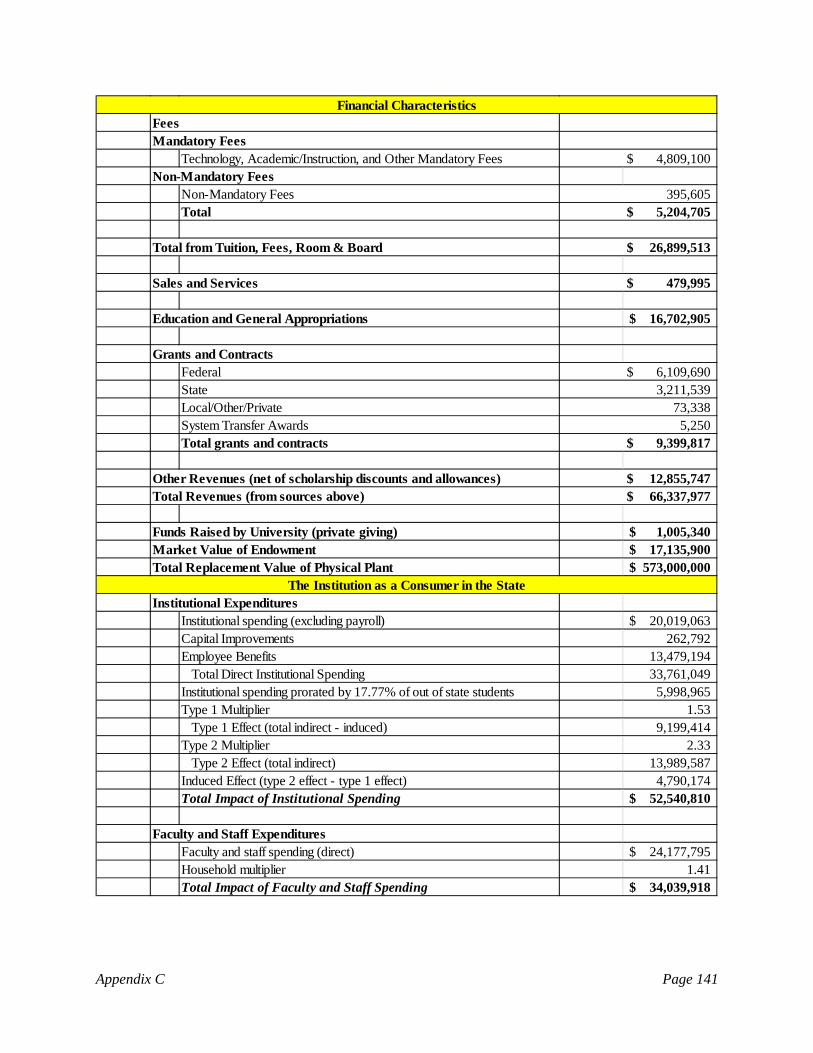
Technology, Academic/Instruction, and Other Mandatory Fees
Non-Mandatory FeesTotal
Total from Tuition, Fees, Room & Board
16,702,905$
FederalStateLocal/Other/PrivateSystem Transfer AwardsTotal grants and contracts
Total Revenues (from sources above)
1,005,340$ 17,135,900$
573,000,000$
Institutional ExpendituresInstitutional spending (excluding payroll) 20,019,063$ Capital Improvements 262,792 Employee Benefits 13,479,194
Total Direct Institutional Spending 33,761,049 Institutional spending prorated by 17.77% of out of state students 5,998,965 Type 1 Multiplier 1.53
Type 1 Effect (total indirect - induced) 9,199,414 Type 2 Multiplier 2.33
Type 2 Effect (total indirect) 13,989,587 Induced Effect (type 2 effect - type 1 effect) 4,790,174 Total Impact of Institutional Spending 52,540,810$
Faculty and Staff ExpendituresFaculty and staff spending (direct) 24,177,795$ Household multiplier 1.41 Total Impact of Faculty and Staff Spending 34,039,918$
9,399,817$
12,855,747$
Total Replacement Value of Physical Plant
5,204,705$
26,899,513$
Sales and Services
Education and General Appropriations
Grants and Contracts
Other Revenues (net of scholarship discounts and allowances)
Funds Raised by University (private giving)
479,995$
6,109,690$
395,605
Financial Characteristics
73,338
FeesMandatory Fees
4,809,100$
The Institution as a Consumer in the State
Market Value of Endowment
3,211,539
66,337,977$
5,250
Non-Mandatory Fees
Appendix C Page 141
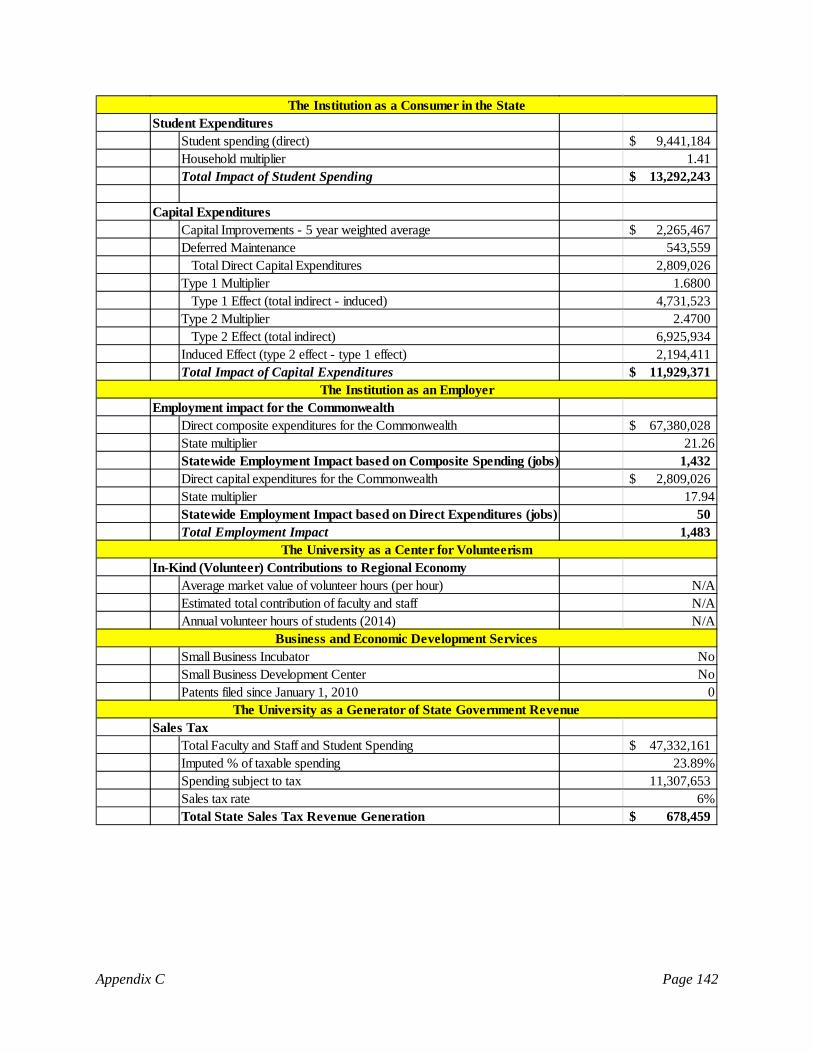
Student ExpendituresStudent spending (direct) 9,441,184$ Household multiplier 1.41 Total Impact of Student Spending 13,292,243$
Capital ExpendituresCapital Improvements - 5 year weighted average 2,265,467$ Deferred Maintenance 543,559
Total Direct Capital Expenditures 2,809,026 Type 1 Multiplier 1.6800
Type 1 Effect (total indirect - induced) 4,731,523 Type 2 Multiplier 2.4700
Type 2 Effect (total indirect) 6,925,934 Induced Effect (type 2 effect - type 1 effect) 2,194,411 Total Impact of Capital Expenditures 11,929,371$
Employment impact for the CommonwealthDirect composite expenditures for the Commonwealth 67,380,028$ State multiplier 21.26Statewide Employment Impact based on Composite Spending (jobs) 1,432 Direct capital expenditures for the Commonwealth 2,809,026$ State multiplier 17.94Statewide Employment Impact based on Direct Expenditures (jobs) 50 Total Employment Impact 1,483
In-Kind (Volunteer) Contributions to Regional EconomyAverage market value of volunteer hours (per hour) N/AEstimated total contribution of faculty and staff N/AAnnual volunteer hours of students (2014) N/A
Small Business IncubatorSmall Business Development CenterPatents filed since January 1, 2010
Sales TaxTotal Faculty and Staff and Student Spending 47,332,161$ Imputed % of taxable spending 23.89%Spending subject to tax 11,307,653 Sales tax rate 6%Total State Sales Tax Revenue Generation 678,459$
The Institution as an Employer
The University as a Center for Volunteerism
Business and Economic Development Services
The University as a Generator of State Government Revenue
NoNo
0
The Institution as a Consumer in the State
Appendix C Page 142
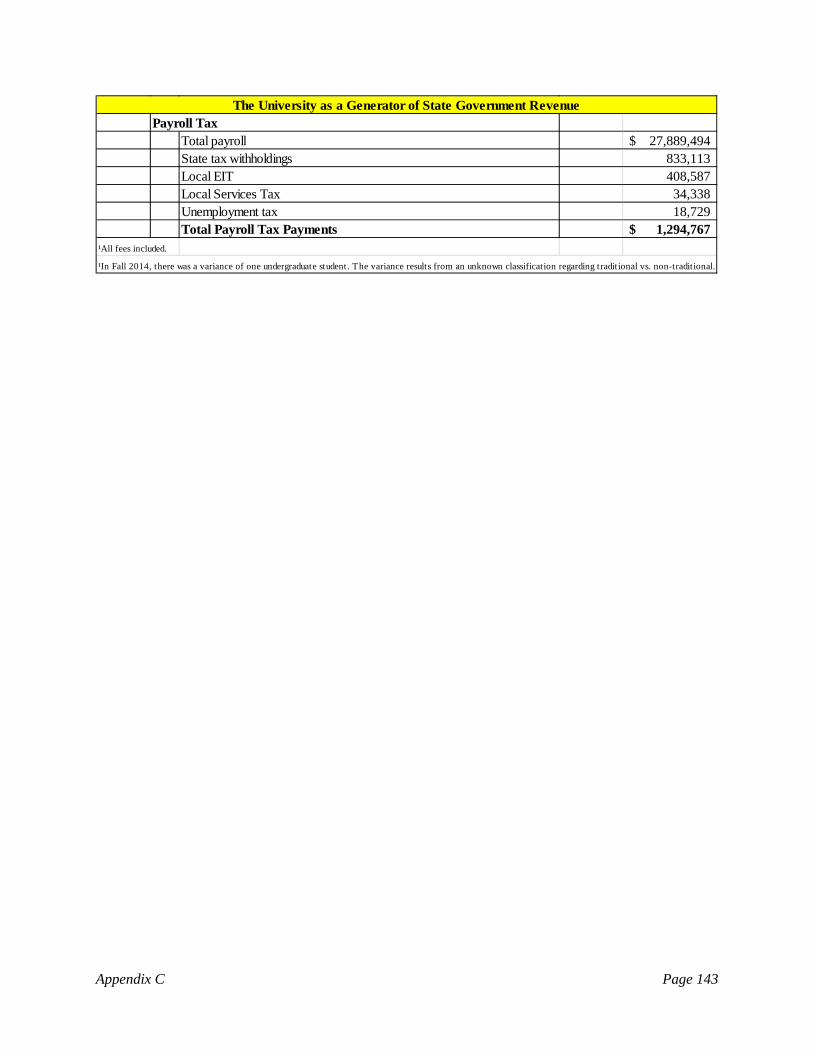
Payroll TaxTotal payroll 27,889,494$ State tax withholdings 833,113 Local EIT 408,587 Local Services Tax 34,338 Unemployment tax 18,729 Total Payroll Tax Payments 1,294,767$
¹All fees included.
¹In Fall 2014, there was a variance of one undergraduate student. The variance results from an unknown classification regarding traditional vs. non-traditional.
The University as a Generator of State Government Revenue
Appendix C Page 143

Millersville University of Pennsylvania Lancaster, PA
Millersville University was founded in 1855 as Lancaster County Normal School; it was not for
another 100 years that it would receive university status in 1983 as Millersville University. As
of the fall 2014 semester there were 7,171 students enrolled in an undergraduate program and
876 enrolled in graduate studies. Of those students, approximately 95 percent were Pennsylvania
residents. Furthermore, of the 64,000 alumni Millersville has, 79 percent of them continue to
live in Pennsylvania. Of the full-time instructional faculty, 98 percent hold a Ph.D. or terminal
degree.
Map 11.1 demonstrates these students come from all across the state, thus contributing to the
economic impact of the State System.
The university offers 19 intercollegiate varsity sports plus a wide array of intramural and club
programs. Millersville’s mission is to provide diverse, dynamic, meaningful experiences to
inspire learners to grow both intellectually and personally to enable them to contribute positively
Appendix C Page 144

to local and global communities. In November 2012, Dr. John M. Anderson was chosen as the
14th president of Millersville University.1
Map 11.2 demonstrates Millersville University’s alumni that still reside in the Commonwealth.
Lancaster County contains 943.8 sq. miles in land area and has a population density of 561.1 per
square mile. As of 2013, there are 529,600 people living in Lancaster, which is a two percent
increase since 2010. The average household size is 2.6 persons compared to an average family
size of 3.1 persons. On the most recent census form, 98 percent of the population reported only
one race, with 3.7 percent of these reporting African-American. The population of this county is
8.6 percent Hispanic (of any race). The labor force in 2013 was 268,570 people and Lancaster
had an unemployment rate of 6.1 percent. Also in 2013, manufacturing was the largest of 20
major sectors.
1 Excerpts obtained from Millersville University’s website, www.millersville.edu. Appendix C Page 145

Below are some of Lancaster County’s population demographics.2
People & Income Overview (By Place of Residence) Value
Rank in
State Population (2013) 529,600 6
Growth ( percent) since 2010 Census 2.0% 3
Households (2013) 194,082 6
Labor Force (persons) (2013) 268,570 7
Unemployment Rate (2013) 6.1 61
Per Capita Personal Income (2013) $41,116 21
Median Household Income (2013) $56,766 11
Poverty Rate (2013) 10.5 56
H.S. Diploma or More - percent of Adults 25+ (2013 ACS 5yr) 83.9 62
Bachelor Deg. or More - percent of Adults 25+ (2013 ACS 5yr) 24.2 17
Countywide labor force data and countywide employment impact as a result of Millersville
University is shown in Table 11.1. Out of the 268,570 people in the available labor force,
Millersville University had 1,481 in-county jobs and therefore, had an in-county percentage
employment impact on the available labor force of approximately 0.6 percent. Furthermore, the
countywide employment impact as a percent of the number of people employed in Lancaster
County can also be calculated. Of the 254,300 total people employed in Lancaster County, 1,481
were employed by Millersville University and live in-county; therefore the university’s
countywide employment impact is approximately 0.7 percent.3
Table 11.1: Labor Force Data, Lancaster County: Averages and Countywide Employment Impact
Countywide Impact
University County
Employer Ranking (2014)
Employee Count
Labor Force (2013)
% of Labor Force
Employed (2014)
% of Employed
Millersville Lancaster 26 1,481 268,570 0.55% 254,300 0.58%
The geographic distribution of Millersville University employees is shown on Map 11.3.4 832
employees, or 67 percent, live within 10 miles of the university, 218 employees, which
constitutes 18 percent of the employees, live within 25 miles, leaving 15 percent of employees
2 Population demographics obtained from StatsAmerica provided by the Indiana Business Research Center Pennsylvania’s Department of Labor and Industry Center for Workforce Information and Analysis. 3 The in-county employee count includes students who are employed by the university. 4 For the purpose of this illustration, student employees were excluded. Appendix C Page 146
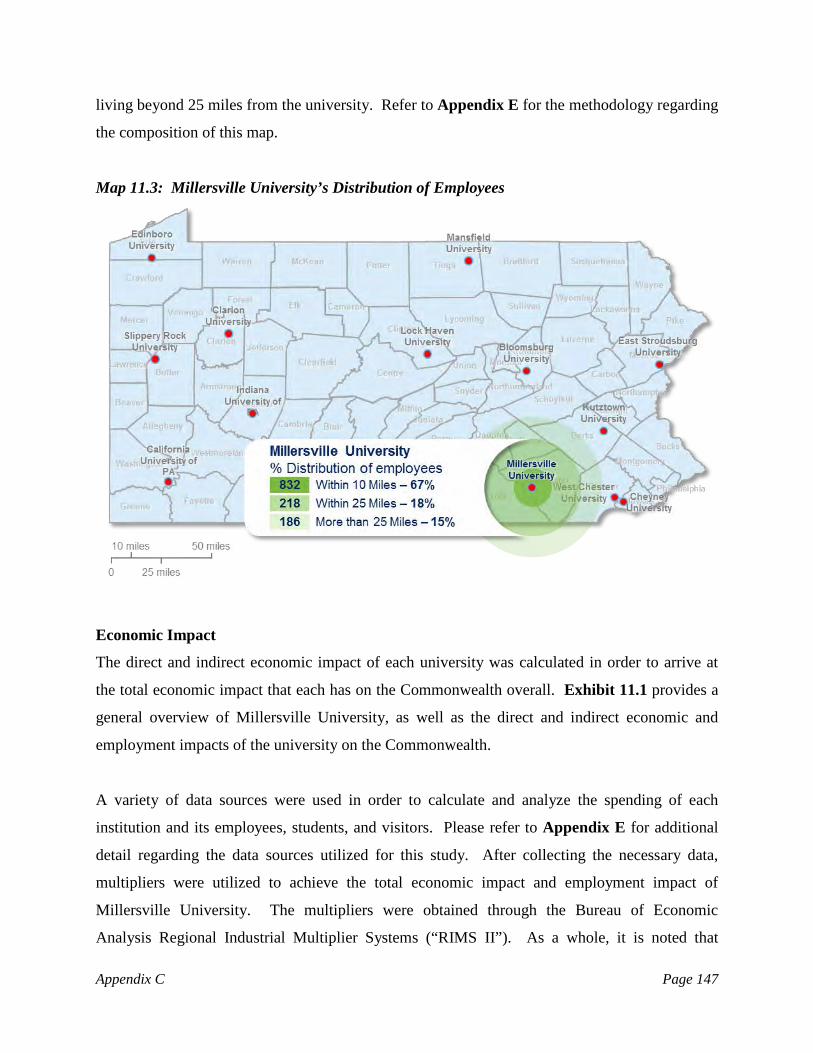
living beyond 25 miles from the university. Refer to Appendix E for the methodology regarding
the composition of this map.
Map 11.3: Millersville University’s Distribution of Employees
Economic Impact
The direct and indirect economic impact of each university was calculated in order to arrive at
the total economic impact that each has on the Commonwealth overall. Exhibit 11.1 provides a
general overview of Millersville University, as well as the direct and indirect economic and
employment impacts of the university on the Commonwealth.
A variety of data sources were used in order to calculate and analyze the spending of each
institution and its employees, students, and visitors. Please refer to Appendix E for additional
detail regarding the data sources utilized for this study. After collecting the necessary data,
multipliers were utilized to achieve the total economic impact and employment impact of
Millersville University. The multipliers were obtained through the Bureau of Economic
Analysis Regional Industrial Multiplier Systems (“RIMS II”). As a whole, it is noted that
Appendix C Page 147
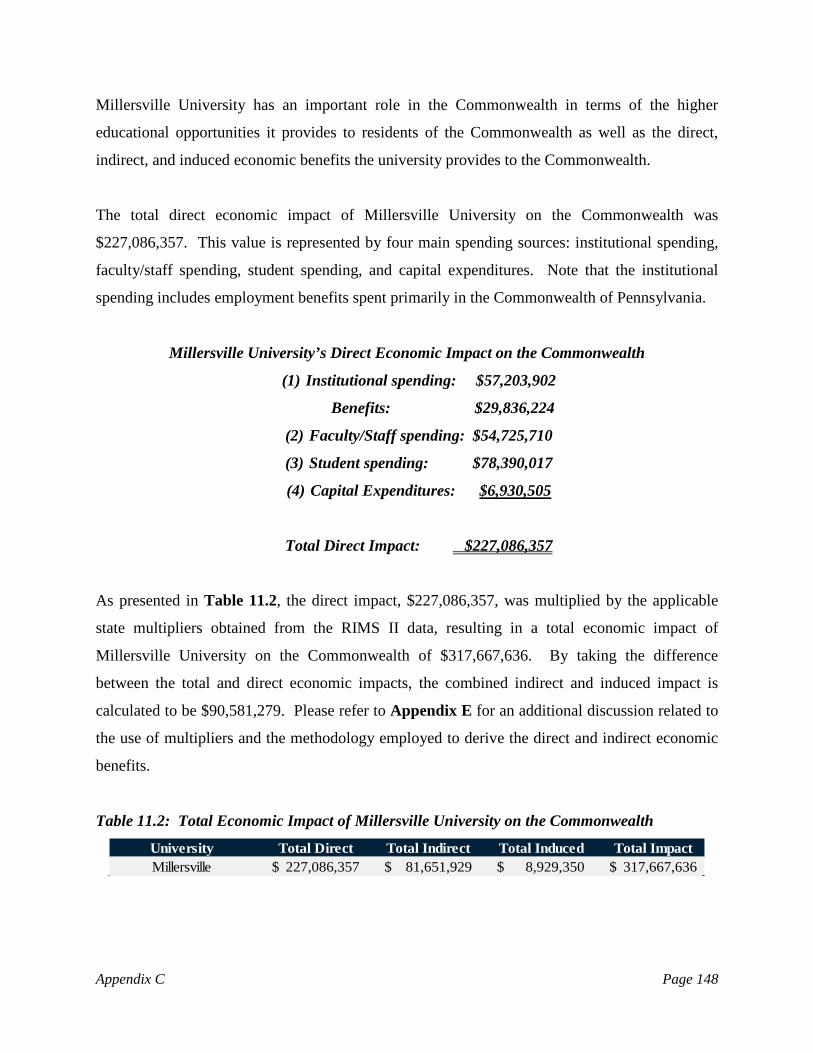
Millersville University has an important role in the Commonwealth in terms of the higher
educational opportunities it provides to residents of the Commonwealth as well as the direct,
indirect, and induced economic benefits the university provides to the Commonwealth.
The total direct economic impact of Millersville University on the Commonwealth was
$227,086,357. This value is represented by four main spending sources: institutional spending,
faculty/staff spending, student spending, and capital expenditures. Note that the institutional
spending includes employment benefits spent primarily in the Commonwealth of Pennsylvania.
Millersville University’s Direct Economic Impact on the Commonwealth
(1) Institutional spending: $57,203,902
Benefits: $29,836,224
(2) Faculty/Staff spending: $54,725,710
(3) Student spending: $78,390,017
(4) Capital Expenditures: $6,930,505
Total Direct Impact: $227,086,357
As presented in Table 11.2, the direct impact, $227,086,357, was multiplied by the applicable
state multipliers obtained from the RIMS II data, resulting in a total economic impact of
Millersville University on the Commonwealth of $317,667,636. By taking the difference
between the total and direct economic impacts, the combined indirect and induced impact is
calculated to be $90,581,279. Please refer to Appendix E for an additional discussion related to
the use of multipliers and the methodology employed to derive the direct and indirect economic
benefits.
Table 11.2: Total Economic Impact of Millersville University on the Commonwealth
University Total Direct Total Indirect Total Induced Total ImpactMillersville 227,086,357$ 81,651,929$ 8,929,350$ 317,667,636$
Appendix C Page 148

Chart 11.1: Total Economic Impact (Direct + Indirect + Induced): $317,667,636
The resulting return of taxpayer dollars via the Commonwealth’s appropriations has a significant
and measurable economic impact on the Commonwealth as a whole. Specifically, the
appropriation to Millersville University made by the Commonwealth of Pennsylvania, and
allocated by the State System, for fiscal year 2013-2014 was $30,872,019. Therefore, each
dollar invested in Millersville University by the Commonwealth via appropriations yielded a
return of approximately $10.29 in total economic impact, as is shown on Table 11.3.
Table 11.3: Statewide Economic Impact of Millersville University Appropriations
University Total ImpactState
Appropriations RatioMillersville 317,667,636$ 30,872,019$ 10.29
University spending in addition to the ancillary spending (faculty and students) yielded income
tax revenues to the Commonwealth, as well as to local municipalities and the state
unemployment trust fund. Table 11.4 illustrates the benefits provided by the university’s payroll
expenditures.
$227,086,357
$81,651,929
$8,929,350
Total Direct
Total Indirect
Total Induced
Appendix C Page 149

Table 11.4: Statewide Economic Impact of Millersville University Payroll Tax Withholdings
UniversityState Tax
Withholdings Local EIT
Local Services
TaxUnemployment
TaxTotal Tax Payments
Millersville 2,018,212$ 698,065$ 81,976$ 44,270$ 2,842,524$
In addition, sales tax revenue was collected by the Commonwealth as a result of the consumption
of taxable goods and services by the university’s faculty and staff as well as students. Table 11.5
illustrates the sales tax revenue collected by the Commonwealth. Please refer to Appendix E for
an additional discussion of the methodology employed to estimate the sale tax revenue collected
by the Commonwealth.
Table 11.5: Statewide Economic Impact of Millersville University Sales Tax Revenue Collections
University Total Student and Faculty Spending
Spending subject to tax
Sales Tax Rate
Sales Tax Revenue
Millersville 187,413,631$ 44,773,116$ 6.00% 2,686,387$
In the aggregate, the revenues realized by the Commonwealth in terms of payroll tax
withholdings and sales tax receipts for Millersville University were $4,704,599 or 15.2 percent
of the Commonwealth’s appropriations for fiscal year 2013-2014.
The composite spending activity of the university also has a measureable effect on employment
in the Commonwealth.5 Specifically the direct spending of three categories enumerated above
helps to create jobs. The employment impact of the aggregate spending of the university and the
ancillary spending of the faculty/staff and students is measured by the RIMS II multiplier which
estimates the number of jobs created per every additional million in spending.6 Specifically, the
RIMS II state multiplier for Pennsylvania indicated that for each additional million dollars of
output by the State System universities, approximately 21.3 jobs were created or supported. In
this manner, the employment impact of Millersville University on the Commonwealth
approximated 4,680 jobs, as is shown in Table 11.6.
5 Composite spending activity includes institutional, faculty and staff and student spending. 6 Please refer to Appendix E for additional information related to the RIMS II multipliers. Appendix C Page 150

Table 11.6: Statewide Employment Impact of Millersville University on the Commonwealth as a Result of Direct Composite Spending: 4,680 Jobs
University
Direct Composite Spending
Jobs Output
Employment Impact
Millersville 220,155,852 21.26 4,680
The capital expenditures of the university also help to support jobs in the region. This
employment impact is again measured using RIMS II multipliers by estimating the number of
jobs created for every additional million spent on capital expenditures. Specifically, the RIMS II
construction multiplier for Pennsylvania indicated that per each additional million dollars of
output, approximately 17.9 jobs were created or supported. In this manner, the employment
impact of Millersville University on the Commonwealth approximated 124 more jobs, as shown
in Table 11.7. Therefore, the total employment impact of Millersville University is 4,804 jobs.
Table 11.7: Statewide Employment Impact of Millersville University on the Commonwealth as
a Result of Direct Capital Expenditures: 124 Jobs
UniversityDirect Capital Expenditures Jobs Output
Employment Impact
Millersville $ 6,930,505 17.94 124
The final quantified measure of economic impact would be that of volunteer hours contributed
by faculty and staff. In 2014, Millersville University’s faculty and staff spent 120,935 hours
volunteering. With an average value of approximately $22.55 per hour, their total contribution
amounts to approximately $2,727,084. Students also devoted their time to helping the
community. Millersville students spent a total of 190,237 hours in 2014 volunteering.7 It is
likely that the students’ participation was required by university curricular and co-curricular
programs, some of which either required supervision or a faculty team leader.
7 The most recent data available for the market value of volunteer time is $22.55 for 2013 according to the Independent Sector’s Value of Volunteer Time. Appendix C Page 151

Economic Development
Economic development involves improvements to the standard of living through the creation of
jobs and the support of innovation and new research in a community’s region, state, or nation.
The State System plays a role in enhancing the economic development of the regions in which
the individual universities reside by assisting in the development and growth of new and existing
businesses, as well as increasing the employment opportunities, both of which increase economic
activity in the respective areas. The universities accomplish this in various ways, such as
partnering with local businesses, providing education and job skills training, providing an outlet
for research and development through incubators, and by providing financial and technical
assistance.
The goal of Pennsylvania’s State System of Higher Education and its 14 universities is
fundamentally to educate the citizens of the Commonwealth. By providing higher education, the
universities are not only helping to improve the economic development in the short-term, but in
the long-run as well. Therefore, by way of establishing and accomplishing its mission,
Pennsylvania’s State System is benefiting the economic advancement of the Commonwealth.
Primarily, the State System does this through the granting of undergraduate and graduate
degrees, but also does so indirectly through its purchasing, expenditures, services, and by
employing hundreds, even thousands, of people.
Overall, Pennsylvania’s State System of Higher Education is a key player in supporting the
economic development and growth of communities, counties, regions, and the Commonwealth
overall. By providing sources of innovation and entrepreneurial assistance, the State System
supplies economic growth to local businesses along with highly skilled and educated candidate
employees. Through its various economic development activities, Millersville University
successfully provides an economic competitive advantage for the county and the Commonwealth
as a whole.
While Millersville University does not track participation in the WEDnetPA program, the
university offers entrepreneurial programs. These programs include a software productization
center where multi-disciplinary groups of students work in teams to create websites to support
local businesses and organizations and several panel discussions throughout 2014. These Appendix C Page 152

university programs drew over 200 participants, as well as participation from eight businesses.
As a result, Millersville University contributes to the economic development in Lancaster, as
well as the surrounding counties.
Appendix C Page 153
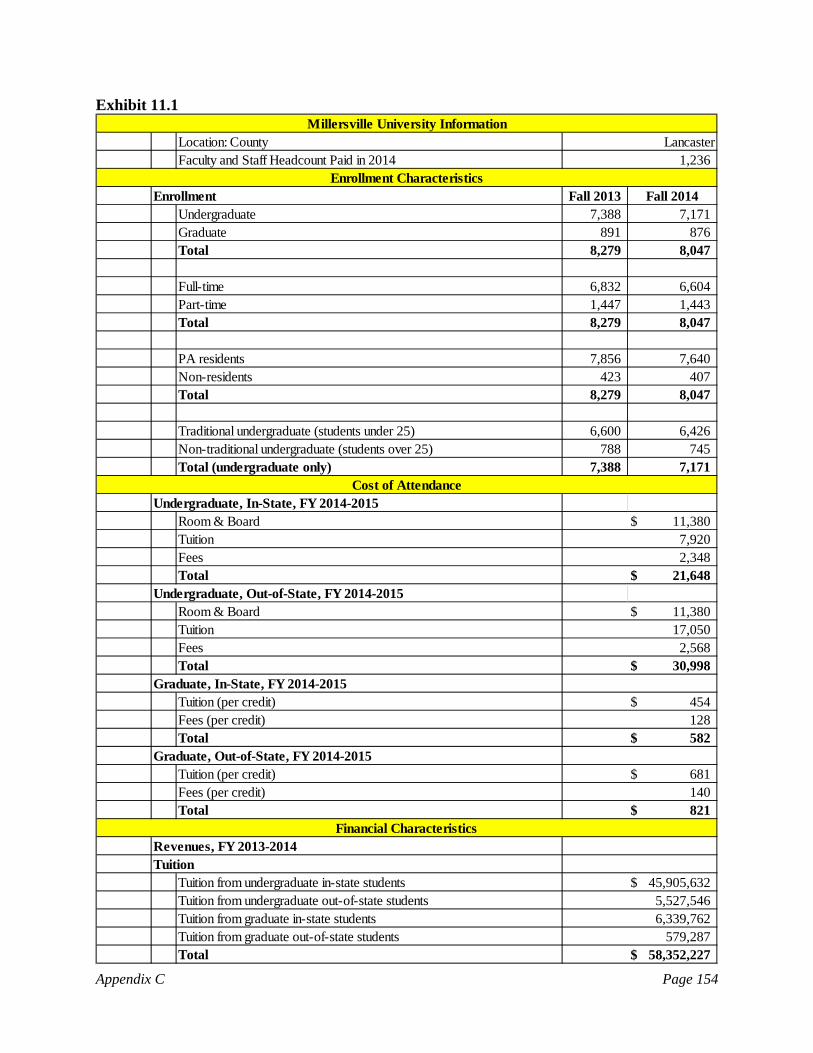
Exhibit 11.1
Location: CountyFaculty and Staff Headcount Paid in 2014
Fall 2013 Fall 2014Undergraduate 7,388 7,171 Graduate 891 876 Total 8,279 8,047
Full-time 6,832 6,604 Part-time 1,447 1,443 Total 8,279 8,047
PA residents 7,856 7,640 Non-residents 423 407 Total 8,279 8,047
Traditional undergraduate (students under 25) 6,600 6,426 Non-traditional undergraduate (students over 25) 788 745 Total (undergraduate only) 7,388 7,171
Room & BoardTuitionFeesTotal
Room & BoardTuitionFeesTotal
Tuition (per credit)Fees (per credit)Total
Tuition (per credit)Fees (per credit)Total
Tuition from undergraduate in-state studentsTuition from undergraduate out-of-state studentsTuition from graduate in-state studentsTuition from graduate out-of-state studentsTotal
Cost of Attendance
EnrollmentEnrollment Characteristics
Undergraduate, Out-of-State, FY 2014-2015
11,380$ 7,920 2,348
21,648$
11,380$
821$
17,050
454$ 128
Millersville University Information
Tuition45,905,632$
5,527,546 6,339,762
579,287
2,568
582$
Lancaster1,236
681$ 140
Financial CharacteristicsRevenues, FY 2013-2014
Undergraduate, In-State, FY 2014-2015
Graduate, Out-of-State, FY 2014-2015
Graduate, In-State, FY 2014-2015
58,352,227$
30,998$
Appendix C Page 154

Technology, Academic/Instruction, and Other Mandatory Fees
Non-Mandatory FeesTotal
Total from Tuition, Fees, Room & Board
30,872,019$
FederalStateLocal/Other/PrivateSystem Transfer AwardsTotal grants and contracts
Total Revenues (from sources above)
2,696,916$ 32,171,525$
814,000,000$
Institutional ExpendituresInstitutional spending (excluding payroll) 56,653,470$ Capital Improvements 550,432 Employee Benefits 29,836,224
Total Direct Institutional Spending 87,040,126 Institutional spending prorated by 5.06% of out of state students 4,402,303 Type 1 Multiplier 1.53
Type 1 Effect (total indirect - induced) 6,750,931 Type 2 Multiplier 2.33
Type 2 Effect (total indirect) 10,266,170 Induced Effect (type 2 effect - type 1 effect) 3,515,239 Total Impact of Institutional Spending 100,821,535$
Faculty and Staff ExpendituresFaculty and staff spending (direct) 54,725,709$ Household multiplier 1.41 Total Impact of Faculty and Staff Spending 77,048,327$
418,528 21,895,452$
33,203,352$
Total Replacement Value of Physical Plant
1,118,981 18,205,364$
3,128,584$
13,539,718$
315,378
FeesMandatory Fees
76,557,591$
Sales and Services
Education and General Appropriations
Grants and Contracts
Non-Mandatory Fees
The Institution as a Consumer in the State
Funds Raised by University (private giving)Market Value of Endowment
7,621,828
165,656,998$ Other Revenues (net of scholarship discounts and allowances)
17,086,383$
Financial Characteristics
Appendix C Page 155

Student ExpendituresStudent spending (direct) 78,390,017$ Household multiplier 1.41 Total Impact of Student Spending 110,365,305$
Capital ExpendituresCapital Improvements - 5 year weighted average 5,933,333$ Deferred Maintenance 997,172
Total Direct Capital Expenditures 6,930,505 Type 1 Multiplier 1.68
Type 1 Effect (total indirect - induced) 11,673,743 Type 2 Multiplier 2.47
Type 2 Effect (total indirect) 17,087,854 Induced Effect (type 2 effect - type 1 effect) 5,414,111 Total Impact of Capital Expenditures 29,432,470$
Employment impact for the CommonwealthDirect composite expenditures for the Commonwealth 220,155,852$ State multiplier 21.26Statewide Employment Impact based on Composite Spending (jobs) 4,680 Direct capital expenditures for the Commonwealth 6,930,505State multiplier 17.94Statewide Employment Impact based on Direct Expenditures (jobs) 124Total Employment Impact 4,804
In-Kind (Volunteer) Contributions to Regional EconomyAnnual volunteer hours of faculty and staff (2014) 120,935 Average market value of volunteer hours (per hour) 22.55$ Estimated total contribution of faculty and staff 2,727,084$ Annual volunteer hours of students (2014) 190,237
Small Business IncubatorSmall Business Development CenterPatents filed since January 1, 2010¹
Sales TaxTotal Faculty and Staff and Student Spending 187,413,631$ Imputed % of taxable spending 23.89%Spending subject to tax 44,773,116 Sales tax rate 6%Total State Sales Tax Revenue Generation 2,686,387$
The Institution as an Employer
The University as a Center for Volunteerism
Business and Economic Development Services
The Institution as a Consumer in the State
The University as a Generator of State Government Revenue
NoNo
0
Appendix C Page 156
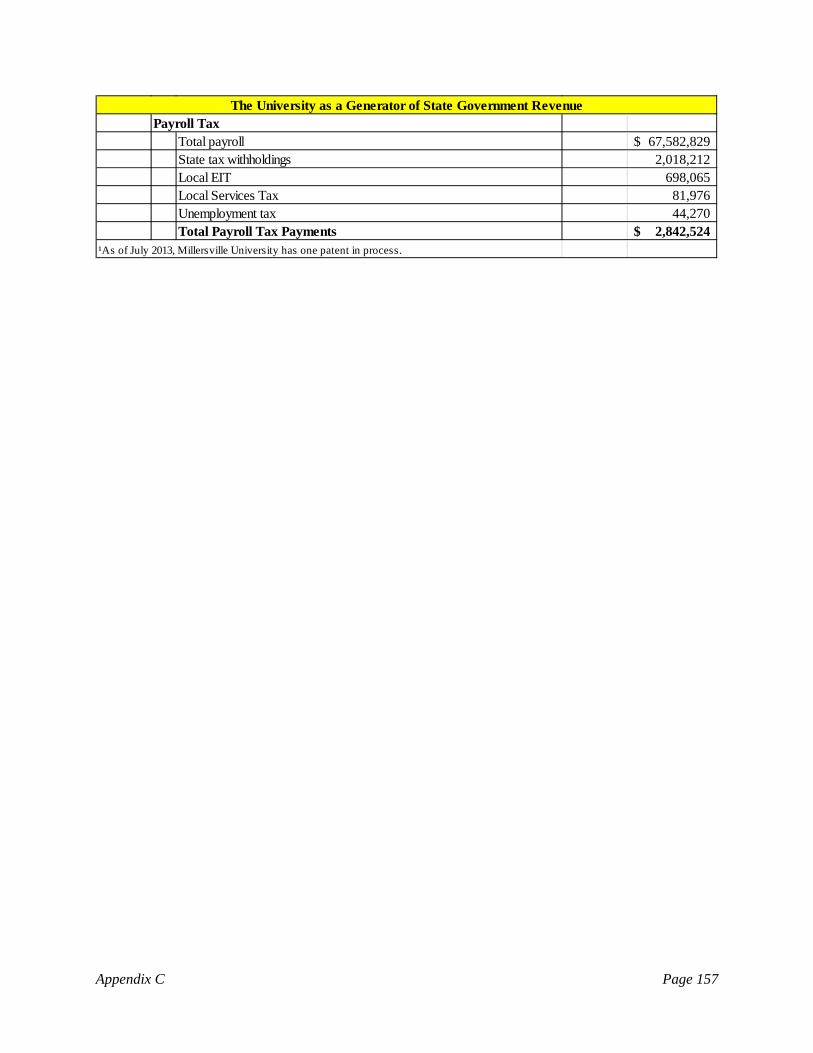
Payroll TaxTotal payroll 67,582,829$ State tax withholdings 2,018,212 Local EIT 698,065 Local Services Tax 81,976 Unemployment tax 44,270 Total Payroll Tax Payments 2,842,524$
¹As of July 2013, Millersville University has one patent in process.
The University as a Generator of State Government Revenue
Appendix C Page 157
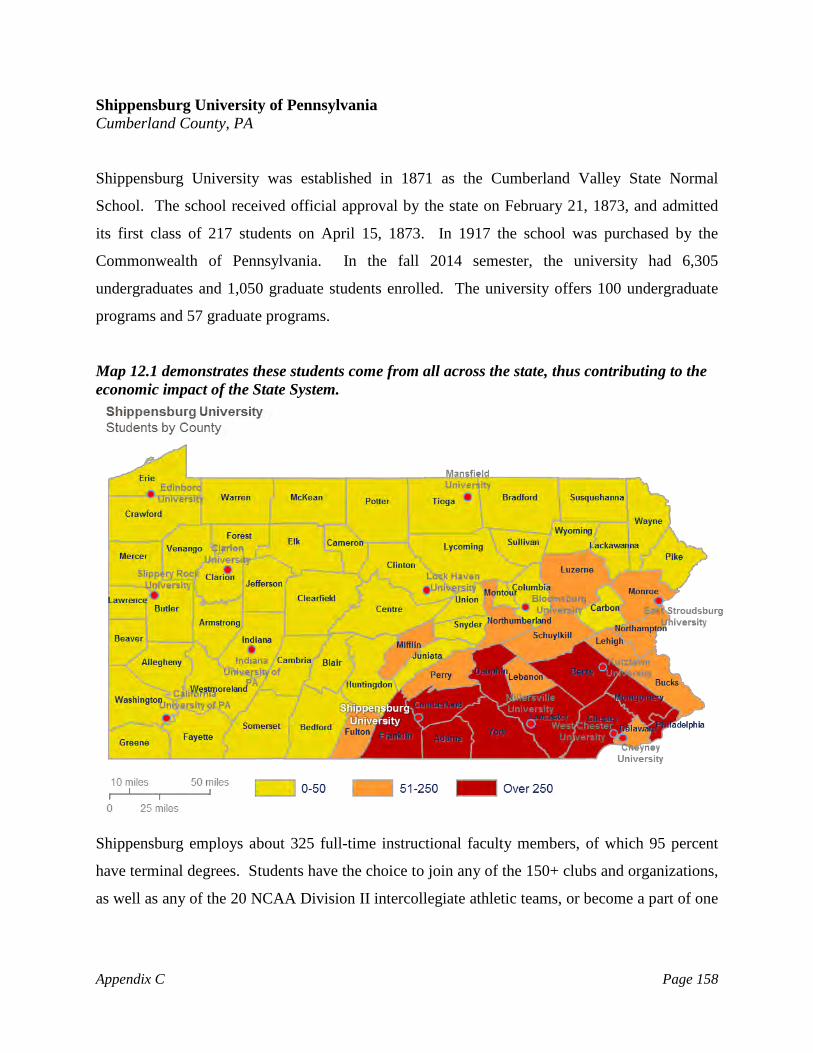
Shippensburg University of Pennsylvania Cumberland County, PA
Shippensburg University was established in 1871 as the Cumberland Valley State Normal
School. The school received official approval by the state on February 21, 1873, and admitted
its first class of 217 students on April 15, 1873. In 1917 the school was purchased by the
Commonwealth of Pennsylvania. In the fall 2014 semester, the university had 6,305
undergraduates and 1,050 graduate students enrolled. The university offers 100 undergraduate
programs and 57 graduate programs.
Map 12.1 demonstrates these students come from all across the state, thus contributing to the economic impact of the State System.
Shippensburg employs about 325 full-time instructional faculty members, of which 95 percent
have terminal degrees. Students have the choice to join any of the 150+ clubs and organizations,
as well as any of the 20 NCAA Division II intercollegiate athletic teams, or become a part of one
Appendix C Page 158
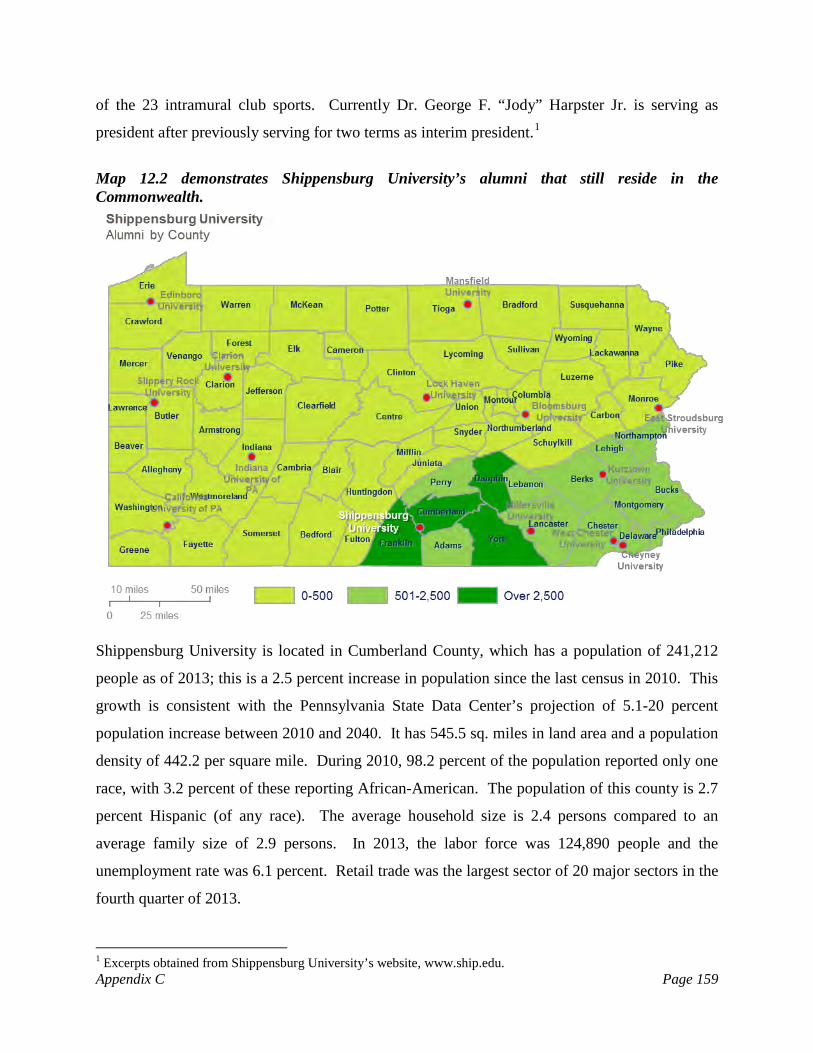
of the 23 intramural club sports. Currently Dr. George F. “Jody” Harpster Jr. is serving as
president after previously serving for two terms as interim president.1
Map 12.2 demonstrates Shippensburg University’s alumni that still reside in the Commonwealth.
Shippensburg University is located in Cumberland County, which has a population of 241,212
people as of 2013; this is a 2.5 percent increase in population since the last census in 2010. This
growth is consistent with the Pennsylvania State Data Center’s projection of 5.1-20 percent
population increase between 2010 and 2040. It has 545.5 sq. miles in land area and a population
density of 442.2 per square mile. During 2010, 98.2 percent of the population reported only one
race, with 3.2 percent of these reporting African-American. The population of this county is 2.7
percent Hispanic (of any race). The average household size is 2.4 persons compared to an
average family size of 2.9 persons. In 2013, the labor force was 124,890 people and the
unemployment rate was 6.1 percent. Retail trade was the largest sector of 20 major sectors in the
fourth quarter of 2013.
1 Excerpts obtained from Shippensburg University’s website, www.ship.edu. Appendix C Page 159
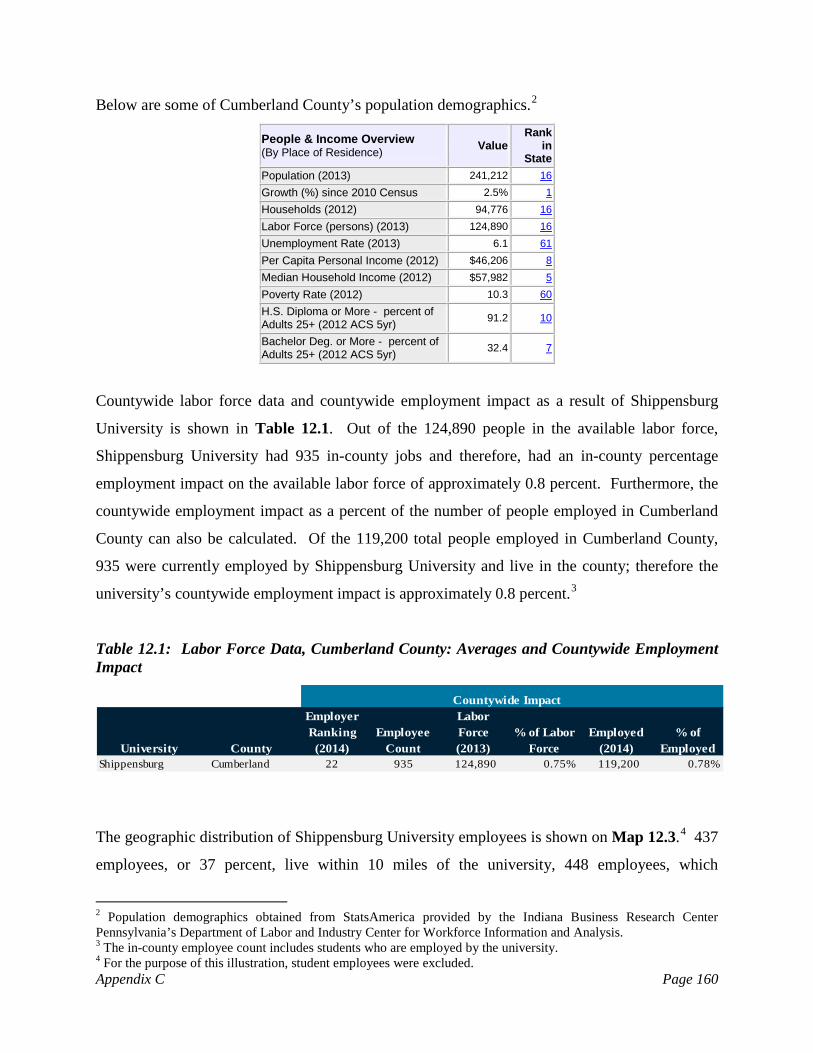
Below are some of Cumberland County’s population demographics.2
People & Income Overview (By Place of Residence) Value
Rank in
State Population (2013) 241,212 16
Growth (%) since 2010 Census 2.5% 1
Households (2012) 94,776 16
Labor Force (persons) (2013) 124,890 16
Unemployment Rate (2013) 6.1 61
Per Capita Personal Income (2012) $46,206 8
Median Household Income (2012) $57,982 5
Poverty Rate (2012) 10.3 60
H.S. Diploma or More - percent of Adults 25+ (2012 ACS 5yr) 91.2 10
Bachelor Deg. or More - percent of Adults 25+ (2012 ACS 5yr) 32.4 7
Countywide labor force data and countywide employment impact as a result of Shippensburg
University is shown in Table 12.1. Out of the 124,890 people in the available labor force,
Shippensburg University had 935 in-county jobs and therefore, had an in-county percentage
employment impact on the available labor force of approximately 0.8 percent. Furthermore, the
countywide employment impact as a percent of the number of people employed in Cumberland
County can also be calculated. Of the 119,200 total people employed in Cumberland County,
935 were currently employed by Shippensburg University and live in the county; therefore the
university’s countywide employment impact is approximately 0.8 percent.3
Table 12.1: Labor Force Data, Cumberland County: Averages and Countywide Employment Impact
Countywide Impact
University County
Employer Ranking (2014)
Employee Count
Labor Force (2013)
% of Labor Force
Employed (2014)
% of Employed
Shippensburg Cumberland 22 935 124,890 0.75% 119,200 0.78%
The geographic distribution of Shippensburg University employees is shown on Map 12.3.4 437
employees, or 37 percent, live within 10 miles of the university, 448 employees, which
2 Population demographics obtained from StatsAmerica provided by the Indiana Business Research Center Pennsylvania’s Department of Labor and Industry Center for Workforce Information and Analysis. 3 The in-county employee count includes students who are employed by the university. 4 For the purpose of this illustration, student employees were excluded. Appendix C Page 160
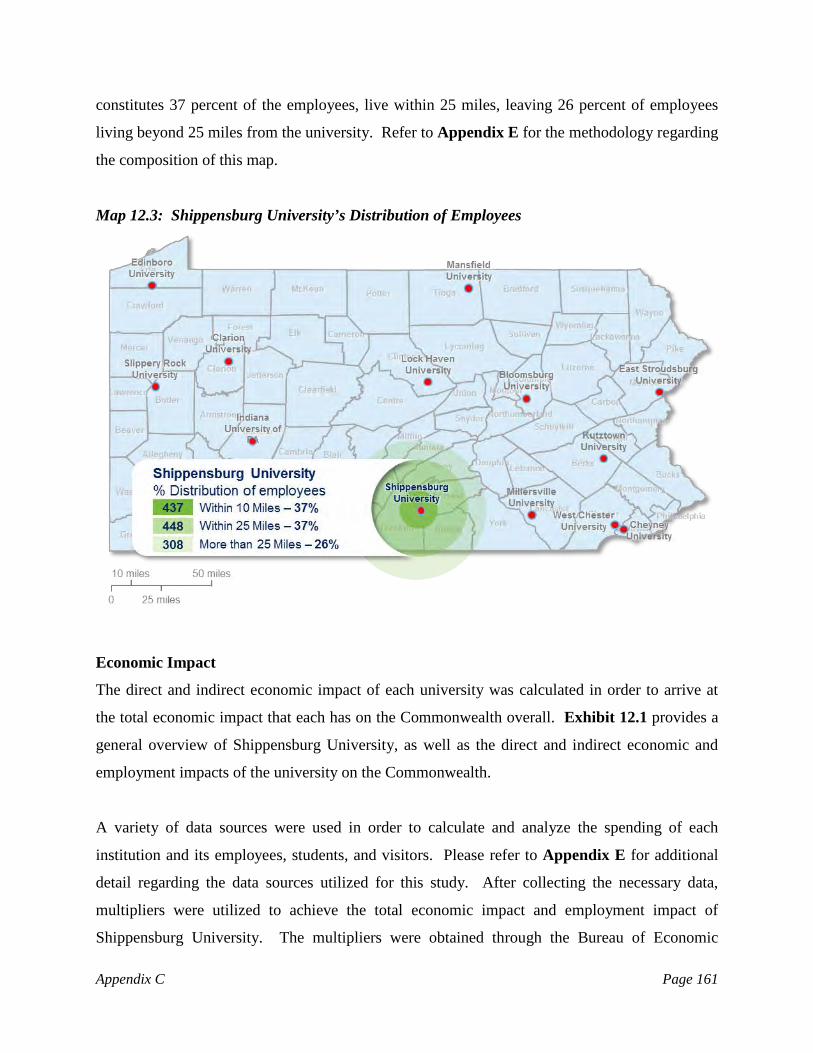
constitutes 37 percent of the employees, live within 25 miles, leaving 26 percent of employees
living beyond 25 miles from the university. Refer to Appendix E for the methodology regarding
the composition of this map.
Map 12.3: Shippensburg University’s Distribution of Employees
Economic Impact
The direct and indirect economic impact of each university was calculated in order to arrive at
the total economic impact that each has on the Commonwealth overall. Exhibit 12.1 provides a
general overview of Shippensburg University, as well as the direct and indirect economic and
employment impacts of the university on the Commonwealth.
A variety of data sources were used in order to calculate and analyze the spending of each
institution and its employees, students, and visitors. Please refer to Appendix E for additional
detail regarding the data sources utilized for this study. After collecting the necessary data,
multipliers were utilized to achieve the total economic impact and employment impact of
Shippensburg University. The multipliers were obtained through the Bureau of Economic
Appendix C Page 161
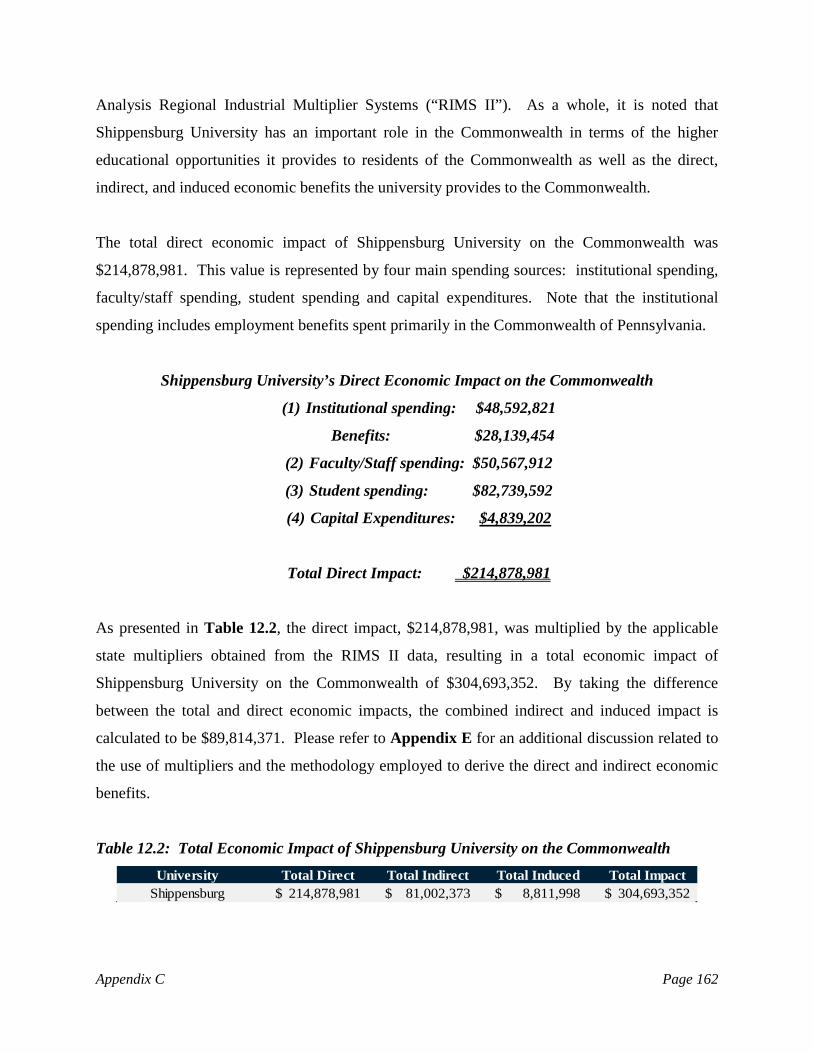
Analysis Regional Industrial Multiplier Systems (“RIMS II”). As a whole, it is noted that
Shippensburg University has an important role in the Commonwealth in terms of the higher
educational opportunities it provides to residents of the Commonwealth as well as the direct,
indirect, and induced economic benefits the university provides to the Commonwealth.
The total direct economic impact of Shippensburg University on the Commonwealth was
$214,878,981. This value is represented by four main spending sources: institutional spending,
faculty/staff spending, student spending and capital expenditures. Note that the institutional
spending includes employment benefits spent primarily in the Commonwealth of Pennsylvania.
Shippensburg University’s Direct Economic Impact on the Commonwealth
(1) Institutional spending: $48,592,821
Benefits: $28,139,454
(2) Faculty/Staff spending: $50,567,912
(3) Student spending: $82,739,592
(4) Capital Expenditures: $4,839,202
Total Direct Impact: $214,878,981
As presented in Table 12.2, the direct impact, $214,878,981, was multiplied by the applicable
state multipliers obtained from the RIMS II data, resulting in a total economic impact of
Shippensburg University on the Commonwealth of $304,693,352. By taking the difference
between the total and direct economic impacts, the combined indirect and induced impact is
calculated to be $89,814,371. Please refer to Appendix E for an additional discussion related to
the use of multipliers and the methodology employed to derive the direct and indirect economic
benefits.
Table 12.2: Total Economic Impact of Shippensburg University on the Commonwealth University Total Direct Total Indirect Total Induced Total Impact
Shippensburg 214,878,981$ 81,002,373$ 8,811,998$ 304,693,352$
Appendix C Page 162

Chart 12.1: Total Economic Impact (Direct + Indirect + Induced): $304,693,352
The resulting return of taxpayer dollars via the Commonwealth’s appropriations has a significant
and measurable economic impact on the Commonwealth as a whole. Specifically, the
appropriation to Shippensburg University made by the Commonwealth of Pennsylvania,
allocated by the State System, for fiscal year 2013-2014 was $28,164,791. Therefore, each
dollar invested in Shippensburg University by the Commonwealth via appropriations yielded a
return of approximately $10.82 in total economic impact, as is shown on Table 12.3.
Table 12.3: Statewide Economic Impact of Shippensburg University Appropriations
University Total ImpactState
Appropriations RatioShippensburg 304,693,352$ 28,164,791$ 10.82
University spending in addition to the ancillary spending (faculty and students) yielded income
tax revenues to the Commonwealth, as well as to local municipalities and the state
unemployment trust fund. Table 12.4 illustrates the benefits provided by the university’s payroll
expenditures.
$214,878,981
$81,002,373
$8,811,998
Total Direct
Total Indirect
Total Induced
Appendix C Page 163
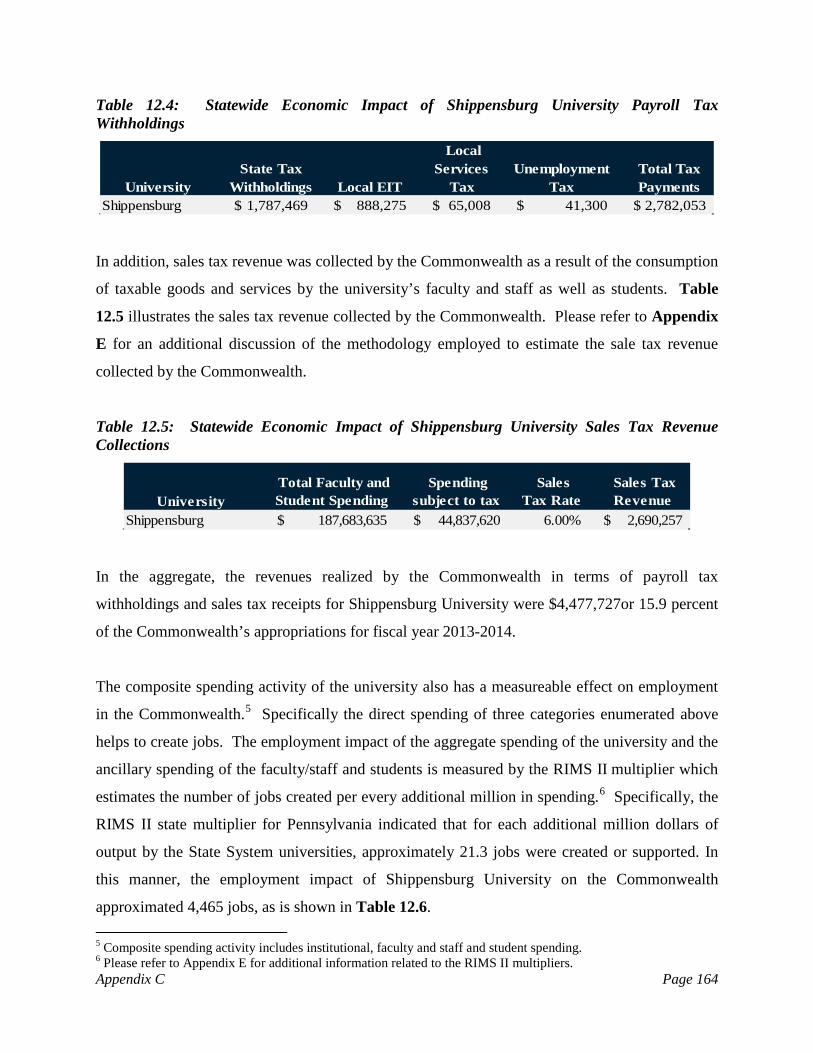
Table 12.4: Statewide Economic Impact of Shippensburg University Payroll Tax Withholdings
UniversityState Tax
Withholdings Local EIT
Local Services
TaxUnemployment
TaxTotal Tax Payments
Shippensburg 1,787,469$ 888,275$ 65,008$ 41,300$ 2,782,053$
In addition, sales tax revenue was collected by the Commonwealth as a result of the consumption
of taxable goods and services by the university’s faculty and staff as well as students. Table
12.5 illustrates the sales tax revenue collected by the Commonwealth. Please refer to Appendix
E for an additional discussion of the methodology employed to estimate the sale tax revenue
collected by the Commonwealth.
Table 12.5: Statewide Economic Impact of Shippensburg University Sales Tax Revenue Collections
University Total Faculty and Student Spending
Spending subject to tax
Sales Tax Rate
Sales Tax Revenue
Shippensburg 187,683,635$ 44,837,620$ 6.00% 2,690,257$
In the aggregate, the revenues realized by the Commonwealth in terms of payroll tax
withholdings and sales tax receipts for Shippensburg University were $4,477,727or 15.9 percent
of the Commonwealth’s appropriations for fiscal year 2013-2014.
The composite spending activity of the university also has a measureable effect on employment
in the Commonwealth.5 Specifically the direct spending of three categories enumerated above
helps to create jobs. The employment impact of the aggregate spending of the university and the
ancillary spending of the faculty/staff and students is measured by the RIMS II multiplier which
estimates the number of jobs created per every additional million in spending.6 Specifically, the
RIMS II state multiplier for Pennsylvania indicated that for each additional million dollars of
output by the State System universities, approximately 21.3 jobs were created or supported. In
this manner, the employment impact of Shippensburg University on the Commonwealth
approximated 4,465 jobs, as is shown in Table 12.6.
5 Composite spending activity includes institutional, faculty and staff and student spending. 6 Please refer to Appendix E for additional information related to the RIMS II multipliers. Appendix C Page 164
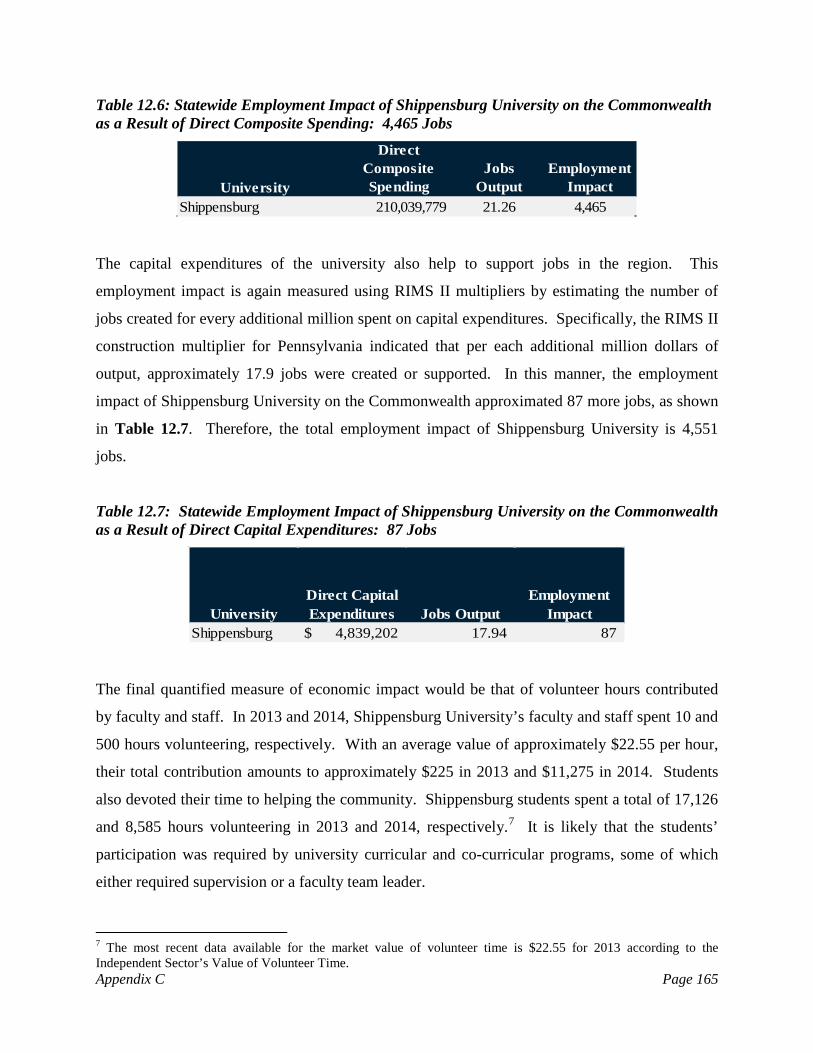
Table 12.6: Statewide Employment Impact of Shippensburg University on the Commonwealth as a Result of Direct Composite Spending: 4,465 Jobs
University
Direct Composite Spending
Jobs Output
Employment Impact
Shippensburg 210,039,779 21.26 4,465
The capital expenditures of the university also help to support jobs in the region. This
employment impact is again measured using RIMS II multipliers by estimating the number of
jobs created for every additional million spent on capital expenditures. Specifically, the RIMS II
construction multiplier for Pennsylvania indicated that per each additional million dollars of
output, approximately 17.9 jobs were created or supported. In this manner, the employment
impact of Shippensburg University on the Commonwealth approximated 87 more jobs, as shown
in Table 12.7. Therefore, the total employment impact of Shippensburg University is 4,551
jobs.
Table 12.7: Statewide Employment Impact of Shippensburg University on the Commonwealth as a Result of Direct Capital Expenditures: 87 Jobs
UniversityDirect Capital Expenditures Jobs Output
Employment Impact
Shippensburg $ 4,839,202 17.94 87
The final quantified measure of economic impact would be that of volunteer hours contributed
by faculty and staff. In 2013 and 2014, Shippensburg University’s faculty and staff spent 10 and
500 hours volunteering, respectively. With an average value of approximately $22.55 per hour,
their total contribution amounts to approximately $225 in 2013 and $11,275 in 2014. Students
also devoted their time to helping the community. Shippensburg students spent a total of 17,126
and 8,585 hours volunteering in 2013 and 2014, respectively.7 It is likely that the students’
participation was required by university curricular and co-curricular programs, some of which
either required supervision or a faculty team leader.
7 The most recent data available for the market value of volunteer time is $22.55 for 2013 according to the Independent Sector’s Value of Volunteer Time. Appendix C Page 165
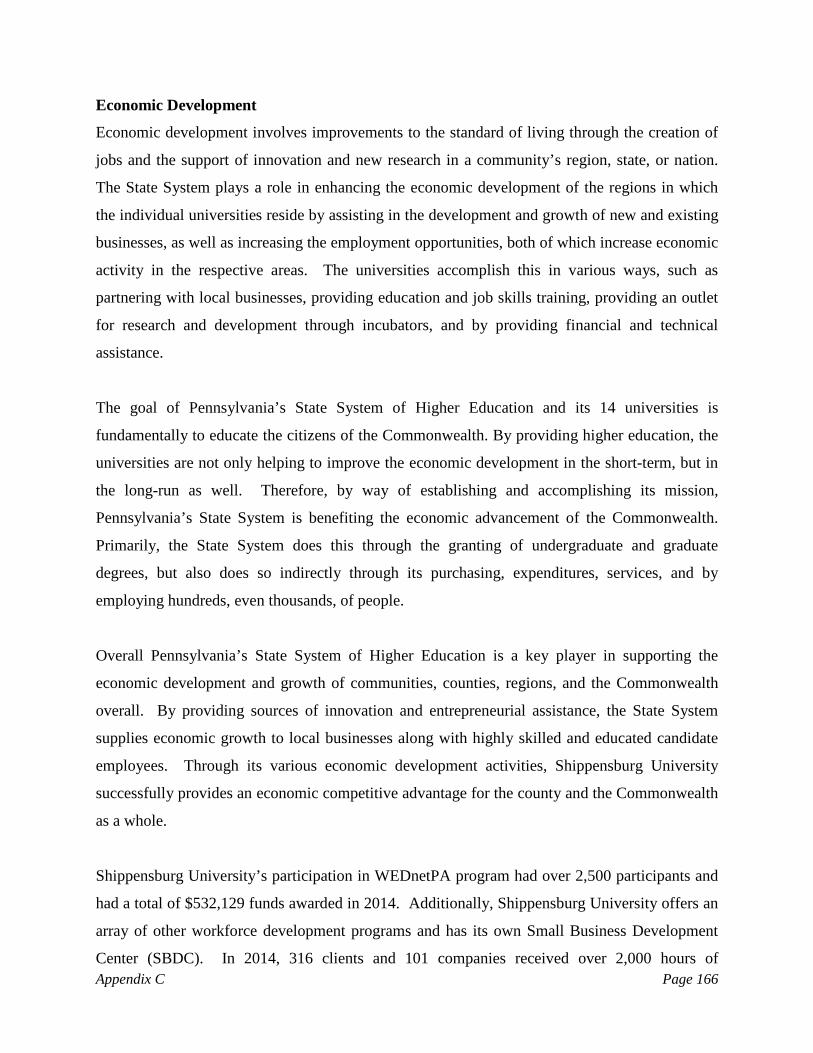
Economic Development
Economic development involves improvements to the standard of living through the creation of
jobs and the support of innovation and new research in a community’s region, state, or nation.
The State System plays a role in enhancing the economic development of the regions in which
the individual universities reside by assisting in the development and growth of new and existing
businesses, as well as increasing the employment opportunities, both of which increase economic
activity in the respective areas. The universities accomplish this in various ways, such as
partnering with local businesses, providing education and job skills training, providing an outlet
for research and development through incubators, and by providing financial and technical
assistance.
The goal of Pennsylvania’s State System of Higher Education and its 14 universities is
fundamentally to educate the citizens of the Commonwealth. By providing higher education, the
universities are not only helping to improve the economic development in the short-term, but in
the long-run as well. Therefore, by way of establishing and accomplishing its mission,
Pennsylvania’s State System is benefiting the economic advancement of the Commonwealth.
Primarily, the State System does this through the granting of undergraduate and graduate
degrees, but also does so indirectly through its purchasing, expenditures, services, and by
employing hundreds, even thousands, of people.
Overall Pennsylvania’s State System of Higher Education is a key player in supporting the
economic development and growth of communities, counties, regions, and the Commonwealth
overall. By providing sources of innovation and entrepreneurial assistance, the State System
supplies economic growth to local businesses along with highly skilled and educated candidate
employees. Through its various economic development activities, Shippensburg University
successfully provides an economic competitive advantage for the county and the Commonwealth
as a whole.
Shippensburg University’s participation in WEDnetPA program had over 2,500 participants and
had a total of $532,129 funds awarded in 2014. Additionally, Shippensburg University offers an
array of other workforce development programs and has its own Small Business Development
Center (SBDC). In 2014, 316 clients and 101 companies received over 2,000 hours of Appendix C Page 166

counseling from the SBDC. The SBDC also held 39 workshops and assists 41 businesses with
secure financing. By way of these efforts, Shippensburg University helps improve the economic
development in Cumberland County, as well as other counties surrounding it.
Appendix C Page 167
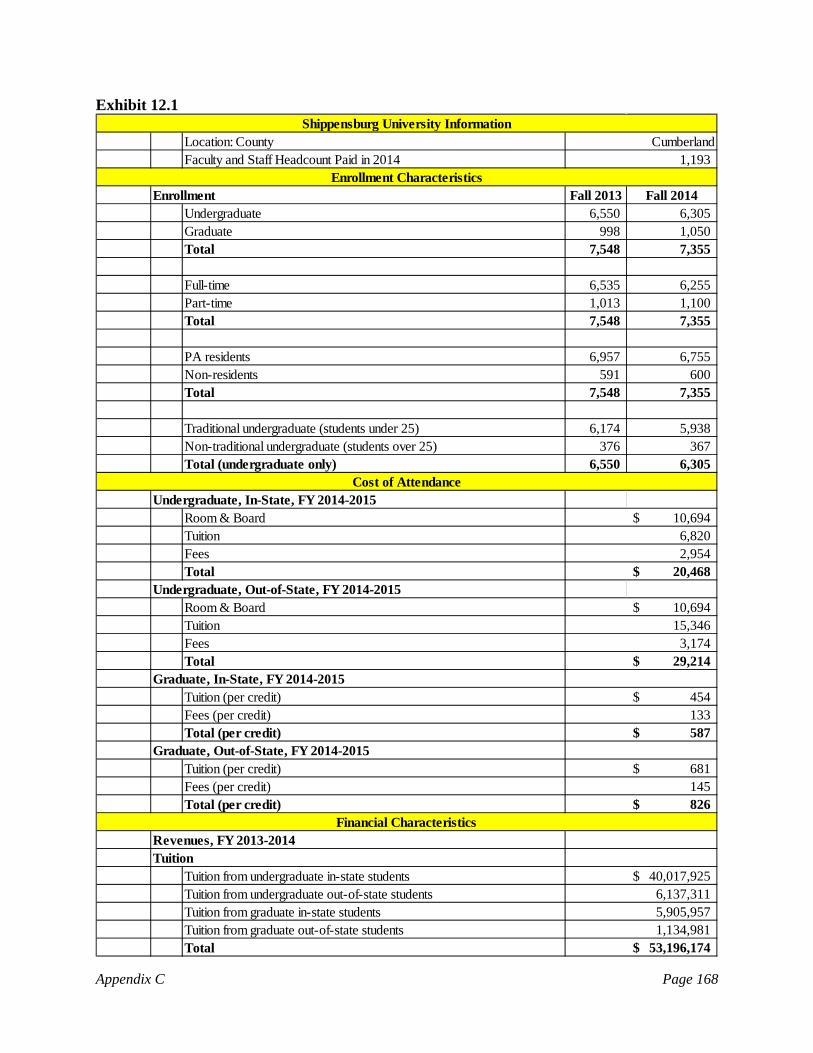
Exhibit 12.1
Location: CountyFaculty and Staff Headcount Paid in 2014
Fall 2013 Fall 2014Undergraduate 6,550 6,305 Graduate 998 1,050 Total 7,548 7,355
Full-time 6,535 6,255 Part-time 1,013 1,100 Total 7,548 7,355
PA residents 6,957 6,755 Non-residents 591 600 Total 7,548 7,355
Traditional undergraduate (students under 25) 6,174 5,938 Non-traditional undergraduate (students over 25) 376 367 Total (undergraduate only) 6,550 6,305
Room & BoardTuitionFeesTotal
Room & BoardTuitionFeesTotal
Tuition (per credit)Fees (per credit)Total (per credit)
Tuition (per credit)Fees (per credit)Total (per credit)
Tuition from undergraduate in-state studentsTuition from undergraduate out-of-state studentsTuition from graduate in-state studentsTuition from graduate out-of-state studentsTotal
Cost of Attendance
EnrollmentEnrollment Characteristics
Undergraduate, Out-of-State, FY 2014-2015
10,694$ 6,820 2,954
20,468$
10,694$
826$
15,346
454$ 133
Shippensburg University Information
Tuition40,017,925$ 6,137,311 5,905,957 1,134,981
3,174
587$
Cumberland1,193
681$ 145
Financial CharacteristicsRevenues, FY 2013-2014
Undergraduate, In-State, FY 2014-2015
Graduate, Out-of-State, FY 2014-2015
Graduate, In-State, FY 2014-2015
53,196,174$
29,214$
Appendix C Page 168
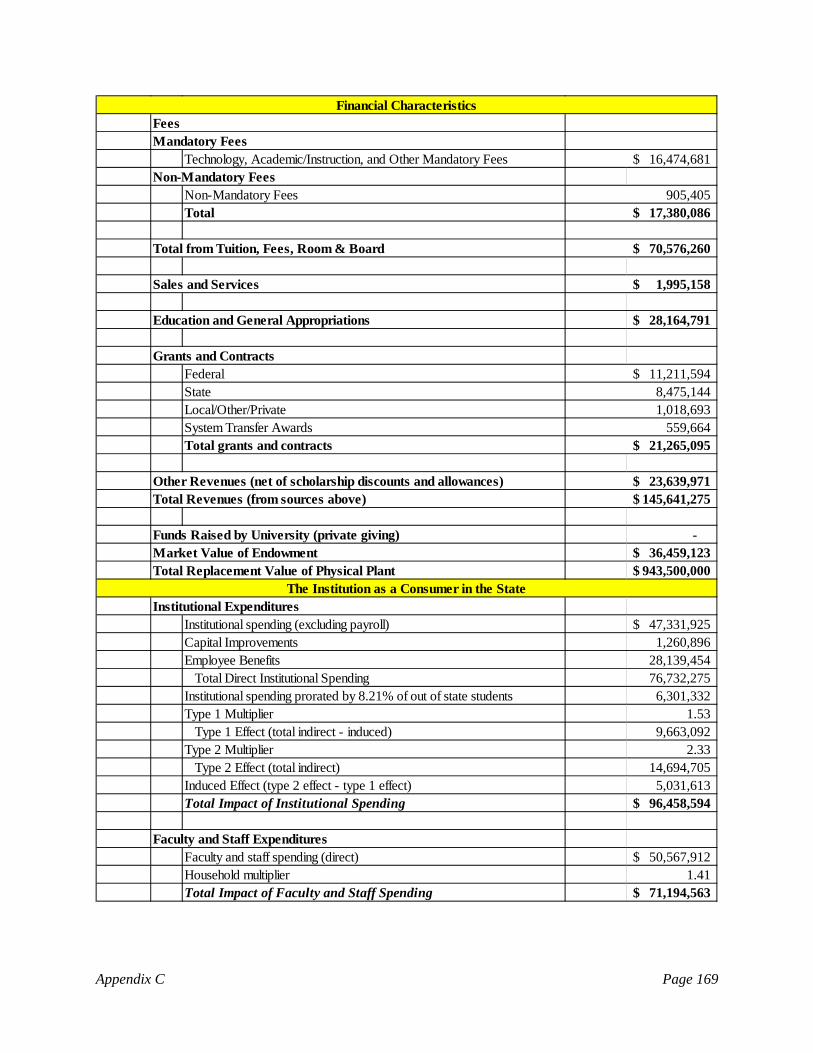
Technology, Academic/Instruction, and Other Mandatory Fees
Non-Mandatory FeesTotal
Total from Tuition, Fees, Room & Board
28,164,791$
FederalStateLocal/Other/PrivateSystem Transfer AwardsTotal grants and contracts
Total Revenues (from sources above)
- 36,459,123$
943,500,000$
Institutional ExpendituresInstitutional spending (excluding payroll) 47,331,925$ Capital Improvements 1,260,896 Employee Benefits 28,139,454
Total Direct Institutional Spending 76,732,275 Institutional spending prorated by 8.21% of out of state students 6,301,332 Type 1 Multiplier 1.53
Type 1 Effect (total indirect - induced) 9,663,092 Type 2 Multiplier 2.33
Type 2 Effect (total indirect) 14,694,705 Induced Effect (type 2 effect - type 1 effect) 5,031,613 Total Impact of Institutional Spending 96,458,594$
Faculty and Staff ExpendituresFaculty and staff spending (direct) 50,567,912$ Household multiplier 1.41 Total Impact of Faculty and Staff Spending 71,194,563$
16,474,681$
Financial Characteristics
Non-Mandatory Fees
The Institution as a Consumer in the State
Funds Raised by University (private giving)Market Value of Endowment
8,475,144
145,641,275$ Other Revenues (net of scholarship discounts and allowances)
1,018,693
FeesMandatory Fees
70,576,260$
Sales and Services
Education and General Appropriations
Grants and Contracts
1,995,158$
11,211,594$
559,664 21,265,095$
23,639,971$
Total Replacement Value of Physical Plant
905,405 17,380,086$
Appendix C Page 169

Student ExpendituresStudent spending (direct) 82,739,592$ Household multiplier 1.41 Total Impact of Student Spending 116,489,072$
Capital ExpendituresCapital Improvements - 5 year weighted average 3,840,000$ Deferred Maintenance 999,202
Total Direct Capital Expenditures 4,839,202 Type 1 Multiplier 1.68
Type 1 Effect (total indirect - induced) 8,151,152 Type 2 Multiplier 2.47
Type 2 Effect (total indirect) 11,931,536 Induced Effect (type 2 effect - type 1 effect) 3,780,385 Total Impact of Capital Expenditures 20,551,123$
Employment impact for the CommonwealthDirect composite expenditures for the Commonwealth 210,039,779$ State multiplier 21.26Statewide Employment Impact based on Composite Spending (jobs) 4,465 Direct capital expenditures for the Commonwealth 4,839,202$ State multiplier 17.94Statewide Employment Impact based on Direct Expenditures (jobs) 87 Total Employment Impact 4,551
In-Kind (Volunteer) Contributions to Regional EconomyAnnual volunteer hours of faculty and staff (2014) 500 Average market value of volunteer hours (per hour) 22.55$ Estimated total contribution of faculty and staff 11,275$ Annual volunteer hours of students (2014) 8,585
Small Business IncubatorSmall Business Development CenterPatents filed since January 1, 2010
Sales TaxTotal Faculty and Staff and Student Spending 187,683,635$ Imputed % of taxable spending 23.89%Spending subject to tax 44,837,620 Sales tax rate 6%Total State Sales Tax Revenue Generation 2,690,257$
The Institution as an Employer
The University as a Center for Volunteerism
Business and Economic Development Services
The Institution as a Consumer in the State
The University as a Generator of State Government Revenue
NoYes
0
Appendix C Page 170
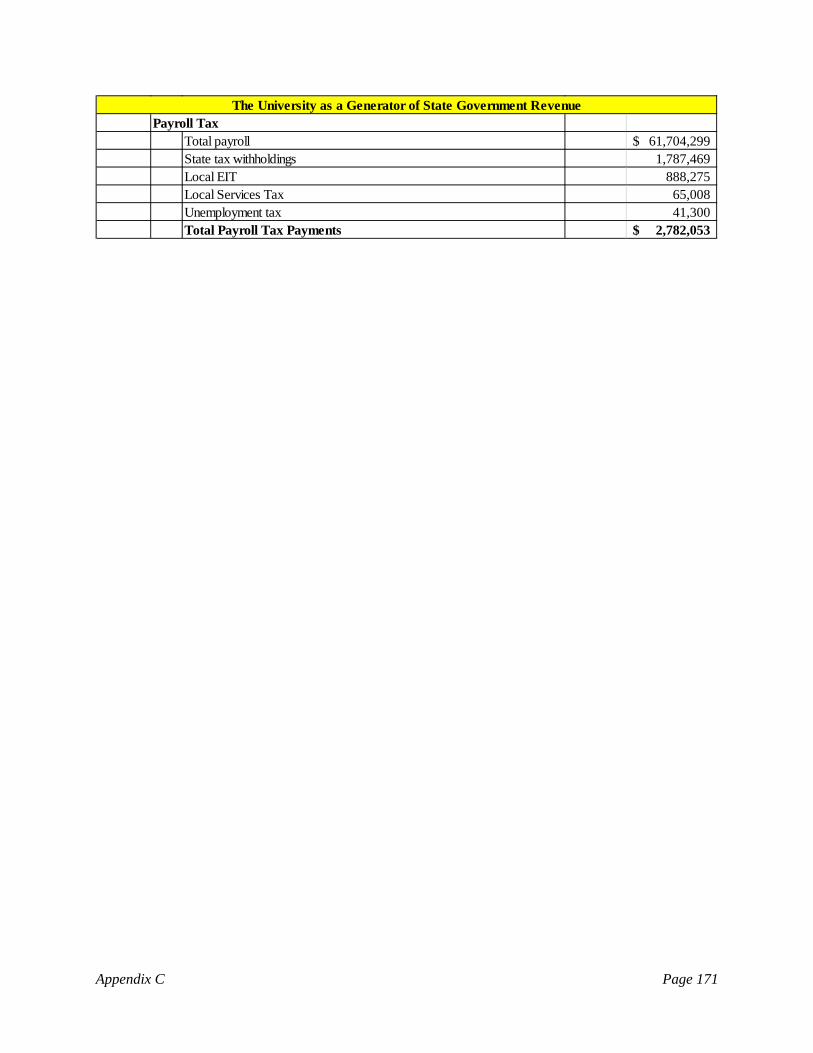
Payroll TaxTotal payroll 61,704,299$ State tax withholdings 1,787,469 Local EIT 888,275 Local Services Tax 65,008 Unemployment tax 41,300 Total Payroll Tax Payments 2,782,053$
The University as a Generator of State Government Revenue
Appendix C Page 171
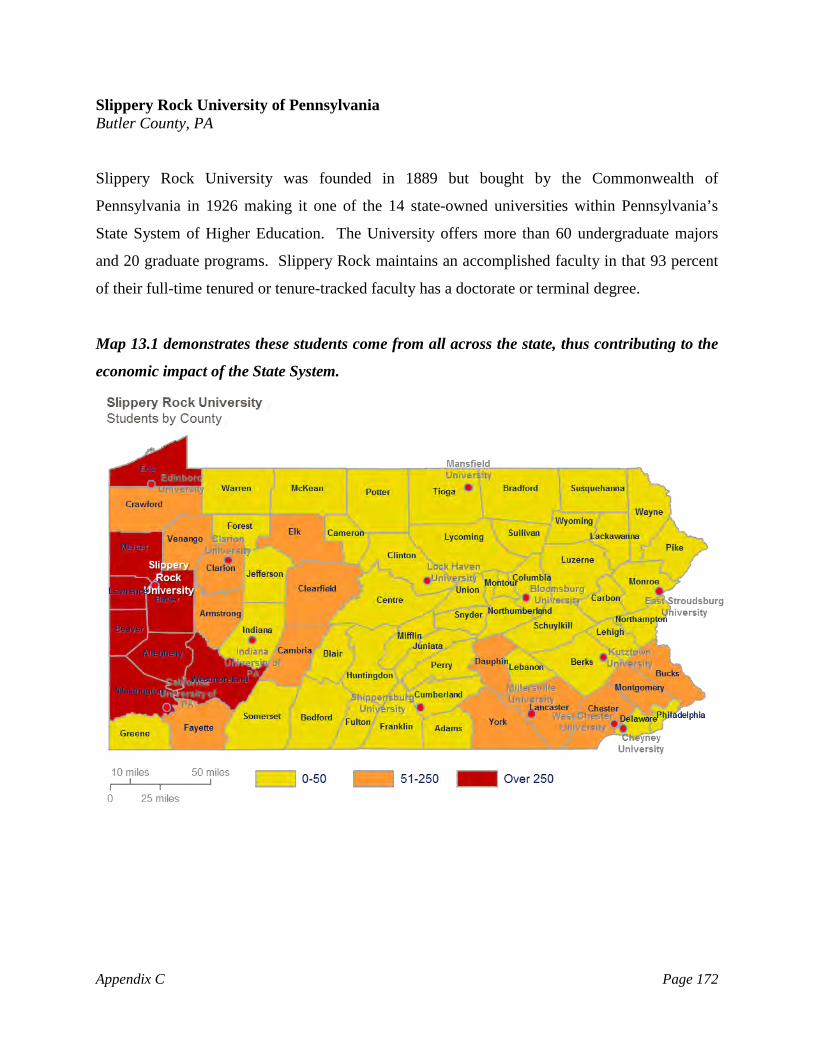
Slippery Rock University of Pennsylvania Butler County, PA
Slippery Rock University was founded in 1889 but bought by the Commonwealth of
Pennsylvania in 1926 making it one of the 14 state-owned universities within Pennsylvania’s
State System of Higher Education. The University offers more than 60 undergraduate majors
and 20 graduate programs. Slippery Rock maintains an accomplished faculty in that 93 percent
of their full-time tenured or tenure-tracked faculty has a doctorate or terminal degree.
Map 13.1 demonstrates these students come from all across the state, thus contributing to the
economic impact of the State System.
Appendix C Page 172
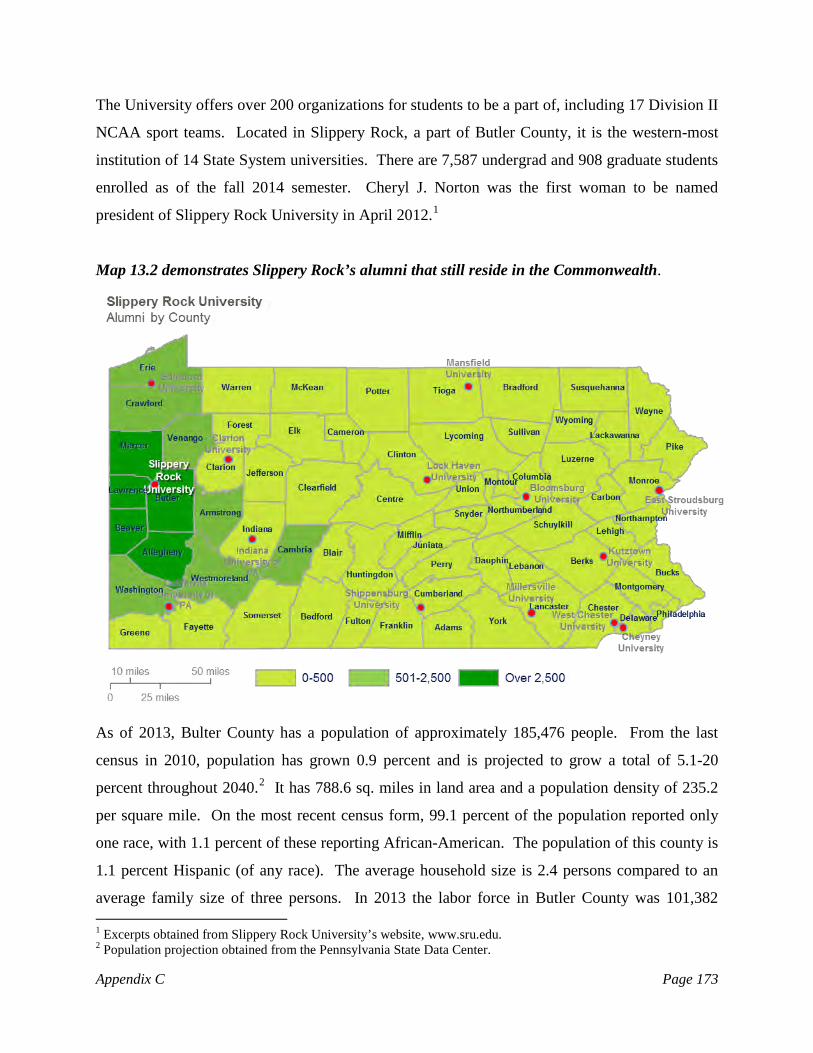
The University offers over 200 organizations for students to be a part of, including 17 Division II
NCAA sport teams. Located in Slippery Rock, a part of Butler County, it is the western-most
institution of 14 State System universities. There are 7,587 undergrad and 908 graduate students
enrolled as of the fall 2014 semester. Cheryl J. Norton was the first woman to be named
president of Slippery Rock University in April 2012.1
Map 13.2 demonstrates Slippery Rock’s alumni that still reside in the Commonwealth.
As of 2013, Bulter County has a population of approximately 185,476 people. From the last
census in 2010, population has grown 0.9 percent and is projected to grow a total of 5.1-20
percent throughout 2040.2 It has 788.6 sq. miles in land area and a population density of 235.2
per square mile. On the most recent census form, 99.1 percent of the population reported only
one race, with 1.1 percent of these reporting African-American. The population of this county is
1.1 percent Hispanic (of any race). The average household size is 2.4 persons compared to an
average family size of three persons. In 2013 the labor force in Butler County was 101,382
1 Excerpts obtained from Slippery Rock University’s website, www.sru.edu. 2 Population projection obtained from the Pennsylvania State Data Center.
Appendix C Page 173
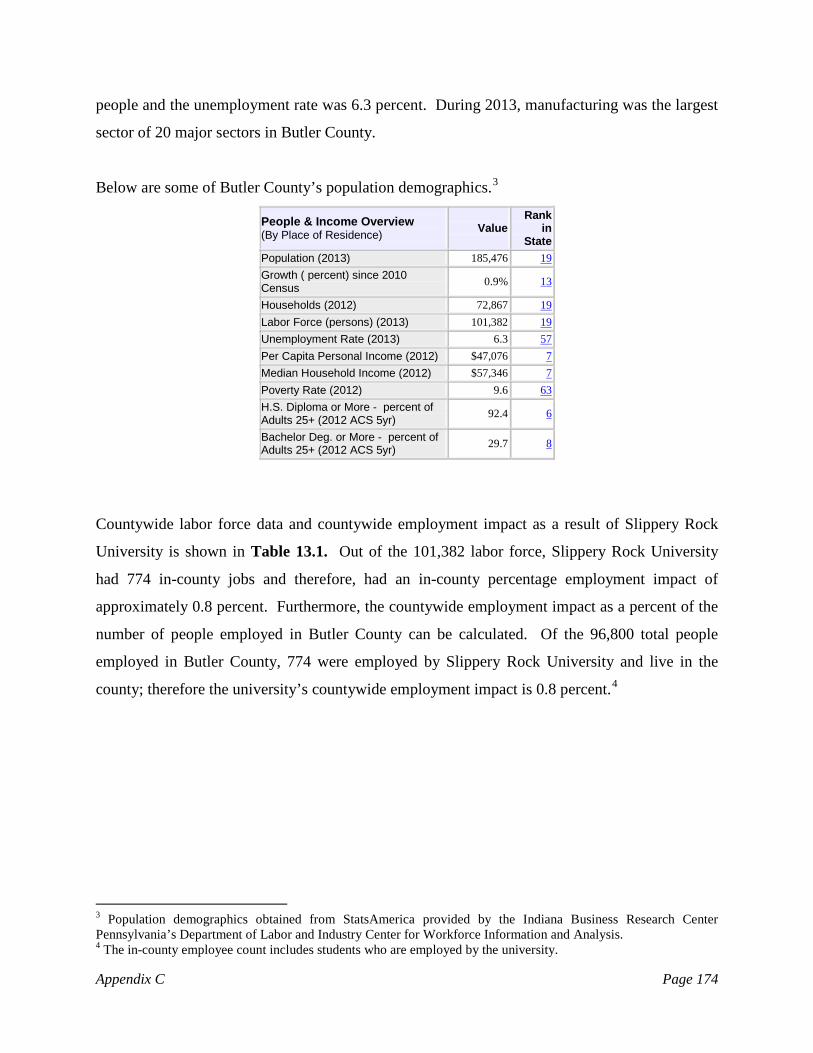
people and the unemployment rate was 6.3 percent. During 2013, manufacturing was the largest
sector of 20 major sectors in Butler County.
Below are some of Butler County’s population demographics.3
People & Income Overview (By Place of Residence) Value
Rank in
State Population (2013) 185,476 19
Growth ( percent) since 2010 Census 0.9% 13
Households (2012) 72,867 19
Labor Force (persons) (2013) 101,382 19
Unemployment Rate (2013) 6.3 57
Per Capita Personal Income (2012) $47,076 7
Median Household Income (2012) $57,346 7
Poverty Rate (2012) 9.6 63
H.S. Diploma or More - percent of Adults 25+ (2012 ACS 5yr) 92.4 6
Bachelor Deg. or More - percent of Adults 25+ (2012 ACS 5yr) 29.7 8
Countywide labor force data and countywide employment impact as a result of Slippery Rock
University is shown in Table 13.1. Out of the 101,382 labor force, Slippery Rock University
had 774 in-county jobs and therefore, had an in-county percentage employment impact of
approximately 0.8 percent. Furthermore, the countywide employment impact as a percent of the
number of people employed in Butler County can be calculated. Of the 96,800 total people
employed in Butler County, 774 were employed by Slippery Rock University and live in the
county; therefore the university’s countywide employment impact is 0.8 percent.4
3 Population demographics obtained from StatsAmerica provided by the Indiana Business Research Center Pennsylvania’s Department of Labor and Industry Center for Workforce Information and Analysis. 4 The in-county employee count includes students who are employed by the university.
Appendix C Page 174
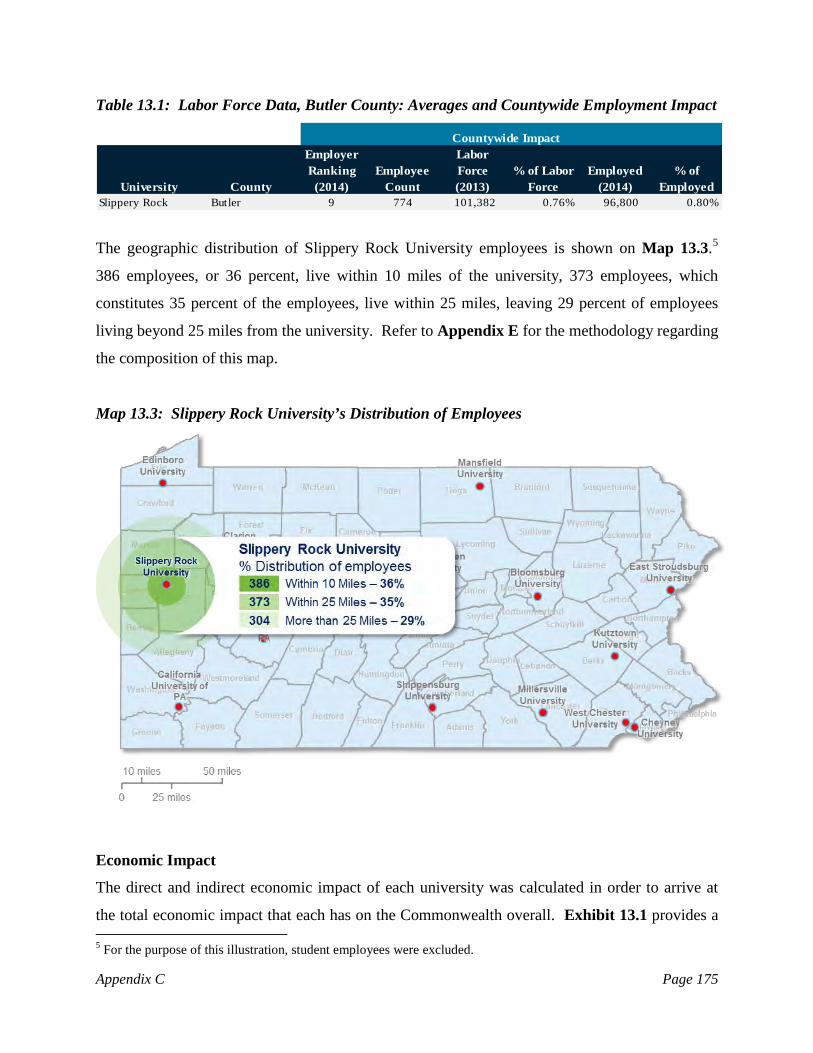
Table 13.1: Labor Force Data, Butler County: Averages and Countywide Employment Impact
Countywide Impact
University County
Employer Ranking
(2014)Employee
Count
Labor Force (2013)
% of Labor Force
Employed (2014)
% of Employed
Slippery Rock Butler 9 774 101,382 0.76% 96,800 0.80%
The geographic distribution of Slippery Rock University employees is shown on Map 13.3.5
386 employees, or 36 percent, live within 10 miles of the university, 373 employees, which
constitutes 35 percent of the employees, live within 25 miles, leaving 29 percent of employees
living beyond 25 miles from the university. Refer to Appendix E for the methodology regarding
the composition of this map.
Map 13.3: Slippery Rock University’s Distribution of Employees
Economic Impact
The direct and indirect economic impact of each university was calculated in order to arrive at
the total economic impact that each has on the Commonwealth overall. Exhibit 13.1 provides a
5 For the purpose of this illustration, student employees were excluded.
Appendix C Page 175

general overview of Slippery Rock University, as well as the direct and indirect economic and
employment impacts of the university on the Commonwealth.
A variety of data sources were used in order to calculate and analyze the spending of each
institution and its employees, students, and visitors. Please refer to Appendix E for additional
detail regarding the data sources utilized for this study. After collecting the necessary data,
multipliers were utilized to achieve the total economic impact and employment impact of
Slippery Rock University. The multipliers were obtained through the Bureau of Economic
Analysis Regional Industrial Multiplier Systems (“RIMS II”). As a whole, it is noted that
Slippery Rock University has an important role in the Commonwealth in terms of the higher
educational opportunities it provides to residents of the Commonwealth as well as the direct,
indirect, and induced economic benefits the university provides to the Commonwealth.
The total direct economic impact of Slippery Rock University on the Commonwealth was
$227,279,453. This value is represented by four main spending sources: institutional spending,
faculty/staff spending, student spending and capital expenditures. Note that the institutional
spending includes employment benefits spent primarily in the Commonwealth of Pennsylvania.
Slippery Rock University’s Direct Economic Impact on the Commonwealth
(1) Institutional spending: $48,178,716
Benefits: $29,556,312
(2) Faculty/Staff spending: $52,359,620
(3) Student spending: $91,411,886
(4) Capital Expenditures: $5,772,919
Total Direct Impact: $227,279,453
As presented in Table 13.2, the direct impact, $227,279,453, was multiplied by the applicable
state multipliers obtained from the RIMS II data, resulting in a total economic impact of Slippery
Rock University on the Commonwealth of $333,284,922. By taking the difference between the
total and direct economic impacts, the combined indirect and induced impact is calculated to be
Appendix C Page 176

$106,005,469. Please refer to Appendix E for an additional discussion related to the use of
multipliers and the methodology employed to derive the direct and indirect economic benefits.
Table 13.2: Total Economic Impact of Slippery Rock University on the Commonwealth
University Total Direct Total Indirect Total Induced Total ImpactSlippery Rock 227,279,453$ 94,196,153$ 11,809,316$ 333,284,922$
Chart 13.1: Total Economic Impact (Direct + Indirect + Induced): $333,284,922
The resulting return of taxpayer dollars via the Commonwealth’s appropriations has a significant
and measurable economic impact on the Commonwealth as a whole. Specifically, the
appropriation to Slippery Rock University made by the Commonwealth of Pennsylvania, and
allocated by the State System, for fiscal year 2013-2014 was $32,576,803. Therefore, each
dollar invested in Slippery Rock University by the Commonwealth via appropriations yielded a
return of approximately $10.23 in total economic impact, as is shown on Table 13.3.
Table 13.3: Statewide Economic Impact of Slippery Rock University Appropriations
University Total ImpactState
Appropriations RatioSlippery Rock 333,284,922$ 32,576,803$ 10.23
$227,279,453
$94,196,153
$11,809,316
Total Direct
Total Indirect
Total Induced
Appendix C Page 177

University spending in addition to the ancillary spending (faculty and students) yielded income
tax revenues to the Commonwealth, as well as to local municipalities and the state
unemployment trust fund. Table 13.4 illustrates the benefits provided by the university’s payroll
expenditures.
Table 13.4: Statewide Economic Impact of Slippery Rock University Payroll Tax Withholdings
UniversityState Tax
Withholdings Local EIT
Local Services
TaxUnemployment
TaxTotal Tax Payments
Slippery Rock 1,897,186$ 689,468$ 58,764$ 42,715$ 2,688,133$
In addition, sales tax revenue was collected by the Commonwealth as a result of the consumption
of taxable goods and services by the university’s faculty and staff as well as students. Table
13.5 illustrates the sales tax revenue collected by the Commonwealth. Please refer to Appendix
E for an additional discussion of the methodology employed to estimate the sale tax revenue
collected by the Commonwealth.
Table 13.5: Statewide Economic Impact of Slippery Rock University Sales Tax Revenue Collections
University Total Faculty and Student Spending
Spending subject to tax
Sales Tax Rate
Sales Tax Revenue
Slippery Rock 202,415,903$ 48,357,159$ 6.00% 2,901,430$
In the aggregate, the revenues realized by the Commonwealth in terms of payroll tax
withholdings and sales tax receipts for Slippery Rock University were $4,798,616or 14.7 percent
of the Commonwealth’s appropriations for fiscal year 2013-2014.
The composite spending activity of the university also has a measureable effect on employment
in the Commonwealth.6 Specifically the direct spending of three categories enumerated above
helps to create jobs. The employment impact of the aggregate spending of the university and the
ancillary spending of the faculty/staff and students is measured by the RIMS II multiplier which
6 Composite spending activity includes institutional, faculty and staff and student spending.
Appendix C Page 178
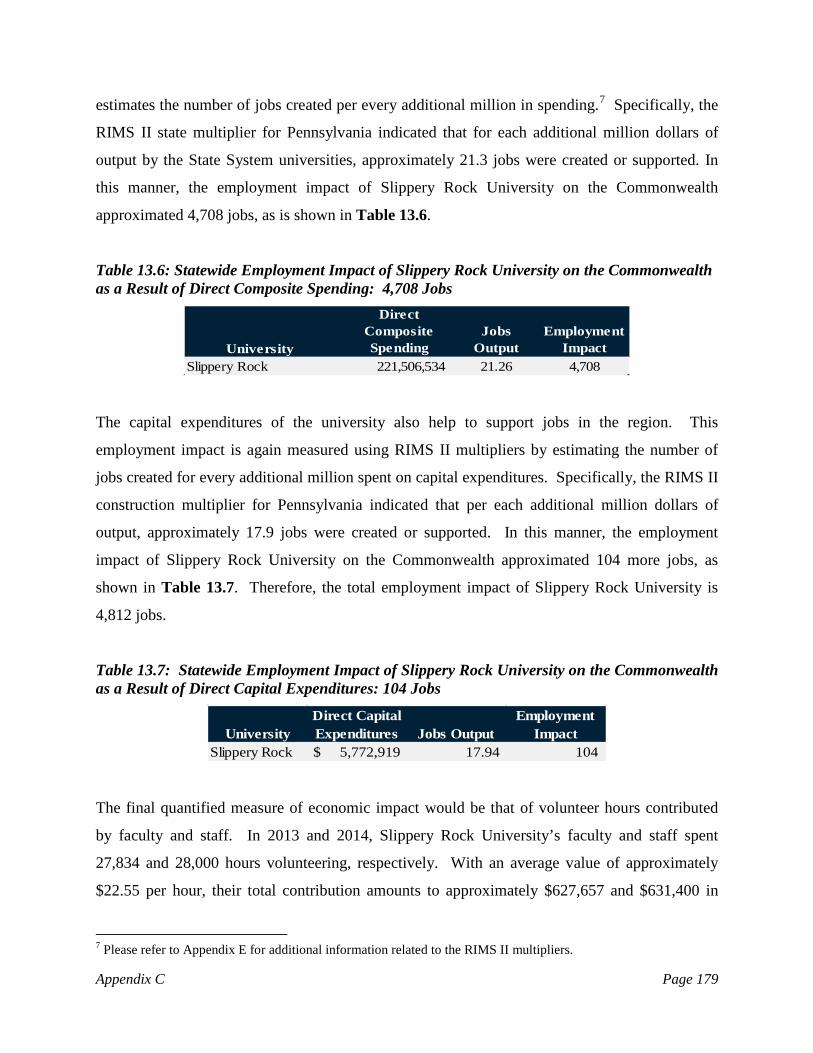
estimates the number of jobs created per every additional million in spending.7 Specifically, the
RIMS II state multiplier for Pennsylvania indicated that for each additional million dollars of
output by the State System universities, approximately 21.3 jobs were created or supported. In
this manner, the employment impact of Slippery Rock University on the Commonwealth
approximated 4,708 jobs, as is shown in Table 13.6.
Table 13.6: Statewide Employment Impact of Slippery Rock University on the Commonwealth as a Result of Direct Composite Spending: 4,708 Jobs
University
Direct Composite Spending
Jobs Output
Employment Impact
Slippery Rock 221,506,534 21.26 4,708
The capital expenditures of the university also help to support jobs in the region. This
employment impact is again measured using RIMS II multipliers by estimating the number of
jobs created for every additional million spent on capital expenditures. Specifically, the RIMS II
construction multiplier for Pennsylvania indicated that per each additional million dollars of
output, approximately 17.9 jobs were created or supported. In this manner, the employment
impact of Slippery Rock University on the Commonwealth approximated 104 more jobs, as
shown in Table 13.7. Therefore, the total employment impact of Slippery Rock University is
4,812 jobs.
Table 13.7: Statewide Employment Impact of Slippery Rock University on the Commonwealth as a Result of Direct Capital Expenditures: 104 Jobs
UniversityDirect Capital Expenditures Jobs Output
Employment Impact
Slippery Rock $ 5,772,919 17.94 104
The final quantified measure of economic impact would be that of volunteer hours contributed
by faculty and staff. In 2013 and 2014, Slippery Rock University’s faculty and staff spent
27,834 and 28,000 hours volunteering, respectively. With an average value of approximately
$22.55 per hour, their total contribution amounts to approximately $627,657 and $631,400 in
7 Please refer to Appendix E for additional information related to the RIMS II multipliers.
Appendix C Page 179

2013 and 2014. Students also devoted their time to helping the community. Slippery Rock
students spent a total of 14,896 and 23,736 hours volunteering in 2013 and 2014, respectively.8
It is likely that the students’ participation was required by university curricular and co-curricular
programs, some of which either required supervision or a faculty team leader.
Economic Development
Economic development involves improvements to the standard of living through the creation of
jobs and the support of innovation and new research in a community’s region, state, or nation.
The State System plays a role in enhancing the economic development of the regions in which
the individual universities reside by assisting in the development and growth of new and existing
businesses, as well as increasing the employment opportunities, both of which increase economic
activity in the respective areas. The universities accomplish this in various ways, such as
partnering with local businesses, providing education and job skills training, providing an outlet
for research and development through incubators, and by providing financial and technical
assistance.
The goal of Pennsylvania’s State System of Higher Education and its fourteen universities is
fundamentally to educate the citizens of the Commonwealth. By providing higher education, the
universities are not only helping to improve the economic development in the short-term, but in
the long-run as well. Therefore, by way of establishing and accomplishing its mission,
Pennsylvania’s State System is benefiting the economic advancement of the Commonwealth.
Primarily, the State System does this through the granting of undergraduate and graduate
degrees, but also does so indirectly through its purchasing, expenditures, services, and by
employing hundreds, even thousands, of people.
Overall Pennsylvania’s State System of Higher Education is a key player in supporting the
economic development and growth of communities, counties, regions, and the Commonwealth
overall. By providing sources of innovation and entrepreneurial assistance, the State System
supplies economic growth to local businesses along with highly skilled and educated candidate
8 The most recent data available for the market value of volunteer time is $22.55 for 2013 according to the Independent Sector’s Value of Volunteer Time.
Appendix C Page 180

employees. Through its various economic development activities, Slippery Rock University
successfully provides an economic competitive advantage for the county and the Commonwealth
as a whole.
While Slippery Rock University does not participate in the WEDnetPA program, this university
is taking initiatives toward economic development in other ways. For instance, Slippery Rock
University has a Sustainable Enterprise Accelerator. The mission of this program is simple, to
help entrepreneurs start business and help to maintain growth as the business develops. The
incubator is funded by state grants and run by students who receive college credit for their time.9
By helping local businesses, as well as giving student the chance to interact and learn from the
entrepreneurs, Slippery Rock University is positively impacting the economic development in its
county.
9 “Slippery Rock University program helps businesses go green, make more green”, triblive.com, visited February 25, 2015.
Appendix C Page 181

Exhibit 13.1
Location: CountyFaculty and Staff Headcount Paid in 2014
Fall 2013 Fall 2014Undergraduate 7,595 7,587 Graduate 752 908 Total 8,347 8,495
Full-time 7,411 7,471 Part-time 936 1,024 Total 8,347 8,495
PA residents 7,367 7,496 Non-residents 980 999 Total 8,347 8,495
Traditional undergraduate (students under 25) 6,974 7,000 Non-traditional undergraduate (students over 25) 621 587 Total (undergraduate only) 7,595 7,587
Room & BoardTuitionFeesTotal
Room & BoardTuitionFeesTotal
TuitionFees (per credit)Total (per credit)
Tuition (per credit)Fees (per credit)Total (per credit)
Tuition from undergraduate in-state studentsTuition from undergraduate out-of-state studentsTuition from graduate in-state studentsTuition from graduate out-of-state studentsTotal
Butler1,063
681$ 200
Financial CharacteristicsRevenues, FY 2013-2014
Undergraduate, In-State, FY 2014-2015
Graduate, Out-of-State, FY 2014-2015
Graduate, In-State, FY 2014-2015
64,359,418$
22,763$
608$
Slippery Rock University Information
Tuition46,040,747$ 9,176,969 7,427,362 1,714,340
2,739
EnrollmentEnrollment Characteristics
Undergraduate, Out-of-State, FY 2014-2015
9,794$ 6,820 2,489
19,103$
9,794$
881$
10,230
454$ 154
Cost of Attendance
Appendix C Page 182

Technology, Academic/Instruction, and Other Mandatory Fees
Non-Mandatory FeesTotal
Total from Tuition, Fees, Room & Board
32,576,803$
FederalStateLocal/Other/PrivateSystem Transfer AwardsTotal grants and contracts
Total Revenues (from sources above)
208,046$ 25,063,303$
926,100,000$
Institutional ExpendituresInstitutional spending (excluding payroll) 47,793,607$ Capital Improvements 385,109 Employee Benefits 29,556,312
Total Direct Institutional Spending 77,735,028 Institutional spending prorated by 11.76% of out of state students 9,141,529 Type 1 Multiplier 1.53
Type 1 Effect (total indirect - induced) 14,018,535 Type 2 Multiplier 2.33
Type 2 Effect (total indirect) 21,318,047 Induced Effect (type 2 effect - type 1 effect) 7,299,511 Total Impact of Institutional Spending 106,352,586$
Faculty and Staff ExpendituresFaculty and staff spending (direct) 52,359,620$ Household multiplier 1.41 Total Impact of Faculty and Staff Spending 73,717,109$
89,279 22,727,639$
18,679,135$
Total Replacement Value of Physical Plant
690,365 18,447,907$
2,323,742$
10,933,522$
4,055,802
FeesMandatory Fees
82,807,325$
Sales and Services
Education and General Appropriations
Grants and Contracts
Non-Mandatory Fees
The Institution as a Consumer in the State
Funds Raised by University (private giving)Market Value of Endowment
7,649,036
159,114,644$ Other Revenues (net of scholarship discounts and allowances)
17,757,542$
Financial Characteristics
Appendix C Page 183

Student ExpendituresStudent spending (direct) 91,411,886$ Household multiplier 1.41 Total Impact of Student Spending 128,698,794$
Capital ExpendituresCapital Improvements - 5 year weighted average 4,718,000$ Deferred Maintenance 1,054,919
Total Direct Capital Expenditures 5,772,919 Type 1 Multiplier 1.68
Type 1 Effect (total indirect - induced) 9,723,905 Type 2 Multiplier 2.47
Type 2 Effect (total indirect) 14,233,709 Induced Effect (type 2 effect - type 1 effect) 4,509,804 Total Impact of Capital Expenditures 24,516,432$
Employment impact for the CommonwealthDirect composite expenditures for the Commonwealth 221,506,534$ State multiplier 21.26Statewide Employment Impact based on Composite Spending (jobs) 4,708 Direct capital expenditures for the Commonwealth 5,772,919 State multiplier 17.94Statewide Employment Impact based on Direct Expenditures (jobs) 104 Total Employment Impact 4,812
In-Kind (Volunteer) Contributions to Regional EconomyAnnual volunteer hours of faculty and staff (2014) 28,000 Average market value of volunteer hours (per hour) 22.55$ Estimated total contribution of faculty and staff 631,400$ Annual volunteer hours of students (2014) 23,736
Small Business IncubatorSmall Business Development CenterPatents filed since January 1, 2010
Sales TaxTotal Faculty and Staff and Student Spending 202,415,903$ Imputed % of taxable spending 23.89%Spending subject to tax 48,357,159 Sales tax rate 6%Total State Sales Tax Revenue Generation 2,901,430
The University as a Generator of State Government Revenue
YesNo
0
The Institution as a Consumer in the State
The Institution as an Employer
The University as a Center for Volunteerism
Business and Economic Development Services
Appendix C Page 184

Payroll TaxTotal payroll 64,238,493$ State tax withholdings 1,897,186 Local EIT 689,468 Local Services Tax 58,764 Unemployment tax 42,715 Total Payroll Tax Payments 2,688,133
The University as a Generator of State Government Revenue
Appendix C Page 185

West Chester University of Pennsylvania Chester County, PA
West Chester University was founded in 1871 and is the largest university of the fourteen that
make up Pennsylvania’s State System of Higher Education. West Chester University offers
more than 116 undergraduate and 86 master degree programs taught by a full-time staff of 685
professors. As of fall 2014, there was approximately 16,086 degree seeking students, with the
majority pursuing an undergraduate degree. Students who attend West Chester University are
primarily from Pennsylvania, Delaware, New Jersey and Maryland.
Map 14.1 demonstrates these students come from all across the state, thus contributing to the
economic impact of the State System.
The institution offers the largest varsity program in the NCAA Division II with 24 intercollegiate
men’s and women’s sports along with maintaining over 225 student clubs and organizations.
Appendix C Page 186
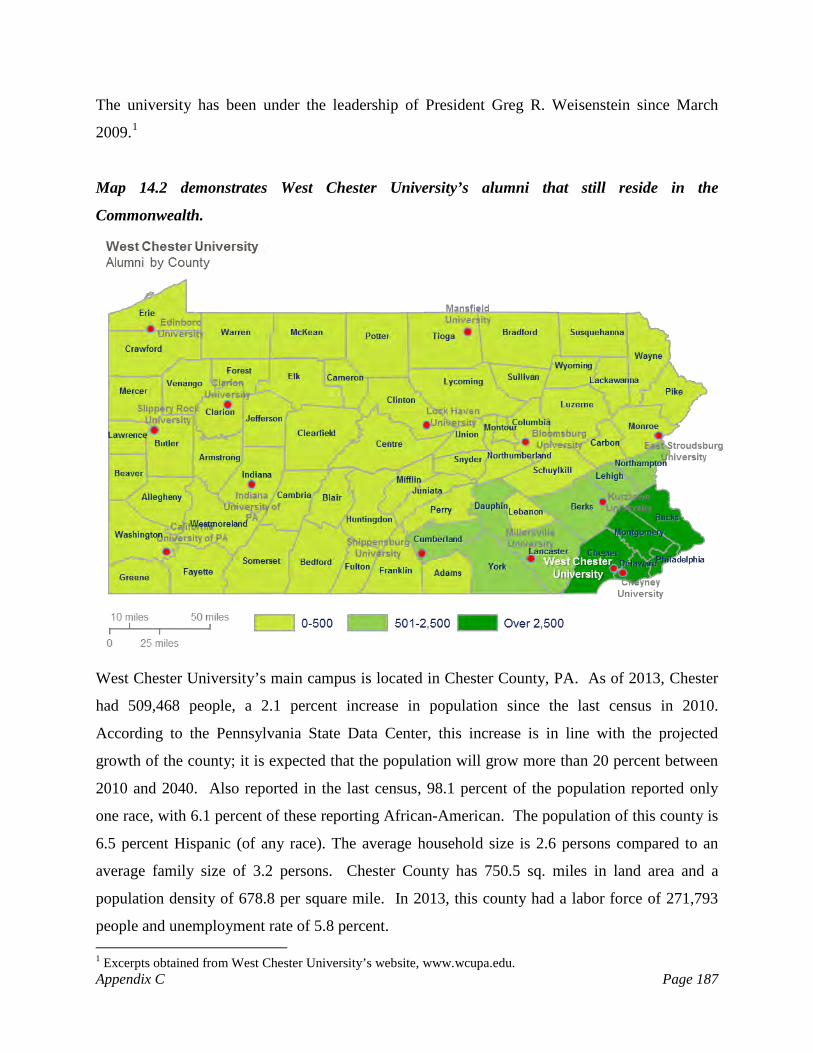
The university has been under the leadership of President Greg R. Weisenstein since March
2009.1
Map 14.2 demonstrates West Chester University’s alumni that still reside in the
Commonwealth.
West Chester University’s main campus is located in Chester County, PA. As of 2013, Chester
had 509,468 people, a 2.1 percent increase in population since the last census in 2010.
According to the Pennsylvania State Data Center, this increase is in line with the projected
growth of the county; it is expected that the population will grow more than 20 percent between
2010 and 2040. Also reported in the last census, 98.1 percent of the population reported only
one race, with 6.1 percent of these reporting African-American. The population of this county is
6.5 percent Hispanic (of any race). The average household size is 2.6 persons compared to an
average family size of 3.2 persons. Chester County has 750.5 sq. miles in land area and a
population density of 678.8 per square mile. In 2013, this county had a labor force of 271,793
people and unemployment rate of 5.8 percent.
1 Excerpts obtained from West Chester University’s website, www.wcupa.edu. Appendix C Page 187

Below are Chester County’s population demographics.2
People & Income Overview (By Place of Residence) Value
Rank in
State Population (2013) 509,468 7
Growth ( percent) since 2010 Census 2.1% 2
Households (2012) 183,793 7
Labor Force (persons) (2013) 271,793 6
Unemployment Rate (2013) 5.8 65
Per Capita Personal Income (2012) $63,741 2
Median Household Income (2012) $82,456 1
Poverty Rate (2012) 7.4 65
H.S. Diploma or More - percent of Adults 25+ (2012 ACS 5yr) 92.7 4
Bachelor Deg. or More - percent of Adults 25+ (2012 ACS 5yr) 48.3 1
Countywide labor force data and countywide employment impact as a result of West Chester
University is shown in Table 14.1. Out of the 271,793 people in the available labor force, West
Chester University had 1,635 in-county jobs and therefore, had an in-county percentage
employment impact on the available labor force of 0.6 percent. Furthermore, the countywide
employment impact as a percent of the number of people employed in Chester County can also
be calculated. Of the 258,800 total people employed in Chester County, 1,635 were employed
by West Chester University and live in the county; therefore the university’s countywide
employment impact is approximately 0.6 percent.3
2 Population demographics obtained from StatsAmerica provided by the Indiana Business Research Center Pennsylvania’s Department of Labor and Industry Center for Workforce Information and Analysis. 3 The in-county employee count includes students who are employed by the university. Appendix C Page 188
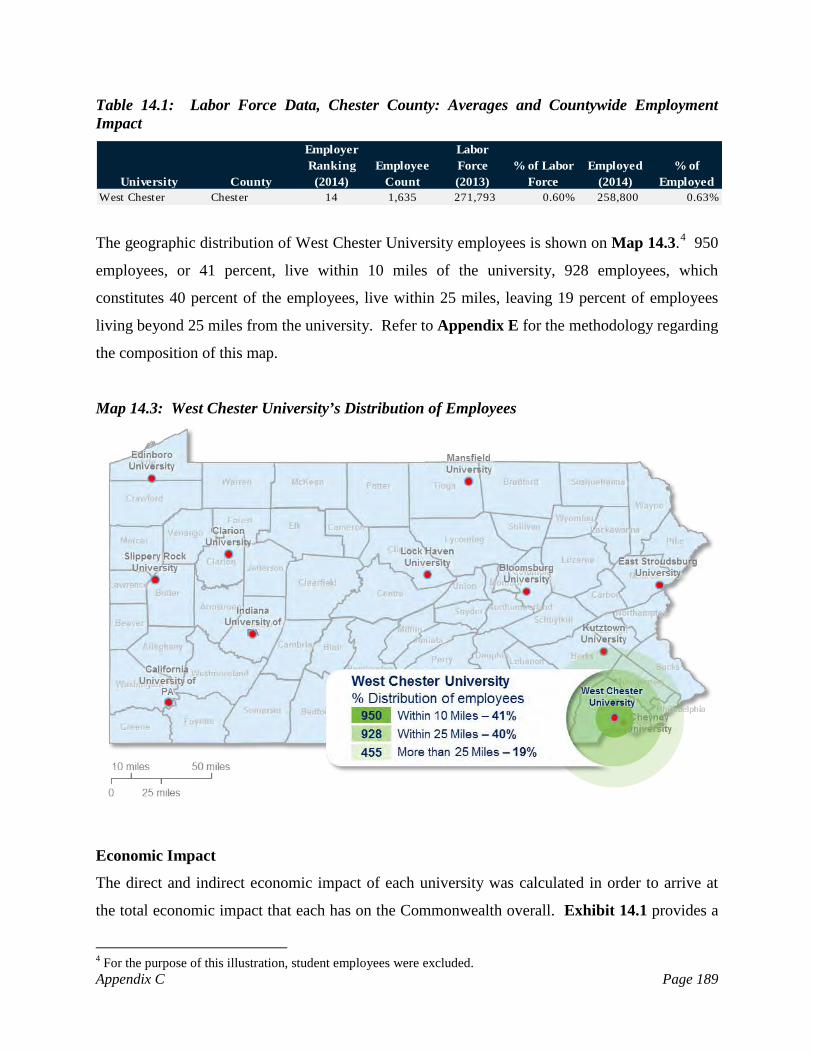
Table 14.1: Labor Force Data, Chester County: Averages and Countywide Employment Impact
University County
Employer Ranking
(2014)Employee
Count
Labor Force (2013)
% of Labor Force
Employed (2014)
% of Employed
West Chester Chester 14 1,635 271,793 0.60% 258,800 0.63%
The geographic distribution of West Chester University employees is shown on Map 14.3.4 950
employees, or 41 percent, live within 10 miles of the university, 928 employees, which
constitutes 40 percent of the employees, live within 25 miles, leaving 19 percent of employees
living beyond 25 miles from the university. Refer to Appendix E for the methodology regarding
the composition of this map.
Map 14.3: West Chester University’s Distribution of Employees
Economic Impact
The direct and indirect economic impact of each university was calculated in order to arrive at
the total economic impact that each has on the Commonwealth overall. Exhibit 14.1 provides a
4 For the purpose of this illustration, student employees were excluded. Appendix C Page 189
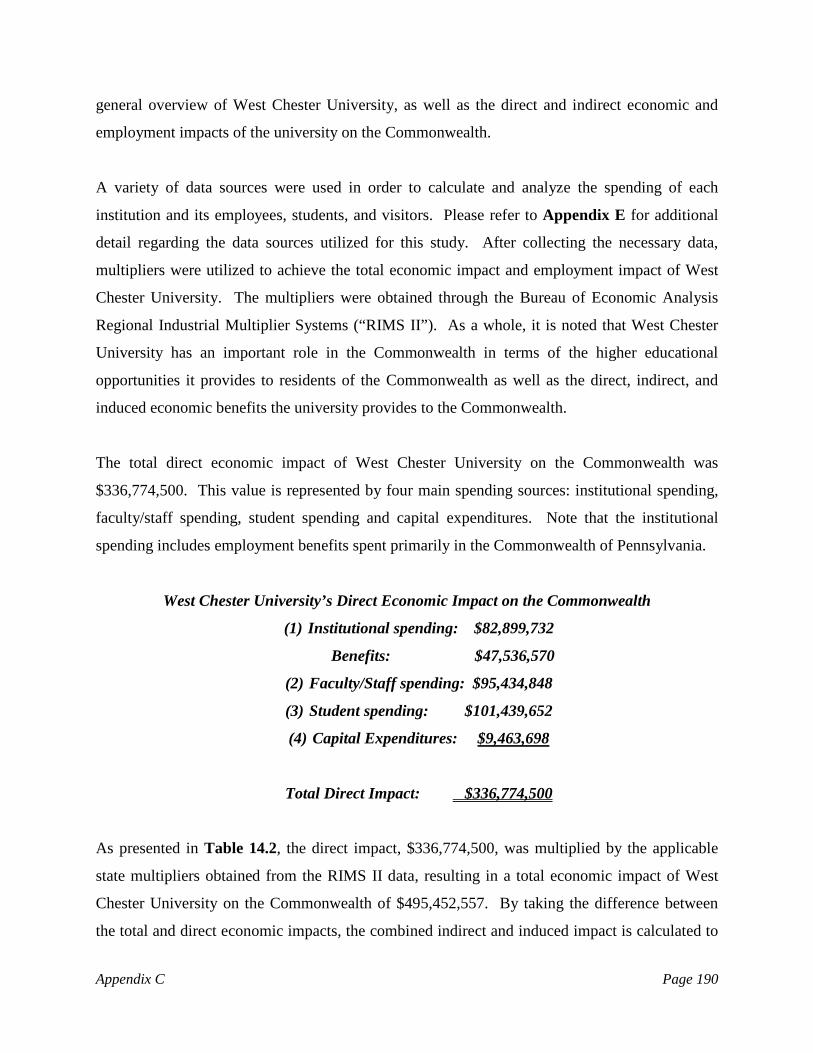
general overview of West Chester University, as well as the direct and indirect economic and
employment impacts of the university on the Commonwealth.
A variety of data sources were used in order to calculate and analyze the spending of each
institution and its employees, students, and visitors. Please refer to Appendix E for additional
detail regarding the data sources utilized for this study. After collecting the necessary data,
multipliers were utilized to achieve the total economic impact and employment impact of West
Chester University. The multipliers were obtained through the Bureau of Economic Analysis
Regional Industrial Multiplier Systems (“RIMS II”). As a whole, it is noted that West Chester
University has an important role in the Commonwealth in terms of the higher educational
opportunities it provides to residents of the Commonwealth as well as the direct, indirect, and
induced economic benefits the university provides to the Commonwealth.
The total direct economic impact of West Chester University on the Commonwealth was
$336,774,500. This value is represented by four main spending sources: institutional spending,
faculty/staff spending, student spending and capital expenditures. Note that the institutional
spending includes employment benefits spent primarily in the Commonwealth of Pennsylvania.
West Chester University’s Direct Economic Impact on the Commonwealth
(1) Institutional spending: $82,899,732
Benefits: $47,536,570
(2) Faculty/Staff spending: $95,434,848
(3) Student spending: $101,439,652
(4) Capital Expenditures: $9,463,698
Total Direct Impact: $336,774,500
As presented in Table 14.2, the direct impact, $336,774,500, was multiplied by the applicable
state multipliers obtained from the RIMS II data, resulting in a total economic impact of West
Chester University on the Commonwealth of $495,452,557. By taking the difference between
the total and direct economic impacts, the combined indirect and induced impact is calculated to
Appendix C Page 190
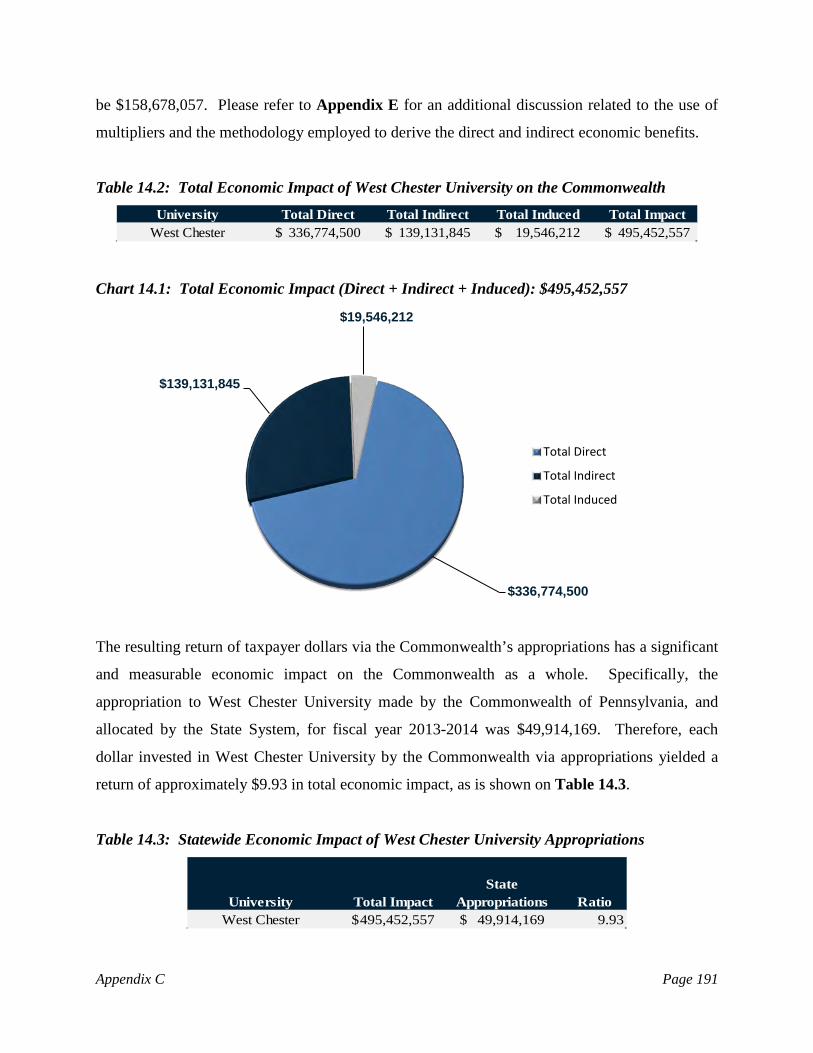
be $158,678,057. Please refer to Appendix E for an additional discussion related to the use of
multipliers and the methodology employed to derive the direct and indirect economic benefits.
Table 14.2: Total Economic Impact of West Chester University on the Commonwealth
University Total Direct Total Indirect Total Induced Total ImpactWest Chester 336,774,500$ 139,131,845$ 19,546,212$ 495,452,557$
Chart 14.1: Total Economic Impact (Direct + Indirect + Induced): $495,452,557
The resulting return of taxpayer dollars via the Commonwealth’s appropriations has a significant
and measurable economic impact on the Commonwealth as a whole. Specifically, the
appropriation to West Chester University made by the Commonwealth of Pennsylvania, and
allocated by the State System, for fiscal year 2013-2014 was $49,914,169. Therefore, each
dollar invested in West Chester University by the Commonwealth via appropriations yielded a
return of approximately $9.93 in total economic impact, as is shown on Table 14.3.
Table 14.3: Statewide Economic Impact of West Chester University Appropriations
University Total ImpactState
Appropriations RatioWest Chester 495,452,557$ 49,914,169$ 9.93
$336,774,500
$139,131,845
$19,546,212
Total Direct
Total Indirect
Total Induced
Appendix C Page 191

University spending in addition to the ancillary spending (faculty and students) yielded income
tax revenues to the Commonwealth, as well as to local municipalities and the state
unemployment trust fund. Table 14.4 illustrates the benefits provided by the university’s payroll
expenditures.
Table 14.4: Statewide Economic Impact of West Chester University Payroll Tax Withholdings
UniversityState Tax
Withholdings Local EIT
Local Services
TaxUnemployment
TaxTotal Tax Payments
West Chester 3,349,207$ 1,348,667$ 126,464$ 76,982$ 4,901,319$
In addition, sales tax revenue was collected by the Commonwealth as a result of the consumption
of taxable goods and services by the university’s faculty and staff as well as students. Table
14.5 illustrates the sales tax revenue collected by the Commonwealth. Please refer to Appendix
E for an additional discussion of the methodology employed to estimate the sale tax revenue
collected by the Commonwealth.
Table 14.5: Statewide Economic Impact of West Chester University Sales Tax Revenue Collections
University Total Faculty and Student Spending
Spending subject to tax
Sales Tax Rate
Sales Tax Revenue
West Chester 277,179,609$ 66,218,208$ 6.00% 3,973,093$
In the aggregate, the revenues realized by the Commonwealth in terms of payroll tax
withholdings and sales tax receipts for West Chester University were $7,322,299or 14.7 percent
of the Commonwealth’s appropriations for fiscal year 2013-2014.
The composite spending activity of the university also has a measureable effect on employment
in the Commonwealth.5 Specifically the direct spending of three categories enumerated above
helps to create jobs. The employment impact of the aggregate spending of the university and the
ancillary spending of the faculty/staff and students is measured by the RIMS II multiplier which
5 Composite spending activity includes institutional, faculty and staff and student spending. Appendix C Page 192

estimates the number of jobs created per every additional million in spending.6 Specifically, the
RIMS II state multiplier for Pennsylvania indicated that for each additional million dollars of
output by the State System universities, approximately 21.3 jobs were created or supported. In
this manner, the employment impact of West Chester University on the Commonwealth
approximated 6,957 jobs, as is shown in Table 14.6.
Table 14.6: Statewide Employment Impact of West Chester University on the Commonwealth as a Result of Direct Composite Spending: 6,957 Jobs
University
Direct Composite Spending
Jobs Output
Employment Impact
West Chester 327,310,802 21.26 6,957
The capital expenditures of the university also help to support jobs in the region. This
employment impact is again measured using RIMS II multipliers by estimating the number of
jobs created for every additional million spent on capital expenditures. Specifically, the RIMS II
construction multiplier for Pennsylvania indicated that per each additional million dollars of
output, 17.9 jobs were created or supported. In this manner, the employment impact of West
Chester University on the Commonwealth approximated 170 more jobs, as shown in Table 12.7.
Therefore, the total employment impact of West Chester University is 7,127 jobs.
Table 12.7: Statewide Employment Impact of West Chester University on the Commonwealth as a Result of Direct Capital Expenditures: 170 Jobs
UniversityDirect Capital Expenditures Jobs Output
Employment Impact
West Chester $ 9,463,698 17.94 170
The final quantified measure of economic impact would be that of volunteer hours contributed
by faculty and staff. While the faculty and staff hours were not tracked, students did devote their
time to helping the community. West Chester University students spent a total of 408,665 and
605,532 hours volunteering in 2013 and 2014, respectively. It is likely that the students’
6 Please refer to Appendix E for additional information related to the RIMS II multipliers. Appendix C Page 193

participation was required by university curricular and co-curricular programs, some of which
either required supervision or a faculty team leader.
Economic Development
Economic development involves improvements to the standard of living through the creation of
jobs and the support of innovation and new research in a community’s region, state, or nation.
The State System plays a role in enhancing the economic development of the regions in which
the individual universities reside by assisting in the development and growth of new and existing
businesses, as well as increasing the employment opportunities, both of which increase economic
activity in the respective areas. The universities accomplish this in various ways, such as
partnering with local businesses, providing education and job skills training, providing an outlet
for research and development through incubators, and by providing financial and technical
assistance.
The goal of Pennsylvania’s State System of Higher Education and its 14 universities is
fundamentally to educate the citizens of the Commonwealth. By providing higher education, the
universities are not only helping to improve the economic development in the short-term, but in
the long-run as well. Therefore, by way of establishing and accomplishing its mission,
Pennsylvania’s State System is benefiting the economic advancement of the Commonwealth.
Primarily, the State System does this through the granting of undergraduate and graduate
degrees, but also does so indirectly through its purchasing, expenditures, services, and by
employing hundreds, even thousands, of people.
Overall Pennsylvania’s State System of Higher Education is a key player in supporting the
economic development and growth of communities, counties, regions, and the Commonwealth
overall. By providing sources of innovation and entrepreneurial assistance, the State System
supplies economic growth to local businesses along with highly skilled and educated candidate
employees. Through its various economic development activities, West Chester University
successfully provides an economic competitive advantage for the county and the Commonwealth
as a whole.
Appendix C Page 194

West Chester University’s participation in the WEDnetPA program had over 600 participants
and had a total of $248,850 funds awarded in 2014. Additionally, West Chester University has
an Entrepreneurial Leadership Center which serves as a catalyst for regional economic
development by promoting entrepreneurship across West Chester University, in Chester County,
and throughout Southeastern Pennsylvania. The center’s mission is to enhance entrepreneurship
literacy, to inspire students to engage in entrepreneurial ventures by exposing them first hand to
entrepreneurs and entrepreneurial environments, and to foster economic development in the
region by assisting startup firms as they move toward economic viability. The center offers a
wide array of programs including: an internship program, consulting project, an entrepreneurship
speaker series, seminars and workshops, an entrepreneurial fellowship program, and many
more.7 By establishing the center, and West Chester’s participation in the WEDnetPA program,
the university is effectively contributing to the economic development in Chester County.
7 Excerpt obtained from West Chester University’s website, www.wcupa.edu. Appendix C Page 195

Exhibit 14.1
Location: CountyFaculty and Staff Headcount Paid in 2014
Fall 2013 Fall 2014Undergraduate 13,711 13,844 Graduate 2,134 2,242 Total 15,845 16,086
Full-time 13,250 13,403 Part-time 2,595 2,683 Total 15,845 16,086
PA residents 13,790 14,209 Non-residents 2,055 1,877 Total 15,845 16,086
Traditional undergraduate (students under 25) 12,464 12,537 Non-traditional undergraduate (students over 25) 1,244 1,306 Total (undergraduate only)¹ 13,708 13,843
Room & BoardTuitionFees³Total
Room & BoardTuitionFeesTotal
Tuition (per credit)Fees (per credit)Total (per credit)
Tuition (per credit)Fees (per credit)Total (per credit)
Tuition from undergraduate in-state studentsTuition from undergraduate out-of-state studentsTuition from graduate in-state studentsTuition from graduate out-of-state studentsTotal
804$
17,050
454$
123
West Chester University Information
Tuition79,118,426$ 29,401,392 13,913,495 3,046,238
2,544 26,970$
Graduate, In-State, FY 2014-2015
Chester2,333
565$
681$
Enrollment Characteristics
Undergraduate, Out-of-State, FY 2014-2015
7,376$ 6,820 2,324
16,520$
7,376$
125,479,551$
111
Enrollment
Financial CharacteristicsRevenues, FY 2013-2014
Cost of AttendanceUndergraduate, In-State, FY 2014-2015
Graduate, Out-of-State, FY 2014-2015
Appendix C Page 196

Technology, Academic/Instruction, and Other Mandatory Fees
Non-Mandatory FeesTotal
Total from Tuition, Fees, Room & Board
49,914,169$
FederalStateLocal/Other/PrivateSystem Transfer AwardsTotal grants and contracts
Total Revenues (from sources above)
2,105,855$ 31,659,193$
1,367,000,000$
Institutional ExpendituresInstitutional spending (excluding payroll) 80,439,820$ Capital Improvements 2,459,912 Employee Benefits 47,536,570
Total Direct Institutional Spending 130,436,302 Institutional spending prorated by 11.67% of out of state students 15,220,001 Type 1 Multiplier 1.53
Type 1 Effect (total indirect - induced) 23,339,872 Type 2 Multiplier 2.33
Type 2 Effect (total indirect) 35,493,043 Induced Effect (type 2 effect - type 1 effect) 12,153,171 Total Impact of Institutional Spending 178,082,516$
Faculty and Staff ExpendituresFaculty and staff spending (direct) 95,434,848 Household multiplier 1.41 Total Impact of Faculty and Staff Spending 134,362,722$
Financial Characteristics
26,887,784$
41,237,379$
Total Replacement Value of Physical Plant
2,103,185 30,087,366$
184,927
FeesMandatory Fees
Education and General Appropriations
Grants and Contracts
Other Revenues (net of scholarship discounts and allowances)
3,811,371$
15,507,658$
The Institution as a Consumer in the State
Non-Mandatory Fees27,984,181$
Funds Raised by University (private giving)Market Value of Endowment
10,542,854
277,417,620$
652,345
155,566,917$
Sales and Services
Appendix C Page 197
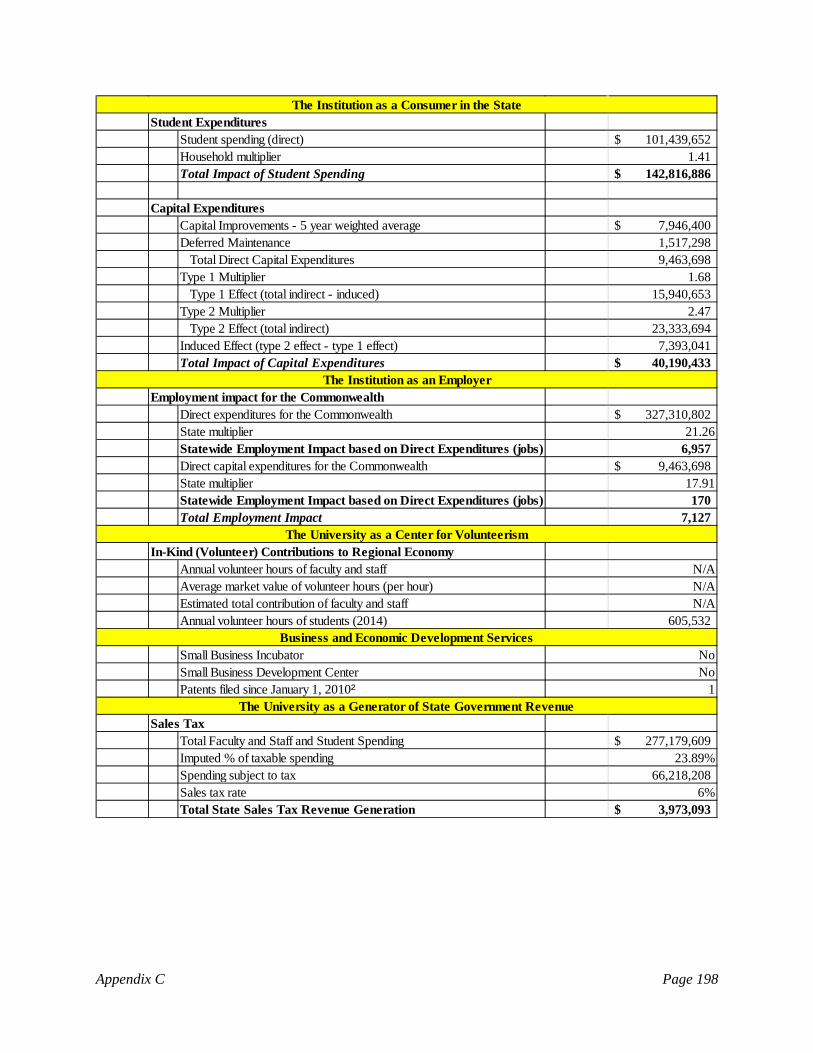
Student ExpendituresStudent spending (direct) 101,439,652$ Household multiplier 1.41 Total Impact of Student Spending 142,816,886$
Capital ExpendituresCapital Improvements - 5 year weighted average 7,946,400$ Deferred Maintenance 1,517,298
Total Direct Capital Expenditures 9,463,698 Type 1 Multiplier 1.68
Type 1 Effect (total indirect - induced) 15,940,653 Type 2 Multiplier 2.47
Type 2 Effect (total indirect) 23,333,694 Induced Effect (type 2 effect - type 1 effect) 7,393,041 Total Impact of Capital Expenditures 40,190,433$
Employment impact for the CommonwealthDirect expenditures for the Commonwealth 327,310,802$ State multiplier 21.26Statewide Employment Impact based on Direct Expenditures (jobs) 6,957 Direct capital expenditures for the Commonwealth 9,463,698$ State multiplier 17.91Statewide Employment Impact based on Direct Expenditures (jobs) 170 Total Employment Impact 7,127
In-Kind (Volunteer) Contributions to Regional EconomyAnnual volunteer hours of faculty and staff N/AAverage market value of volunteer hours (per hour) N/AEstimated total contribution of faculty and staff N/AAnnual volunteer hours of students (2014) 605,532
Small Business IncubatorSmall Business Development CenterPatents filed since January 1, 2010²
Sales TaxTotal Faculty and Staff and Student Spending 277,179,609$ Imputed % of taxable spending 23.89%Spending subject to tax 66,218,208 Sales tax rate 6%Total State Sales Tax Revenue Generation 3,973,093$
The University as a Generator of State Government Revenue
NoNo
1
The Institution as an Employer
The University as a Center for Volunteerism
The Institution as a Consumer in the State
Business and Economic Development Services
Appendix C Page 198
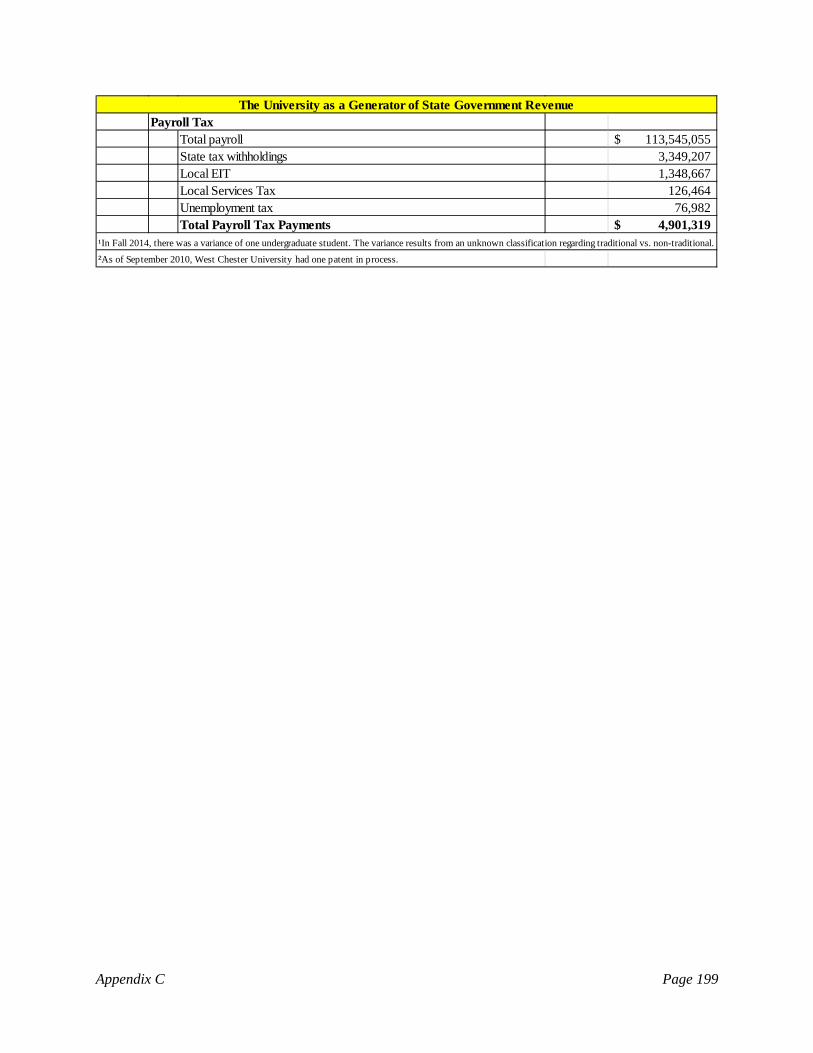
Payroll TaxTotal payroll 113,545,055$ State tax withholdings 3,349,207 Local EIT 1,348,667 Local Services Tax 126,464 Unemployment tax 76,982 Total Payroll Tax Payments 4,901,319$
¹In Fall 2014, there was a variance of one undergraduate student. The variance results from an unknown classification regarding traditional vs. non-traditional.
²As of September 2010, West Chester University had one patent in process.
The University as a Generator of State Government Revenue
Appendix C Page 199
System-wide Functions and Services Dauphin County, PA
System-wide Functions and Services are primarily located at the Dixon University Center in
Harrisburg and include: System-wide shared administrative services; System leadership
functions of the Chancellor and Board of Governors; some System-wide initiatives and grants
managed on behalf of the universities; and the academic, student, and facilities support for the
multi-university sites in Harrisburg and Philadelphia. Of the 14 state-owned universities within
Pennsylvania’s State System of Higher Education, Bloomsburg, Indiana University of
Pennsylvania, Lock Haven, Millersville, and Shippensburg offer one or more programs at the
Dixon University Center. The State System began operating the six-and-one-half-acre site under
a lease/purchase agreement in 1988, and purchased the site in 1991. In 1993, the State System
Board of Governors acknowledged the leadership and generosity of its founding chairman, F.
Eugene Dixon, Jr., by renaming the center in his honor.
The State System’s acquisition of the early twentieth century facility demonstrates a commitment
to bring educational programs and opportunities to the Harrisburg area that the 14 universities
have provided throughout the Commonwealth for over 150 years. Under the State System’s
stewardship, the five original structures were renovated and an Administration Building
constructed to make the facility adequate for classroom instruction and business purposes. The
programs offered through the center range from undergraduate and graduate programs;
continuing education and professional development; and customized training solutions for adult
learners looking for a part-time and flexible education. The Dixon University Center is also
paired with four private institutions: Elizabethtown College, Immaculata University, Lebanon
Valley College, and Rochester Institute of Technology.1
Dauphin County had a population of 270,937 people in 2013. The population in this county has
grown 1.1 percent since the last census in 2010. The average household size is 2.4 persons
compared to an average family size of three persons. It has 525.0 sq. miles in land area and a
population density of 516.1 per square mile. On the most recent census form, 96.9 percent of the
population reported only one race, with 18 percent of these reporting African-American. The
1 Excerpts obtained from The Dixon University Center’s website, www.dixonuniversitycenter.org.
Appendix C Page 200

population of this county is seven percent Hispanic (of any race). The labor force in 2013
consisted of 139,052 people and the rate of unemployment was 6.9 percent. In 2013, health care
and social assistance was the largest of 20 major sectors.
Below are some of Dauphin County’s population demographics.2
People & Income Overview (By Place of Residence) Value
Rank in
State Population (2013) 270,937 15
Growth (percent) since 2010 Census 1.1% 11
Households (2012) 108,831 15
Labor Force (persons) (2013) 139,052 15
Unemployment Rate (2013) 6.9 47
Per Capita Personal Income (2012) $45,396 10
Median Household Income (2012) $53,480 19
Poverty Rate (2012) 13.8 34
H.S. Diploma or More - percent of Adults 25+ (2012 ACS 5yr) 89.0 21
Bachelor Deg. or More - percent of Adults 25+ (2012 ACS 5yr) 28.5 9
Countywide labor force data and countywide employment impact as a result of System-wide
Functions and Services is shown in Table 15.6. Out of the 139,052 in the labor force, System-
wide Functions and Services employed 69 in-county jobs and therefore had an in-county
percentage employment impact of half of one percent. Furthermore, the countywide
employment impact as a percent of the number of people employed in Dauphin County can be
calculated. Of the 131,800 total people employed in Dauphin County, 69 were employed by
System-wide Functions and Services and live in the county; therefore the countywide
employment impact is half of one percent.3
2 Population demographics obtained from StatsAmerica provided by the Indiana Business Research Center Pennsylvania’s Department of Labor and Industry Center for Workforce Information and Analysis. 3 The in-county employee county includes students who are employed by the entity.
Appendix C Page 201
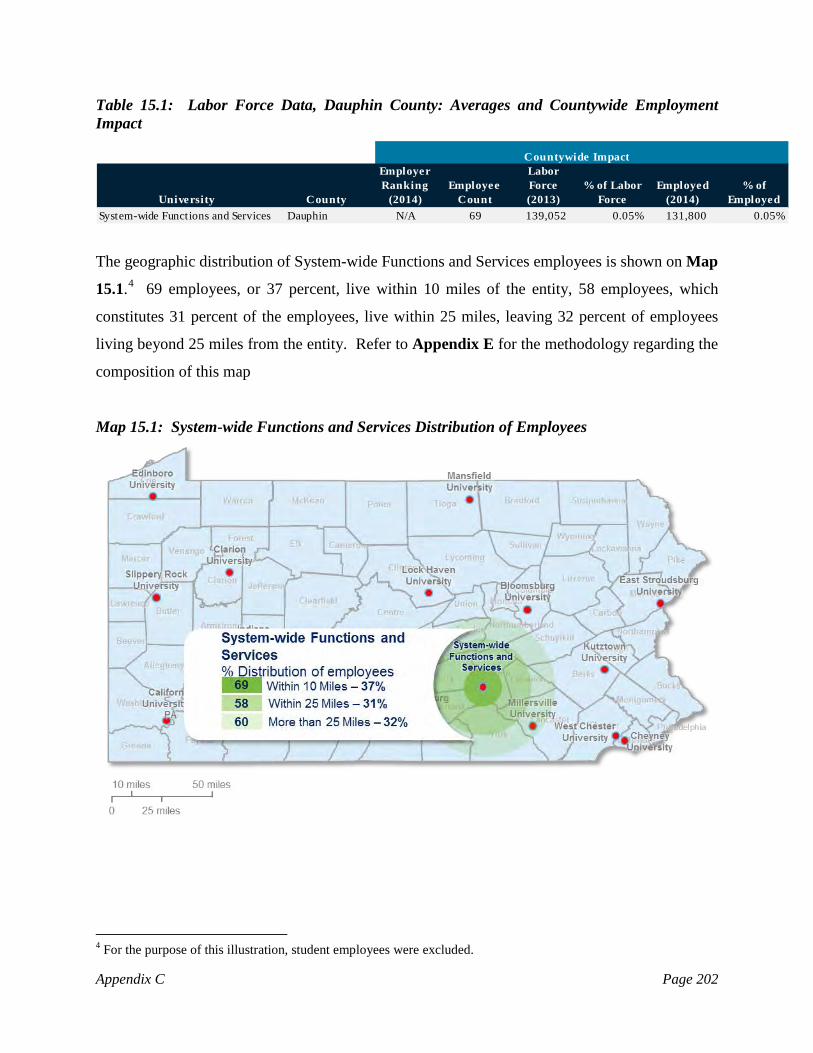
Table 15.1: Labor Force Data, Dauphin County: Averages and Countywide Employment Impact
Countywide Impact
University County
Employer Ranking
(2014)Employee
Count
Labor Force (2013)
% of Labor Force
Employed (2014)
% of Employed
System-wide Functions and Services Dauphin N/A 69 139,052 0.05% 131,800 0.05%
The geographic distribution of System-wide Functions and Services employees is shown on Map
15.1.4 69 employees, or 37 percent, live within 10 miles of the entity, 58 employees, which
constitutes 31 percent of the employees, live within 25 miles, leaving 32 percent of employees
living beyond 25 miles from the entity. Refer to Appendix E for the methodology regarding the
composition of this map
Map 15.1: System-wide Functions and Services Distribution of Employees
4 For the purpose of this illustration, student employees were excluded.
Appendix C Page 202
Economic Impact
The direct and indirect economic impact of each university, and System-wide Functions and
Services, was calculated in order to arrive at the total economic impact that each has on the
Commonwealth overall. Exhibit 15.1 provides a general overview of System-wide Functions
and Services, as well as the direct and indirect economic and employment impacts of the entity
on the Commonwealth.
A variety of data sources were used in order to calculate and analyze the spending of each
institution and its employees, students, and visitors. Please refer to Appendix E for additional
detail regarding the data sources utilized for this study. After collecting the necessary data,
multipliers were utilized to achieve the total economic impact and employment impact of
System-wide Functions and Services. The multipliers were obtained through the Bureau of
Economic Analysis Regional Industrial Multiplier Systems (“RIMS II”). As a whole, it is noted
that System-wide Functions and Services has an important role in the Commonwealth in terms of
the higher educational opportunities it provides to residents of the Commonwealth as well as the
direct, indirect, and induced economic benefits System-wide Functions and Services provides to
the Commonwealth.
The total direct economic impact of System-wide Functions and Services on the Commonwealth
was $16,050,363. This value is represented by two main spending sources: institutional
spending and staff spending. Note that the institutional spending includes employment benefits
spent primarily in the Commonwealth of Pennsylvania.
System-wide Functions and Services Direct Economic Impact on the Commonwealth
(1) Institutional spending: $4,729,154
Benefits: $2,162,562
(2) Staff spending: $10,728,425
Total Direct Impact: $16,050,363
Appendix C Page 203

As presented in Table 15.2, the direct impact, $16,050,363, was multiplied by the applicable
state multipliers obtained from the RIMS II data, resulting in a total economic impact of System-
wide Functions and Services on the Commonwealth of $37,086,814. By taking the difference
between the total and direct economic impacts, the combined indirect and induced impact is
calculated to be $21,036,451. Please refer to Appendix E for an additional discussion related to
the use of multipliers and the methodology employed to derive the direct and indirect economic
benefits.
Table 15.2: Total Economic Impact of System-wide Functions and Services on the Commonwealth
University Total Direct Total Indirect Total Induced Total ImpactSystem-wide Functions and Services
16,050,363$ 16,786,884$ 4,249,567$ 37,086,814$
Chart 15.1: Total Economic Impact (Direct + Indirect + Induced): $37,086,814
The resulting return of taxpayer dollars via the Commonwealth’s appropriations has a significant
and measurable economic impact on the Commonwealth as a whole. Per Act 188 of 1982,
funding for the Board of Governors and Chancellor functions, one component of System-wide
Functions and Services, is provided annually from half of one percent of state appropriations,
tuition, room, and board charges. Other limited System-wide activities are allocated a portion of
$16,050,363
$16,786,884
$4,249,567
Total Direct
Total Indirect
Total Induced
Appendix C Page 204

the System’s appropriation by the Board of Governors and managed centrally in Harrisburg. In
total, the fiscal year 2013-2014 budget of System-wide Functions and Services funded by state
appropriations was $4,838,914. Therefore, each dollar invested in System-wide Functions and
Services yielded a return of $7.66 in total economic impact, as is shown on Table 15.3.
Table 15.3: State Economic Impact of System-wide Functions and Services Appropriations
University Total ImpactState
Appropriations RatioSystem-wide Functions and Services 37,086,814$ 4,838,914$ 7.66
Spending in addition to the ancillary spending of staff yielded income tax revenues to the
Commonwealth, as well as to local municipalities and the state unemployment trust fund. Table
15.4 illustrates the benefits provided by System-wide Functions and Services’ payroll
expenditures.
Table 15.4: State Economic Impact of System-wide Functions and Services Payroll Tax Withholdings
UniversityState Tax
Withholdings Local EIT
Local Services
TaxUnemployment
TaxTotal Tax Payments
System-wide Functions and Services
390,398$ 200,864$ 7,946$ 8,396$ 607,604$
In addition, sales tax revenue was collected by the Commonwealth as a result of the consumption
of taxable goods and services by System-wide Functions and Services’ staff. Table 15.5
illustrates the sales tax revenue collected by the Commonwealth. Please refer to Appendix E for
an additional discussion of the methodology employed to estimate the sale tax revenue collected
by the Commonwealth.
Table 15.5: State Economic Impact of System-wide Functions and Services Sales Tax Revenue Collections
University Total Faculty
Spending Spending
subject to tax Sales
Tax Rate Sales Tax Revenue
System-wide Functions and Services
15,104,550$ 3,608,477$ 6.00% 216,509$
Appendix C Page 205
In the aggregate, the revenues realized by the Commonwealth in terms of payroll tax
withholdings and sales tax receipts for System-wide Functions and Services were $606,906 or
12.5 percent of the Commonwealth’s appropriations for fiscal year 2013-2014.
The composite spending activity also has a measureable effect on employment in the
Commonwealth. Specifically the direct spending of the three categories enumerated above helps
to create jobs. The employment impact of the aggregate spending of the entity and the ancillary
spending of the staff is measured by the RIMS II5 multiplier which estimates the number of jobs
created per every additional million in spending. Specifically, the RIMS II state multiplier for
Pennsylvania indicated that for each additional million dollars of output by a State System
institution, approximately 21.3 jobs were created or supported. In this manner, the employment
impact of System-wide Function and Services on the Commonwealth approximated 341 jobs, as
is shown in Table 15.6.
Table 15.6: Statewide Employment of System-wide Functions and Services on the Commonwealth: 341 Jobs
University Total DirectJobs
OutputEmployment
ImpactSystem-wide Functions and Services
16,050,363 21.26 341
Economic Development
Economic development involves improvements to the standard of living through the creation of
jobs and the support of innovation and new research in a community’s region, state, or nation.
The State System plays a role in enhancing the economic development of the regions in which
the individual universities reside by assisting in the development and growth of new and existing
businesses, as well as increasing the employment opportunities, both of which increase economic
activity in the respective areas. The universities accomplish this in various ways, such as
partnering with local businesses, providing education and job skills training, providing an outlet
for research and development through incubators, and by providing financial and technical
assistance.
5 Please refer to Appendix E for additional information related to the RIMS II multipliers.
Appendix C Page 206

The goal of Pennsylvania’s State System of Higher Education and its 14 universities is
fundamentally to educate the citizens of the Commonwealth. By providing higher education, the
universities are not only helping to improve the economic development in the short-term, but in
the long-run as well. Therefore, by way of establishing and accomplishing its mission,
Pennsylvania’s State System is benefiting the economic advancement of the Commonwealth.
Primarily, the State System does this through the granting of undergraduate and graduate
degrees, but also does so indirectly through its purchasing, expenditures, services, and by
employing hundreds, even thousands, of people.
Overall, Pennsylvania’s State System of Higher Education is a key player in supporting the
economic development and growth of communities, counties, regions, and the Commonwealth
overall. By providing sources of innovation and entrepreneurial assistance, the State System
supplies economic growth to local businesses along with highly skilled and educated candidate
employees. System-wide Functions and Services, as an integral part of the State System, aides
the State System universities in providing an economic and competitive advantage in their
respective regions and the state as a whole.
Appendix C Page 207
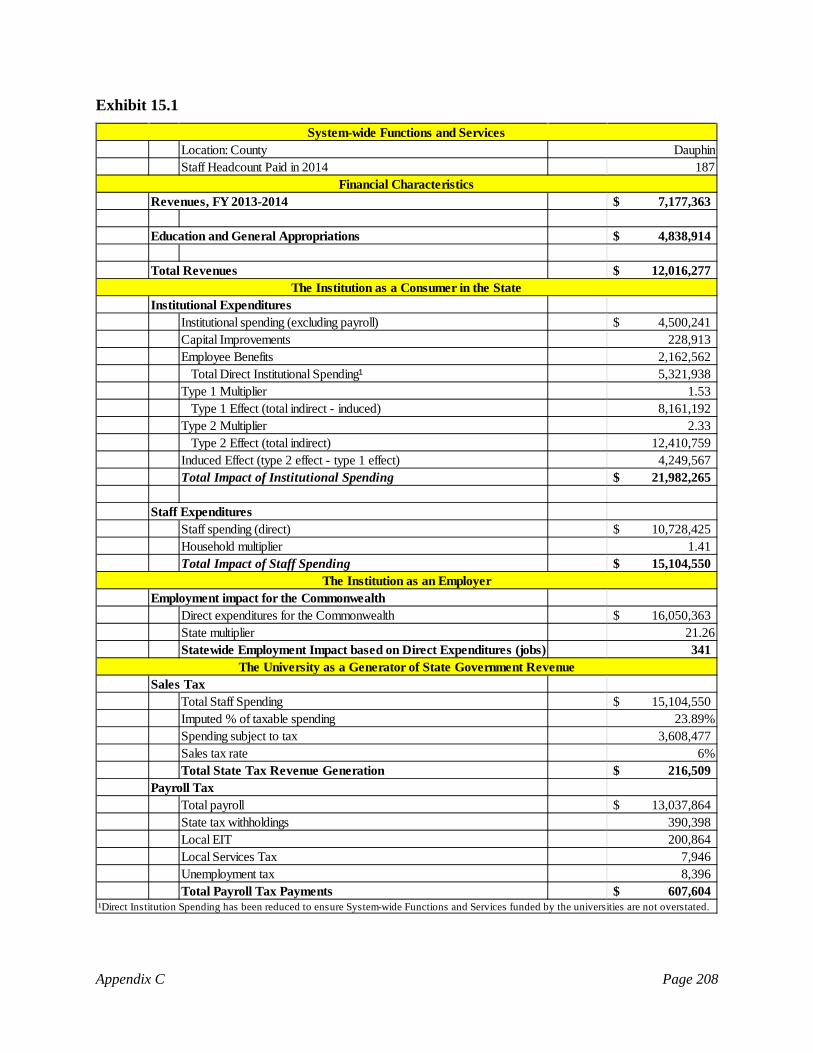
Exhibit 15.1
Location: CountyStaff Headcount Paid in 2014 187
7,177,363$
4,838,914$
Total Revenues 12,016,277$
Institutional ExpendituresInstitutional spending (excluding payroll) 4,500,241$ Capital Improvements 228,913 Employee Benefits 2,162,562
Total Direct Institutional Spending¹ 5,321,938 Type 1 Multiplier 1.53
Type 1 Effect (total indirect - induced) 8,161,192 Type 2 Multiplier 2.33
Type 2 Effect (total indirect) 12,410,759 Induced Effect (type 2 effect - type 1 effect) 4,249,567 Total Impact of Institutional Spending 21,982,265$
Staff ExpendituresStaff spending (direct) 10,728,425$ Household multiplier 1.41 Total Impact of Staff Spending 15,104,550$
Employment impact for the CommonwealthDirect expenditures for the Commonwealth 16,050,363$ State multiplier 21.26Statewide Employment Impact based on Direct Expenditures (jobs) 341
Sales TaxTotal Staff Spending 15,104,550$ Imputed % of taxable spending 23.89%Spending subject to tax 3,608,477 Sales tax rate 6%Total State Tax Revenue Generation 216,509$
Payroll TaxTotal payroll 13,037,864$ State tax withholdings 390,398 Local EIT 200,864 Local Services Tax 7,946 Unemployment tax 8,396 Total Payroll Tax Payments 607,604$
¹Direct Institution Spending has been reduced to ensure System-wide Functions and Services funded by the universities are not overstated.
The University as a Generator of State Government Revenue
System-wide Functions and Services
Education and General Appropriations
The Institution as a Consumer in the State
The Institution as an Employer
Dauphin
Financial CharacteristicsRevenues, FY 2013-2014
Appendix C Page 208
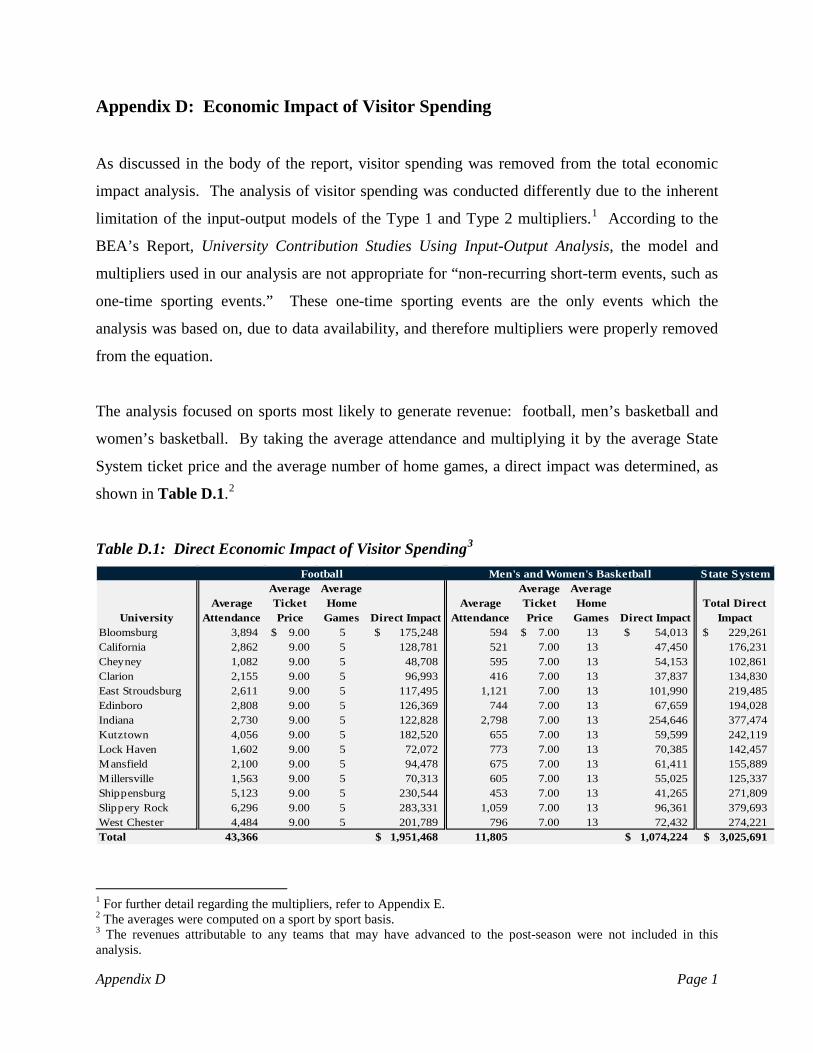
Appendix D: Economic Impact of Visitor Spending
As discussed in the body of the report, visitor spending was removed from the total economic
impact analysis. The analysis of visitor spending was conducted differently due to the inherent
limitation of the input-output models of the Type 1 and Type 2 multipliers.1 According to the
BEA’s Report, University Contribution Studies Using Input-Output Analysis, the model and
multipliers used in our analysis are not appropriate for “non-recurring short-term events, such as
one-time sporting events.” These one-time sporting events are the only events which the
analysis was based on, due to data availability, and therefore multipliers were properly removed
from the equation.
The analysis focused on sports most likely to generate revenue: football, men’s basketball and
women’s basketball. By taking the average attendance and multiplying it by the average State
System ticket price and the average number of home games, a direct impact was determined, as
shown in Table D.1.2
Table D.1: Direct Economic Impact of Visitor Spending3 State System
UniversityAverage
Attendance
Average Ticket Price
Average Home
Games Direct ImpactAverage
Attendance
Average Ticket Price
Average Home
Games Direct ImpactTotal Direct
ImpactBloomsburg 3,894 9.00$ 5 175,248$ 594 7.00$ 13 54,013$ 229,261$ California 2,862 9.00 5 128,781 521 7.00 13 47,450 176,231 Cheyney 1,082 9.00 5 48,708 595 7.00 13 54,153 102,861 Clarion 2,155 9.00 5 96,993 416 7.00 13 37,837 134,830 East Stroudsburg 2,611 9.00 5 117,495 1,121 7.00 13 101,990 219,485 Edinboro 2,808 9.00 5 126,369 744 7.00 13 67,659 194,028 Indiana 2,730 9.00 5 122,828 2,798 7.00 13 254,646 377,474 Kutztown 4,056 9.00 5 182,520 655 7.00 13 59,599 242,119 Lock Haven 1,602 9.00 5 72,072 773 7.00 13 70,385 142,457 Mansfield 2,100 9.00 5 94,478 675 7.00 13 61,411 155,889 Millersville 1,563 9.00 5 70,313 605 7.00 13 55,025 125,337 Shippensburg 5,123 9.00 5 230,544 453 7.00 13 41,265 271,809 Slippery Rock 6,296 9.00 5 283,331 1,059 7.00 13 96,361 379,693 West Chester 4,484 9.00 5 201,789 796 7.00 13 72,432 274,221 Total 43,366 1,951,468$ 11,805 1,074,224$ 3,025,691$
Football Men's and Women's Basketball
1 For further detail regarding the multipliers, refer to Appendix E. 2 The averages were computed on a sport by sport basis. 3 The revenues attributable to any teams that may have advanced to the post-season were not included in this analysis.
Appendix D Page 1
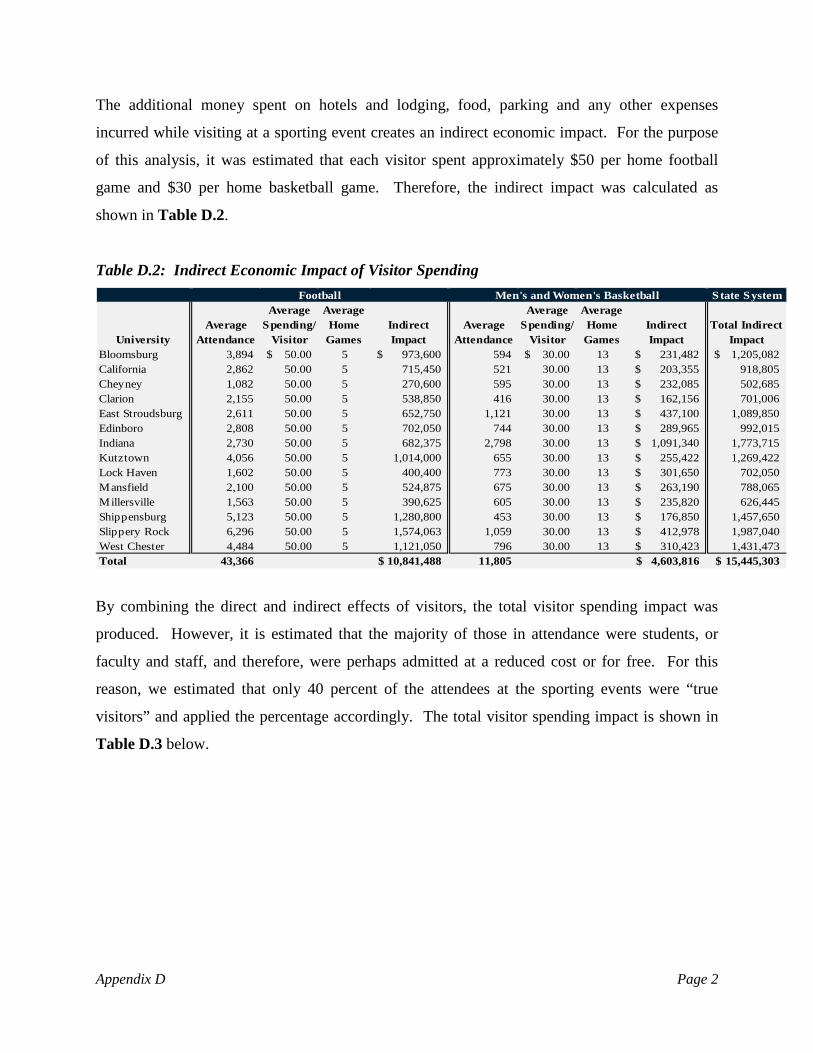
The additional money spent on hotels and lodging, food, parking and any other expenses
incurred while visiting at a sporting event creates an indirect economic impact. For the purpose
of this analysis, it was estimated that each visitor spent approximately $50 per home football
game and $30 per home basketball game. Therefore, the indirect impact was calculated as
shown in Table D.2.
Table D.2: Indirect Economic Impact of Visitor Spending State System
UniversityAverage
Attendance
Average Spending/
Visitor
Average Home
GamesIndirect Impact
Average Attendance
Average Spending/
Visitor
Average Home Games
Indirect Impact
Total Indirect Impact
Bloomsburg 3,894 50.00$ 5 973,600$ 594 30.00$ 13 231,482$ 1,205,082$ California 2,862 50.00 5 715,450 521 30.00 13 203,355$ 918,805 Cheyney 1,082 50.00 5 270,600 595 30.00 13 232,085$ 502,685 Clarion 2,155 50.00 5 538,850 416 30.00 13 162,156$ 701,006 East Stroudsburg 2,611 50.00 5 652,750 1,121 30.00 13 437,100$ 1,089,850 Edinboro 2,808 50.00 5 702,050 744 30.00 13 289,965$ 992,015 Indiana 2,730 50.00 5 682,375 2,798 30.00 13 1,091,340$ 1,773,715 Kutztown 4,056 50.00 5 1,014,000 655 30.00 13 255,422$ 1,269,422 Lock Haven 1,602 50.00 5 400,400 773 30.00 13 301,650$ 702,050 Mansfield 2,100 50.00 5 524,875 675 30.00 13 263,190$ 788,065 Millersville 1,563 50.00 5 390,625 605 30.00 13 235,820$ 626,445 Shippensburg 5,123 50.00 5 1,280,800 453 30.00 13 176,850$ 1,457,650 Slippery Rock 6,296 50.00 5 1,574,063 1,059 30.00 13 412,978$ 1,987,040 West Chester 4,484 50.00 5 1,121,050 796 30.00 13 310,423$ 1,431,473 Total 43,366 10,841,488$ 11,805 4,603,816$ 15,445,303$
Football Men's and Women's Basketball
By combining the direct and indirect effects of visitors, the total visitor spending impact was
produced. However, it is estimated that the majority of those in attendance were students, or
faculty and staff, and therefore, were perhaps admitted at a reduced cost or for free. For this
reason, we estimated that only 40 percent of the attendees at the sporting events were “true
visitors” and applied the percentage accordingly. The total visitor spending impact is shown in
Table D.3 below.
Appendix D Page 2
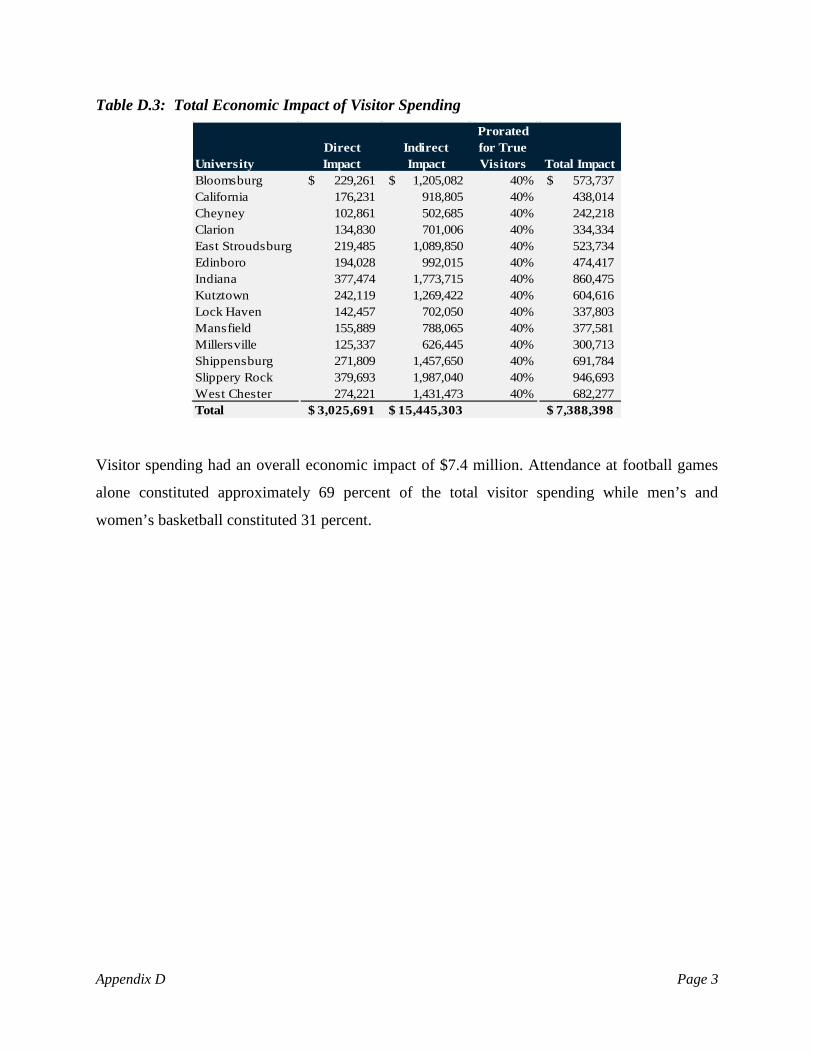
Table D.3: Total Economic Impact of Visitor Spending
UniversityDirect Impact
Indirect Impact
Prorated for True Visitors Total Impact
Bloomsburg 229,261$ 1,205,082$ 40% 573,737$ California 176,231 918,805 40% 438,014 Cheyney 102,861 502,685 40% 242,218 Clarion 134,830 701,006 40% 334,334 East Stroudsburg 219,485 1,089,850 40% 523,734 Edinboro 194,028 992,015 40% 474,417 Indiana 377,474 1,773,715 40% 860,475 Kutztown 242,119 1,269,422 40% 604,616 Lock Haven 142,457 702,050 40% 337,803 Mansfield 155,889 788,065 40% 377,581 Millersville 125,337 626,445 40% 300,713 Shippensburg 271,809 1,457,650 40% 691,784 Slippery Rock 379,693 1,987,040 40% 946,693 West Chester 274,221 1,431,473 40% 682,277 Total 3,025,691$ 15,445,303$ 7,388,398$
Visitor spending had an overall economic impact of $7.4 million. Attendance at football games
alone constituted approximately 69 percent of the total visitor spending while men’s and
women’s basketball constituted 31 percent.
Appendix D Page 3

Appendix E: Data Analysis Methodologies
To prepare the analysis for each of the 14 universities of Pennsylvania’s State System of Higher
Education, as well as System-wide Functions and Services, the following primary data categories
were utilized:
• Publicly sourced documents;
• Subscription based information; and
• Information provided directly from the State System.
The purposes of this section and the information contained herein are intended to provide a
listing of the documents and information relied upon, as well as the analytical procedures and
methodologies utilized to ascertain the economic impact of State System universities on the
Commonwealth of Pennsylvania, individually and in the aggregate.
This particular methodology was selected and utilized because it is considered by numerous
economists to provide highly accurate and valid results. While, there are other acceptable
methods to conduct an economic and employment impact of a university or system of
universities, we have chosen and employed the Bureau of Economic Analysis RIMS II model, as
discussed below.1
For the purposes of this appendix, certain examples of the analytical procedures will be
reproduced for illustrative purposes. Unless otherwise noted, the examples described herein will
be applicable to all of the universities within the State System, as well as to System-wide
Functions and Services.2
1 Similar economic studies include alumni spending as a factor of total economic impact. This was excluded from the State System’s analysis based on our discretion. 2 The use of Bloomsburg University as an illustrative example is based solely on Bloomsburg’s position in alphabetical order of the State System universities. Appendix E Page 1
Economic Impact Study Analysis and Methodology
This study’s key components include:
• Total economic impact of the State System’s universities on the Commonwealth of
Pennsylvania;
• The employment impact of the State System’s universities upon the Commonwealth of
Pennsylvania;
• Economic Development Inventory impacts of each university; and
• An analysis of the Geo Spatial data for the State System’s universities’ employees,
students, and alumni.
Multiple data sources were reviewed and relied upon for the purposes of this analysis. The data
relied upon was used to generate the specific databases applicable to the following key
categories:
• Institutional Spending;
• Faculty and Staff Spending;
• Student Spending; and
• Capital Expenditures.
Please see the accompanying narrative text in this appendix for a detailed discussion of the data
relied upon and the analytical procedures employed to quantify the direct, indirect, and induced
economic impacts for each category. Calculations throughout this analysis are subject to
rounding.
Appendix E Page 2

Bureau of Economic Analysis – RIMS II Data3
The Regional Input-Output Modeling System (RIMS II), a regional economic model, is a tool
used by investors, planners, and elected officials to objectively assess the potential economic
impacts of various projects. This model produces multipliers that are used in economic impact
studies to estimate the total impact a project has on a region. The idea behind the results of
RIMS II is that an initial change in economic activity results in other rounds of spending or
economic activity.
RIMS II is based on a set of national industry input-output (I-O) accounts that show the goods
and services produced by each industry and the use of these goods and services by industries and
final users. Like most other regional I-O models, RIMS II adjusts these national relationships to
account for regional supply conditions.
Regional I-O multipliers, such as those provided in the RIMS II data, share similarities with
other macroeconomic (Keynesian) multipliers in that both types of multipliers provide a way to
estimate the total impact that an initial change in economic activity has on an economy. They
are both based on the idea that an initial change in economic activity results in diminishing
rounds of new spending. Spending diminishes because of “leakages” from the economy in the
form of savings, taxes, and imports.
Geospatial Analysis
The use of geocoding was used in this study to assess the distribution of employees, students,
and alumni of each of the State System universities. The goal of the address geocoding process
is to locate various features according to a specific address. The process involves matching the
address of an observation to a specific address location within the target geographic area.
In this study, the observations (employees, students, and alumni) were geographically identified
based on the postal zip codes associated with the address of their permanent residence.
3 Sections excerpted from the RIMS II Users Guide, https://www.bea.gov/regional/pdf/rims/rimsii_user_guide.pdf. Appendix E Page 3
The residential address data that was geocoded in this study represents the complete population
of each subgroup of the State System’s employees, students, and alumni as of 2014. In
recognition of potential problems that may result from inaccurate or unavailable data, the
following steps were undertaken:
• Employees and staff - in instances where postal code data was not available, postal
codes associated with the municipality in which local earned income tax was paid by the
employee was used as a proxy for their permanent residence. In addition, if local
municipality earned income tax data was not available and the employee was subject to
Pennsylvania income tax withholdings, the postal code of the university at which the
employee worked was used as a proxy. These instances were limited in number and do
not materially affect the outcome of the analysis.
• Further, in the instances for students and alumni where postal code information was
unavailable from the information provided, these individuals were considered to be
outside of the Commonwealth of Pennsylvania. As a general observation, this issue was
limited to the alumni data, which was obtained from the State System’s living alumni
database for all of the State System universities.
After the geocoding procedures were completed, the university employees were stratified based
on the distance of their permanent residences relative to the postal code of the respective
university. Specifically, this analysis began with the employee addresses located within a 10
mile radius of the university center and continued outward to include employees between 10 to
25 miles from the university center, and then finally to include all employees living greater than
25 miles from the university center.
The concept of measuring the distance of students or alumni from the university site does not
represent a significant measure of the impact on the local community and economy. Rather the
focus of the analysis of the State System’s alumni is designed to measure the distribution of
alumni after graduation and demonstrates the retention of the State System’s alumni post-
graduation within the Commonwealth of Pennsylvania. Specifically, the analyses show the
Appendix E Page 4
spread of alumni within the regional economies of the Commonwealth. The alumni were
geocoded and then tabulated, for each university, by the county in which they reside.
The student population for each university was analyzed in a similar manner to the alumni data.
Specifically, the student data was geocoded and then tabulated on a county by county basis. The
resulting data represent the counties from which the students were drawn throughout
Pennsylvania. The distribution of students at each of the State System’s universities illustrates
the significant impact that the State System plays in the education of the local population. This
is consistent with the State System’s mission to provide instruction for undergraduate and
graduate students in the disciplines of liberal arts and sciences. Further, the universities within
the State System aim to provide diverse, dynamic, meaningful experiences to inspire learners to
grow both intellectually and personally to enable them to contribute positively to local and global
communities.
Analytical procedures were applied to arrive at total spending (direct impacts) for each
university. The direct impact attributable to each university for the fiscal 2013-2014 year can be
broken down into the following four categories:
• Institutional spending;
• Faculty and staff spending on goods and services;
• Student spending on goods and services; and
• Capital expenditures.
Institutional Spending Analysis
The institution spending for each university was aggregated from the operation budgets for the
2013-2014 academic years. The spending data included all direct spending of the universities,
exclusive of all salary and wages paid to faculty, staff, and student employees. The spending
data, however, does include employee benefits and the capital spending that stems from the
university’s operating funds.
Appendix E Page 5
To avoid a potential double counting of the indirect economic benefits derived from the
institutional spending, an allocation of the spending attributable to out-of state students is
required, as is discussed in the example below. The delineation is necessary because the indirect
benefits attributable to the in-state students, as well as in-state faculty and staff, are already
captured in the Pennsylvania household spending multiplier. Specifically, this distinction is
made to prevent overstatement of the Type I and Type II multiplied effect.4
A white paper authored by the Bureau of Economic Analysis provides guidance on the proper
use of multipliers in the analysis and determination of the economic impacts that universities
have on a surrounding region. Specifically the white paper states:5
• Most regional I-O models produce two types of multipliers. Type I multipliers account
only for the “inter-industry” (direct and indirect) effect of an initial change in economic
activity. Type II multipliers account for both the inter-industry and “household-spending”
(induced) effects associated with an initial change in economic activity. Most university
contribution studies are based on Type II multipliers, which are more difficult to use in a
manner that avoids double-counting.
• Even though regional I-O multipliers have traditionally been used to estimate the
economic impact of an incremental change in economic activity, such as an increase in
the provision of educational services, these multipliers have increasingly been used to
estimate the contribution of an entire industry, such as an institution (academic
university) to a regional economy.
4 The Type I and Type II effect of the institutional spending captures all of the economic impacts of in-state consumers of the State System universities good and services 5 Sections excerpted from “University Contribution Studies Using Input-Output Analysis” by Zoe O. Ambargis, Charles Ian Mean, & Stanislaw J. Rzeznik (May 3, 2013) Appendix E Page 6

• The value of university output should exclude any university services that are purchased
by businesses inside the region. If using a Type II university multiplier, the value of
university output should also exclude purchases of university services by households in
the region. Not following these practices will result in double counting and inflated
results.
• If a Type II university multiplier is used in the analysis, the value of the university output
needs to be adjusted to exclude university output that is purchased by households in the
region because the impact of their purchases is captured in the Type II multiplier. This
adjustment can be made by prorating the measure of university output by the percentage
of students that come from outside the region.
Further, the paper provides a step-by-step methodology to ascertain the contribution a university
has on a region. The steps are as follows:
1. Calculated university output (Direct spending of the university);6
2. Prorate university output by the share of non-local students;
3. Separately multiply the pro-rated output by the Type I and Type II multipliers for
universities; and
4. Subtract the result calculated with the Type I multiplier (total indirect less induced)
from the result calculated with the Type II multiplier (total indirect) to separately
identify the household-spending effect.
For illustrative purposes the analysis for Bloomsburg University has been reproduced below:
6 The direct spending of the university excludes the payroll for faculty, staff, and students. Appendix E Page 7

Bloomsburg University: Amount
Institutional Spending (Excluding Payroll) $61,695,020 Capital Improvements 2,412,867 Sub total 64,107,887 Employee Benefits 34,829,989
Total Institutional Spending (Total Direct Spending) $98,937,876 Institutional Spending prorated by % of out of state students (10.86%) $10,746,803 Type 1 Multiplier 1.5335 Type 1 Effect: (Total Indirect – Induced Effect) $16,480,222 Type 2 Multiplier 2.332 Type 2 Effect7 (Total Indirect Spending) $25,061,544 Induced Effect8 (Type 2 Effect - Type 1 Effect) $8,581,322 Total Impact of Institutional Spending (Total Direct Spending + Indirect Spending + Induced Spending) $132,580,742
Faculty and Staff Spending Analysis
To ascertain the effect of the faculty and staff spending the Type II household spending
multiplier was applied to an estimate of faculty and staff spending on a university-by-university
basis.9
An estimation of faculty and staff spending was based on spending data provided by the Bureau
of Labor and Statistics (“BLS”) Consumer Expenditure Survey for 2013. The BLS data
provided a detail of the average consumer spending for the separate categories which are as
follows:
7 Indirect effects are defined as the changes in sales, income or jobs in sectors within the region that supply goods and services to a specific sector. 8 Induced effects are defined as the increased sales within the region from household spending of the income earned supporting in a specific sector. 9 Household spending multiplier for Pennsylvania obtained from the Bureau of Economic Analysis. Appendix E Page 8

• Groceries
• Restaurants
• Housing
• Apparel and Services
• Transportation
• Health Care
• Entertainment
• Cash Contributions
• Personal Insurance and Pensions
• All Other Expenditures
The BLS data allowed for a spending analysis to be completed based on income stratification,
estimating average spending by category over six income ranges. The annual income ranges
begin at less than $70,000 and work up incrementally to $150,000 and greater. Accordingly,
gross wages paid to faculty and staff was sorted by income level to which the applicable
spending percentages were applied for each category.
For illustrative purposes the analysis for Bloomsburg University has been reproduced below:
Bloomsburg University: Permanent Other10 Total
Income (wages) $ 64,848,859
$ 7,701,853
$72,550,713 Groceries 4,465,037 773,026 5,238,064 Restaurants 2,885,129 424,257 3,309,387 Housing 18,634,533 3,009,266 21,643,799 Apparel and Services 1,769,004 264,046 2,033,049 Transportation 9,981,933 1,505,309 11,487,243 Health Care 4,053,423 684,306 4,737,728 Entertainment 2,662,553 382,280 3,044,833 Cash Contributions 1,912,814 262,355 2,175,170 Personal Ins & Pensions 5,690,671 562,232 6,252,903 All Other Expenditures 3,440,604 520,025 3,960,628
Total Consumption $55,495,702 $8,387,101 $ 63,882,803
10 Other employees include temporary and part-time employees, however all student wages are excluded. Appendix E Page 9

Note that the reproduced analysis illustrates total spending for faculty and staff, in the aggregate,
across all income ranges. Further, for the purposes of this analysis, payroll data was filtered to
exclude student wages, as student spending was captured in a separate analysis, described below.
Continuing with the Bloomsburg University example, the total estimated consumption spending
for faculty and staff was then used as the basis for the application of the Pennsylvania Type II
household multiplier, which is reproduced below:
Bloomsburg University: Amount
Faculty & Staff Spending - Direct $63,882,803 Household Multiplier (Type II) 1.4079 Total Faculty & Staff Spending Impact 89,940,599 Faculty Spending - Indirect Impact (Total less Direct Impact) $26,057,796
Student Spending Analysis
The third element of the direct economic impact analysis applicable to all of the State System’s
universities is an estimation of student spending.11 This analysis was based on the fall 2014
enrollment data for each university, which segregated the student enrollment into three broad
categories, as follows:
• Students living on campus in university housing or university affiliated private housing;
• Student’s living off campus in private, non-affiliated housing; and
• Students living off campus with parents.
In order to capture the amount of student spending resulting from students who live in affiliated
university housing, an aggregate of privatized housing fees for each university was obtained. A
percent was then calculated to determine the amount of room and board fees that were collected
by affiliates, rather than the universities, and subsequently applied to the total number of students
living in affiliated university housing. Average cost estimates for room, board, books, and
11 System-wide Functions and Services was not included this analysis. Appendix E Page 10

supplies, and other expenses were then applied to the students who live off-campus and pay for
room and board to parties other than the university directly.12 In the other instances in which
students lived in on-campus housing or with a parent, only books and supplies and other
expenses were included in the aggregated total. This was done in order to avoid double counting
room and board expenditures that have already been accounted for in other aspects of the
analysis.
To calculate the total direct student spending, the Pennsylvania Type II household multiplier was
applied to the total amount spent by all students, the results of which are reproduced below:
Bloomsburg University: Amount Student Spending – Direct $90,272,210 Household Multiplier (Type II) 1.4079 Total Student Spending Impact 127,094,244 Student Spending - Indirect Impact (Total less Direct Impact) $36,822,034
Direct Composite Employment Impact
In addition to an economic impact, there is an employment impact that arises from direct
institutional, faculty and staff, and student spending or, what is referred to in the report as direct
composite spending. By applying the Pennsylvania Type II Employment Output multiplier to
the total direct composite spending, the amount of jobs supported as a result of the university’s
expenditures can be calculated. Specifically, for every additional million dollars of composite
spending by a university, approximately 21.3 jobs are supported.
12 Average cost estimates were supplied on a university by university basis by the State System. Appendix E Page 11

For illustrative purposes, the direct composite employment impact of Bloomsburg University is
reproduced below:
Direct
Institutional Spending
Direct Faculty and Staff Spending
Direct Student
Spending
Direct Composite Spending
$98,937,876 $63,882,803 $90,272,210 $253,092,889
Direct Composite Spending
Jobs Output Employment Impact
$253,092,889 21.26 5,380
Capital Expenditures Analysis
The last component of the State System’s total direct economic impact is the capital expenditures
of each university. As mentioned previously in the report, Pennsylvania’s State System of
Higher Education receives funding from the Governor’s Budget Office for its capital
investments; as a result, the impact of these projects is segregated from the institutional spending
impact. The following provides an overview of how the capital expenditures impact was
calculated.
Historical data was obtained for the funding received for capital investments and the deferred
maintenance. The capital projects, on average, take approximately four to five years to be
executed, and therefore, a five-year weighted average was calculated for each university, with
the most weight being placed on 2013-2014 fiscal year. This amount was combined with the
funding per university provided for deferred maintenance to arrive at the total directly spent on
capital expenditures.
The Pennsylvania Type I and Type II construction multipliers were then applied, in the same
manner as applied on institutional spending, to calculate the indirect and induced effect of the
capital expenditures.13
13 The construction multiplier was chosen because, as indicated by the State System, the majority of the funding is spent on renovations and additions. The construction multipliers assume that construction is being performed by a firm in the region and has enough spare capacity to take on the job without forcing up prices or demand. It also assumes that there is some amount of leakages from the local economy because of inputs of supplies or services that cannot be provided locally. Appendix E Page 12

For illustrative purposes, the economic impact of Bloomsburg University’s capital expenditures
is displayed below:
Bloomsburg University: Amount
Capital Improvements (5-year Weighted Average) $9,165,333 Key ‘93 Deferred Maintenance 1,037,338 Total Capital Expenditures (Total Direct Spending) 10,202,671 Type 1 Multiplier 1.6844 Type 1 Effect (Total Indirect – Induced Effect) $17,185,380 Type 2 Multiplier 2.4656 Type 2 Effect (Total Indirect Spending) $25,155,706 Induced Effect (Type 2 Effect - Type 1 Effect) 7,970,327 Total Impact of Capital Expenditures $43,328,705
Direct Capital Expenditures Employment Impact
In calculating the direct capital expenditures employment impact, it is important to note that
because a different type of multiplier is being used, the jobs output multiplier utilized is 17.9. In
other words, for each additional million dollars spent on capital expenditures approximately 17.9
jobs are supported.
For illustrative purposes, the employment impact of Bloomsburg University’s capital
expenditures is displayed below:
Direct Capital Expenditures Jobs Output Employment Impact
$10,202,671 17.94 183
In the aggregate, the total economic impact for Bloomsburg University is quantified as follows:
Appendix E Page 13
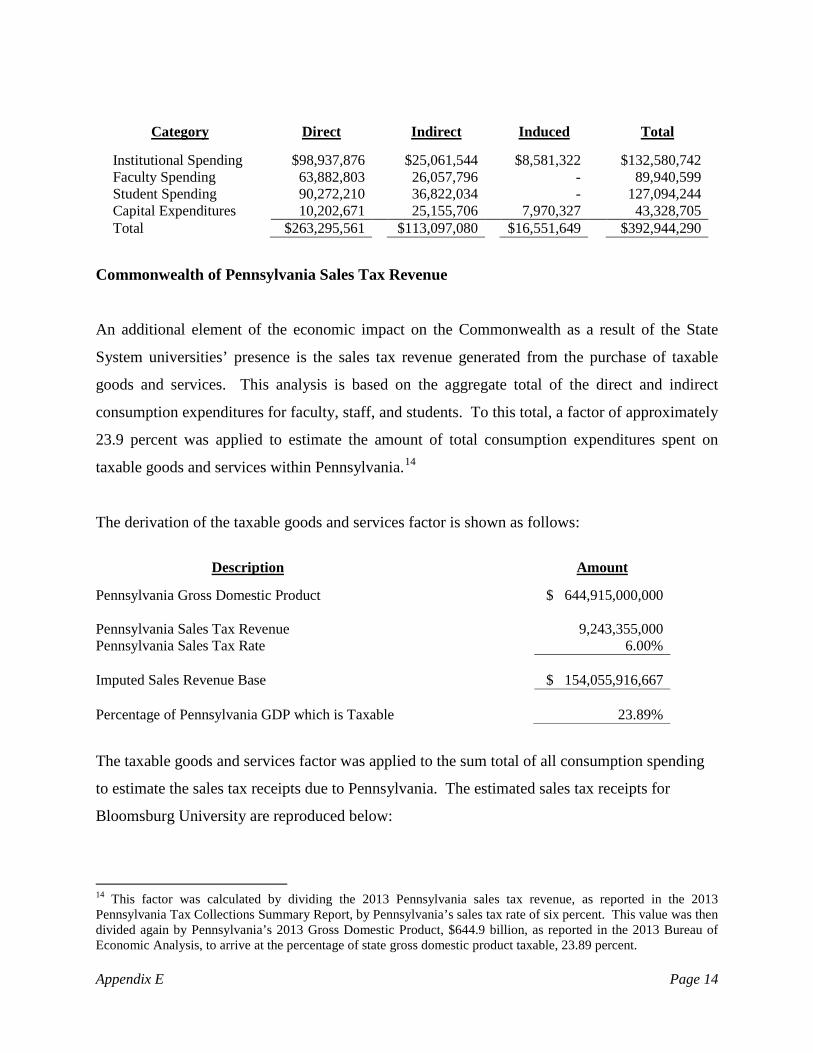
Category Direct Indirect Induced Total
Institutional Spending $98,937,876 $25,061,544 $8,581,322 $132,580,742 Faculty Spending 63,882,803 26,057,796 - 89,940,599 Student Spending 90,272,210 36,822,034 - 127,094,244 Capital Expenditures 10,202,671 25,155,706 7,970,327 43,328,705 Total $263,295,561 $113,097,080 $16,551,649 $392,944,290
Commonwealth of Pennsylvania Sales Tax Revenue
An additional element of the economic impact on the Commonwealth as a result of the State
System universities’ presence is the sales tax revenue generated from the purchase of taxable
goods and services. This analysis is based on the aggregate total of the direct and indirect
consumption expenditures for faculty, staff, and students. To this total, a factor of approximately
23.9 percent was applied to estimate the amount of total consumption expenditures spent on
taxable goods and services within Pennsylvania.14
The derivation of the taxable goods and services factor is shown as follows:
Description Amount
Pennsylvania Gross Domestic Product
$ 644,915,000,000 Pennsylvania Sales Tax Revenue 9,243,355,000 Pennsylvania Sales Tax Rate 6.00% Imputed Sales Revenue Base $ 154,055,916,667 Percentage of Pennsylvania GDP which is Taxable 23.89%
The taxable goods and services factor was applied to the sum total of all consumption spending
to estimate the sales tax receipts due to Pennsylvania. The estimated sales tax receipts for
Bloomsburg University are reproduced below:
14 This factor was calculated by dividing the 2013 Pennsylvania sales tax revenue, as reported in the 2013 Pennsylvania Tax Collections Summary Report, by Pennsylvania’s sales tax rate of six percent. This value was then divided again by Pennsylvania’s 2013 Gross Domestic Product, $644.9 billion, as reported in the 2013 Bureau of Economic Analysis, to arrive at the percentage of state gross domestic product taxable, 23.89 percent. Appendix E Page 14
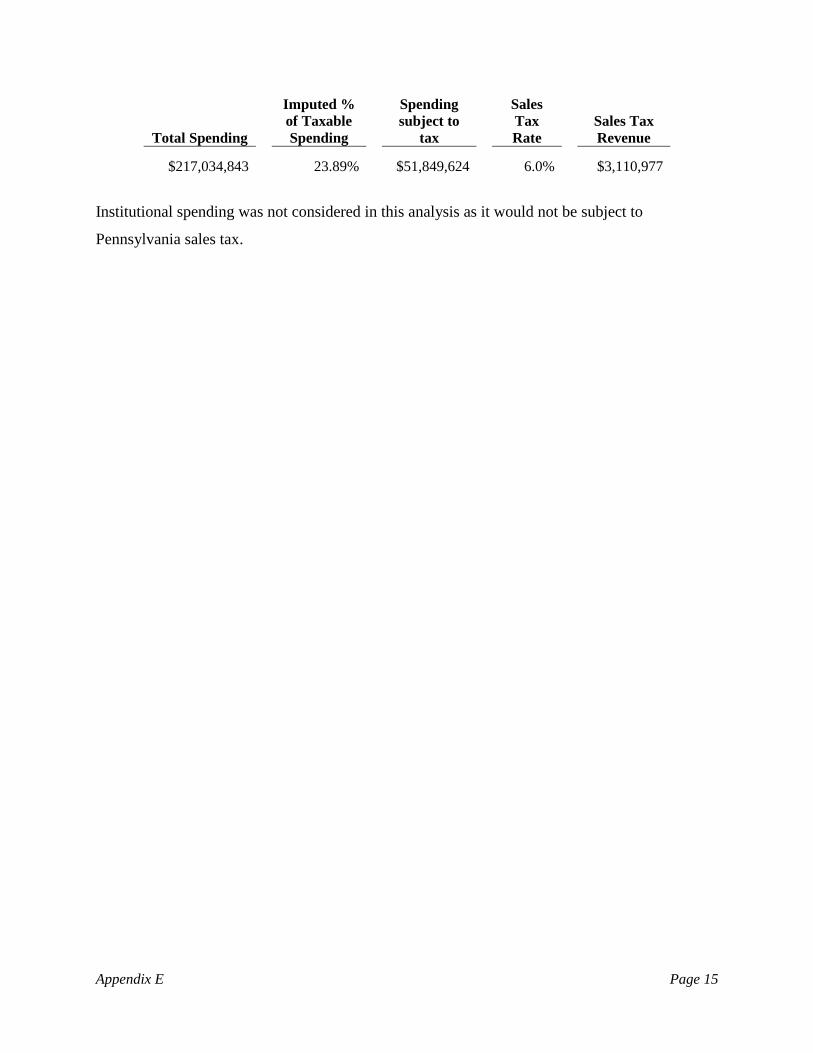
Total Spending
Imputed % of Taxable Spending
Spending subject to
tax
Sales Tax Rate
Sales Tax Revenue
$217,034,843
23.89%
$51,849,624
6.0%
$3,110,977
Institutional spending was not considered in this analysis as it would not be subject to
Pennsylvania sales tax.
Appendix E Page 15

Appendix F: Information Relied On General Documents Received: 12-13 Minor Objects. 13-14 Minor Objects. 14-15 Cost of Attendance. 2013 Athletics for BL ED KU MA SH. 2014 Athletics for CA CH CL EA IN LO MI SL WE. 2014 Gross Salary. AAE Fall Freshmen by Univ. AAE Transfer Fall Trends. All Grant Contract Awards 2011-12. All Grant Contract Awards 2012-13. All Grant Contract Awards 2013-14. Capital Spending Plan History. Economic Activity (System Student Housing). Employee Headcount Information. Endowments by University FY 2003-2014. Enrollment by County. Enrollment Trends. Financial Aid Information. Financial Statements: FYE 6/30/2013 & 2014. Grant Contract Awards BU 2011-12. GRANTCONAWARDSOC201213. GRANTCONAWARDSOC201314. Key '93 Deferred Maintenance Appropriation Annual Report. Key 93 Funding History. Links to pages of PASSHE websites.
of 2010-11. of 2011-12.
of 2012-13 On Campus Events Summary. Operating Budgets. PASSHE Alumni_Fall 2014. PASSHE Enrollment. PASSHE Financial Statements. PASSHE Tuition and Fees. Patents Issued. Restricted Positions. State System of Higher Education Projects. State System's Single Audit Report, June 30, 2012. State System's Single Audit Report, June 30, 2013. Taxes Report 2014.
Appendix F Page 1
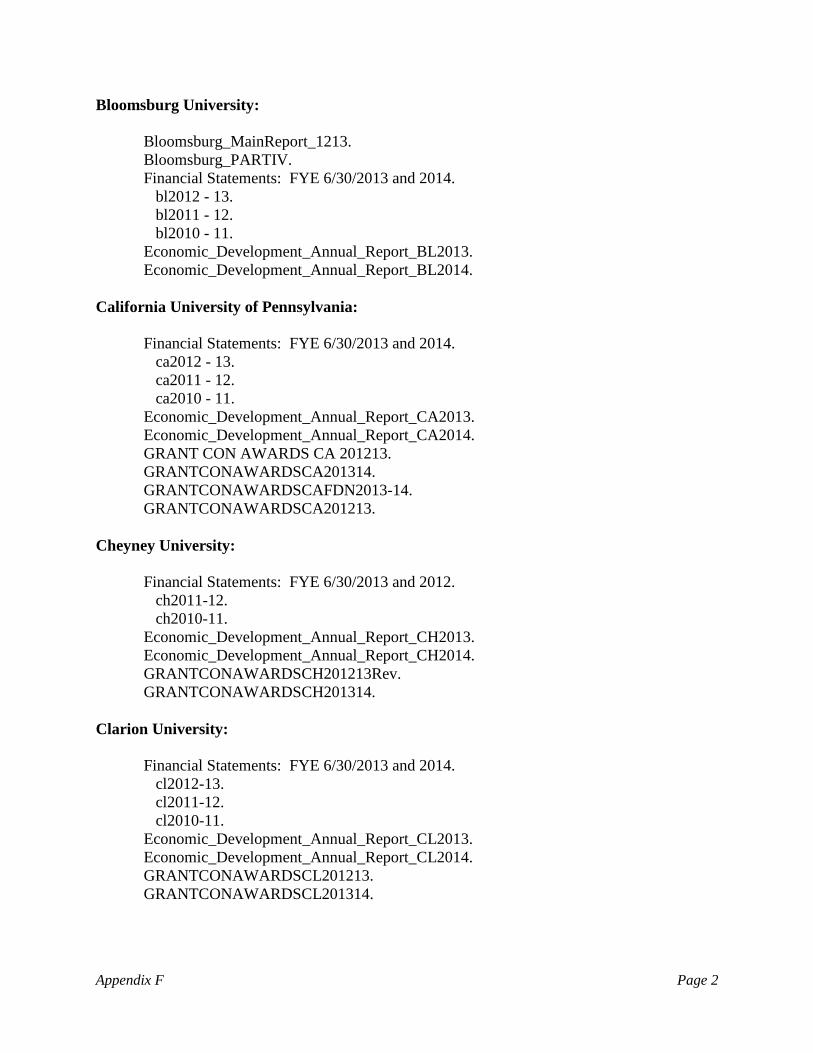
Bloomsburg University: Bloomsburg_MainReport_1213. Bloomsburg_PARTIV. Financial Statements: FYE 6/30/2013 and 2014. bl2012 - 13. bl2011 - 12. bl2010 - 11. Economic_Development_Annual_Report_BL2013. Economic_Development_Annual_Report_BL2014. California University of Pennsylvania: Financial Statements: FYE 6/30/2013 and 2014. ca2012 - 13. ca2011 - 12. ca2010 - 11. Economic_Development_Annual_Report_CA2013. Economic_Development_Annual_Report_CA2014. GRANT CON AWARDS CA 201213. GRANTCONAWARDSCA201314. GRANTCONAWARDSCAFDN2013-14. GRANTCONAWARDSCA201213. Cheyney University: Financial Statements: FYE 6/30/2013 and 2012. ch2011-12. ch2010-11. Economic_Development_Annual_Report_CH2013. Economic_Development_Annual_Report_CH2014. GRANTCONAWARDSCH201213Rev. GRANTCONAWARDSCH201314. Clarion University: Financial Statements: FYE 6/30/2013 and 2014. cl2012-13. cl2011-12. cl2010-11. Economic_Development_Annual_Report_CL2013. Economic_Development_Annual_Report_CL2014. GRANTCONAWARDSCL201213. GRANTCONAWARDSCL201314.
Appendix F Page 2

East Stroudsburg University: Financial Statements: FYE 6/30/2013 and 2014. ea2012-13. ea2011-12. ea2010-11. Economic_Development_Annual_Report_EA2013. Economic_Development_Annual_Report_EA2014. GRANTCONAWARDSEA201213REV2. GRANTCONAWARDSEA201314. Edinboro University: Financial Statements: FYE 6/30/2013 and 2014. ed2012-13. ed2011-12. ed2010-11. EU Economic Impact Flyer. Economic_Development_Annual_Report_ED2013. Economic_Development_Annual_Report_ED2014. GRANTCONAWARDSED201213. GRANTCONAWARDSED201314. Indiana University of Pennsylvania: Financial Statements: FYE 6/30/2013 and 2014. in2012-13. in2011-12. in2010-11. Economic_Development_Annual_Report_IN2013. Economic_Development_Annual_Report_IN2014. GRANTCONAWARDSIN201213. GRANTCONAWARDSIN201314. Kutztown University: Financial Statements: FYE 6/30/2013 and 2014. ku2012-13. ku2011-12. ku2010-11. Economic_Development_Annual_Report_KU2013. Economic_Development_Annual_Report_KU2014. GRANTCONAWARDSKU201213. GRANTCONAWARDSKU201314.
Appendix F Page 3
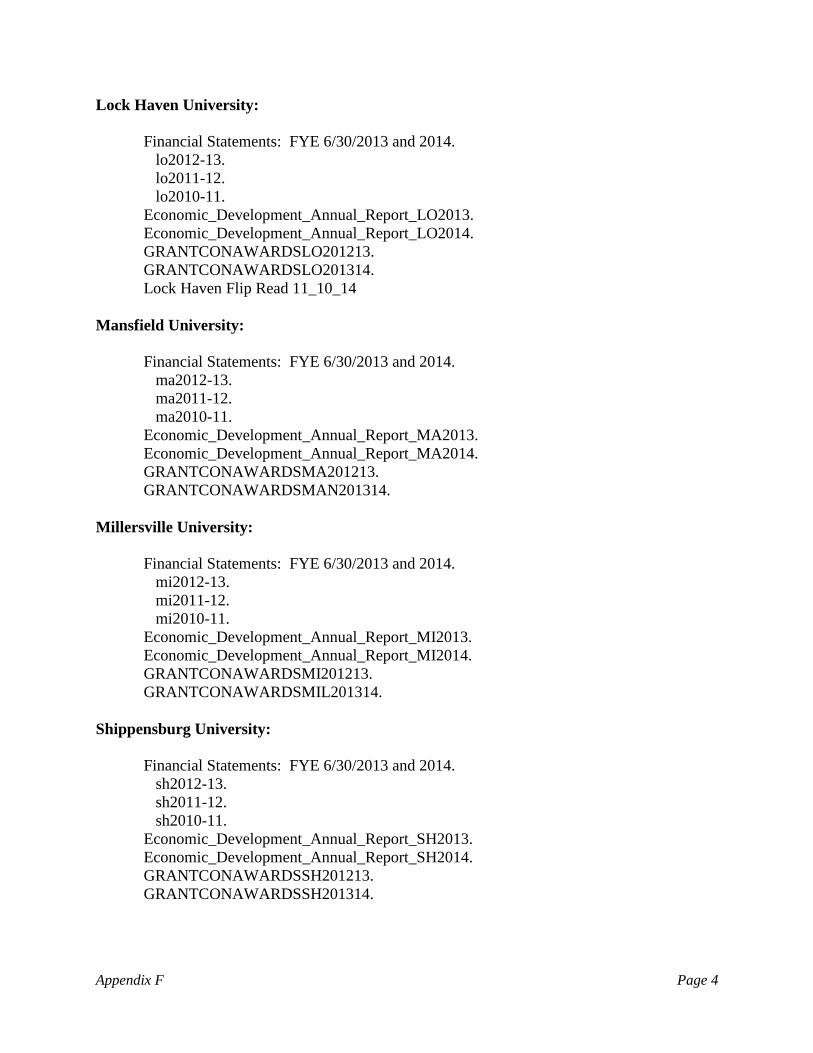
Lock Haven University: Financial Statements: FYE 6/30/2013 and 2014. lo2012-13. lo2011-12. lo2010-11. Economic_Development_Annual_Report_LO2013. Economic_Development_Annual_Report_LO2014. GRANTCONAWARDSLO201213. GRANTCONAWARDSLO201314. Lock Haven Flip Read 11_10_14 Mansfield University: Financial Statements: FYE 6/30/2013 and 2014. ma2012-13. ma2011-12. ma2010-11. Economic_Development_Annual_Report_MA2013. Economic_Development_Annual_Report_MA2014. GRANTCONAWARDSMA201213. GRANTCONAWARDSMAN201314. Millersville University: Financial Statements: FYE 6/30/2013 and 2014. mi2012-13. mi2011-12. mi2010-11. Economic_Development_Annual_Report_MI2013. Economic_Development_Annual_Report_MI2014. GRANTCONAWARDSMI201213. GRANTCONAWARDSMIL201314. Shippensburg University: Financial Statements: FYE 6/30/2013 and 2014. sh2012-13. sh2011-12. sh2010-11. Economic_Development_Annual_Report_SH2013. Economic_Development_Annual_Report_SH2014. GRANTCONAWARDSSH201213. GRANTCONAWARDSSH201314.
Appendix F Page 4
Slippery Rock University: Financial Statements: FYE 6/30/2013 and 2014. sl2012-13. sl2011-12. sl2010-11. SRU_Economic Bookmark. SRU_EconomicImpactBooklet. Economic_Development_Annual_Report_SL2013. Economic_Development_Annual_Report_SL2014. GRANTCONAWARDSSL201213. GRANTCONAWARDSSL201314. West Chester University Financial Statements: FYE 6/30/2013 and 2014. we2012-13. we2011-12. we2010-11. MD&A 2013 and 2014. Economic_Development_Annual_Report_WE2013. Economic_Development_Annual_Report_WE2014. GRANTCONAWARDSWC201314. GRANTCONAWARDSWE201213.
Appendix F Page 5

Appendix G: Supporting Geographic Data
Bloomsburg CAL U Cheyney ClarionEast
Stroudsburg Edinboro IUP KutztownLock
Haven Mansfield Millersville ShippensburgSlippery
RockWest
Chester TotalAdams 59 34 - 11 6 5 57 33 45 6 102 264 31 52 705
Allegheny 14 1,902 29 715 9 656 1,768 5 48 12 14 28 1,781 39 7,020 Armstrong - 23 - 185 - 42 428 2 4 - - 1 129 - 814
Beaver 5 139 1 148 1 110 210 2 11 1 3 5 480 5 1,121 Bedford 3 20 - 13 1 2 80 1 14 3 2 45 16 2 202 Berks 282 47 10 36 152 13 189 1,663 108 38 426 258 43 494 3,759 Blair 7 43 - 41 3 24 244 6 100 7 4 49 48 8 584
Bradford 65 1 - 13 8 17 20 15 83 382 5 10 16 6 641 Bucks 657 64 5 22 329 22 249 643 140 64 299 221 52 1,378 4,145 Butler 3 75 - 245 2 166 406 1 19 4 3 6 1,131 6 2,067
Cambria 6 76 - 68 1 32 680 2 42 6 10 27 81 1 1,032 Cameron 2 4 - 12 - 4 19 1 10 1 1 - 10 1 65 Carbon 108 6 - 6 96 3 14 120 25 12 15 20 3 27 455 Centre 18 29 - 36 2 28 70 7 403 13 10 22 48 13 699 Chester 353 107 36 24 94 13 281 446 87 21 452 284 53 3,745 5,996 Clarion 2 19 - 690 - 29 60 - 11 4 1 2 63 2 883
Clearfield 13 23 - 182 3 49 159 4 354 6 2 10 72 4 881 Clinton 31 8 - 9 1 5 21 5 469 25 10 6 6 4 600
Columbia 878 6 - 15 12 4 30 21 34 14 13 24 9 14 1,074 Crawford 1 21 - 119 - 637 80 1 15 2 3 2 140 3 1,024
Cumberland 186 57 1 39 22 25 242 131 95 44 262 1,174 50 209 2,537 Dauphin 207 69 17 48 43 17 189 122 113 57 364 427 58 221 1,952 Delaware 350 46 96 24 126 10 193 303 61 31 314 176 33 2,443 4,206
Elk 4 16 - 105 1 71 96 - 39 9 1 3 53 - 398 Erie 10 55 - 176 3 2,616 241 1 19 4 2 5 333 4 3,469
Fayette 1 893 2 8 1 20 124 1 2 - 5 5 75 - 1,137 Forest - 4 - 33 - 11 2 - 2 - - - 5 - 57
Franklin 29 41 - 18 6 6 83 22 34 6 55 938 33 31 1,302 Fulton - 7 - 2 - - 7 - 4 - 6 51 4 - 81 Greene 1 145 - 5 - 6 12 - - 2 - 4 25 1 201
Huntingdon 7 3 - 17 1 3 33 1 46 4 1 48 14 4 182 Indiana 2 32 - 36 - 27 1,486 1 8 2 2 6 42 1 1,645
Jefferson 2 17 - 241 - 48 196 - 53 - - 5 25 - 587 Juniata 19 1 - 1 2 3 15 1 34 7 6 27 2 5 123
Lackawanna 243 16 3 16 203 8 58 125 36 43 22 24 13 176 986 Lancaster 212 86 4 38 36 33 264 329 139 40 2,752 323 67 463 4,786 Lawrence - 39 4 91 - 94 89 - 2 - - 3 486 2 810 Lebanon 88 21 - 5 23 7 74 123 39 13 207 124 16 63 803 Lehigh 406 27 8 25 308 18 114 1,044 99 21 111 105 33 345 2,664 Luzerne 609 20 3 23 127 12 95 126 103 53 31 70 39 126 1,437
Lycoming 199 13 2 22 11 15 73 24 384 138 30 39 34 29 1,013 McKean 1 17 - 53 2 80 53 1 11 15 1 2 39 2 277 Mercer 2 48 1 171 - 196 95 1 11 1 1 4 563 1 1,095 Mifflin 38 6 - 2 4 8 53 3 89 7 11 60 6 3 290 Monroe 221 17 7 22 1,684 13 92 187 54 21 26 59 24 105 2,532
Montgomery 733 58 2 37 260 23 331 781 131 55 469 400 72 2,049 5,401 Montour 215 1 31 6 1 4 22 3 21 14 7 5 6 4 340
Northampton 301 31 4 11 770 7 121 632 79 27 103 108 34 286 2,514 Northumberland 540 14 - 20 11 5 58 41 88 56 13 51 18 23 938
Perry 30 13 - 12 5 6 29 24 30 21 31 91 10 17 319 Philadelphia 676 123 469 82 309 58 694 517 220 144 380 305 39 1,247 5,263
Pike 89 8 - 11 298 5 29 75 28 11 7 12 12 48 633 Potter 9 8 - 11 1 9 8 - 26 47 - 1 18 2 140
Schuylkill 319 15 - 15 57 10 46 283 73 16 61 93 11 69 1,068 Snyder 125 8 1 9 1 2 20 8 32 21 6 17 6 13 269
Somerset 1 82 - 19 - 11 136 1 11 1 - 18 42 1 323 Sullivan 10 3 - 2 - - - 1 6 6 2 2 1 1 34
Susquehanna 26 6 - 1 29 - 16 28 22 50 5 12 3 21 219 Tioga 17 13 1 17 2 13 29 9 41 487 7 - 18 2 656 Union 148 2 1 8 6 4 20 6 48 28 13 21 4 4 313
Venango 4 12 - 512 - 125 48 1 4 - 2 - 132 - 840 Warren - 19 - 70 1 126 45 1 6 6 1 1 47 1 324
Washington 2 1,137 - 97 1 83 292 1 12 2 3 14 267 4 1,915 Wayne 75 7 - 8 99 5 20 32 22 38 11 9 6 24 356
Westmoreland 11 712 - 200 3 128 1,097 4 27 1 7 16 389 11 2,606 Wyoming 30 5 - 1 16 1 15 18 16 32 3 6 6 13 162
York 207 125 7 44 57 31 280 211 148 61 924 607 71 331 3,104 Total Pennsylvania 8,912 6,745 745 5,004 5,250 5,864 12,400 8,201 4,590 2,263 7,640 6,755 7,496 14,209 96,074
Non-Pennsylvania 1,086 1,233 277 708 1,570 973 1,969 1,017 327 489 407 600 999 1,877 13,532
Grand Total 9,998 7,978 1,022 5,712 6,820 6,837 14,369 9,218 4,917 2,752 8,047 7,355 8,495 16,086 109,606
State System Students by Pennsylvania County by University, Fall 2014
Appendix G Page 1
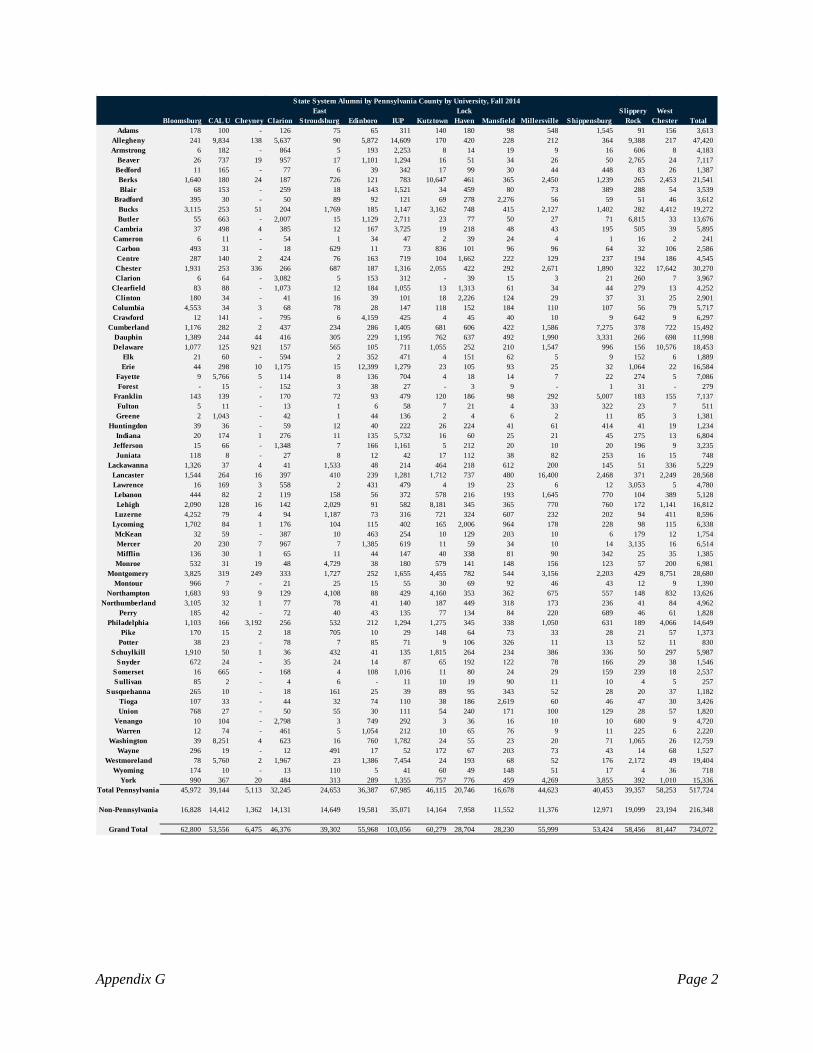
Bloomsburg CAL U Cheyney ClarionEast
Stroudsburg Edinboro IUP KutztownLock
Haven Mansfield Millersville ShippensburgSlippery
RockWest
Chester TotalAdams 178 100 - 126 75 65 311 140 180 98 548 1,545 91 156 3,613
Allegheny 241 9,834 138 5,637 90 5,872 14,609 170 420 228 212 364 9,388 217 47,420 Armstrong 6 182 - 864 5 193 2,253 8 14 19 9 16 606 8 4,183
Beaver 26 737 19 957 17 1,101 1,294 16 51 34 26 50 2,765 24 7,117 Bedford 11 165 - 77 6 39 342 17 99 30 44 448 83 26 1,387 Berks 1,640 180 24 187 726 121 783 10,647 461 365 2,450 1,239 265 2,453 21,541 Blair 68 153 - 259 18 143 1,521 34 459 80 73 389 288 54 3,539
Bradford 395 30 - 50 89 92 121 69 278 2,276 56 59 51 46 3,612 Bucks 3,115 253 51 204 1,769 185 1,147 3,162 748 415 2,127 1,402 282 4,412 19,272 Butler 55 663 - 2,007 15 1,129 2,711 23 77 50 27 71 6,815 33 13,676
Cambria 37 498 4 385 12 167 3,725 19 218 48 43 195 505 39 5,895 Cameron 6 11 - 54 1 34 47 2 39 24 4 1 16 2 241 Carbon 493 31 - 18 629 11 73 836 101 96 96 64 32 106 2,586 Centre 287 140 2 424 76 163 719 104 1,662 222 129 237 194 186 4,545 Chester 1,931 253 336 266 687 187 1,316 2,055 422 292 2,671 1,890 322 17,642 30,270 Clarion 6 64 - 3,082 5 153 312 - 39 15 3 21 260 7 3,967
Clearfield 83 88 - 1,073 12 184 1,055 13 1,313 61 34 44 279 13 4,252 Clinton 180 34 - 41 16 39 101 18 2,226 124 29 37 31 25 2,901
Columbia 4,553 34 3 68 78 28 147 118 152 184 110 107 56 79 5,717 Crawford 12 141 - 795 6 4,159 425 4 45 40 10 9 642 9 6,297
Cumberland 1,176 282 2 437 234 286 1,405 681 606 422 1,586 7,275 378 722 15,492 Dauphin 1,389 244 44 416 305 229 1,195 762 637 492 1,990 3,331 266 698 11,998 Delaware 1,077 125 921 157 565 105 711 1,055 252 210 1,547 996 156 10,576 18,453
Elk 21 60 - 594 2 352 471 4 151 62 5 9 152 6 1,889 Erie 44 298 10 1,175 15 12,399 1,279 23 105 93 25 32 1,064 22 16,584
Fayette 9 5,766 5 114 8 136 704 4 18 14 7 22 274 5 7,086 Forest - 15 - 152 3 38 27 - 3 9 - 1 31 - 279
Franklin 143 139 - 170 72 93 479 120 186 98 292 5,007 183 155 7,137 Fulton 5 11 - 13 1 6 58 7 21 4 33 322 23 7 511 Greene 2 1,043 - 42 1 44 136 2 4 6 2 11 85 3 1,381
Huntingdon 39 36 - 59 12 40 222 26 224 41 61 414 41 19 1,234 Indiana 20 174 1 276 11 135 5,732 16 60 25 21 45 275 13 6,804
Jefferson 15 66 - 1,348 7 166 1,161 5 212 20 10 20 196 9 3,235 Juniata 118 8 - 27 8 12 42 17 112 38 82 253 16 15 748
Lackawanna 1,326 37 4 41 1,533 48 214 464 218 612 200 145 51 336 5,229 Lancaster 1,544 264 16 397 410 239 1,281 1,712 737 480 16,400 2,468 371 2,249 28,568 Lawrence 16 169 3 558 2 431 479 4 19 23 6 12 3,053 5 4,780 Lebanon 444 82 2 119 158 56 372 578 216 193 1,645 770 104 389 5,128 Lehigh 2,090 128 16 142 2,029 91 582 8,181 345 365 770 760 172 1,141 16,812 Luzerne 4,252 79 4 94 1,187 73 316 721 324 607 232 202 94 411 8,596
Lycoming 1,702 84 1 176 104 115 402 165 2,006 964 178 228 98 115 6,338 McKean 32 59 - 387 10 463 254 10 129 203 10 6 179 12 1,754 Mercer 20 230 7 967 7 1,385 619 11 59 34 10 14 3,135 16 6,514 Mifflin 136 30 1 65 11 44 147 40 338 81 90 342 25 35 1,385 Monroe 532 31 19 48 4,729 38 180 579 141 148 156 123 57 200 6,981
Montgomery 3,825 319 249 333 1,727 252 1,655 4,455 782 544 3,156 2,203 429 8,751 28,680 Montour 966 7 - 21 25 15 55 30 69 92 46 43 12 9 1,390
Northampton 1,683 93 9 129 4,108 88 429 4,160 353 362 675 557 148 832 13,626 Northumberland 3,105 32 1 77 78 41 140 187 449 318 173 236 41 84 4,962
Perry 185 42 - 72 40 43 135 77 134 84 220 689 46 61 1,828 Philadelphia 1,103 166 3,192 256 532 212 1,294 1,275 345 338 1,050 631 189 4,066 14,649
Pike 170 15 2 18 705 10 29 148 64 73 33 28 21 57 1,373 Potter 38 23 - 78 7 85 71 9 106 326 11 13 52 11 830
Schuylkill 1,910 50 1 36 432 41 135 1,815 264 234 386 336 50 297 5,987 Snyder 672 24 - 35 24 14 87 65 192 122 78 166 29 38 1,546
Somerset 16 665 - 168 4 108 1,016 11 80 24 29 159 239 18 2,537 Sullivan 85 2 - 4 6 - 11 10 19 90 11 10 4 5 257
Susquehanna 265 10 - 18 161 25 39 89 95 343 52 28 20 37 1,182 Tioga 107 33 - 44 32 74 110 38 186 2,619 60 46 47 30 3,426 Union 768 27 - 50 55 30 111 54 240 171 100 129 28 57 1,820
Venango 10 104 - 2,798 3 749 292 3 36 16 10 10 680 9 4,720 Warren 12 74 - 461 5 1,054 212 10 65 76 9 11 225 6 2,220
Washington 39 8,251 4 623 16 760 1,782 24 55 23 20 71 1,065 26 12,759 Wayne 296 19 - 12 491 17 52 172 67 203 73 43 14 68 1,527
Westmoreland 78 5,760 2 1,967 23 1,386 7,454 24 193 68 52 176 2,172 49 19,404 Wyoming 174 10 - 13 110 5 41 60 49 148 51 17 4 36 718
York 990 367 20 484 313 289 1,355 757 776 459 4,269 3,855 392 1,010 15,336 Total Pennsylvania 45,972 39,144 5,113 32,245 24,653 36,387 67,985 46,115 20,746 16,678 44,623 40,453 39,357 58,253 517,724
Non-Pennsylvania 16,828 14,412 1,362 14,131 14,649 19,581 35,071 14,164 7,958 11,552 11,376 12,971 19,099 23,194 216,348
Grand Total 62,800 53,556 6,475 46,376 39,302 55,968 103,056 60,279 28,704 28,230 55,999 53,424 58,456 81,447 734,072
State System Alumni by Pennsylvania County by University, Fall 2014
Appendix G Page 2

Appendix H: About Baker Tilly and the Preparers of the Report Baker Tilly Virchow Krause, LLP (“Baker Tilly”) is a nationally recognized, full-service accounting and advisory firm whose professionals connect with clients and their businesses through refreshing candor and clear industry insight. With approximately 2,500 employees across the United States, Baker Tilly is ranked as one of the 12 largest accounting and advisory firms in the country. Headquartered in Chicago, Baker Tilly is also an independent member of Baker Tilly International, a worldwide network of independent accounting and business advisory firms in 133 countries, with 27,000 professionals. The combined worldwide revenue of independent member firms is $3.6 billion. Resumes of the primary authors of this study:
Paul W. Pocalyko, CPA, CFE, CFF Partner 215 972 2504 [email protected]
Paul D. Haynes Manager 215 557 2220 [email protected]
Jennifer Dziak Associate 215 557 2207 [email protected]
Paul is a partner in the firm’s forensic, litigation, and valuation services group and has provided a variety of financial consulting and accounting services to attorneys, insurance companies, governmental agencies, and public and private corporations for more than 32 years. His responsibilities are carried out through financial and forensic analysis of financial statements and tax returns, general ledgers and other original books of entry, relevant contracts, and agreements, and industry data. Paul has spoken before professional and educational groups on various aspects of financial analysis, litigation consulting, economic analysis, fraud investigations, and economic damages, and has co-authored various publications and articles. Licenses / Certifications > Licensed CPA in Pennsylvania > Certified Fraud Examiner > Certified in Financial Forensics Professional affiliations > American Institute of Certified Public
Accountants (AICPA) > Pennsylvania Institute of Certified Public
Accountants (PICPA) > PICPA Construction Industry Committee,
Board Member > PICPA Image Enhancement Committee,
Chair > Association of Certified Fraud Examiners Education > Lehigh University, Bachelor of Science > Lehigh University , Master of Business
Administration Community involvement > North Penn Community Health Foundation,
Board Member and Treasurer
With over 14 years of experience in public accounting, Paul specializes in forensic analysis, business valuations, and forensic accounting. Paul’s focus has included quantifying economic impacts and damages resulting from insurance claims, and other analytical reviews. Additionally, Paul has significant experience in valuing public and privately held entities, equity securities and financial and intangible assets. His valuation experience spans a wide range of industries, with valuation assignments prepared for estate and gift tax purposes, mergers and acquisitions, and purchase price allocations for financial reporting. Licenses / Certifications > Certified Public Accountant, Pennsylvania > Accredited in Business Valuation > Certified in Financial Forensics Professional affiliations > American Institute of Certified Public
Accountants (AICPA) > Association of Certified Fraud Examiners > Loss Executives Association > American Society of Appraisers Education > West Virginia University, Bachelor of
Science > West Virginia University, Master of
Professional Accountancy
Jennifer is an associate in the firm’s forensic, litigation, and valuation services group where her responsibilities include preparation of financial analysis, economic research, as well as forensic accounting. She has experience in complex data analysis, economic modeling, and the review of financial documents. Other responsibilities include economic analysis, creation and presentation of data, and review of findings from investigations. In addition, she has performed and managed quality control procedures for reports and accompanying exhibits. Prior to joining Baker Tilly, Jennifer interned at Chubb Corporation, as an Investment Accounting Intern, where she performed an assortment of financial accounting functions. Education > University of Scranton, Bachelor of Science
in Forensic Accounting
Appendix H Page 1
Related Documents