THE STATE OF FOREIGN LANGUAGES IN THE U.S. REVIEW OF THE 2015 CENSUS REPORT

Welcome message from author
This document is posted to help you gain knowledge. Please leave a comment to let me know what you think about it! Share it to your friends and learn new things together.
Transcript
THE STATE OF FOREIGN LANGUAGES IN THE U.S.
REVIEW OF THE 2015 CENSUS REPORT
“THE AMERICAN COMMUNITY SURVEY REVEALS THE WIDE-
RANGING LINGUISTIC DIVERSITY OF THE UNITED STATES.”
- ERIK VIKSTROM, CENSUS BUREAU STATISTICIAN

In November 2015, the U.S. Census Bureau released its most detailed data ever on
language use in the United States.
Previously available for only 39 languages, the latest data expanded to 350 languages.
WHO IS SPEAKING FOREIGN LANGUAGES?
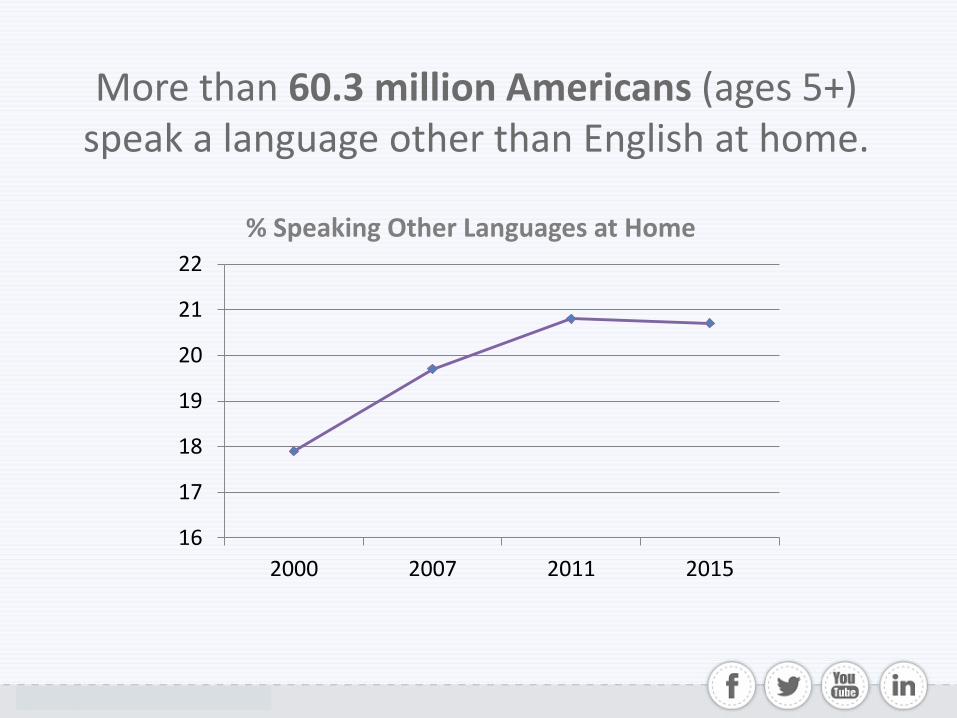
More than 60.3 million Americans (ages 5+) speak a language other than English at home.
16
17
18
19
20
21
22
2000 2007 2011 2015
% Speaking Other Languages at Home

1 in 5 Americans speaks a language other than English at home.
60.3 million
321.1 million
WHAT FOREIGN LANGUAGES ARE THEY SPEAKING?

Of the 60+ million people speaking languages other than English, 37 million of
those people speak Spanish at home.
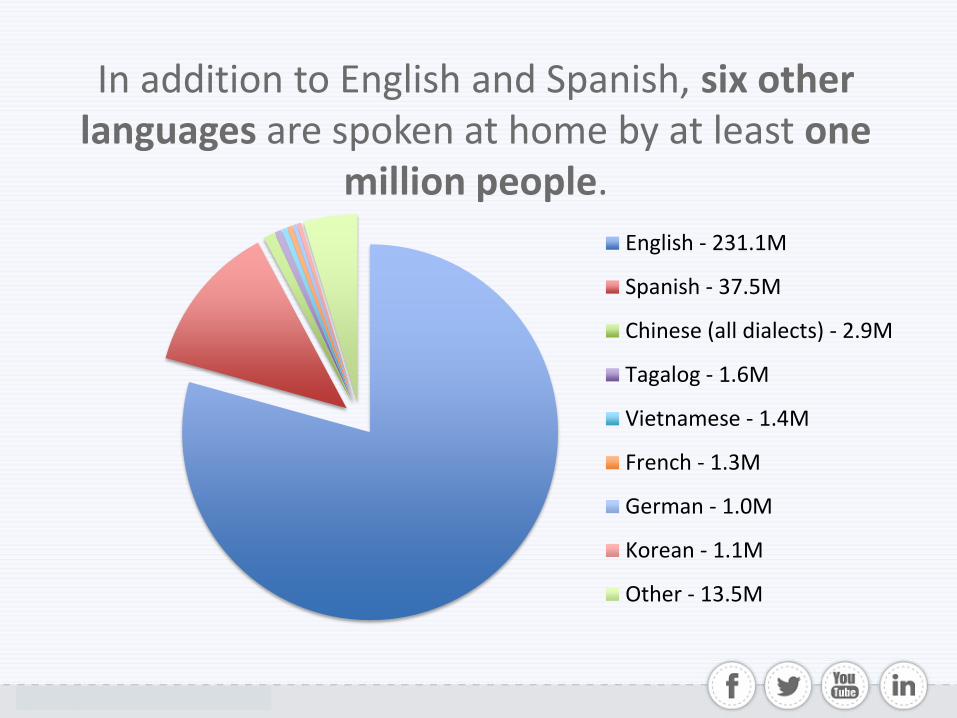
In addition to English and Spanish, six other languages are spoken at home by at least one
million people.
English - 231.1M
Spanish - 37.5M
Chinese (all dialects) - 2.9M
Tagalog - 1.6M
Vietnamese - 1.4M
French - 1.3M
German - 1.0M
Korean - 1.1M
Other - 13.5M
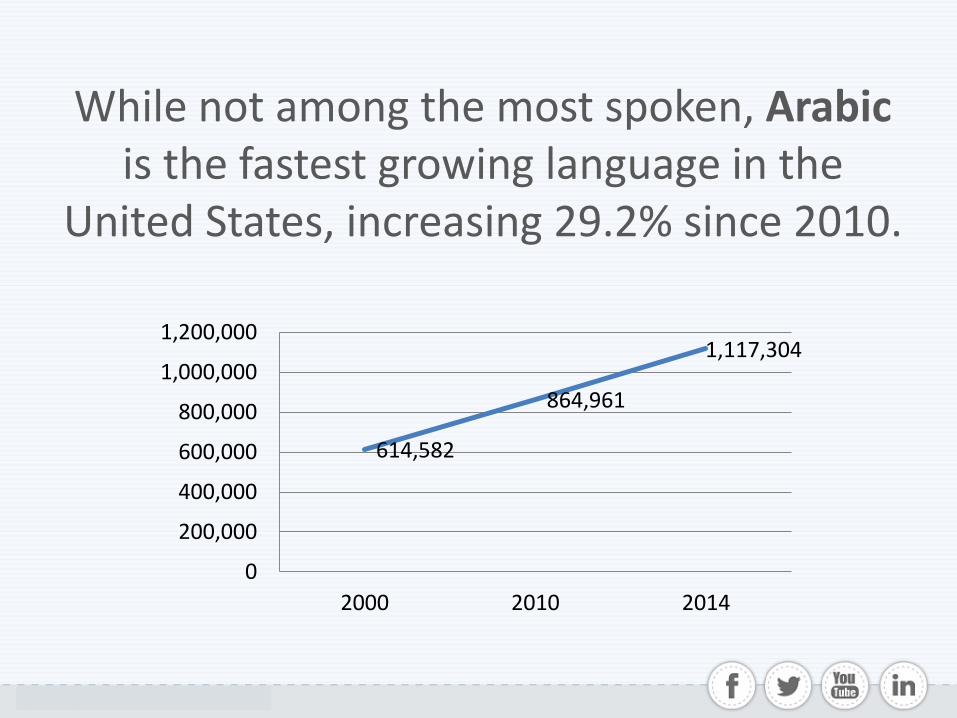
While not among the most spoken, Arabic is the fastest growing language in the
United States, increasing 29.2% since 2010.
614,582
864,961
1,117,304
0
200,000
400,000
600,000
800,000
1,000,000
1,200,000
2000 2010 2014
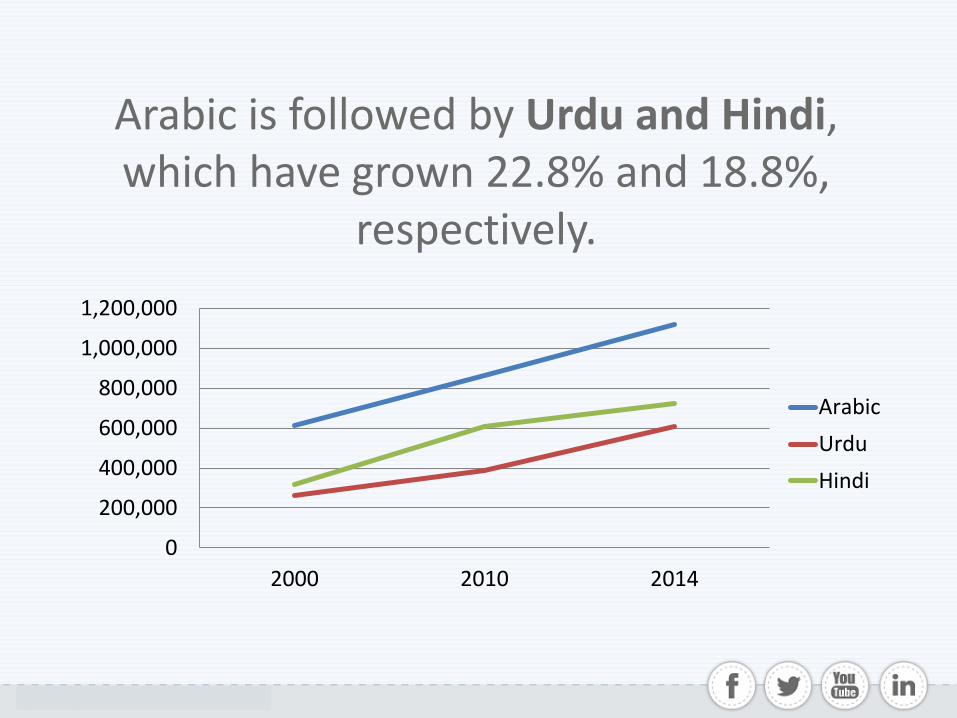
Arabic is followed by Urdu and Hindi, which have grown 22.8% and 18.8%,
respectively.
0
200,000
400,000
600,000
800,000
1,000,000
1,200,000
2000 2010 2014
Arabic
Urdu
Hindi

Other languages have decreased in recent years, including Hungarian (-13.6%), Serbo-
Croatian (-13.3%), and German (-12.5%).
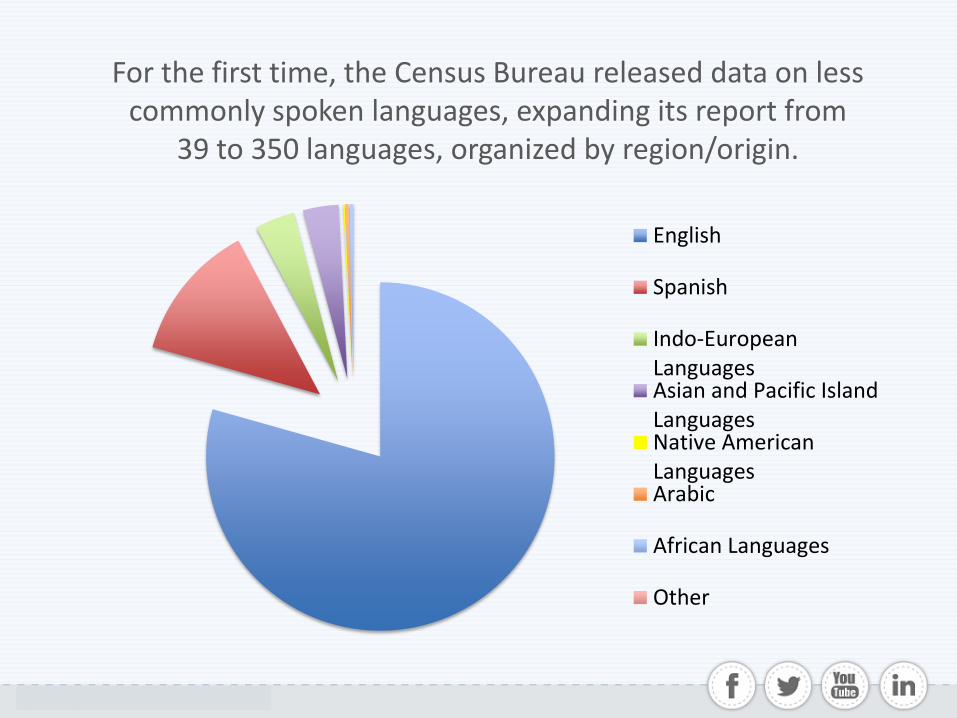
For the first time, the Census Bureau released data on less commonly spoken languages, expanding its report from
39 to 350 languages, organized by region/origin.
English
Spanish
Indo-EuropeanLanguagesAsian and Pacific IslandLanguagesNative AmericanLanguagesArabic
African Languages
Other
WHERE ARE FOREIGN LANGUAGES SPOKEN MOST?
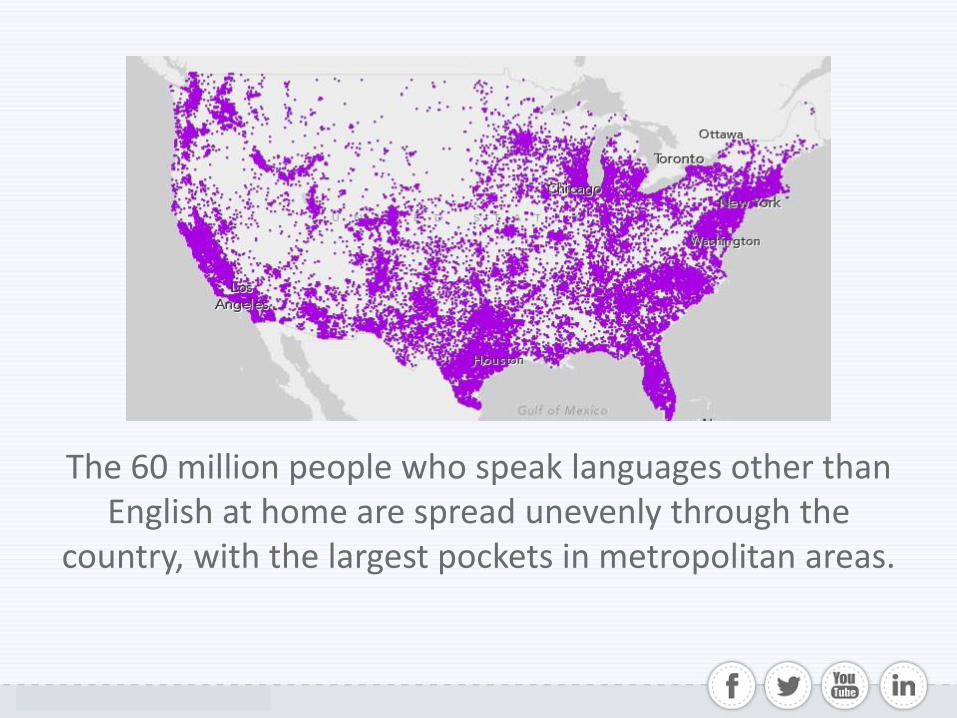
The 60 million people who speak languages other than English at home are spread unevenly through the
country, with the largest pockets in metropolitan areas.
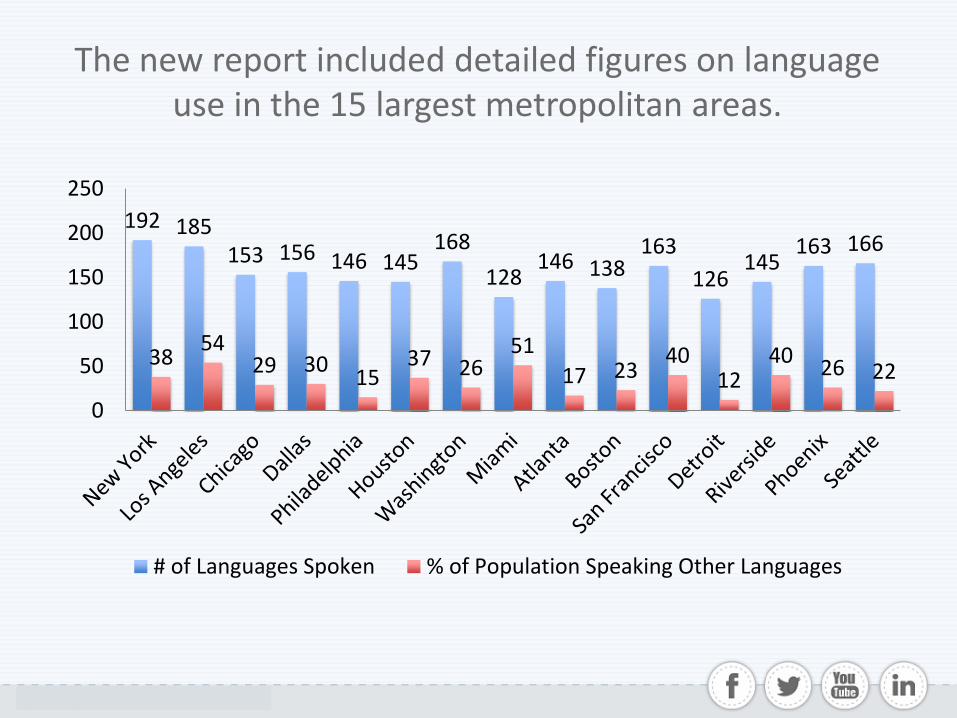
The new report included detailed figures on language use in the 15 largest metropolitan areas.
192 185 153 156 146 145
168
128 146 138
163
126 145
163 166
38 54
29 30 15
37 26 51
17 23 40
12 40
26 22
0
50
100
150
200
250
# of Languages Spoken % of Population Speaking Other Languages
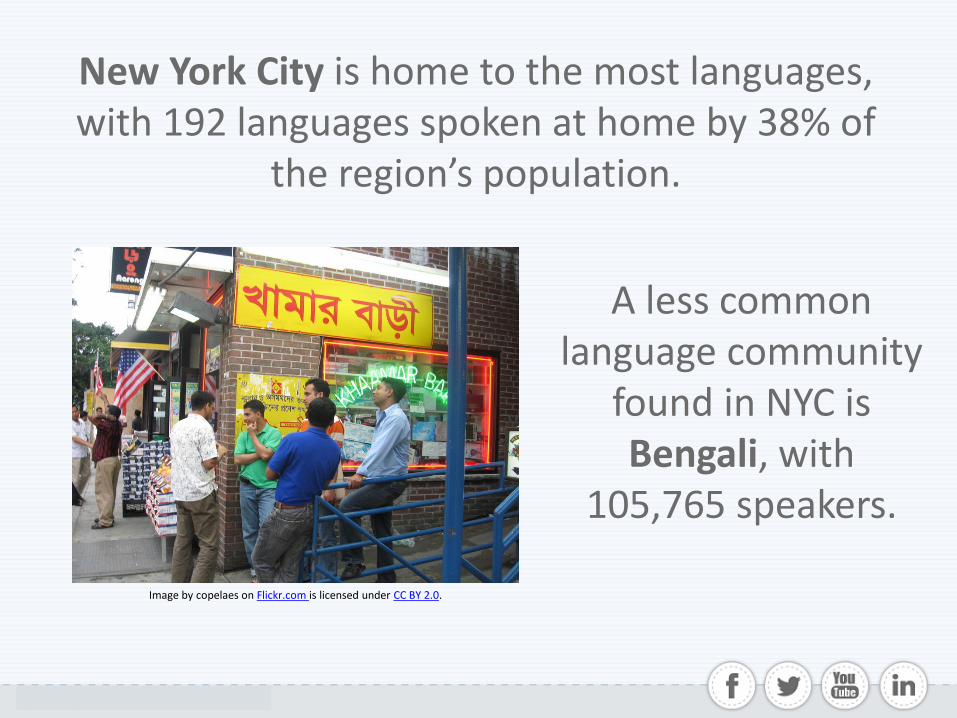
New York City is home to the most languages, with 192 languages spoken at home by 38% of
the region’s population.
A less common language community
found in NYC is Bengali, with
105,765 speakers.
Image by copelaes on Flickr.com is licensed under CC BY 2.0.
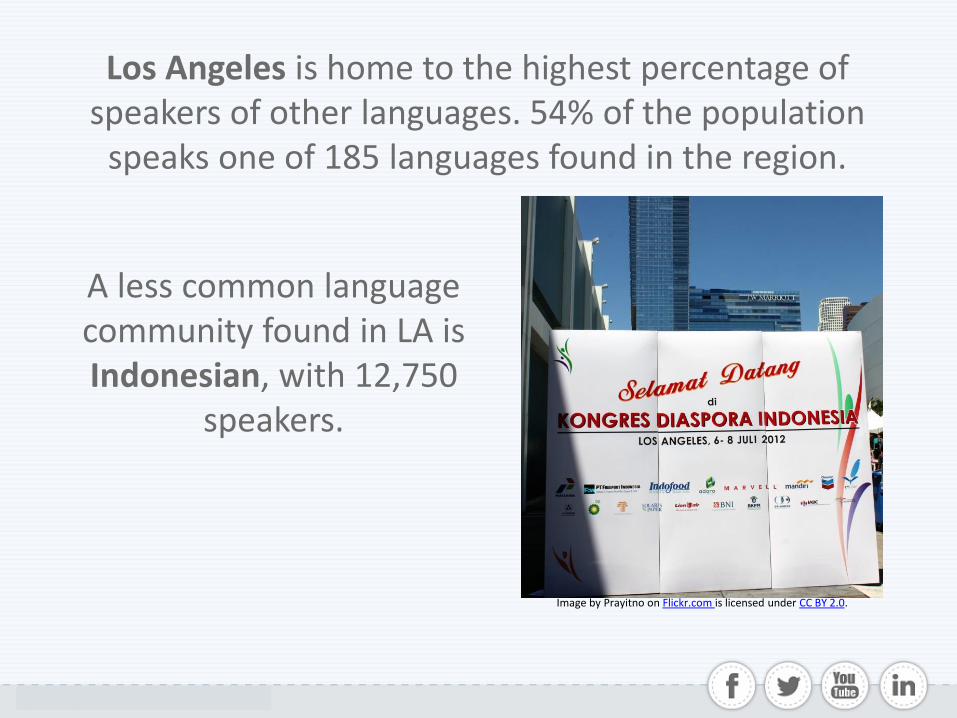
Los Angeles is home to the highest percentage of speakers of other languages. 54% of the population
speaks one of 185 languages found in the region.
A less common language community found in LA is Indonesian, with 12,750
speakers.
Image by Prayitno on Flickr.com is licensed under CC BY 2.0.
HOW IS THE USE OF A DIFFERENT LANGUAGE AT HOME RELATED TO
ENGLISH PROFICIENCY?
Those who spoke a language other than English at home were asked to self-evaluate their English skill.
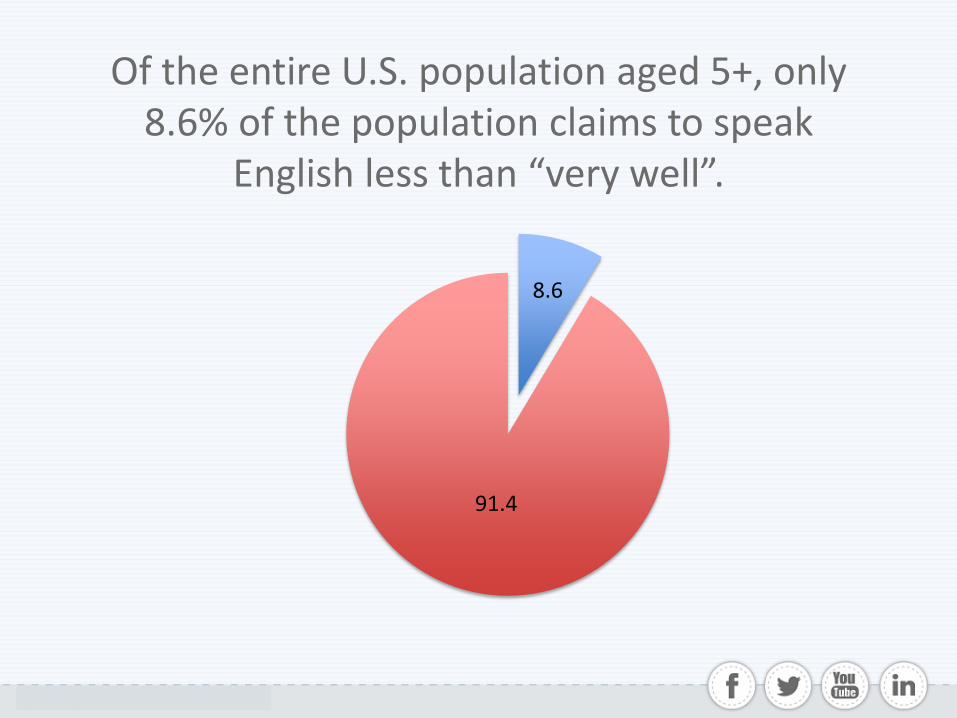
Of the entire U.S. population aged 5+, only 8.6% of the population claims to speak
English less than “very well”.
8.6
91.4
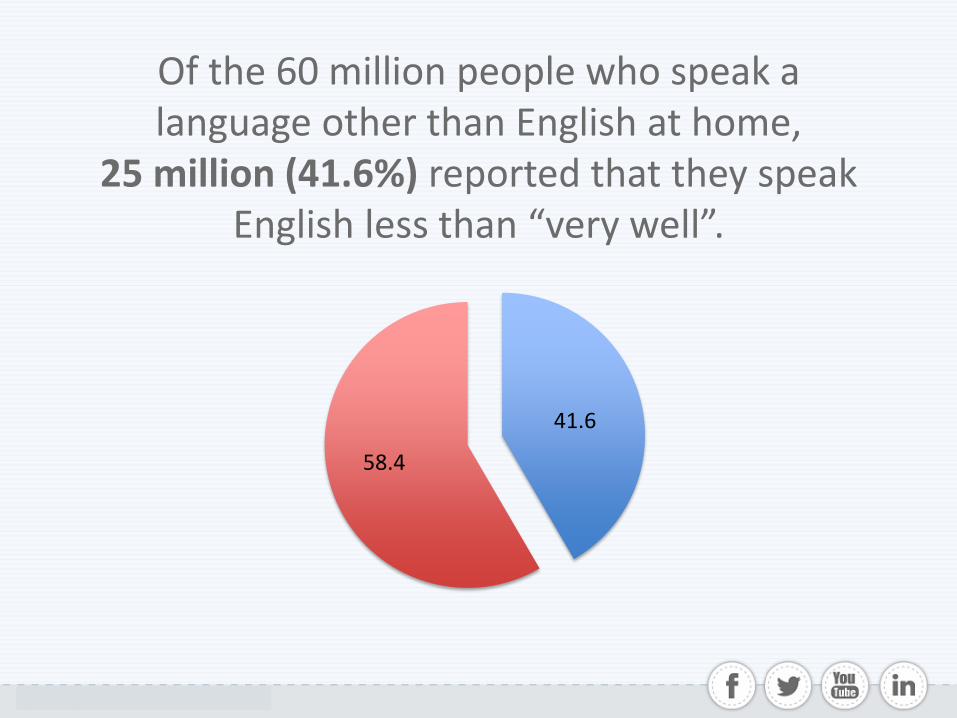
Of the 60 million people who speak a language other than English at home,
25 million (41.6%) reported that they speak English less than “very well”.
41.6
58.4
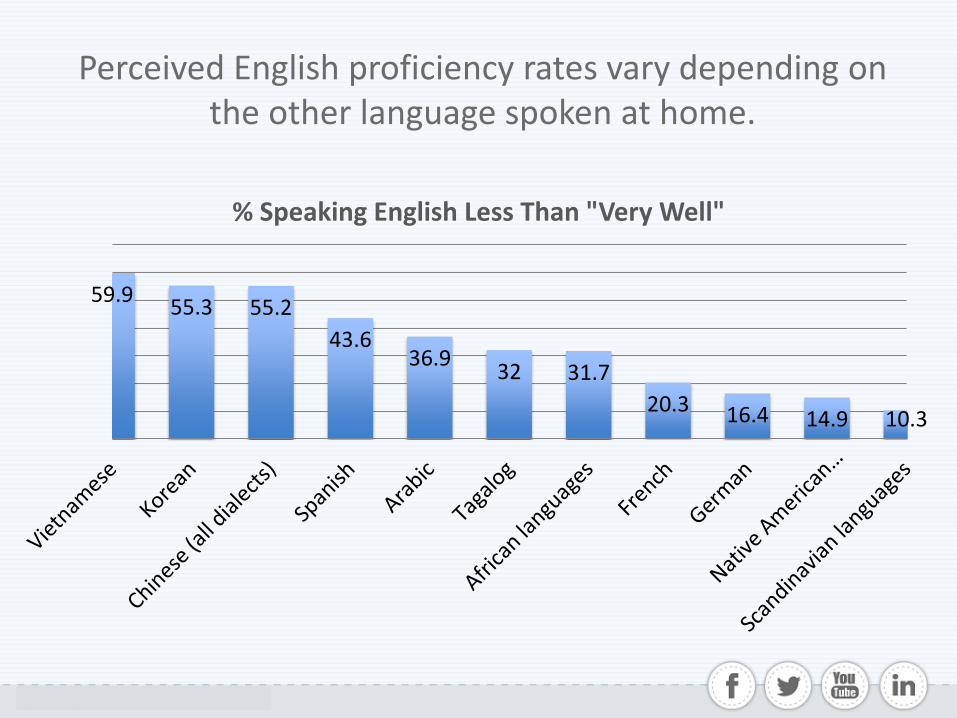
Perceived English proficiency rates vary depending on the other language spoken at home.
59.9 55.3 55.2
43.6 36.9
32 31.7
20.3 16.4 14.9 10.3
% Speaking English Less Than "Very Well"
Those who speak Asian languages at home report lower English proficiency levels than speakers of European or Native American
languages.
However, the data provided is self-evaluated, not tested, so this could say more about the expectations of certain cultures rather than their actual English
proficiency levels.

WHY DOES IT MATTER?
The upward trend in linguistic diversity in the United States shows no sign of slowing or
reversing.
The U.S. requires better language capabilities for social, economic, and security needs. The newest
US Census data shows we already have that capability in hundreds of languages, if only we
were better leveraging it.
Public planners and policy makers can also use this data to strengthen English language skills
nationwide by identifying regions and groups in need of more support.

“KNOWING THE NUMBER OF LANGUAGES AND HOW MANY SPEAK THESE LANGUAGES IN A PARTICULAR
AREA PROVIDES VALUABLE INFORMATION TO POLICYMAKERS,
PLANNERS AND RESEARCHERS.”
- ERIK VIKSTROM, CENSUS BUREAU STATISTICIAN
To learn more about the state of foreign languages in the U.S., check out the latest US
Census Bureau report.
To learn more about Transparent Language and take a step towards improving your language capabilities visit our website.
Related Documents