Part III STATISTICAL ANNEX

Welcome message from author
This document is posted to help you gain knowledge. Please leave a comment to let me know what you think about it! Share it to your friends and learn new things together.
Transcript

Part IIIStatiStical annex

Part III

S t a t i S t i c a l a n n e x 109notes on the annex tables
Key
the following conventions are used in the tables:
.. = data not available0 or 0.0 = nil or negligibleblank cell = not applicable
numbers presented in the tables may differ from the original data sources because of rounding or data processing. With the exception of table a3, observations presented in the annex tables include only those observations used for compiling figures and tables in the text. to separate decimals from whole numbers a full point (.) is used.
Weighted averages for income and regional groupings are reported only when data are available for at least half of the countries in each region and represent at least two-thirds of the population of each region.
technical notes
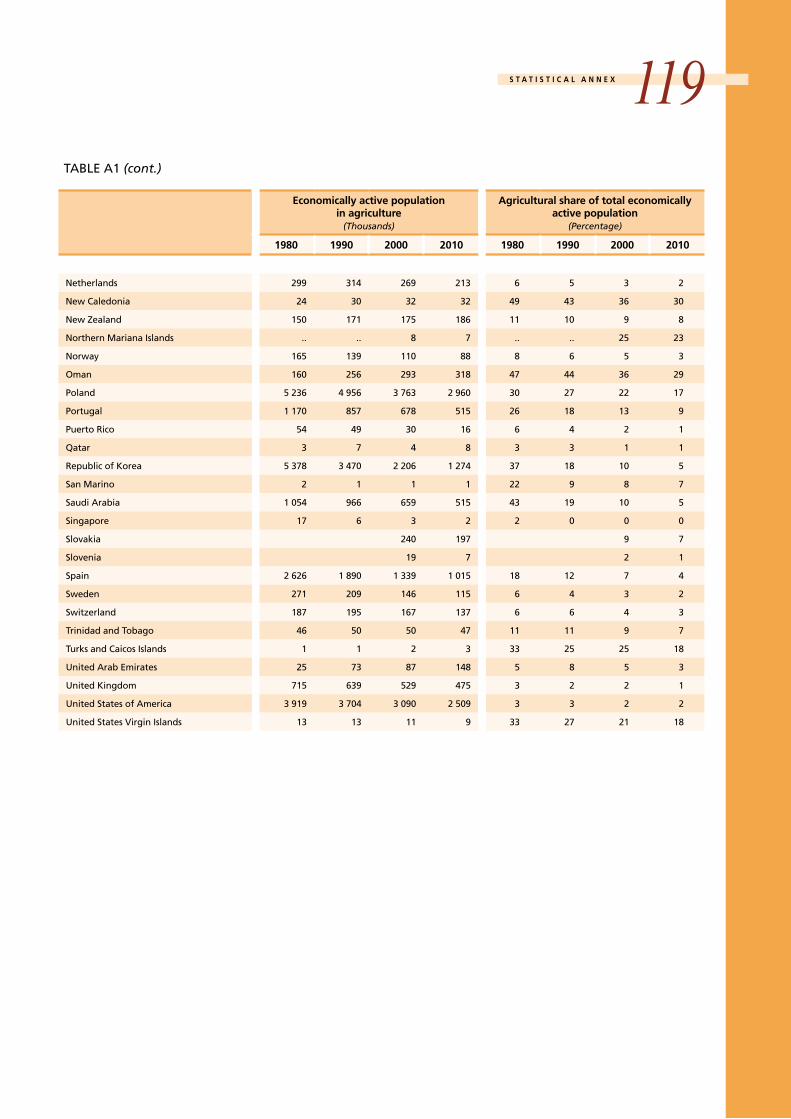
table a1. economically active population in agriculture and agricultural share of total economically active population, 1980, 1990, 2000 and 2010Source: FaO, 2012a. the total economically active population includes all employed and unemployed persons. the term covers employers, self-employed workers, salaried employees, wage earners, unpaid workers assisting in a family, farm or business operation, members of producers’ cooperatives and members of the armed forces.
Economically active population in agriculturethe number of people engaged in or seeking work in agriculture, hunting, fishing or forestry. Referred to elsewhere in the text as the agricultural labour force or agricultural workers.
Agricultural share of total economically active populationthe total number of people economically active in agriculture divided by the total economically active population multiplied by 100.
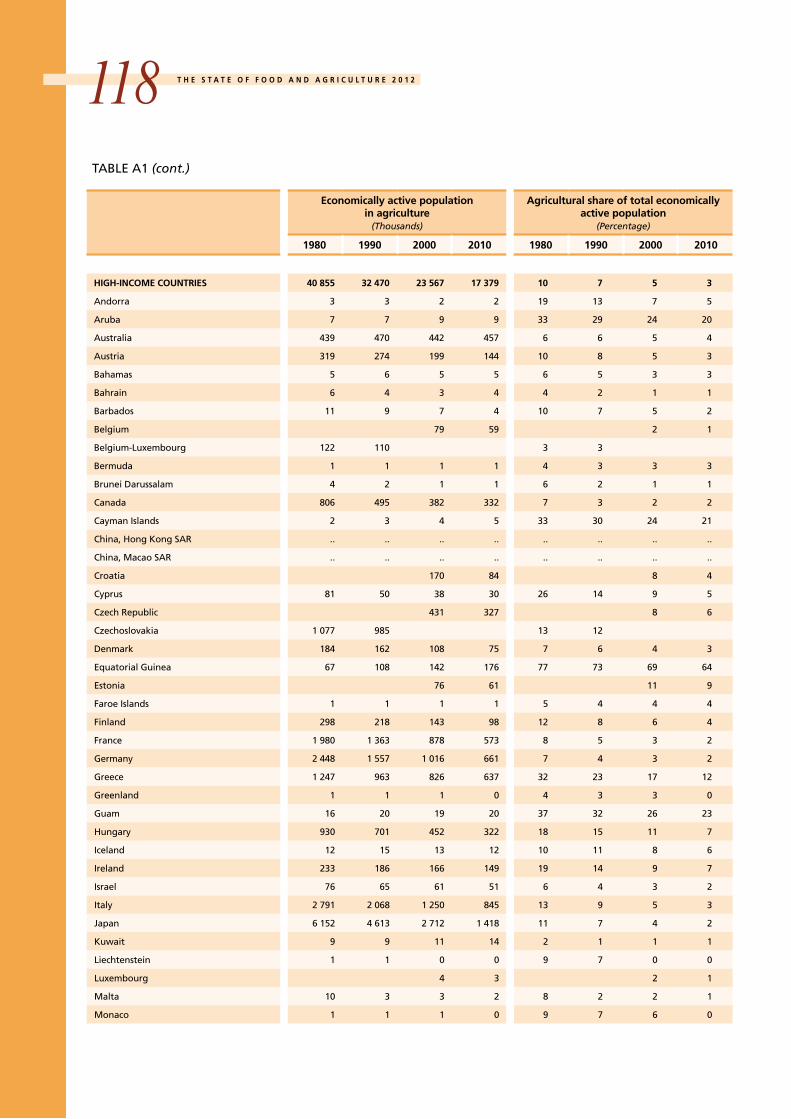
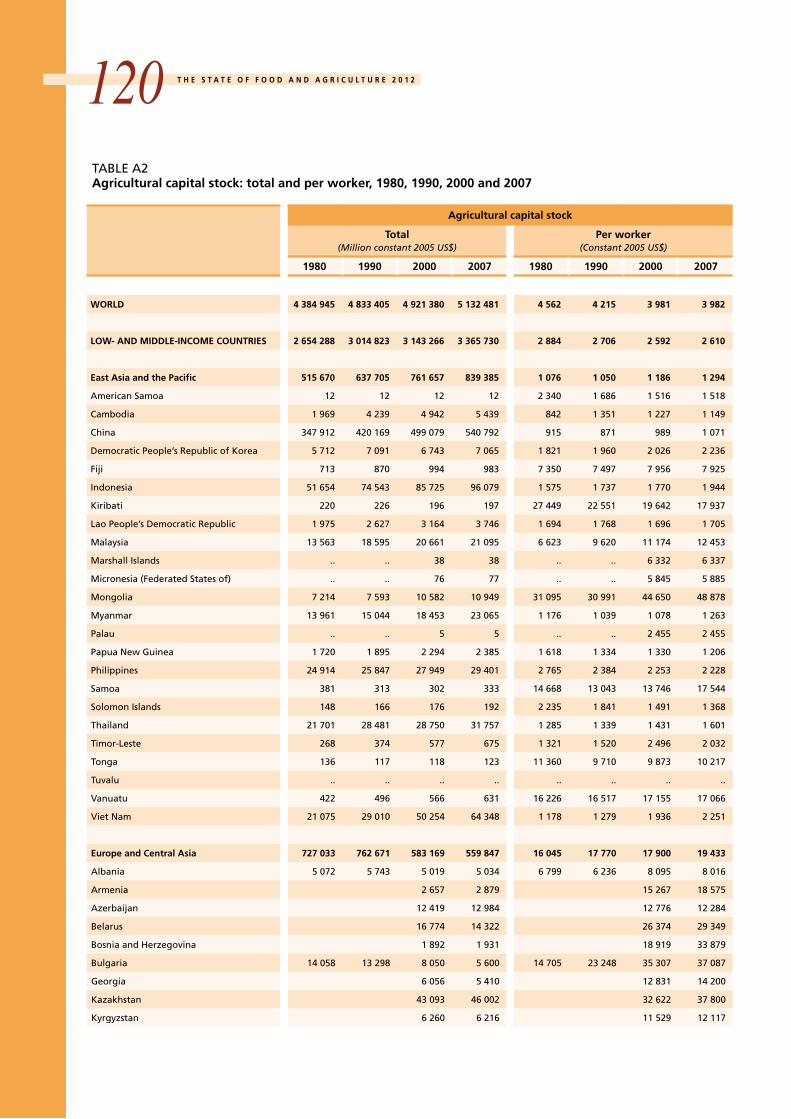
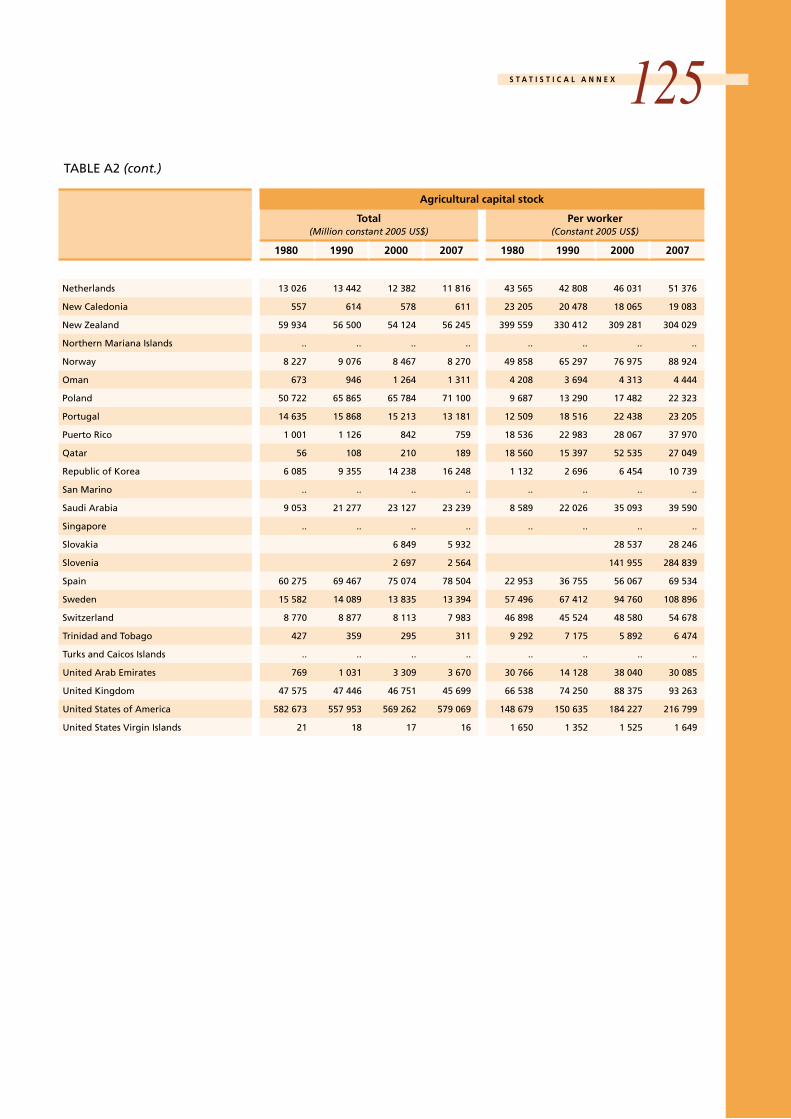
table a2. agricultural capital stock: total and per worker, 1980, 1990, 2000 and 2007Source: FaO, 2012a.
Agricultural capital stock agricultural capital stock equals the total value of a producer’s holdings of a defined set of fixed assets. Fixed assets consist of
t H e S t a t e O F F O O D a n D a G R i c U l t U R e 2 0 1 2110tangible or intangible assets that are used repeatedly or continuously in other processes of production over periods of one year or longer. the physical assets included are land development, livestock, machinery and equipment, plantation crops (trees, vines and shrubs yielding repeated products) and structures for livestock. Values are presented in constant 2005 US dollars.
Agricultural capital stock per workeragricultural capital stock divided by the economically active population in agriculture. Values are presented in constant 2005 US dollars.
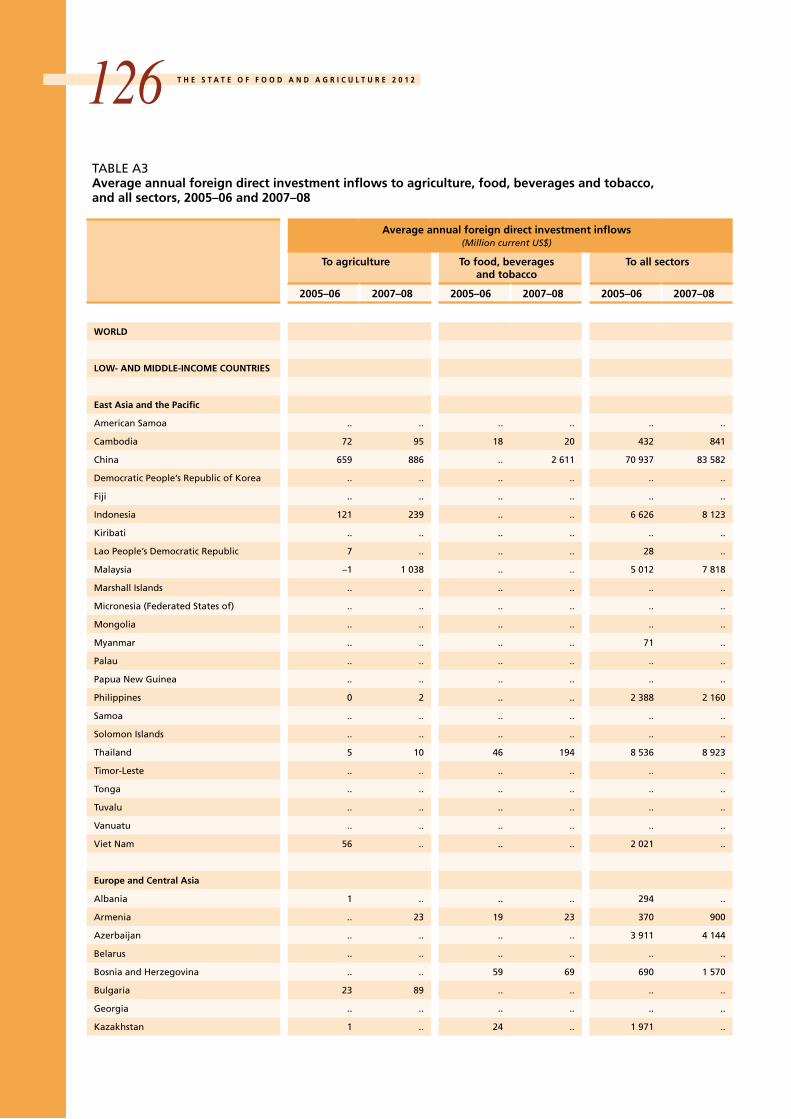
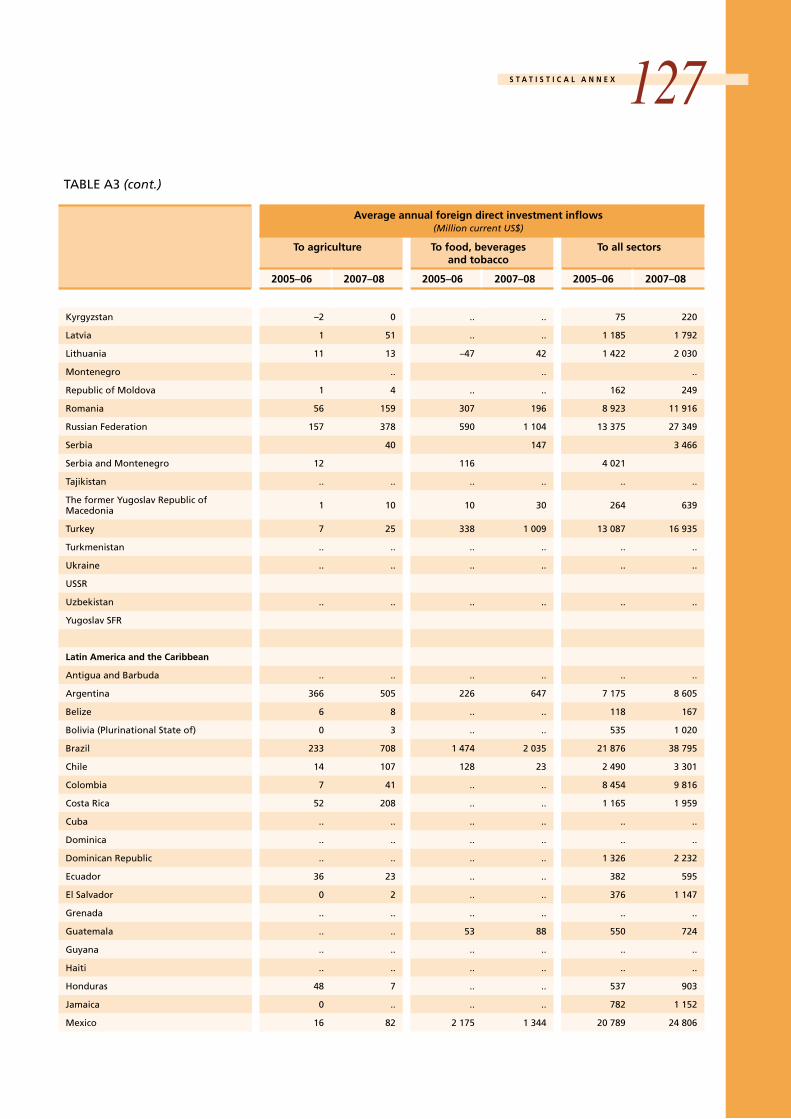
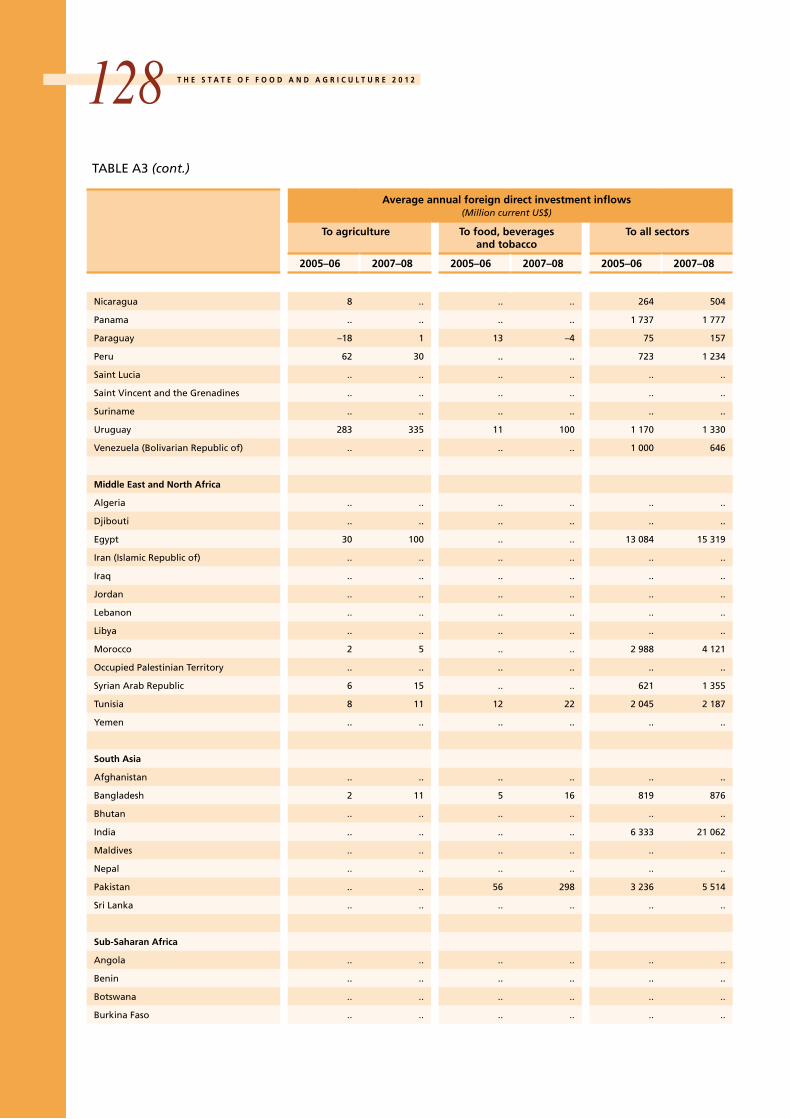
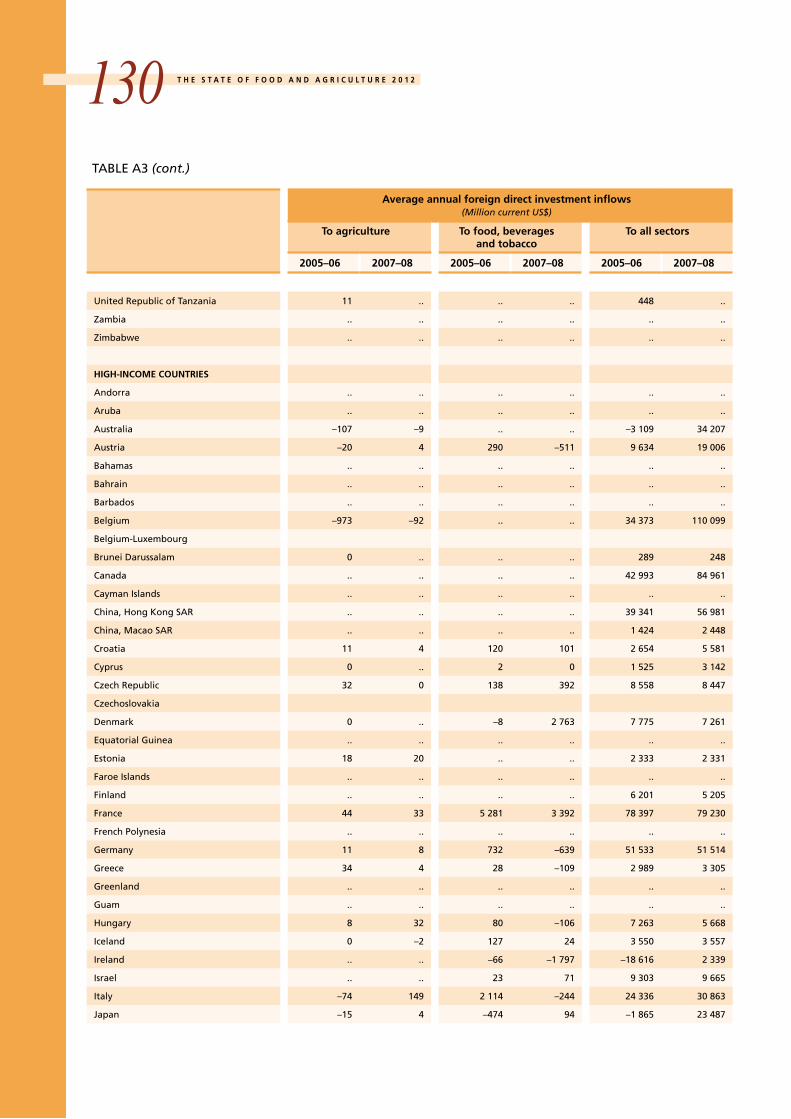
table a3. average annual foreign direct investment inflows to agriculture, food, beverages and tobacco, and all sectors, 2005–06 and 2007–08 Source: Data provided by UnctaD.Foreign direct investment (FDi) occurs when an enterprise (the direct investor) establishes a lasting interest in an enterprise (direct investment enterprise) that is a resident of a country other than that of the direct investor. lasting interest implies the existence of a long-term relationship between the investor and enterprise, as well as the investor’s ownership of at least 10 percent of the voting power of the enterprise. FDi flows with a negative sign indicate that at least one of the three components of FDi (equity capital, reinvested earnings or intra-company loans) is negative and not offset by positive amounts of the remaining components. these are instances of reverse investment or disinvestment. Sectoral FDi data use the categories of economic activity established by the United nations international Standard industrial classification of all economic activities, Revision 3. Values are presented in current US dollars.
FDI inflows to agricultureFDi inflows to agriculture are those investments made in crop production, market gardening and horticulture; livestock; mixed crops and livestock; agricultural and animal husbandry services (excluding veterinary activities); hunting, trapping and game propagation; forestry and logging; and fishing, fish hatcheries and fish farms.
FDI inflows to food, beverages and tobaccoFDi inflows to food, beverages and tobacco consist of all such investments in production, processing and preservation of meat, fish, fruit, vegetables, oils and fats; the manufacture of dairy products, grain mill products, starches and starch products, prepared animal feeds, other food products, beverages and tobacco products.
FDI inflows to all sectors FDi inflows to all sectors are investments to all economic activities. these are: agriculture, hunting, forestry and fishing; mining and quarrying; manufacturing; electricity, gas and water supply; construction; wholesale and retail trade, repair of motor vehicles, motorcycles and personal and household goods; hotels and restaurants; transport, storage and communications; financial intermediation; real estate, renting and business activities; public administration and defence; compulsory social security; education;

S t a t i S t i c a l a n n e x 111health and social work; other community, social and personal service activities; private households with employed persons; and extra-territorial organizations and bodies.
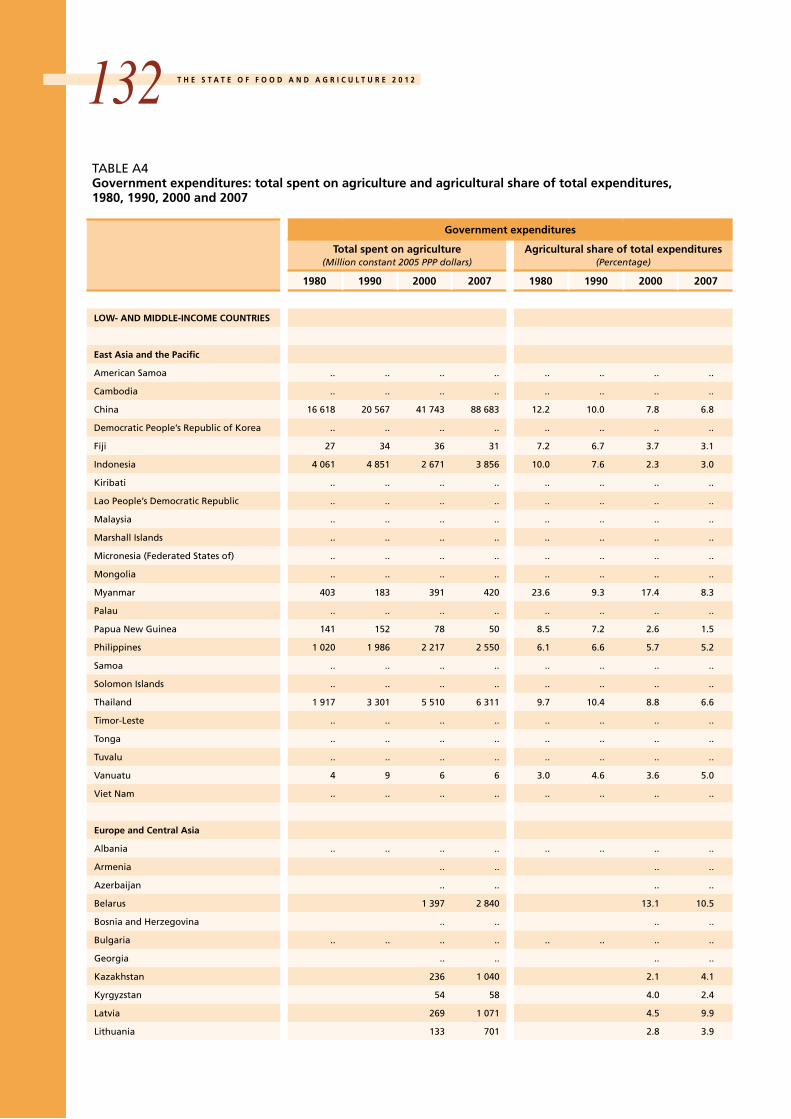
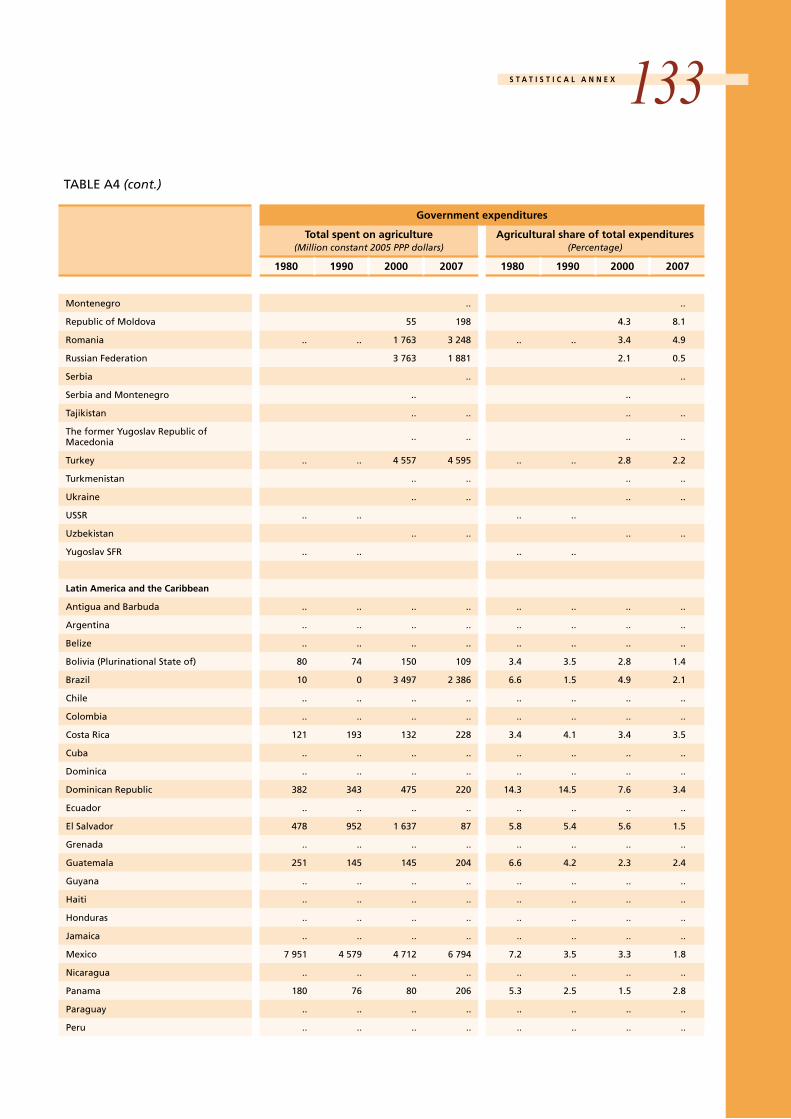
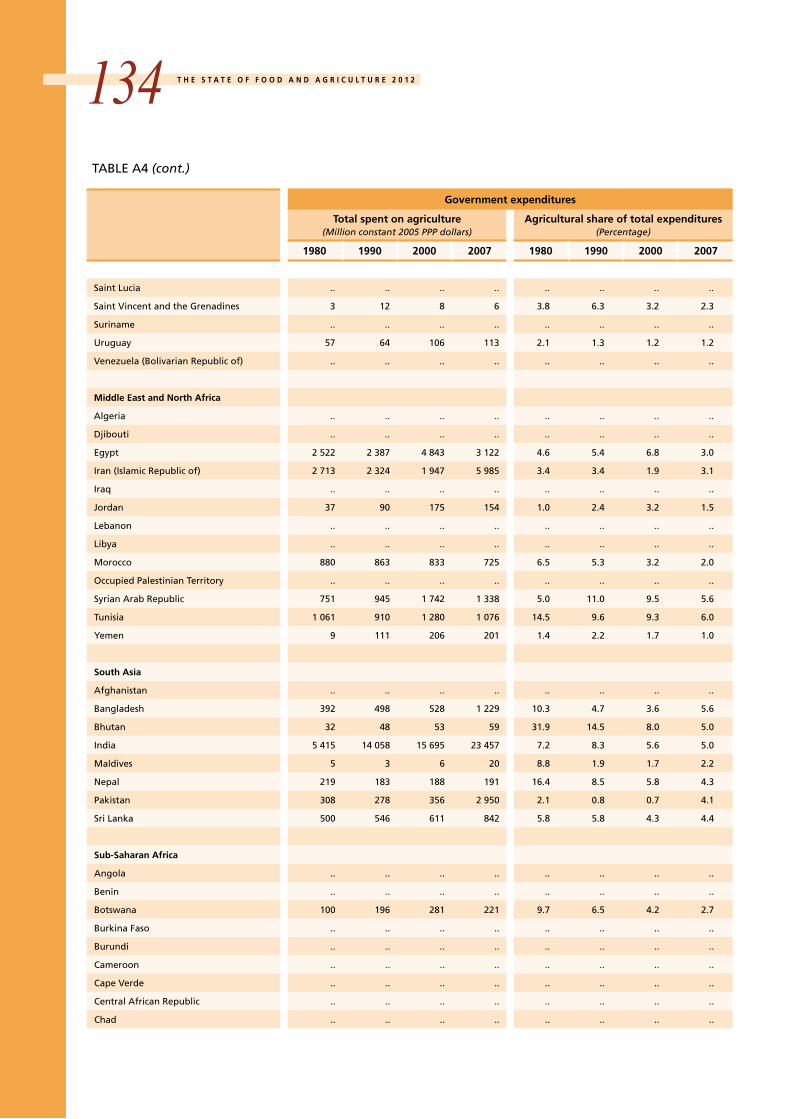
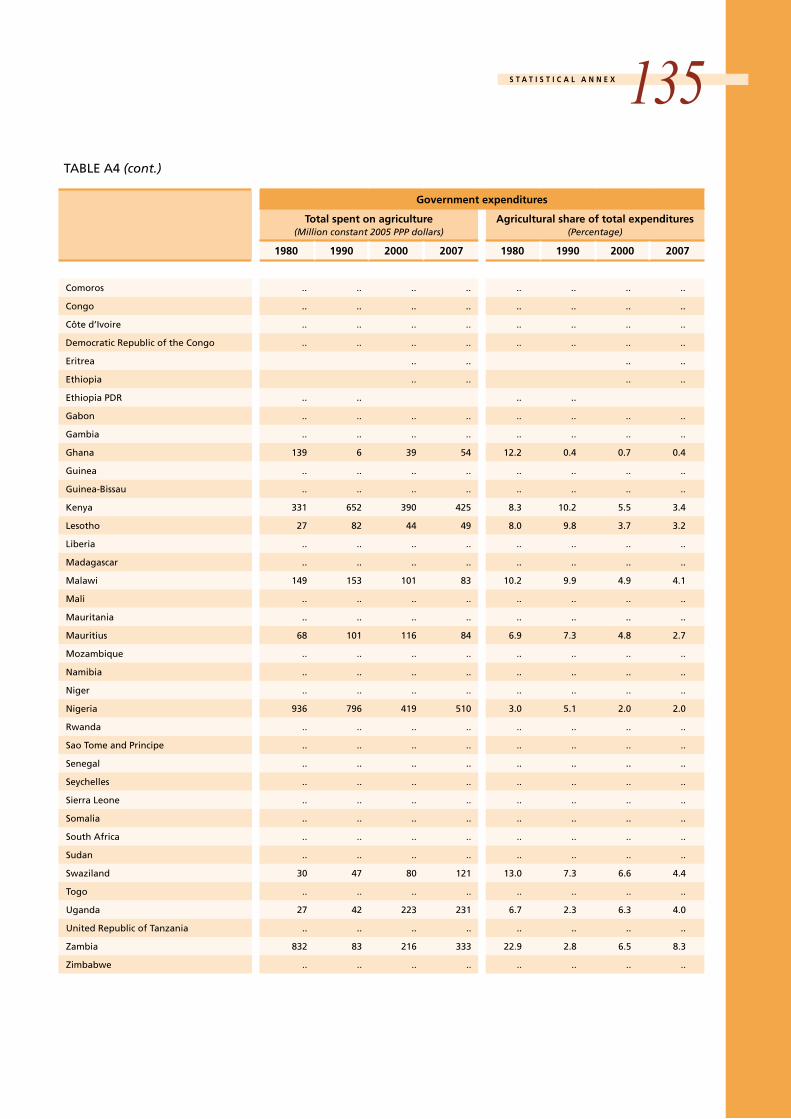
table a4. Government expenditures: total spent on agriculture and agricultural share of total expenditures, 1980, 1990, 2000 and 2007 Source: iFPRi, 2010.total government expenditures are spending carried out by domestic government; they include, as far as possible, the categories considered by the iMF (2001), which are agriculture, defence, education, health, social protection, transportation and communication and others. Values are presented in constant 2005 purchasing power parity (PPP) dollars.
Government expenditures on agricultureGovernment expenditures on agriculture include projects and programmes related to administration, supervision and regulation of agriculture; agrarian reform, agricultural land settlement, development and expansion; flood control and irrigation; farm price and income stabilization programmes; extension, veterinary, pest control, crop inspection and crop grading services; production and dissemination of general and technical information on agriculture; and compensation, grants, loans or subsidies to farmers. expenditures on agricultural research and development as well as on development projects and programmes that serve multiple purposes, including agricultural development, are excluded.
Agricultural share of total expenditures Government spending on agriculture divided by government spending on all sectors multiplied by 100.
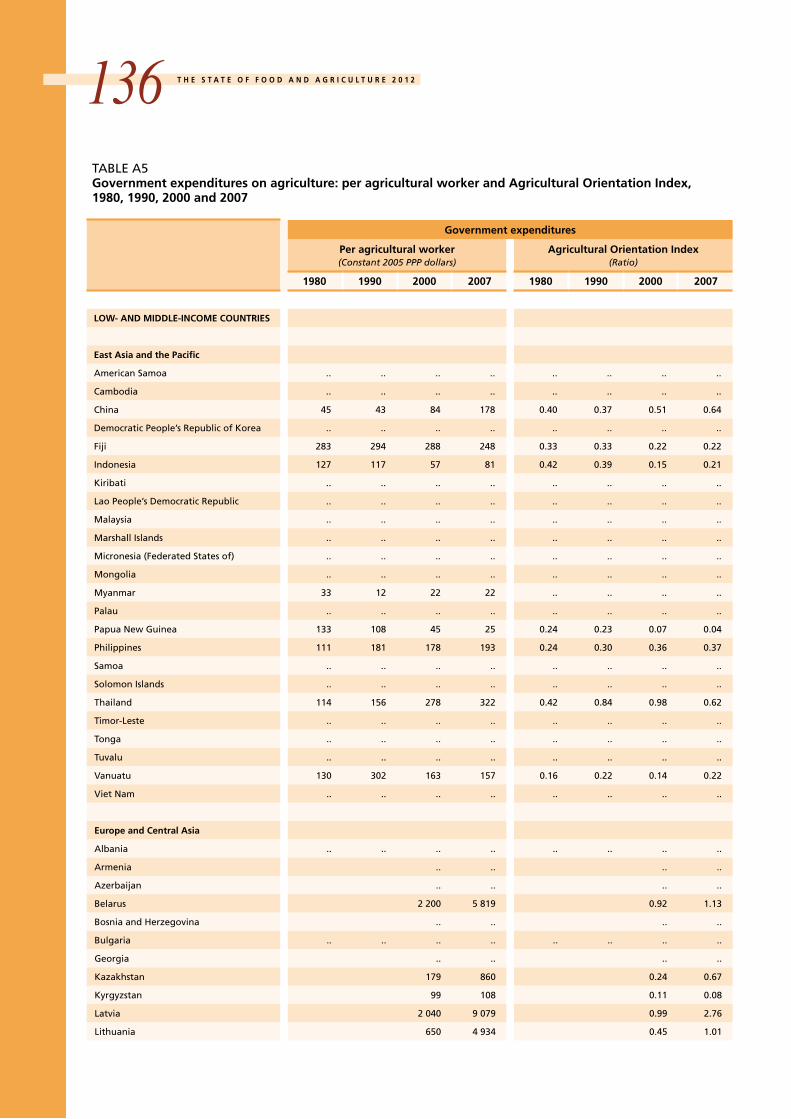
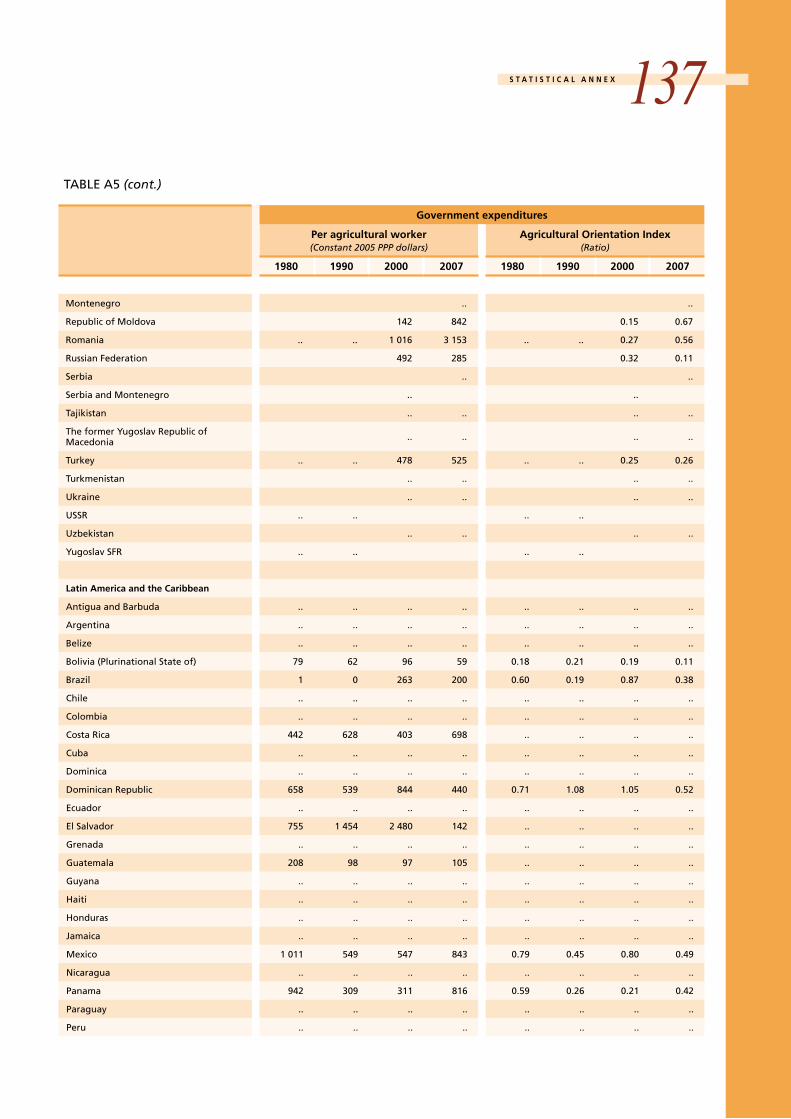
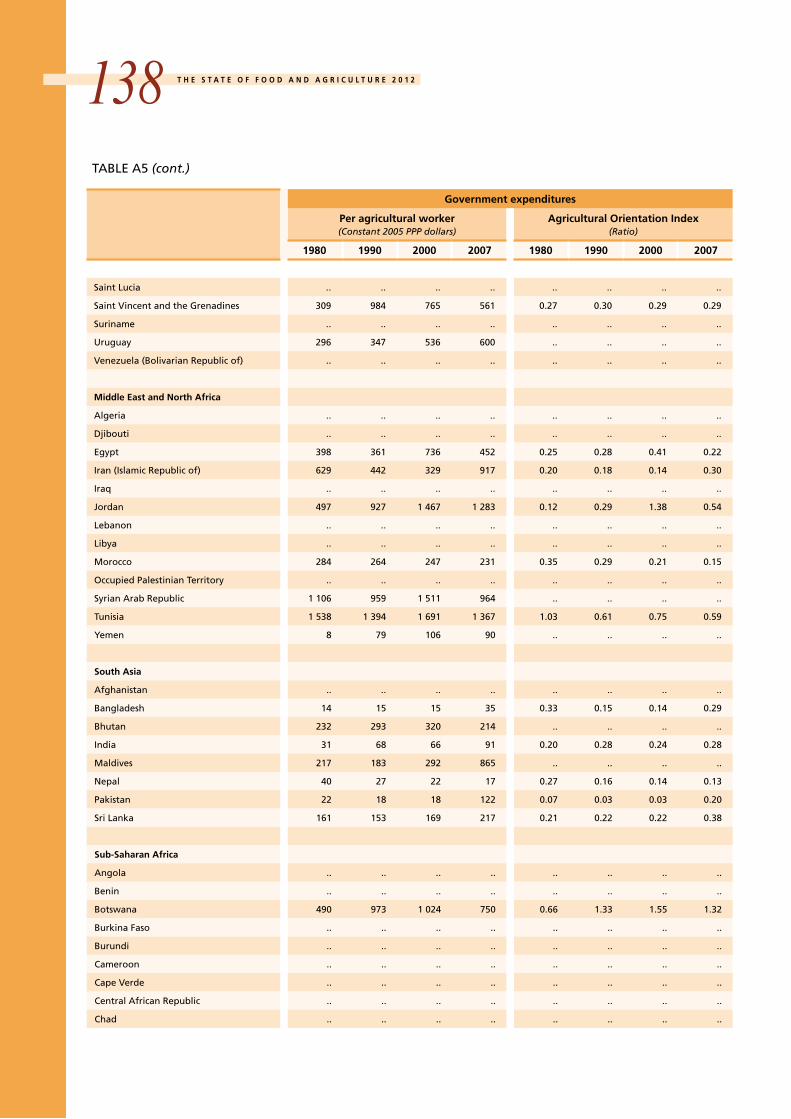
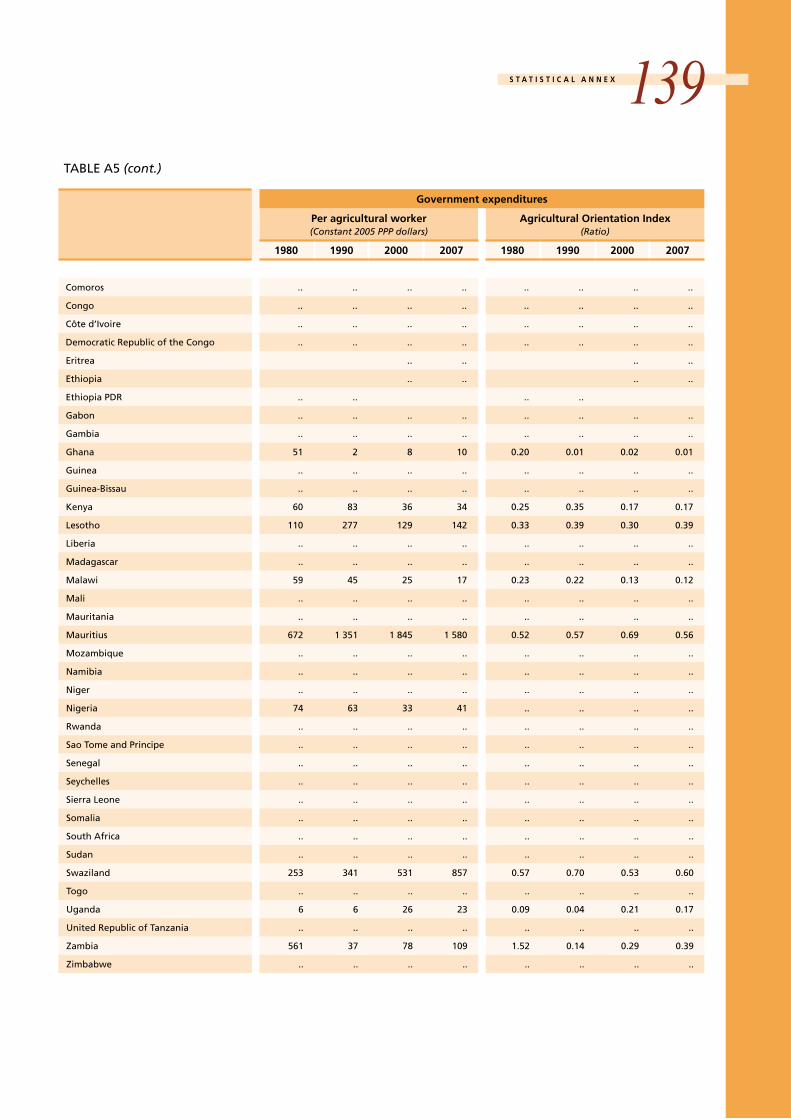
table a5. Government expenditures on agriculture: per agricultural worker and agricultural Orientation index, 1980, 1990, 2000 and 2007Sources: iFPRi, 2010 and World Bank, 2012.
Government expenditures on agriculture per agricultural worker Government expenditures on agriculture divided by the total economically active population in agriculture. Values are presented in constant 2005 PPP dollars.
Agricultural orientation index for government expendituresagricultural share of government spending divided by the agricultural share of gross domestic product.
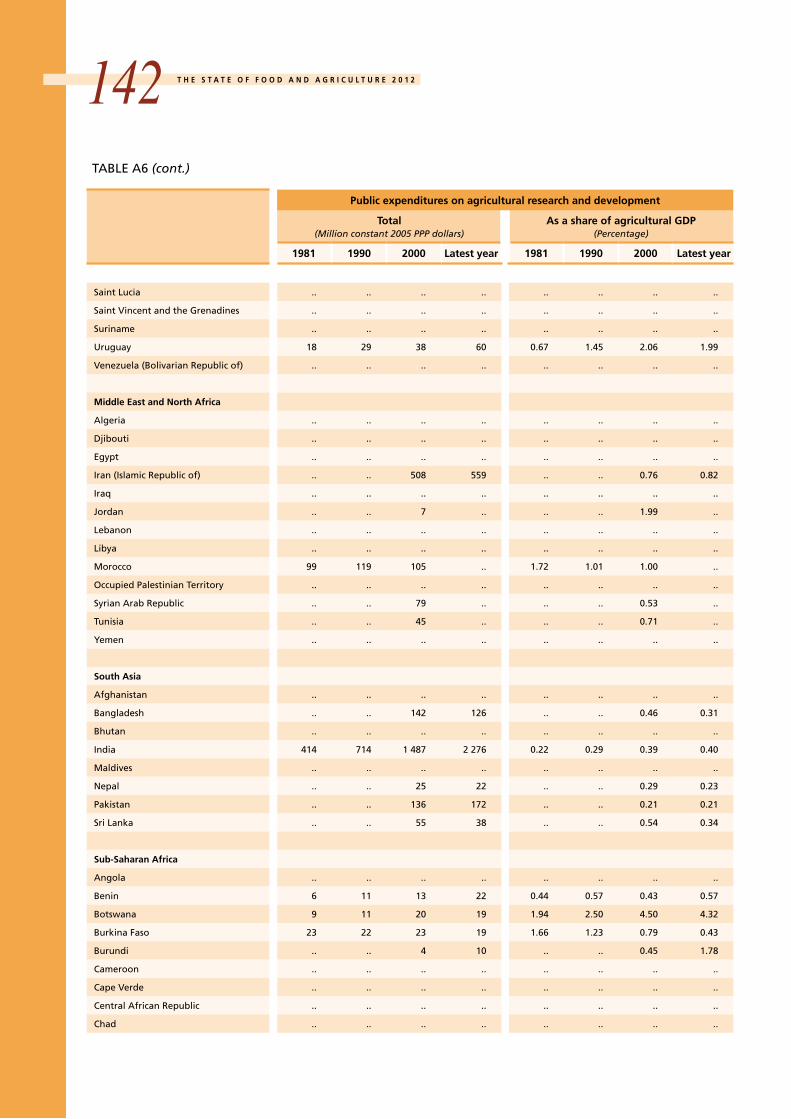
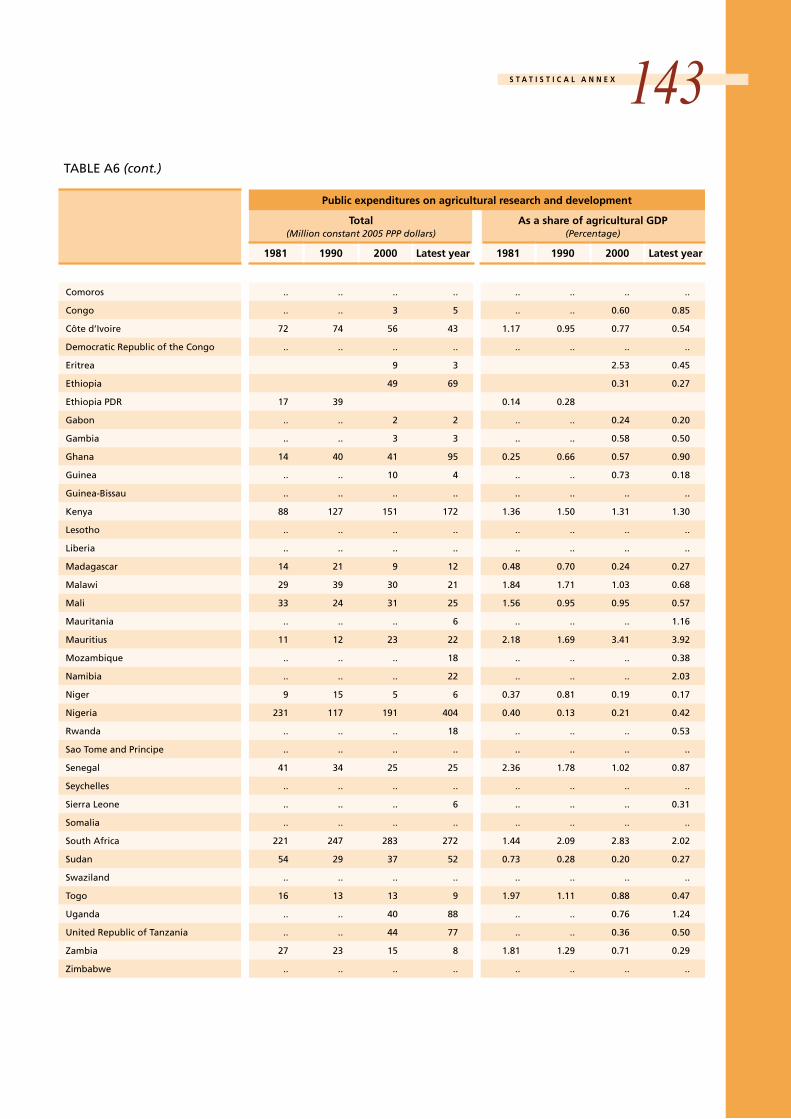
table a6. Public expenditures on agricultural research and development: total and as a share of agricultural GDP, 1981, 1990, 2000 and latest yearSources: iFPRi, 2012a and World Bank, 2012.
Public expenditures on agricultural research and developmentincludes spending by the public sector (government agencies, institutions of higher education and non profit agencies) on research
t H e S t a t e O F F O O D a n D a G R i c U l t U R e 2 0 1 2112regarding crops, livestock, forestry, fisheries, natural resources and socioeconomic aspects of primary agricultural production as well as on-farm post-harvest activities and food-processing. Values are presented in constant 2005 PPP dollars.
Public expenditures on agricultural research and development as a share of agricultural GDPPublic expenditures on agricultural research and development divided by the agricultural GDP multiplied by 100.
the latest year varies by region. For countries in east asia and the Pacific the latest year is 2003, with the exception of china for which it is 2008. For those in europe and central asia it is 2000; for latin america and the caribbean it is 2006; for the Middle east and north africa it is 2004; for South asia it is 2009 and for sub-Saharan africa it is 2008.
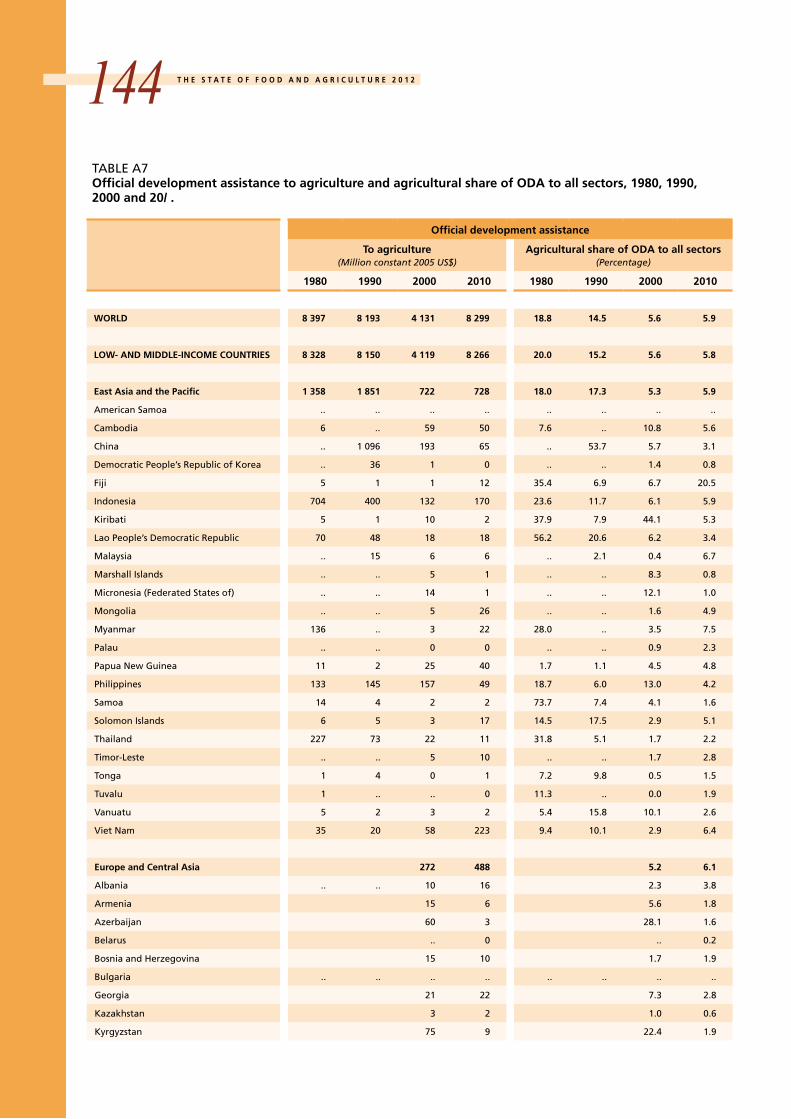
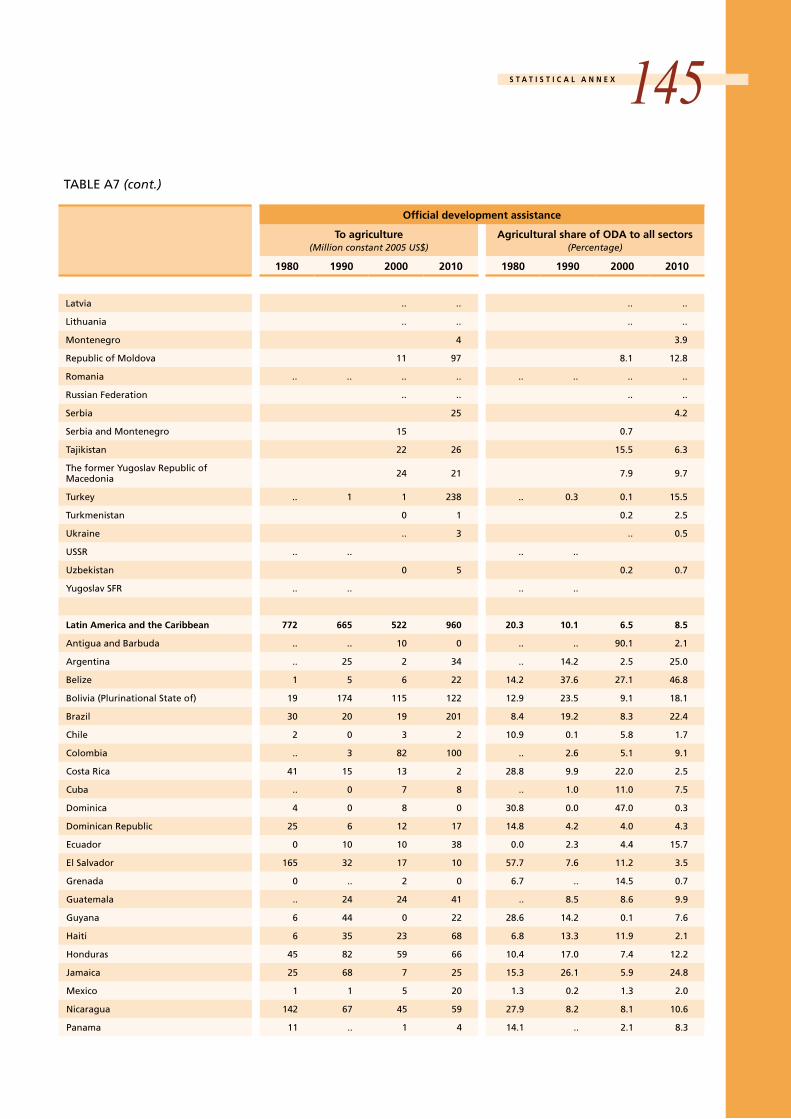
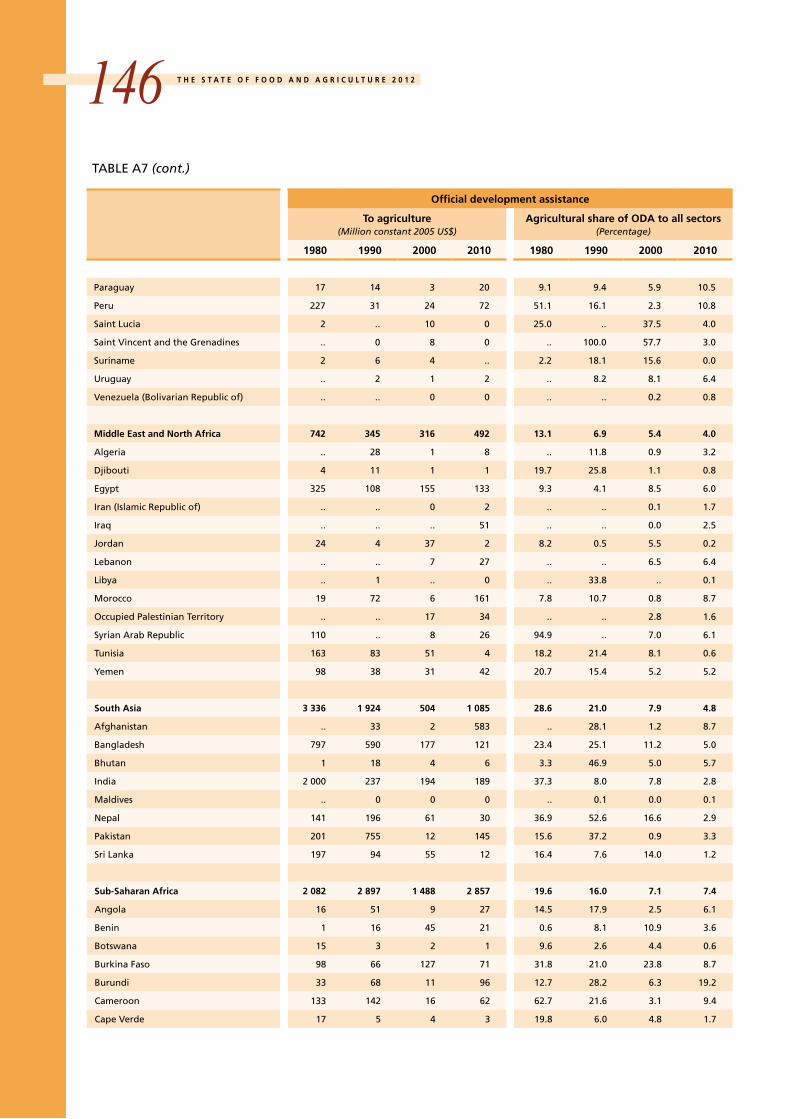
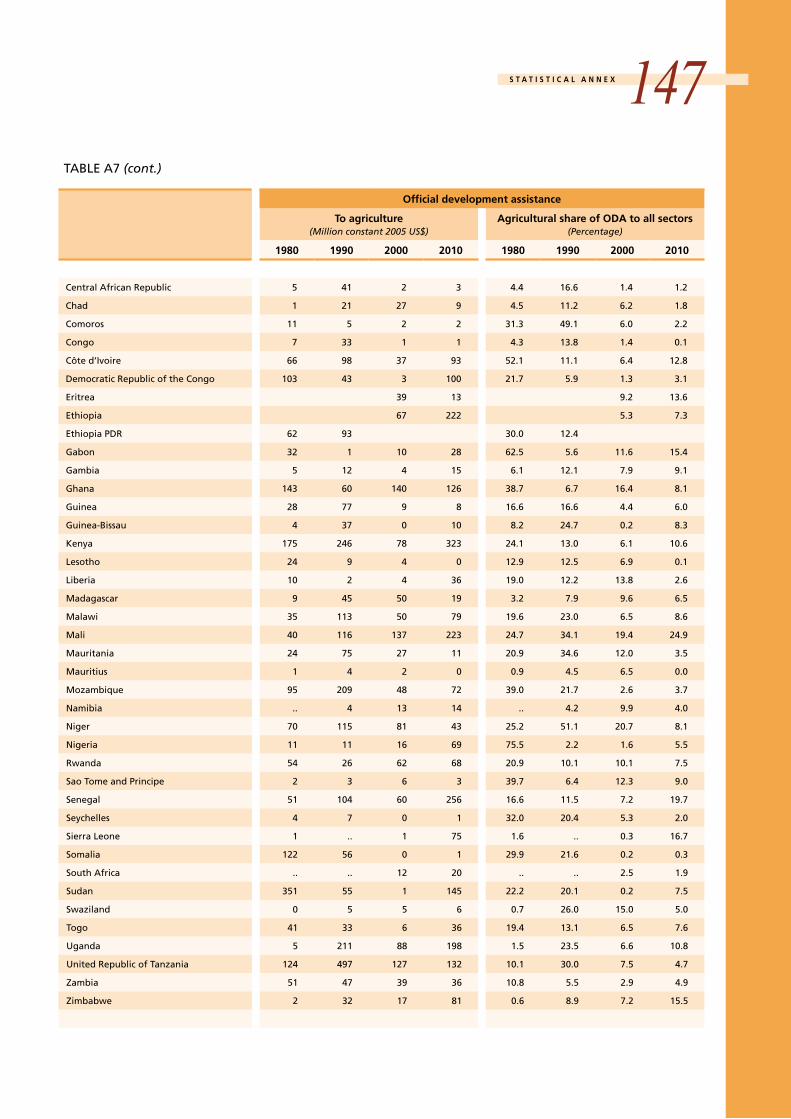
table a7. Official development assistance to agriculture and agricultural share of ODa to all sectors, 1980, 1990, 2000 and 2010Source: OecD, 2012a.Official development assistance (ODa) as presented here consists of commitments of financing made by donor country governments and by multilateral organizations to a recipient country. Such commitments are intended to promote the economic and social development primarily of low- and middle-income countries and are concessional in character with a grant element of at least 25 percent. Values are presented in constant 2005 US dollars.
Official development assistance to agriculture ODa to agriculture includes those commitments for the purposes of projects and programmes related to crops and livestock, forestry and fisheries. these include: (crops and livestock) agrarian reform, agricultural policy and administrative management, crop production, land and water resources, inputs, education, research, extension, training, plant and post-harvest protection and pest control, financial services, farmers’ organizations and cooperatives, livestock production and veterinary services; (forestry) policy and administrative management, development, production of fuelwood and charcoal, education and training, research and services; (fisheries) policy and administrative management, development, education and training, research and services. the definition excludes rural development and development food aid.
Agricultural share of ODA to all sectorsODa to agriculture divided by total ODa to all sectors multiplied by 100. Unspecified recipients include all commitments made for which a recipient country or region was not specified. Regional recipients represent the sum of all commitments of assistance to the following regions: africa, america, asia, central asia, europe, Far east asia, Middle east, north and central america, africa north of the Sahara, Oceania, South and central asia, South america, South asia, africa South of the Sahara and the West indies.
S t a t i S t i c a l a n n e x 113Regional and income groupings
countries are listed in alphabetical order according to the income and groupings established by the World Bank country classification system. a description of the World Bank country classifications is available at http://data.worldbank.org/about/country-classifications.
country notes
Whenever possible, data from 1992 or 1995 onwards are shown for armenia, azerbaijan, Belarus, estonia, Georgia, Kazakhstan, Kyrgyzstan, latvia, lithuania, Moldova, Russian Federation, tajikistan, turkmenistan, Ukraine, and Uzbekistan. available data for years prior to 1992 are shown for the Union of Soviet Socialist Republics (“USSR” in the table listings).
Data for years prior to 1992 are provided for the former Yugoslavia (“Yugoslavia SFR” in the table listings). Observations for the years following 1992 are provided for the individual countries formed from the former Yugoslavia; these are Bosnia and Herzegovina, croatia, the former Yugoslav Republic of Macedonia, and Slovenia, as well as Serbia and Montenegro. Observations are provided separately for Serbia and for Montenegro after the year 2006.
Data are shown when possible for the individual countries formed from the former czechoslovakia – the czech Republic and Slovakia. Data for years prior to 1993 are shown under czechoslovakia.
Data are shown for eritrea and ethiopia separately, if possible; in most cases before 1992 data on eritrea and ethiopia are aggregated and presented as ethiopia PDR.
Data for Yemen refer to that country from 1990 onward; data for previous years refer to aggregated data of the former People’s Democratic Republic of Yemen and the former Yemen arab Republic.
Separate observations are shown for Belgium and luxembourg whenever possible.
Data for china exclude data for Hong Kong Special administrative Region of china and Macao Special administrative Region of china.
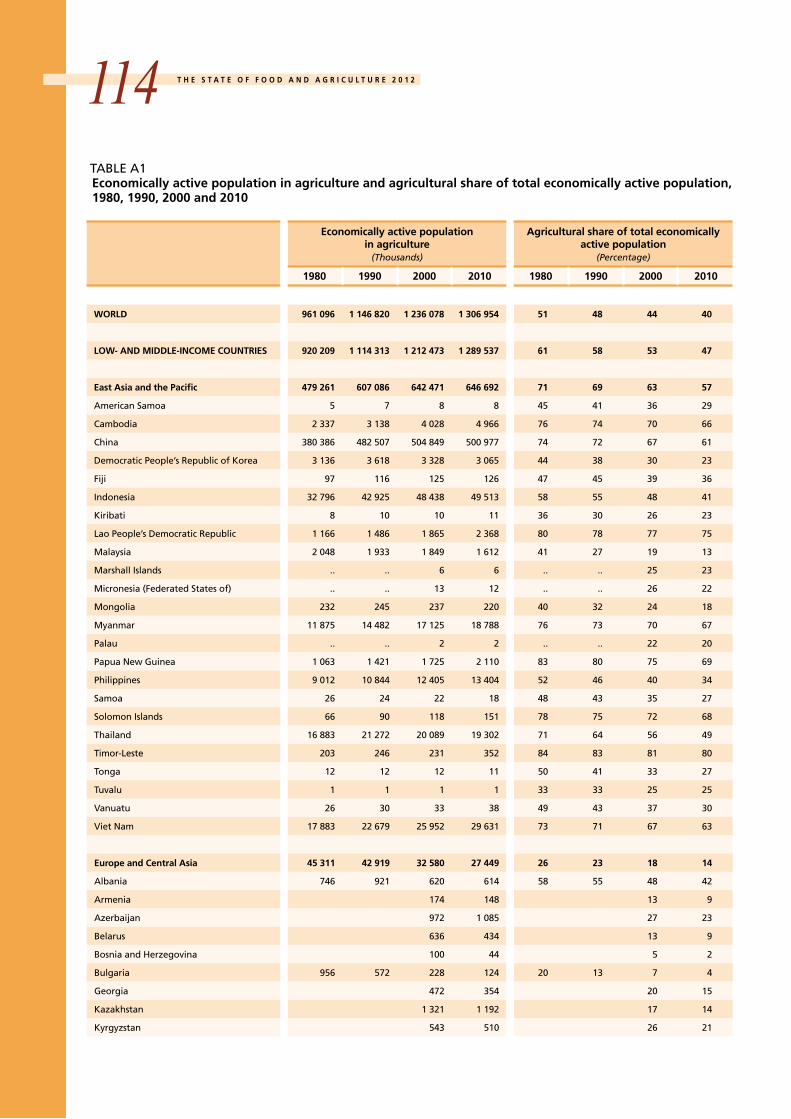
t H e S t a t e O F F O O D a n D a G R i c U l t U R e 2 0 1 2114 taBle a1economically active population in agriculture and agricultural share of total economically active population, 1980, 1990, 2000 and 2010
economically active population in agriculture
(Thousands)
agricultural share of total economically active population
(Percentage)
1980 1990 2000 2010 1980 1990 2000 2010
WORlD 961 096 1 146 820 1 236 078 1 306 954 51 48 44 40
lOW- anD MiDDle-incOMe cOUntRieS 920 209 1 114 313 1 212 473 1 289 537 61 58 53 47
east asia and the Pacific 479 261 607 086 642 471 646 692 71 69 63 57
american Samoa 5 7 8 8 45 41 36 29
cambodia 2 337 3 138 4 028 4 966 76 74 70 66
china 380 386 482 507 504 849 500 977 74 72 67 61
Democratic People’s Republic of Korea 3 136 3 618 3 328 3 065 44 38 30 23
Fiji 97 116 125 126 47 45 39 36
indonesia 32 796 42 925 48 438 49 513 58 55 48 41
Kiribati 8 10 10 11 36 30 26 23
lao People’s Democratic Republic 1 166 1 486 1 865 2 368 80 78 77 75
Malaysia 2 048 1 933 1 849 1 612 41 27 19 13
Marshall islands .. .. 6 6 .. .. 25 23
Micronesia (Federated States of) .. .. 13 12 .. .. 26 22
Mongolia 232 245 237 220 40 32 24 18
Myanmar 11 875 14 482 17 125 18 788 76 73 70 67
Palau .. .. 2 2 .. .. 22 20
Papua new Guinea 1 063 1 421 1 725 2 110 83 80 75 69
Philippines 9 012 10 844 12 405 13 404 52 46 40 34
Samoa 26 24 22 18 48 43 35 27
Solomon islands 66 90 118 151 78 75 72 68
thailand 16 883 21 272 20 089 19 302 71 64 56 49
timor-leste 203 246 231 352 84 83 81 80
tonga 12 12 12 11 50 41 33 27
tuvalu 1 1 1 1 33 33 25 25
Vanuatu 26 30 33 38 49 43 37 30
Viet nam 17 883 22 679 25 952 29 631 73 71 67 63
europe and central asia 45 311 42 919 32 580 27 449 26 23 18 14
albania 746 921 620 614 58 55 48 42
armenia 174 148 13 9
azerbaijan 972 1 085 27 23
Belarus 636 434 13 9
Bosnia and Herzegovina 100 44 5 2
Bulgaria 956 572 228 124 20 13 7 4
Georgia 472 354 20 15
Kazakhstan 1 321 1 192 17 14
Kyrgyzstan 543 510 26 21
S t a t i S t i c a l a n n e x 115
economically active population in agriculture
(Thousands)
agricultural share of total economically active population
(Percentage)
1980 1990 2000 2010 1980 1990 2000 2010
latvia 132 113 12 9
lithuania 204 126 12 8
Montenegro 39 13
Republic of Moldova 390 200 23 15
Romania 3 680 2 603 1 739 868 35 24 15 9
Russian Federation 7 648 6 251 11 8
Serbia 617 13
Serbia and Montenegro 1 007 20
tajikistan 610 773 34 27
the former Yugoslav Republic of Macedonia 107 68 13 7
turkey 8 205 10 355 9 131 8 067 56 51 41 32
turkmenistan 627 705 33 30
Ukraine 3 295 2 412 14 10
USSR 29 983 27 557 22 19
Uzbekistan 2 624 2 705 28 21
Yugoslav SFR 1 741 911 28 14
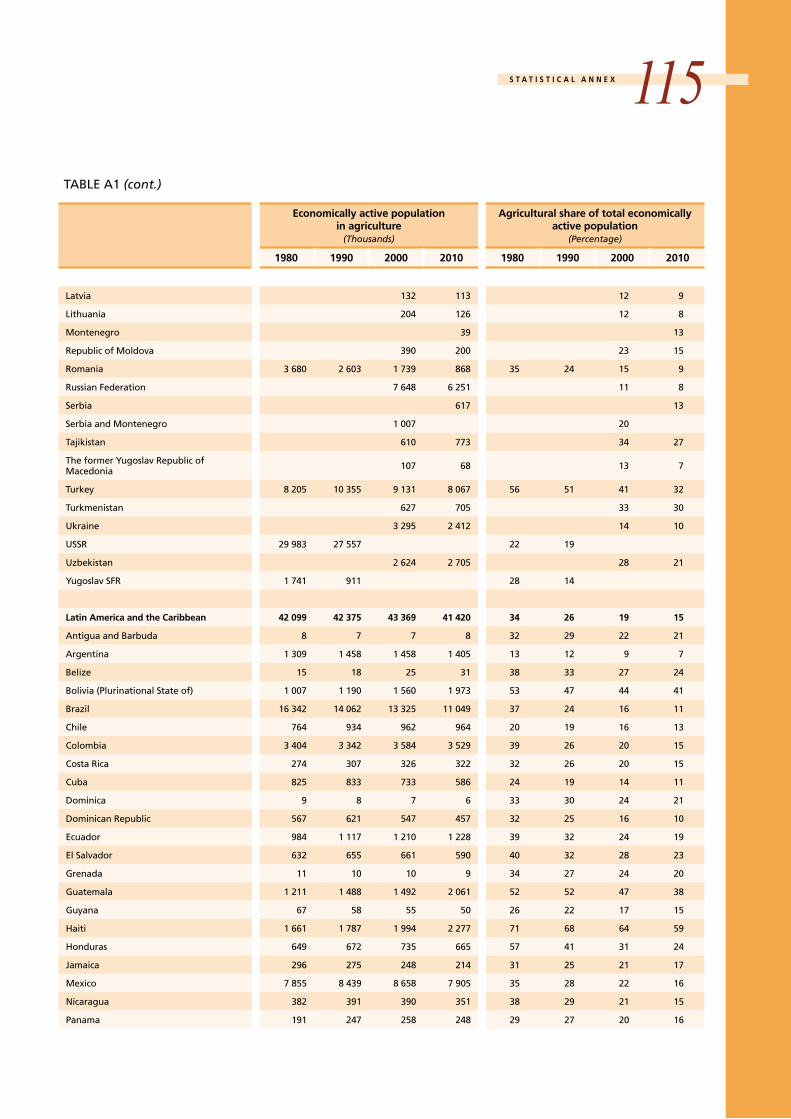
latin america and the caribbean 42 099 42 375 43 369 41 420 34 26 19 15
antigua and Barbuda 8 7 7 8 32 29 22 21
argentina 1 309 1 458 1 458 1 405 13 12 9 7
Belize 15 18 25 31 38 33 27 24
Bolivia (Plurinational State of) 1 007 1 190 1 560 1 973 53 47 44 41
Brazil 16 342 14 062 13 325 11 049 37 24 16 11
chile 764 934 962 964 20 19 16 13
colombia 3 404 3 342 3 584 3 529 39 26 20 15
costa Rica 274 307 326 322 32 26 20 15
cuba 825 833 733 586 24 19 14 11
Dominica 9 8 7 6 33 30 24 21
Dominican Republic 567 621 547 457 32 25 16 10
ecuador 984 1 117 1 210 1 228 39 32 24 19
el Salvador 632 655 661 590 40 32 28 23
Grenada 11 10 10 9 34 27 24 20
Guatemala 1 211 1 488 1 492 2 061 52 52 47 38
Guyana 67 58 55 50 26 22 17 15
Haiti 1 661 1 787 1 994 2 277 71 68 64 59
Honduras 649 672 735 665 57 41 31 24
Jamaica 296 275 248 214 31 25 21 17
Mexico 7 855 8 439 8 658 7 905 35 28 22 16
nicaragua 382 391 390 351 38 29 21 15
Panama 191 247 258 248 29 27 20 16
taBle a1 (cont.)
t H e S t a t e O F F O O D a n D a G R i c U l t U R e 2 0 1 2116economically active population
in agriculture(Thousands)
agricultural share of total economically active population
(Percentage)
1980 1990 2000 2010 1980 1990 2000 2010
Paraguay 493 576 715 831 39 34 29 25
Peru 2 185 2 773 3 344 3 692 39 33 29 24
Saint lucia 13 15 16 17 34 28 23 20
Saint Vincent and the Grenadines 11 12 11 11 34 29 23 20
Suriname 25 29 30 33 24 21 19 17
Uruguay 191 184 197 186 15 14 13 11
Venezuela (Bolivarian Republic of) 718 867 811 722 15 13 8 5
Middle east and north africa 19 267 20 897 23 112 24 858 43 33 27 22
algeria 1 633 1 907 2 718 3 175 36 27 25 21
Djibouti 112 182 233 285 84 82 78 74
egypt 6 411 6 495 6 339 6 620 54 40 31 25
iran (islamic Republic of) 4 260 5 040 5 761 6 553 39 32 27 22
iraq 808 626 535 436 27 15 9 5
Jordan 76 102 118 114 16 14 9 6
lebanon 121 69 48 28 14 7 4 2
libya 188 127 103 71 22 10 6 3
Morocco 3 101 3 264 3 372 3 009 53 42 33 26
Occupied Palestinian territory 111 128 125 110 24 18 12 8
Syrian arab Republic 674 954 1 116 1 337 34 30 24 20
tunisia 689 652 756 805 37 27 24 21
Yemen 1 083 1 351 1 888 2 315 68 56 48 39
South asia 228 463 269 218 307 395 348 834 68 63 58 53
afghanistan 3 258 2 804 4 485 6 046 70 68 64 60
Bangladesh 24 586 30 773 31 757 32 100 72 65 55 45
Bhutan 139 166 169 311 93 93 92 93
india 178 564 210 181 239 959 269 740 68 63 59 54
Maldives 24 20 21 23 52 34 23 15
nepal 5 442 6 653 8 677 12 066 93 93 93 93
Pakistan 13 340 15 044 18 712 24 520 59 48 44 39
Sri lanka 3 110 3 577 3 615 4 028 52 49 45 42
Sub-Saharan africa 105 808 131 818 163 546 200 284 72 68 63 58
angola 2 534 3 323 4 337 5 878 76 74 72 69
Benin 787 1 095 1 384 1 601 67 63 54 44
Botswana 206 206 281 317 61 45 44 42
Burkina Faso 2 894 3 742 4 982 6 909 92 92 92 92
Burundi 1 842 2 546 2 754 3 741 93 92 91 89
cameroon 2 543 3 086 3 482 3 569 75 71 60 48
cape Verde 35 34 35 32 37 30 23 17
taBle a1 (cont.)

S t a t i S t i c a l a n n e x 117economically active population
in agriculture(Thousands)
agricultural share of total economically active population
(Percentage)
1980 1990 2000 2010 1980 1990 2000 2010
central african Republic 862 1 038 1 189 1 254 85 80 73 63
chad 1 308 1 889 2 418 2 962 86 83 75 66
comoros 104 135 171 222 80 78 73 69
congo 397 447 501 524 57 48 40 32
côte d’ivoire 2 018 2 686 2 946 2 814 65 59 49 38
Democratic Republic of the congo 7 504 9 460 11 694 14 194 71 67 62 57
eritrea 1 090 1 547 77 74
ethiopia 24 049 31 657 82 77
ethiopia PDR 13 191 18 086 89 86
Gabon 200 207 207 183 66 51 38 26
Gambia 236 351 461 605 85 82 79 76
Ghana 2 732 3 585 4 785 6 075 62 59 57 55
Guinea 1 913 2 372 3 320 3 832 91 87 84 80
Guinea-Bissau 289 338 391 447 88 85 82 79
Kenya 5 523 7 846 10 757 13 220 82 80 75 71
lesotho 244 301 348 362 45 44 42 39
liberia 550 568 712 913 77 72 67 62
Madagascar 3 196 4 029 5 243 7 255 82 79 75 70
Malawi 2 524 3 377 3 907 4 909 87 87 83 79
Mali 1 745 1 953 2 376 3 049 88 85 81 75
Mauritania 427 435 570 745 71 55 53 50
Mauritius 100 75 63 48 27 17 12 8
Mozambique 5 051 5 209 7 092 8 674 85 84 83 81
namibia 177 219 253 267 57 50 41 34
niger 1 756 2 247 3 099 4 237 90 88 86 83
nigeria 12 790 12 689 12 443 12 267 54 43 33 25
Rwanda 2 156 2 824 3 242 4 360 93 92 91 89
Sao tome and Principe 21 24 28 32 70 69 64 56
Senegal 1 839 2 296 2 929 3 821 80 76 74 70
Seychelles 23 25 28 30 85 81 80 75
Sierra leone 894 1 083 1 041 1 326 73 71 65 60
Somalia 1 882 1 875 2 048 2 440 77 74 70 66
South africa 1 606 1 614 1 482 1 188 17 13 9 6
Sudan 4 656 5 151 6 223 7 124 72 69 61 52
Swaziland 118 139 148 138 53 43 35 29
togo 699 909 1 106 1 288 69 66 60 53
Uganda 4 946 6 665 8 420 11 016 87 85 80 75
United Republic of tanzania 7 806 10 554 13 557 16 879 86 84 81 76
Zambia 1 483 2 215 2 685 3 215 75 74 69 63
Zimbabwe 2 001 2 870 3 269 3 118 73 69 63 56
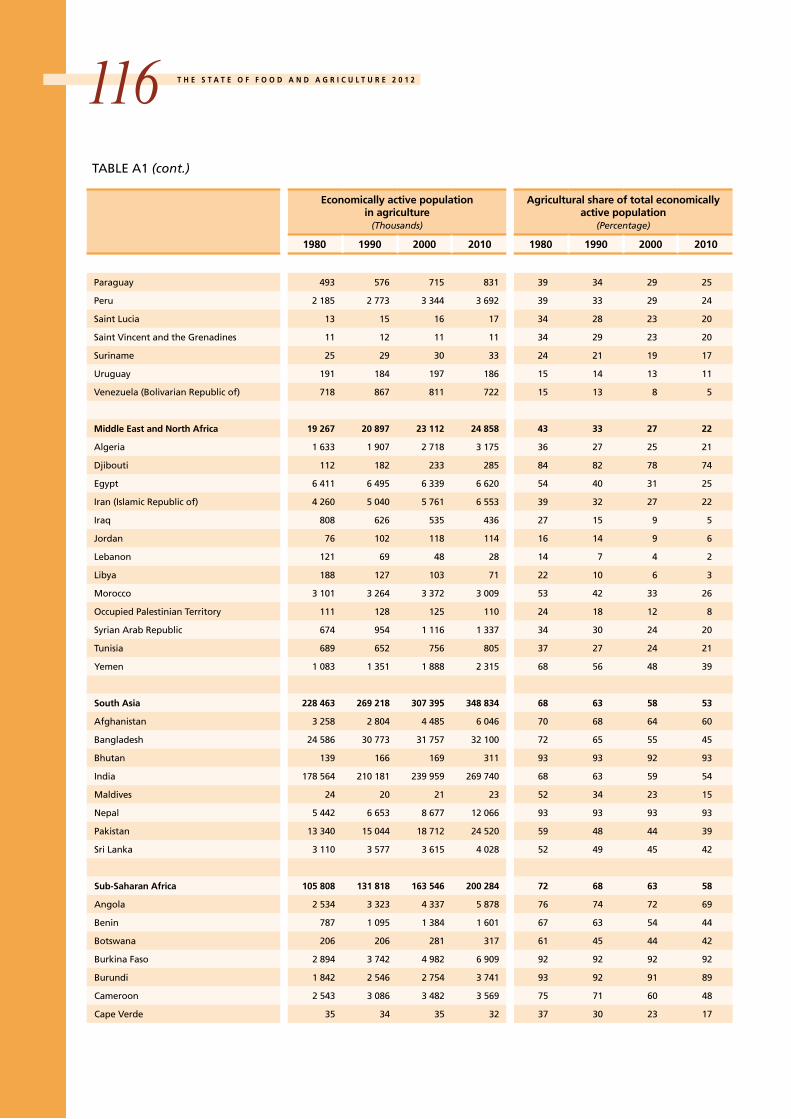
taBle a1 (cont.)
t H e S t a t e O F F O O D a n D a G R i c U l t U R e 2 0 1 2118economically active population
in agriculture(Thousands)
agricultural share of total economically active population
(Percentage)
1980 1990 2000 2010 1980 1990 2000 2010
HiGH-incOMe cOUntRieS 40 855 32 470 23 567 17 379 10 7 5 3
andorra 3 3 2 2 19 13 7 5
aruba 7 7 9 9 33 29 24 20
australia 439 470 442 457 6 6 5 4
austria 319 274 199 144 10 8 5 3
Bahamas 5 6 5 5 6 5 3 3
Bahrain 6 4 3 4 4 2 1 1
Barbados 11 9 7 4 10 7 5 2
Belgium 79 59 2 1
Belgium-luxembourg 122 110 3 3
Bermuda 1 1 1 1 4 3 3 3
Brunei Darussalam 4 2 1 1 6 2 1 1
canada 806 495 382 332 7 3 2 2
cayman islands 2 3 4 5 33 30 24 21
china, Hong Kong SaR .. .. .. .. .. .. .. ..
china, Macao SaR .. .. .. .. .. .. .. ..
croatia 170 84 8 4
cyprus 81 50 38 30 26 14 9 5
czech Republic 431 327 8 6
czechoslovakia 1 077 985 13 12
Denmark 184 162 108 75 7 6 4 3
equatorial Guinea 67 108 142 176 77 73 69 64
estonia 76 61 11 9
Faroe islands 1 1 1 1 5 4 4 4
Finland 298 218 143 98 12 8 6 4
France 1 980 1 363 878 573 8 5 3 2
Germany 2 448 1 557 1 016 661 7 4 3 2
Greece 1 247 963 826 637 32 23 17 12
Greenland 1 1 1 0 4 3 3 0
Guam 16 20 19 20 37 32 26 23
Hungary 930 701 452 322 18 15 11 7
iceland 12 15 13 12 10 11 8 6
ireland 233 186 166 149 19 14 9 7
israel 76 65 61 51 6 4 3 2
italy 2 791 2 068 1 250 845 13 9 5 3
Japan 6 152 4 613 2 712 1 418 11 7 4 2
Kuwait 9 9 11 14 2 1 1 1
liechtenstein 1 1 0 0 9 7 0 0
luxembourg 4 3 2 1
Malta 10 3 3 2 8 2 2 1
Monaco 1 1 1 0 9 7 6 0
taBle a1 (cont.)
S t a t i S t i c a l a n n e x 119economically active population
in agriculture(Thousands)
agricultural share of total economically active population
(Percentage)
1980 1990 2000 2010 1980 1990 2000 2010
netherlands 299 314 269 213 6 5 3 2
new caledonia 24 30 32 32 49 43 36 30
new Zealand 150 171 175 186 11 10 9 8
northern Mariana islands .. .. 8 7 .. .. 25 23
norway 165 139 110 88 8 6 5 3
Oman 160 256 293 318 47 44 36 29
Poland 5 236 4 956 3 763 2 960 30 27 22 17
Portugal 1 170 857 678 515 26 18 13 9
Puerto Rico 54 49 30 16 6 4 2 1
Qatar 3 7 4 8 3 3 1 1
Republic of Korea 5 378 3 470 2 206 1 274 37 18 10 5
San Marino 2 1 1 1 22 9 8 7
Saudi arabia 1 054 966 659 515 43 19 10 5
Singapore 17 6 3 2 2 0 0 0
Slovakia 240 197 9 7
Slovenia 19 7 2 1
Spain 2 626 1 890 1 339 1 015 18 12 7 4
Sweden 271 209 146 115 6 4 3 2
Switzerland 187 195 167 137 6 6 4 3
trinidad and tobago 46 50 50 47 11 11 9 7
turks and caicos islands 1 1 2 3 33 25 25 18
United arab emirates 25 73 87 148 5 8 5 3
United Kingdom 715 639 529 475 3 2 2 1
United States of america 3 919 3 704 3 090 2 509 3 3 2 2
United States Virgin islands 13 13 11 9 33 27 21 18
taBle a1 (cont.)
t H e S t a t e O F F O O D a n D a G R i c U l t U R e 2 0 1 2120taBle a2agricultural capital stock: total and per worker, 1980, 1990, 2000 and 2007
agricultural capital stock
total(Million constant 2005 US$)
Per worker(Constant 2005 US$)
1980 1990 2000 2007 1980 1990 2000 2007
WORlD 4 384 945 4 833 405 4 921 380 5 132 481 4 562 4 215 3 981 3 982
lOW- anD MiDDle-incOMe cOUntRieS 2 654 288 3 014 823 3 143 266 3 365 730 2 884 2 706 2 592 2 610
east asia and the Pacific 515 670 637 705 761 657 839 385 1 076 1 050 1 186 1 294
american Samoa 12 12 12 12 2 340 1 686 1 516 1 518
cambodia 1 969 4 239 4 942 5 439 842 1 351 1 227 1 149
china 347 912 420 169 499 079 540 792 915 871 989 1 071
Democratic People’s Republic of Korea 5 712 7 091 6 743 7 065 1 821 1 960 2 026 2 236
Fiji 713 870 994 983 7 350 7 497 7 956 7 925
indonesia 51 654 74 543 85 725 96 079 1 575 1 737 1 770 1 944
Kiribati 220 226 196 197 27 449 22 551 19 642 17 937
lao People’s Democratic Republic 1 975 2 627 3 164 3 746 1 694 1 768 1 696 1 705
Malaysia 13 563 18 595 20 661 21 095 6 623 9 620 11 174 12 453
Marshall islands .. .. 38 38 .. .. 6 332 6 337
Micronesia (Federated States of) .. .. 76 77 .. .. 5 845 5 885
Mongolia 7 214 7 593 10 582 10 949 31 095 30 991 44 650 48 878
Myanmar 13 961 15 044 18 453 23 065 1 176 1 039 1 078 1 263
Palau .. .. 5 5 .. .. 2 455 2 455
Papua new Guinea 1 720 1 895 2 294 2 385 1 618 1 334 1 330 1 206
Philippines 24 914 25 847 27 949 29 401 2 765 2 384 2 253 2 228
Samoa 381 313 302 333 14 668 13 043 13 746 17 544
Solomon islands 148 166 176 192 2 235 1 841 1 491 1 368
thailand 21 701 28 481 28 750 31 757 1 285 1 339 1 431 1 601
timor-leste 268 374 577 675 1 321 1 520 2 496 2 032
tonga 136 117 118 123 11 360 9 710 9 873 10 217
tuvalu .. .. .. .. .. .. .. ..
Vanuatu 422 496 566 631 16 226 16 517 17 155 17 066
Viet nam 21 075 29 010 50 254 64 348 1 178 1 279 1 936 2 251
europe and central asia 727 033 762 671 583 169 559 847 16 045 17 770 17 900 19 433
albania 5 072 5 743 5 019 5 034 6 799 6 236 8 095 8 016
armenia 2 657 2 879 15 267 18 575
azerbaijan 12 419 12 984 12 776 12 284
Belarus 16 774 14 322 26 374 29 349
Bosnia and Herzegovina 1 892 1 931 18 919 33 879
Bulgaria 14 058 13 298 8 050 5 600 14 705 23 248 35 307 37 087
Georgia 6 056 5 410 12 831 14 200
Kazakhstan 43 093 46 002 32 622 37 800
Kyrgyzstan 6 260 6 216 11 529 12 117

S t a t i S t i c a l a n n e x 121
agricultural capital stock
total(Million constant 2005 US$)
Per worker(Constant 2005 US$)
1980 1990 2000 2007 1980 1990 2000 2007
latvia 3 164 3 538 23 969 29 733
lithuania 7 624 7 899 37 372 55 237
Montenegro 390 8 666
Republic of Moldova 5 393 4 706 13 828 20 025
Romania 44 283 49 348 42 318 41 695 12 033 18 958 24 335 40 130
Russian Federation 185 689 161 586 24 279 24 280
Serbia 7 409 10 554
Serbia and Montenegro 8 251 8 193
tajikistan 5 700 6 295 9 345 8 553
the former Yugoslav Republic of Macedonia 1 297 1 448 12 124 18 328
turkey 94 818 108 748 117 001 123 247 11 556 10 502 12 814 14 695
turkmenistan 16 497 18 639 26 311 27 491
Ukraine 64 498 56 618 19 574 21 390
USSR 549 629 562 688 18 331 20 419
Uzbekistan 23 518 25 997 8 963 9 639
Yugoslav SFR 19 174 22 846 11 013 25 077
latin america and the caribbean 581 207 635 421 667 946 710 649 13 806 14 995 15 401 16 761
antigua and Barbuda 34 35 36 38 4 189 4 943 5 104 4 746
argentina 79 791 79 909 73 741 77 402 60 956 54 807 50 576 54 165
Belize 100 143 170 192 6 665 7 957 6 814 6 623
Bolivia (Plurinational State of) 6 459 6 126 7 606 9 122 6 414 5 148 4 876 4 931
Brazil 140 894 167 128 184 435 206 250 8 622 11 885 13 841 17 328
chile 18 515 19 024 22 308 22 031 24 234 20 368 23 189 22 689
colombia 88 886 93 958 97 034 101 981 26 112 28 114 27 074 28 582
costa Rica 2 020 2 176 2 050 2 093 7 372 7 087 6 288 6 422
cuba 27 877 27 827 24 985 23 913 33 791 33 406 34 086 38 017
Dominica 39 49 55 59 4 316 6 100 7 827 9 837
Dominican Republic 7 245 8 582 8 718 10 156 12 778 13 819 15 938 20 897
ecuador 14 270 18 777 19 565 18 526 14 502 16 810 16 170 14 988
el Salvador 2 365 2 417 2 413 2 608 3 742 3 689 3 651 4 269
Grenada 43 35 34 38 3 876 3 488 3 386 4 246
Guatemala 5 358 5 727 6 738 9 203 4 425 3 849 4 516 4 710
Guyana 974 1 002 1 025 1 022 14 534 17 277 18 636 19 649
Haiti 3 938 3 688 4 813 4 887 2 371 2 064 2 414 2 218
Honduras 3 601 4 158 3 663 4 267 5 548 6 188 4 983 6 331
Jamaica 1 726 2 036 2 141 2 239 5 831 7 404 8 633 10 041
Mexico 100 140 111 384 117 366 118 762 12 749 13 199 13 556 14 501
nicaragua 4 232 4 207 5 739 5 995 11 078 10 759 14 715 16 469
Panama 2 967 3 076 3 207 3 525 15 534 12 452 12 429 13 934
taBle a2 (cont.)

t H e S t a t e O F F O O D a n D a G R i c U l t U R e 2 0 1 2122agricultural capital stock
total(Million constant 2005 US$)
Per worker(Constant 2005 US$)
1980 1990 2000 2007 1980 1990 2000 2007
Paraguay 4 676 6 599 7 536 8 318 9 485 11 457 10 540 10 411
Peru 19 148 19 548 22 071 23 350 8 763 7 049 6 600 6 447
Saint lucia 54 65 66 56 4 140 4 327 4 126 3 292
Saint Vincent and the Grenadines 33 35 29 28 2 972 2 898 2 614 2 536
Suriname 567 712 750 662 22 668 24 549 24 986 20 678
Uruguay 24 426 21 436 22 124 24 972 127 885 116 499 112 306 132 829
Venezuela (Bolivarian Republic of) 20 830 25 564 27 528 28 955 29 011 29 486 33 944 38 351
Middle east and north africa 150 374 199 402 227 256 248 549 7 805 9 542 9 833 10 082
algeria 9 155 11 783 12 998 14 081 5 606 6 179 4 782 4 548
Djibouti 242 316 382 384 2 159 1 736 1 641 1 437
egypt 22 484 25 714 32 377 35 992 3 507 3 959 5 108 5 429
iran (islamic Republic of) 46 137 67 144 74 309 82 643 10 830 13 322 12 899 12 841
iraq 18 143 30 848 30 642 31 128 22 455 49 277 57 276 67 816
Jordan 793 1 155 1 388 1 492 10 434 11 324 11 759 13 086
lebanon 2 488 2 601 2 749 2 774 20 560 37 695 57 264 84 063
libya 4 612 7 005 6 945 7 309 24 534 55 158 67 426 90 229
Morocco 22 985 23 655 25 436 25 487 7 412 7 247 7 543 8 185
Occupied Palestinian territory 364 421 640 676 3 279 3 293 5 122 5 925
Syrian arab Republic 10 920 14 167 21 163 25 030 16 201 14 850 18 964 19 151
tunisia 6 813 7 933 9 430 9 963 9 888 12 167 12 473 12 611
Yemen 5 239 6 661 8 797 11 594 4 838 4 930 4 659 5 241
South asia 399 171 460 007 531 857 583 962 1 747 1 709 1 730 1 733
afghanistan 26 818 27 213 30 437 30 398 8 232 9 705 6 786 5 397
Bangladesh 43 032 50 871 56 734 65 559 1 750 1 653 1 787 2 022
Bhutan 260 343 324 342 1 873 2 068 1 919 1 224
india 244 749 282 488 329 089 355 253 1 371 1 344 1 371 1 363
Maldives 12 15 18 15 485 726 839 636
nepal 5 744 6 856 7 911 8 676 1 055 1 030 912 786
Pakistan 71 376 84 767 100 738 117 171 5 350 5 635 5 384 5 122
Sri lanka 7 180 7 455 6 606 6 548 2 309 2 084 1 827 1 654
Sub-Saharan africa 280 833 319 616 371 382 423 337 2 654 2 425 2 271 2 248
angola 5 707 5 826 6 267 6 547 2 252 1 753 1 445 1 212
Benin 1 619 1 805 2 534 2 908 2 057 1 649 1 831 1 881
Botswana 1 841 2 100 2 045 1 845 8 937 10 192 7 279 6 151
Burkina Faso 3 357 5 222 7 596 10 079 1 160 1 396 1 525 1 610
Burundi 1 346 1 336 1 205 1 647 731 525 437 477
cameroon 5 324 6 510 7 158 7 286 2 094 2 110 2 056 2 055
cape Verde 76 123 153 206 2 169 3 605 4 364 6 246
taBle a2 (cont.)

S t a t i S t i c a l a n n e x 123agricultural capital stock
total(Million constant 2005 US$)
Per worker(Constant 2005 US$)
1980 1990 2000 2007 1980 1990 2000 2007
central african Republic 1 269 1 693 2 171 2 460 1 472 1 631 1 826 2 012
chad 4 267 4 329 5 667 7 033 3 262 2 292 2 344 2 468
comoros 95 107 129 135 913 793 757 660
congo 440 500 560 623 1 109 1 119 1 118 1 209
côte d’ivoire 4 435 6 392 7 108 7 563 2 198 2 380 2 413 2 669
Democratic Republic of the congo 4 665 5 601 4 956 4 875 622 592 424 362
eritrea 3 492 3 367 3 204 2 348
ethiopia 32 771 48 465 1 363 1 649
ethiopia PDR 29 785 33 338 2 258 1 843
Gabon 375 410 452 429 1 875 1 982 2 182 2 235
Gambia 217 244 277 370 917 695 602 664
Ghana 3 876 4 431 5 748 7 025 1 419 1 236 1 201 1 249
Guinea 2 184 2 251 3 834 5 331 1 142 949 1 155 1 466
Guinea-Bissau 860 1 147 1 681 1 783 2 975 3 393 4 299 4 176
Kenya 12 632 17 295 15 958 18 301 2 287 2 204 1 484 1 463
lesotho 986 1 036 1 132 1 070 4 042 3 441 3 253 2 998
liberia 544 489 578 617 988 861 812 753
Madagascar 14 589 17 227 17 710 17 416 4 565 4 276 3 378 2 652
Malawi 1 596 1 870 2 462 3 066 633 554 630 680
Mali 7 067 6 658 9 891 12 499 4 050 3 409 4 163 4 395
Mauritania 2 558 2 914 3 969 4 306 5 990 6 699 6 963 6 240
Mauritius 225 247 260 267 2 248 3 294 4 134 5 046
Mozambique 2 838 3 580 4 405 4 843 562 687 621 592
namibia 2 711 2 361 2 551 2 623 15 314 10 779 10 083 10 088
niger 8 441 7 456 10 493 12 961 4 807 3 318 3 386 3 371
nigeria 33 068 40 407 49 768 59 792 2 585 3 184 4 000 4 870
Rwanda 1 246 1 316 1 392 1 973 578 466 429 495
Sao tome and Principe 191 201 216 218 9 099 8 368 7 711 7 042
Senegal 6 934 8 393 9 756 10 498 3 771 3 655 3 331 2 988
Seychelles 12 15 15 11 541 588 553 355
Sierra leone 925 1 294 1 430 2 186 1 035 1 195 1 374 1 716
Somalia 11 621 13 440 13 088 13 145 6 175 7 168 6 391 5 663
South africa 42 868 42 810 43 350 42 668 26 692 26 524 29 251 33 178
Sudan 24 999 27 681 43 260 47 540 5 369 5 374 6 952 7 002
Swaziland 801 876 852 809 6 788 6 299 5 754 5 824
togo 907 1 452 1 549 1 747 1 298 1 597 1 400 1 417
Uganda 4 754 5 992 7 197 8 541 961 899 855 842
United Republic of tanzania 15 058 16 679 19 829 21 504 1 929 1 580 1 463 1 372
Zambia 3 704 4 864 5 334 5 904 2 498 2 196 1 987 1 970
Zimbabwe 7 823 9 699 9 132 8 858 3 910 3 379 2 794 2 842
taBle a2 (cont.)

t H e S t a t e O F F O O D a n D a G R i c U l t U R e 2 0 1 2124agricultural capital stock
total(Million constant 2005 US$)
Per worker(Constant 2005 US$)
1980 1990 2000 2007 1980 1990 2000 2007
HiGH-incOMe cOUntRieS 1 730 513 1 818 454 1 776 270 1 764 612 42 328 55 944 75 328 92 456
andorra 0 0 0 0 147 147 220 220
aruba .. .. .. .. .. .. .. ..
australia 112 505 111 469 115 219 111 963 256 276 237 168 260 676 249 361
austria 15 310 15 579 14 200 13 844 47 994 56 857 71 356 86 525
Bahamas 22 23 28 29 4 388 3 905 5 534 5 790
Bahrain 24 40 58 57 4 002 10 018 19 177 19 130
Barbados 102 127 108 84 9 307 14 079 15 366 16 892
Belgium 7 275 6 529 92 086 102 011
Belgium-luxembourg 7 659 7 857 62 783 71 430
Bermuda .. .. .. .. .. .. .. ..
Brunei Darussalam 45 37 58 81 11 190 18 425 58 130 81 360
canada 88 391 91 794 91 090 94 170 109 666 185 442 238 455 271 384
cayman islands .. .. .. .. .. .. .. ..
china, Hong Kong SaR .. .. .. .. .. .. .. ..
china, Macao SaR .. .. .. .. .. .. .. ..
croatia .. .. .. ..
cyprus 814 954 1 092 1 141 10 052 19 087 28 733 34 582
czech Republic 11 782 10 936 27 337 30 892
czechoslovakia 20 886 23 151 19 393 23 503
Denmark 16 591 14 061 12 292 11 906 90 170 86 796 113 816 141 738
equatorial Guinea 408 410 413 355 6 084 3 799 2 908 2 152
estonia 2 511 2 002 33 044 30 798
Faroe islands .. .. .. .. .. .. .. ..
Finland 14 156 14 203 11 877 11 374 47 504 65 150 83 055 103 398
France 102 650 97 840 93 064 90 402 51 843 71 783 105 995 136 972
Germany 120 949 114 290 83 432 74 076 49 407 73 404 82 119 98 505
Greece 16 619 18 743 19 832 21 190 13 327 19 463 24 010 30 445
Greenland 5 6 5 5 5 140 5 690 5 450 5 310
Guam 28 28 28 29 1 776 1 423 1 498 1 434
Hungary 12 137 11 434 11 491 10 619 13 050 16 311 25 423 29 497
iceland 1 006 954 809 936 83 863 63 614 62 239 77 962
ireland 16 847 17 167 19 092 18 832 72 304 92 294 115 014 119 947
israel 2 298 2 355 2 357 2 378 30 234 36 236 38 647 44 033
italy 64 288 74 748 80 147 75 343 23 034 36 145 64 117 78 976
Japan 236 526 307 545 274 751 265 379 38 447 66 669 101 309 153 133
Kuwait 131 129 236 307 14 516 14 384 21 416 23 620
liechtenstein 14 14 14 14 13 710 14 030 15 178 15 371
luxembourg 505 440 126 143 146 760
Malta 62 95 90 96 6 153 31 537 30 113 48 245
Monaco .. .. .. .. .. .. .. ..
taBle a2 (cont.)
S t a t i S t i c a l a n n e x 125agricultural capital stock
total(Million constant 2005 US$)
Per worker(Constant 2005 US$)
1980 1990 2000 2007 1980 1990 2000 2007
netherlands 13 026 13 442 12 382 11 816 43 565 42 808 46 031 51 376
new caledonia 557 614 578 611 23 205 20 478 18 065 19 083
new Zealand 59 934 56 500 54 124 56 245 399 559 330 412 309 281 304 029
northern Mariana islands .. .. .. .. .. .. .. ..
norway 8 227 9 076 8 467 8 270 49 858 65 297 76 975 88 924
Oman 673 946 1 264 1 311 4 208 3 694 4 313 4 444
Poland 50 722 65 865 65 784 71 100 9 687 13 290 17 482 22 323
Portugal 14 635 15 868 15 213 13 181 12 509 18 516 22 438 23 205
Puerto Rico 1 001 1 126 842 759 18 536 22 983 28 067 37 970
Qatar 56 108 210 189 18 560 15 397 52 535 27 049
Republic of Korea 6 085 9 355 14 238 16 248 1 132 2 696 6 454 10 739
San Marino .. .. .. .. .. .. .. ..
Saudi arabia 9 053 21 277 23 127 23 239 8 589 22 026 35 093 39 590
Singapore .. .. .. .. .. .. .. ..
Slovakia 6 849 5 932 28 537 28 246
Slovenia 2 697 2 564 141 955 284 839
Spain 60 275 69 467 75 074 78 504 22 953 36 755 56 067 69 534
Sweden 15 582 14 089 13 835 13 394 57 496 67 412 94 760 108 896
Switzerland 8 770 8 877 8 113 7 983 46 898 45 524 48 580 54 678
trinidad and tobago 427 359 295 311 9 292 7 175 5 892 6 474
turks and caicos islands .. .. .. .. .. .. .. ..
United arab emirates 769 1 031 3 309 3 670 30 766 14 128 38 040 30 085
United Kingdom 47 575 47 446 46 751 45 699 66 538 74 250 88 375 93 263
United States of america 582 673 557 953 569 262 579 069 148 679 150 635 184 227 216 799
United States Virgin islands 21 18 17 16 1 650 1 352 1 525 1 649
taBle a2 (cont.)
t H e S t a t e O F F O O D a n D a G R i c U l t U R e 2 0 1 2126taBle a3average annual foreign direct investment inflows to agriculture, food, beverages and tobacco, and all sectors, 2005–06 and 2007–08
average annual foreign direct investment inflows (Million current US$)
to agriculture to food, beverages and tobacco
to all sectors
2005–06 2007–08 2005–06 2007–08 2005–06 2007–08
WORlD
lOW- anD MiDDle-incOMe cOUntRieS
east asia and the Pacific
american Samoa .. .. .. .. .. ..
cambodia 72 95 18 20 432 841
china 659 886 .. 2 611 70 937 83 582
Democratic People’s Republic of Korea .. .. .. .. .. ..
Fiji .. .. .. .. .. ..
indonesia 121 239 .. .. 6 626 8 123
Kiribati .. .. .. .. .. ..
lao People’s Democratic Republic 7 .. .. .. 28 ..
Malaysia –1 1 038 .. .. 5 012 7 818
Marshall islands .. .. .. .. .. ..
Micronesia (Federated States of) .. .. .. .. .. ..
Mongolia .. .. .. .. .. ..
Myanmar .. .. .. .. 71 ..
Palau .. .. .. .. .. ..
Papua new Guinea .. .. .. .. .. ..
Philippines 0 2 .. .. 2 388 2 160
Samoa .. .. .. .. .. ..
Solomon islands .. .. .. .. .. ..
thailand 5 10 46 194 8 536 8 923
timor-leste .. .. .. .. .. ..
tonga .. .. .. .. .. ..
tuvalu .. .. .. .. .. ..
Vanuatu .. .. .. .. .. ..
Viet nam 56 .. .. .. 2 021 ..
europe and central asia
albania 1 .. .. .. 294 ..
armenia .. 23 19 23 370 900
azerbaijan .. .. .. .. 3 911 4 144
Belarus .. .. .. .. .. ..
Bosnia and Herzegovina .. .. 59 69 690 1 570
Bulgaria 23 89 .. .. .. ..
Georgia .. .. .. .. .. ..
Kazakhstan 1 .. 24 .. 1 971 ..
S t a t i S t i c a l a n n e x 127
average annual foreign direct investment inflows (Million current US$)
to agriculture to food, beverages and tobacco
to all sectors
2005–06 2007–08 2005–06 2007–08 2005–06 2007–08
Kyrgyzstan –2 0 .. .. 75 220
latvia 1 51 .. .. 1 185 1 792
lithuania 11 13 –47 42 1 422 2 030
Montenegro .. .. ..
Republic of Moldova 1 4 .. .. 162 249
Romania 56 159 307 196 8 923 11 916
Russian Federation 157 378 590 1 104 13 375 27 349
Serbia 40 147 3 466
Serbia and Montenegro 12 116 4 021
tajikistan .. .. .. .. .. ..
the former Yugoslav Republic of Macedonia 1 10 10 30 264 639
turkey 7 25 338 1 009 13 087 16 935
turkmenistan .. .. .. .. .. ..
Ukraine .. .. .. .. .. ..
USSR
Uzbekistan .. .. .. .. .. ..
Yugoslav SFR
latin america and the caribbean
antigua and Barbuda .. .. .. .. .. ..
argentina 366 505 226 647 7 175 8 605
Belize 6 8 .. .. 118 167
Bolivia (Plurinational State of) 0 3 .. .. 535 1 020
Brazil 233 708 1 474 2 035 21 876 38 795
chile 14 107 128 23 2 490 3 301
colombia 7 41 .. .. 8 454 9 816
costa Rica 52 208 .. .. 1 165 1 959
cuba .. .. .. .. .. ..
Dominica .. .. .. .. .. ..
Dominican Republic .. .. .. .. 1 326 2 232
ecuador 36 23 .. .. 382 595
el Salvador 0 2 .. .. 376 1 147
Grenada .. .. .. .. .. ..
Guatemala .. .. 53 88 550 724
Guyana .. .. .. .. .. ..
Haiti .. .. .. .. .. ..
Honduras 48 7 .. .. 537 903
Jamaica 0 .. .. .. 782 1 152
Mexico 16 82 2 175 1 344 20 789 24 806
taBle a3 (cont.)
t H e S t a t e O F F O O D a n D a G R i c U l t U R e 2 0 1 2128average annual foreign direct investment inflows
(Million current US$)
to agriculture to food, beverages and tobacco
to all sectors
2005–06 2007–08 2005–06 2007–08 2005–06 2007–08
nicaragua 8 .. .. .. 264 504
Panama .. .. .. .. 1 737 1 777
Paraguay –18 1 13 –4 75 157
Peru 62 30 .. .. 723 1 234
Saint lucia .. .. .. .. .. ..
Saint Vincent and the Grenadines .. .. .. .. .. ..
Suriname .. .. .. .. .. ..
Uruguay 283 335 11 100 1 170 1 330
Venezuela (Bolivarian Republic of) .. .. .. .. 1 000 646
Middle east and north africa
algeria .. .. .. .. .. ..
Djibouti .. .. .. .. .. ..
egypt 30 100 .. .. 13 084 15 319
iran (islamic Republic of) .. .. .. .. .. ..
iraq .. .. .. .. .. ..
Jordan .. .. .. .. .. ..
lebanon .. .. .. .. .. ..
libya .. .. .. .. .. ..
Morocco 2 5 .. .. 2 988 4 121
Occupied Palestinian territory .. .. .. .. .. ..
Syrian arab Republic 6 15 .. .. 621 1 355
tunisia 8 11 12 22 2 045 2 187
Yemen .. .. .. .. .. ..
South asia
afghanistan .. .. .. .. .. ..
Bangladesh 2 11 5 16 819 876
Bhutan .. .. .. .. .. ..
india .. .. .. .. 6 333 21 062
Maldives .. .. .. .. .. ..
nepal .. .. .. .. .. ..
Pakistan .. .. 56 298 3 236 5 514
Sri lanka .. .. .. .. .. ..
Sub-Saharan africa
angola .. .. .. .. .. ..
Benin .. .. .. .. .. ..
Botswana .. .. .. .. .. ..
Burkina Faso .. .. .. .. .. ..
taBle a3 (cont.)

S t a t i S t i c a l a n n e x 129average annual foreign direct investment inflows
(Million current US$)
to agriculture to food, beverages and tobacco
to all sectors
2005–06 2007–08 2005–06 2007–08 2005–06 2007–08
Burundi .. .. .. .. .. ..
cameroon .. .. .. .. .. ..
cape Verde .. .. .. .. .. ..
central african Republic .. .. .. .. .. ..
chad .. .. .. .. .. ..
comoros .. .. .. .. .. ..
congo .. .. .. .. .. ..
côte d’ivoire .. .. .. .. .. ..
Democratic Republic of the congo .. .. .. .. .. ..
eritrea .. .. .. .. .. ..
ethiopia .. .. .. .. .. ..
ethiopia PDR
Gabon .. .. .. .. .. ..
Gambia .. .. .. .. .. ..
Ghana .. .. .. .. .. ..
Guinea .. .. .. .. .. ..
Guinea-Bissau .. .. .. .. .. ..
Kenya .. .. .. .. .. ..
lesotho .. .. .. .. .. ..
liberia .. .. .. .. .. ..
Madagascar 8 –6 .. .. 190 979
Malawi .. .. .. .. .. ..
Mali .. .. .. .. .. ..
Mauritania .. .. .. .. 509 ..
Mauritius 1 8 .. .. 162 385
Mozambique 9 71 .. .. 131 510
namibia .. .. .. .. .. ..
niger .. .. .. .. .. ..
nigeria .. .. .. .. 3 403 ..
Rwanda .. .. .. .. .. ..
Sao tome and Principe .. .. .. .. .. ..
Senegal .. .. .. .. .. ..
Seychelles .. .. .. .. .. ..
Sierra leone .. .. .. .. .. ..
Somalia .. .. .. .. .. ..
South africa .. .. .. .. .. ..
Sudan .. .. .. .. .. ..
Swaziland .. .. .. .. .. ..
togo .. .. .. .. .. ..
Uganda .. .. .. .. .. ..
taBle a3 (cont.)
t H e S t a t e O F F O O D a n D a G R i c U l t U R e 2 0 1 2130average annual foreign direct investment inflows
(Million current US$)
to agriculture to food, beverages and tobacco
to all sectors
2005–06 2007–08 2005–06 2007–08 2005–06 2007–08
United Republic of tanzania 11 .. .. .. 448 ..
Zambia .. .. .. .. .. ..
Zimbabwe .. .. .. .. .. ..
HiGH-incOMe cOUntRieS
andorra .. .. .. .. .. ..
aruba .. .. .. .. .. ..
australia –107 –9 .. .. –3 109 34 207
austria –20 4 290 –511 9 634 19 006
Bahamas .. .. .. .. .. ..
Bahrain .. .. .. .. .. ..
Barbados .. .. .. .. .. ..
Belgium –973 –92 .. .. 34 373 110 099
Belgium-luxembourg
Brunei Darussalam 0 .. .. .. 289 248
canada .. .. .. .. 42 993 84 961
cayman islands .. .. .. .. .. ..
china, Hong Kong SaR .. .. .. .. 39 341 56 981
china, Macao SaR .. .. .. .. 1 424 2 448
croatia 11 4 120 101 2 654 5 581
cyprus 0 .. 2 0 1 525 3 142
czech Republic 32 0 138 392 8 558 8 447
czechoslovakia
Denmark 0 .. –8 2 763 7 775 7 261
equatorial Guinea .. .. .. .. .. ..
estonia 18 20 .. .. 2 333 2 331
Faroe islands .. .. .. .. .. ..
Finland .. .. .. .. 6 201 5 205
France 44 33 5 281 3 392 78 397 79 230
French Polynesia .. .. .. .. .. ..
Germany 11 8 732 –639 51 533 51 514
Greece 34 4 28 –109 2 989 3 305
Greenland .. .. .. .. .. ..
Guam .. .. .. .. .. ..
Hungary 8 32 80 –106 7 263 5 668
iceland 0 –2 127 24 3 550 3 557
ireland .. .. –66 –1 797 –18 616 2 339
israel .. .. 23 71 9 303 9 665
italy –74 149 2 114 –244 24 336 30 863
Japan –15 4 –474 94 –1 865 23 487
taBle a3 (cont.)

S t a t i S t i c a l a n n e x 131average annual foreign direct investment inflows
(Million current US$)
to agriculture to food, beverages and tobacco
to all sectors
2005–06 2007–08 2005–06 2007–08 2005–06 2007–08
Kuwait .. .. .. .. .. ..
liechtenstein .. .. .. .. .. ..
luxembourg .. .. .. .. .. ..
Malta .. .. .. .. 1 239 885
Monaco .. .. .. .. .. ..
netherlands .. .. –338 10 392 27 622 55 742
new caledonia .. .. .. .. .. ..
new Zealand .. .. .. .. .. ..
northern Mariana islands .. .. .. .. .. ..
norway .. .. .. .. 4 426 4 893
Oman .. .. .. .. 1 746 3 200
Poland 52 117 499 416 14 906 22 695
Portugal .. .. .. .. 7 419 3 864
Puerto Rico .. .. .. .. .. ..
Qatar .. .. .. .. .. ..
Republic of Korea 2 .. –150 .. 6 000 ..
San Marino .. .. .. .. .. ..
Saudi arabia 8 24 –542 179 15 195 31 270
Singapore .. .. 34 50 2 183 –479
Slovakia 2 1 .. .. 2 703 3 267
Slovenia .. .. .. .. .. ..
Spain –4 .. .. .. 22 518 0
Sweden .. .. 24 4 435 20 418 32 114
Switzerland .. .. .. .. 21 383 23 792
trinidad and tobago .. .. 6 10 911 830
turks and caicos islands .. .. .. .. .. ..
United arab emirates .. .. .. .. .. ..
United Kingdom 88 79 1 959 10 468 166 096 136 618
United States of america 22 240 8 619 29 025 170 955 293 644
United States Virgin islands .. .. .. .. .. ..
taBle a3 (cont.)
t H e S t a t e O F F O O D a n D a G R i c U l t U R e 2 0 1 2132taBle a4Government expenditures: total spent on agriculture and agricultural share of total expenditures, 1980, 1990, 2000 and 2007
Government expenditures
total spent on agriculture(Million constant 2005 PPP dollars)
agricultural share of total expenditures(Percentage)
1980 1990 2000 2007 1980 1990 2000 2007
lOW- anD MiDDle-incOMe cOUntRieS
east asia and the Pacific
american Samoa .. .. .. .. .. .. .. ..
cambodia .. .. .. .. .. .. .. ..
china 16 618 20 567 41 743 88 683 12.2 10.0 7.8 6.8
Democratic People’s Republic of Korea .. .. .. .. .. .. .. ..
Fiji 27 34 36 31 7.2 6.7 3.7 3.1
indonesia 4 061 4 851 2 671 3 856 10.0 7.6 2.3 3.0
Kiribati .. .. .. .. .. .. .. ..
lao People’s Democratic Republic .. .. .. .. .. .. .. ..
Malaysia .. .. .. .. .. .. .. ..
Marshall islands .. .. .. .. .. .. .. ..
Micronesia (Federated States of) .. .. .. .. .. .. .. ..
Mongolia .. .. .. .. .. .. .. ..
Myanmar 403 183 391 420 23.6 9.3 17.4 8.3
Palau .. .. .. .. .. .. .. ..
Papua new Guinea 141 152 78 50 8.5 7.2 2.6 1.5
Philippines 1 020 1 986 2 217 2 550 6.1 6.6 5.7 5.2
Samoa .. .. .. .. .. .. .. ..
Solomon islands .. .. .. .. .. .. .. ..
thailand 1 917 3 301 5 510 6 311 9.7 10.4 8.8 6.6
timor-leste .. .. .. .. .. .. .. ..
tonga .. .. .. .. .. .. .. ..
tuvalu .. .. .. .. .. .. .. ..
Vanuatu 4 9 6 6 3.0 4.6 3.6 5.0
Viet nam .. .. .. .. .. .. .. ..
europe and central asia
albania .. .. .. .. .. .. .. ..
armenia .. .. .. ..
azerbaijan .. .. .. ..
Belarus 1 397 2 840 13.1 10.5
Bosnia and Herzegovina .. .. .. ..
Bulgaria .. .. .. .. .. .. .. ..
Georgia .. .. .. ..
Kazakhstan 236 1 040 2.1 4.1
Kyrgyzstan 54 58 4.0 2.4
latvia 269 1 071 4.5 9.9
lithuania 133 701 2.8 3.9
S t a t i S t i c a l a n n e x 133
Government expenditures
total spent on agriculture(Million constant 2005 PPP dollars)
agricultural share of total expenditures(Percentage)
1980 1990 2000 2007 1980 1990 2000 2007
Montenegro .. ..
Republic of Moldova 55 198 4.3 8.1
Romania .. .. 1 763 3 248 .. .. 3.4 4.9
Russian Federation 3 763 1 881 2.1 0.5
Serbia .. ..
Serbia and Montenegro .. ..
tajikistan .. .. .. ..
the former Yugoslav Republic of Macedonia .. .. .. ..
turkey .. .. 4 557 4 595 .. .. 2.8 2.2
turkmenistan .. .. .. ..
Ukraine .. .. .. ..
USSR .. .. .. ..
Uzbekistan .. .. .. ..
Yugoslav SFR .. .. .. ..
latin america and the caribbean
antigua and Barbuda .. .. .. .. .. .. .. ..
argentina .. .. .. .. .. .. .. ..
Belize .. .. .. .. .. .. .. ..
Bolivia (Plurinational State of) 80 74 150 109 3.4 3.5 2.8 1.4
Brazil 10 0 3 497 2 386 6.6 1.5 4.9 2.1
chile .. .. .. .. .. .. .. ..
colombia .. .. .. .. .. .. .. ..
costa Rica 121 193 132 228 3.4 4.1 3.4 3.5
cuba .. .. .. .. .. .. .. ..
Dominica .. .. .. .. .. .. .. ..
Dominican Republic 382 343 475 220 14.3 14.5 7.6 3.4
ecuador .. .. .. .. .. .. .. ..
el Salvador 478 952 1 637 87 5.8 5.4 5.6 1.5
Grenada .. .. .. .. .. .. .. ..
Guatemala 251 145 145 204 6.6 4.2 2.3 2.4
Guyana .. .. .. .. .. .. .. ..
Haiti .. .. .. .. .. .. .. ..
Honduras .. .. .. .. .. .. .. ..
Jamaica .. .. .. .. .. .. .. ..
Mexico 7 951 4 579 4 712 6 794 7.2 3.5 3.3 1.8
nicaragua .. .. .. .. .. .. .. ..
Panama 180 76 80 206 5.3 2.5 1.5 2.8
Paraguay .. .. .. .. .. .. .. ..
Peru .. .. .. .. .. .. .. ..
taBle a4 (cont.)
t H e S t a t e O F F O O D a n D a G R i c U l t U R e 2 0 1 2134Government expenditures
total spent on agriculture(Million constant 2005 PPP dollars)
agricultural share of total expenditures(Percentage)
1980 1990 2000 2007 1980 1990 2000 2007
Saint lucia .. .. .. .. .. .. .. ..
Saint Vincent and the Grenadines 3 12 8 6 3.8 6.3 3.2 2.3
Suriname .. .. .. .. .. .. .. ..
Uruguay 57 64 106 113 2.1 1.3 1.2 1.2
Venezuela (Bolivarian Republic of) .. .. .. .. .. .. .. ..
Middle east and north africa
algeria .. .. .. .. .. .. .. ..
Djibouti .. .. .. .. .. .. .. ..
egypt 2 522 2 387 4 843 3 122 4.6 5.4 6.8 3.0
iran (islamic Republic of) 2 713 2 324 1 947 5 985 3.4 3.4 1.9 3.1
iraq .. .. .. .. .. .. .. ..
Jordan 37 90 175 154 1.0 2.4 3.2 1.5
lebanon .. .. .. .. .. .. .. ..
libya .. .. .. .. .. .. .. ..
Morocco 880 863 833 725 6.5 5.3 3.2 2.0
Occupied Palestinian territory .. .. .. .. .. .. .. ..
Syrian arab Republic 751 945 1 742 1 338 5.0 11.0 9.5 5.6
tunisia 1 061 910 1 280 1 076 14.5 9.6 9.3 6.0
Yemen 9 111 206 201 1.4 2.2 1.7 1.0
South asia
afghanistan .. .. .. .. .. .. .. ..
Bangladesh 392 498 528 1 229 10.3 4.7 3.6 5.6
Bhutan 32 48 53 59 31.9 14.5 8.0 5.0
india 5 415 14 058 15 695 23 457 7.2 8.3 5.6 5.0
Maldives 5 3 6 20 8.8 1.9 1.7 2.2
nepal 219 183 188 191 16.4 8.5 5.8 4.3
Pakistan 308 278 356 2 950 2.1 0.8 0.7 4.1
Sri lanka 500 546 611 842 5.8 5.8 4.3 4.4
Sub-Saharan africa
angola .. .. .. .. .. .. .. ..
Benin .. .. .. .. .. .. .. ..
Botswana 100 196 281 221 9.7 6.5 4.2 2.7
Burkina Faso .. .. .. .. .. .. .. ..
Burundi .. .. .. .. .. .. .. ..
cameroon .. .. .. .. .. .. .. ..
cape Verde .. .. .. .. .. .. .. ..
central african Republic .. .. .. .. .. .. .. ..
chad .. .. .. .. .. .. .. ..
taBle a4 (cont.)
S t a t i S t i c a l a n n e x 135Government expenditures
total spent on agriculture(Million constant 2005 PPP dollars)
agricultural share of total expenditures(Percentage)
1980 1990 2000 2007 1980 1990 2000 2007
comoros .. .. .. .. .. .. .. ..
congo .. .. .. .. .. .. .. ..
côte d’ivoire .. .. .. .. .. .. .. ..
Democratic Republic of the congo .. .. .. .. .. .. .. ..
eritrea .. .. .. ..
ethiopia .. .. .. ..
ethiopia PDR .. .. .. ..
Gabon .. .. .. .. .. .. .. ..
Gambia .. .. .. .. .. .. .. ..
Ghana 139 6 39 54 12.2 0.4 0.7 0.4
Guinea .. .. .. .. .. .. .. ..
Guinea-Bissau .. .. .. .. .. .. .. ..
Kenya 331 652 390 425 8.3 10.2 5.5 3.4
lesotho 27 82 44 49 8.0 9.8 3.7 3.2
liberia .. .. .. .. .. .. .. ..
Madagascar .. .. .. .. .. .. .. ..
Malawi 149 153 101 83 10.2 9.9 4.9 4.1
Mali .. .. .. .. .. .. .. ..
Mauritania .. .. .. .. .. .. .. ..
Mauritius 68 101 116 84 6.9 7.3 4.8 2.7
Mozambique .. .. .. .. .. .. .. ..
namibia .. .. .. .. .. .. .. ..
niger .. .. .. .. .. .. .. ..
nigeria 936 796 419 510 3.0 5.1 2.0 2.0
Rwanda .. .. .. .. .. .. .. ..
Sao tome and Principe .. .. .. .. .. .. .. ..
Senegal .. .. .. .. .. .. .. ..
Seychelles .. .. .. .. .. .. .. ..
Sierra leone .. .. .. .. .. .. .. ..
Somalia .. .. .. .. .. .. .. ..
South africa .. .. .. .. .. .. .. ..
Sudan .. .. .. .. .. .. .. ..
Swaziland 30 47 80 121 13.0 7.3 6.6 4.4
togo .. .. .. .. .. .. .. ..
Uganda 27 42 223 231 6.7 2.3 6.3 4.0
United Republic of tanzania .. .. .. .. .. .. .. ..
Zambia 832 83 216 333 22.9 2.8 6.5 8.3
Zimbabwe .. .. .. .. .. .. .. ..
taBle a4 (cont.)
t H e S t a t e O F F O O D a n D a G R i c U l t U R e 2 0 1 2136taBle a5Government expenditures on agriculture: per agricultural worker and agricultural Orientation index, 1980, 1990, 2000 and 2007
Government expenditures
Per agricultural worker (Constant 2005 PPP dollars)
agricultural Orientation index (Ratio)
1980 1990 2000 2007 1980 1990 2000 2007
lOW- anD MiDDle-incOMe cOUntRieS
east asia and the Pacific
american Samoa .. .. .. .. .. .. .. ..
cambodia .. .. .. .. .. .. .. ..
china 45 43 84 178 0.40 0.37 0.51 0.64
Democratic People’s Republic of Korea .. .. .. .. .. .. .. ..
Fiji 283 294 288 248 0.33 0.33 0.22 0.22
indonesia 127 117 57 81 0.42 0.39 0.15 0.21
Kiribati .. .. .. .. .. .. .. ..
lao People’s Democratic Republic .. .. .. .. .. .. .. ..
Malaysia .. .. .. .. .. .. .. ..
Marshall islands .. .. .. .. .. .. .. ..
Micronesia (Federated States of) .. .. .. .. .. .. .. ..
Mongolia .. .. .. .. .. .. .. ..
Myanmar 33 12 22 22 .. .. .. ..
Palau .. .. .. .. .. .. .. ..
Papua new Guinea 133 108 45 25 0.24 0.23 0.07 0.04
Philippines 111 181 178 193 0.24 0.30 0.36 0.37
Samoa .. .. .. .. .. .. .. ..
Solomon islands .. .. .. .. .. .. .. ..
thailand 114 156 278 322 0.42 0.84 0.98 0.62
timor-leste .. .. .. .. .. .. .. ..
tonga .. .. .. .. .. .. .. ..
tuvalu .. .. .. .. .. .. .. ..
Vanuatu 130 302 163 157 0.16 0.22 0.14 0.22
Viet nam .. .. .. .. .. .. .. ..
europe and central asia
albania .. .. .. .. .. .. .. ..
armenia .. .. .. ..
azerbaijan .. .. .. ..
Belarus 2 200 5 819 0.92 1.13
Bosnia and Herzegovina .. .. .. ..
Bulgaria .. .. .. .. .. .. .. ..
Georgia .. .. .. ..
Kazakhstan 179 860 0.24 0.67
Kyrgyzstan 99 108 0.11 0.08
latvia 2 040 9 079 0.99 2.76
lithuania 650 4 934 0.45 1.01
S t a t i S t i c a l a n n e x 137
Government expenditures
Per agricultural worker (Constant 2005 PPP dollars)
agricultural Orientation index (Ratio)
1980 1990 2000 2007 1980 1990 2000 2007
Montenegro .. ..
Republic of Moldova 142 842 0.15 0.67
Romania .. .. 1 016 3 153 .. .. 0.27 0.56
Russian Federation 492 285 0.32 0.11
Serbia .. ..
Serbia and Montenegro .. ..
tajikistan .. .. .. ..
the former Yugoslav Republic of Macedonia .. .. .. ..
turkey .. .. 478 525 .. .. 0.25 0.26
turkmenistan .. .. .. ..
Ukraine .. .. .. ..
USSR .. .. .. ..
Uzbekistan .. .. .. ..
Yugoslav SFR .. .. .. ..
latin america and the caribbean
antigua and Barbuda .. .. .. .. .. .. .. ..
argentina .. .. .. .. .. .. .. ..
Belize .. .. .. .. .. .. .. ..
Bolivia (Plurinational State of) 79 62 96 59 0.18 0.21 0.19 0.11
Brazil 1 0 263 200 0.60 0.19 0.87 0.38
chile .. .. .. .. .. .. .. ..
colombia .. .. .. .. .. .. .. ..
costa Rica 442 628 403 698 .. .. .. ..
cuba .. .. .. .. .. .. .. ..
Dominica .. .. .. .. .. .. .. ..
Dominican Republic 658 539 844 440 0.71 1.08 1.05 0.52
ecuador .. .. .. .. .. .. .. ..
el Salvador 755 1 454 2 480 142 .. .. .. ..
Grenada .. .. .. .. .. .. .. ..
Guatemala 208 98 97 105 .. .. .. ..
Guyana .. .. .. .. .. .. .. ..
Haiti .. .. .. .. .. .. .. ..
Honduras .. .. .. .. .. .. .. ..
Jamaica .. .. .. .. .. .. .. ..
Mexico 1 011 549 547 843 0.79 0.45 0.80 0.49
nicaragua .. .. .. .. .. .. .. ..
Panama 942 309 311 816 0.59 0.26 0.21 0.42
Paraguay .. .. .. .. .. .. .. ..
Peru .. .. .. .. .. .. .. ..
taBle a5 (cont.)
t H e S t a t e O F F O O D a n D a G R i c U l t U R e 2 0 1 2138Government expenditures
Per agricultural worker (Constant 2005 PPP dollars)
agricultural Orientation index (Ratio)
1980 1990 2000 2007 1980 1990 2000 2007
Saint lucia .. .. .. .. .. .. .. ..
Saint Vincent and the Grenadines 309 984 765 561 0.27 0.30 0.29 0.29
Suriname .. .. .. .. .. .. .. ..
Uruguay 296 347 536 600 .. .. .. ..
Venezuela (Bolivarian Republic of) .. .. .. .. .. .. .. ..
Middle east and north africa
algeria .. .. .. .. .. .. .. ..
Djibouti .. .. .. .. .. .. .. ..
egypt 398 361 736 452 0.25 0.28 0.41 0.22
iran (islamic Republic of) 629 442 329 917 0.20 0.18 0.14 0.30
iraq .. .. .. .. .. .. .. ..
Jordan 497 927 1 467 1 283 0.12 0.29 1.38 0.54
lebanon .. .. .. .. .. .. .. ..
libya .. .. .. .. .. .. .. ..
Morocco 284 264 247 231 0.35 0.29 0.21 0.15
Occupied Palestinian territory .. .. .. .. .. .. .. ..
Syrian arab Republic 1 106 959 1 511 964 .. .. .. ..
tunisia 1 538 1 394 1 691 1 367 1.03 0.61 0.75 0.59
Yemen 8 79 106 90 .. .. .. ..
South asia
afghanistan .. .. .. .. .. .. .. ..
Bangladesh 14 15 15 35 0.33 0.15 0.14 0.29
Bhutan 232 293 320 214 .. .. .. ..
india 31 68 66 91 0.20 0.28 0.24 0.28
Maldives 217 183 292 865 .. .. .. ..
nepal 40 27 22 17 0.27 0.16 0.14 0.13
Pakistan 22 18 18 122 0.07 0.03 0.03 0.20
Sri lanka 161 153 169 217 0.21 0.22 0.22 0.38
Sub-Saharan africa
angola .. .. .. .. .. .. .. ..
Benin .. .. .. .. .. .. .. ..
Botswana 490 973 1 024 750 0.66 1.33 1.55 1.32
Burkina Faso .. .. .. .. .. .. .. ..
Burundi .. .. .. .. .. .. .. ..
cameroon .. .. .. .. .. .. .. ..
cape Verde .. .. .. .. .. .. .. ..
central african Republic .. .. .. .. .. .. .. ..
chad .. .. .. .. .. .. .. ..
taBle a5 (cont.)
S t a t i S t i c a l a n n e x 139Government expenditures
Per agricultural worker (Constant 2005 PPP dollars)
agricultural Orientation index (Ratio)
1980 1990 2000 2007 1980 1990 2000 2007
comoros .. .. .. .. .. .. .. ..
congo .. .. .. .. .. .. .. ..
côte d’ivoire .. .. .. .. .. .. .. ..
Democratic Republic of the congo .. .. .. .. .. .. .. ..
eritrea .. .. .. ..
ethiopia .. .. .. ..
ethiopia PDR .. .. .. ..
Gabon .. .. .. .. .. .. .. ..
Gambia .. .. .. .. .. .. .. ..
Ghana 51 2 8 10 0.20 0.01 0.02 0.01
Guinea .. .. .. .. .. .. .. ..
Guinea-Bissau .. .. .. .. .. .. .. ..
Kenya 60 83 36 34 0.25 0.35 0.17 0.17
lesotho 110 277 129 142 0.33 0.39 0.30 0.39
liberia .. .. .. .. .. .. .. ..
Madagascar .. .. .. .. .. .. .. ..
Malawi 59 45 25 17 0.23 0.22 0.13 0.12
Mali .. .. .. .. .. .. .. ..
Mauritania .. .. .. .. .. .. .. ..
Mauritius 672 1 351 1 845 1 580 0.52 0.57 0.69 0.56
Mozambique .. .. .. .. .. .. .. ..
namibia .. .. .. .. .. .. .. ..
niger .. .. .. .. .. .. .. ..
nigeria 74 63 33 41 .. .. .. ..
Rwanda .. .. .. .. .. .. .. ..
Sao tome and Principe .. .. .. .. .. .. .. ..
Senegal .. .. .. .. .. .. .. ..
Seychelles .. .. .. .. .. .. .. ..
Sierra leone .. .. .. .. .. .. .. ..
Somalia .. .. .. .. .. .. .. ..
South africa .. .. .. .. .. .. .. ..
Sudan .. .. .. .. .. .. .. ..
Swaziland 253 341 531 857 0.57 0.70 0.53 0.60
togo .. .. .. .. .. .. .. ..
Uganda 6 6 26 23 0.09 0.04 0.21 0.17
United Republic of tanzania .. .. .. .. .. .. .. ..
Zambia 561 37 78 109 1.52 0.14 0.29 0.39
Zimbabwe .. .. .. .. .. .. .. ..
taBle a5 (cont.)

t H e S t a t e O F F O O D a n D a G R i c U l t U R e 2 0 1 2140taBle a6Public expenditures on agricultural research and development: total and as a share of agricultural GDP, 1981, 1990, 2000 and latest year
Public expenditures on agricultural research and development
total(Million constant 2005 PPP dollars)
as a share of agricultural GDP(Percentage)
1981 1990 2000 latest year 1981 1990 2000 latest year
lOW- anD MiDDle-incOMe cOUntRieS
east asia and Pacific
american Samoa .. .. .. .. .. .. .. ..
cambodia .. .. .. .. .. .. .. ..
china 658 1 055 1 745 4 048 0.41 0.34 0.38 0.50
Democratic People’s Republic of Korea .. .. .. .. .. .. .. ..
Fiji .. .. .. .. .. .. .. ..
indonesia .. .. 154 204 .. .. 0.18 0.20
Kiribati .. .. .. .. .. .. .. ..
lao People’s Democratic Republic .. .. 22 10 .. .. 0.57 0.24
Malaysia 158 210 335 .. 1.01 1.14 1.57 ..
Marshall islands .. .. .. .. .. .. .. ..
Micronesia (Federated States of) .. .. .. .. .. .. .. ..
Mongolia .. .. .. .. .. .. .. ..
Myanmar .. .. 6 5 .. .. 0.04 0.06
Palau .. .. .. .. .. .. .. ..
Papua new Guinea .. .. 21 .. .. .. 0.60 ..
Philippines .. .. 129 .. .. .. 0.41 ..
Samoa .. .. .. .. .. .. .. ..
Solomon islands .. .. .. .. .. .. .. ..
thailand .. .. .. .. .. .. .. ..
timor-leste .. .. .. .. .. .. .. ..
tonga .. .. .. .. .. .. .. ..
tuvalu .. .. .. .. .. .. .. ..
Vanuatu .. .. .. .. .. .. .. ..
Viet nam .. .. 12 .. .. .. 0.13 ..
europe and central asia
albania .. .. .. .. .. .. .. ..
armenia .. .. .. ..
azerbaijan .. .. .. ..
Belarus .. .. .. ..
Bosnia and Herzegovina .. .. .. ..
Bulgaria .. .. .. .. .. .. .. ..
Georgia .. .. .. ..
Kazakhstan .. .. .. ..
Kyrgyzstan .. .. .. ..
latvia .. .. .. ..
lithuania .. .. .. ..

S t a t i S t i c a l a n n e x 141
Public expenditures on agricultural research and development
total(Million constant 2005 PPP dollars)
as a share of agricultural GDP(Percentage)
1981 1990 2000 latest year 1981 1990 2000 latest year
Montenegro .. ..
Republic of Moldova .. .. .. ..
Romania .. .. .. .. .. .. .. ..
Russian Federation .. .. .. ..
Serbia .. ..
Serbia and Montenegro .. ..
tajikistan .. .. .. ..
the former Yugoslav Republic of Macedonia .. .. .. ..
turkey .. .. .. .. .. .. .. ..
turkmenistan .. .. .. ..
Ukraine .. .. .. ..
USSR .. .. .. ..
Uzbekistan .. .. .. ..
Yugoslav SFR .. .. .. ..
latin america and the caribbean
antigua and Barbuda .. .. .. .. .. .. .. ..
argentina 203 194 239 449 1.17 0.98 1.34 1.27
Belize 1 1 2 3 0.75 0.86 0.90 0.95
Bolivia (Plurinational State of) .. .. .. .. .. .. .. ..
Brazil 979 1 227 1 247 1 296 1.15 1.66 1.86 1.68
chile 58 75 117 98 1.45 1.09 1.30 1.22
colombia 104 153 165 152 0.43 0.54 0.62 0.50
costa Rica 13 17 25 30 0.41 0.85 0.93 0.93
cuba .. .. .. .. .. .. .. ..
Dominica .. .. .. .. .. .. .. ..
Dominican Republic .. .. .. 17 .. .. .. 0.26
ecuador .. .. .. .. .. .. .. ..
el Salvador 14 11 7 6 0.20 0.30 0.20 0.15
Grenada .. .. .. .. .. .. .. ..
Guatemala 21 14 9 8 0.25 0.15 0.07 0.06
Guyana .. .. .. .. .. .. .. ..
Haiti .. .. .. .. .. .. .. ..
Honduras 6 15 14 13 0.25 0.55 0.54 0.43
Jamaica .. .. .. .. .. .. .. ..
Mexico .. .. 438 518 .. .. 1.08 1.21
nicaragua .. .. .. 24 .. .. .. 0.94
Panama 10 12 11 10 0.92 0.95 0.72 0.50
Paraguay .. .. .. 3 .. .. .. 0.20
Peru .. .. .. .. .. .. .. ..
taBle a6 (cont.)
t H e S t a t e O F F O O D a n D a G R i c U l t U R e 2 0 1 2142Public expenditures on agricultural research and development
total(Million constant 2005 PPP dollars)
as a share of agricultural GDP(Percentage)
1981 1990 2000 latest year 1981 1990 2000 latest year
Saint lucia .. .. .. .. .. .. .. ..
Saint Vincent and the Grenadines .. .. .. .. .. .. .. ..
Suriname .. .. .. .. .. .. .. ..
Uruguay 18 29 38 60 0.67 1.45 2.06 1.99
Venezuela (Bolivarian Republic of) .. .. .. .. .. .. .. ..
Middle east and north africa
algeria .. .. .. .. .. .. .. ..
Djibouti .. .. .. .. .. .. .. ..
egypt .. .. .. .. .. .. .. ..
iran (islamic Republic of) .. .. 508 559 .. .. 0.76 0.82
iraq .. .. .. .. .. .. .. ..
Jordan .. .. 7 .. .. .. 1.99 ..
lebanon .. .. .. .. .. .. .. ..
libya .. .. .. .. .. .. .. ..
Morocco 99 119 105 .. 1.72 1.01 1.00 ..
Occupied Palestinian territory .. .. .. .. .. .. .. ..
Syrian arab Republic .. .. 79 .. .. .. 0.53 ..
tunisia .. .. 45 .. .. .. 0.71 ..
Yemen .. .. .. .. .. .. .. ..
South asia
afghanistan .. .. .. .. .. .. .. ..
Bangladesh .. .. 142 126 .. .. 0.46 0.31
Bhutan .. .. .. .. .. .. .. ..
india 414 714 1 487 2 276 0.22 0.29 0.39 0.40
Maldives .. .. .. .. .. .. .. ..
nepal .. .. 25 22 .. .. 0.29 0.23
Pakistan .. .. 136 172 .. .. 0.21 0.21
Sri lanka .. .. 55 38 .. .. 0.54 0.34
Sub-Saharan africa
angola .. .. .. .. .. .. .. ..
Benin 6 11 13 22 0.44 0.57 0.43 0.57
Botswana 9 11 20 19 1.94 2.50 4.50 4.32
Burkina Faso 23 22 23 19 1.66 1.23 0.79 0.43
Burundi .. .. 4 10 .. .. 0.45 1.78
cameroon .. .. .. .. .. .. .. ..
cape Verde .. .. .. .. .. .. .. ..
central african Republic .. .. .. .. .. .. .. ..
chad .. .. .. .. .. .. .. ..
taBle a6 (cont.)
S t a t i S t i c a l a n n e x 143Public expenditures on agricultural research and development
total(Million constant 2005 PPP dollars)
as a share of agricultural GDP(Percentage)
1981 1990 2000 latest year 1981 1990 2000 latest year
comoros .. .. .. .. .. .. .. ..
congo .. .. 3 5 .. .. 0.60 0.85
côte d’ivoire 72 74 56 43 1.17 0.95 0.77 0.54
Democratic Republic of the congo .. .. .. .. .. .. .. ..
eritrea 9 3 2.53 0.45
ethiopia 49 69 0.31 0.27
ethiopia PDR 17 39 0.14 0.28
Gabon .. .. 2 2 .. .. 0.24 0.20
Gambia .. .. 3 3 .. .. 0.58 0.50
Ghana 14 40 41 95 0.25 0.66 0.57 0.90
Guinea .. .. 10 4 .. .. 0.73 0.18
Guinea-Bissau .. .. .. .. .. .. .. ..
Kenya 88 127 151 172 1.36 1.50 1.31 1.30
lesotho .. .. .. .. .. .. .. ..
liberia .. .. .. .. .. .. .. ..
Madagascar 14 21 9 12 0.48 0.70 0.24 0.27
Malawi 29 39 30 21 1.84 1.71 1.03 0.68
Mali 33 24 31 25 1.56 0.95 0.95 0.57
Mauritania .. .. .. 6 .. .. .. 1.16
Mauritius 11 12 23 22 2.18 1.69 3.41 3.92
Mozambique .. .. .. 18 .. .. .. 0.38
namibia .. .. .. 22 .. .. .. 2.03
niger 9 15 5 6 0.37 0.81 0.19 0.17
nigeria 231 117 191 404 0.40 0.13 0.21 0.42
Rwanda .. .. .. 18 .. .. .. 0.53
Sao tome and Principe .. .. .. .. .. .. .. ..
Senegal 41 34 25 25 2.36 1.78 1.02 0.87
Seychelles .. .. .. .. .. .. .. ..
Sierra leone .. .. .. 6 .. .. .. 0.31
Somalia .. .. .. .. .. .. .. ..
South africa 221 247 283 272 1.44 2.09 2.83 2.02
Sudan 54 29 37 52 0.73 0.28 0.20 0.27
Swaziland .. .. .. .. .. .. .. ..
togo 16 13 13 9 1.97 1.11 0.88 0.47
Uganda .. .. 40 88 .. .. 0.76 1.24
United Republic of tanzania .. .. 44 77 .. .. 0.36 0.50
Zambia 27 23 15 8 1.81 1.29 0.71 0.29
Zimbabwe .. .. .. .. .. .. .. ..
taBle a6 (cont.)
t H e S t a t e O F F O O D a n D a G R i c U l t U R e 2 0 1 2144taBle a7Official development assistance to agriculture and agricultural share of ODa to all sectors, 1980, 1990, 2000 and 20
Official development assistance
to agriculture (Million constant 2005 US$)
agricultural share of ODa to all sectors (Percentage)
1980 1990 2000 2010 1980 1990 2000 2010
WORlD 8 397 8 193 4 131 8 299 18.8 14.5 5.6 5.9
lOW- anD MiDDle-incOMe cOUntRieS 8 328 8 150 4 119 8 266 20.0 15.2 5.6 5.8
east asia and the Pacific 1 358 1 851 722 728 18.0 17.3 5.3 5.9
american Samoa .. .. .. .. .. .. .. ..
cambodia 6 .. 59 50 7.6 .. 10.8 5.6
china .. 1 096 193 65 .. 53.7 5.7 3.1
Democratic People’s Republic of Korea .. 36 1 0 .. .. 1.4 0.8
Fiji 5 1 1 12 35.4 6.9 6.7 20.5
indonesia 704 400 132 170 23.6 11.7 6.1 5.9
Kiribati 5 1 10 2 37.9 7.9 44.1 5.3
lao People’s Democratic Republic 70 48 18 18 56.2 20.6 6.2 3.4
Malaysia .. 15 6 6 .. 2.1 0.4 6.7
Marshall islands .. .. 5 1 .. .. 8.3 0.8
Micronesia (Federated States of) .. .. 14 1 .. .. 12.1 1.0
Mongolia .. .. 5 26 .. .. 1.6 4.9
Myanmar 136 .. 3 22 28.0 .. 3.5 7.5
Palau .. .. 0 0 .. .. 0.9 2.3
Papua new Guinea 11 2 25 40 1.7 1.1 4.5 4.8
Philippines 133 145 157 49 18.7 6.0 13.0 4.2
Samoa 14 4 2 2 73.7 7.4 4.1 1.6
Solomon islands 6 5 3 17 14.5 17.5 2.9 5.1
thailand 227 73 22 11 31.8 5.1 1.7 2.2
timor-leste .. .. 5 10 .. .. 1.7 2.8
tonga 1 4 0 1 7.2 9.8 0.5 1.5
tuvalu 1 .. .. 0 11.3 .. 0.0 1.9
Vanuatu 5 2 3 2 5.4 15.8 10.1 2.6
Viet nam 35 20 58 223 9.4 10.1 2.9 6.4
europe and central asia 272 488 5.2 6.1
albania .. .. 10 16 2.3 3.8
armenia 15 6 5.6 1.8
azerbaijan 60 3 28.1 1.6
Belarus .. 0 .. 0.2
Bosnia and Herzegovina 15 10 1.7 1.9
Bulgaria .. .. .. .. .. .. .. ..
Georgia 21 22 7.3 2.8
Kazakhstan 3 2 1.0 0.6
Kyrgyzstan 75 9 22.4 1.9
S t a t i S t i c a l a n n e x 145
Official development assistance
to agriculture (Million constant 2005 US$)
agricultural share of ODa to all sectors (Percentage)
1980 1990 2000 2010 1980 1990 2000 2010
latvia .. .. .. ..
lithuania .. .. .. ..
Montenegro 4 3.9
Republic of Moldova 11 97 8.1 12.8
Romania .. .. .. .. .. .. .. ..
Russian Federation .. .. .. ..
Serbia 25 4.2
Serbia and Montenegro 15 0.7
tajikistan 22 26 15.5 6.3
the former Yugoslav Republic of Macedonia 24 21 7.9 9.7
turkey .. 1 1 238 .. 0.3 0.1 15.5
turkmenistan 0 1 0.2 2.5
Ukraine .. 3 .. 0.5
USSR .. .. .. ..
Uzbekistan 0 5 0.2 0.7
Yugoslav SFR .. .. .. ..
latin america and the caribbean 772 665 522 960 20.3 10.1 6.5 8.5
antigua and Barbuda .. .. 10 0 .. .. 90.1 2.1
argentina .. 25 2 34 .. 14.2 2.5 25.0
Belize 1 5 6 22 14.2 37.6 27.1 46.8
Bolivia (Plurinational State of) 19 174 115 122 12.9 23.5 9.1 18.1
Brazil 30 20 19 201 8.4 19.2 8.3 22.4
chile 2 0 3 2 10.9 0.1 5.8 1.7
colombia .. 3 82 100 .. 2.6 5.1 9.1
costa Rica 41 15 13 2 28.8 9.9 22.0 2.5
cuba .. 0 7 8 .. 1.0 11.0 7.5
Dominica 4 0 8 0 30.8 0.0 47.0 0.3
Dominican Republic 25 6 12 17 14.8 4.2 4.0 4.3
ecuador 0 10 10 38 0.0 2.3 4.4 15.7
el Salvador 165 32 17 10 57.7 7.6 11.2 3.5
Grenada 0 .. 2 0 6.7 .. 14.5 0.7
Guatemala .. 24 24 41 .. 8.5 8.6 9.9
Guyana 6 44 0 22 28.6 14.2 0.1 7.6
Haiti 6 35 23 68 6.8 13.3 11.9 2.1
Honduras 45 82 59 66 10.4 17.0 7.4 12.2
Jamaica 25 68 7 25 15.3 26.1 5.9 24.8
Mexico 1 1 5 20 1.3 0.2 1.3 2.0
nicaragua 142 67 45 59 27.9 8.2 8.1 10.6
Panama 11 .. 1 4 14.1 .. 2.1 8.3
taBle a7 (cont.)
t H e S t a t e O F F O O D a n D a G R i c U l t U R e 2 0 1 2146Official development assistance
to agriculture (Million constant 2005 US$)
agricultural share of ODa to all sectors (Percentage)
1980 1990 2000 2010 1980 1990 2000 2010
Paraguay 17 14 3 20 9.1 9.4 5.9 10.5
Peru 227 31 24 72 51.1 16.1 2.3 10.8
Saint lucia 2 .. 10 0 25.0 .. 37.5 4.0
Saint Vincent and the Grenadines .. 0 8 0 .. 100.0 57.7 3.0
Suriname 2 6 4 .. 2.2 18.1 15.6 0.0
Uruguay .. 2 1 2 .. 8.2 8.1 6.4
Venezuela (Bolivarian Republic of) .. .. 0 0 .. .. 0.2 0.8
Middle east and north africa 742 345 316 492 13.1 6.9 5.4 4.0
algeria .. 28 1 8 .. 11.8 0.9 3.2
Djibouti 4 11 1 1 19.7 25.8 1.1 0.8
egypt 325 108 155 133 9.3 4.1 8.5 6.0
iran (islamic Republic of) .. .. 0 2 .. .. 0.1 1.7
iraq .. .. .. 51 .. .. 0.0 2.5
Jordan 24 4 37 2 8.2 0.5 5.5 0.2
lebanon .. .. 7 27 .. .. 6.5 6.4
libya .. 1 .. 0 .. 33.8 .. 0.1
Morocco 19 72 6 161 7.8 10.7 0.8 8.7
Occupied Palestinian territory .. .. 17 34 .. .. 2.8 1.6
Syrian arab Republic 110 .. 8 26 94.9 .. 7.0 6.1
tunisia 163 83 51 4 18.2 21.4 8.1 0.6
Yemen 98 38 31 42 20.7 15.4 5.2 5.2
South asia 3 336 1 924 504 1 085 28.6 21.0 7.9 4.8
afghanistan .. 33 2 583 .. 28.1 1.2 8.7
Bangladesh 797 590 177 121 23.4 25.1 11.2 5.0
Bhutan 1 18 4 6 3.3 46.9 5.0 5.7
india 2 000 237 194 189 37.3 8.0 7.8 2.8
Maldives .. 0 0 0 .. 0.1 0.0 0.1
nepal 141 196 61 30 36.9 52.6 16.6 2.9
Pakistan 201 755 12 145 15.6 37.2 0.9 3.3
Sri lanka 197 94 55 12 16.4 7.6 14.0 1.2
Sub-Saharan africa 2 082 2 897 1 488 2 857 19.6 16.0 7.1 7.4
angola 16 51 9 27 14.5 17.9 2.5 6.1
Benin 1 16 45 21 0.6 8.1 10.9 3.6
Botswana 15 3 2 1 9.6 2.6 4.4 0.6
Burkina Faso 98 66 127 71 31.8 21.0 23.8 8.7
Burundi 33 68 11 96 12.7 28.2 6.3 19.2
cameroon 133 142 16 62 62.7 21.6 3.1 9.4
cape Verde 17 5 4 3 19.8 6.0 4.8 1.7
taBle a7 (cont.)
S t a t i S t i c a l a n n e x 147Official development assistance
to agriculture (Million constant 2005 US$)
agricultural share of ODa to all sectors (Percentage)
1980 1990 2000 2010 1980 1990 2000 2010
central african Republic 5 41 2 3 4.4 16.6 1.4 1.2
chad 1 21 27 9 4.5 11.2 6.2 1.8
comoros 11 5 2 2 31.3 49.1 6.0 2.2
congo 7 33 1 1 4.3 13.8 1.4 0.1
côte d’ivoire 66 98 37 93 52.1 11.1 6.4 12.8
Democratic Republic of the congo 103 43 3 100 21.7 5.9 1.3 3.1
eritrea 39 13 9.2 13.6
ethiopia 67 222 5.3 7.3
ethiopia PDR 62 93 30.0 12.4
Gabon 32 1 10 28 62.5 5.6 11.6 15.4
Gambia 5 12 4 15 6.1 12.1 7.9 9.1
Ghana 143 60 140 126 38.7 6.7 16.4 8.1
Guinea 28 77 9 8 16.6 16.6 4.4 6.0
Guinea-Bissau 4 37 0 10 8.2 24.7 0.2 8.3
Kenya 175 246 78 323 24.1 13.0 6.1 10.6
lesotho 24 9 4 0 12.9 12.5 6.9 0.1
liberia 10 2 4 36 19.0 12.2 13.8 2.6
Madagascar 9 45 50 19 3.2 7.9 9.6 6.5
Malawi 35 113 50 79 19.6 23.0 6.5 8.6
Mali 40 116 137 223 24.7 34.1 19.4 24.9
Mauritania 24 75 27 11 20.9 34.6 12.0 3.5
Mauritius 1 4 2 0 0.9 4.5 6.5 0.0
Mozambique 95 209 48 72 39.0 21.7 2.6 3.7
namibia .. 4 13 14 .. 4.2 9.9 4.0
niger 70 115 81 43 25.2 51.1 20.7 8.1
nigeria 11 11 16 69 75.5 2.2 1.6 5.5
Rwanda 54 26 62 68 20.9 10.1 10.1 7.5
Sao tome and Principe 2 3 6 3 39.7 6.4 12.3 9.0
Senegal 51 104 60 256 16.6 11.5 7.2 19.7
Seychelles 4 7 0 1 32.0 20.4 5.3 2.0
Sierra leone 1 .. 1 75 1.6 .. 0.3 16.7
Somalia 122 56 0 1 29.9 21.6 0.2 0.3
South africa .. .. 12 20 .. .. 2.5 1.9
Sudan 351 55 1 145 22.2 20.1 0.2 7.5
Swaziland 0 5 5 6 0.7 26.0 15.0 5.0
togo 41 33 6 36 19.4 13.1 6.5 7.6
Uganda 5 211 88 198 1.5 23.5 6.6 10.8
United Republic of tanzania 124 497 127 132 10.1 30.0 7.5 4.7
Zambia 51 47 39 36 10.8 5.5 2.9 4.9
Zimbabwe 2 32 17 81 0.6 8.9 7.2 15.5
taBle a7 (cont.)
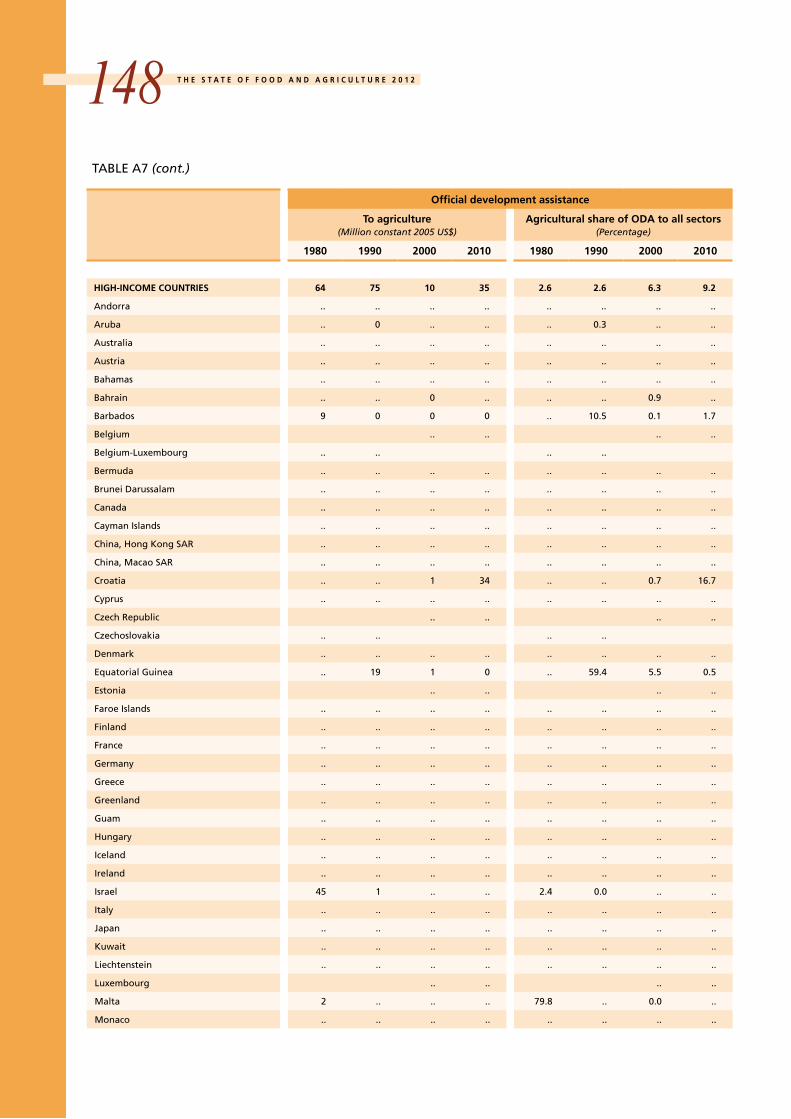
t H e S t a t e O F F O O D a n D a G R i c U l t U R e 2 0 1 2148Official development assistance
to agriculture (Million constant 2005 US$)
agricultural share of ODa to all sectors (Percentage)
1980 1990 2000 2010 1980 1990 2000 2010
HiGH-incOMe cOUntRieS 64 75 10 35 2.6 2.6 6.3 9.2
andorra .. .. .. .. .. .. .. ..
aruba .. 0 .. .. .. 0.3 .. ..
australia .. .. .. .. .. .. .. ..
austria .. .. .. .. .. .. .. ..
Bahamas .. .. .. .. .. .. .. ..
Bahrain .. .. 0 .. .. .. 0.9 ..
Barbados 9 0 0 0 .. 10.5 0.1 1.7
Belgium .. .. .. ..
Belgium-luxembourg .. .. .. ..
Bermuda .. .. .. .. .. .. .. ..
Brunei Darussalam .. .. .. .. .. .. .. ..
canada .. .. .. .. .. .. .. ..
cayman islands .. .. .. .. .. .. .. ..
china, Hong Kong SaR .. .. .. .. .. .. .. ..
china, Macao SaR .. .. .. .. .. .. .. ..
croatia .. .. 1 34 .. .. 0.7 16.7
cyprus .. .. .. .. .. .. .. ..
czech Republic .. .. .. ..
czechoslovakia .. .. .. ..
Denmark .. .. .. .. .. .. .. ..
equatorial Guinea .. 19 1 0 .. 59.4 5.5 0.5
estonia .. .. .. ..
Faroe islands .. .. .. .. .. .. .. ..
Finland .. .. .. .. .. .. .. ..
France .. .. .. .. .. .. .. ..
Germany .. .. .. .. .. .. .. ..
Greece .. .. .. .. .. .. .. ..
Greenland .. .. .. .. .. .. .. ..
Guam .. .. .. .. .. .. .. ..
Hungary .. .. .. .. .. .. .. ..
iceland .. .. .. .. .. .. .. ..
ireland .. .. .. .. .. .. .. ..
israel 45 1 .. .. 2.4 0.0 .. ..
italy .. .. .. .. .. .. .. ..
Japan .. .. .. .. .. .. .. ..
Kuwait .. .. .. .. .. .. .. ..
liechtenstein .. .. .. .. .. .. .. ..
luxembourg .. .. .. ..
Malta 2 .. .. .. 79.8 .. 0.0 ..
Monaco .. .. .. .. .. .. .. ..
taBle a7 (cont.)
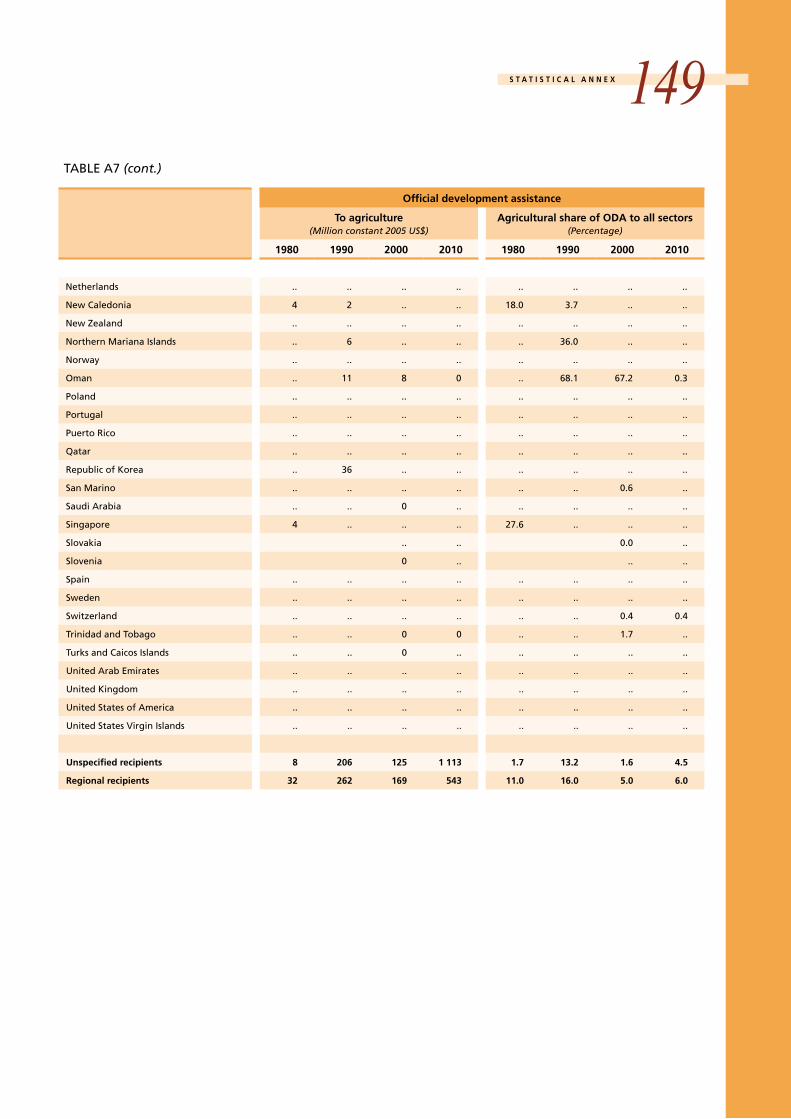
S t a t i S t i c a l a n n e x 149Official development assistance
to agriculture (Million constant 2005 US$)
agricultural share of ODa to all sectors (Percentage)
1980 1990 2000 2010 1980 1990 2000 2010
netherlands .. .. .. .. .. .. .. ..
new caledonia 4 2 .. .. 18.0 3.7 .. ..
new Zealand .. .. .. .. .. .. .. ..
northern Mariana islands .. 6 .. .. .. 36.0 .. ..
norway .. .. .. .. .. .. .. ..
Oman .. 11 8 0 .. 68.1 67.2 0.3
Poland .. .. .. .. .. .. .. ..
Portugal .. .. .. .. .. .. .. ..
Puerto Rico .. .. .. .. .. .. .. ..
Qatar .. .. .. .. .. .. .. ..
Republic of Korea .. 36 .. .. .. .. .. ..
San Marino .. .. .. .. .. .. 0.6 ..
Saudi arabia .. .. 0 .. .. .. .. ..
Singapore 4 .. .. .. 27.6 .. .. ..
Slovakia .. .. 0.0 ..
Slovenia 0 .. .. ..
Spain .. .. .. .. .. .. .. ..
Sweden .. .. .. .. .. .. .. ..
Switzerland .. .. .. .. .. .. 0.4 0.4
trinidad and tobago .. .. 0 0 .. .. 1.7 ..
turks and caicos islands .. .. 0 .. .. .. .. ..
United arab emirates .. .. .. .. .. .. .. ..
United Kingdom .. .. .. .. .. .. .. ..
United States of america .. .. .. .. .. .. .. ..
United States Virgin islands .. .. .. .. .. .. .. ..
Unspecified recipients 8 206 125 1 113 1.7 13.2 1.6 4.5
Regional recipients 32 262 169 543 11.0 16.0 5.0 6.0
taBle a7 (cont.)

Related Documents