THE STATE OF DIVISION REPORT October 2014

The State of Division Report
Jan 04, 2016
The State of Division Report. October 2014. School Division Highlight from 2013-2014. 84 students earned awards at the Piedmont Regional Science Fair, including both Best in Show awards and 75 percent of all first-place awards ; Destination Imagination teams - PowerPoint PPT Presentation
Welcome message from author
This document is posted to help you gain knowledge. Please leave a comment to let me know what you think about it! Share it to your friends and learn new things together.
Transcript

THE STATE OF DIVISION REPORT
October 2014
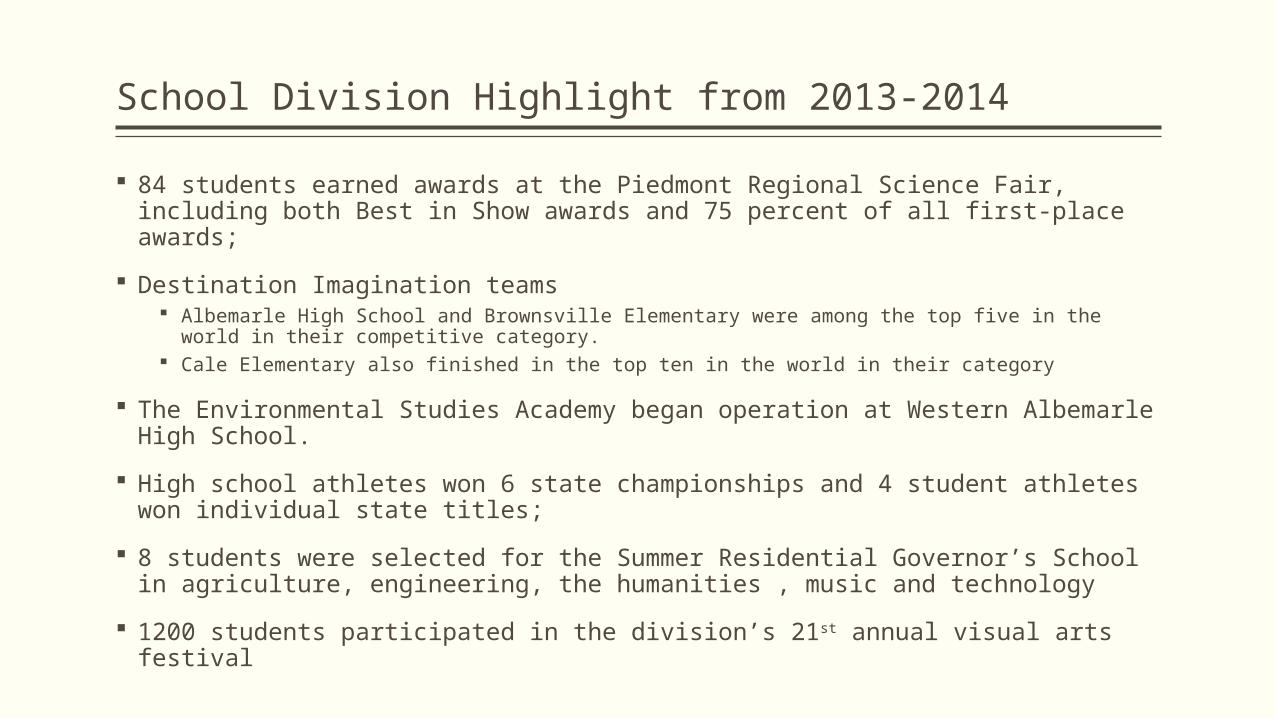
School Division Highlight from 2013-2014
84 students earned awards at the Piedmont Regional Science Fair, including both Best in Show awards and 75 percent of all first-place awards;
Destination Imagination teams Albemarle High School and Brownsville Elementary were among the top five in the world in
their competitive category. Cale Elementary also finished in the top ten in the world in their category
The Environmental Studies Academy began operation at Western Albemarle High School.
High school athletes won 6 state championships and 4 student athletes won individual state titles;
8 students were selected for the Summer Residential Governor’s School in agriculture, engineering, the humanities , music and technology
1200 students participated in the division’s 21st annual visual arts festival

Albemarle County Public School Grants Received
Club Yancey received a $142,000 state grant with the potential of receiving a total of $426,000 over three years.
$46,000 to Murray High School and the Community Public Charter School to advance project-based learning,
$40,000 from the Lastinger Family Foundation to Woodbrook Elementary School for an outdoor environmental classroom;
$20,000 from Battelle to support the division’s manufacturing lab schools;
$17,000 from the Shannon Foundation to support innovative learning projects at eight schools;
$10,000 from Verizon for the Environmental Studies Academy;

HIGH SCHOOL HIGHLIGHTS
Our Strategic Goal in Action
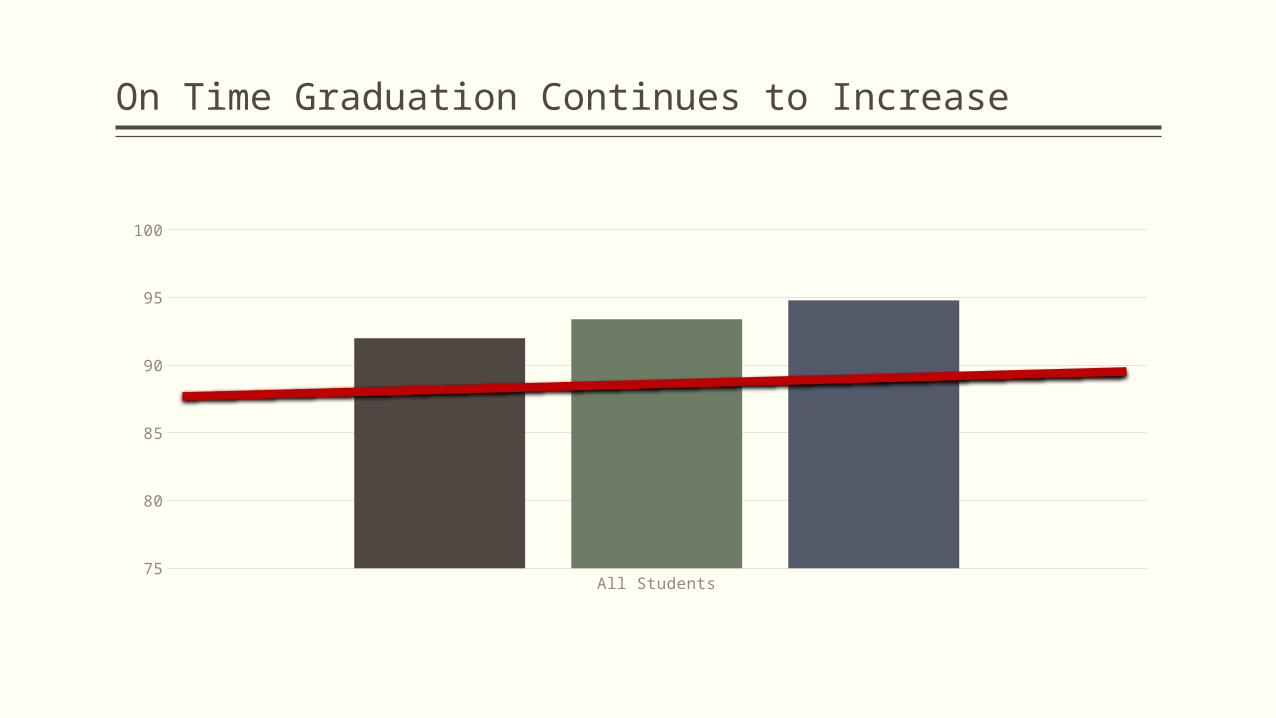
On Time Graduation Continues to Increase
All Students75
80
85
90
95
100
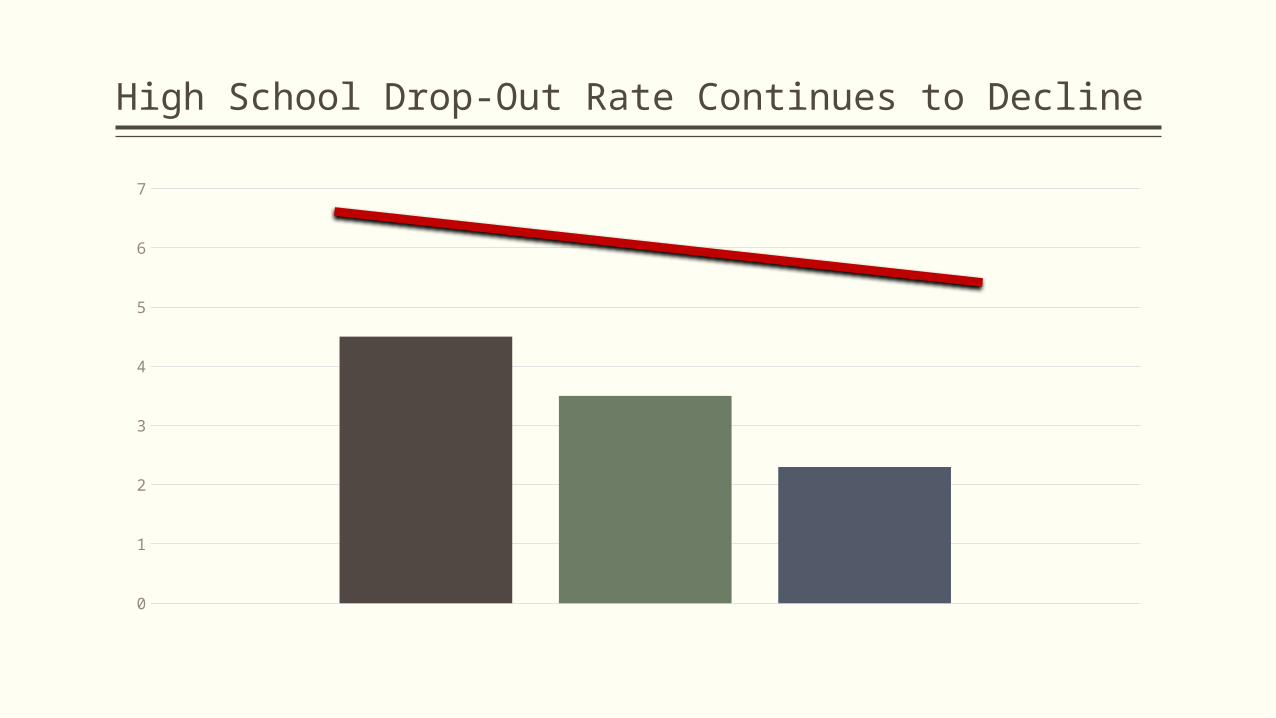
High School Drop-Out Rate Continues to Decline
0
1
2
3
4
5
6
7
2012 2013 2014

High School Graduation Rates
Black Hispanic White Asian Students with Disabilities
Economically Disadv
Limited English Prof
50
55
60
65
70
75
80
85
90
95
100
2012 2013 2014
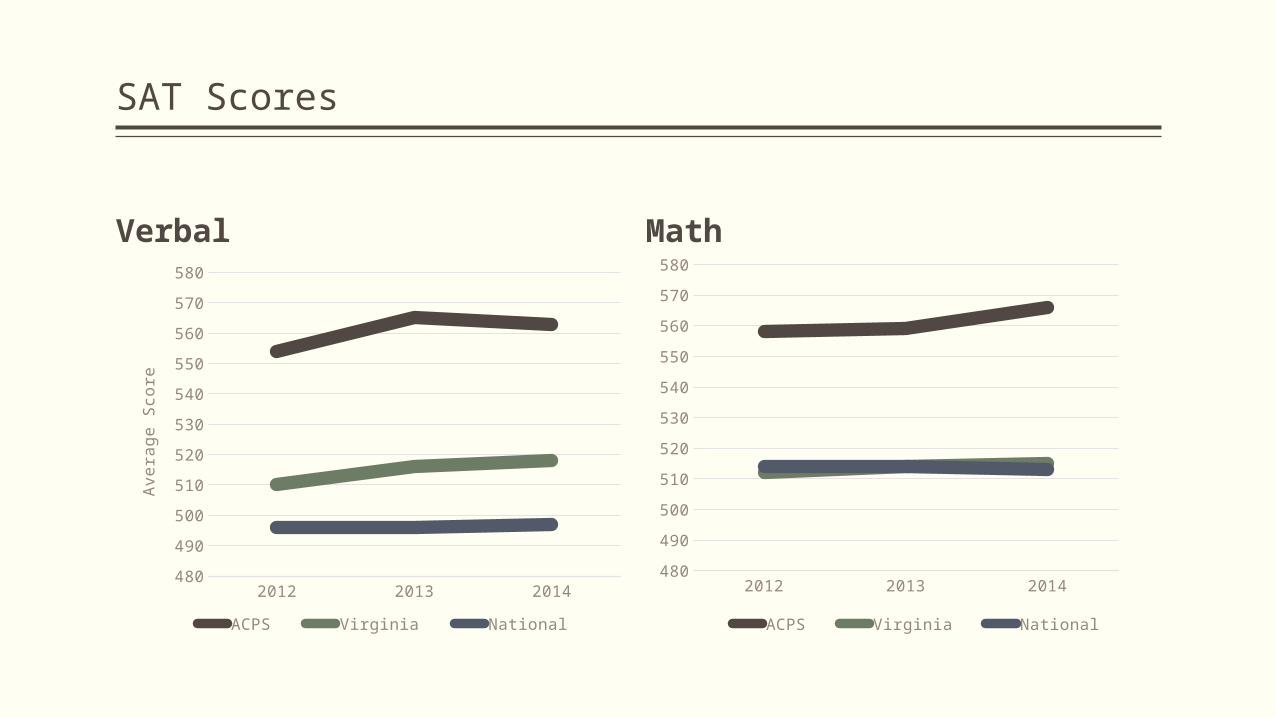
SAT Scores
Verbal Math
2012 2013 2014480
490
500
510
520
530
540
550
560
570
580
ACPS Virginia National
Ave
rage S
core
2012 2013 2014480
490
500
510
520
530
540
550
560
570
580
ACPS Virginia National
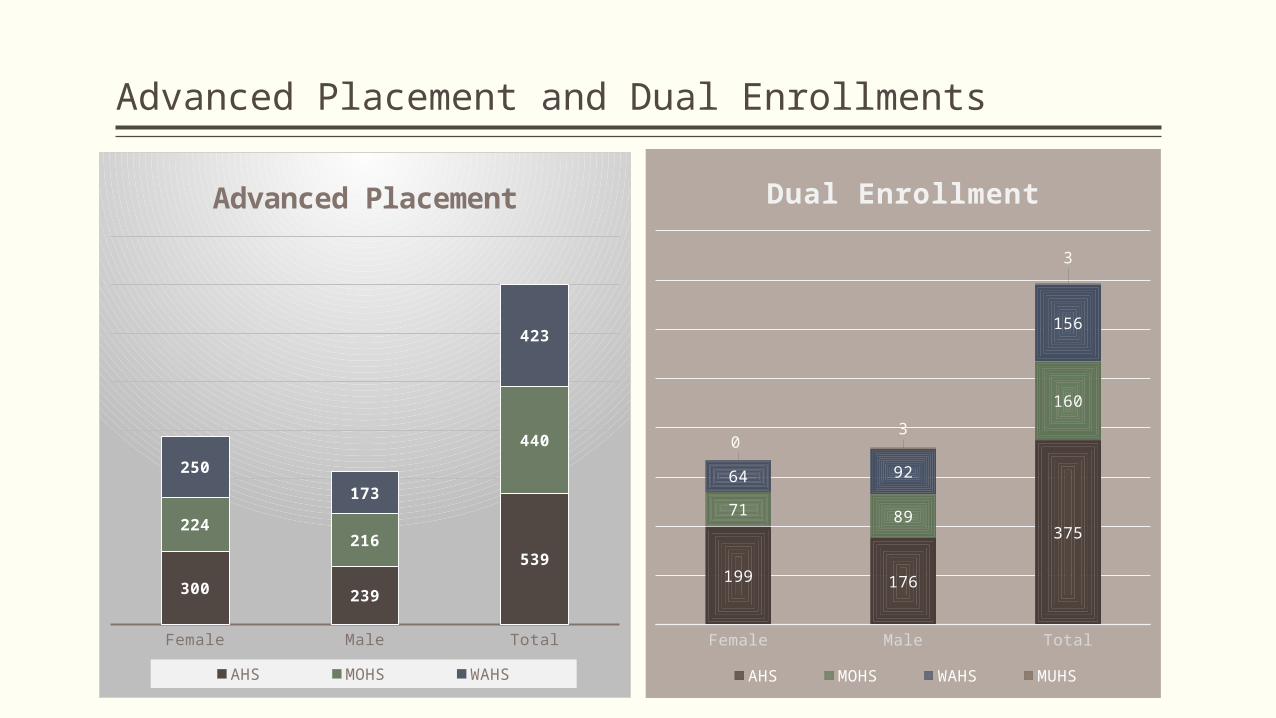
Advanced Placement and Dual Enrollments
Female Male Total
300 239
539
224216
440
250
173
423
Advanced Placement
AHS MOHS WAHS
Female Male Total
199 176
375
71 89
160
64 92
156
03
3
Dual Enrollment
AHS MOHS WAHS MUHS
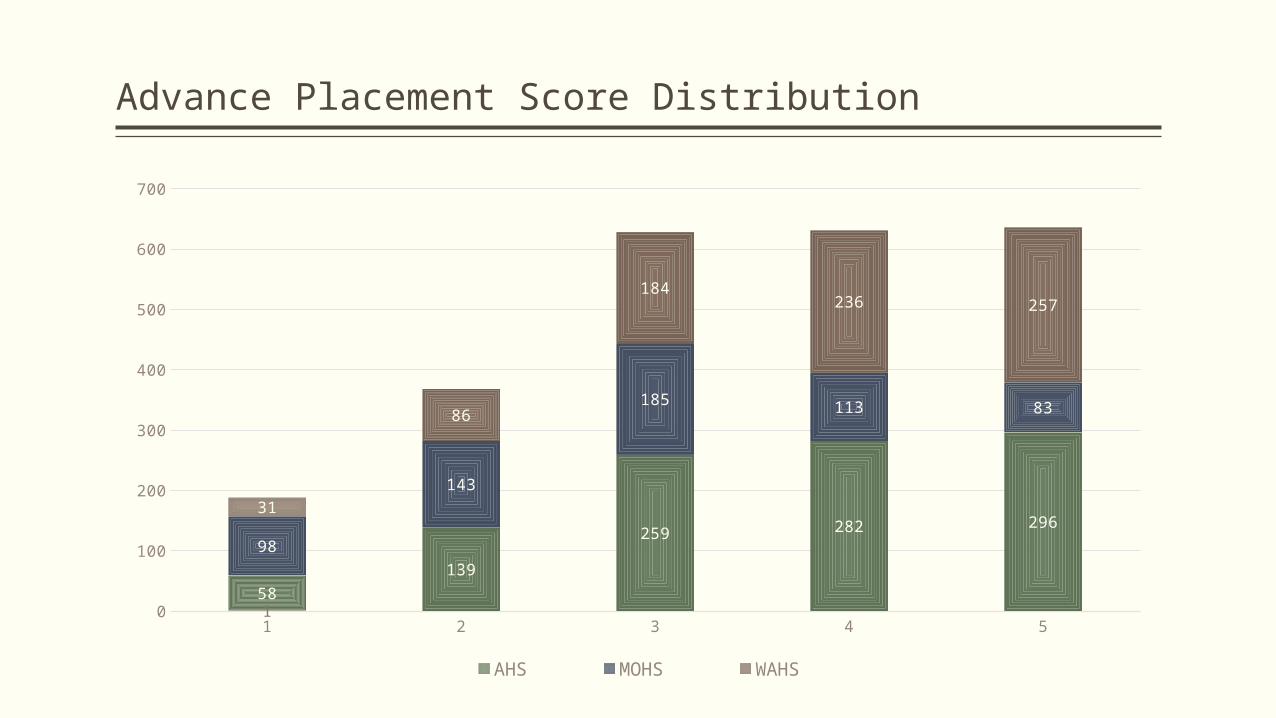
Advance Placement Score Distribution
1 2 3 4 50
100
200
300
400
500
600
700
158
139
259 282 296
98
143
185 113 83
31
86
184236 257
AHS MOHS WAHS
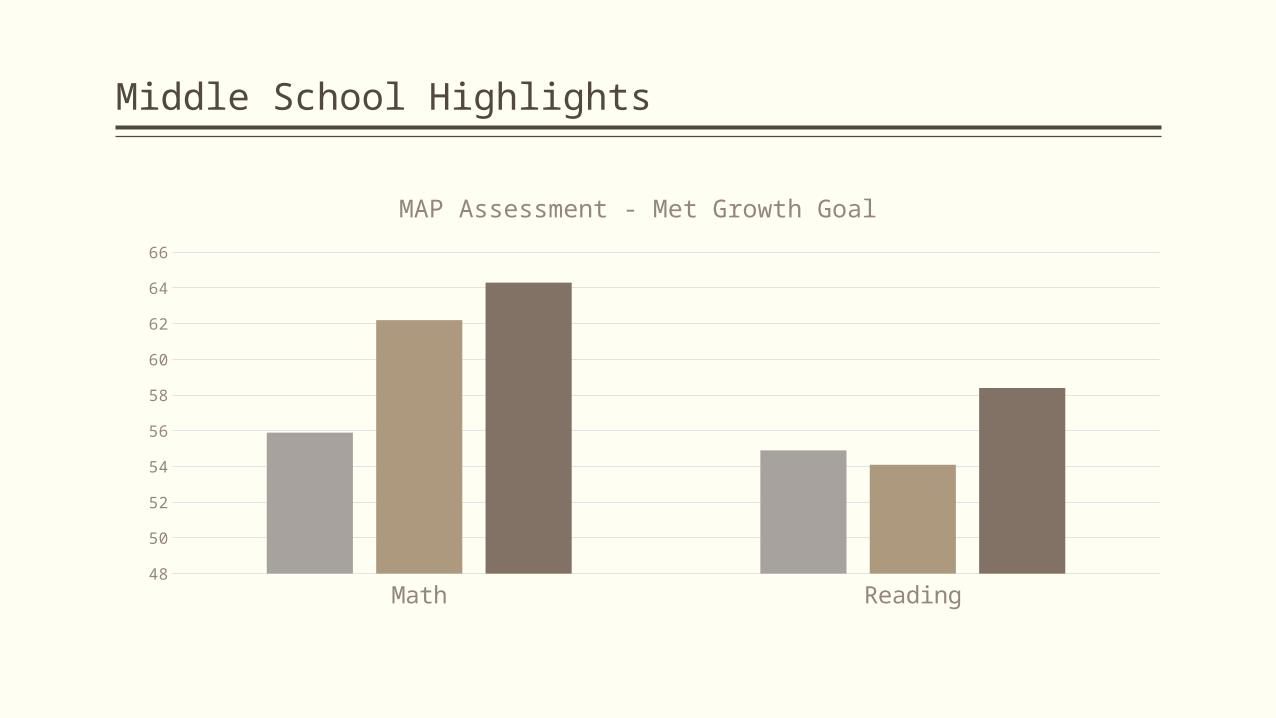
Middle School Highlights
Math Reading48
50
52
54
56
58
60
62
64
66
MAP Assessment - Met Growth Goal
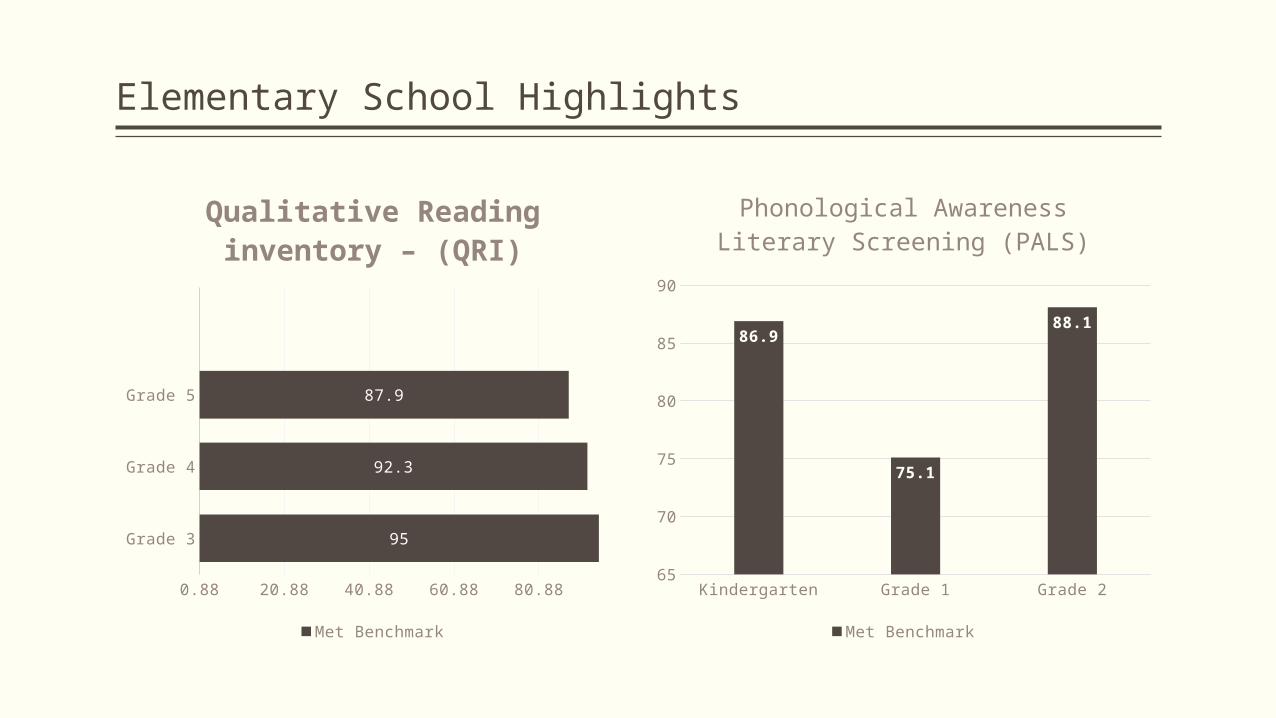
Elementary School Highlights
Grade 3
Grade 4
Grade 5
0.88 20.88 40.88 60.88 80.88
95
92.3
87.9
Qualitative Reading inventory – (QRI)
Met Benchmark
Kindergarten Grade 1 Grade 265
70
75
80
85
90
86.9
75.1
88.1
Phonological Awareness Lit-erary Screening (PALS)
Met Benchmark

FINE ARTS
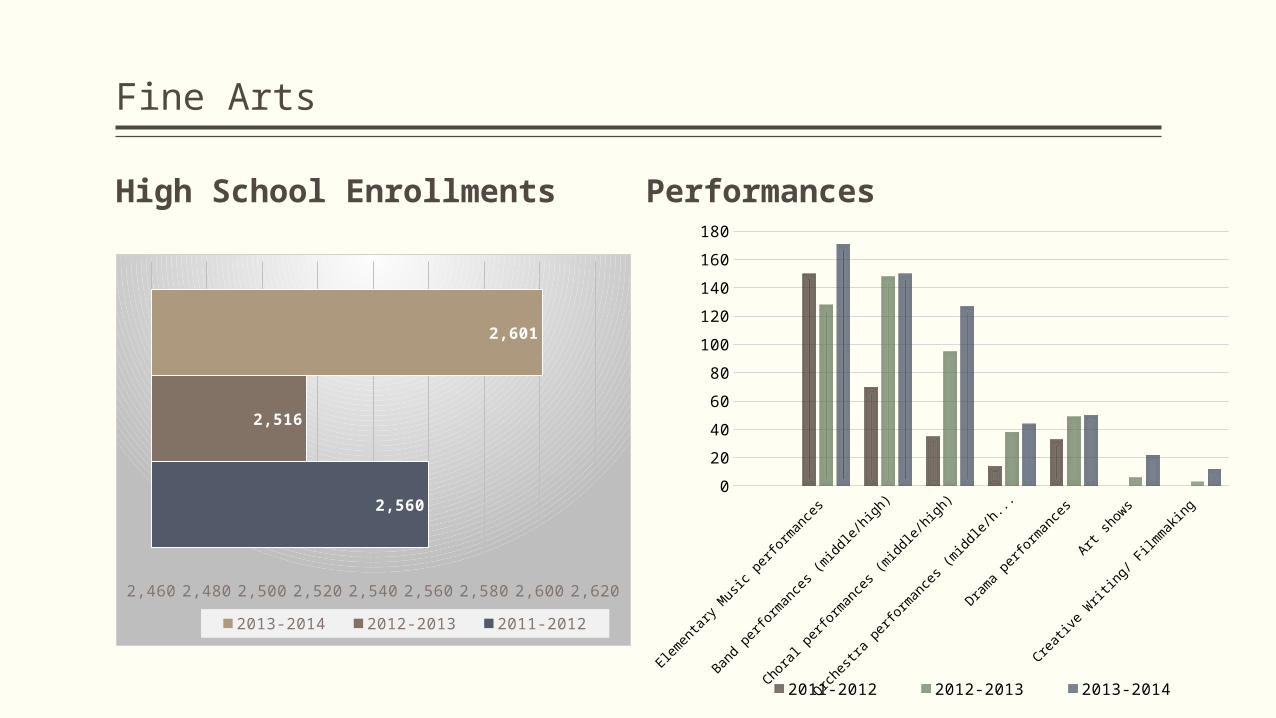
Fine Arts
High School Enrollments
2,460 2,480 2,500 2,520 2,540 2,560 2,580 2,600 2,620
2,560
2,516
2,601
2013-2014 2012-2013 2011-2012
Performances
Elem
enta
ry M
usic p
erfo
rman
ces
Band
perfo
rman
ces (m
iddl
e/hi
gh)
Chora
l per
form
ance
s (m
iddl
e/hi
gh)
Orche
stra
per
form
ance
s (m
iddl
e/hi
gh)
Dram
a pe
rform
ance
s
Art sh
ows
Creat
ive
Writ
ing/
Film
mak
ing
0
20
40
60
80
100
120
140
160
180
2011-2012 2012-2013 2013-2014

CAREER AND TECHNICAL EDUCATION

Secondary Enrollments in Career and Technical Courses
Tech
nology
Edu
catio
n
Busin
ess an
d In
form
ation
Tech
nology
Health
and
Med
ical S
cien
ces
Mar
ketin
g
Trad
e an
d In
dust
rial E
duca
tion
Care
er C
onne
ctions
Milit
ary
Scienc
e
Fam
ily a
nd C
onsu
mer
Scien
ces
0
200
400
600
800
1000
1200
High School
2011-12 2012-13 2013-14
Technology Education
Business and Information Technology
Family and Consumer Sciences
0 200 400 600 800 10001200
Middle School
2013-14 2012-13 2011-12

GIFTED EDUCATION
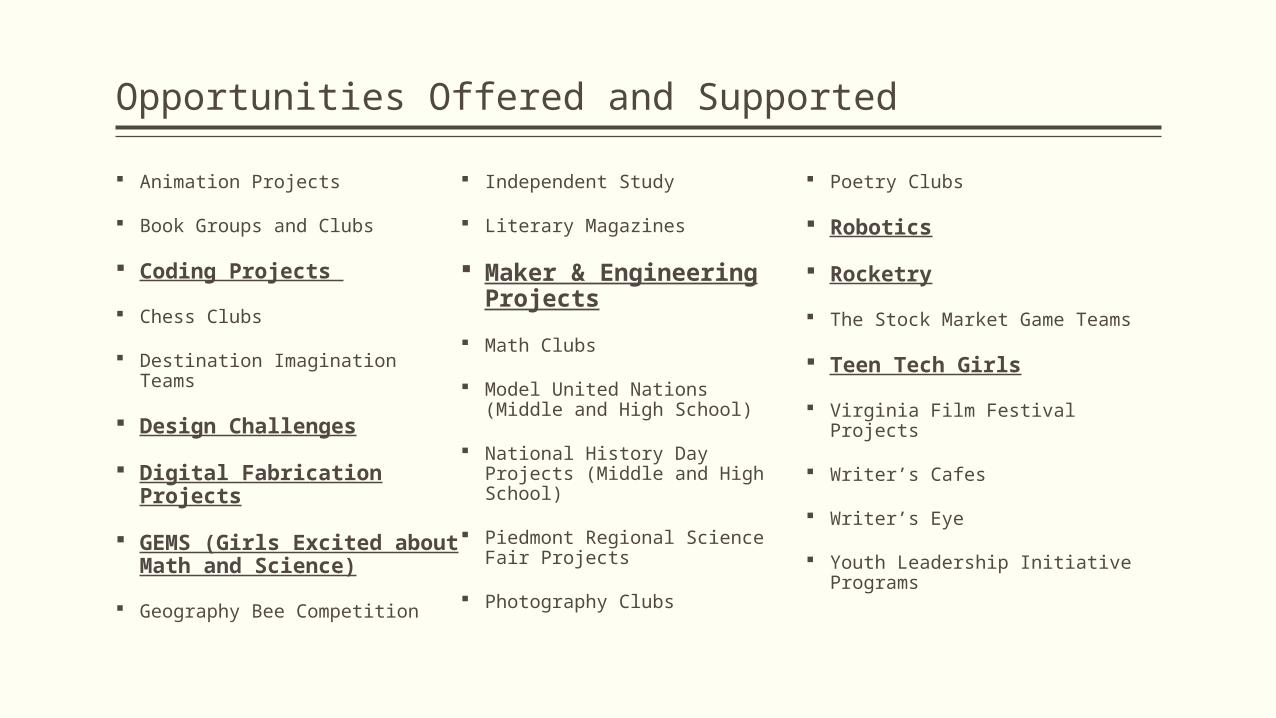
Opportunities Offered and Supported
Animation Projects
Book Groups and Clubs
Coding Projects
Chess Clubs
Destination Imagination Teams
Design Challenges
Digital Fabrication Projects
GEMS (Girls Excited about Math and Science)
Geography Bee Competition
Independent Study
Literary Magazines
Maker & Engineering Projects
Math Clubs
Model United Nations (Middle and High School)
National History Day Projects (Middle and High School)
Piedmont Regional Science Fair Projects
Photography Clubs
Poetry Clubs
Robotics
Rocketry
The Stock Market Game Teams
Teen Tech Girls
Virginia Film Festival Projects
Writer’s Cafes
Writer’s Eye
Youth Leadership Initiative Programs
PROGRAMS AND ACTIVITIES

Student Activities
AHS MOHS WAHS 0
50
100
150
200
250
202
110
192
239
140
192
Spring Athletic Partic-ipation
Female Male
Division-wide art show for Youth Art Month
Inaugural Summer Fine Arts Academy
Spelling Bee
Writer's Eye
Literacy Explosion
24 Competition
Math Counts
Math Olympiad
Meaningful Watershed Educational Experience (MWEE)

THE FUTURE OF ASSESSMENTS
COLLEGE WORKFORCE READINESS ASSESSMENT
Administered 2013

2012-2013 College Workforce Readiness Assessment
AHS MoHS WAHS
1143
1078
1046
1099
995
1020
Expected Mean Score Actual Mean Score

PERFORMANCE ASSESSMENT BASELINE
The Future of Assessment

Progression of CAI Roll-Out
2011 Mapped the assessment to the LLC
2012 Wrote assessment tasks and vertical team piloted in schools
2013 Revised assessment tasks through vertical teams
2014 We scored student work.
2015 School teams will be reporting by student
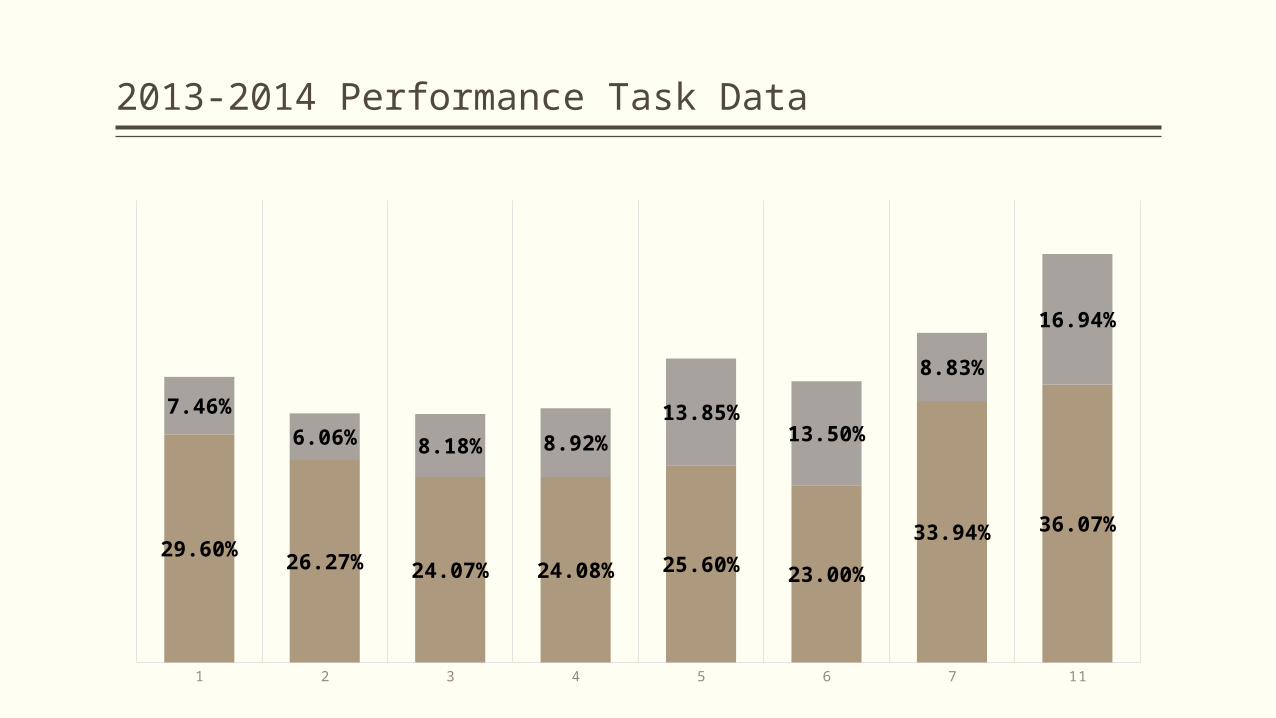
2013-2014 Performance Task Data
1 2 3 4 5 6 7 11
29.60%26.27% 24.07% 24.08% 25.60% 23.00%
33.94% 36.07%
7.46%
6.06% 8.18% 8.92%
13.85%13.50%
8.83%
16.94%
Proficient Exemplary
QUESTIONS?
Related Documents