2009 The State of Agricultural Commodity Markets High food prices and the food crisis – experiences and lessons learned

Welcome message from author
This document is posted to help you gain knowledge. Please leave a comment to let me know what you think about it! Share it to your friends and learn new things together.
Transcript
2009The State of
Agricultural Commodity MarketsHigh food prices and the food crisis – experiences and lessons learned

Key messages
1 In June 2008, the prices of basic foods on international markets reached their highest levels for 30 years, threatening the food security of the poor worldwide. In 2007 and 2008, mainly because of high food prices, an additional 115 million people were pushed into chronic hunger.
2 Since then, prices have declined, driven lower by the financial crisis, emerging world recession, falling oil prices and an appreciating US dollar. However, they are still high by recent historical standards and the structural problems underlying the vulnerability of developing countries to international price increases remain.
3 Many factors contributed to the dramatic increase in world food prices, but new biofuel demands and record oil prices were the major drivers, leading some analysts to ask whether new linkages between food and energy markets have broken the long-run downward trend in real agricultural commodity prices.
4 High product prices did not prove to be an opportunity for farmers in developing countries. They did not seize that opportunity to invest and raise their production and productivity because the high prices did not filter through to them, their access to affordable inputs was limited, their available technology was weak, necessary infrastructure and institutions were lacking and some policy responses (such as price controls and tariff reductions) actually reduced incentives.
5 The need to protect consumers from higher food prices must be balanced against maintaining incentives for productivity-raising investment and supply response. Policy measures need to be targeted, non-distortionary and positive towards agricultural investment.
6 Many developing countries need international support to overcome budgetary constraints and to identify and implement appropriate policies. Developed countries also need to consider the impacts of their agriculture, trade and energy policies on international food prices and availability.

2009The State of
Agricultural Commodity MarketsHigh food prices and the food crisis – experiences and lessons learned
Produced by the Electronic Publishing Policy and Support BranchKnowledge and Communication DepartmentFAO
The designations employed and the presentation of material in this information product do not imply the expression of any opinion whatsoever on the part of the Food and Agriculture Organization of the United Nations (FAO) concerning the legal or development status of any country, territory, city or area or of its authorities, or concerning the delimitation of its frontiers or boundaries. The mention of specific companies or products of manufacturers, whether or not these have been patented, does not imply that these have been endorsed or recommended by FAO in preference to others of a similar nature that are not mentioned.
ISBN 978-92-5-106280-7
All rights reserved. Reproduction and dissemination of material in this information product for educational or other non-commercial purposes are authorized without any prior written permission from the copyright holders provided the source is fully acknowledged. Reproduction of material in this information product for resale or other commercial purposes is prohibited without written permission of the copyright holders. Applications for such permission should be addressed to the Chief, Electronic Publishing Policy and Support Branch, Communication Division, FAO, Viale delle Terme di Caracalla, 00153 Rome, Italy or by e-mail to [email protected]
© FAO 2009
Copies of FAO publications can be requested from:Sales and Marketing GroupCommunication DivisionFood and Agriculture Organization of the United NationsE-mail: [email protected]: (+39) 06 57053360Web site: www.fao.org/icatalog/inter-e.htm
Note: Unless otherwise stated, data for China also include those for Taiwan Province of China, Hong Kong Special Administrative Region and Macao Special Administrative Region.
Cover photos (from top to bottom):
© FAO/Roberto Faidutti
© FAO/Giuseppe Bizzarri
© FAO/KCII
© FAO/Giuseppe Bizzarri
© FAO/Giulio Napolitano
AcknowledgementsThe State of Agricultural Commodity Markets 2009 was written by a team of staff from the Trade and Markets Division of FAO, led by David Hallam.
The report was prepared under the overall guidance of Hafez Ghanem, Assistant Director General of FAO’s Economic and Social Development Department, and Alexander Sarris, Director of the Trade and Markets Division.
Acknowledgement is given to the overall contribution of Pedro Arias and to the particular contributions of Adam Prakash on trends and volatility in agricultural commodity prices, Abdolreza Abbassian on cereal prices, Josef Schmidhuber on biofuels, Hansdeep Khaira on speculation, Merritt Cluff and Holger Matthey on the outlook for commodity prices, George Rapsomanikis on price transmission, Jamie Morrison on supply-side constraints and supply response, Liliana Balbi, Ramesh Sharma and Manitra Rakotoarisoa on policy responses and Alexander Sarris on financing arrangements for food imports.
The report benefited from detailed review and comment by colleagues throughout the FAO Economic and Social Development Department. Special mention should be made of the contributions of Hafez Ghanem, Alexander Sarris, Marcela Villarreal, Keith Wiebe, Josef Schmidhuber, Jelle Bruinsma, Kostas Stamoulis, David Marshall, Hiek Som, Henri Josserand and Abdolreza Abbassian.
4 About this report
6 Foreword
8 Part 1. What happened to world food prices and why?
9 World food price inflation in 2007–0815 Why did food prices increase so much?26 The impacts of high food prices
30 Part 2. Why were high food prices not an opportunity for poor farmers?
31 Do world price increases reach developing country producers?35 Prices increased but so did costs36 Supply-side constraints
38 Part 3. What should the policy response be?
39 What are the policy problems?40 How have developing countries responded?42 What policy measures should be taken?47 The need for international action
54 Annex
54 Table 1. Policy responses to rising commodity prices in selected countries58 Table 2. Trends in real commodity prices59 Table 3. Monthly commodity prices, nominal terms61 Further reading and information
62 FAO Trade and Markets Division publications, 2006–08
The State of Agricultural Commodity Markets 2009 3
Contents
The State of Agricultural Commodity Markets 2009 4
About this report
I n the second half of 2006, world prices of most major food commodities began to climb. By the
first half of 2008, international US dollar prices of cereals had reached their highest levels in almost 30 years, threatening the food security of the poor worldwide and provoking widespread international concern over an apparent world food crisis. While the second half of 2008 saw a rapid fall in international food prices as oil prices tumbled and the financial crisis and global recession reduced demand, prices are well above the levels seen in recent years and are expected to remain so. Many poor consumers still face high or rising food prices. Furthermore, while international food prices may have fallen, many of the adverse supply and market conditions remain unchanged. The fall in prices was not caused by any widespread expansion in food availability. In most developing countries, there was no positive supply response to high food prices. Therefore, it is timely to review what happened and why, and to consider what lessons (especially for policy) might be learned.
While the broad facts of the “soaring food prices” episode may be well known, questions remain concerning the relative importance of the various factors suggested as being responsible, whether new developments have led to a fundamental change in market behaviour, and whether high prices might be expected to be the norm from now on. How governments and the international community should respond depends on the answers to these questions. Furthermore, while the dramatic price increases and the plight of poor consumers dominated the world’s media, the impact on poor agricultural producers attracted far less attention. Following years of low agricultural product prices, high prices should have been an opportunity for
poor producers to improve their incomes and an incentive to increase their output for the benefit of all. Why was this apparently not so?
The State of Agricultural Commodity Markets 2009 begins by reviewing the nature of price increases on world markets and how these become higher food prices for individual consumers and agricultural producers. Agricultural commodity prices have always been highly variable, but around a long-run downward trend. However, some commentators and analysts have suggested that there are now new factors at work, especially the expansion of biofuel production, that mean that food prices will not return to their historical trend. As yet, the available evidence is not conclusive, although some market fundamentals could indeed suggest the end of so-called “cheap food”. What those features are and how they have influenced food prices are looked at in some detail.
Particular attention is focused on the extent to which the different explanations – biofuel demand, record oil prices and increasing food demand arising from rapid economic growth in China and India – can account for the sudden food price inflation witnessed around the world and on what the role was of the traditional market drivers such as low stock levels or weather-related supply shortfalls. The questions of whether the situation was exacerbated by inflows of speculative funds or policy measures introduced by governments are also discussed. In practice, while biofuel demand and high oil prices arguably had the major impact, all of these factors played some role and interacted to produce the jump in food prices. Several of these factors are likely to have a persistent effect, so a return of food prices to their previous levels is unlikely in the short term.
The State of Agricultural Commodity Markets 2009 assembles the evidence on

The State of Agricultural Commodity Markets 2009 5
the impacts of high food prices. The negative food security impact of higher food prices is greatest on developing country poor consumers, who include many of the rural poor. Many developing and least-developed countries are food importers and have seen their annual food import bills more than double since 2000. Where they are also dependent on imported oil (which was also at record prices) and have existing high levels of undernourishment, their situation has been especially precarious. On the positive side, higher food prices should enable producers to invest in raising productivity and production. However, as The State of Agricultural Commodity Markets 2009 explains, whether high food prices can be turned into an opportunity for producers in developing countries depends on their ability to respond. This is far from guaranteed. The prices of key inputs such as energy and fertilizer increased along with product prices – sometimes faster – so the incentive to produce more actually weakened. Furthermore, the capacity to produce more is limited for developing country smallholders with weak technology and limited access to inputs. High food prices do not appear to have led to any significant supply response from the vast majority of developing country producers.
How to help producers to produce more is one policy problem facing governments in developing countries. How to ensure consumers have access to food at affordable prices is a more immediate one. In most cases, understandably in view of the social unrest that high food prices provoked, the policy measures introduced focused on the immediate short-term food security problems by attempting to slow price increases and increase food availability. The medium- and long-term needs to support producers were neglected, and some of the short-term measures – notably trade measures –
were likely to have a negative impact. The State of Agricultural Commodity Markets 2009 concludes with a review of the policy options available to governments and an appraisal of how developing countries have responded to the high food prices. It calls for complementarity and consistency between targeted measures introduced to address immediate emergencies and longer-term measures to address the strategic need for long-run food security. However, it recognizes the difficulties some developing countries face in making the right policy choices and in putting effective policies into practice. They simply cannot afford to ensure food supplies for the poor, meet higher food import bills and reverse, overnight, years of neglect of their agriculture sectors. The international support that has been building is urgently needed to provide technical and policy assistance and, as the “right” policies tend to cost more, additional budgetary resources.
The State of Agricultural Commodity Markets 2009 aims to bring to a wider public an accessible discussion of agricultural commodity market issues and related policy matters. Although the findings and conclusions presented rely on recent technical analyses by FAO specialists in commodity and trade issues, this is not an overly technical report. Rather, it seeks to provide an objective and straightforward treatment of what are at times complicated economic issues for policy-makers, commodity market observers and all those interested in agricultural commodity market developments and their impact on developing countries.
The State of Agricultural Commodity Markets 2009 6
Foreword
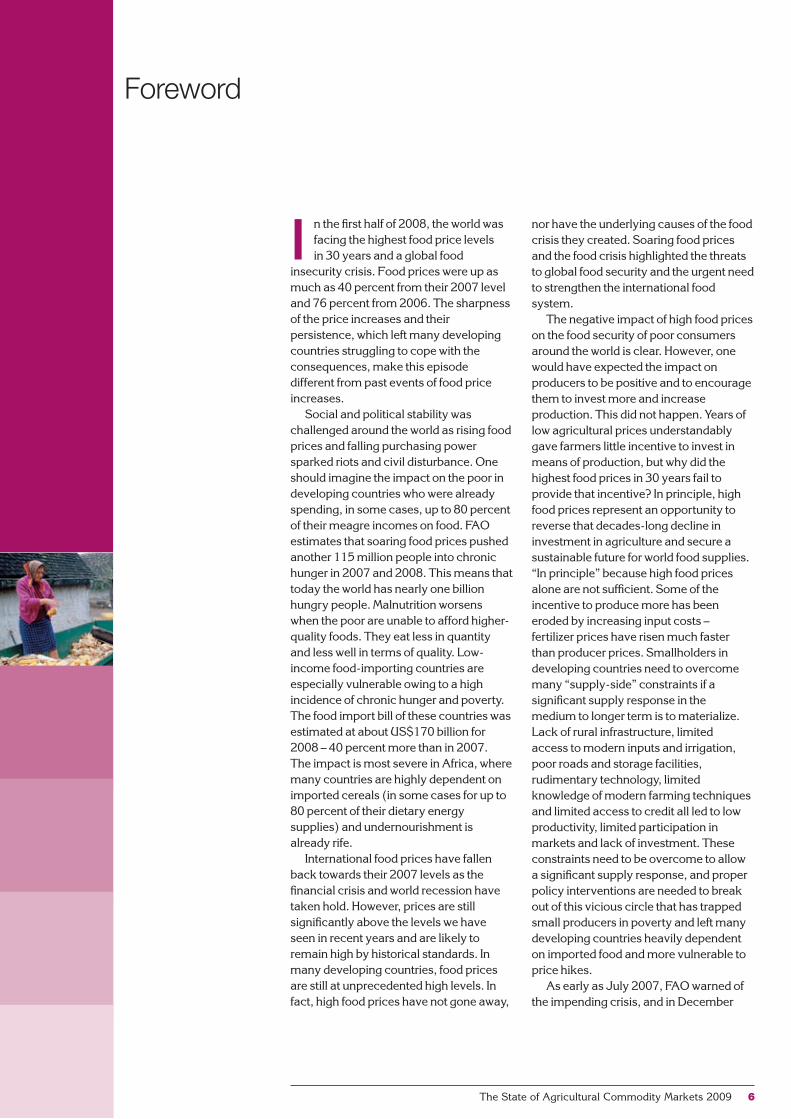
I n the first half of 2008, the world was facing the highest food price levels in 30 years and a global food
insecurity crisis. Food prices were up as much as 40 percent from their 2007 level and 76 percent from 2006. The sharpness of the price increases and their persistence, which left many developing countries struggling to cope with the consequences, make this episode different from past events of food price increases.
Social and political stability was challenged around the world as rising food prices and falling purchasing power sparked riots and civil disturbance. One should imagine the impact on the poor in developing countries who were already spending, in some cases, up to 80 percent of their meagre incomes on food. FAO estimates that soaring food prices pushed another 115 million people into chronic hunger in 2007 and 2008. This means that today the world has nearly one billion hungry people. Malnutrition worsens when the poor are unable to afford higher- quality foods. They eat less in quantity and less well in terms of quality. Low-income food-importing countries are especially vulnerable owing to a high incidence of chronic hunger and poverty. The food import bill of these countries was estimated at about US$170 billion for 2008 – 40 percent more than in 2007. The impact is most severe in Africa, where many countries are highly dependent on imported cereals (in some cases for up to 80 percent of their dietary energy supplies) and undernourishment is already rife.
International food prices have fallen back towards their 2007 levels as the financial crisis and world recession have taken hold. However, prices are still significantly above the levels we have seen in recent years and are likely to remain high by historical standards. In many developing countries, food prices are still at unprecedented high levels. In fact, high food prices have not gone away,
nor have the underlying causes of the food crisis they created. Soaring food prices and the food crisis highlighted the threats to global food security and the urgent need to strengthen the international food system.
The negative impact of high food prices on the food security of poor consumers around the world is clear. However, one would have expected the impact on producers to be positive and to encourage them to invest more and increase production. This did not happen. Years of low agricultural prices understandably gave farmers little incentive to invest in means of production, but why did the highest food prices in 30 years fail to provide that incentive? In principle, high food prices represent an opportunity to reverse that decades-long decline in investment in agriculture and secure a sustainable future for world food supplies. “In principle” because high food prices alone are not sufficient. Some of the incentive to produce more has been eroded by increasing input costs – fertilizer prices have risen much faster than producer prices. Smallholders in developing countries need to overcome many “supply-side” constraints if a significant supply response in the medium to longer term is to materialize. Lack of rural infrastructure, limited access to modern inputs and irrigation, poor roads and storage facilities, rudimentary technology, limited knowledge of modern farming techniques and limited access to credit all led to low productivity, limited participation in markets and lack of investment. These constraints need to be overcome to allow a significant supply response, and proper policy interventions are needed to break out of this vicious circle that has trapped small producers in poverty and left many developing countries heavily dependent on imported food and more vulnerable to price hikes.
As early as July 2007, FAO warned of the impending crisis, and in December
The State of Agricultural Commodity Markets 2009 7
2007 it launched an Initiative on Soaring Food Prices, known as the ISFP, initially funded from FAO’s own resources to boost food production quickly by facilitating small farmers’ access to seeds, fertilizers, animal feed and other farming tools and supplies. This initiative should catalyze support from donors, financial institutions and national governments to improve the provision of inputs on a much larger scale. Countries most affected by the crisis, especially in sub-Saharan Africa, need at least US$1.7 billion now to revive agriculture that has been neglected for decades.
Soaring food prices and the consequent food crisis are matters of international concern that require international action. They were the main focus of attention at the FAO High-Level Conference (HLC) on World Food Security held in Rome in June 2008, which brought together governments, international organizations, donors, non-governmental organizations, the private sector and civil society to discuss what should be done. The HLC saw the participation of 181 countries, including 43 Heads of State or Government and more than 100 Ministers. The declaration adopted unanimously by the HLC has clearly indicated the need to increase production in the developing countries and boost investment in the agriculture sector.
Furthermore, and as expressed recently in several fora, including the HLC, the G8 Summit in Japan in July 2008 and the Special Session of the FAO Conference last November, there is an urgent need to strengthen the governance of world food security. An improved system is needed to prevent international food crises and help develop and implement the required policies at national, regional and international levels. In addition, rules and mechanisms need to be devised to ensure not only free but also fair trade in agricultural products – a system that offers farmers in both developed and developing countries the
means of earning a decent income that is comparable with their fellow citizens in the secondary and tertiary sectors.
The technical knowledge of how to eradicate hunger from the world and to double world food production by 2050 to feed a population of nine billion is available. The time to move from talk to action has come. We urgently need to forge an international consensus on the rapid and final eradication of hunger and a plan of action.
The twin-track approach advanced by FAO in its Anti-Hunger Programme remains valid – making food accessible to the most vulnerable, and simultaneously helping small producers to raise their output and increase their income. Affordable food supplies need to be made available for poor consumers to avoid increasing the incidence of malnutrition. Some countries already have safety net mechanisms in place, others need to establish them and may need international assistance to do so. The experience of high food prices resulted in the widespread recognition that the structural solution to the problem of food insecurity in the world lies in increasing production and productivity in the developing world, notably in low-income and food-deficit countries. Investments need to be boosted significantly and sustainably for improved productivity and increased food production. Supply-side constraints need to be overcome across the board and appropriate policies and institutions need to provide a conducive environment for a supply response to exist. Without these in place, investments in agriculture will not be forthcoming.
In addition to its direct support through the ISFP, FAO is also playing its part in helping countries define and implement appropriate policy responses. All these activities are underpinned and guided by thorough and up-to-date economic analyses of food price movements, their impacts on consumers and producers and the alternative policy responses. Much of
this work is presented in this new edition of The State of Agricultural Commodity Markets. It provides a comprehensive review based on research by FAO specialists of the issues surrounding the soaring food prices and their consequences. It explains why food prices increased and what steps developing countries and the international community need to take in order to ensure that high food prices are turned into an opportunity for developing country farmers to help safeguard world food supplies at affordable prices.
Jacques DioufFAO Director-General

Part 1 What happened to world food prices and why?
The State of Agricultural Commodity Markets 2009 8
The State of Agricultural Commodity Markets 2009 9
World food price inflation in 2007–08
T he upturn in international food prices that began in 2006 escalated into a surge of food price inflation around
the world, increasing food insecurity, leading to violent protests and even raising fears about international security. Africa was perhaps hardest hit, but the problem was global. Reports of the impact of high food prices on the poor across many developing countries led to calls for international action to reverse the slide towards increased poverty and malnutrition. Food aid agencies such as the World Food Programme (WFP) encountered difficulties in meeting the higher costs of purchasing food for distribution and appealed for additional funds.
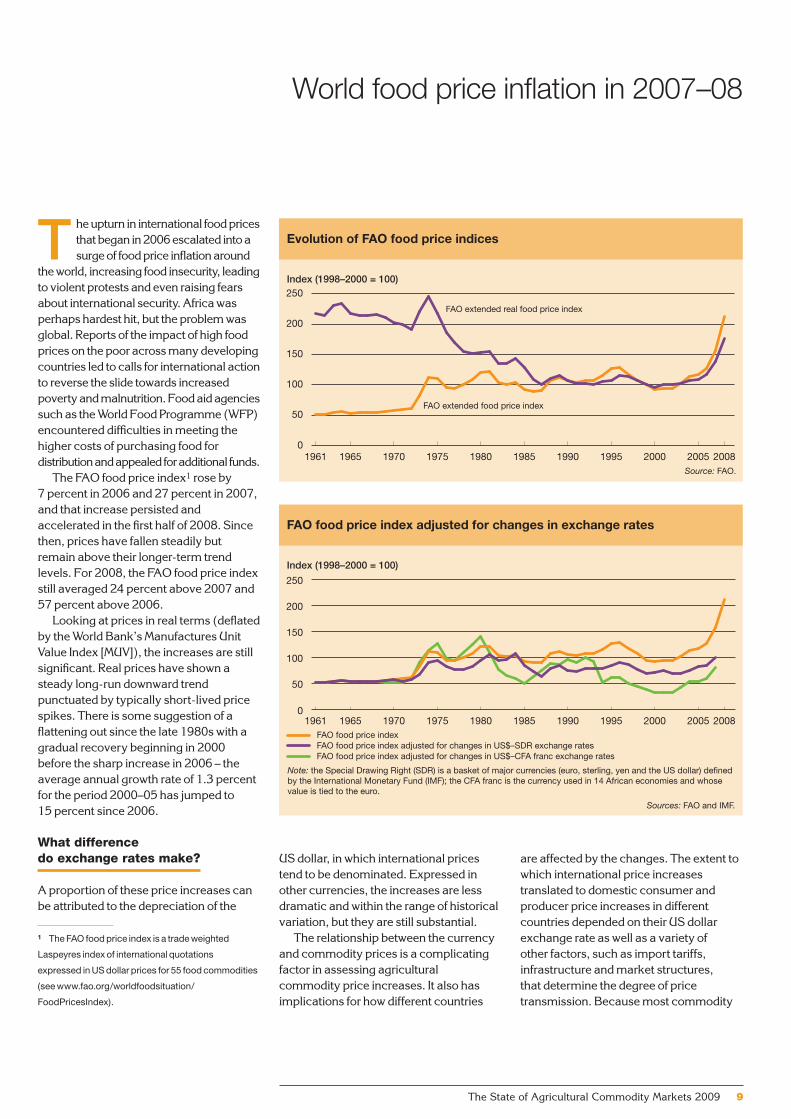
The FAO food price index1 rose by 7 percent in 2006 and 27 percent in 2007, and that increase persisted and accelerated in the first half of 2008. Since then, prices have fallen steadily but remain above their longer-term trend levels. For 2008, the FAO food price index still averaged 24 percent above 2007 and 57 percent above 2006.
Looking at prices in real terms (deflated by the World Bank’s Manufactures Unit Value Index [MUV]), the increases are still significant. Real prices have shown a steady long-run downward trend punctuated by typically short-lived price spikes. There is some suggestion of a flattening out since the late 1980s with a gradual recovery beginning in 2000 before the sharp increase in 2006 – the average annual growth rate of 1.3 percent for the period 2000–05 has jumped to 15 percent since 2006.
What difference do exchange rates make?
A proportion of these price increases can be attributed to the depreciation of the
1 The FAO food price index is a trade weighted
Laspeyres index of international quotations
expressed in US dollar prices for 55 food commodities
(see www.fao.org/worldfoodsituation/
FoodPricesIndex).
Evolution of FAO food price indices
Index (1998–2000 = 100)
0
50
100
150
200
250
200820052000Source: FAO.
19951990198519801975197019651961
FAO extended food price index
FAO extended real food price index
FAO food price index adjusted for changes in exchange rates
Index (1998–2000 = 100)
0
50
100
150
200
250
200820052000
Sources: FAO and IMF.
Note: the Special Drawing Right (SDR) is a basket of major currencies (euro, sterling, yen and the US dollar) defined by the International Monetary Fund (IMF); the CFA franc is the currency used in 14 African economies and whose value is tied to the euro.
19951990198519801975197019651961FAO food price indexFAO food price index adjusted for changes in US$–SDR exchange ratesFAO food price index adjusted for changes in US$–CFA franc exchange rates
US dollar, in which international prices tend to be denominated. Expressed in other currencies, the increases are less dramatic and within the range of historical variation, but they are still substantial.
The relationship between the currency and commodity prices is a complicating factor in assessing agricultural commodity price increases. It also has implications for how different countries
are affected by the changes. The extent to which international price increases translated to domestic consumer and producer price increases in different countries depended on their US dollar exchange rate as well as a variety of other factors, such as import tariffs, infrastructure and market structures, that determine the degree of price transmission. Because most commodity

Wha
t hap
pene
d to
wor
ld fo
od p
rices
and
why
?
The State of Agricultural Commodity Markets 2009 10
prices are commonly expressed in US dollars, depreciation in the value of the US dollar reduces the cost of commodities for countries whose currencies are stronger than the US dollar, resulting in a cushioning of food price increases to a greater or lesser extent. However, for countries whose local currencies are pegged to or are weaker than the US dollar, depreciation in the US dollar increases the cost of procuring food. More than 30 developing countries peg their currency to the US dollar.
Did the prices of all agricultural commodities increase in the same way?
While almost all agricultural product prices increased at least in nominal terms, the rate of increase varied significantly
from one commodity to another. In particular, international prices of basic foods, such as cereals, oilseeds and dairy products, increased far more dramatically than the prices of tropical products, such as coffee and cocoa, and raw materials, such as cotton or rubber. Therefore, developing countries dependent on exports of these latter products found that while their export earnings might have been increasing this was at a slower rate than the cost of their food imports. As many developing countries are net food importers, this imposed a serious balance of payments problem.
What was different about the 2007–08 food price increases?
The leap in food prices was in sharp contrast to the secular downward trend
Evolution of monthly FAO price indices for basic food commodity groups
Index (2002–04 = 100)
Source: FAO.
50
100
150
200
250
300
2008200620042002200019981996199419921990
SugarMeat
Cereals OilsDairy
Evolution of prices for tropical export crops
Price
Source: FAO.Note: Rice and wheat prices in US$/tonne; cocoa and coffee prices in US cents/pound.
Rice CoffeeWheat Cocoa
0
200
400
600
800
2008200620042002200019981996199419921990
The State of Agricultural Commodity Markets 2009 11
and the prolonged slump in commodity prices from 1995 to 2002, which even prompted calls for the revival of international commodity agreements. For some analysts, the increases signalled the end of the long-term decline in real agricultural commodity prices, with The Economist (2007) announcing “the end of cheap food”. Others saw the beginnings of a potential world food crisis. It is an interesting question whether these sharp increases are fundamentally different from earlier price spikes and whether the long-term decline in real prices could have come to a halt, signalling a fundamental change in agricultural commodity market behaviour. High-price events, like low-price events, are not rare occurrences in agricultural markets, although high prices often tend to be short-lived compared with low prices, which persist for longer periods. What has distinguished this episode was the concurrence of the hike in world prices of not just a few but of nearly all major food and feed commodities and the possibility that the prices may remain high after the effects of short-term shocks dissipate.
The price boom was also accompanied by much higher price volatility2 than in the past, especially in the cereals and oilseeds sectors, highlighting the greater uncertainty in the markets. In the first four months of 2008, volatility in wheat and rice prices approached record highs (volatility in wheat prices was twice the level of the previous year while rice price volatility was five times higher). The increase in volatility was not confined to cereals – vegetable oils, livestock products and sugar all witnessed much larger price swings than in the recent past. High volatility means uncertainty, which complicates decision-making for buyers
and sellers. Greater uncertainty limits opportunities for producers to access credit markets and tends to result in the adoption of low-risk production technologies at the expense of innovation and entrepreneurship. In addition, the wider and more unpredictable the price changes in a commodity are, the greater is the possibility of realizing large gains by speculating on future price movements of that commodity. Thus, volatility can attract significant speculative activity, which in turn can initiate a vicious cycle of destabilizing cash prices. At the national level, many developing countries are still highly dependent on primary commodities, either in their exports or imports. While sharp price spikes can be a temporary boon to an exporter’s
economy, they can also heighten the cost of importing foodstuffs and agricultural inputs. At the same time, large fluctuations in prices can have a destabilizing effect on real exchange rates of countries, putting a severe strain on their economy and hampering their efforts to reduce poverty.
How does the 2007–08 high-price episode compare with past crises?
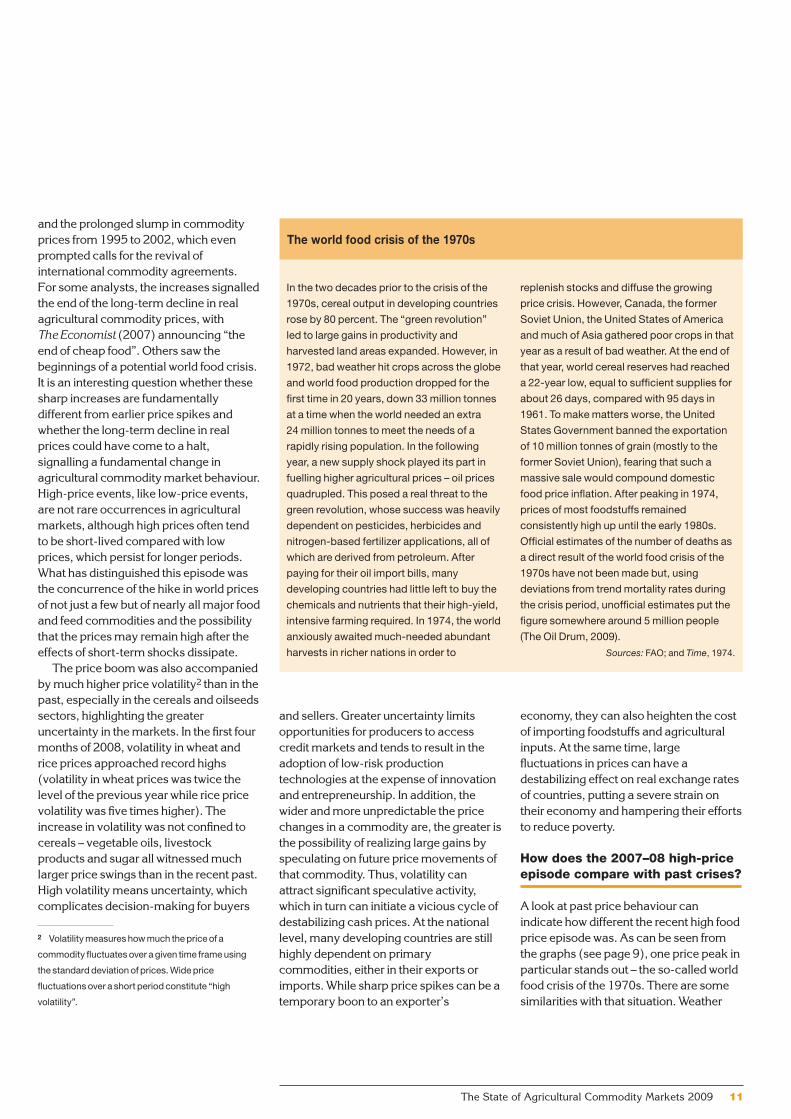
A look at past price behaviour can indicate how different the recent high food price episode was. As can be seen from the graphs (see page 9), one price peak in particular stands out – the so-called world food crisis of the 1970s. There are some similarities with that situation. Weather
2 Volatility measures how much the price of a
commodity fluctuates over a given time frame using
the standard deviation of prices. Wide price
fluctuations over a short period constitute “high
volatility”.
The world food crisis of the 1970s
In the two decades prior to the crisis of the
1970s, cereal output in developing countries
rose by 80 percent. The “green revolution”
led to large gains in productivity and
harvested land areas expanded. However, in
1972, bad weather hit crops across the globe
and world food production dropped for the
first time in 20 years, down 33 million tonnes
at a time when the world needed an extra
24 million tonnes to meet the needs of a
rapidly rising population. In the following
year, a new supply shock played its part in
fuelling higher agricultural prices – oil prices
quadrupled. This posed a real threat to the
green revolution, whose success was heavily
dependent on pesticides, herbicides and
nitrogen-based fertilizer applications, all of
which are derived from petroleum. After
paying for their oil import bills, many
developing countries had little left to buy the
chemicals and nutrients that their high-yield,
intensive farming required. In 1974, the world
anxiously awaited much-needed abundant
harvests in richer nations in order to
replenish stocks and diffuse the growing
price crisis. However, Canada, the former
Soviet Union, the United States of America
and much of Asia gathered poor crops in that
year as a result of bad weather. At the end of
that year, world cereal reserves had reached
a 22-year low, equal to sufficient supplies for
about 26 days, compared with 95 days in
1961. To make matters worse, the United
States Government banned the exportation
of 10 million tonnes of grain (mostly to the
former Soviet Union), fearing that such a
massive sale would compound domestic
food price inflation. After peaking in 1974,
prices of most foodstuffs remained
consistently high up until the early 1980s.
Official estimates of the number of deaths as
a direct result of the world food crisis of the
1970s have not been made but, using
deviations from trend mortality rates during
the crisis period, unofficial estimates put the
figure somewhere around 5 million people
(The Oil Drum, 2009).
Sources: FAO; and Time, 1974.

Wha
t hap
pene
d to
wor
ld fo
od p
rices
and
why
?
The State of Agricultural Commodity Markets 2009 12
and crude oil price shocks resulted in contractions in food production in the wake of rising food demand brought about by rapid population growth in developing countries. Even export restrictions featured, in the same vein as this time, as measures to contain domestic inflation. However, one big difference is that while the 1970s crisis was caused by supply-side shocks, demand factors (notably biofuel demand) were key to the 2007–08 episode and may have longer-lasting effects.
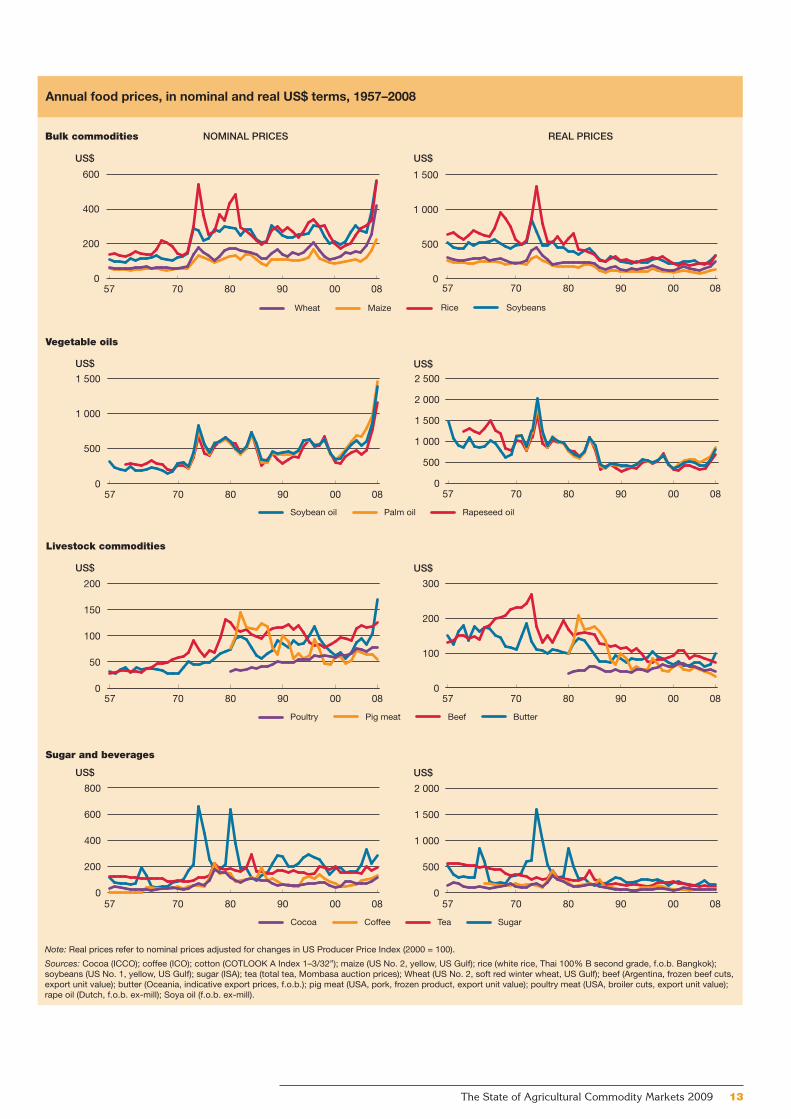
At the peak of the 1970s crisis, international quotations of rice and wheat rose to US$542 and US$180 per tonne, respectively. It would be tempting to conclude that, as prices in early 2008 far exceeded those witnessed in the 1970s, the world was facing a similar crisis. However, the purchasing power of the
US dollar today is fundamentally different from what it was in the 1970s. Looking at prices in real terms, a drastically different picture is revealed. At 2000 prices and exchange rates, for example, the cost of one tonne of rice in 1974 stood at well over four times the average over the first four months of 2008.
The end of “cheap food”?
Soaring food prices came as a shock partly because consumers throughout the world had become accustomed to the notion of so-called “cheap food”. Up until 2006, the real cost of the global food basket had fallen by almost one-half in the previous 30 years, with prices of many foodstuffs falling on average by 2–3 percent per year in real terms. Technological advances greatly reduced the cost of producing foodstuffs and this, together with widespread subsidies in countries of the Organisation for Economic Co-operation and Development (OECD) that rendered more efficient and cheaper production elsewhere unprofitable, entrenched the role of a few countries in supplying the world with food. This supply-driven agricultural paradigm sent real prices spiralling downward on a trend lasting for decades. Added to this, changes in the market and policy setting have been instrumental in reducing stock levels and have led to far more planned dependence on imports to meet food needs. Put together, these developments have resulted in a significant role for major exporting countries to supply international markets as needed. Therefore, it is not surprising that when production shortages occur in such countries, particularly in consecutive years, global supplies are stretched and the ensuing market tightness is manifest in both higher prices and higher volatility. This was precisely the case in the run-up to the recent price surge. Against this backdrop, the world’s growing demand for agricultural commodities, driven by rising global incomes and population and then expansion in biofuel production, left major exporters with little opportunity to replenish stocks.
Extreme price volatility for several commodities was another factor prompting fears of a wide-scale crisis. In a period of rising and protracted price
Agricultural commodity price spikes
A price spike is a pronounced sharp
increase in price above the trend value. For
practical purposes, a price spike can be
identified as an annual percentage change
that is more than two standard deviations
of the price in the five years preceding the
year that the percentage change is
calculated from. Using this definition, it is
possible to identify the years in which high-
price events for basic food commodities
(using the FAO food price index) occurred
during the 1961–2008 period. Checking
each year’s percentage change against
twice the standard deviation calculated as:
four distinct periods can be identified
where prices exhibited significant
increases: 1972–74, 1988, 1995 and the
current period. The only price events in
consecutive years are those that occurred
in the first and the last periods: three years
in a row in the first (1972, 1973 and 1974);
and two years in the last (2007 and 2008).
However, when the same methodology is
applied to the prices expressed in real
terms, only four years appear to have been
significant price event years: 1973, 1974,
2007 and 2008.
The State of Agricultural Commodity Markets 2009 13
Annual food prices, in nominal and real US$ terms, 1957–2008
Note: Real prices refer to nominal prices adjusted for changes in US Producer Price Index (2000 = 100).
Sources: Cocoa (ICCO); coffee (ICO); cotton (COTLOOK A Index 1–3/32”); maize (US No. 2, yellow, US Gulf); rice (white rice, Thai 100% B second grade, f.o.b. Bangkok); soybeans (US No. 1, yellow, US Gulf); sugar (ISA); tea (total tea, Mombasa auction prices); Wheat (US No. 2, soft red winter wheat, US Gulf); beef (Argentina, frozen beef cuts, export unit value); butter (Oceania, indicative export prices, f.o.b.); pig meat (USA, pork, frozen product, export unit value); poultry meat (USA, broiler cuts, export unit value); rape oil (Dutch, f.o.b. ex-mill); Soya oil (f.o.b. ex-mill).
Wheat Maize Rice Soybeans
US$
Bulk commodities NOMINAL PRICES
US$
US$
200
400
600
0800908070570
500
1 000
1 500
080090807057
US$
Soybean oil Palm oil Rapeseed oil
Vegetable oils
US$
0
500
1 000
1 500
0800908070570
500
1 000
1 500
2 000
2 500
080090807057
US$
Livestock commodities
Poultry Pig meat Beef Butter
US$
0
50
100
150
200
0
100
200
300
US$
080090807057 080090807057
Sugar and beverages
REAL PRICES
Cocoa Coffee Tea Sugar
0
200
400
600
800
0800908070570
500
1 000
1 500
2 000
080090807057
0

Wha
t hap
pene
d to
wor
ld fo
od p
rices
and
why
?
The State of Agricultural Commodity Markets 2009 14
volatility, it is quite difficult to distinguish between market instability and fundamentally higher price levels. Again, uncertainty as to just what was happening on international food markets added to fears of an impending crisis.
Does the recent high-price episode reflect a reversal in the trend of falling real prices or is it the case that the world was experiencing yet another spike, albeit a rather large one? Periods of excessive market turbulence do not necessarily result in a fundamental, permanent shift in the trajectory of prices. When they do so, economists describe the event as a “structural break”. Econometric techniques can be used to detect these structural breaks in agricultural commodity prices. Applying these techniques, even the price peaks for many foodstuffs in the crisis of the 1970s did not manifest themselves as structural breaks. After the worst of the crisis passed, prices simply resumed their preceding trend.
It is difficult to draw any firm conclusions regarding the recent price spike from the evidence to date, and econometric tests have so far failed to detect a structural break. Therefore, in order to answer the question as to whether the recent high-price episode is consistent with past commodity price behaviour of sharp but short-lived peaks and prolonged slumps or represents a break with past behaviour patterns, it is necessary to explore the nature of the apparent causes. Many different factors have been cited as responsible: production shortfalls, low stock levels, oil prices, biofuel demand,
growing incomes in emerging economies, depreciation of the US dollar and speculation. While it is difficult to determine their individual contributions quantitatively, some of these factors could have a persistent effect on the average level of prices. There are some features of the current situation, notably the historically low stock levels for cereals and strong demand for biofuels, that suggest that, in spite of the downward adjustments from the peak of early 2008, the recent high prices may well not be short-lived but could persist for some years.
After the rise, the fall – food prices now
Prices for most agricultural commodities have fallen significantly from the peaks reached in the first half of 2008. World grain prices have fallen by 50 percent and prices for other basic foods have followed. However, prices remain high by historical standards and are still above their 2007 levels. At the national level in many countries, but especially in Africa, prices remain substantially above 2007 levels. In some cases, the peaks in international prices reached in the first half of 2008 are still working their way through national markets.
FAO food price indices
Index (2002–04 = 100)
Source: FAO.
110
140
170
200
230
2008
2007
20062005
DNOSAJJMAMFJ
Food commodity price indices, 2007–2008
Index (2002–04 = 100)
Source: FAO.
100
150
200
250
300
350
DNOSAJJMAMFJD
DairyOils and fats
Cereals
Sugar
Meat

The State of Agricultural Commodity Markets 2009 15
A nalysts and commentators have emphasized different explanations for the leap in food
prices. The most popular is increased demand for certain agricultural products as feedstocks for biofuel production, particularly maize for ethanol. Record oil prices and environmental concerns strengthened interest in alternative energy
sources and policy measures in the United States of America, and the European Union (EU) encouraged the expansion of biofuel production. High oil prices also had a direct impact on the costs of agricultural production and prices. A third popular explanation is rapid economic growth in certain emerging economies, notably China and India, increasing
demand for food, especially for livestock products, which generated increased cereal and oilseed demand for feed. These explanations focus on “new” drivers in international agricultural commodity markets and suggest the possibility of a fundamental change in the behaviour of agricultural commodity prices and continuing high prices. “Traditional” explanations (see box on page 16) of high prices are also relevant – supply reductions as a result of drought in major exporters and the lowest cereal stock levels for more than 30 years. Various other complicating factors have also been cited as at least partial explanations of the high food prices. These include an inflow of speculative funds into agricultural commodity futures markets as the global financial downturn weakened more usual bond and equity markets. Once world prices began to rise significantly, the market and policy responses this provoked added to the inflationary pressure, e.g. hoarding against expectations of further price rises, and export restrictions.
In practice, all these factors contributed to pushing up food prices. It was the combination of them that was crucial. These were the immediate triggers of increasing food prices but were set against the background of the longer-term problems facing developing country agriculture – slowing growth in yields, lack of investment, declining share of agriculture in development aid, and declining funds for research and development – which not only exacerbated the food insecurity problem but also made it even more difficult for developing countries to deal with.
Production shortfalls and low stocks
Traditional explanations for food price variability emphasize the importance of exogenous shocks to agricultural supply, notably as a result of the weather.
Why did food prices increase so much?
Evolution of wheat ending stocks and stock-to-use ratios
Million tonnes Percentage
Source: FAO.Ending stocks Stock-to-use ratio
0
100
200
300
400
07/0805/0603/0401/0299/0097/9895/9693/9491/9289/9087/8885/8683/8481/8279/80
15
25
35
45
5
Evolution of coarse grains ending stocks and stock-to-use ratios
Million tonnes Percentage
Source: FAO.Ending stocks Stock-to-use ratio
07/0805/0603/0401/0299/0097/9895/9693/9491/9289/9087/8885/8683/8481/8279/800
100
200
300
400
0
9
18
27
36
Wha
t hap
pene
d to
wor
ld fo
od p
rices
and
why
?
The State of Agricultural Commodity Markets 2009 16
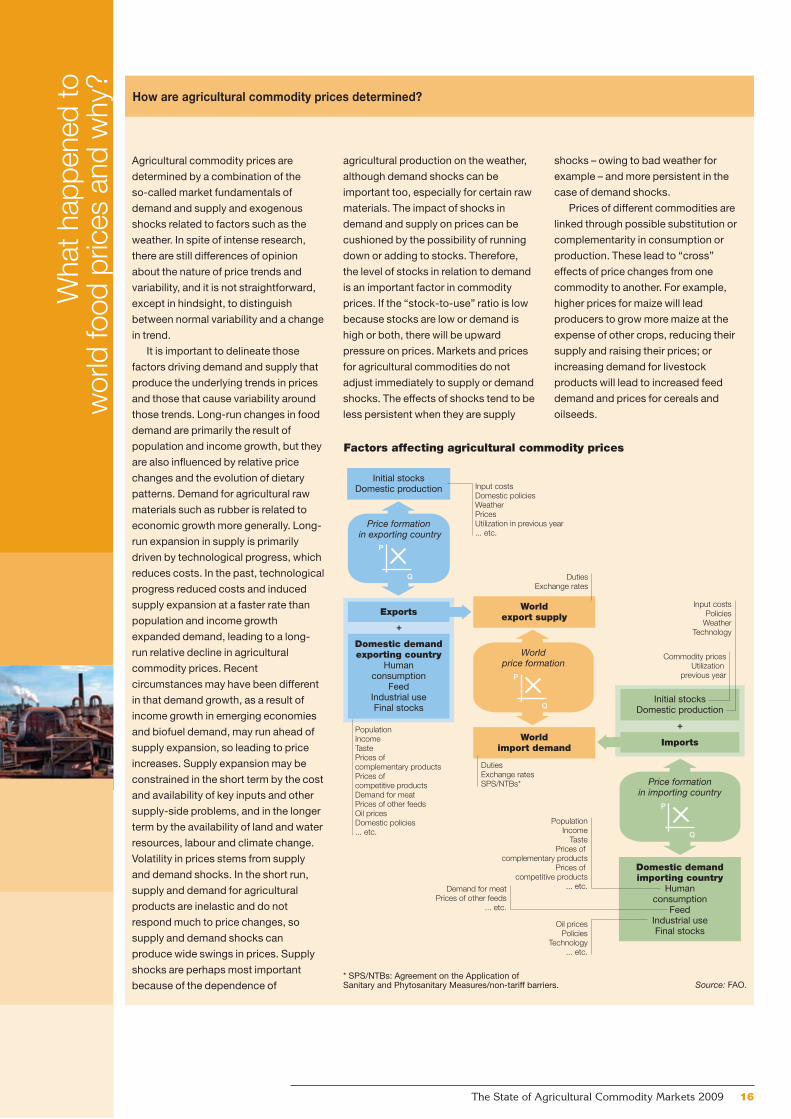
How are agricultural commodity prices determined?
Agricultural commodity prices are
determined by a combination of the
so-called market fundamentals of
demand and supply and exogenous
shocks related to factors such as the
weather. In spite of intense research,
there are still differences of opinion
about the nature of price trends and
variability, and it is not straightforward,
except in hindsight, to distinguish
between normal variability and a change
in trend.
It is important to delineate those
factors driving demand and supply that
produce the underlying trends in prices
and those that cause variability around
those trends. Long-run changes in food
demand are primarily the result of
population and income growth, but they
are also influenced by relative price
changes and the evolution of dietary
patterns. Demand for agricultural raw
materials such as rubber is related to
economic growth more generally. Long-
run expansion in supply is primarily
driven by technological progress, which
reduces costs. In the past, technological
progress reduced costs and induced
supply expansion at a faster rate than
population and income growth
expanded demand, leading to a long-
run relative decline in agricultural
commodity prices. Recent
circumstances may have been different
in that demand growth, as a result of
income growth in emerging economies
and biofuel demand, may run ahead of
supply expansion, so leading to price
increases. Supply expansion may be
constrained in the short term by the cost
and availability of key inputs and other
supply-side problems, and in the longer
term by the availability of land and water
resources, labour and climate change.
Volatility in prices stems from supply
and demand shocks. In the short run,
supply and demand for agricultural
products are inelastic and do not
respond much to price changes, so
supply and demand shocks can
produce wide swings in prices. Supply
shocks are perhaps most important
because of the dependence of
agricultural production on the weather,
although demand shocks can be
important too, especially for certain raw
materials. The impact of shocks in
demand and supply on prices can be
cushioned by the possibility of running
down or adding to stocks. Therefore,
the level of stocks in relation to demand
is an important factor in commodity
prices. If the “stock-to-use” ratio is low
because stocks are low or demand is
high or both, there will be upward
pressure on prices. Markets and prices
for agricultural commodities do not
adjust immediately to supply or demand
shocks. The effects of shocks tend to be
less persistent when they are supply
shocks – owing to bad weather for
example – and more persistent in the
case of demand shocks.
Prices of different commodities are
linked through possible substitution or
complementarity in consumption or
production. These lead to “cross”
effects of price changes from one
commodity to another. For example,
higher prices for maize will lead
producers to grow more maize at the
expense of other crops, reducing their
supply and raising their prices; or
increasing demand for livestock
products will lead to increased feed
demand and prices for cereals and
oilseeds.
Worldimport demand
Initial stocksDomestic production
Factors affecting agricultural commodity prices
Source: FAO.* SPS/NTBs: Agreement on the Application of Sanitary and Phytosanitary Measures/non-tariff barriers.
Domestic demandexporting country
Human consumption
FeedIndustrial useFinal stocks
Initial stocksDomestic production
Domestic demandimporting country
Human consumption
FeedIndustrial useFinal stocks
Worldexport supply
PopulationIncomeTastePrices of complementary productsPrices of competitive productsDemand for meatPrices of other feedsOil pricesDomestic policies... etc.
Worldprice formation
P
Q
Price formationin importing country
P
Q
Input costsDomestic policiesWeatherPricesUtilization in previous year... etc.
DutiesExchange rates
Input costsPolicies
WeatherTechnology
Commodity pricesUtilization
previous year
DutiesExchange ratesSPS/NTBs*
PopulationIncome
TastePrices of
complementary productsPrices of
competitive products... etc.
Oil pricesPolicies
Technology... etc.
Demand for meatPrices of other feeds
... etc.
Exports
Imports
Price formation in exporting country
P
Q
+
+

The State of Agricultural Commodity Markets 2009 17
A critical initial trigger for the recent price hikes was the decline in the production of cereals in major exporting countries beginning in 2005 and continuing in 2006. Cereal production declined by 4 and 7 percent, respectively, in those two years. However, there was a significant increase in cereal output in 2007, especially in maize in the United States of America, responding to the higher prices. The quick supply response for cereals in 2007 came at the expense of reducing productive resources allocated to oilseeds, especially soybeans, resulting in a decline in oilseed production.
Stocks play a key role in equilibrating markets and smoothing price variations. If stocks are low relative to use, markets are less able to cope with supply and demand shocks and supply shortfalls or demand increases will lead to bigger price increases. This ratio fell sharply from 2006 onwards, reaching a historic low in 2008.
The level of stocks, mainly of cereals, has been falling since the mid-1990s. Indeed, since the previous high-price event in 1995, global stock levels have on average declined by 3.4 percent per year. There have been a number of changes in the policy environment since the Uruguay Round Agreements that have been instrumental in reducing stock levels in major exporting countries: the size of reserves held by public institutions; the high cost of storing perishable products; the development of other less costly instruments of risk management; increases in the number of countries able to export; and improvements in information and transportation technologies. When production shortages occur in consecutive years in major exporting countries under such circumstances, international markets tend to become tighter and price volatility and the magnitude of price changes become magnified when unexpected events occur. Indeed, there is a statistically significant negative relationship between marketing season beginning stocks (expressed as a percentage of expected utilization in the ensuing season) and the cereal prices formed during the same season. This means that tight markets at the global level at the beginning of the marketing season tend to put upward pressure on prices. This was one of the main reasons why international cereal prices spiked so
Energy and food price indices
Index (2002–04 = 100)
Source: FAO and Reuters-CRB.
Reuters-CRB energy index FAO food price index
50
150
250
350
450
550
2008200620042002200019981996199419921990
Relationship between cereals stock ratios and prices
Index (1989–1990 = 100)
Source: FAO.
Notes: Correlation coefficients: price with global stock-to-use ratio: r = –0.65; price with global stock-to-use ratio, excluding China: r = –0.49; price with major exporters’ stock-to-disappearance ratio: r = –0.47.Data for China refer to mainland China.
FAO cereal price indexGlobal stock-to-use ratioGlobal stock-to-use ratio, excl. ChinaMajor exporters’ stock-to-disappearance ratio
0
100
200
300
07/0805/0603/0401/0299/0097/9895/9693/9491/9289/90
Ocean freight rates for grains from United States Gulf ports to selected countries
US$/tonne
Source: International Grains Council.
* CIS: Commonwealth of Independent States.
20
40
60
80
100
OSAJJMAMFJDNO
2006 2007
BangladeshEgypt
CIS*European Union
sharply in 2006. Continuing low stock levels is one reason why relatively high prices could be expected to persist for some time. By the close of the seasons ending in 2008, world cereal stocks had increased by only 1.5 percent from their already reduced level at the start of the season and reached their lowest levels in 25 years. In 2007/08, the stock-to-use ratio for world cereals stood at 19.6 percent, well below the five-year average of 24 percent and even smaller than the previous low of 20 percent in 2006/07. The stock situation for oils/fats and meals/cakes began to deteriorate in mid-2007 after the spillover effects from developments in the cereals markets, especially of wheat and coarse grains, with the stock-to-use ratio falling from

Wha
t hap
pene
d to
wor
ld fo
od p
rices
and
why
?
The State of Agricultural Commodity Markets 2009 18
World cereal food and feed utilization
Million tonnes
Source: FAO.
650
750
850
950
1 050
07/0805/0603/0401/0299/0097/98
Food use
Feed use
Cereal utilization in China plus India and the rest of the world
Million tonnes
Source: FAO.
Notes: Data for China refer to mainland China. Utilization is the sum of food, animal feed, seed use, industrial use and waste.
0
500
1 000
1 500
2 000
07050095908580
Rest of the world
China plus India
Cereals used for food in China plus India and the rest of the world
Million tonnes
Source: FAO.
Note: Data for China refer to mainland China.
Rest of the world
China plus India
200
300
400
500
600
700
07050095908580
Net imports of cereals by China and India
Million tonnes
Source: FAO.
Note: Data for China refer to mainland China.
-20
-10
0
10
20
07050095908580
China
India
Cereal utilization and net trade in China
Million tonnes Million tonnes
Source: FAO.
Note: Data for China refer to mainland China.
-5
0
5
10
15
20
07/0805/0603/0401/0299/0097/98
0
100
200
300
400
Net
expo
rts
Net
imp
ort
s
Utilization(right axis)
Net trade(left axis)
Cereal utilization and net trade in India
Million tonnes Million tonnes
Source: FAO.
Utilization(right axis)
Net trade(left axis)
-3
0
3
6
9
12
15
07/0805/0603/0401/0299/0097/98
0
50
100
150
200
250
Net
exp
ort
sN
etim
po
rts
The State of Agricultural Commodity Markets 2009 19
13 to 11 percent for oils/fats and from 17 to 11 percent for meals/cakes by the end of the 2007/08 season.
Putting food and feed in perspective – China and India
The increase in world population requires higher food production if consumption requirements are to be met. Increasing incomes generally also lead to changes in diets, often reflected in stronger demand for higher-value foods (such as livestock products) as opposed to starchy staples (such as wheat). Because these changes are gradual, it is not correct to consider them as an underlying cause for any sudden price increase such as the one experienced recently. Therefore, the widely accepted notion that rising demand in countries such as China and India, the two most populous countries with rapid population and income growth, is a reason for soaring food prices warrants re-examination.
The importance of growth in demand from China and India as a shaper of world food markets and prices has been highlighted in a recent study by the
International Food Policy Research Institute (IFPRI, 2008). This argues that rapid economic growth in certain developing economies has pushed up middle-class consumers’ purchasing power and this has increased demand for livestock products such as meat and milk and, hence, demand for feedgrains.
Emerging economies, particularly China and India, are certainly playing an important role in global agricultural commodity demand and supply. However, the high commodity prices of 2007 and 2008 do not seem to have originated in these emerging markets. Cereal use in China and India has in fact been growing more slowly than in the rest of the world.
Cereal imports by China and India have been trending downwards since 1980, by about 4 percent per year, from an annual average of about 14 million tonnes in the early 1980s to roughly 6 million tonnes in the past three years.
This means that the growth in cereal feed demand in these two countries, at least until recently, has been met mainly from domestic sources. Moreover, while China has become a major importer of oilseeds, vegetable oils and livestock products, the country’s overall agricultural trade balance has remained largely positive in most years since the mid-1990s. The long-term development in the trade position of India also goes contrary to the belief that it is one of the drivers of increasing food prices in world markets. India has been a major exporter of food. In most years between 1995 and 2007, it exported more wheat, rice and meat than it imported. Even India’s relatively large imports of vegetable oils need to be considered in the context of equally large exports of oilcakes. In fact, in the case of both China and India, there is no evidence of a sudden increase in imports of oilseeds, meals and oils to indicate that they have contributed to their price hike, which began in mid-2007 after the spike in the prices of grains (maize in particular)
a year earlier. China and India have not been the cause of the sudden price spike in the oils complex, but this does not downplay their role nor that of changing consumption patterns in general on developments in food markets both in the past and in the future.
What about biofuels?
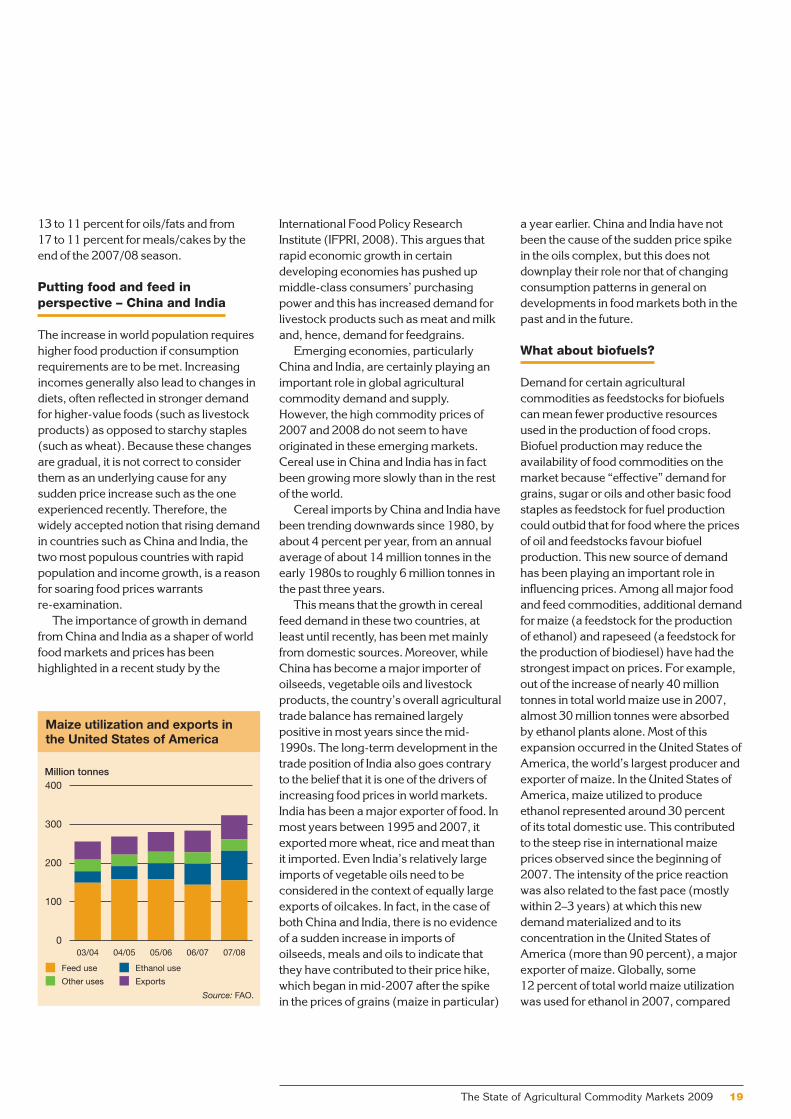
Demand for certain agricultural commodities as feedstocks for biofuels can mean fewer productive resources used in the production of food crops. Biofuel production may reduce the availability of food commodities on the market because “effective” demand for grains, sugar or oils and other basic food staples as feedstock for fuel production could outbid that for food where the prices of oil and feedstocks favour biofuel production. This new source of demand has been playing an important role in influencing prices. Among all major food and feed commodities, additional demand for maize (a feedstock for the production of ethanol) and rapeseed (a feedstock for the production of biodiesel) have had the strongest impact on prices. For example, out of the increase of nearly 40 million tonnes in total world maize use in 2007, almost 30 million tonnes were absorbed by ethanol plants alone. Most of this expansion occurred in the United States of America, the world’s largest producer and exporter of maize. In the United States of America, maize utilized to produce ethanol represented around 30 percent of its total domestic use. This contributed to the steep rise in international maize prices observed since the beginning of 2007. The intensity of the price reaction was also related to the fast pace (mostly within 2–3 years) at which this new demand materialized and to its concentration in the United States of America (more than 90 percent), a major exporter of maize. Globally, some 12 percent of total world maize utilization was used for ethanol in 2007, compared
Maize utilization and exports in the United States of America
Million tonnes
Source: FAO.
Other uses Exports
Feed use Ethanol use
0
100
200
300
400
07/0806/0705/0604/0503/04
Wha
t hap
pene
d to
wor
ld fo
od p
rices
and
why
?
The State of Agricultural Commodity Markets 2009 20
with 60 percent for animal feed. In the EU, the biodiesel sector is estimated to have absorbed about 60 percent of member states’ rapeseed oil output in 2007, amounting to about 25 percent of global production and 70 percent of global trade in the commodity in that year.
The issue is not limited to how much of each crop may be used for biofuels rather than for food and feed, but how much of planting area could be diverted from producing other crops to those used as feedstock for the production of biofuels. Already, high maize prices since mid-2006 encouraged farmers in the United States of America to plant more maize in 2007. Maize plantings increased by nearly 18 percent. This increase was only made possible by the reduction in soybean and wheat areas. The expansion in maize plantings combined with favourable weather resulted in a bumper maize harvest in 2007, enabling the United States of America to meet both domestic demand, including that from its growing ethanol sector, as well as to export. However, this apparent success in maize disguised another important development – reduced wheat and soybean plantings and, therefore, their production. This was one reason for their sharp price increases. However, had production in Australia not suffered from another year of drought and outputs in the EU and Ukraine not been hampered by the unfavourable weather, it is conceivable to assume that grain prices would not have increased by as much as they did.
This chain reaction somewhat repeated itself in 2008, but this time in reverse order. Farmers in the United States of America cut back on their maize plantings in favour of soybeans because of their higher relative prices. Strong soybean prices gave rise to a substantial increase in soybean planted area in the United States of America for the 2008/09 marketing season. This trend is confirmed by the soybean–maize price ratio in the futures market. From a historical perspective, whenever the ratio approaches two, as a rule of thumb soybeans are favoured over maize, resulting in a shift of planting area from maize to soybeans. As this ratio fell in 2006/07, farmers drastically increased maize plantings. However, with the ratio well above two in the 2007/08 season, farmers expanded soybean plantings
instead. Increases in soybean plantings were a positive development for the soybean market but left the maize market precariously balanced. In view of the new United States Energy Bill, the demand for maize by the ethanol sector is expected to continue to rise. If production of maize were to decline in 2009, it would be difficult to picture how the United States of America could meet all demand (food, feed, fuel and exports) without a significant drawdown on its own maize stocks during the 2009/10 season. The market will be closely watched for indications of this eventuality. In these periods of market tightness, maize prices could firm, with a strong possibility of spillover to other major food and feed crops.
With the exception of ethanol production from sugar cane in Brazil, production of biofuels is currently not economically viable without subsidies or other forms of policy support. The production costs per litre of biofuel are by far the lowest for Brazilian sugar-cane ethanol, which is the only biofuel that is consistently priced below its fossil-fuel equivalent. Brazilian biodiesel from soybeans and United States ethanol from maize have the next lowest net production costs, but in both cases costs exceed the market price of fossil fuels. European biodiesel production costs are more than double those for Brazilian ethanol, reflecting higher feedstock and processing costs. According to the Global Subsidies Initiative, the United States of America spent US$5.8 billion on biofuel subsidies in 2006 while the EU spent US$4.7 billion. These policy interventions encouraged the rush to liquid biofuels and, hence, increased demand for certain agricultural products as feedstocks. One motivation for such support – the claimed environmental benefits of biofuels over fossil fuels – is now being questioned as evidence emerges that reductions in greenhouse gas emissions are less than originally assumed for certain types of biofuels. However, while support for biofuels remains in place, the additional demand for the agricultural products involved will continue to shore up their prices, with spillover effects on prices in other agricultural markets.
Much depends on oil prices. The higher that oil prices are, the more economically viable biofuel production becomes and

The State of Agricultural Commodity Markets 2009 21
the more agricultural products are demanded as feedstocks. When oil prices reach a level where biofuels become competitive, demand by the energy market for agricultural products as feedstocks increases and this new demand pushes up agricultural prices. Thus, agricultural and energy markets become linked in a new way. As energy markets are huge relative to agricultural markets, demand from the biofuel sector could in principle absorb any additional production of crops usable as feedstocks so the energy market would effectively set a floor price for the agricultural products. It would also set a ceiling on agricultural product prices at the point where they have risen so much that biofuel production is no longer competitive. It would be energy demands rather than food demands that would set agricultural product prices and agricultural product prices would be tied to energy prices. Clearly, this would be a major departure from how agricultural product prices have been determined in the past.
What is the role of speculation?
Recent discussions of high food prices have included a growing interest in the possible effects of speculators and institutional investors – “non-commercial traders” – buying into agricultural commodities on futures markets as returns on other assets have become less attractive. There has been some concern that speculation has contributed to increasing food prices. The downturn in the global properties and securities markets resulted in an inflow of funds into agricultural commodity futures markets looking for profits, both from traditional institutions such as hedge funds and pension funds and from newer commodity-linked and exchange-traded funds. Global trading activity in futures and options combined has more than doubled in the last five years. In the first nine months of 2007, this activity grew by
Typically, commodity exchange markets
provide risk management tools such as
futures and options to enable market
participants like farmers, processors,
producers or traders – “commercial
traders” – to hedge against the risk of price
fluctuations in the future. These markets also
assist in the discovery of prices and thus
provide a measure of predictability in
ascertaining future prices. Another market
activity is speculation, undertaken mainly by
speculators or investors – “non-commercial
traders”. This involves making profits by
speculating on future movements in the price
of an asset or a commodity.
Speculation is important for the efficient
functioning of markets because it brings
liquidity into the market and helps farmers
and other participants to offset their
exposure to future price fluctuations in the
physical commodity markets. However,
speculation can sometimes play a perverse
role in markets. For example, excessive
levels of speculation can lead to sudden or
unreasonable fluctuations or unwarranted
changes (in one particular direction) in
commodity prices. This may occur when an
increasing share of open interests (number of
outstanding futures contracts) is held by
investors interested in gaining from future
price movements with little regard to the
fundamentals of commodity demand and
supply. Thus, the impact of excessive
speculation is counterproductive to futures
markets because the risk of price volatility is
a fundamental condition that these markets
attempt to address. In addition, excessive
speculation in agricultural commodity
markets may transmit inappropriate market
signals to agricultural producers, leading to
inefficient allocation of resources.
The level of speculative activity could be
controlled by regulating commodity markets.
One way is through limiting the number of
futures contracts that one participant, other
than a participant eligible for hedge
exemption, can hold, thereby limiting the
ability of a single participant to influence the
market. However, this is risky as excessive
regulation may drive speculators out of the
market, depriving it of liquidity.
Speculation on agricultural commodity markets
30 percent over the previous year. Notably, the share of non-commercial traders taking long positions in the commodity markets has been rising, indicating increased interest on their part in buying futures contracts. Between 2005 and 2008, non-commercial traders almost doubled their share of open interests in the maize, wheat and soybean futures markets although their share in the sugar futures market remained largely unchanged. Investments by institutional investors can be large. However, the volume of these investments in agricultural commodities has not been as significant as in other commodities such as metals.
Share of commercial and non-commercial traders in futures markets
Percentage
Source: OECD.
0
20
40
60
80
100
0805080508050805
Commercial traders
Non-commercial traders
Maize Wheat Soybean Sugar

Wha
t hap
pene
d to
wor
ld fo
od p
rices
and
why
?
The State of Agricultural Commodity Markets 2009 22
The increase in the shares of non-commercial traders in maize, wheat and soybean markets coincided with the increase in prices of these commodities in the physical markets. This high level of speculative activity in agricultural commodity markets in the last few years has led some analysts to connect the increases in food prices with increased speculation. However, it is not clear whether speculation on agricultural commodities was driving prices higher or was attracted by prices that were increasing anyway. A recent study by the International Monetary Fund (IMF) concluded that in general it was the high prices that were encouraging inflows of investment funds into futures markets for agricultural commodities. This question of causality requires further research. Large inflows of funds could provide a further explanation at least for the persistence of high food prices and their apparently increased volatility. Again, further research is needed. In the meantime, the role, if any, of financial investors in influencing food prices is a matter of concern to the extent that some countries have even considered additional regulation.
No single explanation for soaring food prices
The sharp jump in the US dollar prices of food, which peaked in the first half of 2008, can be characterized as the most significant spike since the 1970s. The reason for this development was supply and demand imbalances in many of the major commodity markets, notably cereals and oilseeds. It is primarily on the demand side that plausible explanations for the food price hike can be found. The principal drivers of increasing prices on the supply side tend to be short-lived and are related to production shortfalls and to policy measures such as restrictive export policies by major traders. On the demand side, factors contributing to the recent rise in world food prices are few. Unlike with supply, changes on the demand side are in general neither rapid nor unexpected. This is because, aside from the emerging biofuel factor, the main drivers of demand in food markets are population and income growth. In most cases, these two fundamental variables manifest a gradual (and expected) upward demand
progression and, in this way, allow for supply to adjust. The situation during the recent high-price period does not depart from this trend in that neither food nor feed demand exhibited any sudden or unexpected increase that would have merited the kind of price rises witnessed by markets. Speculation and inflows of investment funds are more likely to have followed the increasing prices than to have caused them. Only the rapid expansion in demand for biofuel feedstocks marks a major departure from past experience. However, biofuel demand alone cannot explain the extent of the price increases in 2007 and early 2008. Record oil prices have increased interest in biofuel development but have also had a major impact in their own right by driving up production and transport costs. Upward pressure on prices has been reinforced also from the demand side by fears that prices might go even higher and by increased demand for stocks. The sharp increase in food prices on world markets cannot be attributed to any one single factor. Each one of those causes commonly cited cannot of itself explain the pattern and extent of recent price movements. It is their coincidence and combination that accounts for the dramatic changes. While disentangling their separate effects is problematic, the evidence does point to biofuel demand and oil prices as the principal drivers.
Some broad indication of the relative impacts on food prices of the various factors can be gleaned from simulations with the OECD–FAO Aglink-Cosimo model of world agricultural markets. This model is used to generate market projections over the medium term on the basis of assumptions concerning the future values of key variables affecting markets and prices.3 Varying these assumptions and comparing the resulting
3 Aglink-Cosimo is a partial equilibrium model, a joint
project of FAO and the OECD. These scenarios are
described in more detail in OECD–FAO Agricultural
Outlook 2008–2017 (OECD–FAO, 2008). Aglink-
Cosimo provides a comprehensive dynamic economic
and policy-specific representation of 58 of the world’s
major producing and trading countries and regions for
the main temperate-zone commodities as well as rice,
sugar and palm oil. Ethanol and biodiesel are also now
included. As most models of this type, the model is
driven by elasticities, technical parameters and policy
variables.
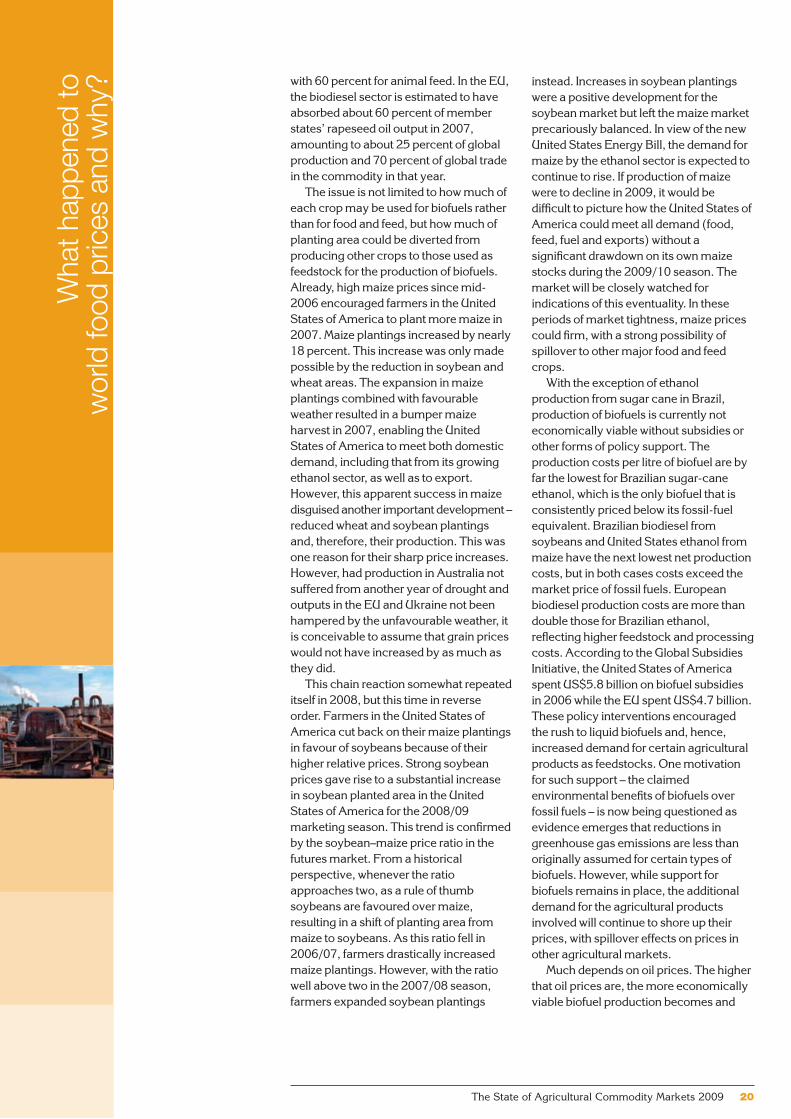
The State of Agricultural Commodity Markets 2009 23
projections gives an indication of the strength of each influence. The five key assumptions examined were: (i) biofuel use of grains and oilseeds; (ii) petroleum prices; (iii) income growth in major developing economies: Brazil, China, India, Indonesia and South Africa (EE5); (iv) the exchange rate of the US dollar relative to the currencies of all other countries; and (v) crop yields.
For coarse grains and vegetable oil, the price outlook would be most affected if biofuel production were to remain constant at 2007 levels. Changes in demand for these commodities as feedstocks for biofuel production are a source of uncertainty irrespective of whether the cause is an oil price change, a change in biofuel support policies or a new technological development that leads processors to buy different feedstocks. Holding biofuel production constant at its 2007 level results in a 12-percent decline in the 2017 projected prices for coarse grains and around 15 percent in the projected price of vegetable oil. The second scenario shows that wheat, coarse grains and vegetable oil price projections are all highly sensitive to petroleum-price assumptions and would be a further 8–10 percent lower if oil prices fell to their 2007 level. The reduced gross domestic product (GDP) growth scenario produces wheat and coarse grains prices that are only modestly (1–2 percent) below the baseline. For
vegetable oils, reflecting presumably a much higher income elasticity of the demand and a greater influence of the five countries in world trade, the simulated price difference exceeds 10 percent. A fourth scenario simulating a stronger US dollar raises prices in domestic currency terms in exporting countries, providing greater incentives to increase supplies. At the same time, a stronger US dollar reduces the import demand in importing countries. The combination of greater export supply and weaker import demand puts additional downward pressure on world prices. By 2017, wheat, coarse grain and vegetable oil prices would all be some 5 percent below the corresponding baseline projection. The scenario under which cereals and oilseeds yields are assumed to be 5 percent higher leads to projected wheat and maize prices for 2017 that are 6 and 8 percent lower, respectively, than the corresponding baseline value, but make little difference to projected vegetable oil prices.
Why have prices fallen?
The sharp fall in international food prices since July 2008 has reversed their equally sharp rise up to that point and pushed them back towards their 2007 levels. The underlying causes of the reversal are a mixture of supply and demand factors. High prices have encouraged an
Sensitivity of projected world prices to changes in five key assumptions, percentage difference from baseline values, 2017
Percentage
Sources: FAO and OECD.
-50
-40
-30
-20
-10
0
Vegetable oilMaizeWheat
Scenario 1: Biofuel production constant at 2007 level
Scenario 2: Scenario 1 and oil price constant at 2007 level (US$72)
Scenario 3: Scenario 2 and lower income growth in EE5* countries (half annual growth rate)
Scenario 4: Scenario 3 and exchange rate over inflation held constant at 2005 level
Scenario 5: Scenario 4 and yields for wheat, oilseeds and coarse grains 5% higher than over the projection period
* EE5: Brazil, China, India, Indonesia and South Africa.
Cereal production in 2007 and 2008
Million tonnes
Source: FAO.
* BIC: Brazil, India and China (mainland).
2007 estimate 2008 forecast
400
600
800
1 000
1 200
1 400
11.0%
0.9%
-1.6%
Developedcountries
Developingcountries
Developingcountriesexcluding
BIC*
expansion in global production of cereals. However, this supply response has been concentrated mostly in the developed countries and, among developing countries, Brazil, China and India. With the exception of these three, cereal production actually fell between 2007 and 2008 in developing countries. Therefore, it is clear that high food prices were not an opportunity seized by the majority of poor farmers in developing countries – their supply response was limited in 2007 and virtually zero in 2008. Falling food prices have little to do with increasing global supplies. The explanation lies more in terms of slowing demand as the financial
Cereal production in developing and developed countries
Million tonnes
Source: FAO.* Forecast.
300
500
700
900
1 100
1 300
08*050095908580757065
Developingcountries
Developedcountries
Wha
t hap
pene
d to
wor
ld fo
od p
rices
and
why
?
The State of Agricultural Commodity Markets 2009 24
crisis and emerging global recession have reduced economic activity and oil prices have tumbled. The declining demand has been having most impact, at least initially, on the markets and prices of agricultural raw materials such as rubber, but food prices are also being affected.
While falling food prices are good news for consumers, they should not be taken as implying that the global food system’s problems are solved. Most of the critical factors that underlay the high-price
episode and the resulting threat to food security remain. Developing country food production has not seen any significant increase and weaker price incentives will not encourage further expansion of production elsewhere. Global cereal stocks are still low with the stock-to-use ratios for cereals in 2008/09 below their five-year average. Although oil prices have fallen drastically, biofuel demand remains strong as feedstock prices have fallen and new ethanol production
The global economy is expected to grow by
only 2 percent in 2009 compared with
3.8 percent in 2008. Evidence of global
recession has accumulated with projected
growth in major developed economies
reduced to zero or even negative. The
financial crisis and, more significantly, the
global recession have obviously contributed
to the dramatic fall in agricultural commodity
prices. However, it is difficult to separate the
impacts of the crisis and recession from the
expected market adjustments to apparent
overshooting of prices upwards in 2007 and
the first half of 2008. Agricultural markets
and prices will be affected on both the
demand side and the supply side, not only
through reduction in economic growth rates
and demand but also through exchange rate
changes, changes in the availability and cost
of credit and changes in the availability of
other external funding, including aid.
However, the reduction in global economic
growth will be the major influence on
agricultural commodity markets and
developing country agricultural prospects in
the near future.
The impacts on demand for commodities
will be negative. Experience of previous
recessions suggests that demand for, and
prices of, raw materials such as natural
rubber and fibres will be hardest and fastest
hit, followed by livestock products for which
income elasticities are relatively higher. The
impact on basic foods such as cereals may
be less, as consumption levels are defended
and demand is maintained. Developing
countries dependent on exports of raw
materials and tropical products will face
balance of payments problems in the
absence of a similar or stronger decrease in
the cost of food imports on which many also
depend. The prevailing uncertainty and
consequent negative market expectations
are likely to dampen overall demand further.
Hopes that commodity demand and prices
might be sustained by continuing high
growth rates in China and India and other
rapidly growing economies in the developing
world now look less tenable as their
projected growth has been revised
downwards. Availability of credit and liquidity
is constraining agricultural trade, adding to
the downward pressure on international
prices but also reducing trade volumes.
Falling oil prices will compound downward
pressure on prices for commodities usable
as feedstocks in biofuel production.
However, the net effect will depend on their
price movements relative to oil and the
extent of biofuel policy support.
Lower prices in general are good news for
consumers but will affect incentives for
producers to make the investments needed
to achieve greater food security in the
medium and long term. With incentives for
producers reduced, some cutback in
production might be expected, also reducing
scope for rebuilding grain stocks. Whether
falling prices are really good news for
consumers depends on what happens to
incomes, which will fall along with
employment in the event of worldwide
recession. Many developing countries are
also highly dependent on remittances, so
downturns in the developed economies
could have an indirect impact on domestic
demand in developing countries as
employment and incomes of migrant
workers fall. Remittances also provide funds
for investment, including in agriculture.
The financial crisis, recession and agricultural commodity prices
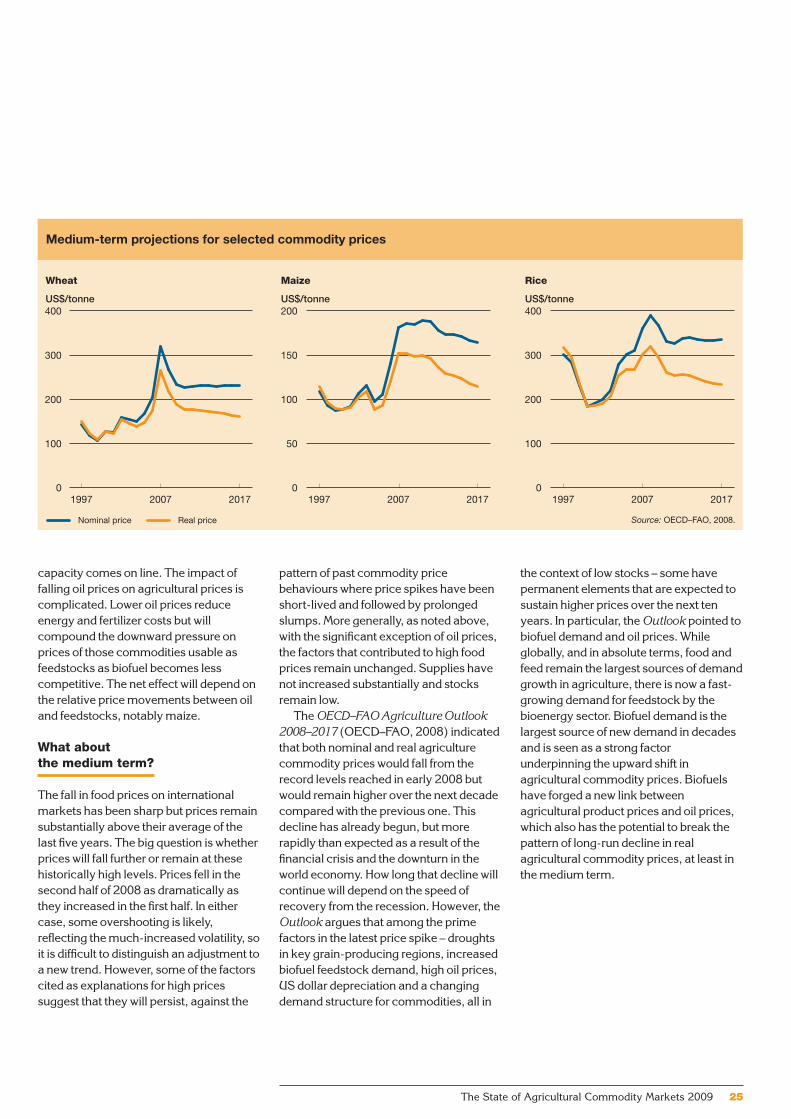
The State of Agricultural Commodity Markets 2009 25
capacity comes on line. The impact of falling oil prices on agricultural prices is complicated. Lower oil prices reduce energy and fertilizer costs but will compound the downward pressure on prices of those commodities usable as feedstocks as biofuel becomes less competitive. The net effect will depend on the relative price movements between oil and feedstocks, notably maize.
What about the medium term?
The fall in food prices on international markets has been sharp but prices remain substantially above their average of the last five years. The big question is whether prices will fall further or remain at these historically high levels. Prices fell in the second half of 2008 as dramatically as they increased in the first half. In either case, some overshooting is likely, reflecting the much-increased volatility, so it is difficult to distinguish an adjustment to a new trend. However, some of the factors cited as explanations for high prices suggest that they will persist, against the
pattern of past commodity price behaviours where price spikes have been short-lived and followed by prolonged slumps. More generally, as noted above, with the significant exception of oil prices, the factors that contributed to high food prices remain unchanged. Supplies have not increased substantially and stocks remain low.
The OECD–FAO Agriculture Outlook 2008–2017 (OECD–FAO, 2008) indicated that both nominal and real agriculture commodity prices would fall from the record levels reached in early 2008 but would remain higher over the next decade compared with the previous one. This decline has already begun, but more rapidly than expected as a result of the financial crisis and the downturn in the world economy. How long that decline will continue will depend on the speed of recovery from the recession. However, the Outlook argues that among the prime factors in the latest price spike – droughts in key grain-producing regions, increased biofuel feedstock demand, high oil prices, US dollar depreciation and a changing demand structure for commodities, all in
the context of low stocks – some have permanent elements that are expected to sustain higher prices over the next ten years. In particular, the Outlook pointed to biofuel demand and oil prices. While globally, and in absolute terms, food and feed remain the largest sources of demand growth in agriculture, there is now a fast-growing demand for feedstock by the bioenergy sector. Biofuel demand is the largest source of new demand in decades and is seen as a strong factor underpinning the upward shift in agricultural commodity prices. Biofuels have forged a new link between agricultural product prices and oil prices, which also has the potential to break the pattern of long-run decline in real agricultural commodity prices, at least in the medium term.
Medium-term projections for selected commodity prices
US$/tonne
Wheat
US$/tonne
Maize
US$/tonne
Rice
Source: OECD–FAO, 2008.Nominal price Real price
0
100
200
300
400
2017200719970
50
100
150
200
2017200719970
100
200
300
400
201720071997

Wha
t hap
pene
d to
wor
ld fo
od p
rices
and
why
?
The State of Agricultural Commodity Markets 2009 26
The impacts of rising food prices on consumers4
T he impact of high food prices is obviously most severe for the poor who rely on purchased food. For
the poor in developing countries, food can account for at least 50 percent and up to 70–80 percent of their budget. Thus, higher prices affect not only their food consumption in terms of quantity and quality, but also their spending in general. The most visible indicator of this negative impact was the social unrest and rioting that erupted around the world triggered by soaring food prices. The disturbances were mostly concentrated in urban areas. These are the areas where dependence on imported food and exposure to international food prices is probably highest and consumers feel the brunt of the impact of soaring food prices. However, the rural poor are also affected even though their connections to international food markets might be weaker. The impact of higher food prices on the poor depends crucially on whether they are net food sellers, in which case the impact could in principle be positive, or net food buyers, in which case the impact is unequivocally negative. The evidence suggests that most households in the developing world and especially the poor are net buyers of food, and this holds even for rural households that are mostly engaged in agriculture. Whether urban or rural, it is the poorest of the poor who spend the largest share of their income on food and who have no access to assets such as land who suffer most. Female-headed households figure disproportionately on both counts, so the negative impacts of high food prices also have a gender dimension that needs to be addressed in policy responses.
Faced with sharply rising food prices, poor households had to adjust their food
consumption patterns. Households are reported to have reduced their food intake or to have attempted to maintain it by reducing their spending on more expensive foods and other non-food items. Among the poorest population groups, per capita cereal consumption may even rise in spite of increasing prices as consumers shift to a cereals-based diet away from more expensive and higher-quality food groups, including meat, dairy products and vegetables. In spite of the soaring prices in global commodity markets (in particular of tradable staples such as wheat, rice and maize), the most recent data on the food use of these key commodities illustrate the resilience of per capita consumption. This trend is the same for most low-income countries, including those with high levels of undernourishment. However, there are also instances of consumers returning to more traditional foods as the costs of preferred but imported cereals increased.
Rising food prices fuel inflation
Rising food prices contribute to the overall rate of inflation in most countries, including developed countries. Changes in food prices are an important component of the general rate of inflation, as measured by the consumer price index (CPI). This is a weighted average of the changes in the prices of a representative fixed basket of goods, including food, and with the weights reflecting the importance of each good in the typical household budget. The greater the share of food in the household budget, the more rising food prices fuel general inflation. For most developed countries, food expenditure shares range between 10 and 20 percent. In developing countries, the share of food expenditure in household budgets is much higher, absorbing more than half of family income in countries such as Bangladesh, Haiti, Kenya and Malawi.
The impacts of high food prices
4 See The State of Food Insecurity in the World 2008
(FAO, 2008a) for a detailed discussion of these
impacts.

The State of Agricultural Commodity Markets 2009 27
In addition to imposing a heavy burden on the cost of living, rising food prices can have further indirect effects on inflation if they prompt pay increases – higher wage demands have been at the core of several protests. An inflation-targeting central bank might have to curb inflationary pressure from higher food prices when the effect on non-food prices is significant, and this would mean raising interest rates. This has become a growing tendency in developing countries, but higher interest rates would undermine the much-needed investment in sectors that provide a path out of poverty for vulnerable countries, especially the agriculture sector.
Higher food prices mean higher food import bills
In spite of the recent falls in international food prices, the global cost of imported basic foodstuffs in 2008 is forecast to reach more than US$1 trillion, nearly 25 percent higher than in 2007, driven by substantially increased prices of rice, wheat, coarse grains and vegetable oils and compounded by increased freight costs, which nearly doubled for many routes. Many of the poorest countries are food importers, heavily dependent on cereal imports. Higher food prices on world markets mean higher food import bills and a balance of payments problem. The total cost of food imports for developing countries was already
Selected annual consumer price indices as of September 2008
PercentageSource: FAO.
0 10 20 30
Senegal
Togo
Ecuador
Mauritania
Philippines
Niger
United Rep. of Tanzania
Dem. Rep. of the Congo
Bangladesh
Honduras
Lesotho
Zambia
Yemen
Mozambique
Angola
Ghana
Sierra Leone
Haiti
Egypt
Pakistan
Sudan
Nicaragua
Azerbaijan
Sri Lanka
Ethiopia
Kenya
Mongolia
Food import bills in 2007 and 2008
Million US$
Source: FAO.
0
100
200
300
CerealsOilsand fats
MeatDairySugar
2007 2008
Food import bills of developed and developing countries
Index (1998–2000 = 100)
Source: FAO.
Note: NFIDCs, net food-importing developing countries; LIFDCs, low-income food-deficit countries; LDCs, least-developed countries.
LIFDCsNFIDCsWorld
Developed countriesDeveloping countriesLDCs
50
100
150
200
250
300
350
0807060504030201009998
Forecast changes in global food import bills by type, 2008 over 2007
PercentageSource: FAO.
0 20 40 60 80 100
Rice
Vegetable oils
Sugar
Coarse grains
Meat
Wheat
Dairy
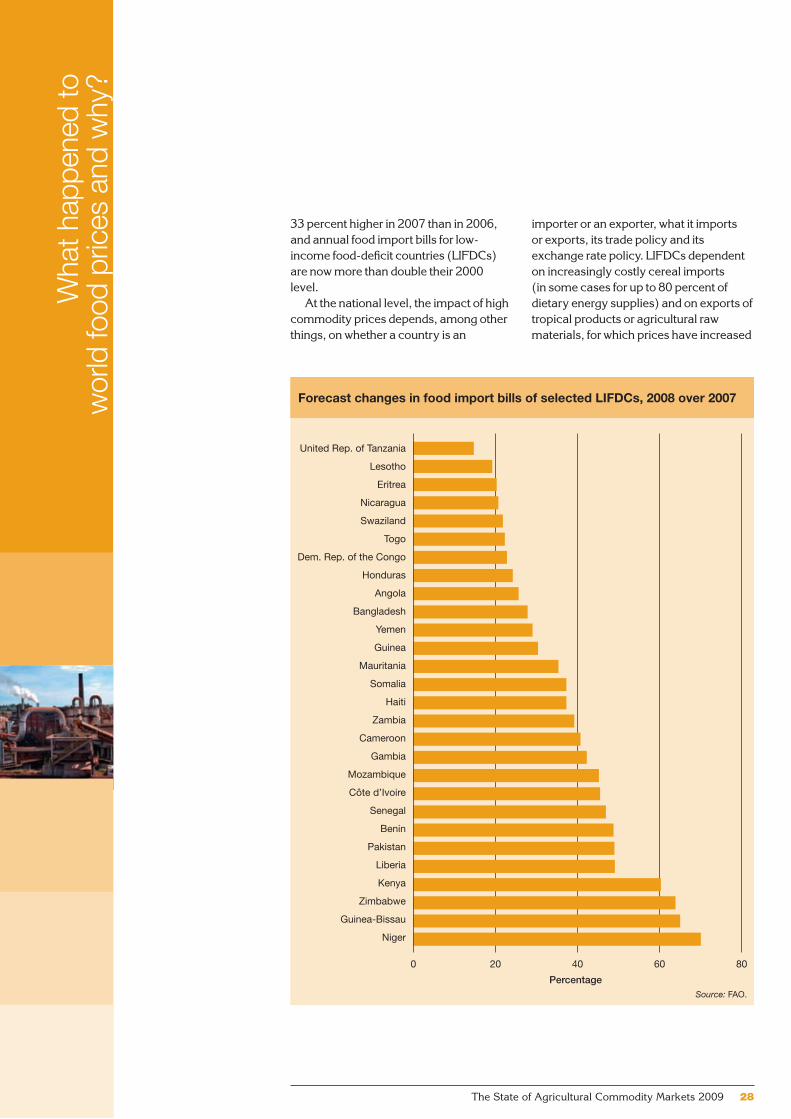
Wha
t hap
pene
d to
wor
ld fo
od p
rices
and
why
?
The State of Agricultural Commodity Markets 2009 28
33 percent higher in 2007 than in 2006, and annual food import bills for low-income food-deficit countries (LIFDCs) are now more than double their 2000 level.
At the national level, the impact of high commodity prices depends, among other things, on whether a country is an
importer or an exporter, what it imports or exports, its trade policy and its exchange rate policy. LIFDCs dependent on increasingly costly cereal imports (in some cases for up to 80 percent of dietary energy supplies) and on exports of tropical products or agricultural raw materials, for which prices have increased
Forecast changes in food import bills of selected LIFDCs, 2008 over 2007
PercentageSource: FAO.
0 20 40 60 80
United Rep. of Tanzania
Lesotho
Eritrea
Nicaragua
Swaziland
Togo
Dem. Rep. of the Congo
Honduras
Angola
Bangladesh
Yemen
Guinea
Mauritania
Somalia
Haiti
Zambia
Cameroon
Gambia
Mozambique
Côte d’Ivoire
Senegal
Benin
Pakistan
Liberia
Kenya
Zimbabwe
Guinea-Bissau
Niger

The State of Agricultural Commodity Markets 2009 29
less, and with currencies linked to or depreciating against the US dollar are the most vulnerable. The situation of countries that in addition are food-insecure (in the sense of more than 30 percent of the population being undernourished) and net fuel importers is obviously extremely precarious. There are more than 20 developing countries with these characteristics, at least 16 of them in Africa.
It is apparent that the most vulnerable countries bore the highest burden of the increasing cost of imported food, with total expenditures by LIFDCs some 35 percent higher in 2008 than in 2007 – the largest annual increase on record. Compared with other developing countries, LIFDCs already tend to have significantly greater current account deficits as a percentage of their GDPs, spend a much greater share of the value of their merchandise exports to import food and have lower income per head.5 The
majority of LIFDCs have witnessed a decline in the value of their currencies against the US dollar, which has further increased the cost of their food imports. These countries find themselves under economic pressure from all sides.
In addition, the financial crisis could have serious implications for food security in many developing countries. The tight credit situation may restrict access by poor countries to finance, thus limiting their ability to import food. LIFDCs in particular can have difficulty financing their cereal import needs through debt and may face increased fiscal pressure.
Consumers lose but do producers gain?
Clearly, the impact of high food prices on consumers is unequivocally negative. However, in principle, high prices should have been good news for farmers around the world. Higher food prices stand to improve the incentives for those producing the particular products concerned. In principle, higher food
prices increase the funds available to producers for investment, leading to increased agricultural growth and poverty reduction. In this sense, higher food prices might be considered an opportunity – at least for windfall gains for some. Access to means of production and assets such as land is a critical factor in determining who reaps the benefits of higher food prices. Large landholders will benefit most. Households highly specialized in agriculture are also likely winners, although these constitute a rather small proportion of the population, relative to the rest. However, will producers respond by increasing supply? It appears that the high food prices have not been an opportunity for most developing country farmers and a supply response has not materialized. As noted above, in spite of enormous increases in prices, developing countries increased their cereal production by less than one percent in 2008 and production actually decreased in the vast majority of them. The hoped-for supply response simply failed to materialize. Understanding the reasons for this and, hence, what needs to be done to promote supply response are crucial strategic and policy issues. These are addressed in detail in Part 2 of this report.Vulnerability of LIFDCs according to risk factors
Percentage
Source: FAO.Note: Differences in group means: * = significant at 5% level; ** = not statistically significant; *** = significant at 10% level.
Other developing countries LIFDCs
-10 0 10 20 30 40 50
Current accountbalance/GDP*
Commercial foodimport bill/GDP**
Commercial foodimport bill/merchandise
exports***
Import dependence(calorie basis)*
5 On average, LIFDCs had significantly lower annual
GDP per capita (US$2 213) compared with other
developing countries (US$7 453) in the period 2000–04.

Part 2 Why were high food pricesnot an opportunity for poor farmers?
Producers in developing countries have faced real declines in prices in most of the last 50 years. The result has been a lack of investment in agriculture and stagnant production. These formed the background to the recent problems in international food system and they also made it more difficult for developing countries to deal with these problems. So, on the face of it, the high food prices, and the possibility that they might persist (even if not at the peak levels reached in early 2008), looked like an opportunity for small poor producers. But was it? Would producers invest and increase productivity and production in response and generate agricultural growth? Most developing country producers are far distanced from what happens on international markets, so increasing food prices there do not necessarily mean higher prices for poor producers. For this to be the case, those high international prices need to be transmitted across national borders and through marketing chains. However, higher output prices alone are still not sufficient. Incentives to invest and produce also depend on how much the costs of inputs such as seeds and fertilizers have risen. Producers need access to affordable inputs. They also need access to affordable credit. Even where adequate incentives are in place, a positive supply response from producers can be blocked by a range of supply-side constraints, especially a lack of transport and market infrastructure for bringing any increase in production to market. In many developing countries, none of these conditions is adequately met. As a result, higher prices on international markets have not triggered a positive supply response by smallholder farmers in developing countries.
The State of Agricultural Commodity Markets 2009 30

The State of Agricultural Commodity Markets 2009 31
transmitted to domestic markets in relative terms. Therefore, an increase in the international price will result in a proportional increase in the domestic price at all points in time provided that tariff levels remain unchanged. Domestic markets can also be insulated by large marketing margins that arise from high transport costs. Especially in developing countries, poor infrastructure, transport and communication services give rise to large marketing margins because of the high costs of delivering the locally produced commodity to the border for export or the imported commodity to the domestic market. High transport costs and marketing margins hinder the transmission of price signals as they may prohibit arbitrage. Other factors, such as consumer preferences for specific attributes of locally produced food or quality differences between domestic and internationally traded commodities determine the extent to which domestically produced food can be substituted by food purchased in the world market and, thus, affect price transmission. The distinction between
F ood prices increased sharply in many countries in line with the international price boom. In others,
domestic food prices did not follow the increase in world prices or were slow to adjust. Unless higher prices actually reach agricultural producers in developing countries, those producers will not benefit from increasing prices on world markets and they will have no incentive to increase productivity and production. There are two questions to consider: first, do international price changes lead to price changes at national level; and second, if national prices do change, do they filter through to producers?
In theory, prices in a country that is linked to the world market in a free-trade environment will move together with international prices expressed in the same common currency. If the national price is above the international price, imports will take place until the national price becomes equal to the international price after allowing for any transport costs. Increased exports fulfil the same equilibrating role if the national price is below the international price. Under these conditions, “price transmission” is complete – the price of a commodity sold on competitive world and national markets can only differ by the cost of transporting it. Commodity analysts view fast and complete price transmission as an indication of the efficient functioning of a market. However, in practice, a number of factors can limit the extent to which world price changes “pass through” to the national level.6
Policies at the border affect the extent to which world price changes pass through to national markets. For example, export restrictions or taxes hinder the transmission of price signals. Ad-valorem import tariffs, unless they are prohibitively high, allow world price changes to be fully
short-run and long-run price transmission is also important. Changes in the price in one market may take some time to be transmitted to other markets for a number of reasons, such as policy interventions, adjustment costs, complexity of the marketing chain, contractual arrangements between economic agents, storage and inventory holding, delays in transportation or processing or even simple inertia. As a result, price transmission is rarely complete or rapid.
In the case of maize in Africa, transport costs, a weakening US dollar and consumer preferences hindered the transmission of price signals from the world market, and domestic prices responded slowly. White maize is not readily substituted in consumption with internationally traded yellow maize. Nevertheless, increases in the volumes of maize traded, both formally and informally, across the Eastern and Southern African regions mean that national markets are integrated with one another. Statistical analysis using monthly maize price data for 1998–2008 suggests that both yellow and white maize prices in
Do world price increasesreach developing country producers?
6 A comprehensive review of issues surrounding
price transmission is provided in Rapsomanikis,
Hallam and Conforti (2006).
South Africa: maize prices
US$/tonne
Source: FAO.
White WorldYellow
0
100
200
300
400
200820072006200520042003
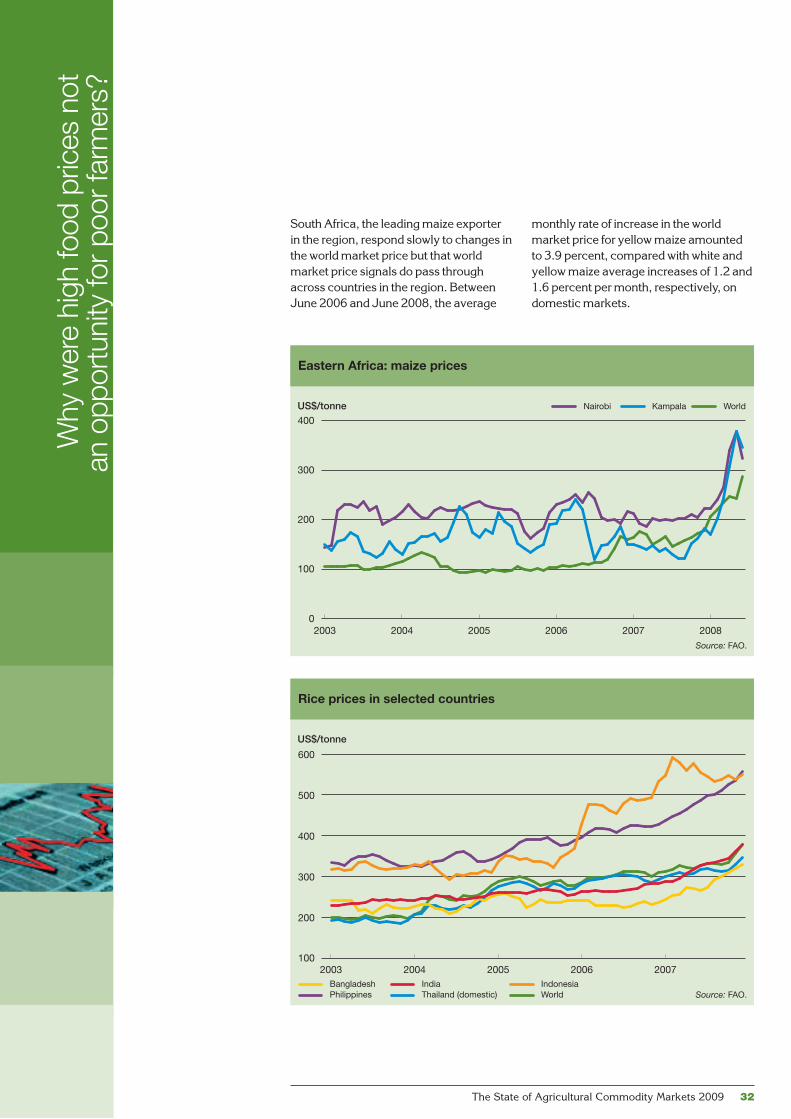
Why
wer
e hi
gh fo
od p
rices
not
an o
ppor
tuni
ty fo
r poo
r far
mer
s?
The State of Agricultural Commodity Markets 2009 32
South Africa, the leading maize exporter in the region, respond slowly to changes in the world market price but that world market price signals do pass through across countries in the region. Between June 2006 and June 2008, the average
monthly rate of increase in the world market price for yellow maize amounted to 3.9 percent, compared with white and yellow maize average increases of 1.2 and 1.6 percent per month, respectively, on domestic markets.
Eastern Africa: maize prices
US$/tonne
Source: FAO.
Nairobi WorldKampala
0
100
200
300
400
200820072006200520042003
Rice prices in selected countries
US$/tonne
Source: FAO.Thailand (domestic)Philippines WorldIndiaBangladesh Indonesia
100
200
300
400
500
600
20072006200520042003

The State of Agricultural Commodity Markets 2009 33
to a cyclone and floods in 2007 contributed to significant increases in the domestic price of rice, while in Indonesia and the Philippines, rice
increase in domestic prices took place in 2007 and in most cases coincided with increased rice imports. In the case of Bangladesh, food shortages owing
FAO case study evidence on levels of smallholder market participation
Common to all the countries studied is
the significant heterogeneity of household
status with respect to maize production
and sales.
In Kenya, the proportion of maize sold is
relatively high at 46 percent of total
production. However, while 98 percent of
households cultivate maize, only 36 percent
sell the product, with 20 percent of households
accounting for the majority of sales.
In Zambia, about 80 percent of farm
households grow maize, but fewer than
30 percent of them sell the product. Of the
total sales, 40–45 percent come from
5 percent of farm households in the
smallholder sector. These households tend
to have incomes that are significantly higher
(8–9 times) and are located in areas more
accessible to markets than those households
that do not sell.
In Mozambique, production and sales are
also highly concentrated. Ninety percent of
households in the central region produce maize
but only 24 percent sell it. In the southern
region, 59 percent produce but only 4 percent
sell maize, and the average amount sold is only
150 kg per household per year. Five percent of
households account for 80 percent of sales
nationally.
In South Africa, 18 000 commercial farmers
account for 90 percent of grain production, with
the remaining 10 percent accounted for by
3 million smallholders.
The differentiation across households is
likely to become more distinct as average
landholding sizes continue to fall. In Malawi,
smallholdings have fallen from an average of
1 ha to less than 0.7 ha in the past 30 years. In
an “average” year, only 20 percent of maize
production is marketed.
Maize prices in important markets in Eastern African countries such as Kenya and Uganda also move together with the world price. On average, in the period 2003–08, world price changes filtered across these markets relatively slowly, with maize prices in Kenya and Uganda adjusting fully to world price changes after about seven months. Nevertheless, the large increase in the world price of maize from July 2007 onwards was reflected in both countries, suggesting that adjustment to world market price changes can be fast, especially when such changes occur simultaneously with low stocks or shocks in regional food supply or demand. In this period, the average monthly rate of growth in maize prices in Nairobi and Kampala amounted to 3.7 and 7.1 percent, respectively, compared with a world price monthly rate of 4.3 percent.
In the case of rice in Asia, the impact of world market price changes has varied from country to country, again depending on exchange rates against the US dollar, trade and market policies and the domestic demand and supply situation.
On average, the weakening of the US dollar in 2006–07 partly offset world price increases for a number of Asian countries. For example, in India, the Philippines and Thailand, the appreciation of the national currencies vis-à-vis the US dollar blunted world price increases at the border, resulting in different patterns of domestic price behaviour, mainly reflecting national market fundamentals and, in some cases, policy response to the international rice price boom. In India, a major exporter of rice, domestic prices increased at a moderate rate owing to increased production in the 2007–08 marketing season in conjunction with policy measures (implemented in the last quarter of 2007) that effectively banned most rice exports. In net importing countries, the larger part of the
Average monthly changes in domestic and world rice prices, 2006–2007
Percentage
Source: FAO.
0.0
0.5
1.0
1.5
2.0
World (US$)Thailand PhilippinesIndonesiaIndiaBangladesh
Domestic prices World prices in national currency
Why
wer
e hi
gh fo
od p
rices
not
an o
ppor
tuni
ty fo
r poo
r far
mer
s?
The State of Agricultural Commodity Markets 2009 34
imports rose in order to meet the increasing demand for food.
Even if there is transmission of international price changes to the national level, this does not necessarily mean that price increases will reach all producers or consumers, although consumers in urban areas may be more quickly exposed to price increases. How much producers are affected depends on the extent to which they participate in local markets and the extent to which local markets are linked with broader national, regional or international markets. It cannot be assumed that there is strong spatial price transmission and significant smallholder market participation in well-integrated markets. In many developing countries, these assumptions simply do not hold.
Smallholders are generally engaged in a different value chain from more commercial farmers. The latter may be linked to large grain-trading, processing and retailing firms, commodity exchanges, networks of integrated silos, millers, and supermarket retailers, sometimes with transnational firm ownership, accessible market information, large transaction volumes, well-specified grades and standards, and legal systems that accommodate more sophisticated contracting arrangements. This contrasts with the more informal chains in which smallholders are typically involved and which are characterized by spot market transactions, small percentages of production sold off the farm, weak road and communications infrastructure, weak information systems and limited coordination between input delivery, credit and sales.
There is considerable evidence that smallholders in Eastern and Southern Africa are only entering local-level markets as sellers of grain to a rather limited extent. Throughout the regions, the proportion of maize producers who are actively selling maize into local markets is low and there is often a
greater level of participation of producing households as purchasers rather than as sellers of maize.
Given the limited market participation by smallholders, it follows that price increases may not have much effect on production incentives for many rural households who are not participating in markets to any significant extent as sellers. Compounding this is the fact that many producers are effectively isolated from regional or international markets as a result of weakly integrated markets. In such cases, price increases at those market levels will have no effect on the situation of smallholders. Econometric studies of market integration and price transmission in Africa tend to confirm this view.

The State of Agricultural Commodity Markets 2009 35
W hatever improvement higher product prices might have made to the incomes of
producers, increases in input costs have worked against it or even cancelled it out. Input costs have been increasing steadily for some years and many farmers saw rising output prices as a temporary respite from diminishing margins over costs until input prices shot up dramatically in 2007, outpacing output prices.
The dramatic increase in oil prices that began in 2003 has had a profound effect on all economic sectors, including agriculture. Increases in fuel prices have raised the costs of producing agricultural commodities both directly by raising the cost of far power and transport, but also indirectly because oil is an important cost item in fertilizer production. The increase in energy prices has been both rapid and steep, with the Reuters-CRB energy price index more than tripling since 2003.
The US dollar prices of some fertilizers (e.g. triple superphosphate and muriate of potash) rose by more than 160 percent in the first few months of 2008 compared with the same period in 2007. This rate of increase in the price of fertilizer was
Prices increased but so did costs
Output to input price ratio: food vs inputs
Percentage
Sources: For food items, FAO and Commodity Research Bureau;for input items, FAO, Yara and Energy Information Administration.
Note: Output and input price indices are unweighted geometric means of the relative nominal prices of the individual commodity prices. The relative price of each commodity is the nominal price over the base period price (2003 = 100).
40
60
80
100
120
080706050403
1 Food price index: beans, butter, cocoa, cottonseed oil, hogs, lard, maize, steers, sugar and wheat. Input price
index: ammonia, urea, CAN, NPK, DAP and IRAC crude oil.2 Imported Refiner Acquisition Cost (IRAC) of crude oil in the United States of America.
Sources: For food items: FAO for meat, dairy, cereals, oils and sugar composites; and FAO and CRB for the food
price composite index. For input items: FAO-AGP, Yara and Energy Information Administration.
Changes in output and input prices for selected products and inputs (percentage)
(Jan–Apr) Meat Dairy Cereals Oils Sugar Food price index1
2008–07 9 49 80 94 23 52
2007–06 5 35 32 29 –39 12
(Jan–Apr) Ammonia Urea CAN NPK DAP IRAC crude oil2
Input price index
2008–07 82 31 85 213 163 70 99
2007–06 4 29 15 41 33 –3 19
Crude oil and fertilizer price indices
Index (1995 = 100)
Sources: International Fertilizer Association and OPEC.
Note: DAP = diammonium phosphate; OPEC = Organization of the Petroleum Exporting Countries.
Urea f.o.b. YuzhnyyPotash f.o.b. VancouverDAP f.o.b. North AfricaOPEC reference basket
0
200
400
600
08070605040302010099989796 95
greater than the rate of increase in prices for agricultural products.
The ratio of output to input prices provides a broad indication of how farm profitability is changing. The steady increase in input prices in the last decade has led to a declining trend in this ratio. Increasing productivity can offset the negative income consequences of a declining ratio but this did not happen in most developing country agriculture,
especially in Africa. The ratio deteriorated sharply with the sudden major increase in fertilizer prices in 2007. Furthermore, there is some evidence that, while output price increases are not completely and rapidly transmitted to producers, increases in the prices of inputs, especially where these are imported, are passed on fully and quickly.
Why
wer
e hi
gh fo
od p
rices
not
an o
ppor
tuni
ty fo
r poo
r far
mer
s?
The State of Agricultural Commodity Markets 2009 36
I f price incentives do materialize, the lack of integration into markets of many small producers prevents
them from responding. In many developing countries, the structure of smallholder agriculture has a significant impact in constraining supply response and it is changing – land–labour ratios are declining as population increases – in a way that could further lower smallholder producers’ capacity to respond to higher prices. Evidence from Eastern and Southern Africa shows that there is a high concentration of marketed maize among a small number of households (in some countries, 2 percent of households supply 50 percent of the total volume of marketed maize), and other smallholders are not making the investments needed to generate surpluses for sale on even moderately sized holdings (3–4 ha). In Uganda, smallholder agricultural production dominates, with farmers with an average landholding of less than 2 ha accounting more than 90 percent of total food production. Smallholder farmers account for about 80 percent of agricultural production in Ghana.
Throughout Africa, smallholder agriculture is often characterized by low productivity, rudimentary technology, minimal use of inputs (including fertilizers), problems with marketing systems and high crop losses. Agricultural yields have remained relatively unchanged, with much farming conducted by the elderly with little or no knowledge of modern farming practices. The incentives for investment in terms of adequate and stable levels of profitability have been lacking, but there are also significant constraints to the adoption of improved technologies, such as shortage of locally improved seeds, planting materials and other inputs. Although access to inputs has improved in some countries following reforms, with more licensed dealers and smaller quantities available for purchase, input use by
smallholders remains low and constrains productivity.
The small quantities of products available to sell and a frequent lack of organization among smallholders to bulk these together into more economic volumes, together with the high cost of marketing owing to weak infrastructure and communications, mean it is not surprising that supply response to better prices is weak. Yet without that supply response, funds are not generated for investment. Throughout the production and marketing chain, a lack of access to affordable credit further limits the feasibility of productivity-improving investments. These constraints need to be overcome to allow a significant supply response, and policy interventions are needed to break out of this vicious circle that traps small producers in poverty.
Development of physical infrastructure appears to be of particular importance in most developing countries. Well-developed transport, communication, storage and marketing infrastructure can facilitate the selling of output and the buying of inputs. Numerous FAO case studies from all over the developing world show that deficiencies in transport infrastructure are a major constraint, limiting access to domestic, regional and international markets.
Credit markets facilitate production, consumption smoothing and the development of new enterprises. They are an important mechanism to assist the poor in adjusting to a new economic environment. Limited access to financial services (both credit and savings) has exacerbated vulnerability to shocks. However, most Structural Adjustment Programmes have reduced the availability of credit to rural households and raised its cost.
FAO studies report widespread difficulties for farmers in accessing credit. Small-scale farmers in Cameroon have little access to credit. Microfinance
Supply-side constraints
The State of Agricultural Commodity Markets 2009 37
institutions were set up in 1992, but they remain poorly distributed throughout the country and sometimes lack good managerial practices. Smallholder farmers in Malawi face credit constraints, with microfinance institutions tending to emphasize finance for off-farm business activities, and much of the available agricultural credit is confined to the tobacco sector. Small- and medium-scale traders in the United Republic of Tanzania cannot access the credit that would enable them to purchase stocks of produce and sell out of season at higher prices. Some farmers have shifted away from the production of cash crops such as cotton because food crops can more easily be sold on cash terms. In Uganda, the only source of credit for rural dwellers is the microfinance industry, which favours non-agricultural activities. Attempts are currently underway in Uganda to develop financial services that meet the needs of the rural population and integrate them into the national financial system. In Guatemala, agricultural credit availability is low and declining. Most available credit is channelled towards export products (traditional and non-traditional) with little support for basic grains production. Guyana has attempted to overcome the problems concerning obtaining acceptable forms of collateral security faced by many small farmers. The Institute of Private Enterprise Development (IPED) was established in 1986 as a local non-governmental organization (NGO) to provide loans to small entrepreneurs. It uses a cross-guarantee system, whereby each member of a small group is liable for the debts of the others. The IPED has been instrumental in facilitating output increases for a number of small producers. On the other hand, the experience with government credit provision schemes in Peru was not positive, with massive losses in capital reported. Most of the credit to the
agriculture sector now comes from commercial banks, and there was a dramatic reduction in the number of small farmers supported by the formal financial system during the 1990s.
Can developing country farmers respond to high food prices?
It is claimed that the recent high food prices present an opportunity for the agriculture sector in developing countries to increase production, raise incomes and re-establish itself as an engine of growth. While there is some evidence that output responds positively to real price increases and negatively to decreases, this is not always found to be the case. A wealth of FAO case study evidence shows that price increases alone are not enough to increase productivity and supply. In a review of 150 episodes of price and production changes in the recent past, FAO found that only in 66 percent of cases was the response in the direction expected, with 34 percent of cases either reporting an increase in production when prices were falling or a decrease in production when prices were increasing. Overall, the picture is mixed regarding how developing country farmers are likely to react to high product prices.
What is clear is that higher output prices alone are not sufficient to encourage a significant expansion in food supplies. A significant supply response requires investment to increase smallholder productivity. Expanding production into new land will not be enough to meet future food needs. In order to match the global demand for affordably priced food by 2050, annual food production must increase by more than one percent annually, and an estimated 80 percent of the increase will have to come from growth in yields. Moreover, productivity-led increases in food and agricultural production will increase not only farm incomes, but will also stimulate
backward and forward linkages in the rural economy and lead to a reduction in poverty.
Significant supply response based on productivity improvement requires a favourable and stable incentives environment in which higher commodity prices are transmitted to the farm level and producers have access to affordable inputs and can deliver their output to market. This requires addressing the various structural constraints that limit smallholder productivity – rudimentary technology, lack of access to modern inputs and credit, poor marketing and transport infrastructure, and ineffective rural services and institutions. Effective government policies have a role in ensuring that the necessary conditions are met. For example, successes in transforming agriculture in India were based on state support to credit, inputs and irrigation infrastructure, which the market had failed to provide. However, the wrong policy choices can block the transmission of higher prices to producers, stifle incentives and discourage supply response.

The State of Agricultural Commodity Markets 2009 38
Part 3What should the policy response be?
The State of Agricultural Commodity Markets 2009 39
F aced with rapidly increasing food prices, many countries made policy changes or introduced new
policy measures. High food prices pose a series of interrelated policy challenges. Most obviously, there is the short-run emergency of ensuring affordable food supplies for poor consumers in order to avoid increasing the incidence of malnutrition. While this can be achieved to some extent at least with available food supplies, there may also be some scope for measures to increase food production and moderate prices even in the short run. However, the main potential for a significant supply response and more stable prices is in the medium to longer term. The current problems reflect the continuing underlying precariousness of the food security situation in some countries and this needs to be rectified. High prices provide an incentive and an opportunity to producers in developing countries but, as indicated above, there are many constraints to be overcome if a significant supply response is to materialize in the medium to longer term. Actual policy interventions by governments around the world have emphasized a limited range of easy, fast-acting and cheap measures (especially trade policy measures) to secure food supplies for domestic markets and to moderate the cost to consumers. This short-termism, while entirely understandable in view of the emergency situation, means that in many cases medium- and longer-term needs to raise production have been neglected. Efforts to protect consumers from higher food prices need to be balanced against maintaining incentives for producers to achieve the productivity and production increases that are necessary to stabilize prices and supplies. Some of the short-term measures introduced by governments to address the immediate food security needs of poor consumers have held down prices for producers and,
hence, incentives to invest in increasing productivity and production. There is a need for policy measures to be targeted, non-distortionary and positive towards agricultural investment.
Policy problems are not confined to the agriculture and food sectors. High food prices also have macroeconomic impacts. For food importers, these include balance of payments problems resulting from higher food import bills and increased inflationary pressure because food is such a large element in the consumer’s basket of goods. Food exporters enjoying higher earnings from higher food prices on world markets may need to consider how best to manage increased export earnings in order to ensure that they are channelled into productive investments to stimulate long-run growth.
What are the policy problems?

Wha
t sho
uld
the
polic
y re
spon
se b
e?
The State of Agricultural Commodity Markets 2009 40
N ational policy responses to high food prices have varied in nature and effectiveness.
In many cases, governments have used existing policy measures already in place. The policy responses made can be grouped into three broad categories, targeting consumption, trade and production, respectively (see Annex Table 1). There appears to have been relatively little action on longer-term measures.
Safeguarding food consumption
Many countries, especially least developed countries (LDCs), have intervened to safeguard poor consumers’ access to food though a variety of emergency and “safety net” measures. These have included distribution of basic food staples (grains, bread and milk), cash to buy food (or food for work) to the most vulnerable groups – the poorest in urban and rural areas, schoolchildren or the sick in hospitals. Consumer price subsidies, especially for the main food staples, have been widely used. At the same time, some governments have also reduced consumption taxes. For example, price controls, through sales from public stocks at pre-set prices or simply freezing retail prices by decree, have also been used.
An FAO survey of 77 countries shows that 55 percent of them have used price controls or consumer subsidies in an attempt to reduce the transmission of price increases to consumers (see box). While such measures can be effective in controlling prices in the short run, they are expensive in terms of scarce budgetary resources and can distort food markets. Price controls can lead to rationing and suppress incentives to producers. Income transfers are less distortionary than subsidies on food and can be targeted on the poor and vulnerable, whereas non-selective
blanket subsidies and price controls benefit the rich and poor equally. This also applies to other safety nets such as food and nutrition programmes.
Encouraging food imports and discouraging food exports
Many countries have introduced trade policy measures to curtail price increases and ensure adequate supplies on domestic markets. These include tariff reductions to facilitate imports, export bans and taxes to divert supplies onto domestic markets. More than half of the 77 countries in the FAO survey had reduced grain import tariffs and one-quarter had imposed export controls of some kind – either taxes or physical controls such as bans and quotas. In the short term, these trade measures are feasible, cheap and easy to implement. However, they may have adverse effects on incentives to expand food supplies through increased domestic production and on world markets by further restricting supplies and pushing up prices even more. While imposing export taxes raises some additional government revenue, a number of exporting countries have reported that export controls and, hence, low output prices coupled with high input prices actually led to decreased planting of cereals. Reducing import tariffs also incurs a loss of tariff revenue, which may make an important contribution to overall budgetary resources for development.
Boosting agricultural production
Reducing producer taxes, especially on grain production, has been a widely used policy to boost production in both low- and middle-income countries. Production subsidies, especially on grain production, have been used to reinforce incentives. Subsidies on inputs such as
How have developing countries responded?

The State of Agricultural Commodity Markets 2009 41
fertilizer and seeds have also been common. While such subsidies and the distribution of productive inputs (e.g. seeds and fertilizers) can provide a short- or medium-term stimulus to production, these schemes can be costly and may lead to suboptimal use of these inputs, especially if they are maintained over a
long period. In spite of a perceived need to secure adequate food supplies, some countries continue to control producer prices, setting the price lower than the free market price, or procure grains from domestic suppliers at low prices for stockholding. Moreover, the release of grain stocks at low prices puts
FAO survey of policy responses
A survey of policy responses for 77 countries
undertaken in May 2008 revealed the
following: reduction in or elimination of
cereal import duties in about half of the
77 countries; price controls or consumer
subsidies in 55 percent of the countries;
some form of export restrictions, including
taxes, in one-quarter of the countries; and
roughly the same proportion took measures
to increase supply, drawing on cereal stocks.
On the other hand, only 16 percent of
countries surveyed had implemented no
policy responses whatsoever.
Policy responses also varied considerably
by region. Countries in East Asia, South Asia
and the Near East and North Africa
undertook significant activities in all four
areas of intervention. In every geographical
region except sub-Saharan Africa,
50 percent or more of the countries reported
using price controls or consumer subsidies.
On the other hand, the regions of sub-
Saharan Africa and Latin America and the
Caribbean showed the lowest level of policy
intervention, with roughly 20 and 30 percent
of their countries, respectively, reporting no
activity in any of the policy categories listed
above.
Percentage
Policy actions to address high food prices(sample of 77 countries by region)
Source: FAO.
0
20
40
60
80
100
SouthAsia
Near East/NorthAfrica
LatinAmerica/
Caribbean
Europe/Central
Asia
EastAsia
Africa
Reduce taxes on foodgrains
Increase supply usingfoodgrain stocks
Export restrictions
Price controls/consumer subsidies
None
44%
22%
19%
33%
22%
80%
80%
40%
80%
0%
33%
0%
33%
67%
0%
44%
0%
19%
50%
31%
60%
60%
20%
100%
0%
78%
56%
44%
67%
11%
Policy actions to address high food prices (sample of 77 countries by type of action)
Source: FAO.
0 10 20 30 40 50 60
None
Price controls/consumer subsidies
Export restrictions
Increase supplyusing foodgrain stocks
Reduce taxeson foodgrains
Percentage
downward pressure on prices, discouraging increases in domestic production.

Wha
t sho
uld
the
polic
y re
spon
se b
e?
The State of Agricultural Commodity Markets 2009 42
A s the previous section showed, governments around the world have responded to high food
prices with a variety of policy measures. Understandably, these have emphasized a limited range of fast-acting measures to secure food supplies for domestic markets and to moderate the cost to domestic consumers. However, the medium- and longer-term needs to increase food production and the international implications of unilateral national policy choices should not be overlooked. What the “best” policy choice is depends on a variety of considerations including the cause of the price increases, the severity of their impact, the size of the vulnerable population groups, their location, the policy options and policy space available to the government, the financial and budgetary situation, and the administrative and institutional infrastructures to implement policies. This section looks in more detail at the policy options and reviews the pros and cons of the various policy instruments available. These address two basic challenges. The first is to provide direct support to consumers, especially those in vulnerable groups, to help them maintain their food consumption levels through so-called “safety net” measures. The second is to increase supplies of food on domestic markets through manipulating food stocks or trade or by stimulating a short-run supply response from the domestic agriculture sector. Ultimately, it is increasing agricultural productivity and production that is the foundation for achieving adequate and stable food supplies and prices in the medium and long term, and care must be taken to ensure that short-run emergency measures do not compromise this goal.
Safety nets for poor consumers
“Safety net” is an umbrella term that covers various programmes aimed at assisting vulnerable population groups. It
includes targeted food distribution programmes, targeted cash transfer schemes, feeding programmes and employment schemes. Many countries have one or more safety net programmes with varying degrees of coverage of the population and the extent of assistance delivered. An employment scheme may also be a guaranteed programme, backed by legislation. The case for targeted interventions can be made on budgetary cost grounds or to avoid leakage to non-poor populations. Although they can be administratively burdensome, they can be narrowly targeted on beneficiaries without creating distortions in the markets. A “food for work” programme can also be made self-targeting by the choice of the food distributed, the food that the poor consume, or by targeting an area with most vulnerable population groups.
In the context of high food prices, one of the problems noted is that not all countries have safety net programmes in place because of their budgetary costs and administrative complexity. Where this is the case, it will be very difficult to put in place a scheme in a short period, given the administrative, institutional and other supports required for this. It is only where such a scheme already exists that it can be scaled up when an emergency arises.
Cash transfers can include the distribution of cash or cash vouchers and can be tied to cash for public works programmes and/or microfinance initiatives. They are appropriate where food markets work and improved access to food is the objective of the intervention. In addition to providing the ability to procure higher-priced food, unrestricted cash transfers allow households to make decisions as to how to spend or invest the cash. For example, some households, in allocating labour to on-farm activities, may have produced sufficient food but may have limited cash for other consumption or investment needs. Such interventions can also foster local market development in food and other goods by
What policy measures should be taken?
The State of Agricultural Commodity Markets 2009 43
providing greater incentives to the private sector to engage in higher-volume, more stable marketing channels.
However, where markets work imperfectly, for example, where they are poorly integrated with other markets or where there is limited supply response to increased prices, such interventions can result in price inflation as the increased spending power bids up the prices of scarce goods. The design should be appropriate – in some contexts, increasing public-sector wages as a means of transferring cash can assist poorer urban consumers, but in other contexts, the poor are engaged primarily in informal-sector activities and may not benefit. Where food prices are increasing rapidly, adjustment to the value of transfers will be needed in order to maintain purchasing power, and this can be administratively difficult.
Other schemes aimed at ensuring that the poor have access to food offer less flexibility than straight cash transfers. Such interventions include food stamps or vouchers and conditional cash transfers (e.g. in exchange for attendance at schools or clinics). As with cash transfers, these interventions are appropriate where local food markets work and improving access to food is the objective. Vouchers can become a parallel currency in markets for food and other goods. As such, they can have some of the positive effects of unrestricted cash transfers in fostering local market development, but they tend not to be used for investment. The schemes tend to have higher transaction costs than cash-based measures and although restricting undesirable consumption may be an objective, this can be difficult. The design of these interventions can be complicated. For example, school feeding programmes can miss target populations, such as poor households without children who attend school. It is important, as with cash transfers, to determine ex ante any potential disruption to private marketing channels. Approaches such as vouchers, cash transfers and nutritional programmes should only be implemented in combination with targeted food sales through public food stores if private channels are constrained in their ability to scale up distribution. Otherwise, the side-benefit of fostering local market development will be diluted.
Local food supplies can also be augmented directly through the distribution of food aid, which is most appropriate where insufficient food supply is the main reason for reduced consumption. In such cases, cash transfers would result in price inflation, particularly where markets are not functioning well, or where food is in short supply as a result of weakly integrated markets, whether infrastructure- or policy-constrained. Food aid is also more difficult to divert to undesirable consumption and, therefore, is more appropriate in such situations. In addition, it places a lower budgetary strain on government resources.
Managing markets and stocks to increase food supplies
Governments in many countries also resort to a variety of other measures that may be called “market management policies”. These could include measures such as price controls through administrative orders, restrictions on stockholding by private traders, restrictions on interdistrict movement of foods, antihoarding measures, restrictions on futures trading of basic foods and open market operations selling public stocks of foods with a view to lowering market prices. These measures were fairly widespread in many developing countries in the 1970s and 1980s but have been discontinued in normal times for not being “market friendly” or pro-private-sector development. However, the fact that governments resort to such measures during food crises shows that they can help the situation to some extent.
Experience has shown that many of these measures may work for a very short period. However, they could also be destabilizing, as economic agents often react by hoarding and thus add to further price rises, defeating the basic purpose of such measures. The longer-term solution to this problem is to take measures to nurture various elements that will ensure that food markets function well and are competitive. The concentration of market power, observed typically for semi-processed or processed agricultural products, is perceived by society at large – as well as by the government – as a major source of the problem. The solution lies in effective pro-competitive policies
that are lacking in many developing countries.
An important market management policy is open market operations – the selling of publicly held stocks to lower or stabilize domestic market prices. These operations used to be fairly widespread but many countries have now eliminated such programmes. In Asia in particular, these measures are actively used. Examples are open market operations by the Food Corporation of India, Badan Urusan Logistikin in Indonesia and the Rice Marketing Board in Viet Nam. The government parastatals maintain the food reserves through domestic purchases or imports, including food aid, and release the stocks when food prices begin to rise, which could be for seasonal reasons or owing to increased prices in the world markets.
The effect of these measures is to check food prices in the short run. However, food availability can only be augmented and prices restrained by releasing public stocks if adequate public stocks exist. This can be problematic given that maintaining stocks is a high-cost operation. Furthermore, releasing public stocks to hold down prices can have a negative impact on incentives for producers and traders, discouraging production expansion and investment. Unlike safety net measures, these operations cannot be targeted and they also benefit rich consumers who may not need the support.
Given the high costs associated with open market operations and the potential for unintended negative effects, most governments have preferred to rely less on stocks operations and more on trade policy measures to encourage imports or restrict exports for price stabilization. Trade measures are discussed below. However, where governments do not perceive trade to be a reliable source of food at short notice, some stockholding and open market operations are still carried out.
Cutting tariffs to increase food imports
Import tariffs raise the price of imported foods, protecting domestic production from international competition and in the process providing tariff revenues for the government. Reducing import tariffs increases the volume of imported food,

Wha
t sho
uld
the
polic
y re
spon
se b
e?
The State of Agricultural Commodity Markets 2009 44
adding to domestic supplies and slowing the increase in domestic prices. Being a policy that affects the market as a whole, reducing import tariffs has an impact on all households, food-insecure as well as food-secure, in contrast to the kinds of targeted policies described earlier. As prices climbed through 2007 and into 2008, many countries lowered tariffs initially, eventually eliminating them as world prices continued to soar. As there needs to be scope to reduce tariffs significantly to be able to offset such dramatic price increases, so tariffs have to be high enough to begin with to permit this. However, while the tariff rates “bound” in the World Trade Organization (WTO) might be high, those actually charged – the “applied” tariffs – tend to be much lower. Available tariff data show that the majority of developing countries did not have applied tariffs high enough to be able to use them to stabilize domestic prices as prices soared. In a sample of 60 LIFDCs, applied tariffs on cereals and key vegetable oils were already quite low in 2006 – in the range of 8–14 percent on average – and tariffs were much lower than these averages for the majority of LIFDCs. This means that reducing these applied rates, even to zero, was sufficient to stabilize only a small part of the overall rise in the world prices, which were higher by at least 50 percent in 2008 compared with 2006 levels. Therefore, tariff reductions alone could not be relied on to counter the dramatic increase in food prices. Reducing or eliminating import tariffs also reduces tariff revenues, which can be an important source of budgetary funds for many governments. Reducing all food import tariffs to zero would have cost LDCs about US$2.1 billion in lost revenue.
Besides reducing domestic prices and, therefore, the incentives for farmers and food manufacturers to invest and produce more, reducing import tariffs exposes the domestic agriculture and food sectors to greater international competition. Increased competition can provide a challenge to domestic food production to make additional efforts to increase competitiveness for the benefit of consumers. However, in many developing countries, the agriculture and food manufacturing sectors are weak and may not be able to withstand competition easily, especially where it is from imports
whose production receives support. Therefore, there is the risk of compromising efforts to develop domestic agriculture and food sectors. Reductions in import tariffs may also have an impact on the country’s exchange rate as they increase the incentive to import and reduce foreign currency reserves. This can lead to a depreciation of local currency, especially in the agriculture- and food-dependent economies. If agricultural inputs are imported and paid for in increasingly high-value foreign currencies, then the risk of high food prices could re-emerge, cancelling out the price reduction effects of the import tariff cut.
Restricting exports to increase domestic food supplies
About one-quarter of the countries in the FAO survey resorted to some form of export restrictions in attempts to ensure domestic food availability. These restrictions range from increasing or imposing export taxes through to outright export bans. They have been perhaps the most controversial of the various policy measures introduced in response to rising food prices. However, current WTO rules do not constrain policies on export taxes, while those on export restriction and prohibition are also very weak and essentially non-binding. By diverting a certain volume of food that would otherwise have been exported to the domestic markets, domestic prices are reduced, thereby providing relief to consumers. Where export taxes are used, the government also raises tax revenue, which might be used to fund other measures such as safety nets. On the other hand, by reducing domestic prices, export restrictions reduce incentives to producers. Producers may shift resources away from the taxed commodities to other activities. Therefore, the eventual result could be a decline in productivity and production, which might reverse the decline in prices that the policy initially intended to achieve. However, the main criticism of export restrictions is that they make the international market smaller and can exacerbate price instability in world markets, thus hurting consumers in other countries. This is especially so where the country imposing the export restrictions is a significant exporter of the

The State of Agricultural Commodity Markets 2009 45
product in question or where internationally traded volumes are small. Export restrictions also have longer-term implications – producers in the exporting countries may be discouraged from investing in agriculture and the price competitiveness of the export products in international markets is negatively affected. For net importing countries, the image of the world markets as reliable sources of food supply could be undermined, leading towards a policy of import substitution. As with cutting import tariffs, export restrictions may also have an impact on exchange rates. As export earnings decline, there will be pressure on the local currency to depreciate, increasing the domestic prices of imported goods, including agricultural inputs (adding a further disincentive to expand food production).
Overcoming supply-side constraints and institutional weaknesses
In the medium to longer term, increased productivity and production are seen as the structural solution for stable food supplies and prices. In principle, high agricultural prices provide producers with an incentive to expand production. In this sense, the high food prices can be seen as an opportunity. However, in many cases, realizing this supply response will require overcoming a variety of supply-side constraints. These include not only high input costs and a variety of infrastructural obstacles but also institutional weaknesses that lead to inefficient marketing systems and problems of access to inputs, credit and technology. Institutional weaknesses are a major cause of poor performance of developing country agriculture, especially in food production in Africa.
In general, these supply-side constraints cannot be addressed and overcome in the short run. However, there may be some scope for immediate action to improve access to necessary inputs, (e.g. seeds and fertilizers) that can enhance food availability in the following growing season. If implemented effectively, these immediate interventions can increase the income of small producers and may reduce price increases in local markets, thereby contributing to improvements in the
nutritional status of net food-buying families. However, the budgetary costs of programmes to improve access to inputs can be high. Such programmes might include productive safety nets (e.g. seed and fertilizer distribution), smart subsidies to reduce selectively the cost of fertilizers and seeds, and support to finance institutions to help alleviate credit constraints. Efforts to improve access to inputs in the short run need to be designed carefully in order to avoid any potentially adverse side-effects, taking account of the availability of additional inputs and the possible impact on private-sector distribution networks. Where input markets are working and inputs are available but producers do not have the cash to buy them, voucher systems are appropriate, as free distribution could undermine input markets. Where input markets are not working, starter packs could be distributed. However, if local output markets are not well integrated, such interventions, in promoting increased production, could result in a fall in local food prices to the detriment of producers and wage labourers.
Short-term measures to improve access to inputs need to be supplemented and supported by longer-term actions to address institutional weaknesses, including facilitating the development of the private sector. These actions include research and dissemination of improved technologies through more effective extension systems, development of market and credit infrastructure and capacity building. Support needs to focus particularly on enabling poor rural producers – those least able to respond to changing market signals – to expand their production and market their supply. Often, they do not have even the basic information necessary to make rational and efficient choices about what to produce and how. They need information on market opportunities, price trends, appropriate input packages and production and marketing alternatives. Agricultural research needs to focus on the needs of these poor rural producers, and their capacity to take advantage of research results needs to be strengthened through more effective extension networks. The scope of individual smallholders to contribute to increased food supplies is limited by the economics of marketing outputs and buying inputs,
which require a certain scale of operation to be viable. For example, there are significant economies of scale in the transportation of fertilizers, and it may be uneconomic to supply individual smallholders whose needs are small. However, individual smallholders can benefit from these economies of scale if they organize themselves to collaborate in accessing inputs (including credit) and marketing outputs. Organizing themselves into groups to market their outputs collectively can reap economies of scale in storage and in transporting products to market. Farmers’ organizations, cooperatives and producer associations can all help smallholders to access inputs and market outputs more efficiently and on better terms. However, many producer organizations are weak. They also need support to strengthen their capacity to fulfil these roles.
Managing increasing food prices for investment
While high food prices can be seen as an opportunity to kickstart agricultural growth, the agriculture sector and commodity-producing households may fail to benefit in the long run if the high-price windfalls are consumed right away instead of invested. Unless the institutional environment in a country assists in the creation of investment opportunities, high prices will have no permanent impact on the sector. Governments play a crucial role even if the sector is not protected or characterized by price or trade policies. Commodity price booms have to be appropriately managed by producers, consumers and governments if they are to result in sustained benefits for commodity-producing countries and minimum costs for importing countries. Policies need to be put in place to provide incentives to private agents and promote favourable economic conditions for investment that will lead to long-run sustained growth and poverty reduction. This involves macroeconomic as well as sectoral policy measures.
Can the risk of high prices be managed?
Volatility in agricultural commodity prices creates risks for market participants whether as producers (revenue and export

Wha
t sho
uld
the
polic
y re
spon
se b
e?
The State of Agricultural Commodity Markets 2009 46
earnings risk) or as consumers (food import bill risk). Increasing international food prices prompt the interesting question of the extent to which commodity-dependent and net food-importing developing countries might benefit in the future from an increased use of market-based risk management tools to hedge against world market fluctuations. Futures, options and other forms of derivative contracts can be considered as tools to hedge against unpredictable changes in both import and export prices. However, such instruments are not designed to stabilize export revenues or import bills but only to make them more predictable. This can be beneficial to the extent that it allows proper planning of financial and other resources. In theory, the unpredictability of the import bills and export revenues of developing countries might be reduced through appropriate hedging. However, in most countries, a number of institutional obstacles need to be overcome before hedging the national import or export positions with the aim of promoting food security would become feasible.
Policy choices and complementarities: the need for a twin-track approach
Determining appropriate policy solutions to the problems caused by the recent sustained high food prices is not straightforward given the needs both for immediate action to protect the food security of vulnerable groups and for establishing a foundation for more stable prices and supplies in the future. There is a potentially strong relationship between measures to protect consumers against higher food prices and the enhancement of agricultural productivity. Well-designed complementary policy measures can encourage risk-averse food staples producers to take the risks necessary to invest in improved technologies. They can stimulate local market development, increasing volumes and reducing volatility. However, if poorly designed or implemented, they can distort incentives, discourage investment and be unsustainable in terms of budgetary resources. Clearly, this kind of policy conflict needs to be avoided. What is required are non-distorting safety net measures to address the immediate food
security problems of the vulnerable poor coupled with incentives and support for the investment and productivity growth needed to ensure continuing food security in the longer term. Such a twin-track approach provides a coherent policy strategy that avoids the policy conflicts warned against above. However, budgetary costs can be prohibitive for some governments and the scope for financing such schemes through internal or external borrowing can be limited. Therefore, there is a need for international support.
The State of Agricultural Commodity Markets 2009 47
of the WTO and under negotiation in the Doha Round. Disciplines agreed in the WTO have a bearing on the choice of policy responses to high food prices.
High food prices are an issue of global dimension and, therefore, a matter for international debate and international action. The international community mobilized to deal with what was seen as an international food crisis through actions to mitigate the negative impact of high food prices on the poor and food-insecure and to help millions of poor farmers around the world seize the opportunity provided by greater demand for their products. The immediate food needs of the poor are being addressed through short-term actions that include increasing resources for food aid and safety nets in developing countries, providing more balance of payments and budget support to help meet increased food and energy bills, and financing emergency programmes aimed at increasing agricultural production in food-deficit countries. In the medium term, efforts are being made to restore agriculture to the centre of the development agenda, reversing the long-term decline in agricultural investment to ensure that it can continue to meet the demands of a world population that is increasing and becoming more urbanized and wealthier. In addition, greater policy coordination is being promoted to assist countries in making efficient policy choices, to maximize synergies in responding to high food prices and to avoid situations where one country’s market intervention hurts others.
International support to meet immediate food needs
The top immediate priority is to ensure access to food for the most vulnerable. Expanded safety net programmes along the lines described above are seen as the most effective way of achieving this. They would include assistance in the form of food, vouchers or cash transfers,
T here appears to be an expanding consensus that the appropriate policy response to sustained high
food prices should be a package of safety net measures to address immediate food security needs and targeting those worst affected, accompanied by measures to encourage and facilitate supply response to stabilize supplies and prices in the medium and longer terms. However, it is also recognized that not all developing countries will have the resources, institutions or knowledge to design and implement such policies. Safety nets have a high budgetary cost and are administratively burdensome. Policies aimed at sustainable expansion of food supplies are also demanding in budgetary terms, requiring a reversal in the downward trend in investment in agriculture. As a result, many have resorted to cheaper and more readily implemented policies that aim to boost food availability and restrain prices on domestic markets but which may compromise incentives to producers to increase production and productivity and may have adverse effects on trading partners. Therefore, many countries need international support in the form of resources and technical assistance. The domestic policy problem also has an international dimension in that, most strongly in the case of export restrictions, policies introduced by one country to increase local food availability and restrain prices can reduce availability and increase prices to other countries. Thus, there is also a need for at least international discussion of policy choices to promote coordination and avoid these negative side-effects. The issues of high food prices and the impacts of policy are not only the preserve of developing countries. Developed-country policy choices, e.g. in relation to biofuels, are also relevant to the discussion of what should be done. More generally, many aspects of international food market developments and policy are the concern
employment programmes (food or cash for work), school feeding and insurance schemes. Targeted programmes addressing the most vulnerable groups need to be scaled up. However, safety net programmes involve significant budgetary costs, which many developing countries will require international support in order to meet. For food-deficit countries, increasing food prices push up their food import bills, which together with higher energy costs lead to a need for balance of payments support. The IMF and the World Bank have an important role to play in providing balance of payments and budget assistance to those countries. Failure to do so runs the risk of jeopardizing important development programmes and projects as scarce national resources are diverted to meet immediate food import requirements.
Food aid was declining even as the need for it was increasing rapidly. Aid agencies found food more costly to procure as food prices increased. This prompted requests from aid agencies such as the WFP for additional funding even to maintain their current levels of assistance. Their difficulties were further compounded by increasing transportation costs. Given the high food prices, the declining trend in food aid needs to be reversed, with greater international support for relief agencies, particularly the WFP and the United Nations Children’s Fund (UNICEF). High food and fuel prices mean that food aid can reach fewer people with the same resources. Food aid deliveries from the WFP declined almost continuously from 15 million tonnes in 1999 to 7 million tonnes in 2006. The cost to the WFP of delivering food to beneficiaries increased by more than 70 percent in the period 2002–07. Further increases between the end of 2007 and early 2008 meant additional costs simply to maintain the current low levels of assistance. The WFP and UNICEF have extensive experience in the development of safety net programmes, and in targeting
The need for international action
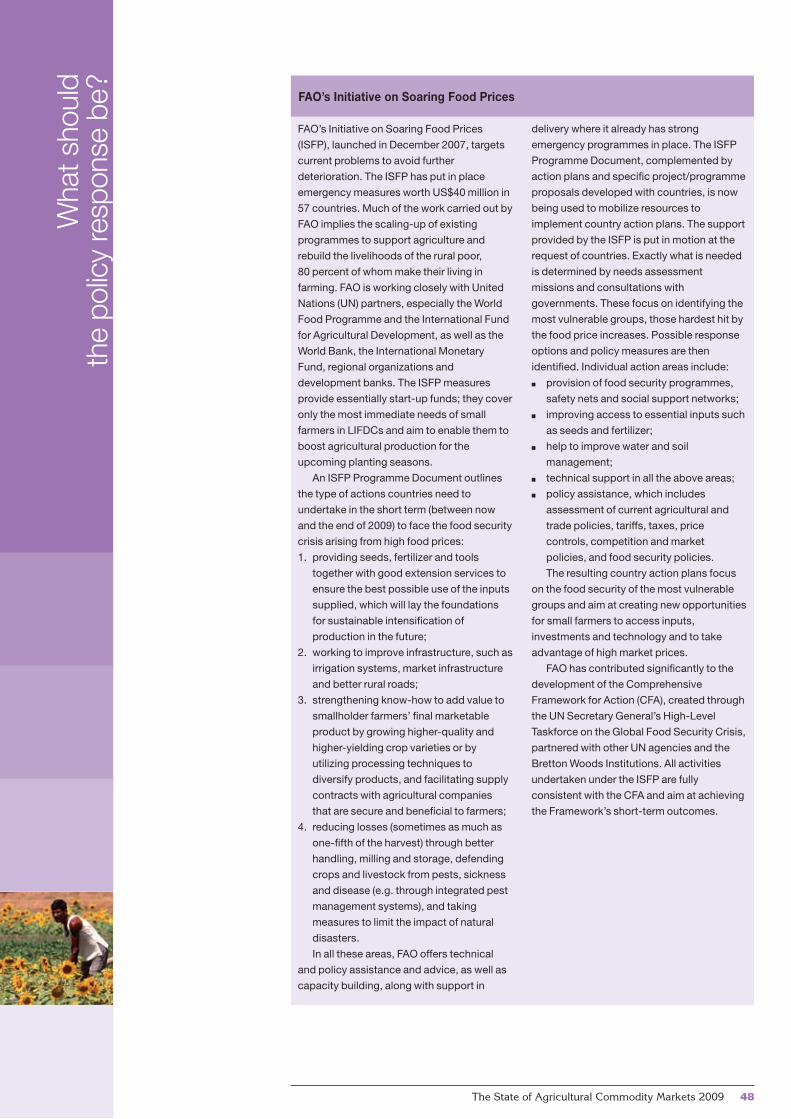
Wha
t sho
uld
the
polic
y re
spon
se b
e?
The State of Agricultural Commodity Markets 2009 48
FAO’s Initiative on Soaring Food Prices
FAO’s Initiative on Soaring Food Prices
(ISFP), launched in December 2007, targets
current problems to avoid further
deterioration. The ISFP has put in place
emergency measures worth US$40 million in
57 countries. Much of the work carried out by
FAO implies the scaling-up of existing
programmes to support agriculture and
rebuild the livelihoods of the rural poor,
80 percent of whom make their living in
farming. FAO is working closely with United
Nations (UN) partners, especially the World
Food Programme and the International Fund
for Agricultural Development, as well as the
World Bank, the International Monetary
Fund, regional organizations and
development banks. The ISFP measures
provide essentially start-up funds; they cover
only the most immediate needs of small
farmers in LIFDCs and aim to enable them to
boost agricultural production for the
upcoming planting seasons.
An ISFP Programme Document outlines
the type of actions countries need to
undertake in the short term (between now
and the end of 2009) to face the food security
crisis arising from high food prices:
1. providing seeds, fertilizer and tools
together with good extension services to
ensure the best possible use of the inputs
supplied, which will lay the foundations
for sustainable intensification of
production in the future;
2. working to improve infrastructure, such as
irrigation systems, market infrastructure
and better rural roads;
3. strengthening know-how to add value to
smallholder farmers’ final marketable
product by growing higher-quality and
higher-yielding crop varieties or by
utilizing processing techniques to
diversify products, and facilitating supply
contracts with agricultural companies
that are secure and beneficial to farmers;
4. reducing losses (sometimes as much as
one-fifth of the harvest) through better
handling, milling and storage, defending
crops and livestock from pests, sickness
and disease (e.g. through integrated pest
management systems), and taking
measures to limit the impact of natural
disasters.
In all these areas, FAO offers technical
and policy assistance and advice, as well as
capacity building, along with support in
delivery where it already has strong
emergency programmes in place. The ISFP
Programme Document, complemented by
action plans and specific project/programme
proposals developed with countries, is now
being used to mobilize resources to
implement country action plans. The support
provided by the ISFP is put in motion at the
request of countries. Exactly what is needed
is determined by needs assessment
missions and consultations with
governments. These focus on identifying the
most vulnerable groups, those hardest hit by
the food price increases. Possible response
options and policy measures are then
identified. Individual action areas include:
n provision of food security programmes,
safety nets and social support networks;
n improving access to essential inputs such
as seeds and fertilizer;
n help to improve water and soil
management;
n technical support in all the above areas;
n policy assistance, which includes
assessment of current agricultural and
trade policies, tariffs, taxes, price
controls, competition and market
policies, and food security policies.
The resulting country action plans focus
on the food security of the most vulnerable
groups and aim at creating new opportunities
for small farmers to access inputs,
investments and technology and to take
advantage of high market prices.
FAO has contributed significantly to the
development of the Comprehensive
Framework for Action (CFA), created through
the UN Secretary General’s High-Level
Taskforce on the Global Food Security Crisis,
partnered with other UN agencies and the
Bretton Woods Institutions. All activities
undertaken under the ISFP are fully
consistent with the CFA and aim at achieving
the Framework’s short-term outcomes.

The State of Agricultural Commodity Markets 2009 49
them to the most vulnerable especially women and children. However, they require additional resources in order to respond effectively to the current situation.
Some scope exists for increasing food supplies from domestic production in the short run. Support needs to focus particularly on enabling poor rural producers – those least able to respond to changing market signals – to expand their production and seize the opportunity offered by higher commodity prices. In fact, cereal production by LIFDCs (excluding China and India) declined by 2.2 percent in 2007 as international prices were rising. Yields in many LIFDCs continue to be much lower than the rest of the world, as they lag in the use of fertilizers, high-yielding varieties, irrigation, integrated nutrient and pest management, and conservation tillage. International assistance can help provide necessary seeds and fertilizers.
Support to investment in agriculture
The high food price episode serves as a reminder of the fragility of the balance between global food supplies and the increasing needs of the world’s population, and also of the fact that agriculture has been neglected in global efforts to reduce poverty. Thus, while the immediate need is to prevent human suffering from hunger and malnutrition as well as to induce a rapid supply response to restore a better balance between food supply and demand, these must be accompanied by actions in the medium term that will result in sustained agricultural growth. There is ample scope for substantial increases in agricultural production and productivity in developing countries. Production and productivity have not grown because resources channelled to agriculture have fallen. There is a need to increase public and private investment in developing country
agriculture. Much more investment is required, particularly for water management, rural roads, marketing and storage facilities, as well as research and extension, yet investment in raising agricultural productivity has been trending
downwards. In addition, there has been a slowdown in investment in international agricultural research centres even as new challenges, such as climate change and increased demand for biofuel feedstocks, have arisen.
Official development assistance (ODA)
Billion US$
Source: OECD.
0
25
50
75
100
2007200420011998199519921989198619831980
Total ODA ODA for agriculture
Proportion of total official development assistance allocated to agriculture
Percentage
Source: OECD.
0
5
10
15
07040198959289868380
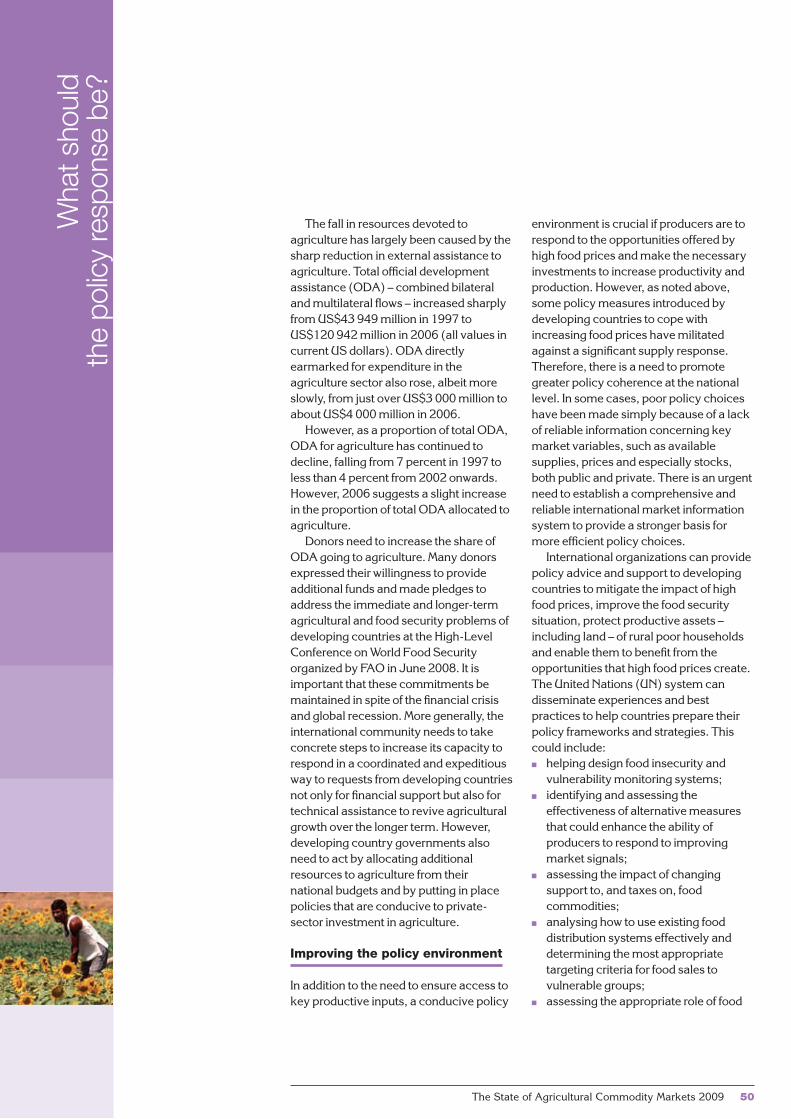
Wha
t sho
uld
the
polic
y re
spon
se b
e?
The State of Agricultural Commodity Markets 2009 50
environment is crucial if producers are to respond to the opportunities offered by high food prices and make the necessary investments to increase productivity and production. However, as noted above, some policy measures introduced by developing countries to cope with increasing food prices have militated against a significant supply response. Therefore, there is a need to promote greater policy coherence at the national level. In some cases, poor policy choices have been made simply because of a lack of reliable information concerning key market variables, such as available supplies, prices and especially stocks, both public and private. There is an urgent need to establish a comprehensive and reliable international market information system to provide a stronger basis for more efficient policy choices.
International organizations can provide policy advice and support to developing countries to mitigate the impact of high food prices, improve the food security situation, protect productive assets – including land – of rural poor households and enable them to benefit from the opportunities that high food prices create. The United Nations (UN) system can disseminate experiences and best practices to help countries prepare their policy frameworks and strategies. This could include:n helping design food insecurity and
vulnerability monitoring systems;n identifying and assessing the
effectiveness of alternative measures that could enhance the ability of producers to respond to improving market signals;
n assessing the impact of changing support to, and taxes on, food commodities;
n analysing how to use existing food distribution systems effectively and determining the most appropriate targeting criteria for food sales to vulnerable groups;
n assessing the appropriate role of food
The fall in resources devoted to agriculture has largely been caused by the sharp reduction in external assistance to agriculture. Total official development assistance (ODA) – combined bilateral and multilateral flows – increased sharply from US$43 949 million in 1997 to US$120 942 million in 2006 (all values in current US dollars). ODA directly earmarked for expenditure in the agriculture sector also rose, albeit more slowly, from just over US$3 000 million to about US$4 000 million in 2006.
However, as a proportion of total ODA, ODA for agriculture has continued to decline, falling from 7 percent in 1997 to less than 4 percent from 2002 onwards. However, 2006 suggests a slight increase in the proportion of total ODA allocated to agriculture.
Donors need to increase the share of ODA going to agriculture. Many donors expressed their willingness to provide additional funds and made pledges to address the immediate and longer-term agricultural and food security problems of developing countries at the High-Level Conference on World Food Security organized by FAO in June 2008. It is important that these commitments be maintained in spite of the financial crisis and global recession. More generally, the international community needs to take concrete steps to increase its capacity to respond in a coordinated and expeditious way to requests from developing countries not only for financial support but also for technical assistance to revive agricultural growth over the longer term. However, developing country governments also need to act by allocating additional resources to agriculture from their national budgets and by putting in place policies that are conducive to private-sector investment in agriculture.
Improving the policy environment
In addition to the need to ensure access to key productive inputs, a conducive policy

The State of Agricultural Commodity Markets 2009 51
reserves for reducing intra-annual price fluctuations and emergency shortfalls;
n determining the most effective means of enabling the private sector to participate more fully in agricultural development and, in particular, play a critical role in trade of food and supply of agricultural inputs.The use of trade policy measures to
increase domestic food supply may also have implications for other countries, notably in the case of export restrictions. This implies a need for better coordination of policy internationally, which the international organizations might facilitate. International trade policies fall under the jurisdiction of the WTO, whose rules, currently under negotiation in the Doha Round, provide the context for trade policy responses to high food prices. WTO rules are discussed further below.
It is not just in poor developing countries that policy changes might be introduced to increase food supplies and slow the increase in prices. If, as appears to be the case, biofuel production is commanding outputs and resources that would otherwise have contributed to food production, then reductions in subsidies or usage targets would correct for any market distortions. As described above, the emerging biofuels market is a new and significant source of demand for some agricultural commodities, such as sugar, maize, cassava, oilseeds and palm oil, that are also basic foods. A considerable part of the diversion of food commodities to biofuel production is considered to be policy-driven, notably by subsidies. One issue being debated actively is the WTO-compatibility of the biofuel subsidies. The other related issue is the indirect effect on food prices of subsidies on biofuel production and whether this amounts to cross-subsidization from the standpoint of the WTO Agreement on Agriculture or other Agreements. Aside from these legal aspects, there is also the ethical issue of whether subsidies that are perfectly legal from the WTO perspective should be
removed if they have a negative impact on food supplies, poverty and food insecurity.
Ensuring that the WTO rules are supportive of policy measures to respond to future food crises
One of the problems addressed by the Uruguay Round Agreement on Agriculture (UR AoA) was excessive production and the resulting trade distortions caused by domestic and export subsidies. The Doha Round is continuing the reform process along similar lines. A question being asked in the context of the high food prices is whether some of the trade rules require rethinking so that governments and the international community can respond better to future food crises. Some of these would be rules on export restrictions and taxation on basic foods. While export taxation is not disciplined either by the UR AoA or by the parent General Agreement on Tariffs and Trade (GATT) 1994 rules, current discipline on export restrictions is rather weak, merely calling upon the exporter to give advance notification and to give due consideration to the effects of the restriction on the importer. One of the dangers of a weak discipline on export restrictions is that it raises doubts about the reliability of the world market as a source of food supplies.
Rules on food aid are likely to be made much tighter if the Doha Round is successfully concluded. While this will prevent circumvention of export subsidies, the draft provisions for food aid during non-emergencies – most probably events like the high food prices episode – may need revisiting so that appropriate triggers are built in to facilitate the provision of timely food aid in such periods also.
A third consideration is the coverage of countries for special treatment. Currently, several special treatments to counter negative effects of trade liberalization are limited only to the two groups of countries mentioned in the Marrakesh Ministerial
Decision on Measures Concerning the Possible Negative Effects of the Reform Programme on Least-Developed and Net Food-Importing Developing Countries (the Marrakesh Decision) – the LDCs and the net food-importing developing countries (NFIDCs). Aside from the LDCs, there are many other LIFDCs that are not among the NFIDCs but that also require special treatment or access to food aid, export credit, food financing facility and so on.
The current crisis of high food prices has been used both to argue for a speedy resolution of the Doha Round negotiations and to argue against any further reductions in protection that might result from a new agreement. Those arguing for a substantive agreement for further liberalization of agricultural markets have suggested that current levels of protection and support have depressed global market prices and curtailed incentives for investment in increased food production in many food-importing countries, contributing to recent surges in import bills. Those arguing against have pointed to evidence that liberalization would result in upward pressure on prices as surplus production in subsidizing countries falls. Perhaps more importantly, they raised concerns that further reducing the policy space available to developing countries to provide adequate protection in promoting the development of their agriculture would result in further reductions in investment in the sector, which could leave countries even more susceptible to rapid increases in food import bills in future crises. It was one of the proposed mechanisms for protecting vulnerable agriculture sectors, the Special Safeguard Mechanism, that proved to be the stumbling block that led to the breakdown of the negotiations in July 2008.
In general, it appears that current rules do not constrain policy responses to high food prices and that the draft agreement that was under negotiation was unlikely to have changed this situation. However, many rules could be improved and
Wha
t sho
uld
the
polic
y re
spon
se b
e?
The State of Agricultural Commodity Markets 2009 52
hampered by the need for ex-ante agreement among interested and participating parties in management – something that has proved elusive. Currently, only a few such schemes exist and, unfortunately, the experience with these has not been satisfactory. For example, experience with the IMF’s Buffer Stock Financing Facility, a mechanism for facilitating the creation of buffer stocks, has shown that modest price stabilization achieved in practice by buffer stocks has typically been outweighed by the interest and carrying costs of the stocks (IMF, 1999). Similarly, the ASEAN Emergency Rice Reserve, a food reserve scheme established by the Association of Southeast Asian Nations (ASEAN), has seen reserves of only up to 87 000 tonnes, which equals a consumption volume for 0.4 of one day (0.1 percent of total demand) of ASEAN countries (MAFF, 2005), and hence has not had any influence on rice prices.
Food reserves can perhaps be better utilized for facilitating food availability during severe food shortages as opposed to stabilizing food prices, which requires availability of resources to finance imports. Thus, a more feasible approach to dealing with food price risks can be the setting up of mechanisms or facilities to assist countries in financing their food imports, especially during sudden, sharp emergencies.
The issue of a global arrangement to guarantee financing of food imports to LDCs and NFIDCs
The issue of possible difficulties in financing normal levels of food imports during food crises has been a recurring concern to NFIDCs from the time the Uruguay Round was negotiated, resulting in the Marrakesh Decision. One of the response instruments listed in the Marrakesh Decision is international food financing facilities. Work by FAO and the United Nations Conference on Trade and
strengthened to promote future policy responses that are more appropriate both to implementing countries and to their WTO partners. The current impasse provides an opportunity for further debate and negotiation on rules and agreements that might reduce the potential negative impacts of future food price crises.
A system of global assurances of smooth supplies
Global food price spikes have the greatest negative impact on those countries that rely on food imports for a large share of their domestic food supplies, and among those, they affect even more negatively the many LIFDCs. If food security is to be enhanced for the LIFDCs (and FAO’s current list includes 82 such countries) and if they are to avoid costly policies of food self-sufficiency, a reliable system of assurance of food supplies is needed for these countries on a bilateral and possibly a multilateral basis. Such a system can be built by reference to agreed “protocols for collaboration”, much as the International Energy Agency has done for petroleum. A system of such protocols could be explored and agreed by all concerned in appropriate international or regional fora. Such protocols would also provide an enhanced form of international collaboration and should lead to a “win–win” situation.
A role for regional food reserves?
The hike in food prices fuelled partially by low levels of global cereal stocks has prompted discussion regarding the role of regional food reserves to help mitigate food shortages and reduce price volatility. If properly coordinated and managed, regional food reserves can assist food-import-dependent countries in particular in accessing food at stable prices, especially during times of crisis. Although the concept is well founded, implementation of such schemes is

The State of Agricultural Commodity Markets 2009 53
Development (UNCTAD) since the Uruguay Round has revealed a number of constraints facing developing country importers at times of excess food import needs (because of domestic shocks) or higher international prices. One of the most severe is credit and exposure limits that export-financing institutions (mainly banks) place on themselves for financing destined to various developing countries.In times of excess financing needs, such as those accompanying the recent period of high food prices, these limits prevent private exporters to and importers in LDCs and NFIDCs from obtaining the appropriate letters of credit to finance exports and imports even if developing country importers have the capacity to pay for them. The idea that has followed from this logic is to create a system of public (nationally or internationally agreed) guarantees to the financial institutions (in both developed and developing countries) to augment the relevant credit ceilings under specific conditions.
In itself, this concept is not revolutionary. In recent years, the European Bank for Reconstruction and Development, International Finance Corporation, Inter-American Development Bank and the Asian Development Bank have introduced similar “trade facilitation schemes” to add risk capacity to the market. At a bilateral level, the Export-Import Bank of the United States, United States Department of Agriculture and some others have been doing this for years. However, little of this has targeted food importers in LDCs and NFIDCs, and these schemes do not have proper capacity-building components for local banks, which are often the weakest part in the chain. Moreover, OECD countries signed a commitment to set up a mechanism of this nature in the run-up to the creation of the WTO.
In that context, FAO and UNCTAD proposed in 2005, in a paper circulated to delegations in Geneva, the creation of the
Food Import Financing Facility (FIFF). The FIFF would involve no new institution or additional financial resources. Instead, it would provide additional guarantees, utilizing existing multilateral facilities, to relevant export and import financing banks of exporting and also importing countries for the cost of excess (additional) food import bills during excess food import bill periods. Financing would be provided to traders via central and commercial banks, with the government of the borrowing country providing sovereign guarantees. The facility would utilize donor guarantees to allow banks to extend the relevant credit. Unlike some of the current international financing schemes, lending would not be limited by any conditionality (e.g. low balance of payments position of the borrowing country). However, in line with the Marrakesh Decision, priority lending could be accorded to LDCs and NFIDCs facing food crises. FAO estimated that, over the period 1974–2003, a system of such guarantees would have been required to guarantee “excess financing” of only about 2 percent of the total food import costs of LDCs and NFIDCs. Given the reservations regarding the feasibility of maintaining physical food reserves, it may be timely in the context of the recent food price increases to re-examine the rationale for this proposal and explore how it could be implemented in practice.
Mobilization of international action
The need for international action to assist developing countries suffering the adverse consequences of high food prices and the forms this assistance might take were discussed at the High-Level Conference (HLC) on World Food Security in June 2008. Representatives of 181 countries, including 43 Heads of State and more than 100 Ministers, and high-level representatives of international organizations, NGOs and civil-society organizations met in order to review the
issues and address the challenges of high food prices.
The HLC’s Declaration on world food security called on the international community to increase assistance for developing countries most negatively affected by high food prices through a programme of urgent and coordinated action. Donors and international financial institutions were urged to provide balance of payments and budgetary support to low-income food-importing countries and to assure the international agencies of sufficient resources to expand and enhance their food assistance and support safety net programmes. The Declaration called for assistance to countries to put in place policies and measures to help producers to increase production. Reaching consensus on the more contentious issues surrounding biofuels and their relationship to food availability and prices proved more elusive, and more detailed research was called for.
Although the HLC was not intended to be a pledging event, a number of donor countries and international financial organizations used the opportunity to announce significant additional financial support totalling more than US$12 billion. Perhaps even more importantly in the medium and longer term, the outcome of the HLC indicates a new recognition of the importance of agriculture, putting it back centre-stage on the development agenda, and a commitment to reverse the downward trend in agriculture-focused development aid. The HLC clearly called for increased food production and investment in agriculture in order to ensure food security.

Ann
ex
The State of Agricultural Commodity Markets 2009 54
Table 1Policy responses to rising commodity prices in selected countries
Sub-Saharan Africa Near East and North Africa Latin America and the Caribbean Asia
Policies Ang
ola
Ben
in
Bur
kina
Fas
o
Bur
und
i
Cam
eroo
n
Cen
tral
Afr
ican
Rep
.
Cha
d
Côt
e d
'Ivoi
re
Dem
. Rep
. of t
he C
ongo
Erit
rea
Eth
iop
ia
Gha
na
Gui
nea
Gui
nea-
Bis
sau
Ken
ya
Leso
tho
Lib
eria
Mad
agas
car
Mal
awi
Moz
amb
ique
Nam
ibia
Nig
er
Nig
eria
Sen
egal
Sie
rra
Leon
e
Som
alia
Sou
th A
fric
a
Sud
an
Sw
azila
nd
Uga
nda
Uni
ted
Rep
. of T
anza
nia
Zam
bia
Zim
bab
we
Alg
eria
Egy
pt
Iraq
Jord
an
Leb
anon
Mau
ritan
ia
Mor
occo
Sau
di A
rab
ia
Tuni
sia
Yem
en
Arg
entin
a
Bol
ivia
(Plu
rinat
iona
l Sta
te o
f)
Bra
zil
Chi
le
Cub
a
Dom
inic
an R
ep.
Ecu
ador
El S
alva
dor
Gua
tem
ala
Hai
ti
Hon
dur
as
Mex
ico
Nic
arag
ua
Per
u
Afg
hani
stan
Ban
glad
esh
Cam
bod
ia
Chi
na
On consumption
Emergency & targeted food aid n n n n n n n n n n n n n
Cash transfer n n n n n n n
Food for work n n n n n
School/hospital – feeding n n n n n n n n n
Consumer price subsidy n n n n n n
Consumer price control & stabilization n n n n n n n n n n n n
Reduction/elimination of consumption taxes n n
On production
Producer price control n
Reduction in producer taxes n n n n n n n n n n n n n n n n n n n n n
Production subsidies n n n
Input subsidies n n n n n
On trade
Input export ban n
Export ban n n n n n n n n n n n n n
Export quota/control n n n n n
Raising export taxes n n
Reduction/elimination of import tariff & quota n n n n n n n n n n n n n n n n n n
Other policies
With long-term effects n n n n n n n n n n n n n n n n n n n n n n n

The State of Agricultural Commodity Markets 2009 55
Sub-Saharan Africa Near East and North Africa Latin America and the Caribbean Asia
Policies Ang
ola
Ben
in
Bur
kina
Fas
o
Bur
und
i
Cam
eroo
n
Cen
tral
Afr
ican
Rep
.
Cha
d
Côt
e d
'Ivoi
re
Dem
. Rep
. of t
he C
ongo
Erit
rea
Eth
iop
ia
Gha
na
Gui
nea
Gui
nea-
Bis
sau
Ken
ya
Leso
tho
Lib
eria
Mad
agas
car
Mal
awi
Moz
amb
ique
Nam
ibia
Nig
er
Nig
eria
Sen
egal
Sie
rra
Leon
e
Som
alia
Sou
th A
fric
a
Sud
an
Sw
azila
nd
Uga
nda
Uni
ted
Rep
. of T
anza
nia
Zam
bia
Zim
bab
we
Alg
eria
Egy
pt
Iraq
Jord
an
Leb
anon
Mau
ritan
ia
Mor
occo
Sau
di A
rab
ia
Tuni
sia
Yem
en
Arg
entin
a
Bol
ivia
(Plu
rinat
iona
l Sta
te o
f)
Bra
zil
Chi
le
Cub
a
Dom
inic
an R
ep.
Ecu
ador
El S
alva
dor
Gua
tem
ala
Hai
ti
Hon
dur
as
Mex
ico
Nic
arag
ua
Per
u
Afg
hani
stan
Ban
glad
esh
Cam
bod
ia
Chi
na
On consumption
Emergency & targeted food aid n n n n n n n n n n n n n
Cash transfer n n n n n n n
Food for work n n n n n
School/hospital – feeding n n n n n n n n n
Consumer price subsidy n n n n n n
Consumer price control & stabilization n n n n n n n n n n n n
Reduction/elimination of consumption taxes n n
On production
Producer price control n
Reduction in producer taxes n n n n n n n n n n n n n n n n n n n n n
Production subsidies n n n
Input subsidies n n n n n
On trade
Input export ban n
Export ban n n n n n n n n n n n n n
Export quota/control n n n n n
Raising export taxes n n
Reduction/elimination of import tariff & quota n n n n n n n n n n n n n n n n n n
Other policies
With long-term effects n n n n n n n n n n n n n n n n n n n n n n n
Specific policy responses to rising commodity prices in selected countries
Categories:
n On consumption
n On production
n On trade
n Other policies
SuB-SAHARAN AFRICA
Angolan School/hospital – feeding:
basic meal
Beninn Consumer price control
and stabilization: wheatn Reduction/elimination of
import tariff and quota: wheat flour
Burkina Fason School/hospital – feeding:
basic meal
n Consumer price control and stabilization: most staple food
n Reduction/elimination of consumption taxes: grains and other staple foods
n Reduction in producer taxes: grains and other staple foods
n Export quota/control: staples
n Reduction/elimination of import tariff and quota: staple food
n With long-term effects: partial payment of poor households’ energy and water bills
Burundin Emergency and targeted
food aid: main staple (grain, maize) to the vulnerable
n Reduction in producer taxes: grains and other staple foods
n With long-term effects: improving agricultural productivity
Cameroonn Emergency and targeted
food aid: main staple (rice, other grains) to the vulnerable
n Consumer price control and stabilization: rice, wheat, bread
n Reduction in producer taxes: rice
Central African Republicn With long-term effects:
improving agricultural productivity

Ann
ex
The State of Agricultural Commodity Markets 2009 56
Chadn Emergency and targeted
food aid: main staple (grain) to the vulnerable
Côte d’Ivoire–
Democratic Republic of the Congon Emergency and targeted
food aid: main staple (grains) to the vulnerable
n With long-term effects: improving agricultural productivity
Eritrea–
Ethiopian Emergency and targeted
food aid: cereals (teff) to the vulnerable
n Cash transfer: to the vulnerable
n Food for work: food (teff, cereals) to vulnerable
n Consumer price subsidy: cereals
n Reduction in producer taxes: grains
n Export ban: cerealsn With long-term effects:
food for assets; improving agricultural productivity
Ghana–
Guinean Export ban: all agricultural
(including livestock) commodities
Guinea-Bissau–
Kenyan Emergency and targeted
food aid: food (maize, milk) to poorest
n Food for work: basic meal (based on maize, milk)
n School/hospital – feeding: basic meal
n Reduction in producer taxes: grains
n Input subsidies: agricultural production: a government loan
n With long-term effects: improving agriculture productivity (Kenya Vision 2030)
Lesothon Reduction in producer
taxes: grains
Liberia–
Madagascarn Emergency and targeted
food aid: rice, wheat flour, biscuits
n Food for work: basic meal; food stamp
n School/hospital – feeding: basic meal (rice, bread, milk)
n Consumer price control and stabilization: rice
n Reduction/elimination of consumption taxes: rice
n Input subsidies: rice production
n Export ban: ricen Reduction/elimination of
import tariff and quota: rice
n With long-term effects: improving agricultural productivity; diversifying staple sources and preparations (e.g. plan to expand sorghum production)
Malawin Export ban: maize
Mozambiquen Cash transfer: to the
vulnerablen Reduction in producer
taxes: grainsn With long-term effects:
improving agricultural productivity
Namibia–
Nigern Consumer price control
and stabilization: cerealsn Reduction in producer
taxes: grainsn Input subsidies: under
consideration for foodgrains
n Reduction/elimination of import tariff and quota: rice
n With long-term effects: improving agricultural productivity
Nigerian Consumer price control
and stabilization: cerealsn Reduction in producer
taxes: grainsn Production subsidies: ricen Input subsidies: rice
production (free seeds and fertilizers)
n Reduction/elimination of import tariff and quota: rice
n With long-term effects: improving agricultural productivity
Senegaln Consumer price subsidy:
rice, wheatn Consumer price control
and stabilization: rice, wheat
n Reduction/elimination of import tariff and quota: wheat flour
n With long-term effects: improving agricultural productivity
Sierra Leonen With long-term effects:
improving agricultural productivity
Somalia–
South African Cash transfer: to the
vulnerablen Reduction in producer
taxes: grainsn With long-term effects:
raising the interest rate to reduce inflation
Sudann Reduction in producer
taxes: grains
Swaziland–
Ugandan School/hospital – feeding:
meal (including maize and milk)
n Reduction in producer taxes: maize
n With long-term effects: increase investment in agriculture
United Republic of Tanzanian Export ban: maize
and other agricultural commodities
n Reduction/elimination of import tariff and quota: maize
n With long-term effects: improving agricultural productivity
Zambian Input subsidies: maizen Export ban: maizen Export quota/control:
maizen With long-term effects:
increase investment in agriculture
Zimbabwen Consumer price control
and stabilization: maize, sorghum, wheat
n Reduction in producer taxes: grains

The State of Agricultural Commodity Markets 2009 57
NEAR EAST AND NORTH AFRICA
Algerian With long-term effects:
long-term investment in agriculture
Egyptn Cash transfer: to the
vulnerablen Consumer price subsidy:
wheat, bread and other food
n Export ban: ricen Export quota/control: key
agricultural commodities (staple, dairies)
n Reduction/elimination of import tariff and quota: dairies, edible oil, rice
Iraq–
Jordann With long-term effects:
raising the wages of some civil servants
Lebanonn Consumer price subsidy:
wheat
Mauritanian Reduction/elimination of
import tariff and quota: food in general
Moroccon Reduction in producer
taxes: grainsn Production subsidies: feed
(for livestock production)n Reduction/elimination of
import tariff and quota: wheat
Saudi Arabian Reduction/elimination of
import tariff and quota: dairies, vegetable oil, wheat
Tunisian Cash transfer: to the the vulnerable
Yemenn Consumer price subsidy:
wheat
LATIN AMERICA AND THE CARIBBEAN
Argentinan Export ban: maizen Raising export taxes:
grains, soybean, oilseeds
Bolivia (Plurinational State of)n Reduction in producer
taxes: grainsn Export ban: grains,
soybean, meatn Reduction/elimination of
import tariff and quota: maize, rice, soybean oil, wheat, wheat products, meat
n With long-term effects: improving agricultural productivity
Braziln Emergency and targeted
food aid: food to the vulnerable
n Cash transfer: to the vulnerable
n School/hospital – feeding: meal
n Reduction in producer taxes: grains
n Reduction/elimination of import tariff and quota: wheat
Chilen With long-term effects:
rising wheat flour imports from Argentina
Cuba–
Dominican Republic–
Ecuadorn Emergency and targeted
food aid: food to the vulnerable
n Consumer price control and stabilization: wheat, wheat flour, bread
n Reduction/elimination of import tariff and quota: wheat, wheat flour from neighbouring countries
El Salvadorn Reduction/elimination
of import tariff and quota: wheat flour from neighbouring countries
Guatemalan Reduction/elimination
of import tariff and quota: wheat flour from neighbouring countries
Haitin Emergency and targeted
food aid: rice to the vulnerable
n Consumer price control and stabilization: rice
Hondurasn School/hospital – feeding:
meal (incl. maize)n Reduction in producer
taxes: grainsn Export ban: maizen Reduction/elimination
of import tariff and quota: wheat flour from neighbouring countries
Mexicon School/hospital – feeding:
meal (incl. maize)n Reduction/elimination of
import tariff and quota: maize
n With long-term effects: plan to cut fertilizer prices by one-third; allowed experimental planting of genetically modified crops (incl. maize)
Nicaraguan Emergency and targeted
food aid: wheat and other food
n Consumer price control and stabilization: wheat
n With long-term effects: innovation in food preparation: potato bread to replace wheat bread
Perun Reduction in producer
taxes: grains
ASIA
Afghanistann Emergency and targeted
food aid: rice to the vulnerable
n Reduction in producer taxes: grains
Bangladeshn Emergency and targeted
food aid: food to the vulnerable
n Food for work: basic meal to the vulnerable
n Consumer price subsidy: rice
n Producer price control: rice
n Reduction in producer taxes: grains
n Export ban: palm oil, soybean oil
Cambodian Food for work: basic meal
(especially rice) to the vulnerable
n Export ban: ricen Export quota/control: key
agricultural commodities
Chinan Cash transfer: to the
vulnerablen School/hospital – feeding:
foodn Consumer price control
and stabilization: rice, wheat, milk, eggs, bread
n Reduction in producer taxes: grains
n Production subsidies: rice, livestock
n Input export ban: agricultural production
n Export ban: rice, maizen Export quota/control:
agricultural commoditiesn Raising export taxes:
grainsn With long-term effects:
risk mitigation and compensation to avian flu losses for poultry production

Ann
ex
The State of Agricultural Commodity Markets 2009 58
Table 2Trends in real commodity prices
1970s 1980s 1990s Average 2000–05
2003 2004 2005 2006 2007
FAO food price index (1998–2000 = 100) 194 129 105 102 101 106 109 116 138
Bananas 746 675 559 476 351 478 532 578 562
Beef 88 84 117 96 90 104 105 99 98
Butter 164 131 99 68 57 74 85 69 111
Cocoa 252 154 70 61 75 64 62 62 74
Coffee 322 215 109 56 49 57 79 82 89
Cotton 201 121 82 52 64 48 50 51 61
Hides 104 98 96 70 64 61 58 59 60
Jute 1 087 599 380 269 226 256 256 325 277
Maize 311 191 130 93 98 102 87 104 135
Rapeseed 825 452 287 234 277 276 230 268 355
Rice 932 504 329 203 187 224 254 266 278
Sisal 1 578 997 802 693 654 786 780 792 813
Sorghum 292 182 124 94 102 102 89 111 143
Soybean 742 431 291 230 248 278 242 228 319
Sugar 37.27 18.91 12.13 7.51 6.63 6.53 8.72 12.60 8.36
Sunflower 1 004 470 364 259 269 294 268 258 410
Tea n.a. 3.14 1.96 1.52 1.41 1.51 1.44 1.67 n.a.
Wheat 371 237 153 123 143 128 n.a. 135 206
Note: Base year is 2000.Basis for prices for individual commodities:
banana, Ecuador (US$/tonne);beef, Australia, c.i.f. USA (US cents/lb); butter, New Zealand (US cents/lb);cocoa, ICCO indicator price (US cents/lb);coffee, ICO indicator price (US cents/lb);cotton, United States of America (US cents/lb);hides, United States of America (US cents/lb);jute, Bangladesh (US$/tonne);maize, United States of America (US$/tonne);rapeseed, Rotterdam (US$/tonne);rice, Thailand 100% B (US$/tonne);sisal, East Africa and Brazil (US$/tonne);sorghum, US No. 2, yellow (US$/tonne);soybean, Rotterdam (US$/tonne);sunflower, Amsterdam (US$/tonne);sugar, ISA (US cents/lb);tea, FAO tea composite price (US$/kg);wheat, Argentina (US$/tonne).
n.a. = not available.Source: FAO.
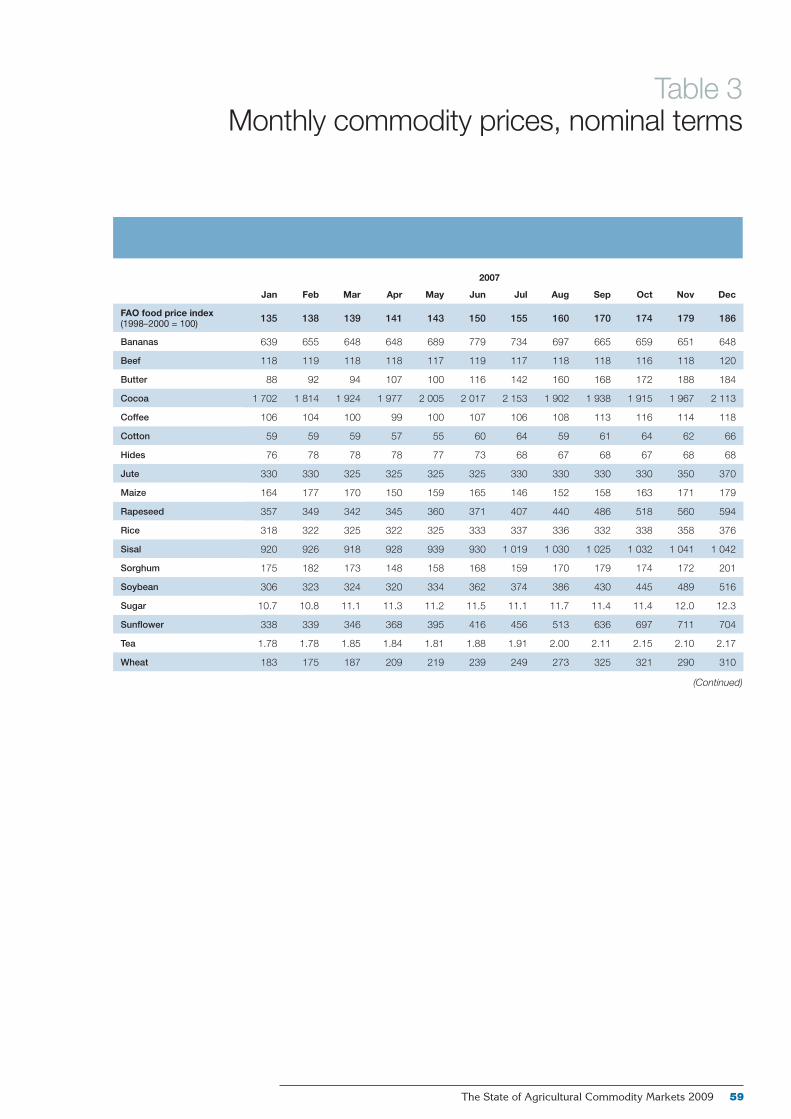
The State of Agricultural Commodity Markets 2009 59
Table 3Monthly commodity prices, nominal terms
1970s 1980s 1990s Average 2000–05
2003 2004 2005 2006 2007
FAO food price index (1998–2000 = 100) 194 129 105 102 101 106 109 116 138
Bananas 746 675 559 476 351 478 532 578 562
Beef 88 84 117 96 90 104 105 99 98
Butter 164 131 99 68 57 74 85 69 111
Cocoa 252 154 70 61 75 64 62 62 74
Coffee 322 215 109 56 49 57 79 82 89
Cotton 201 121 82 52 64 48 50 51 61
Hides 104 98 96 70 64 61 58 59 60
Jute 1 087 599 380 269 226 256 256 325 277
Maize 311 191 130 93 98 102 87 104 135
Rapeseed 825 452 287 234 277 276 230 268 355
Rice 932 504 329 203 187 224 254 266 278
Sisal 1 578 997 802 693 654 786 780 792 813
Sorghum 292 182 124 94 102 102 89 111 143
Soybean 742 431 291 230 248 278 242 228 319
Sugar 37.27 18.91 12.13 7.51 6.63 6.53 8.72 12.60 8.36
Sunflower 1 004 470 364 259 269 294 268 258 410
Tea n.a. 3.14 1.96 1.52 1.41 1.51 1.44 1.67 n.a.
Wheat 371 237 153 123 143 128 n.a. 135 206
2007
Jan Feb Mar Apr May Jun Jul Aug Sep Oct Nov Dec
FAO food price index (1998–2000 = 100) 135 138 139 141 143 150 155 160 170 174 179 186
Bananas 639 655 648 648 689 779 734 697 665 659 651 648
Beef 118 119 118 118 117 119 117 118 118 116 118 120
Butter 88 92 94 107 100 116 142 160 168 172 188 184
Cocoa 1 702 1 814 1 924 1 977 2 005 2 017 2 153 1 902 1 938 1 915 1 967 2 113
Coffee 106 104 100 99 100 107 106 108 113 116 114 118
Cotton 59 59 59 57 55 60 64 59 61 64 62 66
Hides 76 78 78 78 77 73 68 67 68 67 68 68
Jute 330 330 325 325 325 325 330 330 330 330 350 370
Maize 164 177 170 150 159 165 146 152 158 163 171 179
Rapeseed 357 349 342 345 360 371 407 440 486 518 560 594
Rice 318 322 325 322 325 333 337 336 332 338 358 376
Sisal 920 926 918 928 939 930 1 019 1 030 1 025 1 032 1 041 1 042
Sorghum 175 182 173 148 158 168 159 170 179 174 172 201
Soybean 306 323 324 320 334 362 374 386 430 445 489 516
Sugar 10.7 10.8 11.1 11.3 11.2 11.5 11.1 11.7 11.4 11.4 12.0 12.3
Sunflower 338 339 346 368 395 416 456 513 636 697 711 704
Tea 1.78 1.78 1.85 1.84 1.81 1.88 1.91 2.00 2.11 2.15 2.10 2.17
Wheat 183 175 187 209 219 239 249 273 325 321 290 310
(Continued)

Ann
ex
The State of Agricultural Commodity Markets 2009 60
2008
Jan Feb Mar Apr May Jun Jul Aug
FAO food price index (1998–2000 = 100) 195 215 217 214 215 219 213 201
Bananas 689 792 1 027 967 923 868 722 799
Beef 122 129 133 137 154 162 176 169
Butter 184 184 181 179 178 182 184 171
Cocoa 2 216 2 523 2 670 2 628 2 690 3 022 2 954 2 810
Coffee 122 139 136 127 127 131 133 131
Cotton 68 71 83 71 68 69 70 69
Hides 65 65 66 67 67 67 68 n.a.
Jute 383 383 410 460 460 460 510 510
Maize 206 220 234 247 242 281 267 232
Rapeseed 645 700 758 709 713 722 679 596
Rice 385 463 567 853 963 870 835 787
Sisal 1 088 1 088 1 092 1 141 1 141 1 142 n.a. n.a.
Sorghum 226 224 230 242 242 277 234 211
Soybean 536 579 576 556 570 625 634 557
Sugar 11.7 10.7 9.8 9.8 9.2 8.0 8.6 8.5
Sunflower 752 826 920 919 785 767 767 589
Tea n.a. n.a. n.a. n.a. n.a. n.a. n.a. n.a.
Wheat 330 365 395 n.a. n.a. 363 329 307
Table 3 (continued)Monthly commodity prices, real terms
Note: Base year is 2000.Basis for prices for individual commodities:
banana, Ecuador (US$/tonne);beef, Australia, c.i.f. USA (US cents/lb); butter, New Zealand (US cents/lb);cocoa, ICCO indicator price (US cents/lb);coffee, ICO indicator price (US cents/lb);cotton, United States of America (US cents/lb);hides, United States of America (US cents/lb);jute, Bangladesh (US$/tonne);maize, United States of America (US$/tonne);rapeseed, Rotterdam (US$/tonne);rice, Thailand 100% B (US$/tonne);sisal, East Africa and Brazil (US$/tonne);sorghum, US No. 2, yellow (US$/tonne);soybean, Rotterdam (US$/tonne);sunflower, Amsterdam (US$/tonne);sugar, ISA (US cents/lb);tea, FAO tea composite price (US$/kg);wheat, Argentina (US$/tonne).
n.a. = not available.Source: FAO.

The State of Agricultural Commodity Markets 2009 61
Further reading and information
FAO. 2007. The State of Agricultural Commodity Markets 2006. Rome (also available at www.fao.org/SOF/soco).
FAO. 2008a. The State of Food Insecurity in the World 2008. Rome (also available at www.fao.org/SOF/sofi).
FAO. 2008b. Food Outlook (available at www.fao.org/giews/english/fo/index.htm).FAO. 2008c. High-Level Conference on World Food Security: the challenges of climate
change and bioenergy, 3–5 June 2008, Rome. Report on the Conference (available at www.fao.org/foodclimate/conference/en).
FAO. 2008d. The State of Food and Agriculture 2008. Rome (also available at http://www.fao.org/SOF/sofa).
FAO. 2009a. Crop Prospects and Food Situation (available at www.fao.org/giews/ english/cpfs/index.htm).
FAO. 2009b. National basic food prices – data and analysis tool (available at www.fao.org/giews/pricetool).
FAO. 2009c. World Food Situation (available at www.fao.org/worldfoodsituation).Gilbert, C. 2006. Trends and volatility in agricultural commodity prices. In FAO.
Agricultural commodity markets and trade. New approaches to analyzing market structure and instability, A. Sarris & D. Hallam, eds., pp. 31–61. Rome, FAO and Cheltenham, UK, Edward Elgar.
IFPRI (International Food Policy Research Institute). 2008. High and rising food prices (available at www.ifpri.org/presentations/20080411jvbfoodprices.pdf).
IFPRI. 2009. IFPRI’s Action Plan for the Food Price Crisis (available at www.ifpri.org/themes/foodprices/foodprices.asp).
IMF (International Monetary Fund). 1999. Review of the Compensatory and Contingency Financing Facility (CCFF) and Buffer Stock Financing Facility (BSFF) – Preliminary considerations (available at www.imf.org/external/np/ccffbsff/review).
IMF. 2008. Regional Economic Outlook – Middle East and Central Africa. Washington, DC (also available www.imf.org/external/pubs/ft/reo/2008/MCD/eng/ mreo0508.pdf).
MAFF (Ministry of Agriculture, Forestry and Fisheries of Japan). 2005. Toward a world free of starvation and poverty (introductory information on the International Food Stockholding Scheme and East Asia Emergency Rice Reserve). Tokyo (also available at www.maff.go.jp/eaerr.pdf).
OECD–FAO. 2008. OECD–FAO Agricultural Outlook 2008–2017. Paris, OECD Publications (Highlights available at www.fao.org/es/ESC/en/2/3/highlight_550.html).
Rapsomanikis, G., Hallam D. & Conforti, P. 2006. Market integration and price transmission paper in selected food and cash crop markets of developing countries: review and applications. In FAO. Agricultural commodity markets and trade. New approaches to analyzing market structure and instability, A. Sarris & D. Hallam, eds., pp. 187–217. Rome, FAO and Cheltenham, UK, Edward Elgar.
The Economist. 2007. The end of cheap food. 6 December.The Oil Drum. 2009. Discussions about energy and our future (available at
www.theoildrum.com).Time. 1974. The world food crisis. 11 November.World Bank. 2007. World Development Report 2008: Agriculture for Development.
Washington, DC (also available at www.worldbank.org/reference).
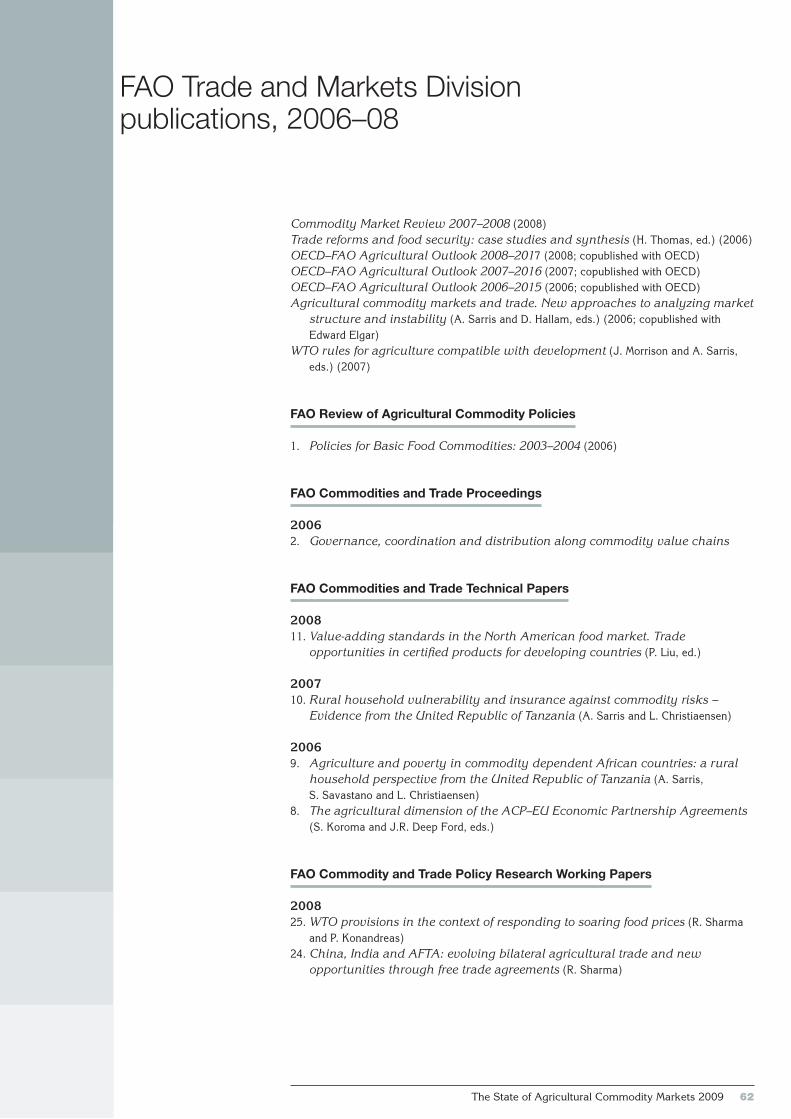
The State of Agricultural Commodity Markets 2009 62
FAO Trade and Markets Division publications, 2006–08
Commodity Market Review 2007–2008 (2008)Trade reforms and food security: case studies and synthesis (H. Thomas, ed.) (2006)OECD–FAO Agricultural Outlook 2008–2017 (2008; copublished with OECD)OECD–FAO Agricultural Outlook 2007–2016 (2007; copublished with OECD)OECD–FAO Agricultural Outlook 2006–2015 (2006; copublished with OECD)Agricultural commodity markets and trade. New approaches to analyzing market
structure and instability (A. Sarris and D. Hallam, eds.) (2006; copublished with Edward Elgar)
WTO rules for agriculture compatible with development (J. Morrison and A. Sarris, eds.) (2007)
FAO Review of Agricultural Commodity Policies
1. Policies for Basic Food Commodities: 2003–2004 (2006)
FAO Commodities and Trade Proceedings
20062. Governance, coordination and distribution along commodity value chains
FAO Commodities and Trade Technical Papers
200811. Value-adding standards in the North American food market. Trade
opportunities in certified products for developing countries (P. Liu, ed.)
200710. Rural household vulnerability and insurance against commodity risks –
Evidence from the United Republic of Tanzania (A. Sarris and L. Christiaensen)
20069. Agriculture and poverty in commodity dependent African countries: a rural
household perspective from the United Republic of Tanzania (A. Sarris, S. Savastano and L. Christiaensen)
8. The agricultural dimension of the ACP–EU Economic Partnership Agreements (S. Koroma and J.R. Deep Ford, eds.)
FAO Commodity and Trade Policy Research Working Papers
200825. WTO provisions in the context of responding to soaring food prices (R. Sharma
and P. Konandreas)24. China, India and AFTA: evolving bilateral agricultural trade and new
opportunities through free trade agreements (R. Sharma)

The State of Agricultural Commodity Markets 2009 63
200723. Liberalizing trade under structural constraints in developing countries:
A general equilibrium analysis of Tanzania (P. Conforti and A. Sarris)
200622. Threshold cointegration in the sugar-ethanol-oil price system in Brazil:
evidence from nonlinear vector error correction models (G. Rapsomanikis and D. Hallam)
21. Estimating price elasticities of supply for cotton: a structural time-series approach (B. Shepherd)
20. Market access and preferential trading schemes: evidence from selected developed and developing countries (P. Conforti and L. Salvatici)
19. The role of agriculture in reducing poverty in Tanzania: A household perspective from rural Kilimanjaro and Ruvuma (A. Sarris, S. Savastano and L. Christiaensen)
18. Producer demand and welfare benefits of rainfall insurance in Tanzania (A. Sarris, P. Karfakis and L. Christiaensen)
17. Household vulnerability in rural Tanzania (A. Sarris and P. Karfakis)


ISBN 978-92-5-106280-7
I0854E/1/6.09/2500
9 7 8 9 2 5 1 0 6 2 8 0 7
I n the first half of 2008, the world was facing the highest food price levels in 30 years and a global food insecurity crisis. Although international food prices have since fallen, they are still above the levels seen in recent years and are
expected to remain so. FAO estimates that soaring food prices pushed another 115 million people into chronic hunger in 2007 and 2008, bringing the world total to nearly one billion hungry people.
This report explains why food prices increased and the steps needed to ensure that high food prices become an opportunity for developing country farmers to help safeguard world food supplies at affordable prices. It focuses on the extent to which “new” explanations – biofuel demand, record oil prices and increasing food demand in China and India – can account for the sudden food price inflation as well as the role of traditional market drivers. It also explores why so few producers in developing countries responded by investing more and increasing production. Soaring food prices and the consequent food crisis are matters of international concern that require concerted action – there is an urgent need to strengthen the governance of world food security.
The State of Agricultural Commodity Markets 2009 aims to bring to a wider public an accessible discussion of agricultural commodity market issues and policy matters. It seeks to provide an objective and straightforward treatment of economic issues for all those interested in agricultural commodity market developments and their impact on developing countries.
2009The State of Agricultural Commodity Markets
Related Documents