The Standard Deviation as a Ruler and the Normal Model Al Nosedal University of Toronto Summer 2017 Al Nosedal University of Toronto The Standard Deviation as a Ruler and the Normal Model Summer 2017 1 / 65

Welcome message from author
This document is posted to help you gain knowledge. Please leave a comment to let me know what you think about it! Share it to your friends and learn new things together.
Transcript

The Standard Deviation as aRuler and the Normal Model
Al NosedalUniversity of Toronto
Summer 2017
Al Nosedal University of Toronto The Standard Deviation as a Ruler and the Normal Model Summer 2017 1 / 65
My momma always said: ”Life was like a box of chocolates. You neverknow what you’re gonna get.”
Forrest Gump.
Al Nosedal University of Toronto The Standard Deviation as a Ruler and the Normal Model Summer 2017 2 / 65

Simple Example
Random Experiment: Rolling a fair die 300 times.
Class Expected Frequency Expected Relative Freq
0 < x ≤ 1 50 1/61 < x ≤ 2 50 1/62 < x ≤ 3 50 1/63 < x ≤ 4 50 1/64 < x ≤ 5 50 1/65 < x ≤ 6 50 1/6
Al Nosedal University of Toronto The Standard Deviation as a Ruler and the Normal Model Summer 2017 3 / 65

Histogram of Expected Frequencies
●
● ●
●
0 1 2 3 4 5 6
010
2030
4050
Histogram of expected frequenciesfre
quen
cy
Al Nosedal University of Toronto The Standard Deviation as a Ruler and the Normal Model Summer 2017 4 / 65
Histogram of Expected Relative Frequencies
●
● ●
●
0 1 2 3 4 5 6
0.00
0.05
0.10
0.15
Histogram of expected relative frequencies
frequ
ency
Al Nosedal University of Toronto The Standard Deviation as a Ruler and the Normal Model Summer 2017 5 / 65
Density Curve
A density curve is a curve that is always on or above the horizontal axis,and has area exactly 1 underneath it.A density curve describes the overall pattern of a distribution. The areaunder the curve and above any range of values is the proportion of allobservations that fall in that range.Note. No set of real data is exactly described by a density curve. Thecurve is an idealized description that is easy to use and accurate enoughfor practical use.
Al Nosedal University of Toronto The Standard Deviation as a Ruler and the Normal Model Summer 2017 6 / 65

Accidents on a bike path
Examining the location of accidents on a level, 5-mile bike path shows thatthey occur uniformly along the length of the path. The figure belowdisplays the density curve that describes the distribution of accidents.a) Explain why this curve satisfies the two requirements for a density curve.b) The proportion of accidents that occur in the first mile of the path isthe area under the density curve between 0 miles and 1 mile. What is thisarea?c) There is a stream alongside the bike path between the 0.8-mile markand the 1.3-mile mark. What proportion of accidents happen on the bikepath alongside the stream?d) The bike path is a paved path through the woods, and there is a roadat each end. What proportion of accidents happen more than 1 mile fromeither road?
Al Nosedal University of Toronto The Standard Deviation as a Ruler and the Normal Model Summer 2017 7 / 65

Density Curve
0 1 2 3 4 5
0.00
0.05
0.10
0.15
0.20
Density Curve
Distance along bike path (miles)
Al Nosedal University of Toronto The Standard Deviation as a Ruler and the Normal Model Summer 2017 8 / 65
Solution
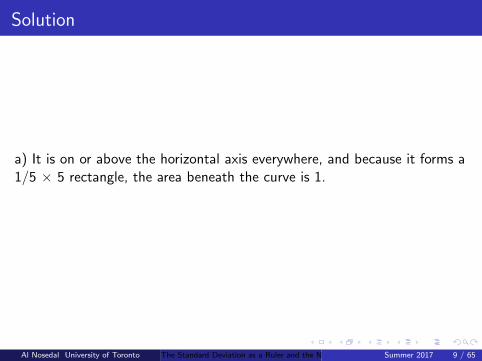
a) It is on or above the horizontal axis everywhere, and because it forms a1/5 × 5 rectangle, the area beneath the curve is 1.
Al Nosedal University of Toronto The Standard Deviation as a Ruler and the Normal Model Summer 2017 9 / 65

Solution b)
0 1 2 3 4 5
0.00
0.05
0.10
0.15
0.20
Density Curve
Distance along bike path (miles)
proportion = 1 x 0.20 = 0.20
Al Nosedal University of Toronto The Standard Deviation as a Ruler and the Normal Model Summer 2017 10 / 65

Solution c)
0 1 2 3 4 5
0.00
0.05
0.10
0.15
0.20
Density Curve
Distance along bike path (miles)
proportion = (1.3-0.8) x 0.20 = 0.10
Al Nosedal University of Toronto The Standard Deviation as a Ruler and the Normal Model Summer 2017 11 / 65

Solution d)
0 1 2 3 4 5
0.00
0.05
0.10
0.15
0.20
Density Curve
Distance along bike path (miles)
proportion = (4-1) x 0.20 = 0.60
Al Nosedal University of Toronto The Standard Deviation as a Ruler and the Normal Model Summer 2017 12 / 65
Normal Distributions
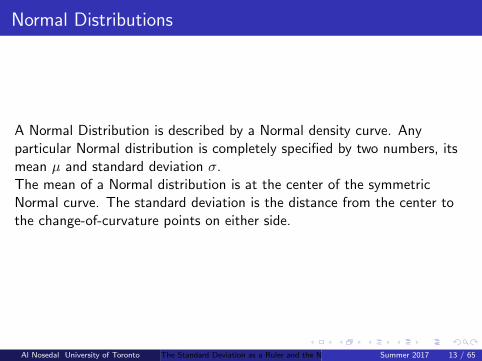
A Normal Distribution is described by a Normal density curve. Anyparticular Normal distribution is completely specified by two numbers, itsmean µ and standard deviation σ.The mean of a Normal distribution is at the center of the symmetricNormal curve. The standard deviation is the distance from the center tothe change-of-curvature points on either side.
Al Nosedal University of Toronto The Standard Deviation as a Ruler and the Normal Model Summer 2017 13 / 65

Standard Normal Distribution
-3 -2 -1 0 1 2 3
0.00.1
0.20.3
0.4
Normal Distributionmean=0 and standard deviation=1
Al Nosedal University of Toronto The Standard Deviation as a Ruler and the Normal Model Summer 2017 14 / 65

Two Different Standard Deviations
-15 -10 -5 0 5 10 15
0.00
0.05
0.10
0.15
0.20
std. dev.= 2std. dev.= 5
Al Nosedal University of Toronto The Standard Deviation as a Ruler and the Normal Model Summer 2017 15 / 65
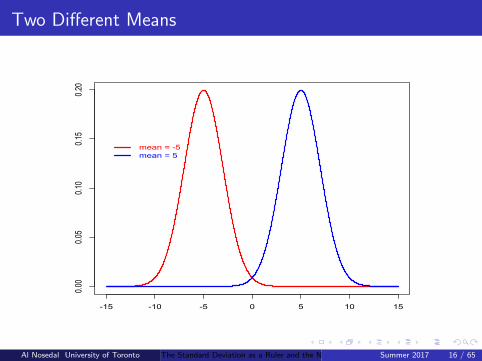
Two Different Means
-15 -10 -5 0 5 10 15
0.00
0.05
0.10
0.15
0.20
mean = -5mean = 5
Al Nosedal University of Toronto The Standard Deviation as a Ruler and the Normal Model Summer 2017 16 / 65

The 68-95-99.7 rule
In the Normal distribution with mean µ and standard deviation σ:Approximately 68% of the observations fall within σ of the mean µ.Approximately 95% of the observations fall within 2σ of µ.Approximately 99.7% of the observations fall within 3σ of µ.
Al Nosedal University of Toronto The Standard Deviation as a Ruler and the Normal Model Summer 2017 17 / 65

Problem
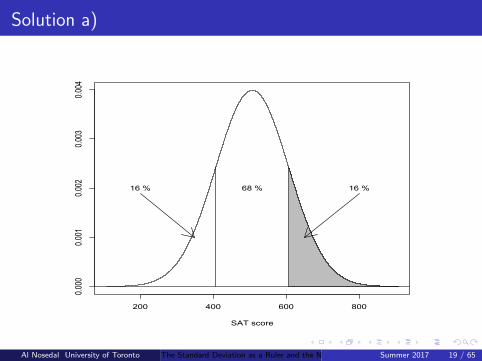
The national average for the verbal portion of the College BoardsScholastic Aptitude Test (SAT) is 507. The College Board periodicallyrescales the test scores such that the standard deviation is approximately100. Answer the following questions using a bell-shaped distribution andthe empirical rule for the verbal test scores.a. What percentage of students have an SAT verbal score greater than607?b. What percentage of students have an SAT verbal score greater than707?c. What percentage of students have an SAT verbal score between 407and 507?d. What percentage of students have an SAT verbal score between 307and 707?
Al Nosedal University of Toronto The Standard Deviation as a Ruler and the Normal Model Summer 2017 18 / 65
Solution a)
200 400 600 800
0.000
0.001
0.002
0.003
0.004
SAT score
16 %68 %16 %
Al Nosedal University of Toronto The Standard Deviation as a Ruler and the Normal Model Summer 2017 19 / 65
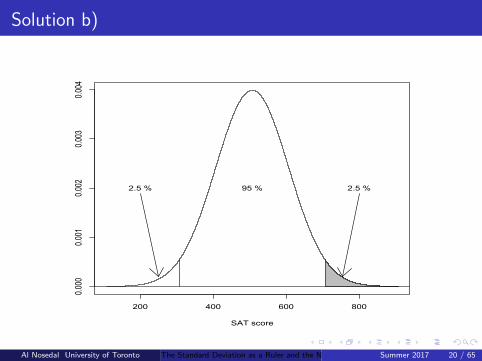
Solution b)
200 400 600 800
0.000
0.001
0.002
0.003
0.004
SAT score
2.5 %95 %2.5 %
Al Nosedal University of Toronto The Standard Deviation as a Ruler and the Normal Model Summer 2017 20 / 65

Solution c)
200 400 600 800
0.000
0.001
0.002
0.003
0.004
SAT score
34 % 34 %16 % 16 %
Al Nosedal University of Toronto The Standard Deviation as a Ruler and the Normal Model Summer 2017 21 / 65

Solution d)
200 400 600 800
0.000
0.001
0.002
0.003
0.004
SAT score
95 %2.5 % 2.5 %
Al Nosedal University of Toronto The Standard Deviation as a Ruler and the Normal Model Summer 2017 22 / 65

Fruit flies
The common fruit fly Drosophila melanogaster is the most studiedorganism in genetic research because it is small, easy to grow, andreproduces rapidly. The length of the thorax (where the wings and legsattach) in a population of male fruit flies is approximately Normal withmean 0.800 millimeters (mm) and standard deviation 0.078 mm. Draw aNormal curve on which this mean and standard deviation are correctlylocated.
Al Nosedal University of Toronto The Standard Deviation as a Ruler and the Normal Model Summer 2017 23 / 65

Solution
0.5 0.6 0.7 0.8 0.9 1.0 1.1
01
23
45
Thorax length
0.800-0.078 0.800+0.078
Al Nosedal University of Toronto The Standard Deviation as a Ruler and the Normal Model Summer 2017 24 / 65

Fruit flies
The lenght of the thorax in a population of male fruit flies is approximatelyNormal with mean 0.800 mm and standard deviation 0.078 mm. Use the68-95-99.7 rule to answer the following questions.a) What range of lengths covers almost all (99.7%) of this distribution?b) What percent of male fruit flies have a thorax length exceeding 0.878mm?
Al Nosedal University of Toronto The Standard Deviation as a Ruler and the Normal Model Summer 2017 25 / 65

Solution a) Between 0.566 mm and 1.034 mm
0.5 0.6 0.7 0.8 0.9 1.0 1.1
01
23
45
Thorax length
99.7 %0.800-3(0.078)=0.566 0.800+3(0.078)=1.034
Al Nosedal University of Toronto The Standard Deviation as a Ruler and the Normal Model Summer 2017 26 / 65

Solution b) 16% of thorax lenghts exceed 0.878 mm
0.5 0.6 0.7 0.8 0.9 1.0 1.1
01
23
45
Thorax length
84 % 16 %
Al Nosedal University of Toronto The Standard Deviation as a Ruler and the Normal Model Summer 2017 27 / 65

Monsoon rains
The summer monsoon brings 80% of India’s rainfall and is essential for thecountry’s agriculture. Records going back more than a century show thatthe amount of monsoon rainfall varies from the year according to adistribution that is approximately Normal with mean 582 mm and standarddeviation 82 mm. Use the 68-95-99.7 rule to answer the followingquestions.a) Between what values do the monsoon rains fall in 95% of all years?b) How small are the monsoon rains in the dryest 2.5% of all years?
Al Nosedal University of Toronto The Standard Deviation as a Ruler and the Normal Model Summer 2017 28 / 65
Solution
a) In 95% of all years, monsoon rain levels are between582 - 2(82) and 582 + 2(82) i.e. 418 mm and 746 mm.b) The driest 2.5% of monsoon rainfalls are less than 418 mm; this is morethan two standard deviations below the mean.
Al Nosedal University of Toronto The Standard Deviation as a Ruler and the Normal Model Summer 2017 29 / 65
Standard Normal Distribution
The standard Normal distribution is the Normal distribution N(0, 1) withmean 0 and standard deviation 1.If a variable x has any Normal distribution N(µ,σ) with mean µ andstandard deviation σ, then the standardized variable
z =x − µ
σ
has the standard Normal distribution.
Al Nosedal University of Toronto The Standard Deviation as a Ruler and the Normal Model Summer 2017 30 / 65

SAT vs ACT
In 2010, when she was a high school senior, Alysha scored 670 on theMathematics part of the SAT. The distribution of SAT Math scores in2010 was Normal with mean 516 and standard deviation 116. John tookthe ACT and scored 26 on the Mathematics portion. ACT Math scores for2010 were Normally distributed with mean 21.0 and standard deviation5.3. Find the standardized scores for both students. Assuming that bothtests measure the same kind of ability, who had the higher score?
Al Nosedal University of Toronto The Standard Deviation as a Ruler and the Normal Model Summer 2017 31 / 65

Solution
Alysha’s standardized score is
zA =670 − 516
116= 1.33.
John’s standardized score is
zJ =26 − 21
5.3= 0.94.
Alysha’s score is relatively higher than John’s.
Al Nosedal University of Toronto The Standard Deviation as a Ruler and the Normal Model Summer 2017 32 / 65

Men’s and women’s heights
The heights of women aged 20 to 29 are approximately Normal with mean64.3 inches and standard deviation 2.7 inches. Men the same age havemean height 69.9 inches with standard deviation 3.1 inches. What are thez-scores for a woman 6 feet tall and a man 6 feet tall? Say in simplelanguage what information the z-scores give that the originalnonstandardized heights do not.
Al Nosedal University of Toronto The Standard Deviation as a Ruler and the Normal Model Summer 2017 33 / 65

Solution
We need to use the same scale, so recall that 6 feet = 72 inches. Awoman 6 feet tall has standardized score
zW =72 − 64.3
2.7= 2.85
(quite tall, relatively).A man 6 feet tall has standardized score
zM =72 − 69.9
3.1= 0.68.
Hence, a woman 6 feet tall is 2.85 standard deviations taller than averagefor women. A man 6 feet tall is only 0.68 standard deviations aboveaverage for men.
Al Nosedal University of Toronto The Standard Deviation as a Ruler and the Normal Model Summer 2017 34 / 65

Using the Normal table
Use table A to find the proportion of observations from a standard Normaldistribution that satisfies each of the following statements. In each case,sketch a standard Normal curve and shade the area under the curve that isthe answer to the question.a) z < −1.42b) z > −1.42c) z < 2.35d) −1.42 < z < 2.35
Al Nosedal University of Toronto The Standard Deviation as a Ruler and the Normal Model Summer 2017 35 / 65
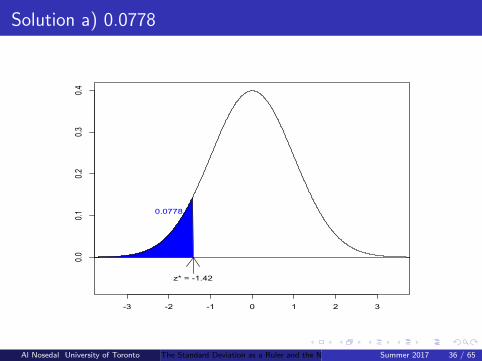
Solution a) 0.0778
-3 -2 -1 0 1 2 3
0.00.1
0.20.3
0.4
0.0778
z* = -1.42
Al Nosedal University of Toronto The Standard Deviation as a Ruler and the Normal Model Summer 2017 36 / 65
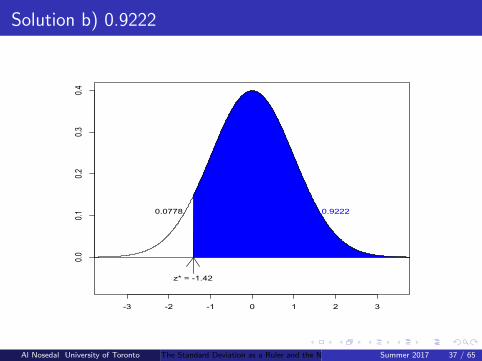
Solution b) 0.9222
-3 -2 -1 0 1 2 3
0.00.1
0.20.3
0.4
0.92220.0778
z* = -1.42
Al Nosedal University of Toronto The Standard Deviation as a Ruler and the Normal Model Summer 2017 37 / 65
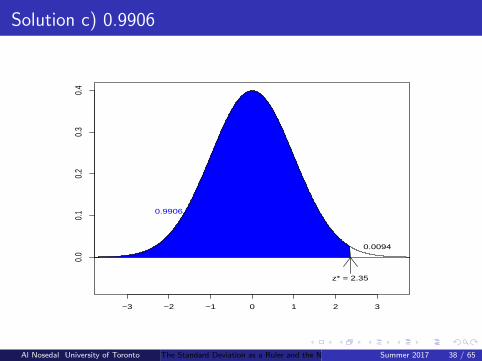
Solution c) 0.9906
−3 −2 −1 0 1 2 3
0.0
0.1
0.2
0.3
0.4
0.9906
0.0094
z* = 2.35
Al Nosedal University of Toronto The Standard Deviation as a Ruler and the Normal Model Summer 2017 38 / 65

Solution d) 0.9966 - 0.0778 = 0.9128
-3 -2 -1 0 1 2 3
0.00.1
0.20.3
0.4
0.9906-0.0778 = 0.9128
z* = 2.35z* = -1.42
Al Nosedal University of Toronto The Standard Deviation as a Ruler and the Normal Model Summer 2017 39 / 65

Monsoon rains
The summer monsoon rains in India follow approximately a Normaldistribution with mean 852 mm of rainfall and standard deviation 82 mm.a) In the drought year 1987, 697 mm of rain fell. In what percent of allyears will India have 697 mm or less of monsoon rain?b) ”Normal rainfall” means within 20% of the long-term average, orbetween 683 and 1022 mm. In what percent of all years is the rainfallnormal?
Al Nosedal University of Toronto The Standard Deviation as a Ruler and the Normal Model Summer 2017 40 / 65
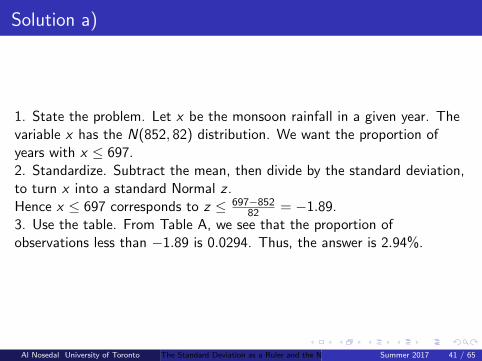
Solution a)
1. State the problem. Let x be the monsoon rainfall in a given year. Thevariable x has the N(852, 82) distribution. We want the proportion ofyears with x ≤ 697.2. Standardize. Subtract the mean, then divide by the standard deviation,to turn x into a standard Normal z .Hence x ≤ 697 corresponds to z ≤ 697−852
82 = −1.89.3. Use the table. From Table A, we see that the proportion ofobservations less than −1.89 is 0.0294. Thus, the answer is 2.94%.
Al Nosedal University of Toronto The Standard Deviation as a Ruler and the Normal Model Summer 2017 41 / 65

Solution b)
1. State the problem. Let x be the monsoon rainfall in a given year. Thevariable x has the N(852, 82) distribution. We want the proportion ofyears with 683 < x < 1022.2. Standardize. Subtract the mean, then divide by the standard deviation,to turn x into a standard Normal z .683 < x < 1022 corresponds to 683−852
82 < z < 1022−85282 , or
−2.06 < z < 2.07.3. Use the table. Hence, using Table A, the area is0.9808 − 0.0197 = 96.11%.
Al Nosedal University of Toronto The Standard Deviation as a Ruler and the Normal Model Summer 2017 42 / 65

The Medical College Admission Test
Almost all medical schools in the United States require students to takethe Medical College Admission Test (MCAT). The exam is composed ofthree multiple-choice sections (Physical Sciences, Verbal Reasoning, andBiological Sciences). The score on each section is converted to a 15-pointscale so that the total score has a maximum value of 45. The total scoresfollow a Normal distribution, and in 2010 the mean was 25.0 with astandard deviation of 6.4. There is little change in the distribution ofscores from year to year.a) What proportion of students taking the MCAT had a score over 30?b) What proportion had scores between 20 and 25?
Al Nosedal University of Toronto The Standard Deviation as a Ruler and the Normal Model Summer 2017 43 / 65

Solution a)
1. State the problem. Let x be the MCAT score of a randomly selectedstudent. The variable x has the N(25, 6.4) distribution. We want theproportion of students with x > 30.2. Standardize. Subtract the mean, then divide by the standard deviation,to turn x into a standard Normal z .Hence x > 30 corresponds to z > 30−25
6.4 = 0.78.3. Use the table. From Table A, we see that the proportion ofobservations less than 0.78 is 0.7823. Hence, the answer is1 − 0.7823 = 0.2177, or 21.77%.
Al Nosedal University of Toronto The Standard Deviation as a Ruler and the Normal Model Summer 2017 44 / 65

Solution b)
1. State the problem. Let x be the MCAT score of a randomly selectedstudent. The variable x has the N(25, 6.4) distribution. We want theproportion of students with 20 ≤ x ≤ 25.2. Standardize. Subtract the mean, then divide by the standard deviation,to turn x into a standard Normal z .20 ≤ x ≤ 25 corresponds to 20−25
6.4 ≤ z ≤ 25−256.4 , or −0.78 ≤ z ≤ 0.
3. Use the table. Using Table A, the area is 0.5 − 0.2177 = 0.2833, or28.33%.
Al Nosedal University of Toronto The Standard Deviation as a Ruler and the Normal Model Summer 2017 45 / 65

Using a table to find Normal proportions
Step 1. State the problem in terms of the observed variable x . Draw apicture that shows the proportion you want in terms of cumulativeproportions.Step 2. Standardize x to restate the problem in terms of a standardNormal variable z .Step 3. Use Table A and the fact that the total are under the curve is 1 tofind the required area under the standard Normal curve.
Al Nosedal University of Toronto The Standard Deviation as a Ruler and the Normal Model Summer 2017 46 / 65

Table A
Use Table A to find the value z∗ of a standard Normal variable thatsatisfies each of the following conditions. (Use the value of z∗ from TableA that comes closest to satisfying the condition.) In each case, sketch astandard Normal curve with your value of z∗ marked on the axis.a) The point z∗ with 15% of the observations falling below it.b) The point z∗ with with 70% of the observations falling above it.
Al Nosedal University of Toronto The Standard Deviation as a Ruler and the Normal Model Summer 2017 47 / 65
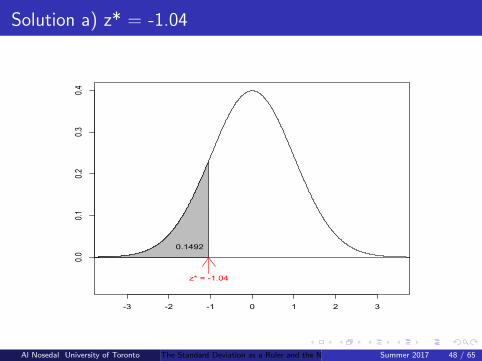
Solution a) z* = -1.04
-3 -2 -1 0 1 2 3
0.00.1
0.20.3
0.4
0.1492
z* = -1.04
Al Nosedal University of Toronto The Standard Deviation as a Ruler and the Normal Model Summer 2017 48 / 65
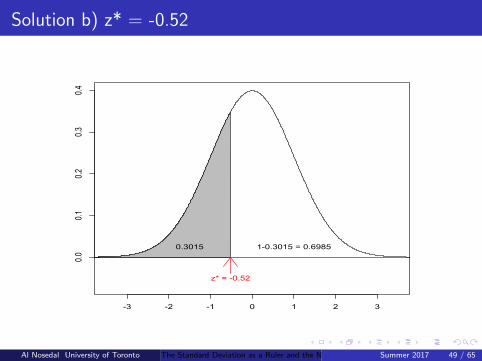
Solution b) z* = -0.52
-3 -2 -1 0 1 2 3
0.00.1
0.20.3
0.4
0.3015 1-0.3015 = 0.6985
z* = -0.52
Al Nosedal University of Toronto The Standard Deviation as a Ruler and the Normal Model Summer 2017 49 / 65
The Medical College Admission Test
The total scores on the Medical College Admission Test (MCAT) follow aNormal distribution with mean 25.0 and standard deviation 6.4. What arethe median and the first and third quartiles of the MCAT scores?
Al Nosedal University of Toronto The Standard Deviation as a Ruler and the Normal Model Summer 2017 50 / 65
Solution: Finding the median
Because the Normal distribution is symmetric, its median and mean arethe same. Hence, the median MCAT score is 25.
Al Nosedal University of Toronto The Standard Deviation as a Ruler and the Normal Model Summer 2017 51 / 65

Solution: Finding Q1
1. State the problem. We want to find the MCAT score x with area 0.25to its left under the Normal curve with mean µ = 25 and standarddeviation σ = 6.4.2. Use the table. Look in the body of Table A for the entry closest to0.25. It is 0.2514. This is the entry corresponding to z∗ = −0.67. Soz∗ = −0.67 is the standardized value with area 0.25 to its left.3. Unstandardize to transform the solution from the z∗ back to theoriginal x scale. We know that the standardized value of the unknown x isz∗ = −0.67.So x itself satisfies
x − 25
6.4= −0.67
Solving this equation for x givesx = 25 + (−0.67)(6.4) = 20.71
Al Nosedal University of Toronto The Standard Deviation as a Ruler and the Normal Model Summer 2017 52 / 65
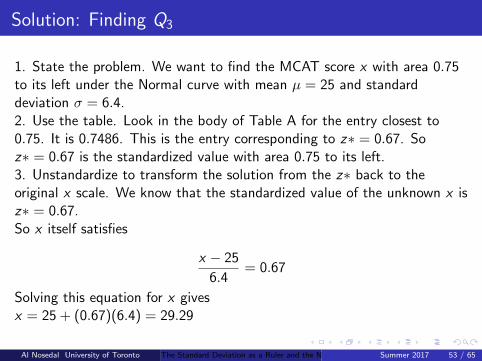
Solution: Finding Q3
1. State the problem. We want to find the MCAT score x with area 0.75to its left under the Normal curve with mean µ = 25 and standarddeviation σ = 6.4.2. Use the table. Look in the body of Table A for the entry closest to0.75. It is 0.7486. This is the entry corresponding to z∗ = 0.67. Soz∗ = 0.67 is the standardized value with area 0.75 to its left.3. Unstandardize to transform the solution from the z∗ back to theoriginal x scale. We know that the standardized value of the unknown x isz∗ = 0.67.So x itself satisfies
x − 25
6.4= 0.67
Solving this equation for x givesx = 25 + (0.67)(6.4) = 29.29
Al Nosedal University of Toronto The Standard Deviation as a Ruler and the Normal Model Summer 2017 53 / 65

Finding a value when given a proportion
1. State the problem.2. Use the table.3. Unstandardize to transform the solution from the z∗ back to theoriginal x scale.
Al Nosedal University of Toronto The Standard Deviation as a Ruler and the Normal Model Summer 2017 54 / 65

Example
The summer monsoon rains in India follow approximately a Normaldistribution with mean 852 mm of rainfall and standard deviation 82 mm.a) In the drought year 1987, 697 mm of rain fell. In what percent of allyears will India have 697 mm or less of monsoon rain?b) ”Normal rainfall” means within 20% of the long-term average, orbetween 683 and 1022 mm. In what percent of all years is the rainfallnormal?
Al Nosedal University of Toronto The Standard Deviation as a Ruler and the Normal Model Summer 2017 55 / 65

R code
a) Just type the following:
pnorm(697, mean = 852, sd = 82);
# You should get 0.02936267;
b) Just type the following:
pnorm(1022, 852, 82) - pnorm(683, 852, 82);
# You should get 0.9612691;
Al Nosedal University of Toronto The Standard Deviation as a Ruler and the Normal Model Summer 2017 56 / 65
Example
Consider an investment whose return is Normally distributed with a meanof 10% and a standard deviation of 5%.a. Determine the probability of losing money.b. Find the probability of losing money when the standard deviation isequal to 10%.
Al Nosedal University of Toronto The Standard Deviation as a Ruler and the Normal Model Summer 2017 57 / 65

Solution a)
X= return. We know that X is Normally distributed with mean (µ) 0.10and standard deviation (σ) 0.05. Another way of writing this is: X has aN(0.10, 0.05) distribution.
a. P(X < 0) = P(X−µσ < 0−0.1
0.05
)= P(Z < −2) = 0.0228.
Therefore, the probability of losing money is 2.28%.(Using the Empirical Rule gives 2.5%)
Al Nosedal University of Toronto The Standard Deviation as a Ruler and the Normal Model Summer 2017 58 / 65

Solution b)
(If we increase the standard deviation to 10%).Y= return. We know that Y is Normally distributed with mean (µ) 0.10and standard deviation (σ) 0.10. Another way of writing this is: Y has aN(0.10, 0.10) distribution.
a. P(Y < 0) = P(Y−µσ < 0−0.1
0.1
)= P(Z < −1) = 0.1587.
Therefore, the probability of losing money is 15.87%.
Al Nosedal University of Toronto The Standard Deviation as a Ruler and the Normal Model Summer 2017 59 / 65
Example
The demand for a daily newspaper at a newsstand at a busy intersection isknown to be Normally distributed with a mean of 150 and a standarddeviation of 25. How many newspapers should the newsstand operatororder to ensure that he runs short on no more than 20% of days?
Al Nosedal University of Toronto The Standard Deviation as a Ruler and the Normal Model Summer 2017 60 / 65

Solution
D = demand. We know that D has a Normal distribution with mean 150and standard deviation 25.1. State the problem. We want to find a number of newspapers, n∗, witharea 0.80 to its left under the Normal curve with mean µ = 150 andstandard deviation σ = 25.2. Use the table. Look in the body of Table A for the entry closest to0.80. It is .7995. This is the entry corresponding to z∗ = 0.84. Soz∗ = 0.84 is the standardized value with area 0.80 to its left.
Al Nosedal University of Toronto The Standard Deviation as a Ruler and the Normal Model Summer 2017 61 / 65

Solution
3. Unstandardize to transform the solution from the z∗ back to theoriginal D scale. We know that the standardized value of the unknown n∗
is z∗ = z∗ = 0.84.So n∗ itself satisfies
n∗ − 150
25= 0.84
Solving this equation for x givesn∗ = 150 + (0.84)(25) = 171The newsstand operator should order 171 newspapers.
Al Nosedal University of Toronto The Standard Deviation as a Ruler and the Normal Model Summer 2017 62 / 65

Example
Mensa is an organization whose members possess IQs that are in the top2% of the population. It is known that IQs are Normally distributed with amean of 100 and a standard deviation of 16. Find the minimum IQ neededto be a Mensa member.
Al Nosedal University of Toronto The Standard Deviation as a Ruler and the Normal Model Summer 2017 63 / 65
Solution
IQ∗ = µ+ z∗σ = 100 + 2.05(16) = 132.8We could round it to 133.
Al Nosedal University of Toronto The Standard Deviation as a Ruler and the Normal Model Summer 2017 64 / 65

R Code
qnorm(0.98, mean = 100, sd = 16);
Al Nosedal University of Toronto The Standard Deviation as a Ruler and the Normal Model Summer 2017 65 / 65
Related Documents