The spring energy budget of the algal mat community in a Crimean hypersaline lake determined by microcalorimetry Vladimir S. Mukhanov 1 , Olga G. Naidanova 1 , Nickolay V. Shadrin 1 and Richard B. Kemp 2, * 1 Institute of Biology of the Southern Seas, 2, Nakhimov Ave., Sevastopol 99011, Ukraine; 2 Institute of Biological Sciences, University of Wales, Aberystwyth, Wales SY23 3DA, UK; * Author for correspondence (fax: +44 1970 622350; e-mail: [email protected]) Received 9 January 2003; accepted in revised form 27 February 2004 Key words: Bacterioplankton, Biosurface, Cladophora, Heat flux, Microcalorimetry Abstract The energy contents standing stock of the floating mat formed by the green alga Cladophora sivaschensis and the energy transfers through it were quantified for a shallow hypersaline lake at Cape Khersones, Crimea, Ukraine during the spring months. Appropriate direct calorimetric techniques were applied to: i measure the heat energy dissipated by the mat community and by the free bacterioplankton in the water column below it; and ii differentiate between the heat flows by the heterotrophic and the phototrophic components of the community. It was shown that Cladophora biomass reached a peak of 579.5 g C m –2 , contributing more than 99.6% of the total mat community. Throughout the spring, the total bacterial energy transfer 6 to 23 mW m –2 was as little as 1.1 to 2.6% of the total heat dissipated by the microplankton community. The rest of the estimated heat energy 584 to 1488 mW m –2 was associated with Cladophora metabolism. In the spring community: i the rate of biomass accumulation in the lake photic layer significantly exceeded its heterotrophic mineralisation; ii the efficiency of the microbial loop was too low to process even a minor part of the accumulated organic matter. The microcalorimetric technique was shown to be a highly promising approach for further studies of natural micro- bial mats and biofilms, biological systems with complex metabolism that involves not only aerobic processes but also anaerobic catabolism under local hypoxic/microxic conditions. Introduction Hypersaline lakes are amongst the ecosystems whose biogeochemical cycling is closely coupled with and, in fact, formed by microbial processes, including pri- mary production, heterotrophic uptake, digestion and mineralisation of the accumulated organic matter. In the Crimea at least, their greatly enhanced primary productivity is due, in particular, to the high produc- tion potential of floating mats formed by the filamen- tous green alga, Cladophora sivaschensis, C. Meyer, 1922 Chlorophyta: Cladophoraceae. Cladophora spp. play a major role in lake ecosystems Dodds and Gudder 1992 and C. sivaschensis is typical in this respect, forming a complex community in the Cape Khersones lake that: i includes anoxygenic pho- totrophs and aerobic/anaerobic heterotrophs; and ii demonstrates a pronounced imbalance in the pro- cesses of organic matter production and mineralisa- tion Ivanova et al. 1994. Shadrin et al. 2001 described the annual changes in this lake. From the late winter to the autumn, the Cladophora mat undergoes successive structural and functional changes accompanied by a marked in- crease in the filament concentration and, conse- quently, in the biomass. From early June onwards, the Aquatic Ecology 38: 375–385, 2004. © 2004 Kluwer Academic Publishers. Printed in the Netherlands. 375

Welcome message from author
This document is posted to help you gain knowledge. Please leave a comment to let me know what you think about it! Share it to your friends and learn new things together.
Transcript
The spring energy budget of the algal mat community in a Crimeanhypersaline lake determined by microcalorimetry
Vladimir S. Mukhanov1, Olga G. Naidanova1, Nickolay V. Shadrin1 and RichardB. Kemp2,*1Institute of Biology of the Southern Seas, 2, Nakhimov Ave., Sevastopol 99011, Ukraine; 2Institute ofBiological Sciences, University of Wales, Aberystwyth, Wales SY23 3DA, UK; *Author for correspondence(fax: +44 1970 622350; e-mail: [email protected])
Received 9 January 2003; accepted in revised form 27 February 2004
Key words: Bacterioplankton, Biosurface, Cladophora, Heat flux, Microcalorimetry
Abstract
The energy contents �standing stock� of the floating mat formed by the green alga Cladophora sivaschensis andthe energy transfers through it were quantified for a shallow hypersaline lake �at Cape Khersones, Crimea,Ukraine� during the spring months. Appropriate direct calorimetric techniques were applied to: �i� measure theheat energy dissipated by the mat community and by the free bacterioplankton in the water column below it; and�ii� differentiate between the heat flows by the heterotrophic and the phototrophic components of the community.It was shown that Cladophora biomass reached a peak of 579.5 g C m–2, contributing more than 99.6% of thetotal mat community. Throughout the spring, the total bacterial energy transfer �6 to 23 mW m–2� was as little as1.1 to 2.6% of the total heat dissipated by the microplankton community. The rest of the estimated heat energy�584 to 1488 mW m–2� was associated with Cladophora metabolism. In the spring community: �i� the rate ofbiomass accumulation in the lake photic layer significantly exceeded its heterotrophic mineralisation; �ii� theefficiency of the microbial loop was too low to process even a minor part of the accumulated organic matter. Themicrocalorimetric technique was shown to be a highly promising approach for further studies of natural micro-bial mats and biofilms, biological systems with complex metabolism that involves not only aerobic processes butalso anaerobic catabolism under local hypoxic/microxic conditions.
Introduction
Hypersaline lakes are amongst the ecosystems whosebiogeochemical cycling is closely coupled with and,in fact, formed by microbial processes, including pri-mary production, heterotrophic uptake, digestion andmineralisation of the accumulated organic matter. Inthe Crimea at least, their greatly enhanced primaryproductivity is due, in particular, to the high produc-tion potential of floating mats formed by the filamen-tous green alga, Cladophora sivaschensis, C. Meyer,1922 �Chlorophyta: Cladophoraceae�. Cladophoraspp. play a major role in lake ecosystems �Dodds and
Gudder 1992� and C. sivaschensis is typical in thisrespect, forming a complex community in the CapeKhersones lake that: �i� includes anoxygenic pho-totrophs and aerobic/anaerobic heterotrophs; and �ii�demonstrates a pronounced imbalance in the pro-cesses of organic matter production and mineralisa-tion �Ivanova et al. 1994�.
Shadrin et al. �2001� described the annual changesin this lake. From the late winter to the autumn, theCladophora mat undergoes successive structural andfunctional changes accompanied by a marked in-crease in the filament concentration and, conse-quently, in the biomass. From early June onwards, the
Aquatic Ecology 38: 375–385, 2004.© 2004 Kluwer Academic Publishers. Printed in the Netherlands.
375
so-called ‘sandwich‘ structure of the mat forms, witha thin, dense biofilm of cyanobacteria and diatomsdeveloping on the upper surface of the mat to changeits colour from green to fulvous. At this stage in thesuccession, the role of the unicellular microorganisms�mainly cyanobacteria and diatoms� inhabiting themat becomes more prominent and the deepest layerof the mat may contain local pockets that have hy-poxic/microxic conditions �Peckol and Rivers 1995�.
In this exploratory study, we examined an interme-diate phase of the mat development from late Marchto late May, which was characterized by an abruptdecrease in the rate of algal metabolism against abackground of extremely high biomass and biosur-face concentrations inside the mat. The first aim ofthe work was to calculate the energy standing stocksand transfers in the phototrophic algae and the het-erotrophic bacteria. According to a reasonable con-ceptual scheme, the first group, the primary produc-ers, supplies the system with the flow of organicmatter while the second one, forming the detrital foodchain, controls the rate of mineralisation of theorganic matter accumulated in the system. The kinet-ics of these processes and, additionally, the ratio be-tween them can serve as the key for calculating theenergy balance of the system and estimating its bio-logical effectiveness.
The fact that all processes, including biogenic ones,are accompanied by changes in heat energy meansthat direct calorimetry is a powerful analytical tool�Spink and Wadsö 1976�. A key property, non-speci-ficity, makes its use compelling in studies of complexbiological systems like the natural microbial commu-nities, especially in the years since the microwattcalorimeters first became available. The type ofinvestigation that is concerned with the complete mi-crobial community rather than the individual specieswithin it has been practiced in soil research from thepioneering studies in the 1930s of Hesselink vanSuchtelen �1931� to the present day �see for instanceNúñez-Regueira et al. 2002�. In the light of this, bio-films and mats that also exhibit high biomass concen-trations and enhanced microbial activity are promis-ing systems for the similar-type environmental andanalytical studies. A most persuasive reason for ex-ploring the potential of direct calorimetry in matstudies is the stagnant hypoxic nature of the condi-tions common in this kind of biotope �e.g., Peckol andRivers 1995�. In contrast to respirometry, calorimetryprovides the essential kinetic information on integral�aerobic � anaerobic� metabolism, serving as a pow-
erful tool for constructing ecosystem network modelsof material and/or energy flows. At the same time, incombination with respirometry, it differentiates be-tween the aerobic and anaerobic processes that occurin the system through the calorimetric/respirometric�CR� ratio calculated from the two measurements�Gnaiger and Kemp 1990�. Thus, the second, moremethodological aim of this work was to adopt a com-mercial microcalorimeter, known mainly as ananalytical tool for environmental studies and, in par-ticular, for microbial ecology in an approach similarto that of Pamatmat et al. �1981� for heat flow mea-surements of sediments with a bespoke instrument.We applied the standard microcalorimetric practice tothe mat and an original technique using the same in-strument first employed in a study of marine bacteri-oplankton �Mukhanov et al. 2003� for measuring theheat flow and thus the metabolic rate of the lake bac-teria after concentrating them.
Theory
It is necessary to use a heat conduction calorimeter inthe present study because it measures the instanta-neous rate of heat flow �� � dQ/dt, Watts, W� �Kemp1998�. This means that the measurement gives the ki-netics of the process as well as providing thermody-namic information relating to the state functions suchas the enthalpy change, ��. The heat flow is prop-erly regarded as the rate of thermal �th� advancement,dth�/dt, in the energy transformations �Gnaiger 1993�.Advancement of a reaction is sometimes known asthe extent of reaction. It is an important concept inenergy transformation because it is expressed explic-itly in terms of the stoichiometric coefficients, �i, ofthe i-th species in the reaction. In other words, ther-mal advancement is directly related to the stoichiom-etry of the reaction. It must be stressed that obviouslythis is true irrespective of the complexity of the reac-tion, i.e., one as complex as the biotic growth reac-tion – the metabolic reaction �see Kemp and Guan1999�.
The rate of the growth reaction, the so-calledmetabolic rate or ‘activity‘, is simply a convenientphrase to denote the rate of advancement of the ag-gregated biochemical reactions in the growth reaction�Kemp 2000� of living matter, d�B/dt, or the scalarflux when the rate is expressed as specific to mass,�1/X��d�B/dt� where X represents the amount of bio-mass or cell volume. The vector flux was also
376
expressed for some results in this paper, i.e., the heatflow per unit surface area of the organism�s�. Thethermal advancement of energy transformation, dth�,is related to d�B by the expression �Kemp, 2000�,
dth� � � i � HB,id�B �1�
where �HB,i is the molar enthalpy of the reaction interms of species i �Kemp and Guan, 1999�. Thechange in thermal advancement, dth�, is exactlyequivalent to the change in heat, dQ. The conclusionof this theoretical treatment is that the calorimetri-cally measured heat flow is a function of the meta-bolic rate of the living matter under investigation.
Materials and methods
The surface water samples were collected in March-May 2002 in a shallow hypersaline lake at CapeKhersones near Sevastopol in the South-West Crimea,Ukraine �44°35�09� N, 33°23�39� E�. It is a small�0.02 km2� lake of marine origin separated from theBlack Sea by the narrow, stony isthmus of about 15m width, through which is a permanent infiltration ofsea water. There is also a small freshwater inflow. Thelake depth does not exceed 85 cm in winter and 60cm in summer. Seasonal water temperature and salin-ity fluctuations occur within the ranges of 3.3 to 34ºC and 60 to 106 g l–1 NaCl, respectively.
The early season formation of the floating mats ofCladophora siwaschensis is a characteristic of thelake. By late March when the work started, the mat atthe exact sampling site was well formed and stable.The samples were carefully taken: �i� from inside themat with a broad-mouth plastic sampler to collectCladophora filaments and inter-filament water; and�ii� in the water column below the mat with a 2 Lcontainer analogous to the Niskin bottle. For the ap-proximations of energy transfers, the in situ tempera-tures were recorded and the depth of the watercolumn and the thickness of the mat were averagedat 30 cm and 4 cm, respectively.
Microcalorimetric measurements were carried outwith an LKB BioActivity Monitor �BAM�, Model2277 �the successor is the Thermal Activity Monitor�TAM�, Thermometric AB, Järfälla, Sweden�equipped with three independent sets of twin differ-ential channels, one of each twin for the test materialand the other as the control. Accordingly, three energy
budget components, namely �i� the total heat flow bythe mat community; �ii� the heat flow by the bacterialfraction from the mat; and �iii� the heat flow by thebacterial fraction from the water column below themat, were measured simultaneously in each calori-metric experiment. All the experiments were con-ducted at 20 ºC, and the energy transfers under in situtemperatures were calculated from the measured heatflow assuming Q10 � 2. In the batch mode measure-ments, the baseline noise was less than � 0.1 Wwhile the samples produced from about 5 to 63 Wper ampoule.
The concentration of the living biomass in the matwas high enough to allow the direct measurement ofits heat flow. For each calorimetric experiment, a matsub-sample including the inter-filament water wascarefully transferred directly into a sterile 3 ml glassampoule without the need for any preparative stages.The control ampoule contained an equal volume ofparticle-free lake water taken from the same site andfiltered using nitrocellulose membranes, 0.1 m poresize, 47 mm diam. to give particle-free water �Sarto-rius #SM113 58-047�. The heat flow by the mat wasassumed to be associated exclusively with photoau-totrophic metabolism because the Cladophora bio-mass concentration in it was several orders ofmagnitude higher than for other algal species. For thesame reason, the budget estimates performed for thetotal water column ignored the heat flow by the phy-toplankton.
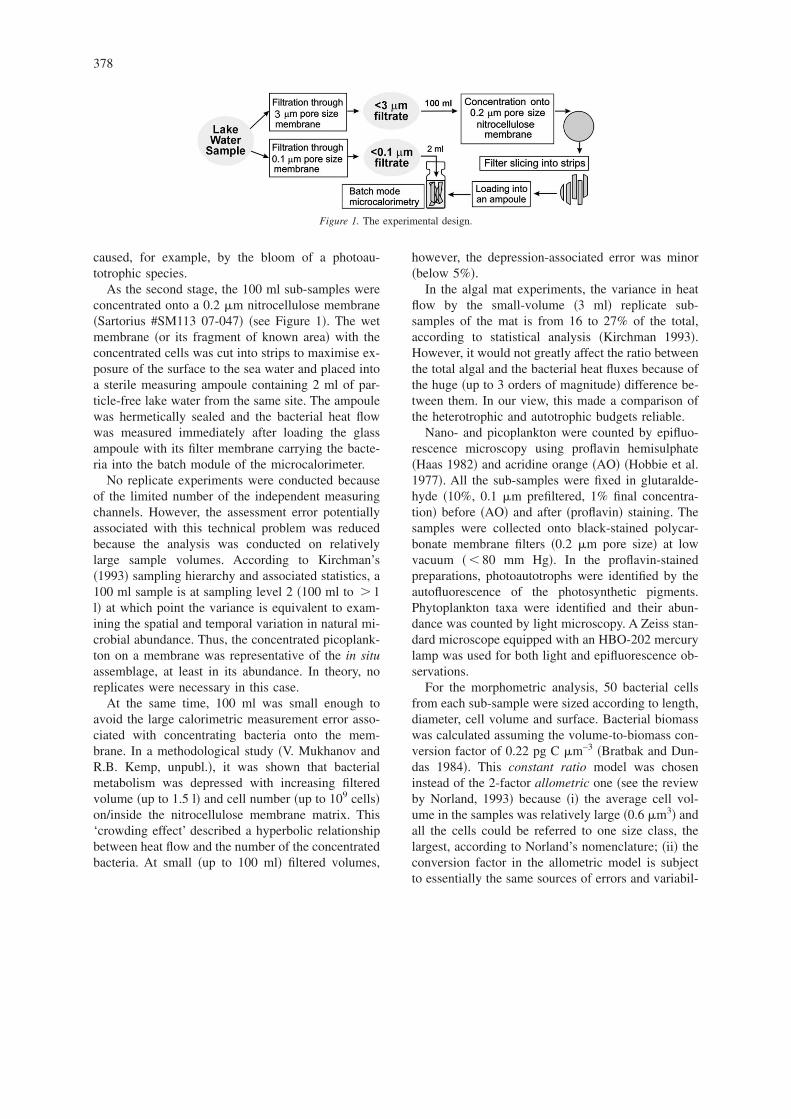
The heat flows by free-living bacteria inhabitingthe inter-filament water in the mat and by the pico-plankton in the water column below the mat weremeasured after a two-step filtration technique �Mukh-anov et al. 2003�. Initially, the 100 ml sub-sampleswere screened with a 3 m pore size membrane �Sar-torius #SM113 02-047� to remove nano- and mi-croplankton. The 3 m filtrate contained theso-called picoseston, with only the amount ofheterotrophic bacteria concentrated in it being suffi-cient for calorimetric detection. Concentrations ofcells in other taxonomic groups, including anycyanobacteria and small nanoplankton passingthrough the membrane, were too low �not more than2% in terms of biomass� to affect the calorimetricmeasurements and, thereby, the budget calculations.For this reason, their abundance and biomass werenot quantified thoroughly and the heat flow by the pi-coseston was assumed to be associated solely with theheterotrophic bacteria. However, all the samples weremicroscopically examined to check for artefacts
377
caused, for example, by the bloom of a photoau-totrophic species.
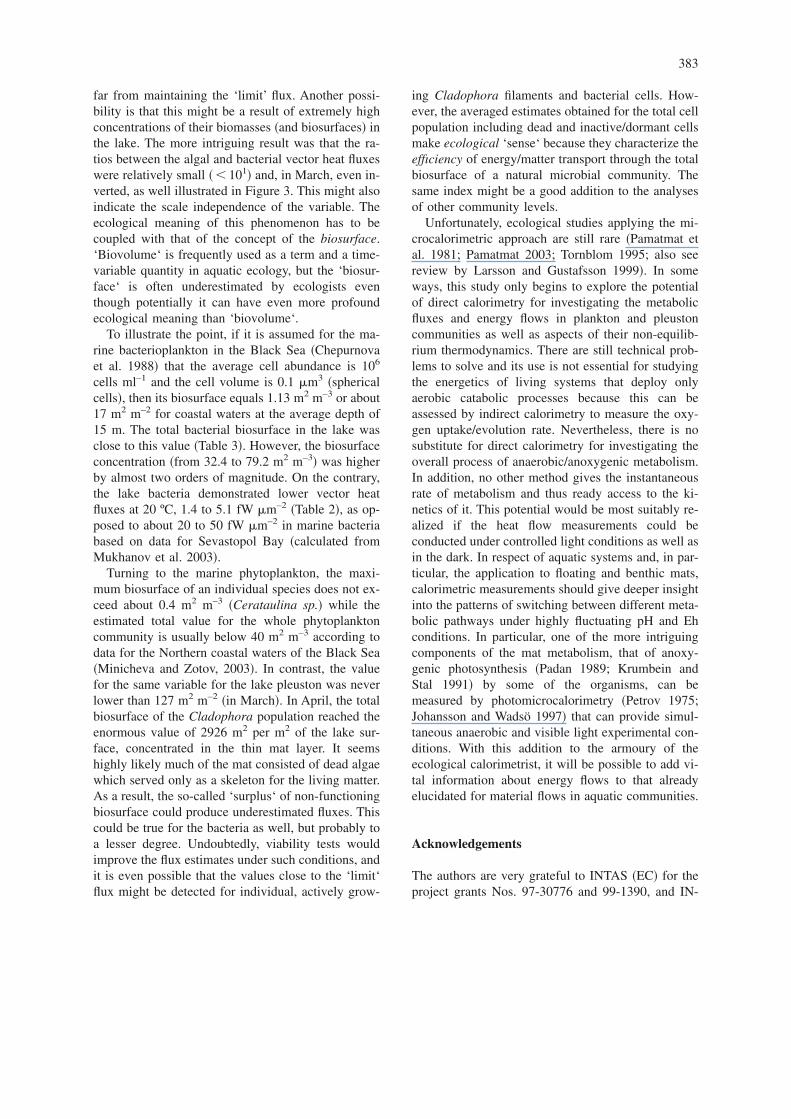
As the second stage, the 100 ml sub-samples wereconcentrated onto a 0.2 m nitrocellulose membrane�Sartorius #SM113 07-047� �see Figure 1�. The wetmembrane �or its fragment of known area� with theconcentrated cells was cut into strips to maximise ex-posure of the surface to the sea water and placed intoa sterile measuring ampoule containing 2 ml of par-ticle-free lake water from the same site. The ampoulewas hermetically sealed and the bacterial heat flowwas measured immediately after loading the glassampoule with its filter membrane carrying the bacte-ria into the batch module of the microcalorimeter.
No replicate experiments were conducted becauseof the limited number of the independent measuringchannels. However, the assessment error potentiallyassociated with this technical problem was reducedbecause the analysis was conducted on relativelylarge sample volumes. According to Kirchman’s�1993� sampling hierarchy and associated statistics, a100 ml sample is at sampling level 2 �100 ml to � 1l� at which point the variance is equivalent to exam-ining the spatial and temporal variation in natural mi-crobial abundance. Thus, the concentrated picoplank-ton on a membrane was representative of the in situassemblage, at least in its abundance. In theory, noreplicates were necessary in this case.
At the same time, 100 ml was small enough toavoid the large calorimetric measurement error asso-ciated with concentrating bacteria onto the mem-brane. In a methodological study �V. Mukhanov andR.B. Kemp, unpubl.�, it was shown that bacterialmetabolism was depressed with increasing filteredvolume �up to 1.5 l� and cell number �up to 109 cells�on/inside the nitrocellulose membrane matrix. This‘crowding effect’ described a hyperbolic relationshipbetween heat flow and the number of the concentratedbacteria. At small �up to 100 ml� filtered volumes,
however, the depression-associated error was minor�below 5%�.
In the algal mat experiments, the variance in heatflow by the small-volume �3 ml� replicate sub-samples of the mat is from 16 to 27% of the total,according to statistical analysis �Kirchman 1993�.However, it would not greatly affect the ratio betweenthe total algal and the bacterial heat fluxes because ofthe huge �up to 3 orders of magnitude� difference be-tween them. In our view, this made a comparison ofthe heterotrophic and autotrophic budgets reliable.
Nano- and picoplankton were counted by epifluo-rescence microscopy using proflavin hemisulphate�Haas 1982� and acridine orange �AO� �Hobbie et al.1977�. All the sub-samples were fixed in glutaralde-hyde �10%, 0.1 m prefiltered, 1% final concentra-tion� before �AO� and after �proflavin� staining. Thesamples were collected onto black-stained polycar-bonate membrane filters �0.2 m pore size� at lowvacuum � 80 mm Hg�. In the proflavin-stainedpreparations, photoautotrophs were identified by theautofluorescence of the photosynthetic pigments.Phytoplankton taxa were identified and their abun-dance was counted by light microscopy. A Zeiss stan-dard microscope equipped with an HBO-202 mercurylamp was used for both light and epifluorescence ob-servations.
For the morphometric analysis, 50 bacterial cellsfrom each sub-sample were sized according to length,diameter, cell volume and surface. Bacterial biomasswas calculated assuming the volume-to-biomass con-version factor of 0.22 pg C m–3 �Bratbak and Dun-das 1984�. This constant ratio model was choseninstead of the 2-factor allometric one �see the reviewby Norland, 1993� because �i� the average cell vol-ume in the samples was relatively large �0.6 m3� andall the cells could be referred to one size class, thelargest, according to Norland’s nomenclature; �ii� theconversion factor in the allometric model is subjectto essentially the same sources of errors and variabil-
Figure 1. The experimental design.
378
ity as the conversion factors for the constant ratiomodel �Norland 1993�, and �iii� the Bratbak-Dundasfactor is frequently used for the approximations at thelevels of the community and the ecosystem, whichmakes it easier to conduct inter-study comparisons.
The microalgal carbon biomass was calculated us-ing the regression equations given by Strathmann�1967�:
logC = 0.866 log V � 0.460 for diatoms,
logC = 0.758 log V � 0.422 for other groups,
where C is the carbon per cell �pg� and V is the cellvolume �m3�. The biomass energy content equiva-lents were calculated using the conversion factors of1 mg C � 43.45 J and 44.17 J for bacteria and algae,respectively �calculated from the average bacterialand algal enthalpies of combustion given by Dubocet al. 1999�.
Results
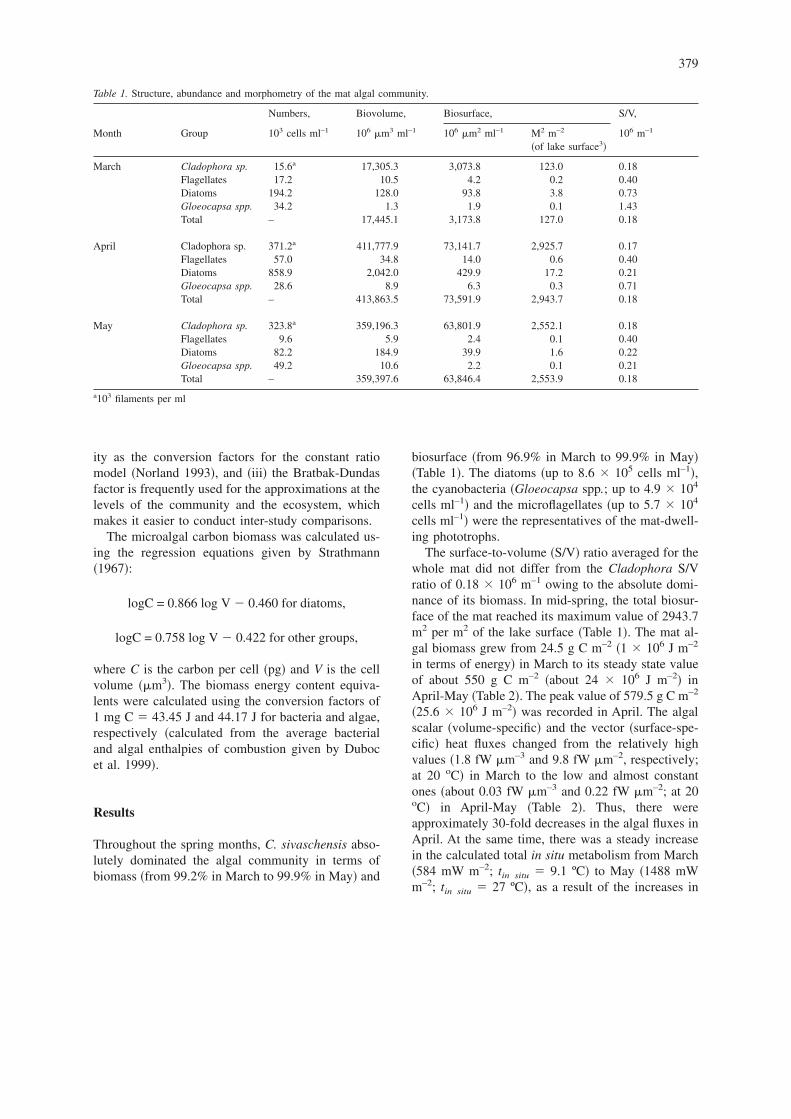
Throughout the spring months, C. sivaschensis abso-lutely dominated the algal community in terms ofbiomass �from 99.2% in March to 99.9% in May� and
biosurface �from 96.9% in March to 99.9% in May��Table 1�. The diatoms �up to 8.6 � 105 cells ml–1�,the cyanobacteria �Gloeocapsa spp.; up to 4.9 � 104
cells ml–1� and the microflagellates �up to 5.7 � 104
cells ml–1� were the representatives of the mat-dwell-ing phototrophs.
The surface-to-volume �S/V� ratio averaged for thewhole mat did not differ from the Cladophora S/Vratio of 0.18 � 106 m–1 owing to the absolute domi-nance of its biomass. In mid-spring, the total biosur-face of the mat reached its maximum value of 2943.7m2 per m2 of the lake surface �Table 1�. The mat al-gal biomass grew from 24.5 g C m–2 �1 � 106 J m–2
in terms of energy� in March to its steady state valueof about 550 g C m–2 �about 24 � 106 J m–2� inApril-May �Table 2�. The peak value of 579.5 g C m–2
�25.6 � 106 J m–2� was recorded in April. The algalscalar �volume-specific� and the vector �surface-spe-cific� heat fluxes changed from the relatively highvalues �1.8 fW m–3 and 9.8 fW m–2, respectively;at 20 oC� in March to the low and almost constantones �about 0.03 fW m–3 and 0.22 fW m–2; at 20oC� in April-May �Table 2�. Thus, there wereapproximately 30-fold decreases in the algal fluxes inApril. At the same time, there was a steady increasein the calculated total in situ metabolism from March�584 mW m–2; tin situ � 9.1 ºC� to May �1488 mWm–2; tin situ � 27 ºC�, as a result of the increases in
Table 1. Structure, abundance and morphometry of the mat algal community.
Numbers, Biovolume, Biosurface, S/V,
Month Group 103 cells ml–1 106 m3 ml–1 106 m2 ml–1 M2 m–2
�of lake surface3�106 m–1
March Cladophora sp. 15.6a 17,305.3 3,073.8 123.0 0.18Flagellates 17.2 10.5 4.2 0.2 0.40Diatoms 194.2 128.0 93.8 3.8 0.73Gloeocapsa spp. 34.2 1.3 1.9 0.1 1.43Total – 17,445.1 3,173.8 127.0 0.18
April Cladophora sp. 371.2a 411,777.9 73,141.7 2,925.7 0.17Flagellates 57.0 34.8 14.0 0.6 0.40Diatoms 858.9 2,042.0 429.9 17.2 0.21Gloeocapsa spp. 28.6 8.9 6.3 0.3 0.71Total – 413,863.5 73,591.9 2,943.7 0.18
May Cladophora sp. 323.8a 359,196.3 63,801.9 2,552.1 0.18Flagellates 9.6 5.9 2.4 0.1 0.40Diatoms 82.2 184.9 39.9 1.6 0.22Gloeocapsa spp. 49.2 10.6 2.2 0.1 0.21Total – 359,397.6 63,846.4 2,553.9 0.18
a103 filaments per ml
379
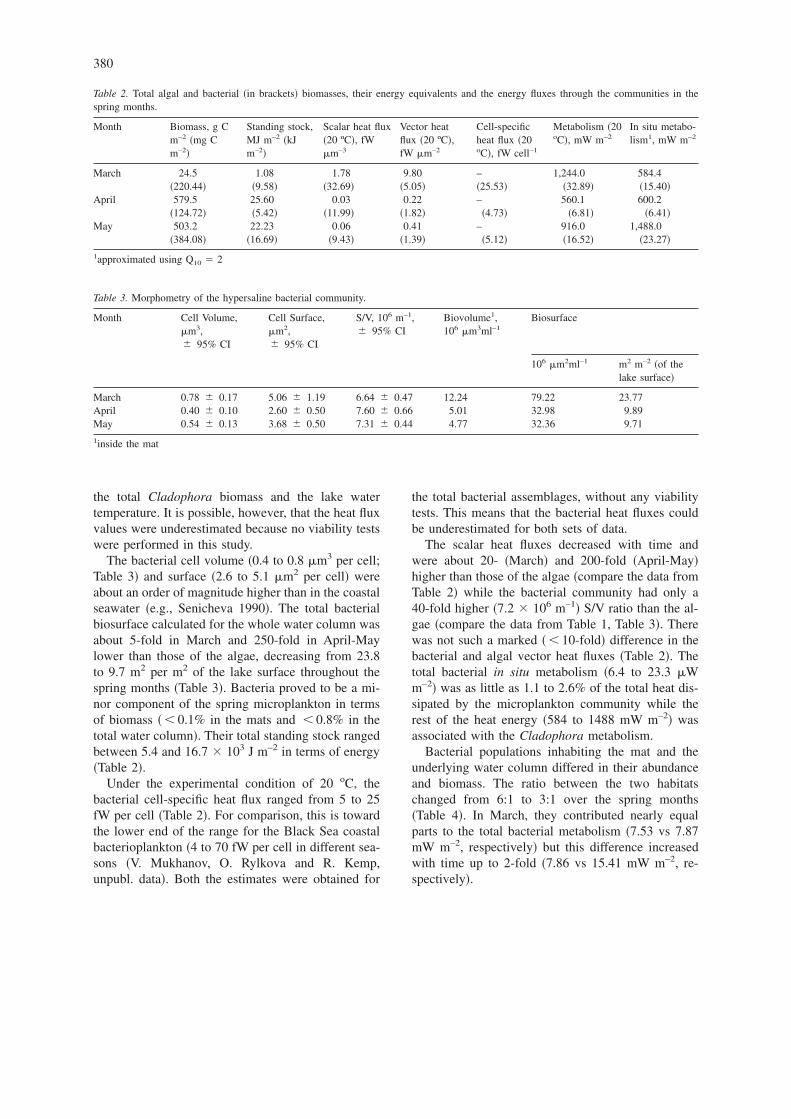
the total Cladophora biomass and the lake watertemperature. It is possible, however, that the heat fluxvalues were underestimated because no viability testswere performed in this study.
The bacterial cell volume �0.4 to 0.8 m3 per cell;Table 3� and surface �2.6 to 5.1 m2 per cell� wereabout an order of magnitude higher than in the coastalseawater �e.g., Senicheva 1990�. The total bacterialbiosurface calculated for the whole water column wasabout 5-fold in March and 250-fold in April-Maylower than those of the algae, decreasing from 23.8to 9.7 m2 per m2 of the lake surface throughout thespring months �Table 3�. Bacteria proved to be a mi-nor component of the spring microplankton in termsof biomass � 0.1% in the mats and 0.8% in thetotal water column�. Their total standing stock rangedbetween 5.4 and 16.7 � 103 J m–2 in terms of energy�Table 2�.
Under the experimental condition of 20 oC, thebacterial cell-specific heat flux ranged from 5 to 25fW per cell �Table 2�. For comparison, this is towardthe lower end of the range for the Black Sea coastalbacterioplankton �4 to 70 fW per cell in different sea-sons �V. Mukhanov, O. Rylkova and R. Kemp,unpubl. data�. Both the estimates were obtained for
the total bacterial assemblages, without any viabilitytests. This means that the bacterial heat fluxes couldbe underestimated for both sets of data.
The scalar heat fluxes decreased with time andwere about 20- �March� and 200-fold �April-May�higher than those of the algae �compare the data fromTable 2� while the bacterial community had only a40-fold higher �7.2 � 106 m–1� S/V ratio than the al-gae �compare the data from Table 1, Table 3�. Therewas not such a marked � 10-fold� difference in thebacterial and algal vector heat fluxes �Table 2�. Thetotal bacterial in situ metabolism �6.4 to 23.3 Wm–2� was as little as 1.1 to 2.6% of the total heat dis-sipated by the microplankton community while therest of the heat energy �584 to 1488 mW m–2� wasassociated with the Cladophora metabolism.
Bacterial populations inhabiting the mat and theunderlying water column differed in their abundanceand biomass. The ratio between the two habitatschanged from 6:1 to 3:1 over the spring months�Table 4�. In March, they contributed nearly equalparts to the total bacterial metabolism �7.53 vs 7.87mW m–2, respectively� but this difference increasedwith time up to 2-fold �7.86 vs 15.41 mW m–2, re-spectively�.
Table 2. Total algal and bacterial �in brackets� biomasses, their energy equivalents and the energy fluxes through the communities in thespring months.
Month Biomass, g Cm–2 �mg Cm–2�
Standing stock,MJ m–2 �kJm–2�
Scalar heat flux�20 ºC�, fWm–3
Vector heatflux �20 ºC�,fW m–2
Cell-specificheat flux �20oC�, fW cell–1
Metabolism �20oC�, mW m–2
In situ metabo-lism1, mW m–2
March 24.5 1.08 1.78 9.80 – 1,244.0 584.4�220.44� �9.58� �32.69� �5.05� �25.53� �32.89� �15.40�
April 579.5 25.60 0.03 0.22 – 560.1 600.2�124.72� �5.42� �11.99� �1.82� �4.73� �6.81� �6.41�
May 503.2 22.23 0.06 0.41 – 916.0 1,488.0�384.08� �16.69� �9.43� �1.39� �5.12� �16.52� �23.27�
1approximated using Q10 � 2
Table 3. Morphometry of the hypersaline bacterial community.
Month Cell Volume,m3,� 95% CI
Cell Surface,m2,� 95% CI
S/V, 106 m–1,� 95% CI
Biovolume1,106 m3ml–1
Biosurface
106 m2ml–1 m2 m–2 �of thelake surface�
March 0.78 � 0.17 5.06 � 1.19 6.64 � 0.47 12.24 79.22 23.77April 0.40 � 0.10 2.60 � 0.50 7.60 � 0.66 5.01 32.98 9.89May 0.54 � 0.13 3.68 � 0.50 7.31 � 0.44 4.77 32.36 9.71
1inside the mat
380
Discussion
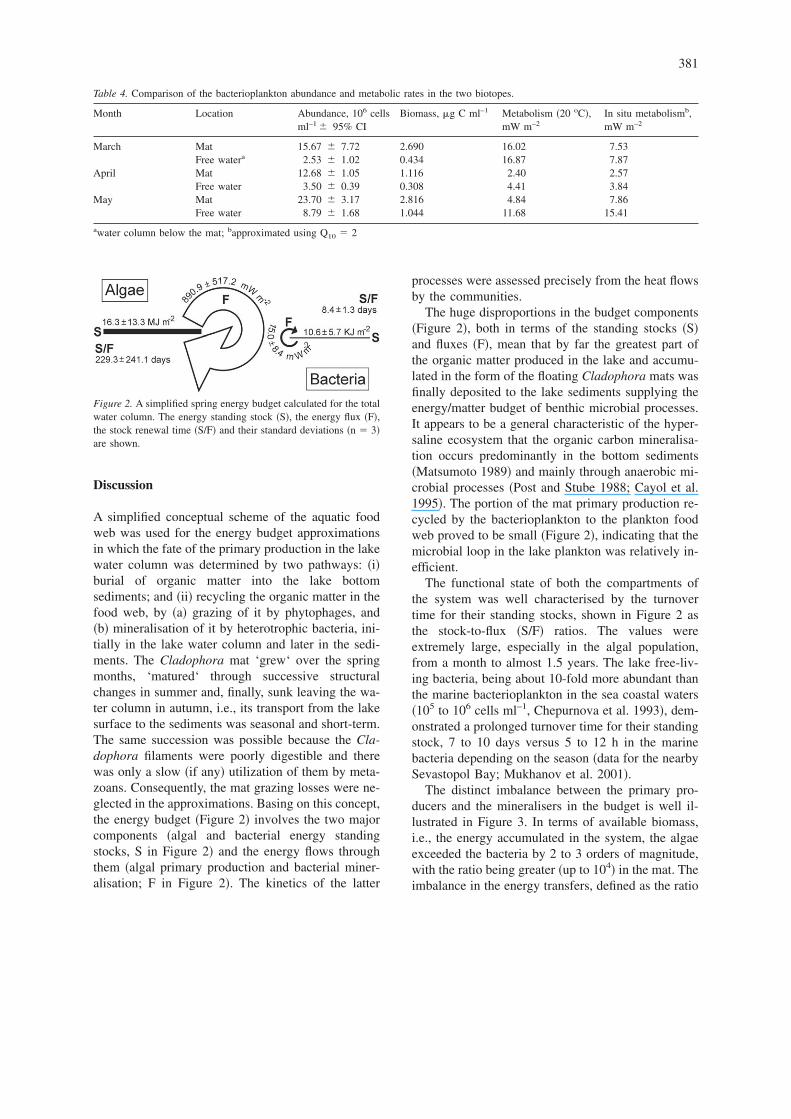
A simplified conceptual scheme of the aquatic foodweb was used for the energy budget approximationsin which the fate of the primary production in the lakewater column was determined by two pathways: �i�burial of organic matter into the lake bottomsediments; and �ii� recycling the organic matter in thefood web, by �a� grazing of it by phytophages, and�b� mineralisation of it by heterotrophic bacteria, ini-tially in the lake water column and later in the sedi-ments. The Cladophora mat ‘grew‘ over the springmonths, ‘matured‘ through successive structuralchanges in summer and, finally, sunk leaving the wa-ter column in autumn, i.e., its transport from the lakesurface to the sediments was seasonal and short-term.The same succession was possible because the Cla-dophora filaments were poorly digestible and therewas only a slow �if any� utilization of them by meta-zoans. Consequently, the mat grazing losses were ne-glected in the approximations. Basing on this concept,the energy budget �Figure 2� involves the two majorcomponents �algal and bacterial energy standingstocks, S in Figure 2� and the energy flows throughthem �algal primary production and bacterial miner-alisation; F in Figure 2�. The kinetics of the latter
processes were assessed precisely from the heat flowsby the communities.
The huge disproportions in the budget components�Figure 2�, both in terms of the standing stocks �S�and fluxes �F�, mean that by far the greatest part ofthe organic matter produced in the lake and accumu-lated in the form of the floating Cladophora mats wasfinally deposited to the lake sediments supplying theenergy/matter budget of benthic microbial processes.It appears to be a general characteristic of the hyper-saline ecosystem that the organic carbon mineralisa-tion occurs predominantly in the bottom sediments�Matsumoto 1989� and mainly through anaerobic mi-crobial processes �Post and Stube 1988; Cayol et al.1995�. The portion of the mat primary production re-cycled by the bacterioplankton to the plankton foodweb proved to be small �Figure 2�, indicating that themicrobial loop in the lake plankton was relatively in-efficient.
The functional state of both the compartments ofthe system was well characterised by the turnovertime for their standing stocks, shown in Figure 2 asthe stock-to-flux �S/F� ratios. The values wereextremely large, especially in the algal population,from a month to almost 1.5 years. The lake free-liv-ing bacteria, being about 10-fold more abundant thanthe marine bacterioplankton in the sea coastal waters�105 to 106 cells ml–1, Chepurnova et al. 1993�, dem-onstrated a prolonged turnover time for their standingstock, 7 to 10 days versus 5 to 12 h in the marinebacteria depending on the season �data for the nearbySevastopol Bay; Mukhanov et al. 2001�.
The distinct imbalance between the primary pro-ducers and the mineralisers in the budget is well il-lustrated in Figure 3. In terms of available biomass,i.e., the energy accumulated in the system, the algaeexceeded the bacteria by 2 to 3 orders of magnitude,with the ratio being greater �up to 104� in the mat. Theimbalance in the energy transfers, defined as the ratio
Table 4. Comparison of the bacterioplankton abundance and metabolic rates in the two biotopes.
Month Location Abundance, 106 cellsml–1 � 95% CI
Biomass, g C ml–1 Metabolism �20 oC�,mW m–2
In situ metabolismb,mW m–2
March Mat 15.67 � 7.72 2.690 16.02 7.53Free watera 2.53 � 1.02 0.434 16.87 7.87
April Mat 12.68 � 1.05 1.116 2.40 2.57Free water 3.50 � 0.39 0.308 4.41 3.84
May Mat 23.70 � 3.17 2.816 4.84 7.86Free water 8.79 � 1.68 1.044 11.68 15.41
awater column below the mat; bapproximated using Q10 � 2
Figure 2. A simplified spring energy budget calculated for the totalwater column. The energy standing stock �S�, the energy flux �F�,the stock renewal time �S/F� and their standard deviations �n � 3�are shown.
381
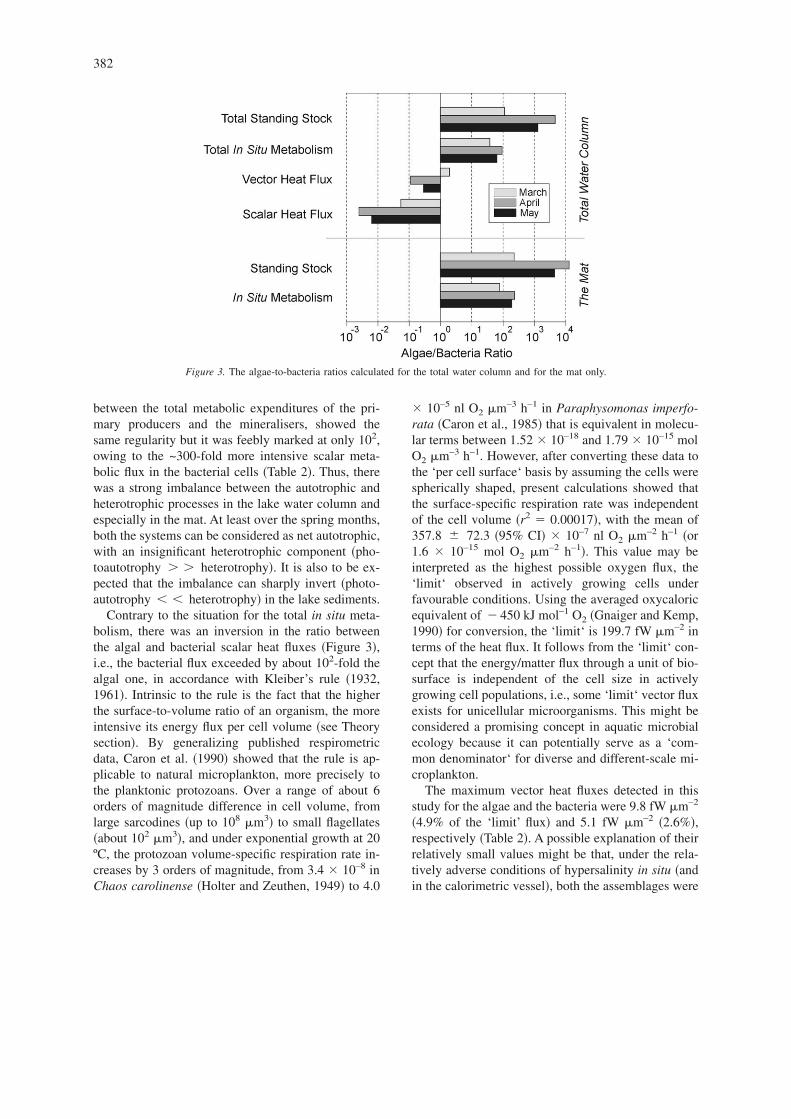
between the total metabolic expenditures of the pri-mary producers and the mineralisers, showed thesame regularity but it was feebly marked at only 102,owing to the ~300-fold more intensive scalar meta-bolic flux in the bacterial cells �Table 2�. Thus, therewas a strong imbalance between the autotrophic andheterotrophic processes in the lake water column andespecially in the mat. At least over the spring months,both the systems can be considered as net autotrophic,with an insignificant heterotrophic component �pho-toautotrophy � � heterotrophy�. It is also to be ex-pected that the imbalance can sharply invert �photo-autotrophy heterotrophy� in the lake sediments.
Contrary to the situation for the total in situ meta-bolism, there was an inversion in the ratio betweenthe algal and bacterial scalar heat fluxes �Figure 3�,i.e., the bacterial flux exceeded by about 102-fold thealgal one, in accordance with Kleiber’s rule �1932,1961�. Intrinsic to the rule is the fact that the higherthe surface-to-volume ratio of an organism, the moreintensive its energy flux per cell volume �see Theorysection�. By generalizing published respirometricdata, Caron et al. �1990� showed that the rule is ap-plicable to natural microplankton, more precisely tothe planktonic protozoans. Over a range of about 6orders of magnitude difference in cell volume, fromlarge sarcodines �up to 108 m3� to small flagellates�about 102 m3�, and under exponential growth at 20ºC, the protozoan volume-specific respiration rate in-creases by 3 orders of magnitude, from 3.4 � 10–8 inChaos carolinense �Holter and Zeuthen, 1949� to 4.0
� 10–5 nl O2 m–3 h–1 in Paraphysomonas imperfo-rata �Caron et al., 1985� that is equivalent in molecu-lar terms between 1.52 � 10–18 and 1.79 � 10–15 molO2 m–3 h–1. However, after converting these data tothe ‘per cell surface‘ basis by assuming the cells werespherically shaped, present calculations showed thatthe surface-specific respiration rate was independentof the cell volume �r2 � 0.00017�, with the mean of357.8 � 72.3 �95% CI� � 10–7 nl O2 m–2 h–1 �or1.6 � 10–15 mol O2 m–2 h–1�. This value may beinterpreted as the highest possible oxygen flux, the‘limit‘ observed in actively growing cells underfavourable conditions. Using the averaged oxycaloricequivalent of � 450 kJ mol–1 O2 �Gnaiger and Kemp,1990� for conversion, the ‘limit‘ is 199.7 fW m–2 interms of the heat flux. It follows from the ‘limit‘ con-cept that the energy/matter flux through a unit of bio-surface is independent of the cell size in activelygrowing cell populations, i.e., some ‘limit‘ vector fluxexists for unicellular microorganisms. This might beconsidered a promising concept in aquatic microbialecology because it can potentially serve as a ‘com-mon denominator‘ for diverse and different-scale mi-croplankton.
The maximum vector heat fluxes detected in thisstudy for the algae and the bacteria were 9.8 fW m–2
�4.9% of the ‘limit’ flux� and 5.1 fW m–2 �2.6%�,respectively �Table 2�. A possible explanation of theirrelatively small values might be that, under the rela-tively adverse conditions of hypersalinity in situ �andin the calorimetric vessel�, both the assemblages were
Figure 3. The algae-to-bacteria ratios calculated for the total water column and for the mat only.
382
far from maintaining the ‘limit’ flux. Another possi-bility is that this might be a result of extremely highconcentrations of their biomasses �and biosurfaces� inthe lake. The more intriguing result was that the ra-tios between the algal and bacterial vector heat fluxeswere relatively small � 101� and, in March, even in-verted, as well illustrated in Figure 3. This might alsoindicate the scale independence of the variable. Theecological meaning of this phenomenon has to becoupled with that of the concept of the biosurface.‘Biovolume‘ is frequently used as a term and a time-variable quantity in aquatic ecology, but the ‘biosur-face‘ is often underestimated by ecologists eventhough potentially it can have even more profoundecological meaning than ‘biovolume‘.
To illustrate the point, if it is assumed for the ma-rine bacterioplankton in the Black Sea �Chepurnovaet al. 1988� that the average cell abundance is 106
cells ml–1 and the cell volume is 0.1 m3 �sphericalcells�, then its biosurface equals 1.13 m2 m–3 or about17 m2 m–2 for coastal waters at the average depth of15 m. The total bacterial biosurface in the lake wasclose to this value �Table 3�. However, the biosurfaceconcentration �from 32.4 to 79.2 m2 m–3� was higherby almost two orders of magnitude. On the contrary,the lake bacteria demonstrated lower vector heatfluxes at 20 ºC, 1.4 to 5.1 fW m–2 �Table 2�, as op-posed to about 20 to 50 fW m–2 in marine bacteriabased on data for Sevastopol Bay �calculated fromMukhanov et al. 2003�.
Turning to the marine phytoplankton, the maxi-mum biosurface of an individual species does not ex-ceed about 0.4 m2 m–3 �Cerataulina sp.� while theestimated total value for the whole phytoplanktoncommunity is usually below 40 m2 m–3 according todata for the Northern coastal waters of the Black Sea�Minicheva and Zotov, 2003�. In contrast, the valuefor the same variable for the lake pleuston was neverlower than 127 m2 m–2 �in March�. In April, the totalbiosurface of the Cladophora population reached theenormous value of 2926 m2 per m2 of the lake sur-face, concentrated in the thin mat layer. It seemshighly likely much of the mat consisted of dead algaewhich served only as a skeleton for the living matter.As a result, the so-called ‘surplus‘ of non-functioningbiosurface could produce underestimated fluxes. Thiscould be true for the bacteria as well, but probably toa lesser degree. Undoubtedly, viability tests wouldimprove the flux estimates under such conditions, andit is even possible that the values close to the ‘limit‘flux might be detected for individual, actively grow-
ing Cladophora filaments and bacterial cells. How-ever, the averaged estimates obtained for the total cellpopulation including dead and inactive/dormant cellsmake ecological ‘sense‘ because they characterize theeffıciency of energy/matter transport through the totalbiosurface of a natural microbial community. Thesame index might be a good addition to the analysesof other community levels.
Unfortunately, ecological studies applying the mi-crocalorimetric approach are still rare �Pamatmat etal. 1981; Pamatmat 2003; Tornblom 1995; also seereview by Larsson and Gustafsson 1999�. In someways, this study only begins to explore the potentialof direct calorimetry for investigating the metabolicfluxes and energy flows in plankton and pleustoncommunities as well as aspects of their non-equilib-rium thermodynamics. There are still technical prob-lems to solve and its use is not essential for studyingthe energetics of living systems that deploy onlyaerobic catabolic processes because this can beassessed by indirect calorimetry to measure the oxy-gen uptake/evolution rate. Nevertheless, there is nosubstitute for direct calorimetry for investigating theoverall process of anaerobic/anoxygenic metabolism.In addition, no other method gives the instantaneousrate of metabolism and thus ready access to the ki-netics of it. This potential would be most suitably re-alized if the heat flow measurements could beconducted under controlled light conditions as well asin the dark. In respect of aquatic systems and, in par-ticular, the application to floating and benthic mats,calorimetric measurements should give deeper insightinto the patterns of switching between different meta-bolic pathways under highly fluctuating pH and Ehconditions. In particular, one of the more intriguingcomponents of the mat metabolism, that of anoxy-genic photosynthesis �Padan 1989; Krumbein andStal 1991� by some of the organisms, can bemeasured by photomicrocalorimetry �Petrov 1975;Johansson and Wadsö 1997� that can provide simul-taneous anaerobic and visible light experimental con-ditions. With this addition to the armoury of theecological calorimetrist, it will be possible to add vi-tal information about energy flows to that alreadyelucidated for material flows in aquatic communities.
Acknowledgements
The authors are very grateful to INTAS �EC� for theproject grants Nos. 97-30776 and 99-1390, and IN-
383
TAS Fellowship YSF 2002-361, which financed muchof this research.
References
Bratbak G. and Dundas I. 1984. Bacterial dry matter content andbiomass estimations. Appl. Environ. Microbiol. 48: 1488–1493.
Caron D.A., Goldman J.C., Andersen O.K. and Dennett M.R. 1985.Nitrogen cycling in a microflagellate food chain: II. Populationdynamics and carbon cycling. Mar. Ecol. Prog. Ser. 24: 243–254.
Caron D.A., Goldman J.C. and Fenchel T. 1990. Protozoan respi-ration and metabolism. In: Capriulo G.M. �ed.�, Ecology of Ma-rine Protozoa. Oxford University Press, Oxford, UK, pp. 307–322.
Cayol J.L., Ollivier B., Patel B.K.C., Ageron E., Grimont P.A.D.,Prensier G. and Garcia J.L. 1995. Haloanaerobium lacusroseussp. nov., an extremely halophilic fermentative bacterium fromthe sediments of a hypersaline lake. Int. J. Syst. Bacteriol. 45:790–797.
Chepurnova E.A., Shumakova G.V. and Buchakchiyskaya A.N.1988. Size spectra of marine bacterioplankton as measured onthe Synpor ultramembranes # 6 and 7. Microbiologia 57: 146–151. �in Russian�
Chepurnova E.A., Shumakova G.V. and Gutveyb L.G. 1993. Bac-terioplankton.. In: Plankton of the Black Sea �Plankton Chyor-nogo moray�. Naukova Dumka, Kiev �in Russian�, pp. 110-142.
Dodds W.K. and Gudder D.A. 1992. The ecology of Cladophora.J. Phycol. 28: 415–427.
Duboc P., Marison I. and von Stockar U. 1999. Quantitative calo-rimetry and biochemical engineering. In: Gallagher P., Hand-book of Thermal Analysis and Calorimetry, Vol. 4, Kemp RB�ed.�, From macromolecules to man. Ch. 6 pp. 267-365. Elsevier,Amsterdam, The Netherlands.
Gnaiger E. 1993. Nonequilibrium thermodynamics of energytransformations. Pure. Appl. Chem. 65: 1983–2002.
Gnaiger E. and Kemp R.B. 1990. Anaerobic metabolism in aerobicmammalian cells: information from the ratio of calorimetric heatflux and respirometric oxygen flux. Biochim. Biophys. Acta.1016: 328–338.
Haas L.W. 1982. Improved epifluorescence microscopy forobserving planktonic microorganisms. Ann. Inst. Oceanogr. 58:261–266.
Hesselink van Suchtelen F.A. 1931. Energetics and microbiologyof the soil. Arch Pflanzenbau 7: 519–541.
Hobbie J.E., Daley R.J. and Jasper S. 1977. Use of Nucleopore fil-ters for counting bacteria by fluorescence microscopy. Appl. En-viron. Microbiol. 33: 1296–1307.
Holter H. and Zeuthen E. 1949. Metabolism and reduced weight instarving Chaos chaos. CR Lab Carlsberg, Ser. Chim. 26: 277–296.
Ivanova M.B., Balushkina E.B. and Basova S.L. 1994. Structural-functional reorganization of ecosystem of the hyperhaline lake,Saki �Crimea�. Russ J. Aquat. Ecol. 3: 111–126.
Johansson P. and Wadsö I. 1997. A photomicrocalorimetric systemfor studies of plant tissue. J. Biochem. Biophys. Methods. 35:103–114.
Kemp R.B. 1998. Nonscanning Calorimetry.. In: Gallagher P.,Handbook of Thermal Analysis and Calorimetry, Vol. 1, Brown
M. �ed.� �ed.�, Principles and Practice. Ch. 14. Elsevier, Amster-dam, The Netherlands, pp. 577–675.
Kemp R.B. 2000. Heat flux and the calorimetric-respirometric ra-tio as on-line probes of the metabolism in animal cells culturedin a bioreactor. Res. Adv. Biotechnol. Bioeng. 1: 37–65.
Kemp R.B. and Guan Y.H. 1999. Microcalorimetric studies of iso-lated animal cells. In: Gallagher P. �ed.�, Handbook of ThermalAnalysis and Calorimetry, Vol. 4, Kemp R.B. �ed.�, From mac-romolecules to man. Ch. 11. Elsevier, Amsterdam, The Nether-lands, pp. 557-656.
Kirchman D.L. 1993. Statistical analysis of direct counts of micro-bial abundance. In: Kemp P.F., Sherr B.F., Sherr E.B. and ColeJ.J. �eds�, Handbook of Methods in Aquatic Microbial Ecology.Lewis Publishers, Boca Raton, Florida, USA, pp. 117–120.
Kleiber M. 1932. Body size and metabolism. Hilgardia 6: 315–353.Kleiber M. 1961. The Fire of Life: An introduction to animal en-
ergetics. John Wiley and Sons, New York, New York, USA.Krumbein W.E. and Stal L.J. 1991. The geophysiology of marine
cyanobacterial mats and biofilms. Kieler Meeresforsch Sonderh8: 137–145.
Larsson C. and Gustafsson L. 1999. Calorimetry of microbial pro-cesses.. In: Gallagher P., Handbook of Thermal Analysis andCalorimetry, Vol 4, Kemp R.B. �ed.�, From macromolecules toman. Ch 11. Elsevier, Amsterdam, The Netherlands, pp.367-404.
Matsumoto G.I. 1989. Biogeochemical study of organic substancesin Antarctic lakes. Hydrobiologia 172: 265–289.
Minicheva G.G. and Zotov A.B. 2003. Feature of dynamics of spe-cific surface of phytoplankton populations from Odessa region�the Black Sea�. Ekologia Morya 63: 46–52. �in Russian�
Mukhanov V.S., Kirin M.P. and Polikarpov I.G. 2001. The growthand grazing kinetics in heterotrophic bacteria inhabiting plank-tonic aggregates estimated by the dilution method. EkologiaMorya 55: 45–49. �in Russian�
Mukhanov V.S., Rylkova O.A., Lopukhina O.A. and Kemp R.B.2003. Productivity and thermodynamics of marine bacteri-oplankton: an inter-ecosystem comparison. Thermochim. Acta.397: 31–35.
Norland S. 1993. The relationship between biomass and volume ofbacteria. In: Kemp P.F., Sherr B.F., Sherr E.B. and Cole J.J.�eds�, Handbook of Methods in Aquatic Microbial Ecology.Lewis Publishers, Boca Raton, Florida, USA, pp. 303–308.
Núñez-Regueira L., Núñez-Fernández O., Rodríguez Añón J.A.and Proupín Castiñeiras 2002. The influence of some physico-chemical parameters on the microbial growth in soils. Thermo-chim. Acta. 394: 123–132.
Padan E. 1989. Combined molecular and physiological approachto anoxygenic photosynthesis of cyanobacteria. In: Cohen Y. andRosenberg E. �eds�, Microbial Mats: Physiological Ecology ofBenthic Microbial Communities. Kluwer, Dordrecht, Nether-lands, pp. 277-282.
Pamatmat M.M. 2003. Heat-flow measurements in aquatic ecosys-tems. J. Plankton Res. 25: 461–464.
Pamatmat M.M., Graf G., Bengtsson W. and Novak C.S. 1981.Heat production, ATP concentration and electron transport activ-ity of marine sediments. Mar. Ecol. Prog. Ser. 4: 135–143.
Peckol P. and Rivers J.S. 1995. Physiological responses of the op-portunistic macroalgae Cladophora vagabunda �L.� van denHoek and Gracilaria tikvahiae �McLachlan� to environmentaldisturbances associated with eutrophication. J. Exp. Mar. Biol.Ecol. 190: 1–16.
384

Petrov V.E. 1975. Energetics of the assimilating cell and photosyn-thesis Kazan University Press, Kazan, Russia �in Russian�.
Post F.J. and Stube J.C. 1988. A microcosm study of nitrogen uti-lization in the Great Salt Lake, Utah. In: Melack J.M. �ed.�, 3rd
Int Symp on Inland Saline Lakes, Nairobi �Kenya�, 28-31 Aug1985, Saline Lakes, 158: 89–100.
Senicheva M.I. 1990. Characteristic of phytoplankton as an objectof nutrition for mussels Mytilus galloprovincialis Lam. in the re-gion of the marine farm of Laspi Bay. Ekologia Morya 36: 7–16.�in Russian�
Shadrin N.V., Zagorodnyaya YuA, Nevrova E.L., Naidanova O.G.and Senicheva M.I. 2001. Hydroecological system of Bakal-skaya spit �Crimea�: Problems of investigation and preservation
of the unique biodiversity. Hydrobiologia 3: 168–170. �in Rus-sian�
Spink C. and Wadsö I. 1976. Calorimetry as an analytical tool inbiochemistry and biology. In: Glick D. �ed.�, Methods in Bio-chemical Analysis. Vol. 23, Wiley-Interscience, New York, NewYork, USA, pp. 1–76.
Strathmann R.R. 1967. Estimating the organic carbon content ofphytoplankton from cell volume or plasma volume. Limnol.Oceanogr. 12: 411–418.
Tornblom E. 1995. Microbial activity and biomass in aquatic sur-face sediments: A community level approach. PhD thesis, Inst.of Limnol, Uppsala University, Sweden.
385
Related Documents