arXiv:1104.1172v1 [astro-ph.HE] 6 Apr 2011 The Spin of the Supermassive Black Hole in NGC 3783 L. W. Brenneman 1 , C. S. Reynolds 2,3 , M. A. Nowak 4 , R. C. Reis 5 , M. Trippe 2 , A. C. Fabian 5 , K. Iwasawa 6 , J. C. Lee 7 , J. M. Miller 8 , R. F. Mushotzky 2,3 , K. Nandra 9 , M. Volonteri 8 ABSTRACT The Suzaku AGN Spin Survey is designed to determine the supermassive black hole spin in six nearby active galactic nuclei (AGN) via deep Suzaku stares, thereby giving us our first glimpse of the local black hole spin distribution. Here, we present an analysis of the first target to be studied under the auspices of this Key Project, the Seyfert galaxy NGC 3783. Despite complexity in the spectrum arising from a multi-component warm absorber, we detect and study relativistic reflection from the inner accretion disk. Assuming that the X-ray reflection is from the surface of a flat disk around a Kerr black hole, and that no X-ray reflection occurs within the general relativistic radius of marginal stability, we determine a lower limit on the black hole spin of a ≥ 0.88 (99% confidence). We examine the robustness of this result to the assumption of the analysis, and present a brief discussion of spin-related selection biases that might affect flux- limited samples of AGN. 1 Harvard-Smithsonian CfA, 60 Garden St. MS-67, Cambridge, MA 02138 USA 2 Dept. of Astronomy, University of Maryland, College Park, MD 20742 USA 3 Joint Space Science Institute (JSI), University of Maryland, College Park, MD 20742 USA 4 MIT Kavli Institute for Astrophysics, Cambridge, MA 02139 USA 5 Institute of Astronomy, University of Cambridge, Madingley Rd., Cambridge CB3 0HA, UK 6 Universitat de Barcelona 7 Dept. of Astronomy, Harvard University, Harvard-Smithsonian CfA, 60 Garden St. MS-6, Cambridge, MA 02138 USA 8 Dept. of Astronomy, University of Michigan, Ann Arbor, Michigan 48109 USA 9 Max-Planck-Institut fu?r Extraterrestrische Physik, Giessenbachstrasse 1, 85740 Garching, Germany

Welcome message from author
This document is posted to help you gain knowledge. Please leave a comment to let me know what you think about it! Share it to your friends and learn new things together.
Transcript

arX
iv:1
104.
1172
v1 [
astr
o-ph
.HE
] 6
Apr
201
1
The Spin of the Supermassive Black Hole in NGC 3783
L. W. Brenneman1, C. S. Reynolds2,3, M. A. Nowak4, R. C. Reis5, M. Trippe2,
A. C. Fabian5, K. Iwasawa6, J. C. Lee7, J. M. Miller8, R. F. Mushotzky2,3, K. Nandra9,
M. Volonteri8
ABSTRACT
The Suzaku AGN Spin Survey is designed to determine the supermassive black
hole spin in six nearby active galactic nuclei (AGN) via deep Suzaku stares,
thereby giving us our first glimpse of the local black hole spin distribution. Here,
we present an analysis of the first target to be studied under the auspices of this
Key Project, the Seyfert galaxy NGC 3783. Despite complexity in the spectrum
arising from a multi-component warm absorber, we detect and study relativistic
reflection from the inner accretion disk. Assuming that the X-ray reflection is
from the surface of a flat disk around a Kerr black hole, and that no X-ray
reflection occurs within the general relativistic radius of marginal stability, we
determine a lower limit on the black hole spin of a ≥ 0.88 (99% confidence).
We examine the robustness of this result to the assumption of the analysis, and
present a brief discussion of spin-related selection biases that might affect flux-
limited samples of AGN.
1Harvard-Smithsonian CfA, 60 Garden St. MS-67, Cambridge, MA 02138 USA
2Dept. of Astronomy, University of Maryland, College Park, MD 20742 USA
3Joint Space Science Institute (JSI), University of Maryland, College Park, MD 20742 USA
4MIT Kavli Institute for Astrophysics, Cambridge, MA 02139 USA
5Institute of Astronomy, University of Cambridge, Madingley Rd., Cambridge CB3 0HA, UK
6Universitat de Barcelona
7Dept. of Astronomy, Harvard University, Harvard-Smithsonian CfA, 60 Garden St. MS-6, Cambridge,
MA 02138 USA
8Dept. of Astronomy, University of Michigan, Ann Arbor, Michigan 48109 USA
9Max-Planck-Institut fu?r Extraterrestrische Physik, Giessenbachstrasse 1, 85740 Garching, Germany

– 2 –
1. Introduction
Ever since the seminal work of Penrose (1969) and Blandford & Znajek (1977), it has
been recognized that black hole spin may be an important source of energy in astrophysics.
Of particular note is the role that black hole spin may play in relativistic jets such as those
seen in radio-loud active galactic nuclei (AGN) — the magnetic extraction of the rotational
energy of a rapidly spinning black hole is the leading contender for the fundamental energy
source of such jets. Indeed, it has been suggested that the spin of the central supermassive
black hole (SMBH) is a crucial parameter in determining whether an AGN can form powerful
jets (i.e., whether the source is radio-quiet or radio-loud; Wilson & Colbert 1995), although
the accretion rate/mode must clearly have a role to play (Sikora et al. 2007).
However, the importance of black hole spin goes beyond its role as a possible power
source. The spin distribution of the SMBH population (and its dependence on SMBH
mass) encodes the black hole growth history (Moderski & Sikora 1996; Volonteri et al. 2005;
Berti & Volonteri 2008). In essence, if local SMBHs have obtained most of their mass dur-
ing prolonged prograde accretion events in a quasar phase of activity, or in major merg-
ers with similar mass SMBHs, we would expect a population of rapidly rotating SMBHs
(a > 0.6) due to the angular momentum accreted from the disks or transferred at merger
(Rezzolla et al. 2008). Here we define a ≡ cJ/GM2, where J is the angular momentum of
the black hole and M is its mass. On the other hand, if mergers with much smaller SMBHs
(Hughes & Blandford 2003) or randomly-oriented accretion events of small packets of mate-
rial (King & Pringle 2007) have been the dominant growth mechanism, most of the SMBHs
would be spinning at a much more modest rate.
To date, the cleanest probe of strong gravitational physics around SMBHs, including the
effects of black hole spin, comes from examining relativistically-broadened spectral features
that are emitted from the surface layers of the inner accretion disk in response to irradiation
by the hard X-ray source (Reynolds & Nowak 2003; Miller 2007). These spectral features
have been observed and well-characterized in both AGN (Tanaka et al. 1995; Fabian et al.
1995) and stellar-mass black hole systems (Miller et al. 2002; Reis et al. 2008). The strongest
feature in this so-called “reflection spectrum” is the fluorescent Fe Kα line (rest frame energy
of 6.4 keV); in contrast to lines from other elements, its relative abundance, high energy and
fluorescent yield make Fe Kα visible above the typical power-law continuum seen commonly
in BH systems. Extreme Doppler effects and gravitational redshifts combine to give this line
(and all other features in the reflection spectrum) a characteristic broadened and skewed
profile (Fabian et al. 1989; Laor 1991). Modern high signal-to-noise (S/N) datasets from
XMM-Newton and Suzaku, combined with the latest models of reflection from an ionized
accretion disk (e.g., Ross & Fabian 2005) and variable-spin relativistic smearing models (e.g.,

– 3 –
Brenneman & Reynolds 2006; Dauser et al. 2010), are giving us our first glimpses at the
spins of SMBHs. However, due to the high S/N required to characterize the subtle effects
of SMBH spin, interesting spin constraints have only been determined for a small handful
of AGN at present (MCG–6-30-15, Brenneman & Reynolds 2006; Fairall 9, Schmoll et al.
2009; SWIFT J2127.4+5654, Miniutti et al. 2009; 1H0707–495, Zoghbi et al. 2010; Mrk 79,
Gallo et al. 2011; Mrk 335 & NGC 7469 Patrick et al. 2010; see Table 2).
Under the auspices of the Suzaku Key Projects program, we have initiated a series
of deep quasi-continuous observations of bright, nearby AGN with the purpose of charac-
terizing relativistic disk features in the spectra and setting constraints on the SMBH spin
(Suzaku AGN Spin Survey; PI C. Reynolds). In this Paper, we present results from the first
object to be studied under this program, the Seyfert 1.5 galaxy NGC 3783 (z = 0.00973;
Theureau et al. 1998). This object possesses a high-column density and multi-component
warm absorber that has been well-studied by every spectroscopic X-ray observatory, includ-
ing a 900 ks campaign by Chandra using the High-Energy Transmission Grating Spectrometer
(HETGS; Kaspi et al. 2002; Krongold et al. 2003; Netzer et al. 2003). We show that, despite
the presence of this complex warm absorber, reflection signatures from the inner accretion
disk can be identified and characterized with sufficient accuracy to constrain SMBH spin.
We conclude that the SMBH is rapidly spinning with a > 0.93 (90% confidence). This result
is shown to be robust to the exclusion of the complex, soft region of the X-ray spectrum as
well as to uncertainties in the XIS/PIN cross-normalization.
This paper is organized as follows. Section 2 discusses the Suzaku observation of
NGC 3783 and the basic reduction of the data. Section 3 then presents our modeling of the
0.7 − 45 keV time-averaged spectrum of NGC 3783, including our newly-derived constraints
on the SMBH spin. Section 4 summarizes our conclusions on NGC 3783 and addresses the
role of spin-dependent selection biases in AGN samples.
2. Observations and Data Reduction
NGC 3783 was observed by Suzaku quasi-continuously for the period 10–15 July 2009,
with the source placed in the Hard X-ray Detector (HXD) nominal aimpoint. After eliminat-
ing Earth occultations, South Atlantic Anomaly (SAA) passages, and other high background
periods, the observation contains 210 ks of “good” on-source exposure. The XIS data (XIS 0,
XIS 1 and XIS 3; XIS 2 has been inoperable since November 2006) were reprocessed using the
xispi script in accordance with the Suzaku ABC Guide1 along with the latest version of the
1http://heasarc.gsfc.nasa.gov/docs/suzaku/analysis/abc/

– 4 –
CALDB (as of 29 March, 2010). XIS spectra and light curves were then produced according
to the procedure outlined in the ABC Guide. For the XIS spectra, we combined data from the
front-illuminated (FI) detectors XIS 0+3 data using the addascaspec script in order to in-
crease S/N. The XIS spectra, responses and backgrounds were then rebinned to 512 spectral
channels from the original 4096 in order to speed up spectral model fitting without compro-
mising the resolution of the detectors. Finally, the XIS spectra were grouped to a minimum of
25 counts per bin in order to facilitate robust χ2 fitting. The merged, background-subtracted,
time-averaged FI spectrum has a net count rate of 4.960±0.002 cts s−1 for a total of 1.04×10⁶
counts. The total number of 2 − 10 keV counts is 6.26 × 10⁵. The total XIS 1 count rate is
3.043 ± 0.004 cts s−1 for a total of 6.40 × 10⁵, or 3.14 × 10⁵ when restricting to 2 − 10 keV.
For all of the fitting presented in this paper, we allow for a global flux cross-normalization
error between the FI and XIS 1 spectra. The XIS 1/FI cross-normalization is allowed to be
a free parameter, and is found to be approximately 1.03.
The HXD/PIN instrument detected NGC 3783, though the GSO did not. Data from
PIN were again reduced as per the Suzaku ABC Guide. For background subtraction, we used
the “tuned” non X-ray background (NXB) event file for July 2009 from the Suzaku CALDB,
along with the appropriate response file and flat field file for epoch 5 data. The NXB
background contributed a count rate of 0.2165±0.0004 cts s−1 to the total X-ray background
from 16 − 45 keV. We modeled the cosmic X-ray background (CXB) contribution as per
the ABC Guide, simulating its spectrum in XSPEC (Arnaud 1996). The simulated CXB
spectrum contributed a count rate of 0.0237 ± 0.0002 cts s−1 to the total X-ray background
from 16− 45 keV. The NXB and CXB files were combined to form a single PIN background
spectrum. In comparison, the PIN data had a count rate of 0.4561 ± 0.0027 cts s−1 over the
same energy range, roughly twice that of the total background.
Because the PIN data only contain 256 spectral channels (vs. the 4096 channels in
the unbinned XIS data), rebinning to 25 counts per bin was not necessary in order to
facilitate χ2 fitting. Rather, we adopted a 5 counts/bin minimum in each of our spectral
bins, which limited our energy range to 16−45 keV. After reduction, filtering and background
subtraction, the PIN spectrum had a net 16− 45 keV count rate of 0.360± 0.002 cts s−1. We
also added 3% systematic errors to the PIN data to account for the uncertainty in the non-
X-ray background data supplied by the Suzaku calibration team. For most of the spectral
fitting presented in this paper, we assume a PIN/XIS-FI cross-normalization factor of 1.18
as per the Suzaku memo 2008-062. However, for the final fits used to constrain the black
hole spin in §3.4, we investigate the effect of allowing this cross-normalization to be a free
2http://heasarc.gsfc.nasa.gov/docs/suzaku/analysis/watchout.html

– 5 –
0.6
0.8
11.
2
XIS
Sof
t
NGC 3783
34
5
XIS
Har
d
0 105 2×10⁵ 3×10⁵
0.3
0.35
0.4
PIN
Time (s)
Fig. 1.— Co-added and background subtracted XIS light curves in the soft (0.3− 1 keV) and hard
(2− 10 keV) bands, together with the background subtracted PIN (16− 45 keV) light curve. These
light curves are shown with 5000 s bins.
parameter.
XIS light curves (both hard and soft band) as well as PIN light curves are shown in
Fig. 1. In the soft band (0.3−1 keV), the source is observed to undergo variability by a factor
of almost two. Most of the large amplitude variability occurs on timescales of 50 − 100 ks,
although there are occasional sharp flares/dips that occur much more rapidly. Also note-
worthy is that the amplitude of variability decreases as one considers higher-energy bands,
suggesting “pivoting” of the spectrum about some energy above the Suzaku/PIN band. The
detailed nature of this spectral variability will be the subject of another publication (Reis et
al. , in preparation). For the remainder of this paper, we examine the high S/N spectrum
from the time-averaged dataset. We restrict our energy range to 0.7 − 10 keV in the XIS
data, ignoring energies below 0.7 keV and from 1.5 − 2.5 keV to avoid areas of significant

– 6 –
105 20
11.
21.
4
data
/mod
el
Energy (keV)
(a)
4 5 6 7 81
1.2
1.4
data
/mod
el
Energy (keV)
(b)
50.9
0.95
11.
051.
1
data
/mod
el
Energy (keV)
(c)
Fig. 2.— Left panel: Simple power-law fit to the 3.5−45 keV XIS-FI+PIN spectrum. Middle panel:
Zoom-in on the 4–8 keV region of the simple power-law fit. Note the probable “Compton shoulder”
on the immediate low-energy side of the strong 6.4 keV emission line. Right panel: Residuals
remaining when the broad iron line component is removed from a simple phenomenological fit to
the 3.5− 45 keV data (see §3.1). In all panels the black points correspond to XIS 0+3 data, red to
XIS 1 data and blue to PIN data. The green line represents a data-to-model ratio of unity.
deviation between the three detectors, i.e., regions of known calibration uncertainty.
3. Analysis of the time-averaged Suzaku spectrum
3.1. A First Look at the Hard-band Spectrum
It is instructive to begin by examining the hard-band (3.5−45 keV) XIS+PIN spectrum.
A simple power-law fit to this band reveals significant spectral complexity (Fig. 2a,b). A
narrow Kα fluorescence line of cold iron (6.4 keV) dominates; structure redward of this line
indicates a possible Compton shoulder as well as an extended tail reaching down to ∼ 4 keV.
Both the narrow iron line and the broad red wing likely originate from X-ray reflection
and, hence, the convex spectrum between 8− 40 keV is readily interpreted as the associated
Compton reflection hump. Structure above the 6.4 keV line indicates a strong absorption
feature at ∼ 6.6 keV and/or an emission line at ∼ 7 keV (likely corresponding to a blend of
the Kβ line of cold iron and the Lα line of Fexxvi).
Guided by these identifications, we construct an heuristic model of the hard spectrum
consisting of a power-law continuum, a narrow Fexxvi emission line (modeled as a Gaus-
sian line centered at 6.97 keV with σ = 10 eV), reflection from distant, low-velocity, cold
– 7 –
matter (described by the pexmon model3), and a relativistically broadened cold iron Kα line
(described by the laor model; Laor 1991). This model produces an excellent fit to the data
(χ2/ν = 573/544 (1.05)) with the following parameters: photon index Γ = 1.68+0.01−0.01, reflec-
tion fraction R = 0.87+0.02−0.06, emission line equivalent widths WFeXXVI = 28+4
−5 eV, Wbroad =
263+23−23 eV, inner edge of line emitting disk rin = 3.0+0.1
−0.8 rg, index of line emissivity across disk
q = 3.31+0.06−0.09, and disk inclination i < 9. If we replace the pexmon model with a pexrav and
three separate Gaussian lines for narrow Fe Kα (6.4 keV, σ = 0.015 keV), Fe Kβ (7.06 keV,
σ = 0.015 keV) and Compton shoulder (6.25 keV, σ = 0.1 keV), their equivalent widths are
WKα = 98+5−5 eV, WKβ ≤ 8 eV, and WCS = 22+8
−6 eV, respectively. We note that, in this fit, the
intrinsic widths of the iron lines were taken from their Chandra/HETG values (Yaqoob et al.
2005). Substituting the individual Gaussian lines and pexrav component for the pexmon
model results in a modest change in the global goodness-of-fit (∆χ2/∆ν = −32/− 3), likely
owing to the free normalizations of the emission lines (they are set at fixed ratios within
pexmon). No statistically significant change is seen in the other model parameters.
For illustrative purposes only, Fig. 2c shows the residuals that remain when the broad
iron line is removed from this spectral model, and the remaining model parameters are
re-fit. An obvious broad line remains. However, there are two reasons why this cannot
be interpreted as the “the broad line profile” for this object. Firstly, NGC 3783 has a
well-known, high-column density warm absorber that, while principally affecting the soft
spectrum, can also introduce subtle spectral curvature up to 10 keV or more. Secondly, the
broadened iron line is just the tip of the iceberg; especially when the accretion disk is ionized,
the rest of the reflection spectrum has a sub-dominant but significant contribution that must
be considered. The statistically unlikely value of the disk inclination derived from the simple
fit (i < 9) is a signal of these issues. For these reasons, we are forced into global modeling
of the full 0.7 − 45 keV spectrum.
3The pexmon model (Nandra et al. 2007) is a modification of the commonly used pexrav model
(Magdziarz & Zdziarski 1995) which, in addition to the Compton backscattered reflection continuum, also
models the Kα and Kβ emission lines of iron, the Compton shoulder of the iron Kα line, and the Kα line of
nickel. The lines are included at the appropriate normalization for the assumed inclination, abundance, and
reflection fraction. Hence, pexmon is superior to the usual “pexrav+gaussian” model since the strengths
of the Compton reflection continuum and fluorescent lines are forced to be self-consistent. Assumptions do
need to be made, however, when employing this model. In particular, we fix the inclination parameter of
this component to be i = 60 and assume cosmic abundances.

– 8 –
3.2. Guidance from the long Chandra/HETG observation
It is well known that NGC 3783 possesses a high-column density warm absorber (WA;
e.g., Reynolds 1997); this is the greatest complexity we face when modeling the X-ray spec-
trum of this source. For guidance, we turn to the long (900 ks) observation of NGC 3783
with the HETGS on Chandra. Extensive analyses of the HETG data have been published
(Kaspi et al. 2002; Krongold et al. 2003; Netzer et al. 2003); however, to retain consistency
and utilize the latest calibrations, we have retrieved these data from the tgcat database4
and have reanalyzed the 1st-order MEG+HEG spectra.
In more detail, we obtain the ChandraHETG-data for NGC 3783 from tgcat for each
of the OBSIDs corresponding to the 900 ks campaign and, coadd together spectra for a given
order of a given grating. As a result, we obtain four spectral files corresponding to the time-
average ±1st order spectrum from each of the HEG and the MEG. These were binned to a
minimum of 15 photons per spectral bin in order to validate the use of χ2 techniques while
still maintaining spectral resolution. We then jointly analyzed these spectra, noticing the
0.5–7 keV range in the MEG data and the 1–7.5 keV range in the HEG data. We permitted
the overall cross-normalization between these four spectra to be free parameters; in all cases,
the best-fitting cross-normalization is within 5% of unity.
Fitting these data with a power-law modified by the effects of Galactic absorption
(NH = 9.91×1020 cm−2 ; described using the phabs model of XSPEC) results in a very poor
fit with χ2/ν = 58962/13112 (4.50). The residuals suggest a soft excess component, soft
X-ray absorption by a WA, and a prominent fluorescent iron Kα line a 6.4 keV. The effect
of the WA is modeled using the XSTAR code (Kallman & Bautista 2001); for an absorber
of a given column density NH and ionization parameter ξ, XSTAR is used to compute the
absorption imprinted on a power-law X-ray spectrum. We compute a grid of XSTAR models,
logarithmically sampling a range of column densities in the range NH : 1020−1024 cm−2 and
a range of ionization parameters in the range ξ : 1 − 104 erg cm s−1 , for use in spectral
fitting. In the construction of the WA grids it is assumed that elemental abundances are
fixed to cosmic values, and that the turbulent velocity of the WA is 200 km s−1 . Dramatic
improvements in the goodness-of-fit are found by the inclusion in the model of three zones
of WA. To begin with, each WA component is included assuming that the absorbing gas is
at rest with respect to NGC 3783; the improvement in the fit upon the addition of each WA
component was ∆χ2 = −26316,−3096 and −2490. The inclusion of a fourth zone led to a
much smaller improvement in the fit and hence was deemed inappropriate. The residuals
from the 3-WA fit do indicate a soft excess. Following Krongold et al. (2003), we model the
4http://tgcat.mit.edu/

– 9 –
soft excess with a blackbody component (this is intended to be a phenomenological, not a
physical, description of the soft excess; see discussion in §3.3) resulting in an improvement
in the fit of ∆χ2/∆ν = −480/− 2 (i.e., χ2/ν = 26582/13104 (2.03)).
While providing a decent fit to the global spectrum, the model thus described leaves
prominent unmodeled emission and absorption lines, the most prominent of which is the
iron fluorescent emission line at 6.4 keV. Fitting the iron line with a simple Gaussian model
improves the goodness-of-fit by ∆χ2/∆ν = −593/ − 3, with a line energy E = 6.398 ±
0.002 keV (confirming the identification of cold iron-Kα), FWHM= 2000 ± 300 km s−1 and
equivalent width WKα = 88±6 eV. However, since we believe that this component originates
from reflection, we shall henceforth model it using pexmon; replacing the simple Gaussian
with the pexmon model convolved with a Gaussian velocity profile (with FWHM= 1800 ±
300 km s−1 ) results in a slightly better fit (∆χ2 = −18). At the soft end of the spectrum,
the Kα emission triplet of Ovii (at 0.574 keV, 0.569 keV, 0.561 keV) as well as the Kα
emission line of Oviii (at 0.654 keV) are clearly visible. Modeling these as Gaussian lines at
the redshift of NGC 3783 with common velocity width yields a further improvement in the
goodness of fit (∆χ2 = −218) with best-fitting FWHM= 700 ± 150 km s−1 and equivalent
widths W0.574 = 26 ± 6 eV, W0.569 = 14 ± 6 eV, W0.561 = 47 ± 9 eV, and W0.654 = 23 ± 5 eV.
It is well known that the WA in this and many other objects corresponds to outflowing
gas. Relaxing the constraint that the WA zones are at the systemic redshift of NGC 3783
yields a large improvement in the fit (∆χ2/∆ν = 4247/ − 3; χ2/ν = 21532/13094 (1.64)),
with implied line-of-sight outflow velocities in the 500− 1000 km s−1 range. These velocities
as well as the other parameters defining the best-fit model for the HETG data are listed
in Table 1. The spectral model described in this section (power-law continuum, three-zone
WA, blackbody soft excess, reflection from distant neutral material, and emission lines from
Ovii and Oviii) describes the vast majority of spectral features seen in the HETG data
(see Fig. 3).
3.3. Global Modeling of the 0.7–45 keV Spectrum
To extract the maximal information from the full-band (0.7–45 keV) Suzaku spectrum
of NGC 3783, we must compare the data to a global spectral model which is as physically
self-consistent and realistic as possible. In constructing this global model, we draw guidance
from our heuristic analysis of the hard-band spectrum (§3.1) as well as the results from
the Chandra/HETG (§3.2). The primary continuum emission is taken to be a power-law
(photon index Γ) with a soft excess which we describe as a blackbody (temperature T ).
X-ray reflection of this continuum from cold, distant material (possibly associated with

– 10 –
0.5 0.6 0.7 0.8 0.9 1
00.
050.
10.
15
cts/
s/ke
V
Energy (keV)
1 1.2 1.4 1.6 1.8 2
00.
10.
20.
3
cts/
s/ke
V
Energy (keV)
2 2.5 3 3.5 4
00.
020.
040.
060.
08
cts/
s/ke
V
Energy (keV)
4 4.5 5 5.5 6 6.5 7 7.5 8
00.
010.
02
cts/
s/ke
V
Energy (keV)
Fig. 3.— Folded Chandra/HETG spectrum and best fitting model as a function of observed energy.
As described in the text (§3.2), the model is fitted simultaneously to the ±1 MEG (0.5–7 keV) and
HEG (1–7.5 keV) data. However, for clarity, we only show here the −1-order MEG data (black;
first three panels) and the −1-order HEG data (blue; bottom panel).

– 11 –
105 20
0.95
11.
051.
1
data
/mod
el
Energy (keV)105
0.95
11.
05
data
/mod
el
Energy (keV)
Fig. 4.— Results of fitting the XIS+PIN spectrum with a model that includes the warm absorbers,
distant reflection and scattering/leaked soft component but not the relativistic ionized accretion
disk. While the fitting is performed on the 0.7–45 keV spectrum, we show for clarity only the
residuals above 3 keV. Left: Strong residuals indicative of a broad iron line and Compton reflection
hump are clearly visible. This motivates the inclusion of a relativistic disk component into the
spectral model. The XIS 0+3 data are shown in black and XIS 1 data are in red, while the
HXD/PIN data are in blue. The solid green line represents a data-to-model ratio of unity. Right:
Zoom-in on the Fe K line region.
the dusty/molecular torus of unified Seyfert schemes) is described using the pexmon model
(see §3.1). As discussed in §3.1, the inclination of the pexmon is fixed at i = 60 and the
abundances are fixed to be cosmic. These emission components are then absorbed by a three-
zone WA modeled using the XSTAR tables described in §3.2; the column density NW and
ionization parameter ξ of each zone is taken to be a free parameter rather than being fixed to
the HETG value. Since the Suzaku/XIS detectors do not have the spectral resolution capable
of constraining the outflow velocities of the various WA zones, we have elected to hold the
redshifts of these components fixed at the cosmological value for NGC 3783. Statistically
indistinguishable results are obtained if we, instead, fix the outflow velocities to the HETG-
derived values. For completeness, we also allow for some fraction fsc of the continuum to be
scattered around (or leak through) the WAs, i.e., our model allows for “partial covering”.
Fitting this model to the 0.7–45 keV Suzaku data results in a poor fit (χ2/ν = 1206/679 (1.78))
and strong residuals which indicate the presence of the broad iron line as well as addi-

– 12 –
1 102 5 20
0.9
11.
1
data
/mod
el
Energy (keV)1 102 5 20
10−
410
−3
0.01
0.1
νFν
Energy (keV)
Fig. 5.— Global modeling of the 0.7 − 45 keV XIS-FI+PIN data. The left panel shows the
resulting residuals from fitting the model (including the relativistic accretion disk) discussed in
§3.3. Data point colors are as in Fig. 2. The right panel shows the best-fitting model color coded
as follows: (a) green line, continuum power-law emission; (b) dark blue line, cold and ionized iron
line emission from distant matter; (c) red line, soft excess modeled as blackbody; (d) magenta line,
significant emission that scatters around or leaks through the warm absorber; (e) light blue line,
relativistically-smeared disk reflection, (f) thick black line, total summed model spectrum. Warm
absorption affects all components apart from (d).
tional reflection beyond that associated with the narrow iron line (Fig. 4). This leads us
to include relativistically smeared reflection from an ionized accretion disk into the spectral
model; operationally, we use the ionized reflection model reflionx (Ross & Fabian 2005)
convolved with the variable spin relativistic smearing model relconv (Dauser et al. 2010).
The relconv model is a further evolution of the kerrconv model of Brenneman & Reynolds
(2006), employing faster and more accurate line-integration schemes and allowing black
hole spin to be fit as a free parameter for prograde, non-spinning and retrograde spins
(a ∈ [−0.998, 0.998]). While the fit achieved with this blurred reflection model is not sta-
tistically ideal (χ2/ν = 917/664 (1.38)), there are no broad-band residuals (Fig. 5a), and
much of the contribution to the excess χ2 originates from fine details of the WA-dominated
region below 1.5 keV. The model is shown in Fig. 5b, and the best-fitting parameter values
are shown in Table 1.
The parameters defining the best-fitting model for the 0.7 − 45 keV data are shown in

– 13 –
Table 1 along with their 90% confidence ranges. Under the assumption that we can identify
the low-, medium-, and high-ionization components seen in the 2001-HETG observation
with those seen in out 2009-Suzaku data, we see that both the column density and the
ionization state of the low-ionization absorber have increased somewhat (∆ log ξ ≈ 0.28,
∆NWA ≈ 3 × 1021 cm−2 ). In contrast, the medium- and high-ionization absorbers have
slightly dropped in ionization parameter. Given that these different zones are likely at very
different distances from the central engine with very different plasma densities, they will
possess very different recombination/photoionization timescales and hence will respond to
changes in the ionization flux on different timescales. Thus, it is not surprising that we see
a mixture of increasing and decreasing ionization states in the various WA zones.
We also note a change in the both the temperature and normalization of the blackbody
component between the 2001-HETG and 2009-Suzaku data. This merits some discussion.
The blackbody component used to phenomenologically parameterize the soft excess was
first employed by Krongold et al. (2003), who found kT = 0.10 ± 0.03 keV and Abb =
2.0 ± 0.7 × 10⁻⁴, where the normalization is in units of L39/D210 (L39 is luminosity of the
component in units of 1039 erg s−1 and D10 is distance to the source in units of 10 kpc). Our
analysis of the same HETG data confirms the Krongold et al. (2003) result. By contrast, our
analysis of the Suzaku/XIS+PIN spectra finds a lower temperature (kT = 0.060+3−4 keV) and
a normalization that is almost two orders of magnitude greater (Abb = 8.4+6.0−2.7 × 10⁻³). We
stress that neither the use of a blackbody to model the soft excess nor the precise change in
the parameters of the blackbody should be interpreted literally. In particular, the significant
change in the normalization of this component is misleading — the lower energy cutoffs in
both the HETG analysis (0.5 keV) and the XIS analysis (0.7 keV) are much higher than the
peak of this blackbody component and, thus, only the Wien tail of this component is playing
any role in the spectral fitting. Given this fact, even a modest drop in the temperature must
be compensated for by a large increase in normalization in order to have a comparable
contribution in the observed energy band. While the physical nature of the soft excess is
of intrinsic interest, it is beyond the scope of this paper. We have verified that different
treatments of the soft excess (replacing the blackbody spectrum with bremsstrahlung or a
steep power-law component) do not affect the interpretation of the spectrum above 2 keV.
The principal focus of this work is the signature of the relativistic accretion disk. Our
global fit finds reflection from a rather low-ionization accretion disk (ξ < 9 erg cm s−1 ) ex-
tending down to the innermost stable circular orbit (ISCO) of a rapidly rotating black hole.
The emissivity/irradiation profile defining the reflection spectrum, modeled as a broken
power-law, is found to have an inner power-law index of q1 = 5.2+0.7−0.8 breaking to q2 = 2.9±0.2
at a radius of rbr = 5.4+1.9−0.9rg. The iron abundance of the disk has been constrained to lie
between 2.8−4.6 times solar. To probe the robustness of this constraint we have refitted the

– 14 –
data in three different ways, each allowing for slight differences in the way the iron abundance
was handled in our model: (1) fixing Fe/solar of the distant reflector (pexmon) to that of the
inner disk reflection (reflionx), with both values frozen at Fe/solar= 1; (2) allowing these
linked abundances allowed to vary freely; and (3) allowing both abundances to vary freely
and independently. Compared with the global best-fit, scenario (1) resulted in a worsening
of goodness-of-fit by ∆χ2 = 91, scenario (2) resulted in a marginal decrease in goodness-of-fit
by ∆χ2 = 7 and scenario (3) yielded no change in the goodness-of-fit. In summary, the high
iron abundance of the reflionx is statistically preferred to the solar value. Because the iron
abundance of the distant reflector could not be constrained independently of the relativistic
reflector, the pexmon and reflionx iron abundances have been linked in our best model fit.
To gauge the importance of the (complex) soft spectrum on our global fit, we have also
conducted a restricted hard-band (3–45 keV) fit. Since a hard-band fit cannot constrain the
parameters of the WA or soft excess, these parameters are constrained to lie within their 90%
confidence ranges as derived from the 0.7–45 keV analysis. To be most conservative, we also
relax the constraint on the XIS/PIN cross-normalization, allowing it to be a free parameter.
The resulting fit is listed in the last column of Table 1. For this fit χ2/ν = 499/527 (0.95),
a great improvement over the 0.7 − 45 keV fit, and confirmation that the small residuals
below ∼ 1.5 keV are the primary contribution to the large reduced χ2 of the full spectral
fit. While the parameter values are equivalent to those of the 0.7 − 45 keV fit within errors,
the uncertainties on the parameters are larger when only the hard spectrum is considered.
This is especially true for the inner disk emissivity and break radius of the relconv model,
which exhibit a strong degeneracy without the soft spectrum data. Figure 6 (left) shows
the confidence contours on the (q1, q2)-plane for this hard band fit; we see that q2 is well-
constrained whereas the constraints on q1 are clearly worse. Fixing the XIS/PIN cross-
normalization at the nominal value of 1.18 tightens the constraints but still leaves a significant
degeneracy in q1 (Fig. 6). The insensitivity of the fit to q1 is follows from the extreme
gravitational redshifting experienced by the emission from the innermost disk.
Using the best-fitting 0.7 − 45 keV spectral model with the XIS 0 normalization, the
2− 10 keV observed-frame flux of NGC 3783 is F2−10 = 6.04× 10⁻¹¹ erg cm−2 s−1 . Adopting
a standard cosmological model (H0 = 71 km s−1 Mpc−1, ΩM = 0.3, ΩΛ = 0.7), this implies a
rest-frame luminosity of L2−10 = 1.26×1043 erg s−1 . The hard X-ray band yields a 16−45 keV
flux of F16−45 = 1.07 × 10⁻¹⁰ erg cm−2 s−1 for a rest-frame luminosity of L16−45 = 2.24 ×
1043 erg s−1 .
– 15 –
Model component Parameter HETG Suzaku (0.7 − 45 keV) Suzaku (> 3 keV)
Galactic column NH 9.91(f) 9.91(f) 9.91(f)
WAbs1 NWA 51.7+0.8−0.7 90+10
−14 90(f)
log ξ 1.15+0.01−0.01 1.47+0.03
−0.03 1.47(f)
∆z −(1.4+0.07−0.07) × 10−3 0(f) 0(f)
WAbs2 NWA 127+1.8−2.0 159+31
−21 159(f)
log ξ 2.08+0.01−0.01 1.93+0.02
−0.01 1.93(f)
∆z −(1.0+0.3−0.3) × 10−3 0(f) 0(f)
WAbs3 NWA 268+10−12 168+48
−42 168(f)
log ξ 2.83+0.01−0.01 2.53+0.05
−0.02 2.53(f)
∆z −(3.4+0.4−0.4) × 10−4 0(f) 0(f)
PL Γ 1.62+0.01−0.01 1.81+0.10
−0.05 1.84+0.06−0.05
Apl 1.49 × 10⁻² 1.46+0.09−0.04 × 10⁻² 1.52+0.10
−0.08 × 10⁻²
BB kT (eV) 107 ± 3 60+3−4 60(f)
Abb 1.4 ± 0.1 × 10⁻⁴ 8.45+5.98−2.67 × 10⁻³ 8.45 × 10⁻³(f)
Scattered fraction fsc (2.3+0.4−1.0) × 10−2 0.17+0.02
−0.02 0.17(f)
Cold Reflection Rcold 0.49+0.04−0.03 0.46+0.12
−0.07 0.62+0.31−0.20
PL cutoff (keV) – 200(f) 200(f)
GAU line E (keV) – 6.97(f) 6.97(f)
σ (keV) – 0.0154(f) 0.0154(f)
WFeXXVI (eV) – 22+5−5 18+6
−5
AFeXXVI – 1.28+0.29−0.31 × 10⁻⁵ 1.11+0.39
−0.31 × 10⁻⁵
Accretion disk ZFe – 3.7+0.9−0.9 2.2+2.4
−0.9
ξ – < 8 < 67
Rrel – 0.21+1.56−0.07 0.23+14.66
−0.03
i – 22+3−8 19+6−14
rin – ISCO(f) ISCO(f)
q1 – 5.2+0.7−0.8 4.7+1.9
−1.2
rbr – 5.4+1.9−0.9 6.0+16.9
−1.9
q2 – 2.9+0.2−0.2 2.8+0.3
−0.5
rout – 400(f) 400(f)
PIN/XIS norm – 1.18(f) 1.15+0.07−0.07
SMBH spin a – ≥ 0.98 0.98+0.02−0.34
χ2/ν 21532/13094 (1.64) 917/664 (1.38) 499/527 (0.95)
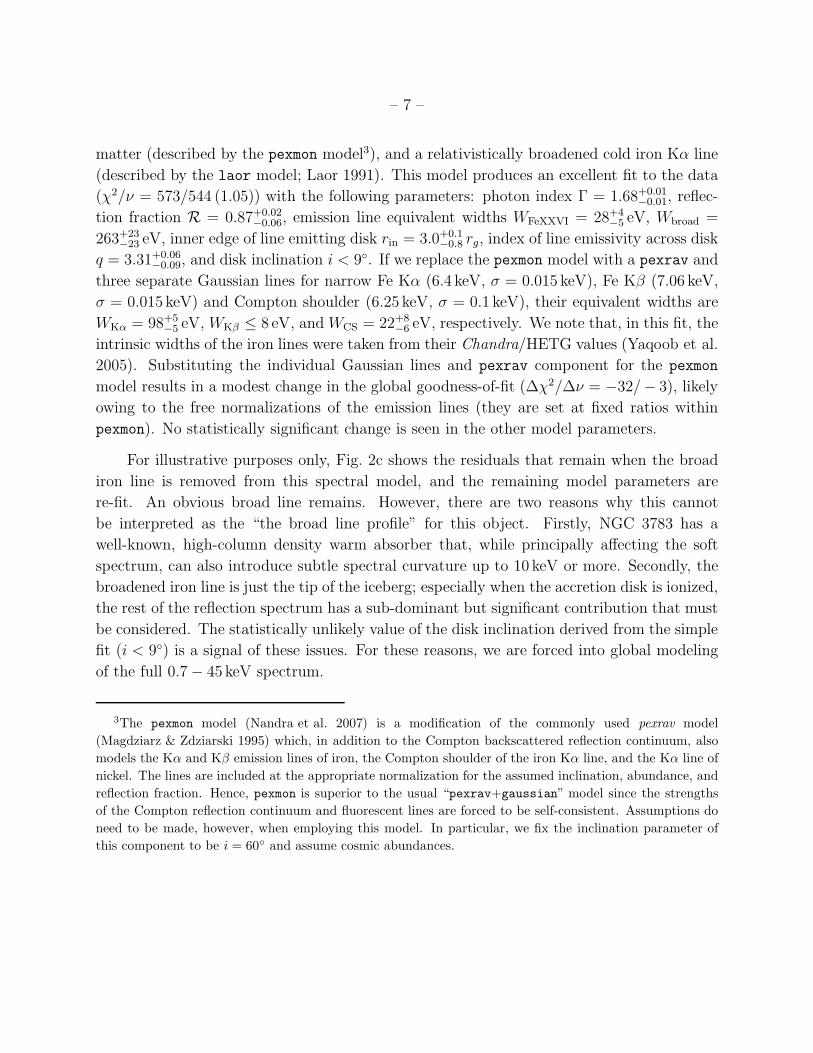
Table 1: Spectral fit parameters. All errors are quoted at the 90% confidence level for one interesting
parameter (∆χ2 = 2.7). Parameters marked with an “(f)” had their values fixed during the fit.
Units of normalization are in ph cm−2 s−1 , column density is in units of 1020 cm−2 , ionization
parameter is in erg cm s−1 , iron abundance is relative to solar (linked between the reflionx and
pexmon reflection components), inclination is in degrees, radii are in rg, and spin parameter is
dimensionless, but is defined as a ≡ cJ/GM2. See §3 for details.

– 16 –
3.4. The Spin of the Black Hole
Our fiducial spectral model discussed above yields a spin constraint of a ≥ 0.98 (90%
confidence), or a ≥ 0.88 (99% confidence). However, given the subtle nature of the spin
measurements, it is useful to address the systematic issues that may be introduced by the
modeling and analysis techniques.
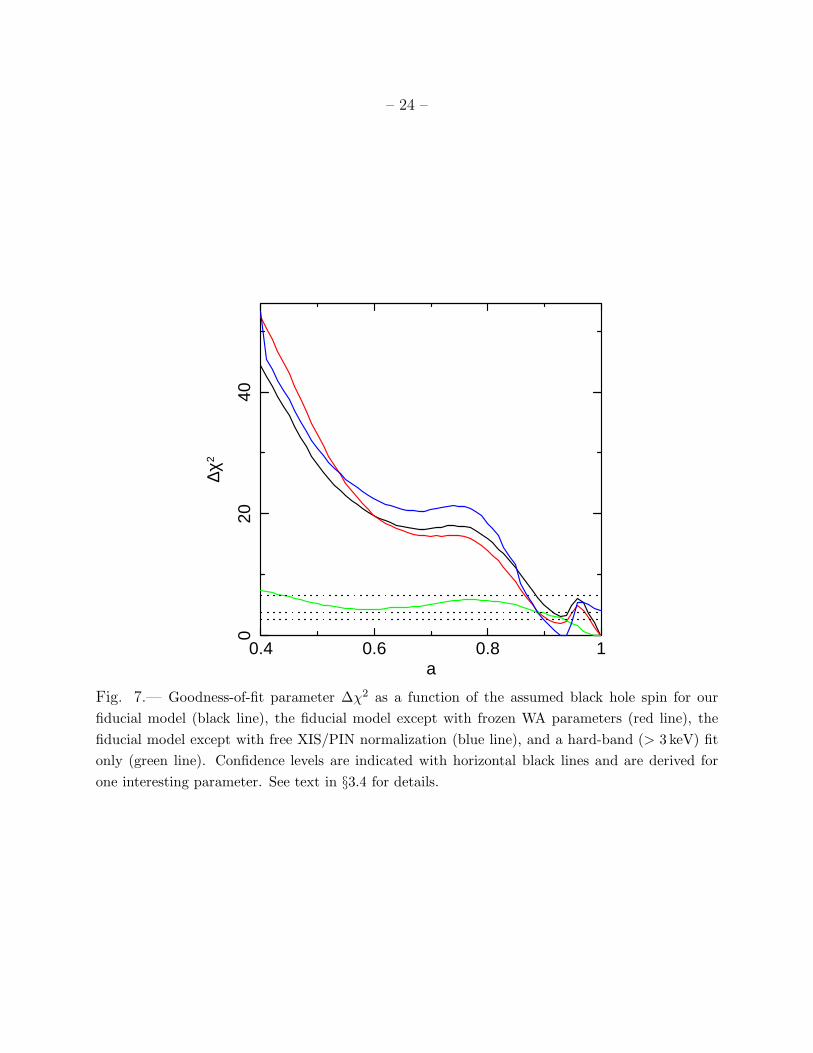
We can assess the role of different analysis-related assumptions on the derived spin by
comparing the variation of χ2 with a. Figure 7 (black line) shows ∆χ2(a) = χ2(a)−χ2best−fit
from our fiducial analysis that underlies the constraint just quoted. It is interesting to note
the non-monotonic nature of the χ2-space above a ∼ 0.75. We consider a few variants from
this fiducial analysis in order to probe the sensitivity of the spin measurement. An important
issue is the extent to which the warm absorber parameters are trading-off with the derived
black hole spin. Thus, we repeat the analysis with the warm absorber parameters (column
densities and ionization parameters for all three zones) fixed at their best-fit values from the
fiducial model. The resulting spin constraints are shown in Fig. 7 (a ≥ 0.98; red line) and
are very similar to the fiducial model, indicating little or no degeneracy between spin and
the warm absorber parameters.
Secondly, to the extent that the strength of the Compton reflection hump is important,
we may be concerned about the effect of cross-calibration errors in the flux normalization
between the XIS and the PIN spectra. Thus, we repeat the spectral analysis, leaving the
cross-normalization factor as a free parameter. The best-fit value is slightly smaller than our
fiducial value (1.15 vs. 1.18), but the improvement in the goodness-of-fit is only marginally
significant (∆χ2 = 6 for one additional degree of freedom). The spin is constrained to be
slightly smaller than that of the fiducial model (to 90% confidence, a = 0.92 − 0.95; Fig. 7,
blue line). While a possible uncertainty in the PIN cross-normalization does introduce a
systematic error of ∼ 3% into our spin measurement, however, we note that the Suzaku
CALDB constrains the cross-normalization to 1.181 ± 0.016. Our fitted value for the cross-
normalization is outside this range.
Lastly, we may be concerned that the spin fits are being driven by the contribution of
the ionized disk to the high-S/N by highly-complex region of the spectrum below 1.5 keV.
Thus, we have repeated our analysis including data only above 3 keV. Here, too, we allow
the XIS/PIN cross-normalization to be a free parameter. Given the lack of data at soft
energies to constrain them, the WA, BB and scattered fraction components were frozen to
their best-fitting values for the full-band, free cross-normalization case (which is, within
errors, identical to the WA parameters for the fiducial model). Yet again, the best-fit spin
parameter is similar to that of the fiducial model (a ≥ 0.95; Fig. 7, green line). This indicates
that the fitted spin value is indeed driven by the Fe K band.
– 17 –
4. Discussion and Conclusions
The X-ray spectrum of NGC 3783 is complicated; in addition to the effects of a multi-
zone warm absorber, there are suggestions that some fraction (17%) of the primary X-
ray emission can scatter around or leak through the warm absorber. However, despite
this complexity, the high-S/N and broad bandpass of Suzaku allows us to robustly detect
and study the relativistically-smeared X-ray reflection spectrum from the surface of the
inner accretion disk. Assuming that the region within the general relativistic radius of
marginal stability does not contribute to the reflection spectrum (Reynolds & Fabian 2008)
we determine a lower limit of a ≥ 0.98 (90% confidence) to the dimensionless spin parameter
of the black hole. Even at the 99% confidence level, we can constrain the spin to be a ≥ 0.88.
Relaxing the assumed XIS/PIN cross-normalization or neglecting the soft-band data (but
then freezing the WA parameters) allows the model to find a slightly better fit and makes
the constraints slightly lower (a = 0.92 − 0.95, a ≥ 0.95 at 90% confidence, respectively;
a ≥ 0.88, a ≥ 0.90 at 99% confidence, respectively).
Including this result, four out of eight of the AGN with reliable spin measurements
may have spins greater than a = 0.8 (see Table 2). Spin measurements for more sources
are required before we can draw any conclusions about the spin distribution function, but
here we note that there are potentially important selection effects biasing any flux-limited
sample towards high spin values. For standard accretion models, the efficiency of black
hole accretion increases as the spin of the black hole increases. So, all else being equal,
an accreting, rapidly spinning black hole will be more luminous than an accreting, slowing
spinning black hole and hence will be over-represented in flux-limited samples.
We illustrate this effect by calculating the selection bias given some very simple as-
sumptions. Suppose that a flux limited sample is constructed in some band B. The accretion
luminosity in that band will be given by
L = KBηMc2, (1)
where KB is the fraction of luminosity appearing in band B (i.e. the reciprocal of the
bolometric correction), η is the accretion efficiency, and M is the mass accretion rate. Now
let us assume that M has no explicit spin dependence (e.g. is determined by the larger
circumnuclear environment), and that the spectral energy distribution and hence KB is
independent of spin. Thus, the space density of sources with accretion rates in the range
M → M + dM and spins in the range a → a + da, denoted Φ(M, a) dM da, can be taken as
a given function set by the astrophysics of black hole growth.
We assume a Euclidean universe, valid for the local/bright AGN samples relevant for spin
measurements with the current generation of X-ray observatories. The number of sources

–18
–AGN a WKα q1 Fe/solar ξ log M Lbol/LEdd Host WA
MCG–6-30-15a ≥ 0.98 305+20−20 4.4+0.5
−0.8 1.9+1.4−0.5 68+31
−31 6.65+0.17−0.17 0.40+0.13
−0.13 E/S0 yes
Fairall 9b 0.65+0.05−0.05 130+10
−10 5.0+0.0−0.1 0.8+0.2
−0.1 3.7+0.1−0.1 8.41+0.11
−0.11 0.05+0.01−0.01 Sc no
SWIFT J2127.4+5654c 0.6+0.2−0.2 220+50
−50 5.3+1.7−1.4 1.5+0.3
−0.3 40+70−35 7.18+0.07
−0.07 0.18+0.03−0.03 — yes
1H0707–495d ≥ 0.98 1775+511−594 6.6+1.9
−1.9 ≥ 7 50+40−40 6.70+0.40
−0.40 ∼ 1.0−0.6 — no
Mrk 79e 0.7+0.1−0.1 377+47−34 3.3+0.2
−0.1 1.2∗ 177+6−6 7.72+0.14
−0.14 0.05+0.01−0.01 SBb yes
Mrk 335f 0.70+0.12−0.01 146+39
−39 6.6+2.0−1.0 1.0+0.1
−0.1 207+5−5 7.15+0.13
−0.13 0.25+0.07−0.07 S0a no
NGC 7469f 0.69+0.09−0.09 91+9
−8 ≥ 3.0 ≤ 0.4 ≤ 24 7.09+0.06−0.06 1.12+0.13
−0.13 SAB(rs)a no
NGC 3783g ≥ 0.98 263+23−23 5.2+0.7
−0.8 3.7+0.9−0.9 ≤ 8 7.47+0.08
−0.08 0.06+0.01−0.01 SB(r)ab yes
Table 2: Summary of black hole spin measurements derived from relativistic reflection fitting of SMBH spectra. Data are taken
with Suzaku except for 1H0707–495, which was observed with XMM-Newton, and MCG–6-30-15, in which the data from XMM
and Suzaku are consistent with each other. Spin (a) is dimensionless, as defined previously. WKα denotes the equivalent width
of the broad iron line relative to the continuum in units of eV. Parameter q1 represents the inner disk emissivity index and is
unitless. Fe/solar is the iron abundance of the inner disk in solar units, while ξ is its ionization parameter in units of erg cm s−1 .
M is the mass of the black hole in solar masses, and Lbol/LEdd is the Eddington ratio of its luminous output. Host denotes the
galaxy host type and WA denotes the presence/absence of a warm absorber. Values marked with an asterisk either were fixed
in the fit or have unknown errors. All masses are from Peterson et al. (2004) except MCG–6-30-15, 1H0707–495 and SWIFT
J2127.4+5654, which are taken from McHardy et al. (2005), Zoghbi et al. (2010) and Malizia et al. (2008), respectively. All
bolometric luminosities are from Woo & Urry (2002) except for the same three sources. The same references for MCG–6-30-15
and SWIFT J2127.4+5654 are used, but host types for 1H0707–495 and SWIFT J2127.4+5654 are unknown.
aBrenneman & Reynolds (2006), Miniutti et al. (2007).
bSchmoll et al. (2009), though note some discrepancies with Patrick et al. (2010).
cMiniutti et al. (2009), though note some discrepancies with Patrick et al. (2010).
dZoghbi et al. (2010), de La Calle Perez et al. (2010).
eGallo et al. (2005, 2010).
fPatrick et al. (2010).
gThis work.

– 19 –
in a flux-limited sample with luminosity in the range L → L + dL and spins in the range
a → a + da is then,
dN ∝ Φ(L, a)L3/2 dL da, (2)
where Φ(L, a) dL da is the space density of sources with luminosity in the range L → L+ dL
and spins in the range a → a + da. Transforming into the (M, a)-plane gives,
dN ∝ Φ(M, a)η3/2 dM da. (3)
Using our assumption that the mass accretion rate is independent of spin, we can separate
Φ(M, a) into an accretion rate dependent space density n(M) and a spin distribution function
f(a), Φ(M , a) = n(M)f(a). We can then integrate Eqn. 3 over M in order to determine the
number of sources in a flux-limited sample with spins in the range a → a + da:
dNa ∝ f(a)η(a)3/2 da
(∫
n(M) dM
)
. (4)
For illustration purposes, let us examine eqn. 4 in the case of a completely flat spin distribu-
tion where f(a) = constant for a ∈ [0, amax] and is zero otherwise. Thus, half of the parent
population as a whole has a > amax/2. We find that if amax = 0.95, then half of sources in
the flux limited sample will have a > 0.67; for amax = 0.99 we find that half of the sources
in the sample have a > 0.73.
Generalizing away from a flat spin distribution, we can consider spin distribution func-
tions of the form f(a) ∝ ap. Within this simple framework, we require f(a) ∝ a (i.e. p = 1.0)
in order to produce flux-limited samples where half of sources have a > 0.84 (assuming
amax = 0.95). For high-spin weighted distribution functions such as this, the selection bias
is stronger; only 20% of objects in the volume-limited parent sample actually have a > 0.84.
Of course, given the small number statistics and highly inhomogeneous selection functions
for the current spin measurements, it is too early to draw any conclusions about the need
for a high-spin biased distribution function.
We are extremely grateful to our NASA and JAXA colleagues in the Suzaku project for
enabling these Key Project data to be collected. We thank Martin Elvis and Cole Miller for
insightful conversations throughout the course of this work, and the anonymous referee, who
provided useful feedback that has improved this manuscript. This work was supported by
NASA under the Suzaku Guest Observer grant NNX09AV43G.

– 20 –
REFERENCES
Arnaud, K. A. 1996, in Astronomical Society of the Pacific Conference Series, Vol. 101,
Astronomical Data Analysis Software and Systems V, ed. G. H. Jacoby & J. Barnes,
17–+
Berti, E. & Volonteri, M. 2008, ApJ, 684, 822
Blandford, R. D. & Znajek, R. L. 1977, MNRAS, 179, 433
Brenneman, L. W. & Reynolds, C. S. 2006, ApJ, 652, 1028
Dauser, T., Wilms, J., Reynolds, C. S., & Brenneman, L. W. 2010, MNRAS, 1460
Fabian, A. C., Nandra, K., Reynolds, C. S., Brandt, W. N., Otani, C., Tanaka, Y., Inoue,
H., & Iwasawa, K. 1995, MNRAS, 277, L11
Fabian, A. C., Rees, M. J., Stella, L., & White, N. E. 1989, MNRAS, 238, 729
Gallo, L. C., Miniutti, G., Miller, J. M., Brenneman, L. W., Fabian, A. C., Guainazzi, M.,
& Reynolds, C. S. 2011, MNRAS, 411, 607
Hughes, S. A. & Blandford, R. D. 2003, ApJ, 585, L101
Kallman, T. & Bautista, M. 2001, ApJS, 133, 221
Kaspi, S., Brandt, W. N., George, I. M., Netzer, H., Crenshaw, D. M., Gabel, J. R.,
Hamann, F. W., Kaiser, M. E., Koratkar, A., Kraemer, S. B., Kriss, G. A., Mathur,
S., Mushotzky, R. F., Nandra, K., Peterson, B. M., Shields, J. C., Turner, T. J., &
Zheng, W. 2002, ApJ, 574, 643
King, A. R. & Pringle, J. E. 2007, MNRAS, 377, L25
Krongold, Y., Nicastro, F., Brickhouse, N. S., Elvis, M., Liedahl, D. A., & Mathur, S. 2003,
ApJ, 597, 832
Laor, A. 1991, ApJ, 376, 90
Magdziarz, P. & Zdziarski, A. A. 1995, MNRAS, 273, 837
Malizia, A., Bassani, L., Bird, A. J., Landi, R., Masetti, N., de Rosa, A., Panessa, F., Molina,
M., Dean, A. J., Perri, M., & Tueller, J. 2008, MNRAS, 389, 1360
McHardy, I. M., Gunn, K. F., Uttley, P., & Goad, M. R. 2005, MNRAS, 359, 1469
– 21 –
Miller, J. M. 2007, ARA&A, 45, 441
Miller, J. M., Fabian, A. C., Wijnands, R., Remillard, R. A., Wojdowski, P., Schulz, N. S.,
Di Matteo, T., Marshall, H. L., Canizares, C. R., Pooley, D., & Lewin, W. H. G.
2002, ApJ, 578, 348
Miniutti, G., Panessa, F., de Rosa, A., Fabian, A. C., Malizia, A., Molina, M., Miller, J. M.,
& Vaughan, S. 2009, MNRAS, 398, 255
Moderski, R. & Sikora, M. 1996, MNRAS, 283, 854
Nandra, K., O’Neill, P. M., George, I. M., & Reeves, J. N. 2007, MNRAS, 382, 194
Netzer, H., Kaspi, S., Behar, E., Brandt, W. N., Chelouche, D., George, I. M., Crenshaw,
D. M., Gabel, J. R., Hamann, F. W., Kraemer, S. B., Kriss, G. A., Nandra, K.,
Peterson, B. M., Shields, J. C., & Turner, T. J. 2003, ApJ, 599, 933
Patrick, A. R., Reeves, J. N., Porquet, D., Markowitz, A. G., Lobban, A. P., & Terashima,
Y. 2010, ArXiv e-prints
Penrose, R. 1969, Nuovo Cimento Rivista Serie, 1, 252
Peterson, B. M., Ferrarese, L., Gilbert, K. M., Kaspi, S., Malkan, M. A., Maoz, D., Merritt,
D., Netzer, H., Onken, C. A., Pogge, R. W., Vestergaard, M., & Wandel, A. 2004,
ApJ, 613, 682
Reis, R. C., Fabian, A. C., Ross, R. R., Miniutti, G., Miller, J. M., & Reynolds, C. 2008,
MNRAS, 387, 1489
Reynolds, C. S. 1997, MNRAS, 286, 513
Reynolds, C. S. & Fabian, A. C. 2008, ApJ, 675, 1048
Reynolds, C. S. & Nowak, M. A. 2003, Phys. Rep., 377, 389
Rezzolla, L., Barausse, E., Dorband, E. N., Pollney, D., Reisswig, C., Seiler, J., & Husa, S.
2008, Phys. Rev. D, 78, 044002
Ross, R. R. & Fabian, A. C. 2005, MNRAS, 358, 211
Schmoll, S., Miller, J. M., Volonteri, M., Cackett, E., Reynolds, C. S., Fabian, A. C., Bren-
neman, L. W., Miniutti, G., & Gallo, L. C. 2009, ApJ, 703, 2171
Sikora, M., Stawarz, L., & Lasota, J. 2007, ApJ, 658, 815
– 22 –
Tanaka, Y., Nandra, K., Fabian, A. C., Inoue, H., Otani, C., Dotani, T., Hayashida, K.,
Iwasawa, K., Kii, T., Kunieda, H., Makino, F., & Matsuoka, M. 1995, Nature, 375,
659
Theureau, G., Bottinelli, L., Coudreau-Durand, N., Gouguenheim, L., Hallet, N., Loulergue,
M., Paturel, G., & Teerikorpi, P. 1998, A&AS, 130, 333
Volonteri, M., Madau, P., Quataert, E., & Rees, M. J. 2005, ApJ, 620, 69
Wilson, A. S. & Colbert, E. J. M. 1995, ApJ, 438, 62
Woo, J. & Urry, C. M. 2002, ApJ, 579, 530
Yaqoob, T., Reeves, J. N., Markowitz, A., Serlemitsos, P. J., & Padmanabhan, U. 2005,
ApJ, 627, 156
Zoghbi, A., Fabian, A. C., Uttley, P., Miniutti, G., Gallo, L. C., Reynolds, C. S., Miller,
J. M., & Ponti, G. 2010, MNRAS, 401, 2419
This preprint was prepared with the AAS LATEX macros v5.2.

– 23 –
3 4 5 6 71.5
22.
53
q1
q2
3 4 5 6 71.5
22.
53
q1
q2
Fig. 6.— Confidence contours on the (q1, q2)-plane for the 3–45 keV band fit assuming a XIS/PIN
cross-normalization that is free (left panel) or fixed at the nominal value of 1.18 (right panel).
Solid lines show the 68%, 90% and 99% confidence contours for two interesting parameters (∆χ2 =
2.3, 4.6, 9.2, and red, blue, green respectively). Dashed lines show the 68%, 90% and 99% confidence
contours for one interesting parameter (∆χ2 = 1, 2.7, 6.6, respectively, with the same color scheme).
– 24 –
0.4 0.6 0.8 1
020
40
∆χ2
a
Fig. 7.— Goodness-of-fit parameter ∆χ2 as a function of the assumed black hole spin for our
fiducial model (black line), the fiducial model except with frozen WA parameters (red line), the
fiducial model except with free XIS/PIN normalization (blue line), and a hard-band (> 3 keV) fit
only (green line). Confidence levels are indicated with horizontal black lines and are derived for
one interesting parameter. See text in §3.4 for details.
Related Documents