The Spatiotemporal Dynamics of Illusory Contour Processing: Combined High-Density Electrical Mapping, Source Analysis, and Functional Magnetic Resonance Imaging Micah M. Murray, 1,2 Glenn R. Wylie, 1 Beth A. Higgins, 1 Daniel C. Javitt, 1,4 Charles E. Schroeder, 1,2 and John J. Foxe 1,2,3 1 The Cognitive Neurophysiology Laboratory, Program in Cognitive Neuroscience and Schizophrenia, Nathan S. Kline Institute for Psychiatric Research, Orangeburg, New York 10962, Departments of 2 Neuroscience and 3 Psychiatry and Behavioral Science, Albert Einstein College of Medicine, Bronx, New York 10461, and 4 Department of Psychiatry, New York University School of Medicine, New York, New York 10016 Because environmental information is often suboptimal, visual perception must frequently rely on the brain’s reconstruction of contours absent from retinal images. Illusory contour (IC) stimuli have been used to investigate these “filling-in” processes. In- tracranial recordings and neuroimaging studies show IC sensi- tivity in lower-tier area V2, and to a lesser extent V1. Some interpret these data as evidence for feedforward processing of IC stimuli, beginning at lower-tier visual areas. On the basis of lesion, visual evoked potentials (VEP), and neuroimaging evi- dence, others contend that IC sensitivity is a later, higher-order process. Whether IC sensitivity seen in lower-tier areas indexes feedforward or feedback processing remains unresolved. In a series of experiments, we addressed the spatiotemporal dy- namics of IC processing. Centrally presented IC stimuli resulted in early VEP modulation (88–100 msec) over lateral–occipital (LOC) scalp—the IC effect. The IC effect followed visual re- sponse onset by 40 msec. Scalp current density topographic mapping, source analysis, and functional magnetic resonance imaging results all localized the IC effect to bilateral LOC areas. We propose that IC sensitivity described in V2 and V1 may reflect predominantly feedback modulation from higher-tier LOC areas, where IC sensitivity first occurs. Two additional observations further support this proposal. The latency of the IC effect shifted dramatically later (120 msec) when stimuli were laterally presented, indicating that retinotopic position alters IC processing. Immediately preceding the IC effect, the VEP modulated with inducer eccentricity—the configuration effect. We interpret this to represent contributions from global stimulus parameters to scene analysis. In contrast to the IC effect, the topography of the configuration effect was restricted to central parieto–occipital scalp. Key words: event-related potentials; ERP; VEP; dipoles; fMRI; Kanizsa; lateral–occipital cortex; LOC Object recognition occurs despite ambiguous or incomplete in- formation in the retinal image, as in situations of partial occlusion and poor lighting. The brain can therefore reconstruct contours absent from visual images (Petry and Meyer, 1987; Doniger et al., 2000, 2001). One method of investigating these processes involves illusory contour (IC) stimuli (Kanizsa, 1976), wherein subjects perceive an object’s borders in the absence of luminance discon- tinuities. At present, the locus and timing of IC processing are unresolved. Some report IC sensitivity at the lowest cortical processing stages. Animal intracranial studies have observed effects in area V2 (von der Heydt et al., 1984; Leventhal et al., 1998; Nieder and Wagner, 1999; Bakin et al., 2000) and sometimes also in area V1 (Redies et al., 1986; Grosof et al., 1993; Sheth et al., 1996; Lee and Nguyen, 2001; Ramsden et al., 2001). Human neuroimaging stud- ies report similar effects (Hirsch et al., 1995; ffytche and Zeki, 1996; Larsson et al., 1999; Seghier et al., 2000). From these findings, some concluded that IC sensitivity is a feedforward bottom-up process (Grosof et al., 1993; ffytche and Zeki, 1996; Sheth et al., 1996; Leventhal et al., 1998; Albert and Hoffman, 2000). Others propose that IC sensitivity occurs at higher processing stages. Behavioral investigations suggest critical roles for ma- caque V4 (De Weerd et al., 1996; Merigan, 1996) and inferotem- poral (IT) areas (Huxlin and Merigan, 1998; Huxlin et al., 2000). In humans, visual evoked potentials (VEP) modulate relatively late (150 msec after stimulus) to IC stimuli (Brandeis and Lehmann, 1989; Sugawara and Morotomi, 1991; Tallon-Baudry et al., 1996, 1997; Hermann et al., 1999; Korshunova, 1999; C sibra et al., 2000; Hermann and Bosch, 2001). Most VEP studies exam- ined modulations (30 – 60 Hz) as an index of perceptual binding (Tallon-Baudry et al., 1996, 1997; Csibra et al., 2000) or target selection (Hermann et al., 1999; Hermann and Bosch, 2001), and some observed no wide-band effects before 200 msec (Tallon- Received Oct. 9, 2001; revised March 6, 2002; accepted March 7, 2002. This work was supported by National Institutes of Health Grants MH63434 (J.J.F.) and MH49334 (D.C.J.) and the Burroughs Wellcome Fund. Data from this study are from a thesis submitted in partial fulfillment of the requirements for the degree of Doctor of Philosophy in the Sue Golding Graduate Division of Medical Sciences, Albert Einstein College of Medicine, Yeshiva University. We thank Dr. Glen Doniger for comments on previous versions of this manuscript and Deirdre Foxe for technical assistance. Special thanks are extended to Dr. Kevin Knuth, Dr. David Guilfoyle, and Raj Sangoi of the Center for Advanced Brain Imaging at The Nathan S. Kline Institute for Psychiatric Research for technical expertise in fMRI data acquisition. Sincere appreciation also goes to two anonymous reviewers for their detailed constructive comments. Correspondence should be addressed to Dr. John J. Foxe, The Cognitive Neuro- physiology Laboratory, Program in Cognitive Neuroscience and Schizophrenia, Nathan S. Kline Institute for Psychiatry Research, 140 Old Orangeburg Road, Orangeburg, N Y 10962. E-mail: [email protected]. M. M. Murray’s present address: Functional Brain Mapping Laboratory, Depart- ment of Neurology, University Hospital of Geneva, 24 rue Micheli-du-Crest, CH- 1211 Geneva, Switzerland. Copyright © 2002 Society for Neuroscience 0270-6474/02/225055-19$15.00/0 The Journal of Neuroscience, June 15, 2002, 22(12):5055–5073

Welcome message from author
This document is posted to help you gain knowledge. Please leave a comment to let me know what you think about it! Share it to your friends and learn new things together.
Transcript
The Spatiotemporal Dynamics of Illusory Contour Processing:Combined High-Density Electrical Mapping, Source Analysis, andFunctional Magnetic Resonance Imaging
Micah M. Murray,1,2 Glenn R. Wylie,1 Beth A. Higgins,1 Daniel C. Javitt,1,4 Charles E. Schroeder,1,2 andJohn J. Foxe1,2,3
1The Cognitive Neurophysiology Laboratory, Program in Cognitive Neuroscience and Schizophrenia, Nathan S. KlineInstitute for Psychiatric Research, Orangeburg, New York 10962, Departments of 2Neuroscience and 3Psychiatry andBehavioral Science, Albert Einstein College of Medicine, Bronx, New York 10461, and 4Department of Psychiatry, NewYork University School of Medicine, New York, New York 10016
Because environmental information is often suboptimal, visualperception must frequently rely on the brain’s reconstruction ofcontours absent from retinal images. Illusory contour (IC) stimulihave been used to investigate these “filling-in” processes. In-tracranial recordings and neuroimaging studies show IC sensi-tivity in lower-tier area V2, and to a lesser extent V1. Someinterpret these data as evidence for feedforward processing ofIC stimuli, beginning at lower-tier visual areas. On the basis oflesion, visual evoked potentials (VEP), and neuroimaging evi-dence, others contend that IC sensitivity is a later, higher-orderprocess. Whether IC sensitivity seen in lower-tier areas indexesfeedforward or feedback processing remains unresolved. In aseries of experiments, we addressed the spatiotemporal dy-namics of IC processing. Centrally presented IC stimuli resultedin early VEP modulation (88–100 msec) over lateral–occipital(LOC) scalp—the IC effect. The IC effect followed visual re-sponse onset by 40 msec. Scalp current density topographic
mapping, source analysis, and functional magnetic resonanceimaging results all localized the IC effect to bilateral LOC areas.We propose that IC sensitivity described in V2 and V1 mayreflect predominantly feedback modulation from higher-tierLOC areas, where IC sensitivity first occurs. Two additionalobservations further support this proposal. The latency of theIC effect shifted dramatically later (�120 msec) when stimuliwere laterally presented, indicating that retinotopic positionalters IC processing. Immediately preceding the IC effect, theVEP modulated with inducer eccentricity—the configurationeffect. We interpret this to represent contributions from globalstimulus parameters to scene analysis. In contrast to the ICeffect, the topography of the configuration effect was restrictedto central parieto–occipital scalp.
Key words: event-related potentials; ERP; VEP; dipoles; fMRI;Kanizsa; lateral–occipital cortex; LOC
Object recognition occurs despite ambiguous or incomplete in-formation in the retinal image, as in situations of partial occlusionand poor lighting. The brain can therefore reconstruct contoursabsent from visual images (Petry and Meyer, 1987; Doniger et al.,2000, 2001). One method of investigating these processes involvesillusory contour (IC) stimuli (Kanizsa, 1976), wherein subjectsperceive an object’s borders in the absence of luminance discon-tinuities. At present, the locus and timing of IC processing areunresolved.
Some report IC sensitivity at the lowest cortical processingstages. Animal intracranial studies have observed effects in areaV2 (von der Heydt et al., 1984; Leventhal et al., 1998; Nieder andWagner, 1999; Bakin et al., 2000) and sometimes also in area V1(Redies et al., 1986; Grosof et al., 1993; Sheth et al., 1996; Lee andNguyen, 2001; Ramsden et al., 2001). Human neuroimaging stud-ies report similar effects (Hirsch et al., 1995; ffytche and Zeki,1996; Larsson et al., 1999; Seghier et al., 2000). From thesefindings, some concluded that IC sensitivity is a feedforwardbottom-up process (Grosof et al., 1993; ffytche and Zeki, 1996;Sheth et al., 1996; Leventhal et al., 1998; Albert and Hoffman,2000).
Others propose that IC sensitivity occurs at higher processingstages. Behavioral investigations suggest critical roles for ma-caque V4 (De Weerd et al., 1996; Merigan, 1996) and inferotem-poral (IT) areas (Huxlin and Merigan, 1998; Huxlin et al., 2000).In humans, visual evoked potentials (VEP) modulate relativelylate (�150 msec after stimulus) to IC stimuli (Brandeis andLehmann, 1989; Sugawara and Morotomi, 1991; Tallon-Baudry etal., 1996, 1997; Hermann et al., 1999; Korshunova, 1999; Csibra etal., 2000; Hermann and Bosch, 2001). Most VEP studies exam-ined � modulations (30–60 Hz) as an index of perceptual binding(Tallon-Baudry et al., 1996, 1997; Csibra et al., 2000) or targetselection (Hermann et al., 1999; Hermann and Bosch, 2001), andsome observed no wide-band effects before 200 msec (Tallon-
Received Oct. 9, 2001; revised March 6, 2002; accepted March 7, 2002.This work was supported by National Institutes of Health Grants MH63434
(J.J.F.) and MH49334 (D.C.J.) and the Burroughs Wellcome Fund. Data from thisstudy are from a thesis submitted in partial fulfillment of the requirements for thedegree of Doctor of Philosophy in the Sue Golding Graduate Division of MedicalSciences, Albert Einstein College of Medicine, Yeshiva University. We thank Dr.Glen Doniger for comments on previous versions of this manuscript and DeirdreFoxe for technical assistance. Special thanks are extended to Dr. Kevin Knuth, Dr.David Guilfoyle, and Raj Sangoi of the Center for Advanced Brain Imaging at TheNathan S. Kline Institute for Psychiatric Research for technical expertise in fMRIdata acquisition. Sincere appreciation also goes to two anonymous reviewers fortheir detailed constructive comments.
Correspondence should be addressed to Dr. John J. Foxe, The Cognitive Neuro-physiology Laboratory, Program in Cognitive Neuroscience and Schizophrenia,Nathan S. Kline Institute for Psychiatry Research, 140 Old Orangeburg Road,Orangeburg, NY 10962. E-mail: [email protected].
M. M. Murray’s present address: Functional Brain Mapping Laboratory, Depart-ment of Neurology, University Hospital of Geneva, 24 rue Micheli-du-Crest, CH-1211 Geneva, Switzerland.Copyright © 2002 Society for Neuroscience 0270-6474/02/225055-19$15.00/0
The Journal of Neuroscience, June 15, 2002, 22(12):5055–5073

Baudry et al., 1996, 1997). Nevertheless, the dynamics of ICprocessing (relative to cortical response onset) as well as its locusremain undetermined. Regarding the latter, one detailed func-tional magnetic resonance imaging (fMRI) study found differen-tial activation to IC shapes of varying types, sizes, and gap-widthsin higher-tier lateral–occipital (LOC) areas but not in lower-tierareas including V1 and V2 (Mendola et al., 1999).
Although all human neuroimaging studies observed effects inhigher-tier cortical areas, studies in animals have neither investi-gated IC sensitivity in such areas nor addressed the timing of ICsensitivity relative to sensory response onset. We investigatedthese issues in a series of experiments, in which we combinedhigh-density electrical mapping, source analysis, and fMRI toelucidate the mechanisms underlying IC processing in humans.The high temporal resolution of our electrophysiological tech-nique permitted us to assess the relative timing of IC processeswhile recording simultaneously over the entire scalp. In experi-ment 1, stimuli were centrally presented while high-density event-related potential (ERP) recordings were made, to determine thetiming and likely sources of VEP modulations specific to ICpresence. In experiment 2, fMRI data were obtained from asecond cohort of subjects, and their hemodynamic activationswere used to constrain VEP source analyses of the electrophysi-ological data recorded from these same subjects. Experiment 3examined whether the timing and locus of IC processing wasaffected by the contrast polarity of the display. Experiment 4 (areanalysis of data from experiments 1 and 3) examined the effectsof variations in the low-level features of the stimuli on the earliestVEP componency, allowing us to determine whether our ap-proach was sensitive to modulations in lower-tier visual areas.Experiment 5 tested the effect of varying the retinotopic positionof IC stimulus presentation on the timing and locus of IC pro-cessing. Collectively, our data support a model of IC processingwherein dorsal stream regions, which are initially insensitive to ICpresence, coarsely demarcate the spatial extent of a given stimu-lus array and then input to ventral stream structures (e.g., theLOC) where IC sensitivity first occurs. Our data support thenotion that IC effects observed previously in lower-tier areas arelikely to be driven by feedback inputs from higher-tier areas.
Portions of this study have been published previously in ab-stract form (Murray et al., 2000).
MATERIALS AND METHODSThis study is composed of five separate experiments, the details of whichare described in turn.
Experiment 1: central presentations of illusory contoursSubjects. Twenty-eight (10 female) neurologically normal, paid volun-teers, aged 20–57 (mean � SD � 33.4 � 12.4) participated. All hadnormal or corrected-to-normal vision, and all but two of the subjectswere right-handed (Oldfield, 1971). All subjects provided written in-formed consent, and the Institutional Review Board of the Nathan KlineInstitute for Psychiatric Research approved all procedures.
Stimuli and task. Kanizsa-type (Kanizsa, 1976) illusory contour stimuliwere presented to subjects on a computer monitor located 114 cm awaywhile subjects fixated a central cross. These stimuli were constructedfrom “pacmen” inducers (Fig. 1) that were oriented to either form or notform an illusory shape (“IC present” and “IC absent,” respectively). Fiveshapes were used: square, circle, triangle, pentagon, and five-pointedstar. Inducers were circular, subtended 3° of visual angle in diameter, andappeared black on a gray background. To produce illusory shapes of thesame maximal width and height (6° in either plane), the eccentricity (�)of inducers varied across shapes. In the case of the square, inducers werecentered at 4.25° eccentricity along 45° radii from central fixation. For thecircle, they were located at 3° eccentricity along the horizontal andvertical meridians. For the triangle, the two lower field inducers were
centered at 4.25° eccentricity, and the upper field inducer was centeredat 3°. For both the pentagon and star, the two lower field inducers werecentered at 3.5° eccentricity, the two lateral upper field inducers werecentered at 3.1°, and the top inducer was centered at 3° along the verticalmeridian. Likewise, different numbers of inducers were used to definethese shapes (Table 1). The support ratio (�), defined as the percentageof the perimeter of the illusory shape revealed by the inducers (Ringachand Shapley, 1996), varied similarly, as did the surface area (�) of the ICshapes (Table 1).
After the presentation of each stimulus a “Y/N” cue appeared prompt-ing a forced-choice response. Subjects pressed one button for a “No”response, indicating that they did not perceive an illusory shape, or asecond button for a “Yes” response, indicating that they perceived sucha shape. The entire experiment consisted of at least nine blocks (mean �SD � 15.5 � 6), each block containing 66 stimuli. IC present and ICabsent inducer configurations were presented randomly and were equallyprobable. Subjects were encouraged to take breaks between blocks tomaintain high concentration and prevent fatigue. The timing of presen-tations was such that each stimulus appeared for 500 msec, followed by ablank screen for 1000 msec. Then the Y/N response prompt appearedand remained on the screen until a response was made, allowing subjectsto control stimulus delivery. A blank screen (1000 msec duration) fol-lowed responses. Use of the response prompt was motivated by the desireto diminish the impact of motor responses on the sensory VEP.
EEG data acquisition. Continuous EEG was acquired through Neuro-scan Synamps from 64 scalp electrodes (impedances �5 k�), referencedto nose, bandpass filtered from 0.05 to 100 Hz, and digitized at 500 Hz(see Fig. 2, inset). Epochs of continuous EEG (�100 msec before stim-ulus onset to 500 msec after stimulus onset) were averaged from eachsubject separately for both the IC present and IC absent stimulus con-figurations to compute the VEP. Baseline was defined as the epoch from�100 msec to stimulus onset. Trials with blinks and eye movements wererejected off-line on the basis of horizontal and vertical electro-oculograms (resolution of �0.5°) (Murray et al., 2001). An artifactcriterion of �60 �V was used at all other scalp sites to reject trials withexcessive EMG or other noise transients. The average (�SD) EEG
Figure 1. Stimuli and experimental paradigm. Left, Kanisza-type induc-ers were used in all experiments of the present study to define variousgeometric shapes (see Materials and Methods and Table 1 for details).Inducers were oriented to either form or not form an illusory shape. Right,The timing of stimulus presentations was such that inducers were pre-sented for 500 msec duration (400 msec in experiment 5), followed by ablank screen for 1000 msec (450 msec in experiment 5). This was followedin turn by a Y/N prompt that remained on the screen until subjects madea forced-choice button-press response indicating whether an illusoryshape was presented. A blank screen (1000 msec duration in experiments1, 3, and 4; 700 msec duration in experiment 5) then preceded the nexttrial. Paradigmatic differences in experiment 2 are described in Materialsand Methods.
Table 1. IC stimulus characteristics (experiments 1–3)
ShapeNumber ofinducers
Supportratio (�)
Inducedsurfacearea (�)
Eccentricityof farthestinducer (�)
Triangle 3 37.5% 18°2 4.25°Square 4 50% 36°2 4.25°Circle 4 �64% 28.3°2 3°Pentagon 5 �80% 24.4°2 3.5°Star 5 �62.5% 12°2 3.5°
5056 J. Neurosci., June 15, 2002, 22(12):5055–5073 Murray et al. • Dynamics of Illusory Contour Processing

epoch acceptance rate was 88% (�9). The average number of acceptedsweeps per condition was 462 (�196), with the lowest for any subjectbeing 248 and the highest being 975. Statistical and dipole source anal-yses as well as topographic mapping for all experiments in this study wereperformed on broad-band data, although filtered waveform data (40 Hzlow-pass; 24 dB/octave) are displayed in the Figures.
Experiment 2: illusory contour processing assessed withcombined EEG and fMRISubjects. Five subjects (three female; aged 24–33; mean � SD � 29.0 �3.9) participated. Two of these subjects had also participated in experi-ment 1. All had normal or corrected-to-normal vision, and four of the fivewere right-handed. All subjects provided written informed consent, andthe Institutional Review Board of the Nathan Kline Institute for Psychi-atric Research approved all procedures.
Stimuli and task. Stimuli were physically identical to those of experi-ment 1; however, the task requirements and the timing parametersdiffered slightly in this experiment. Both the EEG and fMRI componentsrequired only passive viewing of the stimuli. In the case of the EEGportion, stimuli were presented for 300 msec duration [1–2 sec random-ized interstimulus interval (ISI)], and both IC present and IC absentconfigurations appeared with equal probability from one trial to the next(randomized across trials). The entire EEG portion consisted of at least10 stimulus blocks (mean � SD � 10.8 � 1.3), each containing 100 trials.Stimulation for the fMRI portion followed a “box-car” block design.Subjects viewed the following sequence: a blank gray screen (20 secduration; hereafter, “rest”), a series of 20 IC shapes (300 msec duration;700 msec ISI; randomized across the five shapes of experiment 1), rest for20 sec, and a series of 20 IC absent configuration stimuli (300 msecduration; 700 msec ISI). In each set of functional images, this sequencewas repeated three times. Likewise, the order of stimulus types wascounterbalanced across subjects.
EEG data acquisition. Continuous EEG was acquired and the VEP(�100 msec before stimulus onset to 300 msec after stimulus onset) wascalculated in an identical manner to experiment 1, except that data werecollected from a 128-channel montage (�2.4 cm inter-electrode spacing).The average EEG epoch acceptance rate was 84% (�15). The averagenumber of accepted sweeps per condition was 464 (�107), with thelowest for any subject being 307 and the highest, 622. Electrophysiolog-ical results of this experiment are displayed on the three-dimensional(3-D) reconstruction of one subject’s (B.H.) anatomical MRI, using theboundary element method (BEM) (Fuchs et al., 1998) as implemented inCURRY (Philips Research, Hamburg, Germany). Topographic mappingon this BEM reconstruction was based on the digitization of this samesubject’s fiduciary landmarks and electrode locations (Polhemus Fastrakand 3DspaceDX software, Neuroscan, Inc.). In addition to preserving theexact geometric relationships between electrodes, this technique facili-tates the spatial co-registration of EEG and fMRI data by overlappingthese fiduciary landmarks.
fMRI data acquisition and analysis. A 3 tesla SMIS (Marconi) systemequipped with a head volume coil at the Center for Advanced BrainImaging at the Nathan Kline Institute was used to acquire T2*-weightedecho-planar images (EPIs) (repetition time/echo time/flip angle � 3sec/40 msec/90°; voxel size � 3.5 mm 3; matrix size � 64�64). Thissequence emphasizes the blood oxygenation level dependent (BOLD)response, which is an indirect index of local neural activity (Kwong et al.,1992; Ogawa et al., 1992; Logothetis et al., 2001). In each block of EPIscans, 90 volumes were acquired, each of which consisted of 31 contig-uous slices, which covered the entire brain. The first five volumes werediscarded to allow for stabilization of the BOLD signal. Visual stimula-tion was delivered through MR-compatible liquid crystal display goggles(Resonance Technology Inc., Northridge, CA). Head movement wasminimized with the use of a custom-made head holder. In all fivesubjects, motion never exceeded 0.75 mm along any axis. All fMRI dataanalyses were conducted with SPM99 software (Welcome Department ofCognitive Neurology, London, UK). Images were realigned to the firstincluded volume, normalized into Talairach coordinate space, andsmoothed (7 mm 3 full width at half maximum Gaussian kernel). Weconvolved the timing of the stimulation epochs (delayed box-car) with acanonical hemodynamic response function, and cross-correlated the re-sulting design matrix with the signal intensity changes observed in theEPI images. A t test parametric map was generated using a heightthreshold of t � 4.70 ( p � 0.05, corrected for multiple comparisons).First, we rendered this activation map on a brain provided by SPM99software. Then, we spatially co-registered this activation map with one
subject’s (B.H.) anatomical MRI data as well as with the group-averagedVEP data using CURRY software.
Experiment 3: the IC effect and contrast polaritySubjects. Seventeen subjects (five female; aged 20–42; mean � 25.6 �6.5) from experiment 1 participated. All subjects, except one, wereright-handed (Oldfield, 1971).
Stimuli and task. All experimental parameters were identical to exper-iment 1, except that the contrast polarity was inverted, such that inducersappeared gray on a black background. The entire experiment consistedof at least nine blocks (mean � SD � 13.9 � 4.3), each block containing66 stimuli.
Data acquisition. Continuous EEG was acquired and the VEP wascalculated in an identical manner to experiment 1. EEG epoch accep-tance rate was 89.9% (�7.6). The average number of accepted sweepsper condition was 416 (�132), with the lowest for any subject being 251and the highest, 750.
Experiment 4: stimulus features affecting scene analysisSubjects. Data from the 17 subjects (5 female; aged 20–42; mean �25.6 � 6.5) who participated in both experiments 1 and 3 were included.
Stimuli and task. The stimuli were those of experiments 1 and 3. Asdescribed above, five IC shapes were defined by varying numbers ofKanizsa-type inducers. Additional stimulus parameters are listed inTable 1.
Data acquisition. For each subject, the EEG epochs from experiments1 and 3 were pooled and averaged according to shape as well as ICpresence versus absence to compute the VEP. This resulted in 10 VEPsfor each subject (five shapes � two stimulus configurations). The averagenumber of accepted sweeps per condition was 147 � 44, with the lowestfor any subject being 78 and the highest, 280.
Experiment 5: the IC effect and lateral presentationsSubjects. Twelve (seven female) neurologically normal, paid volunteers,aged 19–47 (mean � SD � 26.3 � 7.2) participated. Eleven of the 12subjects were right-handed (Oldfield, 1971). Eight of these twelve sub-jects had also participated in experiment 1.
Stimuli and task. Stimulation was similar to experiments 1 and 3, exceptthat the inducer array was presented entirely to the left or right of centralfixation. As before, inducer stimuli were oriented either to form or notform an illusory shape and were presented to subjects on a computermonitor located 114 cm away as they centrally fixated. Contrast polaritywas identical to experiment 1. All stimulus presentations were composedof five inducers, centered at identical locations for all shapes. Three ofthe five shapes from experiment 1 were used: the circle, pentagon, andfive-pointed star. For each illusory shape there were three versions inwhich the inducers were not aligned, to make it less likely that subjectscompleted the task by remembering the orientation of a particularinducer. Inducers were circular and subtended 1.75° of visual angle indiameter. When present, illusory shapes maximally subtended 4° in boththe horizontal and vertical planes. Stimuli were presented to either theleft or right of a central fixation cross that remained on the screen (2°from the vertical meridian to the nearest edge of the stimulus). Theentire stimulus subtended 5.5° in both horizontal and vertical planes.
The experiment consisted of at least 20 blocks (mean � SD � 30 �9.7), each block containing 72 stimulus presentations. IC present and ICabsent inducer configurations were equally probable, as was hemifield ofpresentation. The timing of stimulus presentations was such that eachstimulus appeared for 400 msec, followed by a blank screen for 450 msec.After this, a Y/N cue appeared centrally, prompting a forced-choiceresponse identical to that in experiment 1. The Y/N cue remained on thescreen until a response was made, allowing subjects to control stimulusdelivery. A blank screen (700 msec duration) followed responses.
Data acquisition. Continuous EEG was acquired in an identical man-ner to experiment 1. The average EEG epoch acceptance rate was 93.8%(�4.2). Epochs of continuous EEG (�100 msec before stimulus onset to500 msec after stimulus onset) were averaged from each subject sepa-rately for both the IC present and IC absent stimulus configurations andeach hemifield of presentation to compute the VEP. This resulted in fourVEPs for each subject. Baseline was defined as the epoch from �100msec to stimulus onset. The average number of accepted sweeps percondition was 336 (�75), with the lowest for any subject being 171 andthe highest, 529.
Murray et al. • Dynamics of Illusory Contour Processing J. Neurosci., June 15, 2002, 22(12):5055–5073 5057

Scalp current density and dipole source analysesInformation about the intracranial generators contributing to IC sensi-tivity was obtained using two methods. The first was topographic map-ping based on scalp current density (SCD) analysis according to themethods of Huiskamp (1991) and as implemented in CURRY. SCDanalysis takes advantage of the relationship between local current densityand field potential defined by Laplace’s equation, by calculating thesecond spatial derivative of the field potential, which is directly propor-tional to the current density. The SCD technique eliminates the contri-bution of the reference electrode and mathematically eliminates effectsof volume conduction on the surface potential caused by tangentialcurrent flow within the scalp. The major strength of the SCD analysis isthe possibility for improved visualization of approximate locations ofintracranial generators through the reduced spatial superposition ofgradients originating from multiple intracranial sources (Urbano et al.,1996).
The second method was dipole source analysis using electromagneticsource estimation as applied through CURRY software. This methodassumes that there are a limited and distinct number of active brainregions over the VEP epoch, each of which can be approximated by anequivalent dipole. Dipole generators are placed within a three-shellspherical volume conductor model and overlaid on and adjusted to one ofour cohort’s (B.H.) BEM-segmented structural MRI. The forward solu-tion to this dipole configuration is tested against the observed experi-mental data. When not fixed, the positions and orientations of the dipolesare iteratively adjusted to minimize the residual variance between theforward solution and the observed data. The upper bound of the numberof modeled dipole sources is determined using a test dipole (Scherg andPicton, 1990). If the number of modeled sources, m, is adequate, thenaddition of another source (test dipole) and solving for m 1 sourceswould not be expected to further reduce the residual variance, above thatattributable to noise. For both SCD and dipole analyses, group-averagedVEP data were used to maintain the highest possible signal-to-noise ratioas well as to generalize our results across individuals.
One further note about the SCD topographic mapping method iswarranted. An obvious constraint of the printed page is that only alimited number of discrete maps can be shown to represent a giventopographic distribution, and such static maps fail to depict the fullspatiotemporal dimensionality of the data. This can make it particularlydifficult for the reader to assess both the stability of a given topographyover time and the extent of contribution of background noise to themaps. In determining the display gain to be used for the maps in thecurrent study, we followed the topography over its entire time course foreach subject (through observing animated time-series). Observation ofthese maps in the baseline period (from �100 msec until the onset ofsignificant activity at �50 msec) allowed us to determine the relativecontribution of noise to the SCD topographic maps. The gain was thenset so that background noise during this baseline period accounts foronly one to two topographic lines of current density in a given SCD map.In all cases in which a topography is plotted for a single time point in thismanuscript, we observed that topography to be stable over time (seeFig. 3C).
Statistical cluster plotsBecause our primary interest was in determining the timing of ICsensitivity, we calculated point-wise paired t tests between VEP re-sponses. By this method, we can identify the onset of differential re-sponses between both the IC present versus IC absent conditions (here-after, the IC effect) as well as VEP response onset versus the 0 �Vbaseline. For each electrode, the first time point where the t test exceededthe 0.05 � criterion for at least 11 consecutive data points (�20 msec ata 500 Hz digitization rate) was labeled as onset of either the IC effect orthe VEP response (Guthrie and Buchwald, 1991).
The results of the point-wise t tests from 55 of the 64 electrodes aredisplayed as an intensity plot (see Fig. 11) to efficiently summarize andfacilitate the comparison of the multiple data sets comprising this study.The x-, y-, and z-axes, respectively, represent time (post-stimulus onset),electrode location, and the t test result (indicated by a color value) at eachdata point. Posterior electrodes (from right to midline to left) include O2,PO8, P8, P6, PO6, PO4, P4, P2, Pz, POz, Oz, P1, P3, PO3, PO5, P5, P7,PO7, and O1. Central electrodes (from right to midline to left) includeTP8, T8, C6, CP6, CP4, C4, C2, CP2, CPZ, CZ, C1, CP1, CP3, C3, C5,CP5, TP7, and T7. Frontal electrodes (from right to midline to left)include FT8, F8, F6, FC6, FC4, F4, F2, FC2, FCZ, FZ, F1, FC1, FC3, F3,F5, FC5, FT7, and F7. The nomenclature of these electrode sites is
modified from the “International extended 10–20 system” (AmericanElectroencephalographic Society, 1991).
RESULTSExperiment 1: central presentations ofillusory contoursBehavioral resultsSubjects correctly indicated the presence or absence of IC shapes94.6% (�8.3%) of the time.
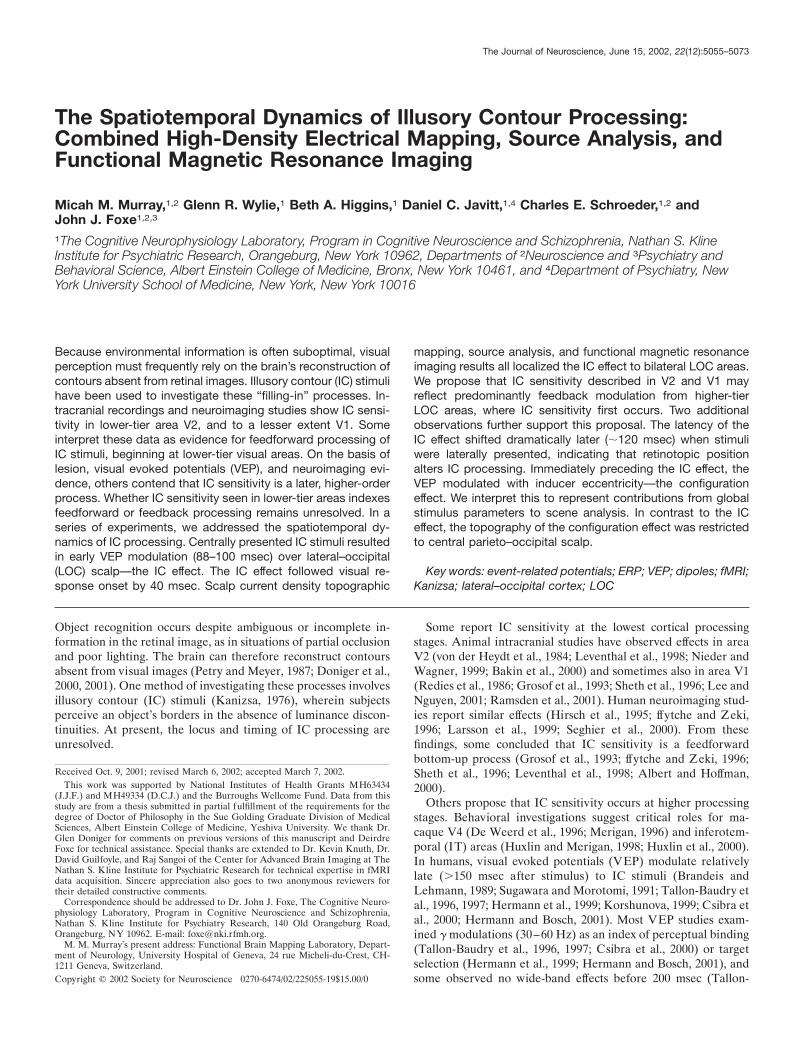
Electrophysiological resultsInspection of group-averaged VEPs for the IC present and ICabsent conditions revealed the traditional series of VEP compo-nents, including the P1, N1, and P2. These components weremaximal over posterior scalp sites. Direct comparison of theseconditions revealed a differential response to centrally presentedIC shapes over posterior scalp sites (Fig. 2). The rising phase ofthe P1 component showed neither amplitude nor latency modu-lation with the presence versus absence of IC shapes. In contrast,a large difference in waveform morphology was apparent begin-ning at the falling phase of the P1 component.
We were interested in determining the onset latency of thedifferential response to the presence versus absence of IC shapes.The point-wise paired t tests indicate that the earliest IC effectonset is at 88 msec after stimulus at scalp site P2. IC effect onsetlatencies at the remaining posterior scalp sites ranged between 88and 102 msec, with near simultaneous onsets over both hemi-spheres (88 msec at site P2 vs 90 msec at site CP3; see Fig. 11, toplef t). The initial IC effect was largest at sites PO5 and PO6 (Fig.2), peaked at �146 msec after stimulus onset, and persisted until�215 msec after stimulus onset (see Fig. 11). A second phase ofthe IC effect began at �230 msec and persisted until �320 msec.No IC effect was observed over frontal sites until �250 msec,persisting until �320 msec after stimulus. Figure 2 displays theVEP waveforms as well as the results of point-wise t tests fromsites PO5 and PO6 in addition to two representative frontal sites.
For each subject and stimulus condition, we then calculated thearea (vs the 0 �V baseline) for the 136–156 msec after stimuluswindow at sites PO5, PO6, P5, and P6 (sites of maximal IC effect)and submitted these area measures to a 2 � 2 � 2 repeatedmeasures ANOVA. The within subjects factors were stimuluscondition (IC absent vs IC present), hemisphere (left vs right),and electrode (two over each hemisphere). There was a maineffect of stimulus condition (F(1,27) � 122.13; p � 0.001), whichconfirmed the results of the point-wise t tests. There was also amain effect of hemisphere (F(1,27) � 5.73; p � 0.03). Furthermore,there was a significant interaction between the factors of stimuluscondition and hemisphere (F(1,27) � 4.52; p � 0.05), indicating alarger IC effect over the right versus left hemisphere.
A further emphasis of this study was the registration of theonset of the IC effect (as well as its time course) relative to onsetof the initial visual cortical activation. That is, we sought todetermine when the brain responded differentially to IC presenceversus absence relative to when the brain responded to any visualstimulus (regardless of IC presence versus absence). We thereforedetermined the latency of the earliest deviation from baselineactivity of the VEP response at each of the 64 scalp sites bycalculating point-wise paired t tests (two-tailed) between the 0�V baseline and the collapsed data from the two stimulus condi-tions. The first time point forward from 30 msec after stimulusonset where the response exceeded the 0.05 � criterion for at least11 consecutive data points was labeled as the VEP response onset
5058 J. Neurosci., June 15, 2002, 22(12):5055–5073 Murray et al. • Dynamics of Illusory Contour Processing
at that site. The earliest response onset was 48 msec (e.g., sites P3,P4), consistent with other observations of what has been termedthe C1 component (Clark et al., 1995; Murray et al., 2001; Foxeand Simpson, 2002; Molholm et al., 2002). From this averageVEP response onset latency, we calculated a minimal lag of 40msec until the onset of the IC effect.
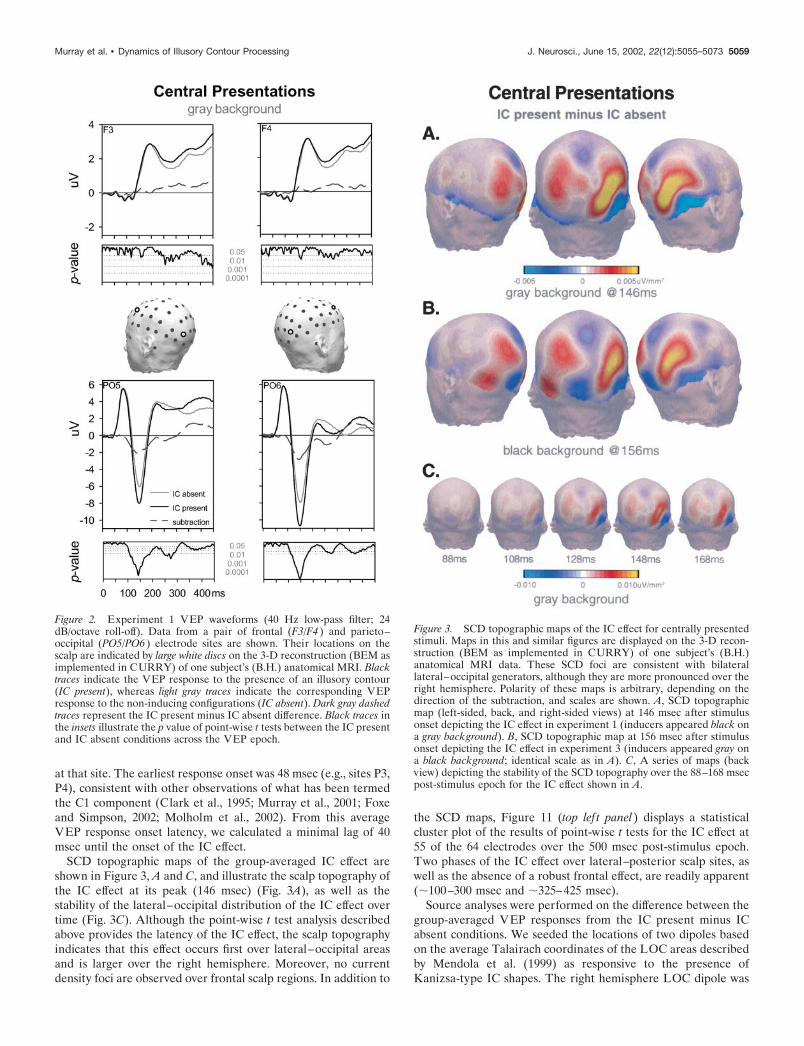
SCD topographic maps of the group-averaged IC effect areshown in Figure 3, A and C, and illustrate the scalp topography ofthe IC effect at its peak (146 msec) (Fig. 3A), as well as thestability of the lateral–occipital distribution of the IC effect overtime (Fig. 3C). Although the point-wise t test analysis describedabove provides the latency of the IC effect, the scalp topographyindicates that this effect occurs first over lateral–occipital areasand is larger over the right hemisphere. Moreover, no currentdensity foci are observed over frontal scalp regions. In addition to
the SCD maps, Figure 11 (top lef t panel) displays a statisticalcluster plot of the results of point-wise t tests for the IC effect at55 of the 64 electrodes over the 500 msec post-stimulus epoch.Two phases of the IC effect over lateral–posterior scalp sites, aswell as the absence of a robust frontal effect, are readily apparent(�100–300 msec and �325–425 msec).
Source analyses were performed on the difference between thegroup-averaged VEP responses from the IC present minus ICabsent conditions. We seeded the locations of two dipoles basedon the average Talairach coordinates of the LOC areas describedby Mendola et al. (1999) as responsive to the presence ofKanizsa-type IC shapes. The right hemisphere LOC dipole was
Figure 2. Experiment 1 VEP waveforms (40 Hz low-pass filter; 24dB/octave roll-off). Data from a pair of frontal (F3/F4 ) and parieto–occipital (PO5/PO6 ) electrode sites are shown. Their locations on thescalp are indicated by large white discs on the 3-D reconstruction (BEM asimplemented in CURRY) of one subject’s (B.H.) anatomical MRI. Blacktraces indicate the VEP response to the presence of an illusory contour(IC present), whereas light gray traces indicate the corresponding VEPresponse to the non-inducing configurations (IC absent). Dark gray dashedtraces represent the IC present minus IC absent difference. Black traces inthe insets illustrate the p value of point-wise t tests between the IC presentand IC absent conditions across the VEP epoch.
Figure 3. SCD topographic maps of the IC effect for centrally presentedstimuli. Maps in this and similar figures are displayed on the 3-D recon-struction (BEM as implemented in CURRY) of one subject’s (B.H.)anatomical MRI data. These SCD foci are consistent with bilaterallateral–occipital generators, although they are more pronounced over theright hemisphere. Polarity of these maps is arbitrary, depending on thedirection of the subtraction, and scales are shown. A, SCD topographicmap (left-sided, back, and right-sided views) at 146 msec after stimulusonset depicting the IC effect in experiment 1 (inducers appeared black ona gray background). B, SCD topographic map at 156 msec after stimulusonset depicting the IC effect in experiment 3 (inducers appeared gray ona black background; identical scale as in A). C, A series of maps (backview) depicting the stability of the SCD topography over the 88–168 msecpost-stimulus epoch for the IC effect shown in A.
Murray et al. • Dynamics of Illusory Contour Processing J. Neurosci., June 15, 2002, 22(12):5055–5073 5059
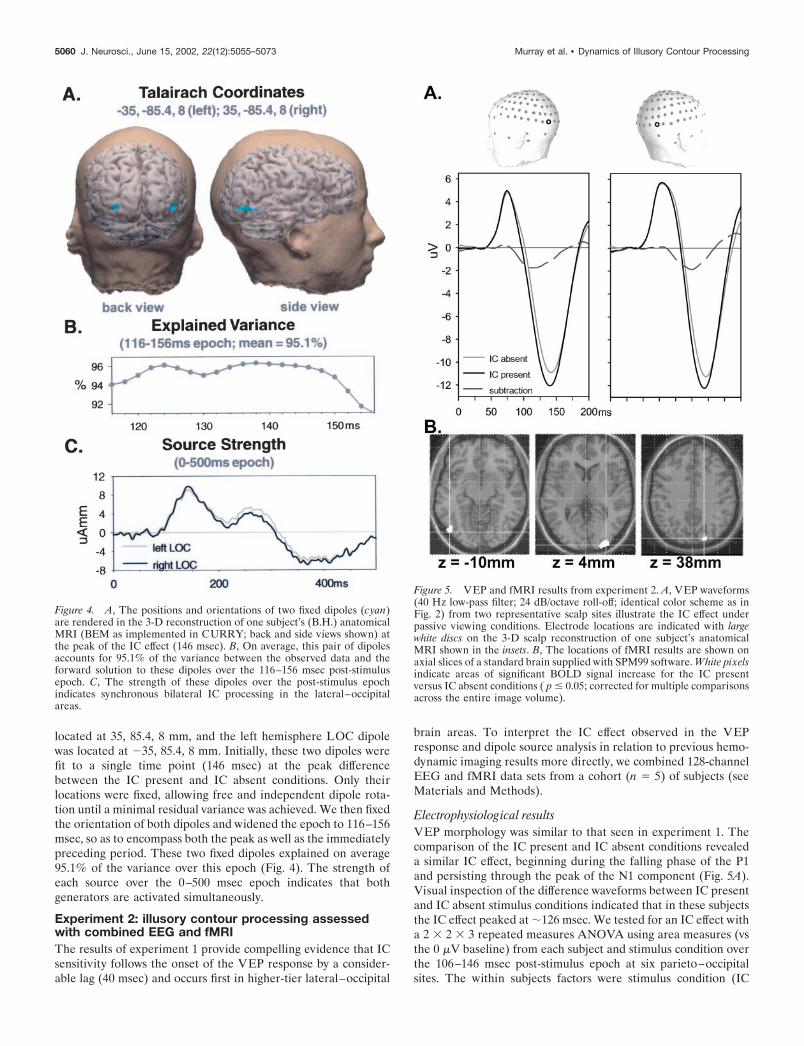
located at 35, 85.4, 8 mm, and the left hemisphere LOC dipolewas located at �35, 85.4, 8 mm. Initially, these two dipoles werefit to a single time point (146 msec) at the peak differencebetween the IC present and IC absent conditions. Only theirlocations were fixed, allowing free and independent dipole rota-tion until a minimal residual variance was achieved. We then fixedthe orientation of both dipoles and widened the epoch to 116–156msec, so as to encompass both the peak as well as the immediatelypreceding period. These two fixed dipoles explained on average95.1% of the variance over this epoch (Fig. 4). The strength ofeach source over the 0–500 msec epoch indicates that bothgenerators are activated simultaneously.
Experiment 2: illusory contour processing assessedwith combined EEG and fMRIThe results of experiment 1 provide compelling evidence that ICsensitivity follows the onset of the VEP response by a consider-able lag (40 msec) and occurs first in higher-tier lateral–occipital
brain areas. To interpret the IC effect observed in the VEPresponse and dipole source analysis in relation to previous hemo-dynamic imaging results more directly, we combined 128-channelEEG and fMRI data sets from a cohort (n � 5) of subjects (seeMaterials and Methods).
Electrophysiological resultsVEP morphology was similar to that seen in experiment 1. Thecomparison of the IC present and IC absent conditions revealeda similar IC effect, beginning during the falling phase of the P1and persisting through the peak of the N1 component (Fig. 5A).Visual inspection of the difference waveforms between IC presentand IC absent stimulus conditions indicated that in these subjectsthe IC effect peaked at �126 msec. We tested for an IC effect witha 2 � 2 � 3 repeated measures ANOVA using area measures (vsthe 0 �V baseline) from each subject and stimulus condition overthe 106–146 msec post-stimulus epoch at six parieto–occipitalsites. The within subjects factors were stimulus condition (IC
Figure 4. A, The positions and orientations of two fixed dipoles (cyan)are rendered in the 3-D reconstruction of one subject’s (B.H.) anatomicalMRI (BEM as implemented in CURRY; back and side views shown) atthe peak of the IC effect (146 msec). B, On average, this pair of dipolesaccounts for 95.1% of the variance between the observed data and theforward solution to these dipoles over the 116–156 msec post-stimulusepoch. C, The strength of these dipoles over the post-stimulus epochindicates synchronous bilateral IC processing in the lateral–occipitalareas.
Figure 5. VEP and fMRI results from experiment 2. A, VEP waveforms(40 Hz low-pass filter; 24 dB/octave roll-off; identical color scheme as inFig. 2) from two representative scalp sites illustrate the IC effect underpassive viewing conditions. Electrode locations are indicated with largewhite discs on the 3-D scalp reconstruction of one subject’s anatomicalMRI shown in the insets. B, The locations of fMRI results are shown onaxial slices of a standard brain supplied with SPM99 software. White pixelsindicate areas of significant BOLD signal increase for the IC presentversus IC absent conditions ( p � 0.05; corrected for multiple comparisonsacross the entire image volume).
5060 J. Neurosci., June 15, 2002, 22(12):5055–5073 Murray et al. • Dynamics of Illusory Contour Processing
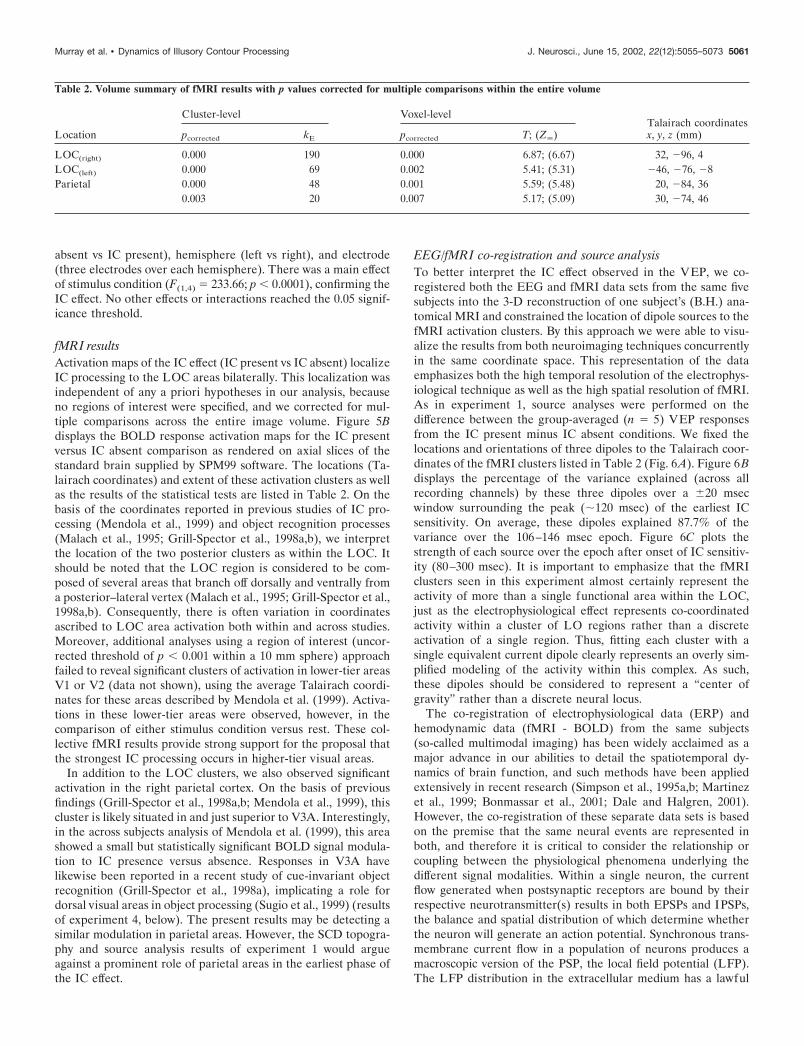
absent vs IC present), hemisphere (left vs right), and electrode(three electrodes over each hemisphere). There was a main effectof stimulus condition (F(1,4) � 233.66; p � 0.0001), confirming theIC effect. No other effects or interactions reached the 0.05 signif-icance threshold.
fMRI resultsActivation maps of the IC effect (IC present vs IC absent) localizeIC processing to the LOC areas bilaterally. This localization wasindependent of any a priori hypotheses in our analysis, becauseno regions of interest were specified, and we corrected for mul-tiple comparisons across the entire image volume. Figure 5Bdisplays the BOLD response activation maps for the IC presentversus IC absent comparison as rendered on axial slices of thestandard brain supplied by SPM99 software. The locations (Ta-lairach coordinates) and extent of these activation clusters as wellas the results of the statistical tests are listed in Table 2. On thebasis of the coordinates reported in previous studies of IC pro-cessing (Mendola et al., 1999) and object recognition processes(Malach et al., 1995; Grill-Spector et al., 1998a,b), we interpretthe location of the two posterior clusters as within the LOC. Itshould be noted that the LOC region is considered to be com-posed of several areas that branch off dorsally and ventrally froma posterior–lateral vertex (Malach et al., 1995; Grill-Spector et al.,1998a,b). Consequently, there is often variation in coordinatesascribed to LOC area activation both within and across studies.Moreover, additional analyses using a region of interest (uncor-rected threshold of p � 0.001 within a 10 mm sphere) approachfailed to reveal significant clusters of activation in lower-tier areasV1 or V2 (data not shown), using the average Talairach coordi-nates for these areas described by Mendola et al. (1999). Activa-tions in these lower-tier areas were observed, however, in thecomparison of either stimulus condition versus rest. These col-lective fMRI results provide strong support for the proposal thatthe strongest IC processing occurs in higher-tier visual areas.
In addition to the LOC clusters, we also observed significantactivation in the right parietal cortex. On the basis of previousfindings (Grill-Spector et al., 1998a,b; Mendola et al., 1999), thiscluster is likely situated in and just superior to V3A. Interestingly,in the across subjects analysis of Mendola et al. (1999), this areashowed a small but statistically significant BOLD signal modula-tion to IC presence versus absence. Responses in V3A havelikewise been reported in a recent study of cue-invariant objectrecognition (Grill-Spector et al., 1998a), implicating a role fordorsal visual areas in object processing (Sugio et al., 1999) (resultsof experiment 4, below). The present results may be detecting asimilar modulation in parietal areas. However, the SCD topogra-phy and source analysis results of experiment 1 would argueagainst a prominent role of parietal areas in the earliest phase ofthe IC effect.
EEG/fMRI co-registration and source analysisTo better interpret the IC effect observed in the VEP, we co-registered both the EEG and fMRI data sets from the same fivesubjects into the 3-D reconstruction of one subject’s (B.H.) ana-tomical MRI and constrained the location of dipole sources to thefMRI activation clusters. By this approach we were able to visu-alize the results from both neuroimaging techniques concurrentlyin the same coordinate space. This representation of the dataemphasizes both the high temporal resolution of the electrophys-iological technique as well as the high spatial resolution of fMRI.As in experiment 1, source analyses were performed on thedifference between the group-averaged (n � 5) VEP responsesfrom the IC present minus IC absent conditions. We fixed thelocations and orientations of three dipoles to the Talairach coor-dinates of the fMRI clusters listed in Table 2 (Fig. 6A). Figure 6Bdisplays the percentage of the variance explained (across allrecording channels) by these three dipoles over a �20 msecwindow surrounding the peak (�120 msec) of the earliest ICsensitivity. On average, these dipoles explained 87.7% of thevariance over the 106–146 msec epoch. Figure 6C plots thestrength of each source over the epoch after onset of IC sensitiv-ity (80–300 msec). It is important to emphasize that the fMRIclusters seen in this experiment almost certainly represent theactivity of more than a single functional area within the LOC,just as the electrophysiological effect represents co-coordinatedactivity within a cluster of LO regions rather than a discreteactivation of a single region. Thus, fitting each cluster with asingle equivalent current dipole clearly represents an overly sim-plified modeling of the activity within this complex. As such,these dipoles should be considered to represent a “center ofgravity” rather than a discrete neural locus.
The co-registration of electrophysiological data (ERP) andhemodynamic data (fMRI - BOLD) from the same subjects(so-called multimodal imaging) has been widely acclaimed as amajor advance in our abilities to detail the spatiotemporal dy-namics of brain function, and such methods have been appliedextensively in recent research (Simpson et al., 1995a,b; Martinezet al., 1999; Bonmassar et al., 2001; Dale and Halgren, 2001).However, the co-registration of these separate data sets is basedon the premise that the same neural events are represented inboth, and therefore it is critical to consider the relationship orcoupling between the physiological phenomena underlying thedifferent signal modalities. Within a single neuron, the currentflow generated when postsynaptic receptors are bound by theirrespective neurotransmitter(s) results in both EPSPs and IPSPs,the balance and spatial distribution of which determine whetherthe neuron will generate an action potential. Synchronous trans-membrane current flow in a population of neurons produces amacroscopic version of the PSP, the local field potential (LFP).The LFP distribution in the extracellular medium has a lawful
Table 2. Volume summary of fMRI results with p values corrected for multiple comparisons within the entire volume
Location
Cluster-level Voxel-levelTalairach coordinatesx, y, z (mm)pcorrected kE pcorrected T; (Z)
LOC(right) 0.000 190 0.000 6.87; (6.67) 32, �96, 4LOC(left) 0.000 69 0.002 5.41; (5.31) �46, �76, �8Parietal 0.000 48 0.001 5.59; (5.48) 20, �84, 36
0.003 20 0.007 5.17; (5.09) 30, �74, 46
Murray et al. • Dynamics of Illusory Contour Processing J. Neurosci., June 15, 2002, 22(12):5055–5073 5061

spatial relationship to the net direction (i.e., inward or outward)and macroscopic anatomical profile of the current flow patternacross the active cellular elements (Freeman and Nicholson, 1975;Schroeder et al., 1995). A portion of these LFPs volume conductto the scalp surface, and it is these and not the action potentialsthat are recorded during ERP studies (Mitzdorf, 1991; Schroederet al., 1995). In fact, in most cases, transmembrane current flowdoes not lead to action potentials because the net combination ofEPSP and IPSP results in either subthreshold activation or inhi-bition. In such cases, action potential measures might suggest lowactivity in a region, although a significant LFP is being generated.Clearly, the LFP would be a likelier index of metabolic activity inthese cases and would be a likelier correlate of the BOLD re-sponse. Furthermore, transmembrane current flow has a clearer apriori relationship to hemodynamic responses than do actionpotentials. The reason is that most of the cortical energy produc-tion of a neuron, and therefore its metabolic load, supportsfunctional (synaptic) glutamatergic neuronal activity (Sibson etal., 1998). A measure of support for these contentions is found ina recent study in which intracranial electrophysiologic recordings
were compared with fMRI data concurrently recorded from thesame monkeys (Logothetis et al., 2001). These authors found thatthe LFP (measured as activity between 10 and 130 Hz) was abetter estimate of the BOLD response than multiunit activity(300–3000 Hz). They interpreted their data, which showed astrong correlation between the LFP and the BOLD response, asstrong evidence that both were indexing the same physiologicalevents in the brain.
Experiment 3: the IC effect and contrast polaritySeveral sources of evidence indicate that the processing of illu-sory contours and figure-ground segregation are independent ofthe contrast polarity of the inducers. Intracranial studies of ma-caques reveal that figure-ground responses (Baumann et al., 1997;Zhou et al., 2000; Peterhans and Heitger, 2001) and illusorycontour presence versus absence (Heider et al., 2000) are signaledin lower-tier areas independent of contrast polarity. Psychophys-ical studies demonstrate that illusory contour strength persistsduring variation in the contrast polarity across inducers (Prazdny,1983, 1986; Shapley and Gordon, 1985; Dresp and Grossberg,1997; Victor and Conte, 1998; Spehar, 2000) and subjectivebrightness (Ware, 1981) of the induced shape. Similarly, recentfMRI results from humans demonstrate contrast polarity inde-pendence for the differential activation to IC presence versusabsence in LOC regions (Mendola et al., 1999). We thereforesought to determine whether the timing and locus of the IC effectwas independent of the contrast polarity between inducers andthe background.
Behavioral resultsSubjects correctly indicated the presence or absence of IC shapes96.3% (�3.2%) of the time. There was no difference in perfor-mance across contrast polarities (t16 � 1.48; p � 0.16) from thedata of those subjects who participated in both experiments 1and 3.
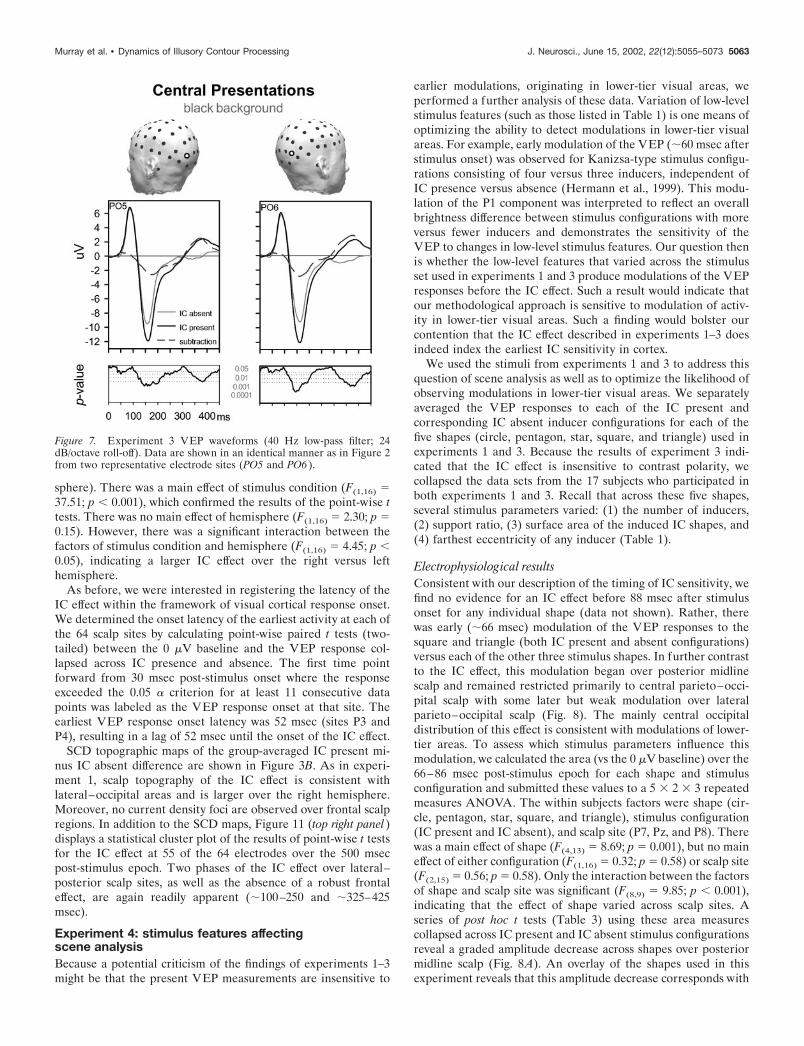
Electrophysiological resultsVEP morphology was similar to that seen in experiment 1, anddirect comparison of the IC present and IC absent conditionsrevealed a similar IC effect (Figs. 3B, 7). As before, the risingphase of the P1 component showed neither amplitude nor latencymodulation with the presence versus absence of IC shapes. Inagreement with the results of experiment 1, a large difference inwaveform morphology was apparent during the falling phase ofthe P1 component.
Point-wise paired t tests between the VEP for the IC presentversus IC absent condition were calculated to determine the onsetlatency of the IC effect (identical criterion as in experiment 1).The earliest IC effect onset was at 104 msec after stimulus at scalpsite P3. IC effect onset latencies at the remaining posterior scalpsites ranged from 106 to 112 msec, with near simultaneous onsetover both hemispheres (110 msec at site PO4). The IC effect waslargest at sites PO5 and PO6, peaking at �162 msec after stimulusonset. No IC effect was observed over frontal sites. Figure 7displays the VEP waveforms as well as the results of point-wise ttests from sites PO5 and PO6.
For each subject and stimulus condition, we then calculated thearea (vs the 0 �V baseline) for the 152–172 msec post-stimuluswindow at sites PO5, PO6, P5, and P6 and submitted these areameasures to a 2 � 2 � 2 repeated measures ANOVA. The withinsubjects factors were stimulus condition (IC absent vs IC present),hemisphere (left vs right), and electrode (two over each hemi-
Figure 6. VEP/fMRI co-registration and source analysis. A, The loca-tions of the fMRI activation clusters ( yellow) and VEP dipoles (blue),both from analyses of the group (n � 5) data of experiment 2, are shownspatially co-registered on the 3-D reconstruction of one subject’s anatom-ical MRI. B, On average, these dipoles account for 87.7% of the variancebetween the observed data and the forward solution to these dipoles overthe 106–146 msec post-stimulus epoch. C, The strength of these dipolesover the 80–300 msec post-stimulus epoch reveals the relative contribu-tion of each source over time.
5062 J. Neurosci., June 15, 2002, 22(12):5055–5073 Murray et al. • Dynamics of Illusory Contour Processing
sphere). There was a main effect of stimulus condition (F(1,16) �37.51; p � 0.001), which confirmed the results of the point-wise ttests. There was no main effect of hemisphere (F(1,16) � 2.30; p �0.15). However, there was a significant interaction between thefactors of stimulus condition and hemisphere (F(1,16) � 4.45; p �0.05), indicating a larger IC effect over the right versus lefthemisphere.
As before, we were interested in registering the latency of theIC effect within the framework of visual cortical response onset.We determined the onset latency of the earliest activity at each ofthe 64 scalp sites by calculating point-wise paired t tests (two-tailed) between the 0 �V baseline and the VEP response col-lapsed across IC presence and absence. The first time pointforward from 30 msec post-stimulus onset where the responseexceeded the 0.05 � criterion for at least 11 consecutive datapoints was labeled as the VEP response onset at that site. Theearliest VEP response onset latency was 52 msec (sites P3 andP4), resulting in a lag of 52 msec until the onset of the IC effect.
SCD topographic maps of the group-averaged IC present mi-nus IC absent difference are shown in Figure 3B. As in experi-ment 1, scalp topography of the IC effect is consistent withlateral–occipital areas and is larger over the right hemisphere.Moreover, no current density foci are observed over frontal scalpregions. In addition to the SCD maps, Figure 11 (top right panel)displays a statistical cluster plot of the results of point-wise t testsfor the IC effect at 55 of the 64 electrodes over the 500 msecpost-stimulus epoch. Two phases of the IC effect over lateral–posterior scalp sites, as well as the absence of a robust frontaleffect, are again readily apparent (�100–250 and �325–425msec).
Experiment 4: stimulus features affectingscene analysisBecause a potential criticism of the findings of experiments 1–3might be that the present VEP measurements are insensitive to
earlier modulations, originating in lower-tier visual areas, weperformed a further analysis of these data. Variation of low-levelstimulus features (such as those listed in Table 1) is one means ofoptimizing the ability to detect modulations in lower-tier visualareas. For example, early modulation of the VEP (�60 msec afterstimulus onset) was observed for Kanizsa-type stimulus configu-rations consisting of four versus three inducers, independent ofIC presence versus absence (Hermann et al., 1999). This modu-lation of the P1 component was interpreted to reflect an overallbrightness difference between stimulus configurations with moreversus fewer inducers and demonstrates the sensitivity of theVEP to changes in low-level stimulus features. Our question thenis whether the low-level features that varied across the stimulusset used in experiments 1 and 3 produce modulations of the VEPresponses before the IC effect. Such a result would indicate thatour methodological approach is sensitive to modulation of activ-ity in lower-tier visual areas. Such a finding would bolster ourcontention that the IC effect described in experiments 1–3 doesindeed index the earliest IC sensitivity in cortex.
We used the stimuli from experiments 1 and 3 to address thisquestion of scene analysis as well as to optimize the likelihood ofobserving modulations in lower-tier visual areas. We separatelyaveraged the VEP responses to each of the IC present andcorresponding IC absent inducer configurations for each of thefive shapes (circle, pentagon, star, square, and triangle) used inexperiments 1 and 3. Because the results of experiment 3 indi-cated that the IC effect is insensitive to contrast polarity, wecollapsed the data sets from the 17 subjects who participated inboth experiments 1 and 3. Recall that across these five shapes,several stimulus parameters varied: (1) the number of inducers,(2) support ratio, (3) surface area of the induced IC shapes, and(4) farthest eccentricity of any inducer (Table 1).
Electrophysiological resultsConsistent with our description of the timing of IC sensitivity, wefind no evidence for an IC effect before 88 msec after stimulusonset for any individual shape (data not shown). Rather, therewas early (�66 msec) modulation of the VEP responses to thesquare and triangle (both IC present and absent configurations)versus each of the other three stimulus shapes. In further contrastto the IC effect, this modulation began over posterior midlinescalp and remained restricted primarily to central parieto–occi-pital scalp with some later but weak modulation over lateralparieto–occipital scalp (Fig. 8). The mainly central occipitaldistribution of this effect is consistent with modulations of lower-tier areas. To assess which stimulus parameters influence thismodulation, we calculated the area (vs the 0 �V baseline) over the66–86 msec post-stimulus epoch for each shape and stimulusconfiguration and submitted these values to a 5 � 2 � 3 repeatedmeasures ANOVA. The within subjects factors were shape (cir-cle, pentagon, star, square, and triangle), stimulus configuration(IC present and IC absent), and scalp site (P7, Pz, and P8). Therewas a main effect of shape (F(4,13) � 8.69; p � 0.001), but no maineffect of either configuration (F(1,16) � 0.32; p � 0.58) or scalp site(F(2,15) � 0.56; p � 0.58). Only the interaction between the factorsof shape and scalp site was significant (F(8,9) � 9.85; p � 0.001),indicating that the effect of shape varied across scalp sites. Aseries of post hoc t tests (Table 3) using these area measurescollapsed across IC present and IC absent stimulus configurationsreveal a graded amplitude decrease across shapes over posteriormidline scalp (Fig. 8A). An overlay of the shapes used in thisexperiment reveals that this amplitude decrease corresponds with
Figure 7. Experiment 3 VEP waveforms (40 Hz low-pass filter; 24dB/octave roll-off). Data are shown in an identical manner as in Figure 2from two representative electrode sites (PO5 and PO6 ).
Murray et al. • Dynamics of Illusory Contour Processing J. Neurosci., June 15, 2002, 22(12):5055–5073 5063

the maximal eccentricity of inducer elements (Fig. 8B). Next, wecollapsed the VEP responses (both IC present and IC absent)from the triangle and square and contrasted them against thecorresponding collapsed data from all other shapes and stimulusconfigurations (hereafter “wide” and “narrow” extent, respec-tively) (Fig. 8C). The SCD topography of this wide minus narrowdifference is displayed in Figure 8D at 70 msec after stimulusonset and illustrates its central parieto–occipital distribution.Hereafter, we refer to this wide minus narrow difference as theconfiguration effect. In addition to its earlier timing, this config-uration effect contrasts with the lateral–occipital distribution thatcharacterizes the IC effect (Fig. 8C, compare with Fig. 3).
The configuration effect reveals stages of scene analysis pre-ceding IC sensitivity that appear to modulate according to thespatial distribution of inducers rather than to several other low-level stimulus parameters (Table 1). We posit that the maximaleccentricity of inducer elements (Table 1, �) demarcates a coarseextent of visual feature space and is the determining parameter inthis early modulation. Several findings from this analysis supportthis hypothesis. In contrast to Hermann et al. (1999), we observe
no difference in the VEP responses to the triangle versus square(Table 3), arguing against a difference in overall brightness(caused by the number of inducers) as an explanation of this earlymodulation. Rather, there was a significant amplitude differencebetween the responses to the square and circle, both of which aredefined by four inducers. Likewise, there were smaller amplituderesponses from stimuli defined by five inducers, relative to thosedefined by fewer inducers. This pattern also is in contrast to theprediction based on a strict interpretation of a “spotlight” ofspatial attention (Eriksen and Yeh, 1985; Stoffer, 1994), becausestimulus displays containing more local elements (inducers)should have yielded a larger response. The induced surface area(�) of IC shapes is highly unlikely to be the mediating parameter,because the configuration effect occurs when IC shapes are bothpresent and absent. Likewise, similar responses are observedacross shapes with large surface area differences (Table 3, pen-tagon vs star). Variation in support ratio (�) likewise cannotaccount for this modulation. The pattern of VEP response am-plitudes across shapes does not follow the prediction of a linearlyincreasing variation across support ratios (Gegenfurtner et al.,
Figure 8. Shape-wise analyses demonstrating the configuration effect. A, Bar graphs display the mean area (66–86 msec after stimulus) of the VEPresponse (sites P7, Pz, and P8) to each shape independent of IC presence versus absence. A step function in mean area is observed over midline but notlateral scalp sites. A single asterisk indicates a significant difference ( p � 0.01; paired t test) in mean area between both the response to the square andtriangle versus a particular shape. The double asterisk indicates a significant difference ( p � 0.01; paired t test) in mean area between the circle and eachof the other shapes. Mean area would appear to follow the eccentricity of inducers. B, A diagram of each of the IC shapes (thick black lines) indicatesthe variation in the farthest eccentricity of any inducer across shapes. C, VEP waveforms from sites P7, Pz, and P8. These data have been collapsed acrosswide shapes (square and triangle) and narrow shapes (star, pentagon, and circle). D, SCD topographic maps of the wide � narrow difference at 76 msecafter stimulus onset.
Table 3. Shape-wise t tests (experiment 4)
Triangle Square Star Pentagon Circle
Triangle t16 � 0.47; p � 0.65 t16 � 2.81; p � 0.01 t16 � 4.07; p � 0.001 t16 � 6.06; p � 0.001Square t16 � 3.22; p � 0.005 t16 � 5.11; p � 0.001 t16 � 5.57; p � 0.001Star t16 � 0.19; p � 0.85 t16 � 3.48; p � 0.003Pentagon t16 � 4.10; p � 0.001
5064 J. Neurosci., June 15, 2002, 22(12):5055–5073 Murray et al. • Dynamics of Illusory Contour Processing
1997), because by this reasoning the pentagon would be expectedto yield the largest early VEP response.
Experiment 5: the IC effect and lateral presentationsIt is also possible that our results from experiments 1–3 werebiased toward the involvement of higher-tier visual areas, becausecentrally presented IC shapes were relatively large (maximally 6°)and the inducers were quite eccentric. Reducing the gap betweeninducing elements has been used experimentally to bias IC pro-cessing toward lower-tier visual areas. However, IC processingappears to be size invariant and did not produce modulation inlower-tier areas despite robust modulation in the LOC area(Mendola et al., 1999). It is important to note, however, thatchanges in gap width when inducers still straddle the verticalmeridian limit the possible biasing of IC processes into lower-tierareas because of the anatomical and physiological properties oflower-tier visual areas. That is, when inducers straddle the verti-cal and horizontal meridians, IC borders must be establishedbetween anatomically separated cortical representations.
One physiological implication is that the formation of IC bor-ders, even for IC shapes induced over small gaps, would bepreceded by interhemispheric and intrahemispheric neural re-sponse interactions when stimuli are spatially dispersed across thehorizontal and vertical meridians (Murray et al., 2001). Suchinteractions are mediated by horizontal and callosal connections.Candidate areas mediating the earliest IC sensitivity may there-fore be restricted to those with sufficient callosal and horizontalconnectivity (Van Essen et al., 1982; Tootell et al., 1988, 1998;Clarke and Miklossy, 1990). In agreement with this possibility, arecent VEP study from our laboratory has shown that theseinteractions are delayed relative to the initial cortical responseonset by �25 msec (Murray et al., 2001).
A further limitation is based on the observation that the in-duction of IC sensitivity requires a minimal stimulus extent thatis larger than the classical receptive fields of neurons in area V1or V2 (von der Heydt et al., 1984; Peterhans and von der Heydt,1989; von der Heydt and Peterhans, 1989). One implication of thisobservation is that IC sensitivity relies on contextual modulations(Lamme and Spekreijse, 2000). Thus, at least two possible mech-anisms of IC sensitivity present themselves. Either long-rangehorizontal connections within a visual area (intrinsic and callosal)or feedback projections from higher-tier visual areas with suffi-ciently large receptive fields to span the inducing elements wouldbe required to process IC stimuli (Rockland and Pandya, 1979;Gilbert, 1983; Maunsell and Van Essen, 1983; Van Essen et al.,1994; Gilbert et al., 1996; Spillmann and Werner, 1996). Evidencefor top-down (i.e., feedback) modulation of activity in lower-tiervisual areas has been shown in macaque V1 during figure-groundsegregation (Kapadia et al., 1995, 1999; Lamme, 1995; Zipser etal., 1996; Hupe et al., 1998; Lamme et al., 1998a,b, 1999; Lammeand Spekreijse, 2000). These modulations occurred �80–100msec after stimulus onset, considerably later than the initial onsetof activity in the same V1 neurons (Zipser et al., 1996; Lammeand Spekreijse, 2000), and are suppressed by anesthesia (Lammeet al., 1998b), consistent with reentrant, feedback modulationsfrom higher-tier areas (Lamme and Roelfsema, 2000). This timeframe for contextual modulations in area V1 corresponds well tothe results of a recent intracranial investigation that focused onthe latency of IC sensitivity across the cortical layers of areas V2and V1 (Lee and Nguyen, 2001). In this study, the earliestdifferential response to Kanizsa-type IC stimuli onset at 70 msecwas in superficial layers of V2, with an effect in both deep layers
of V2 as well as superficial layers of V1 lagging by �25–30 msec(Lee and Nguyen, 2001).
An alternative means of biasing illusory contour processingmay be to vary the retinotopic position of inducers such thatinterhemispheric interactions (and potentially the involvement ofhigher-tier areas with large bilateral receptive fields) would not berequired for IC processing. Lateral presentations should distin-guish between two possible hypotheses of IC processing. The firstcontends that if IC sensitivity is a low-level and bottom-up pro-cess, then confining inducers to a single visual field should resultin earlier modulation of the VEP than when centrally presented,because this would potentially be mediated by long-range localconnectivity. Likewise a change in the scalp topography of the ICeffect would be expected (relative to central presentations) thatshould be consistent with lower-tier visual areas. A second hy-pothesis contends that object recognition of centrally presentedstimuli would be faster than when stimuli are laterally presented,in part because of the overrepresentation of central vision incortex (Popovic and Sjostrand, 2001). Several additional lines ofevidence support this hypothesis. Previous electrophysiologicalstudies of laterally presented IC shapes did not observe differen-tial modulation of the VEP response until �224 msec afterstimulus onset (Brandeis and Lehmann, 1989), which is consid-erably later than our IC effect with centrally presented stimuli.Psychophysical studies involving the discrimination of illusoryshapes of contours reveal that performance is best when stimuliappear centrally rather than laterally or either above or belowfixation (Rubin et al., 1996) [see also Juttner and Rentschler(2000) for demonstrations with object categorization]. Still othersdemonstrate that performance on shape discrimination tasks isimproved when stimuli are distributed between the left and rightvisual hemifields (Banich and Belger, 1990; Mohr et al., 1994).The prediction from these collective data would therefore be thatthe IC effect for laterally presented stimuli would shift laterrelative to central presentations. In experiment 5, we presentedIC stimuli laterally to one or the other visual hemifield to distin-guish between these two hypotheses.
Behavioral resultsSubjects correctly indicated the presence or absence of IC shapesin the left visual field 97.8% (�2.3%) of the time and in the rightvisual field 97.5% (�2.2%) of the time. There was no differencein performance across visual fields (t11 � 0.96; p � 0.36). For theeight subjects who also participated in experiment 1, there was nodifference in the accuracy of performance when stimuli werecentrally presented versus when they were presented to the left(t7 � 1.06; p � 0.32) or right (t7 � 0.72; p � 0.49) visual field.However, it is important to recall that subjects were able toself-pace stimulus delivery and that accuracy was emphasizedover speed. Subjective reports on debriefing of subjects who hadparticipated in experiment 1 indicated that the IC shapes did not“pop out” with the same saliency as when they were presentedcentrally.
Electrophysiological resultsAs in experiments 1 and 3, inspection of group-averaged VEPsfor the IC present and IC absent conditions revealed the tradi-tional series of VEP components, including P1, N1, and P2. Thesecomponents were maximal over posterior scalp sites. Direct com-parison of these conditions revealed a differential response tolaterally presented IC shapes over posterior scalp sites (Fig. 9).The P1 and N1 components showed neither amplitude nor latency
Murray et al. • Dynamics of Illusory Contour Processing J. Neurosci., June 15, 2002, 22(12):5055–5073 5065

modulation with the presence versus absence of IC shapes. Incontrast, two large, successive differences in waveform morphol-ogy were apparent after the P2 component.
As before, to determine the onset latency of the IC effect withlateralized stimuli, we calculated point-wise paired t tests be-tween the VEP for the IC present versus IC absent condition. Foreach electrode, the first time point where this comparison ex-ceeded the 0.05 � criterion for at least 11 consecutive data pointswas labeled as the onset of the IC effect. For left visual fieldpresentations, the earliest IC effect onset at 218 msec after stim-ulus was at scalp site PO4, and at 220 msec it was at site PO3. Forright visual field presentations, the earliest IC effect onset at 202msec after stimulus was at scalp site PO3, and at 214 msec afterstimulus onset it was at site PO4. For both left and right visualfield stimuli, the IC effect was largest at sites PO5 and PO6,peaking at 242 msec after stimulus onset over the hemispherecontralateral to the stimulated visual field and at 252 msec overthe ipsilateral hemisphere (Fig. 9). No IC effect was observed overfrontal sites in response to either visual field presentation. Fig-ure 9 displays the VEP waveforms, as well as the results ofpoint-wise t tests, for both left (PO6) and right (PO5) visual fieldpresentations.
For each subject and stimulus condition, we then calculated thearea (vs 0 �V baseline) for the 236–256 msec window at sitesPO5, PO6, P5, and P6. For each visual field of presentation, wethen submitted these area measures to a 2 � 2 � 2 repeatedmeasures ANOVA. For each of the two ANOVAs, the withinsubjects factors were stimulus condition (IC absent vs IC present),hemisphere (left vs right), and electrode (two over each hemi-sphere). For left visual field presentations, there was a main effectof stimulus condition (F(1,11) � 13.82; p � 0.003), which con-firmed the results of the point-wise t tests. There was no main
effect of hemisphere (F(1,11) � 0.33; p � 0.58). Furthermore, therewas no interaction between the factors of stimulus condition andhemisphere (F(1,11) � 1.88; p � 0.20), indicating an equivalent ICeffect over both hemispheres. None of the other tests reachedsignificance. For right visual field presentations, there was a maineffect of stimulus condition (F(1,11) � 22.12; p � 0.001), whichconfirmed the results of the point-wise t tests. There was no maineffect of hemisphere (F(1,11) � 1.49; p � 0.25); however, theinteraction between the factors of stimulus condition and hemi-sphere approached the significance criterion (F(1,11) � 4.53; p �0.06), suggestive of a larger IC effect over the left (contralateral)hemisphere.
It may be contended that the later IC effect latency in thisexperiment reflects a more general lag in visual cortical process-ing for lateral versus central presentations. We assessed thispossibility by registering this IC effect within the framework ofthe visual cortical response by determining the onset latency ofthe earliest activity at each scalp site. For each of the 64 scalpsites, point-wise paired t tests (two-tailed) were conducted be-tween the 0 �V baseline and the collapsed response across stim-ulus conditions. The first time point forward from 30 msec post-stimulus onset where the response exceeded the 0.05 � criterionfor at least 11 consecutive data points was labeled as the VEPresponse onset at that site. This latency was 62 msec for left and64 msec for right visual field stimuli, �10 msec later than whenstimuli were centrally presented. From this VEP response onsetlatency, we calculated a lag of �120 msec until the onset of the ICeffect for laterally presented stimuli.
It is noteworthy that despite the dramatic latency shift in the ICeffect, we observed no drop in performance accuracy betweencentral and lateral presentations. The most parsimonious expla-nation is that we are observing a ceiling effect, because thedetermination of IC presence versus absence is a relatively trivialtask as evidenced by �94% accuracy in all conditions. Onepossibility is that performance differences might have been ob-served had we asked our subjects to make a more fine-graineddiscrimination (e.g., discriminate between shapes). Likewise, thispattern of results would predict that reaction times, in correspon-dence with the latency of the IC effect, would be slower for lateralversus central presentations. The design of the present study,however, did not include collection of reaction times, becausesubjects responded after a response prompt to minimize theoverlap of motor potentials with the early VEP components.Therefore, this prediction will be tested in future studies.
SCD topographic maps of the group-averaged IC present mi-nus IC absent difference are shown in Figure 10. As with centrallypresented stimuli, the scalp topography of the IC effect indicatesthat IC sensitivity occurs first over lateral–occipital areas of thehemisphere contralateral to stimulus presentation (although alsoinvolving the ipsilateral hemisphere). No current density foci areobserved frontally. This is visualized more extensively in Figure11 (bottom two panels), which displays statistical cluster plots ofthe results of point-wise t tests for the IC effect at 55 of the 64electrodes over the 500 msec post-stimulus epoch. In sharp con-trast to the results of experiments 1–3, the IC effect for laterallypresented stimuli onsets is much later and is composed of a singlephase (�200–275 msec).
The IC effect for laterally presented stimuli is shifted �120msec later relative to when stimuli are presented centrally. Im-portantly, for both central and lateral presentations, the latency ofVEP response onset is indistinguishable, and the scalp topogra-phy of the IC effect is highly similar. A comparison of Figures 3
Figure 9. Experiment 5 VEP waveforms in response to left and rightvisual field presentations (40 Hz low-pass filter; 24 dB/octave roll-off).Data are shown in an identical manner as in Figure 2 from one contralat-eral representative electrode site for left visual field (PO6 ) and rightvisual field (PO5) stimulus presentations.
5066 J. Neurosci., June 15, 2002, 22(12):5055–5073 Murray et al. • Dynamics of Illusory Contour Processing

and 10 shows this general topographic similarity, suggesting theactivation of a similar complex of LOC generators in both cases;however, some clear variations are apparent. Given the relativecrudeness of the ERP topographic technique for spatially local-izing intracranial generators, it would be premature to interpretthese differences to any great extent. Nonetheless, it is reasonableto predict that although central and lateral stimuli both result inLOC activation, there is likely to be some variation in the relativecontributions to this effect from the sub-areas that comprise theLOC region. Clearly, further investigation will be required to testthis prediction.
More importantly, this pattern of results is not consistent withthe prediction that IC processing is a strictly feedforward,bottom-up phenomenon. Likewise, this shift in the latency of theIC effect contrasts with previous VEP studies in which similarlatencies (�200 msec) for the IC effect have been observed forboth central (Sugawara and Morotomi, 1991; Tallon-Baudry etal., 1996, 1997) and lateral presentations (Brandeis and Lehmann,1989). That is, the onset of our IC effect for central presentationsis earlier than in previous studies, whereas the timing of our ICeffect for lateral presentations is in agreement with the results ofBrandeis and Lehmann (1989).
DISCUSSIONHigh-density electrical mapping, source analysis, and fMRI werecombined to elucidate mechanisms underlying IC processing inhumans. We present four main findings. (1) The VEP modulated
with IC presence versus absence—the IC effect. This effect onsetwas at 88 msec, it followed cortical response onset by 40 msec, andit was robust across contrast polarities. (2) Lateral presentationsshifted IC effect onset 120 msec later. From these latencies, wepropose that the earliest IC sensitivity is unlikely to occur duringthe initial phase of activation in lower-tier hierarchical areas. (3)Strongly supporting this hypothesis are combined VEP and fMRIresults localizing the earliest IC effect to the LOC, regardless ofthe shape or the retinotopic position of the IC. (4) Visual featureanalyses preceded IC sensitivity over central parieto–occipitalscalp—the configuration effect. Collectively, our data support amodel of IC processing wherein dorsal stream regions, which areinitially insensitive to IC presence, coarsely demarcate the spatialextent of a given stimulus array and then input to ventral streamstructures (e.g., the LOC area), where IC sensitivity first occurs.Our data support the notion that IC effects previously observed inlower-tier areas are likely to be driven by feedback (perhaps incombination with horizontal) inputs from higher-tier areas.
Timing of IC processingThe earliest VEP modulation to IC shape presence versus ab-sence was onset at 88 msec. In contrast, the initial visual corticalresponse was onset at 48 msec. Thus, there is a 40 msec lagbetween cortical response onset and IC effect onset, which issufficient for signal transmission to the LOC area. Response onsetin human LOC areas can be predicted from intracranial record-ings detailing the timing of activation across cortical regions(Schroeder et al., 1998) in awake monkeys. Onset latencies are�25 msec in V1 (Maunsell and Gibson, 1992; Givre et al., 1994;Schroeder et al., 1998, 2001) and �50 msec in IT (Schroeder etal., 1998, 2001; Mehta et al., 2000a,b). By applying a 3:5 ratio todraw correspondence between monkeys and humans (Schroederet al., 1995, 1998, 2001), a conservative estimate of human V1onset is 40–50 msec (consistent with the current findings) and80–100 msec in LOC areas. From these estimates, the IC effectafter central presentations is likely to commence with or shortlyafter initial activity in higher-tier ventral stream areas.
These timing data can be applied similarly to the interpretationof a recent investigation of IC processing dynamics in monkeys(Lee and Nguyen, 2001). The earliest IC response occurred insuperficial V2 (70 msec), followed by deep V2 (95 msec) andsuperficial V1 (100 msec). Unfortunately, activation onset laten-cies were not reported. However, on the basis of known anatom-ical connections (Felleman and Van Essen, 1991) and previousstudies in monkeys (Givre et al., 1994; Schroeder et al., 1998,2001; Mehta et al., 2000a,b), this laminar activation profile ischaracteristic of a feedback input pattern. Likewise, mean laten-cies in V1 and V2 of the awake monkey are 24 and 32 msec,respectively (Schroeder et al., 1998). Therefore, the findings ofLee and Nguyen (2001) are unlikely to reflect modulation of theinitial afferent volley to V1 or V2. This hypothesis is furthersupported by the impaired discrimination of IC shapes afterlesions in V4 (De Weerd et al., 1996) or IT cortex (Huxlin andMerigan, 1998; Huxlin et al., 2000) and studies of contextualmodulation (Hupe et al., 1998; Lamme and Spekreijse, 2000), aswell as by the present SCD topography, dipole analysis, and fMRIresults that all localized the IC effect to the LOC area.
Lateral versus central presentations reveal modes ofobject processingSeveral lines of evidence support the interpretation that thetemporal disparity in the IC effect for central versus lateral
Figure 10. SCD topographic maps (left-sided, back, and right-sidedviews) of the IC effect for laterally presented stimuli of experiment 5. Top,SCD topographic maps at 236 msec after stimulus onset depicting the ICeffect in response to left visual field stimuli. Bottom, SCD topographicmaps at 236 msec after stimulus onset depicting the IC effect in responseto right visual field stimuli. These SCD foci are consistent with bilaterallateral–occipital generators, although more pronounced over the con-tralateral hemisphere. Polarity of these maps is arbitrary, depending onthe direction of the subtraction, and scales are shown.
Murray et al. • Dynamics of Illusory Contour Processing J. Neurosci., June 15, 2002, 22(12):5055–5073 5067
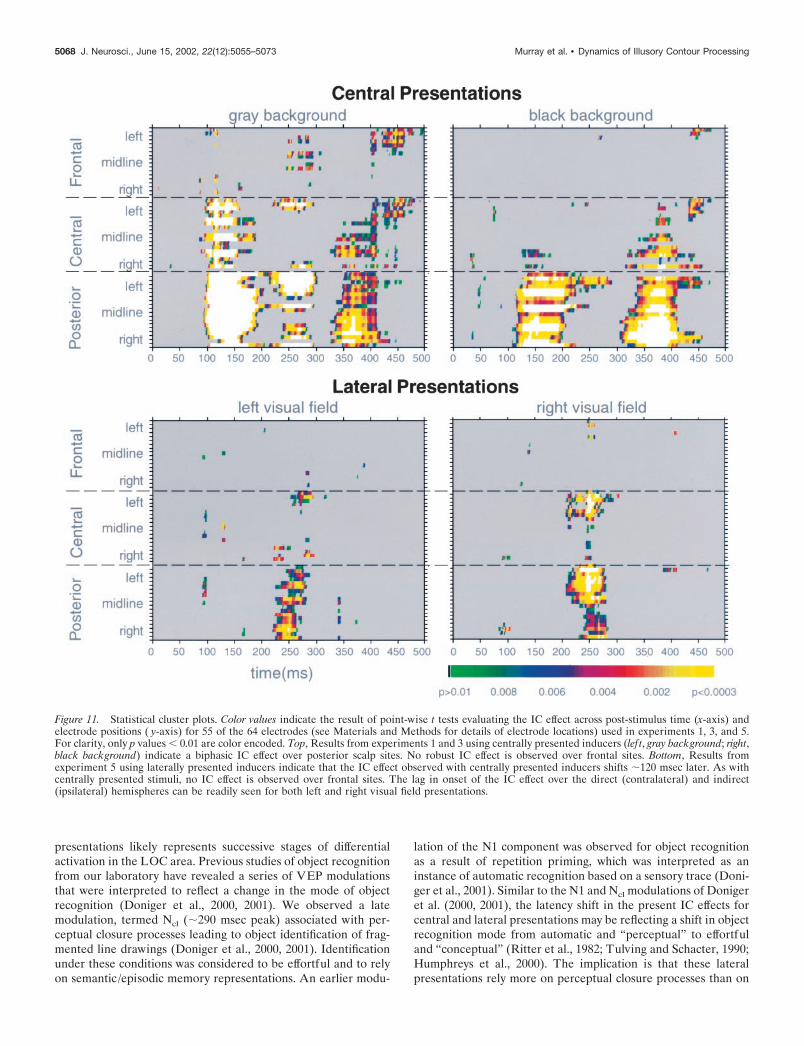
presentations likely represents successive stages of differentialactivation in the LOC area. Previous studies of object recognitionfrom our laboratory have revealed a series of VEP modulationsthat were interpreted to reflect a change in the mode of objectrecognition (Doniger et al., 2000, 2001). We observed a latemodulation, termed Ncl (�290 msec peak) associated with per-ceptual closure processes leading to object identification of frag-mented line drawings (Doniger et al., 2000, 2001). Identificationunder these conditions was considered to be effortful and to relyon semantic/episodic memory representations. An earlier modu-
lation of the N1 component was observed for object recognitionas a result of repetition priming, which was interpreted as aninstance of automatic recognition based on a sensory trace (Doni-ger et al., 2001). Similar to the N1 and Ncl modulations of Donigeret al. (2000, 2001), the latency shift in the present IC effects forcentral and lateral presentations may be reflecting a shift in objectrecognition mode from automatic and “perceptual” to effortfuland “conceptual” (Ritter et al., 1982; Tulving and Schacter, 1990;Humphreys et al., 2000). The implication is that these lateralpresentations rely more on perceptual closure processes than on
Figure 11. Statistical cluster plots. Color values indicate the result of point-wise t tests evaluating the IC effect across post-stimulus time (x-axis) andelectrode positions ( y-axis) for 55 of the 64 electrodes (see Materials and Methods for details of electrode locations) used in experiments 1, 3, and 5.For clarity, only p values � 0.01 are color encoded. Top, Results from experiments 1 and 3 using centrally presented inducers (lef t, gray background; right,black background) indicate a biphasic IC effect over posterior scalp sites. No robust IC effect is observed over frontal sites. Bottom, Results fromexperiment 5 using laterally presented inducers indicate that the IC effect observed with centrally presented inducers shifts �120 msec later. As withcentrally presented stimuli, no IC effect is observed over frontal sites. The lag in onset of the IC effect over the direct (contralateral) and indirect(ipsilateral) hemispheres can be readily seen for both left and right visual field presentations.
5068 J. Neurosci., June 15, 2002, 22(12):5055–5073 Murray et al. • Dynamics of Illusory Contour Processing
rapid object recognition. That is, the IC effect after lateral pre-sentations resulted in modulation of the VEP very similar to theNcl observed during perceptual closure paradigms, whereas thecorresponding IC effect after presentations of stimuli centrallyyielded modulation of the N1 as well as the Ncl componency.These early (in the case of central presentations) and late mod-ulations (in the cases of both central and lateral presentations)can be readily visualized in Figure 11.
Locus of IC processingOur combined VEP and fMRI results localized the IC effect tothe LOC area, which has been implicated repeatedly in objectrecognition (Malach et al., 1995; Moscovitch et al., 1995; Vanni etal., 1996; Grill-Spector et al., 1998a,b; Ishai et al., 1999; Kourtziand Kanwisher, 2000), perceptual closure (Doniger et al., 2000,2001), and IC sensitivity (Hirsch et al., 1995; ffytche and Zeki,1996; Larsson et al., 1999; Mendola et al., 1999; Seghier et al.,2000). The LOC area is considered the homolog of macaque ITcortex (Gross et al., 1972; Sary et al., 1993; Kobatake and Tanaka,1994) and has large, bilateral receptive fields (Kobatake andTanaka, 1994; Tootell et al., 1998). Critically, areas V1 and V2have small receptive fields and lack substantial callosal inputs,making it unlikely for these areas to mediate IC effects with large,centrally presented stimuli used in the present study (althoughthese areas are likely to be involved in IC processing usingfeedback from areas like the LOC area). Object recognition inhigher-tier areas has further been shown to be size, position, andcue invariant (Sary et al., 1993; Lueschow et al., 1994; Ito et al.,1995; Grill-Spector et al., 1998a). Some of these properties haverecently been generalized to include IC processing (Mendola etal., 1999). Here, we replicate the localization of IC processing tothe LOC area of Mendola et al. (1999) and further extend thisfinding to include both centrally and laterally presented ICshapes, demonstrating the position invariance of IC sensitivity inthe LOC area. Although the lateral displacement of the inducerstimuli appears not to alter the locus of IC sensitivity, it wouldappear to shift its mode from automatic to effortful. Although itmay be contended that Kanizsa-type stimuli biased IC processingtoward higher-tier regions and that other IC varieties would havebetter detected IC processing in lower-tier areas, recent fMRIresults suggest a central role for the LOC area in the processingof multiple IC varieties (Mendola et al., 1999). Nonetheless, onequestion for future research is the extent to which the dynamicsof the present results generalize across IC varieties.
Hemispheric asymmetry of IC processingThis study found that although both hemispheres are involved inIC processing, the IC effect is larger over the right versus lefthemisphere after central presentations, but not after lateral pre-sentations. In the case of lateral presentations, the onset of the ICeffect occurs first over the contralateral hemisphere with activa-tion over the ipsilateral hemisphere lagging by �10 msec (con-sistent with estimates of interhemispheric transfer time) (Murrayet al., 2001). However, the amplitude (measured from a 20 msecepoch centered on the peak of the IC effect over the contralateralhemisphere) did not differ over the two hemispheres in thecase of lateral presentations. Further experiments will be re-quired to resolve any hemispheric asymmetry of illusory contourprocessing.
Nonetheless, one hypothesis would maintain that the righthemisphere is specialized for global form processes, whereas theleft hemisphere is specialized for analytic local processes (Rob-
ertson et al., 1988; Atchley and Atchley, 1998; Corballis et al.,1999; Han et al., 2000a,b). Psychophysical investigations of ICperception, however, provide no clear consensus regarding hemi-spheric dominance (Mattingley et al., 1997; Rasmjou et al., 1999),whereas a previous VEP study of attention and IC processesrevealed simultaneous and symmetric effects for both left andright visual field presentations (Brandeis and Lehmann, 1989).The asymmetric IC effect after central presentations may reflecta relatively greater contribution of global processing in perceiv-ing Kanizsa-type IC shapes. Recent reports describe a similarasymmetry during perceptual closure of fragmented images(Wasserstein et al., 1984; Doniger et al., 2001) as well as whenselective attention to global versus local features of a stimulusarray was manipulated directly (Fink et al., 1997; Heinze et al.,1998; Han et al., 2000a,b). It may instead be the case that globalprocesses predominate in early perceptual processing precedingIC sensitivity (Navon, 1977; Sekuler, 1994). The configurationeffect described in experiment 4 supports this postulation in so faras this early VEP modulation is sensitive to the overall, globaldistribution of inducer elements in the visual field, rather than totheir number or IC presence (Fig. 8, Table 1). It is critical to notethat despite its magnitude asymmetry, the onset of the IC effectoccurs simultaneously over left and right hemispheres (whenstimuli appear centrally), suggesting that both hemispheres per-form IC completion processes in parallel, even if potentiallyperforming different types of scene analysis.
Models of IC processingAlthough an extensive review of existing models is beyond thescope of this study (Mendola, 2002), the present study endorsessome modifications and highlights the importance of temporalinformation in modeling brain processes (Schroeder et al., 1998,2001; Martinez et al., 1999). This study temporally and spatiallydissociated several VEP modulations in response to Kanizsa-typeIC shapes. At 66–86 msec the configuration effect appears totrack the extent of inducers in the visual field. This modulation,focused over central parieto–occipital scalp, is insensitive to ICpresence. In contrast, the IC effect (88–100 msec), focused overlateral–occipital scalp sites, is sensitive to IC presence indepen-dently of inducer extent. However, this later modulation is de-pendent on the retinotopic position of IC shapes, and its onsetshifts 120 msec later with inducers confined within a hemifield.The timing of these modulations with respect to the onset of thevisual cortical response supports the view that IC sensitivity asdescribed previously in areas V2 and V1 may reflect modulationcaused by feedback inputs from higher-tier visual areas. Thepresent data thus support a three-phase model of IC processingwherein dorsal stream regions, mediating the configuration effect,establish a coarse global representation of object space thatguides the subsequent IC effect in LOC areas of the ventralstream (Schroeder et al., 1998; Vidyasagar, 1999), in turn provok-ing feedback to lower-tier areas (e.g., V2 and V1).
Although this study highlights the importance of feedbackmodulations for IC sensitivity in lower-tier areas, the role ofhorizontal inputs should not be disregarded (Das and Gilbert,1999; Mendola, 2002). In fact, our proposition of dorsal streamguidance of subsequent ventral stream IC processing is supportedby the finding that the initial activity in ventral stream areas isconsistent with lateral (vs feedforward) inputs, perhaps fromdorsal stream areas (Schroeder et al., 1998). Likewise, severallaboratories have reported dorsal versus ventral stream latencyadvantages in both monkeys (Nowak and Bullier, 1997;
Murray et al. • Dynamics of Illusory Contour Processing J. Neurosci., June 15, 2002, 22(12):5055–5073 5069

Schmolesky et al., 1998; Schroeder et al., 1998; Mehta et al.,2000a) and humans (Foxe and Simpson, 2002).
Existing models provide a context for the scene analyses in-dexed by the configuration effect by proposing that interpolation/perceptual organization processes precede IC formation (Gross-berg and Mingolla, 1985; Dresp and Bonnet, 1993; Heitger andvon der Heydt, 1993; Gegenfurtner et al., 1997). Such processesmay highlight regions of the visual field and guide, from a coarseto fine scale, subsequent object recognition processes (Marr,1982; Grossberg and Mingolla, 1985; Dresp, 1993; Dresp andBonnet, 1993; Vidyasagar, 1999). The spatial extent of the induc-ers, regardless of whether an IC shape is ultimately perceived,would demarcate a subregion where objects may be present.Models of perceptual grouping and selective attention similarlypropose that visual space is preattentively segmented accordingto Gestalt principles and subsequently analyzed under the direc-tion of focal attention (Neisser, 1967; Treisman and Gelade, 1980;Treisman, 1982; Treisman and Schmidt, 1982). Studies of atten-tion (Foxe et al., 1998; Heinze et al., 1998; Worden et al., 2000)and patients with neglect or extinction (for review, see Driver andVuilleumier, 2001) suggest that dorsal stream regions may servesuch a visuospatial segmentation function, although such regionsmay not be critical for IC sensitivity (Vuilleumier and Landis,1998; Olk et al., 2001; Vuilleumier et al., 2001). The configurationeffect and IC effect of this study are consistent with such models.In addition, the EEG/fMRI co-registration results of experiment2 would indicate that parietal areas play a role in efficient ICprocessing (Grill-Spector et al., 1998a,b; Mendola et al., 1999;Sugio et al., 1999).
The IC effect and feature bindingSeveral models of object recognition and figure/ground segrega-tion include synchronized neuronal activity as a mechanism forfeature binding (for review, see Tallon-Baudry and Bertrand,1999; Engel and Singer, 2001). An increase in induced � band(30–50 Hz) activity is generally observed when comparing ICpresence versus absence (Tallon-Baudry et al., 1996, 1997; Her-mann et al., 1999; Csibra et al., 2000; Hermann and Bosch, 2001).Some interpret this and similar results as evidence for bottom-upbinding of coherent visual features (Tallon-Baudry et al., 1996,1997; Elliott and Muller, 1998; Tallon-Baudry and Bertrand,1999; Elliott et al., 2000). Others suggest that such oscillationsindex higher-order processes such as attention (Pulvermuller etal., 1997; Csibra et al., 2000) or target selection (Hermann et al.,1999). Likewise, there is little consensus on either the timing orsource(s) of these oscillations. Some report only late (�280 msec)induced oscillations (Tallon-Baudry et al., 1996, 1997; Tallon-Baudry and Bertrand, 1999; Csibra et al., 2000), whereas othersalso observed earlier (�150 msec) phase-locked effects (Hermannet al., 1999). Moreover, in the studies of Tallon-Baudry et al.(1996, 1997) and Tallon-Baudry and Bertrand (1999), effects werefocused over central–posterior scalp sites, whereas Hermann etal. (1999) and Csibra et al. (2000) observed their effects frontally.
The timing of the present IC effect challenges previous claimsthat � oscillations represent bottom-up feature binding (Tallon-Baudry et al., 1996, 1997). In these earlier studies, no differentialIC response in the early (�200 msec) VEP was reported, whereaswe observed early broadband VEP modulations over the lateral–occipital scalp considerably earlier. The IC effect not only pre-cedes induced �-band activity described in previous studies by
�200 msec (Tallon-Baudry et al., 1996, 1997), but it is alsoconsistent with our previous results describing the time course ofvisuospatial neural response interactions between stimuli in dif-ferent quadrants (Murray et al., 2001). Resolving the timing andfunctional role of � oscillations with regard to object representa-tion and visual scene analysis will require further experimenta-tion. However, the current data set makes it clear that broadbandVEP modulations precede oscillatory effects, suggesting thatthese oscillations index a later processing stage.
REFERENCESAlbert MK, Hoffman DD (2000) The generic-viewpoint assumption and
illusory contours. Perception 29:303–312.American Electroencephalographic Society (1991) Guidelines for stan-
dard electrode position nomenclature. J Clin Neurophysiol 8:200–202.Atchley RA, Atchley P (1998) Hemispheric specialization in the detec-
tion of subjective objects. Neuropsychologia 36:1373–1386.Bakin JS, Nakayama K, Gilbert CD (2000) Visual responses in monkey
areas V1 and V2 to three-dimensional surface configurations. J Neu-rosci 20:8188–8198.
Banich MT, Belger A (1990) Interhemispheric interaction: how do thehemispheres divide and conquer a task? Cortex 26:77–94.
Baumann R, van der Zwan R, Peterhans E (1997) Figure-ground segre-gation at contours: a neural mechanism in the visual cortex of the alertmonkey. Eur J Neurosci 9:1290–1303.
Bonmassar G, Schwartz DP, Liu AK, Kwong KK, Dale AM, BelliveauJW (2001) Spatiotemporal brain imaging of visual-evoked activity us-ing interleaved EEG and fMRI recordings. NeuroImage 13:1035–1043.
Brandeis D, Lehmann D (1989) Segments of event-related potentialmap series reveal landscape changes with visual attention and subjec-tive contours. Electroencephalogr Clin Neurophysiol 73:507–519.
Clarke S, Miklossy J (1990) Occipital cortex in man: organization ofcallosal connections, related myelo- and cytoarchitecture, and putativeboundaries of functional visual areas. J Comp Neurol 298:188–214.
Clark VP, Fan S, Hillyard SA (1995) Identification of early visualevoked potential generators by retinotopic and topographic analyses.Hum Brain Mapp 2:170–187.
Corballis PM, Fendrich R, Shapley RM, Gazzaniga MS (1999) Illusorycontour perception and amodal boundary completion: evidence of adissociation following callosotomy. J Cogn Neurosci 11:459–466.
Csibra G, Davis G, Spratling MW, Johnson MH (2000) Gamma oscil-lations and object processing in the infant brain. Science 290:1582–1585.
Dale AM, Halgren E (2001) Spatiotemporal mapping of brain activity byintegration of multiple imaging modalities. Curr Opin Neurobiol11:202–208.
Das A, Gilbert CD (1999) Topography of contextual modulations medi-ated by short-range interactions in primary visual cortex. Nature399:655–661.
De Weerd P, Desimone R, Ungerleider LG (1996) Cue-dependent def-icits in grating orientation discrimination after V4 lesions in macaques.Vis Neurosci 13:529–538.
Doniger GM, Foxe JJ, Murray MM, Higgins BA, Snodgrass JG, Schroe-der CE, Javitt DC (2000) Activation timecourse of ventral visualstream object-recognition areas: high-density electrical mapping ofperceptual closure processes. J Cogn Neurosci 12:615–621.
Doniger GM, Foxe JJ, Schroeder CE, Murray MM, Higgins BA, JavittDC (2001) Visual perceptual learning in human object recognitionareas: a repetition priming study using high-density electrical mapping.NeuroImage 13:305–313.
Dresp B (1993) Bright lines and edges facilitate the detection of smalllight targets. Spat Vis 7:213–225.
Dresp B, Bonnet C (1993) Psychophysical measures of illusory formperception: further evidence for local mechanisms. Vision Res33:759–766.
Dresp B, Grossberg S (1997) Contour integration across polarities andspatial gaps: from local contrast filtering to global grouping. Vision Res37:913–924.
Driver J, Vuilleumier P (2001) Perceptual awareness and its loss inunilateral neglect and extinction. Cognition 79:39–88.
Elliott M, Muller H (1998) Synchronous information presented in 40 Hzflicker enhances visual feature binding. Psychol Sci 9:277–283.
Elliott M, Herrmann CS, Mecklinger A, Muller HJ (2000) The loci ofoscillatory visual-object priming: a combined electroencephalographicand reaction-time study. Int J Psychophysiol 38:225–241.
Engel AK, Singer W (2001) Temporal binding and the neural correlatesof sensory awareness. Trends Cogn Sci 5:16–25.
Eriksen CW, Yeh Y (1985) Allocation of attention in the visual field. JExp Psychol Hum Percept Perform 11:583–597.
Felleman DJ, Van Essen DC (1991) Distributed hierarchical processingin the primate cerebral cortex. Cereb Cortex 1:1–47.
5070 J. Neurosci., June 15, 2002, 22(12):5055–5073 Murray et al. • Dynamics of Illusory Contour Processing

ffytche DH, Zeki S (1996) Brain activity related to the perception ofillusory contours. NeuroImage 3:104–108.
Fink GR, Hallisan PW, Marshall JC, Frith CD, Frackowiak RS, Dolan RJ(1997) Neural mechanisms involved in the processing of global andlocal aspects of hierarchically organized visual stimuli. Brain120:1779–1791.
Foxe JJ, Simpson GV (2002) Timecourse of activation flow from V1 tofrontal cortex in humans: a framework for defining “early” visualprocessing. Exp Brain Res 142:139–150.
Foxe JJ, Simpson GV, Ahlfors SP (1998) Parieto–occipital �10 Hzactivity reflects anticipatory state of visual attention mechanisms. Neu-roReport 9:3929–3933.
Freeman JA, Nicholson C (1975) Experimental optimization of cur-rent source-density technique for anuran cerebellum. J Neurophysiol38:369 –382.
Fuchs M, Drenckhahn R, Wischmann HA, Wagner M (1998) An im-proved boundary element method for realistic volume-conductor mod-eling. IEEE Trans Biomed Eng 45:980–997.
Gegenfurtner KR, Brown JE, Rieger J (1997) Interpolation processes inthe perception of real and illusory contours. Perception 26:1445–1458.
Gilbert CD (1983) Microcircuitry of the visual cortex. Annu Rev Neu-rosci 6:217–247.
Gilbert CD, Das A, Ito M, Kapadia M, Westheimer G (1996) Spatialintegration and cortical dynamics. Proc Natl Acad Sci USA 93:615–622.
Givre SJ, Schroeder CE, Arezzo JC (1994) Contribution of extrastriatearea V4 to the surface-recorded flash VEP in the awake macaque.Vision Res 34:415–428.
Grill-Spector K, Kushnir T, Edelman S, Itzchak Y, Malach R (1998a)Cue-invariant activation in object recognition areas of the humanoccipital lobe. Neuron 21:191–202.
Grill-Spector K, Kushnir T, Hendler T, Edelman S, Itzchak Y, Malach R(1998b) A sequence of object-processing stages revealed by fMRI inthe human occipital lobe. Hum Brain Mapp 6:316–328.
Grosof DH, Shapley RM, Hawken MJ (1993) Macaque V1 neurons cansignal “illusory” contours. Nature 365:550–552.
Gross CG, Rocha-Miranda CE, Bender DB (1972) Visual properties ofneurons in inferotemporal cortex of the macaque. J Neurophysiol35:96–111.
Grossberg S, Mingolla E (1985) Neural dynamics of form perception:boundary completion, illusory figures, and neon color spreading. Psy-chol Rev 92:173–211.
Guthrie D, Buchwald JS (1991) Significance testing of difference poten-tials. Psychophysiology 28:240–244.
Han S, He X, Woods DL (2000a) Hierarchical processing and level-repetition effect as indexed by early brain potentials. Psychophysiology37:817–830.
Han S, Liu W, Yund EW, Woods DL (2000b) Interactions betweenspatial attention and global / local feature selection: an ERP study.NeuroReport 11:2753–2757.
Heider B, Meskenaite V, Peterhans E (2000) Anatomy and physiology ofa neural mechanism defining depth order and contrast polarity atillusory contours. Eur J Neurosci 12:4117–4130.
Heinze HJ, Hinrichs H, Scholz M, Burchert W, Mangun GR (1998)Neural mechanisms of global and local processing: a combined PETand ERP study. J Cogn Neurosci 10:485–498.
Heitger F, von der Heydt R (1993) A computational model of neuralcontour processing: figure ground segregation and illusory contours. In:Proceedings of the Fourth International Conference on ComputerVision, pp 32–40. Los Alamitos, CA.
Hermann CS, Bosch V (2001) Gestalt perception modulates early visualprocessing. NeuroReport 12:901–904.
Hermann CS, Mecklinger A, Pfeifer E (1999) Gamma responses andERPs in a visual classification task. Clin Neurophysiol 110:636–642.
Hirsch J, DeLaPaz RL, Relkin NR, Victor J, Kim K, Li T, Borden P,Rubin N, Shapley R (1995) Illusory contours activate specific regionsin human visual cortex: evidence from functional magnetic resonanceimaging. Proc Natl Acad Sci USA 92:6469–6473.
Huiskamp G (1991) Difference formulas for the surface Laplacian on atriangulated surface. J Comput Physics 95:477–496.
Humphreys GW, Cinel C, Wolfe J, Olson A, Klempen N (2000) Frac-tionating the binding process: neuropsychological evidence distinguish-ing binding of form from binding of surface features. Vision Res40:1569–1596.
Hupe JM, James AC, Payne BR, Lomber SG, Girard P, Bullier J (1998)Cortical feedback improves discrimination between figure and back-ground by V1, V2 and V3 neurons. Nature 394:784–787.
Huxlin KR, Merigan WH (1998) Deficits in complex visual perceptionfollowing unilateral temporal lobectomy. J Cogn Neurosci 10:395–407.
Huxlin KR, Saunders RC, Marchionini D, Pham HA, Merigan WH(2000) Perceptual deficits after lesions of inferotemporal cortex inmacaques. Cereb Cortex 10:671–683.
Ishai A, Ungerleider LG, Martin A, Schouten JL, Haxby JV (1999)Distributed representation of objects in the human ventral visual path-way. Proc Natl Acad Sci USA 96:9379–9384.
Ito M, Tamura H, Fujita I, Tanaka K (1995) Size and position invariance
of neuronal responses in monkey inferotemporal cortex. J Neurophysiol73:218–226.
Juttner M, Rentschler I (2000) Scale-invariant superiority of foveal vi-sion in perceptual categorization. Eur J Neurosci 12:353–359.
Kanizsa G (1976) Subjective contours. Sci Am 234:48–52.Kapadia MK, Ito M, Gilbert CD, Westheimer G (1995) Improvement in
visual sensitivity by changes in local context: parallel studies in humanobservers and in V1 of alert monkey. Neuron 15:843–856.
Kapadia MK, Westheimer G, Gilbert CD (1999) Dynamics of spatialsummation in primary visual cortex of alert monkeys. Proc Natl AcadSci USA 96:12073–12078.
Kobatake E, Tanaka K (1994) Neuronal selectivities to complex objectfeatures in the ventral visual pathway of the macaque cerebral cortex.J Neurophysiol 71:856–867.
Korshunova SG (1999) Visual evoked potentials induced by illusory out-lines (Kanizsa’s square). Neurosci Behav Phsyiol 29:695–701.
Kourtzi Z, Kanwisher N (2000) Cortical regions involved in perceivingobject shape. J Neurosci 20:3310–3318.
Kwong K, Belliveau J, Chessler D, Goldberg I, Weisskoff R, Poncelet B,Kennedy D, Hoppel B, Cohen M, Turner R, Cheng H-M, Brady T,Rosen B (1992) Dynamic magnetic resonance imaging of human brainactivity. Proc Natl Acad Sci USA 89:5675–5679.
Lamme VA (1995) The neurophysiology of figure-ground segregation inprimary visual cortex. J Neurosci 15:1605–1615.
Lamme VA, Roelfsema PR (2000) The distinct modes of vision offeredby feedforward and recurrent processing. Trends Neurosci 23:571–579.
Lamme VA, Spekreijse H (2000) Modulations of primary visual cortexactivity representing attentive and conscious scene perception. FrontBiosci 5:D232–D243.
Lamme VA, Super H, Spekreijse H (1998a) Feedforward, horizontal,and feedback processing in the visual cortex. Curr Opin Neurobiol8:529–535.
Lamme VA, Zipser K, Spekreijse H (1998b) Figure-ground activity inprimary visual cortex is suppressed by anesthesia. Proc Natl Acad SciUSA 95:3263–3268.
Lamme VA, Rodriguez-Rodriguez V, Spekreijse H (1999) Separate pro-cessing dynamics for texture elements, boundaries and surfaces inprimary visual cortex of the macaque monkey. Cereb Cortex9:406–413.
Larsson J, Amunts K, Gulyas B, Malikovic A, Zilles K, Roland PE(1999) Neuronal correlates of real and illusory contour perception:functional anatomy with PET. Eur J Neurosci 11:4024–4036.
Lee TS, Nguyen M (2001) Dynamics of subjective contour formation inthe early visual cortex. Proc Natl Acad Sci USA 98:1907–1911.
Leventhal AG, Wang Y, Schmolesky MT, Zhou Y (1998) Neural corre-lates of boundary perception. Vis Neurosci 15:1107–1118.
Logothetis NK, Pauls J, Augath M, Trinath T, Oeltermann A (2001)Neurophysiological investigation of the basis of the fMRI signal. Nature412:150–157.
Lueschow A, Miller EK, Desimone R (1994) Inferior temporal mecha-nisms for invariant object recognition. Cereb Cortex 4:523–531.
Malach R, Reppas JB, Benson RR, Kwong KK, Jiang H, Kennedy WA,Ledden PJ, Brady TL, Rosen BR, Tootell RB (1995) Object-relatedactivity revealed by functional magnetic resonance imaging in humanoccipital cortex. Proc Natl Acad Sci USA 92:8135–8139.
Marr D (1982) Vision. San Francisco: Freeman.Martinez A, Anllo-Vento L, Sereno MI, Frank LR, Buxton RB, Dubo-
witz DJ, Wong EC, Hinrichs H, Heinze HJ, Hillyard SA (1999) In-volvement of striate and extrastriate visual cortical areas in spatialattention. Nat Neurosci 2:364–369.
Mattingley JB, Davis G, Driver J (1997) Preattentive filling-in of visualsurfaces in parietal extinction. Science 275:671–674.
Maunsell JH, Gibson JR (1992) Visual response latencies in striate cor-tex of the macaque monkey. J Neurophysiol 68:1332–1344.
Maunsell JHR, Van Essen DC (1983) Functional properties of neuronsin middle temporal visual area (MT) of macaque monkey. I. Selectivityfor stimulus direction, velocity, and orientation. J Neurophysiol49:1127–1147.
Mehta AD, Ulbert I, Schroeder CE (2000a) Intermodal selective atten-tion in monkeys. I. Distribution and timing of effects across visual areas.Cereb Cortex 10:343–358.
Mehta AD, Ulbert I, Schroeder CE (2000b) Intermodal selective atten-tion in monkeys. II. Physiological mechanisms of modulation. CerebCortex 10:359–370.
Mendola JD (2002) Functional neuroimaging of contour representationin human visual cortex: beginning to fill-in the blanks. In: Filling-in:from perceptual completion to skill learning (De Weerd P, Pessoa L,eds). Oxford: Oxford UP, in press.
Mendola JD, Dale AM, Fischl B, Liu AK, Tootell RBH (1999) Therepresentation of illusory and real contours in human cortical visualareas revealed by functional magnetic resonance imaging. J Neurosci19:8560–8572.
Merigan WH (1996) Basic visual capacities and shape discriminationafter lesions of extrastriate area V4 in macaques. Vis Neurosci13:51–60.
Murray et al. • Dynamics of Illusory Contour Processing J. Neurosci., June 15, 2002, 22(12):5055–5073 5071

Mitzdorf U (1991) Physiological sources of evoked potentials. Electro-encephalogr Clin Neurophysiol [Suppl] 42:47–57.
Mohr B, Pulvermuller F, Rayman J, Zaidel E (1994) Interhemisphericcooperation during lexical processing is mediated by the corpus callo-sum: evidence from the split-brain. Neurosci Lett 181:17–21.
Molholm S, Ritter W, Murray MM, Javitt DC, Schroeder CE, Foxe JJ(2002) Multisensory auditory-visual interactions during early sensoryprocessing in humans: a high-density electrical mapping study. CognitBrain Res 14:121–134.
Moscovitch C, Kapur S, Kohler S, Houle S (1995) Distinct neural cor-relates of visual long-term memory for spatial location and objectidentity: a positron emission tomography study in humans. Proc NatlAcad Sci USA 92:3721–3725.
Murray MM, Higgins BA, Dias EC, Javitt DC, Schroeder CE, Foxe JJ(2000) Neural sensitivity to illusory contours occurs first in higher-tierlateral-occipital areas of the human. Soc Neurosci Abstr 26:952.
Murray MM, Foxe JJ, Higgins BA, Javitt DC, Schroeder CE (2001)Visuo-spatial neural response interactions in early visual cortical pro-cessing during a simple reaction time task: a high-density electricalmapping study. Neuropsychologia 39:828–844.
Navon D (1977) Forest before trees: the precedence of global features invisual perception. Cogn Psychol 9:353–383.
Neisser U (1967) Cognitive psychology. New York: Appleton-Century-Crofts.
Nieder A, Wagner H (1999) Perception and neuronal coding of subjec-tive contours in the owl. Nat Neurosci 2:660–663.
Nowak L, Bullier J (1997) The timing of information transfer in thevisual system. In: Cerebral cortex (Kaas JH, Rockland K, Peters A,eds) pp 204–241. New York: Plenum.
Ogawa S, Tank DW, Menon R, Ellermann JM, Kim SG, Merle H,Ugurbil K (1992) Intrinsic signal changes accompanying sensory stim-ulation: functional brain mapping with magnetic resonance imaging.Proc Natl Acad Sci USA 89:5951–5955.
Oldfield RC (1971) The assessment and analysis of handedness: theEdinburgh inventory. Neuropsychologia 9:97–113.
Olk B, Harvey M, Dow L, Murphy PJS (2001) Illusion processing inhemispatial neglect. Neuropsychologia 39:611–625.
Peterhans E, Heitger F (2001) Simulation of neuronal responses definingdepth order and contrast polarity at illusory contours in monkey areaV2. J Comput Neurosci 10:195–211.
Peterhans E, von der Heydt R (1989) Mechanisms of contour perceptionin monkey visual cortex. II. Contours bridging gaps. J Neurosci9:1749–1763.
Petry S, Meyer GE (1987) The perception of illusory contours. NewYork: Springer.
Popovic Z, Sjostrand J (2001) Resolution, separation of retinal ganglioncells, and cortical magnification in humans. Vision Res 41:1313–1319.
Prazdny K (1983) Illusory contours are not caused by simultaneousbrightness contrast. Percept Psychophys 34:403–404.
Prazdny K (1986) Illusory contours from inducers defined solely byspatiotemporal correlation. Percept Psychophys 39:175–178.
Pulvermuller F, Birbaumer N, Lutzenberger W, Mohr B (1997) High-frequency brain activity: its possible role in attention, perception andlanguage processing. Prog Neurobiol 52:427–445.
Ramsden BM, Hung CP, Roe AW (2001) Real and illusory contourprocessing in area V1 of the primate: a cortical balancing act. CerebCortex 11:648–665.
Rasmjou S, Hausmann M, Gunturkun O (1999) Hemispheric dominanceand gender in the perception of an illusion. Neuropsychologia37:1041–1047.
Redies C, Crook JM, Creutzfeldt OD (1986) Neuronal responses toborders with and without luminance gradients in cat visual cortex anddorsal lateral geniculate nucleus. Exp Brain Res 61:469–481.
Ringach DL, Shapley R (1996) Spatial and temporal properties of illu-sory contours and amodal boundary completion. Vision Res36:3037–3050.
Ritter W, Simson R, Vaughan Jr HG, Macht M (1982) Manipulation ofevent-related potential manifestations of information processing stages.Science 218:909–911.
Robertson LC, Lamb MR, Knight RT (1988) Effects of lesions oftemporal-parietal junction on perceptual and attentional processing inhumans. J Neurosci 8:3757–3769.
Rockland KS, Pandya DN (1979) Laminar origins and terminations ofcortical connections of the occipital lobe in the rhesus monkey. BrainRes 179:3–20.
Rubin N, Nakayama K, Shapley R (1996) Enhanced perception of illu-sory contours in the lower versus upper visual hemifields. Science271:651–653.
Sary G, Vogels R, Orban GA (1993) Cue-invariant shape selectivity ofmacaque inferior temporal neurons. Science 260:995–997.
Scherg M, Picton TW (1990) Separation and identification of event-related potential components by brain electrical source analysis. Elec-troencephalogr Clin Neurophysiol [Suppl] 42:24–37.
Schmolesky MT, Wang Y, Hanes DP, Thompson KG, Leutgeb S, Schall
JD, Leventhal AG (1998) Signal timing across the macaque visualsystem. J Neurophysiol 79:3272–3278.
Schroeder CE, Steinschneider M, Javitt DC, Tenke CE, Givre SJ, MehtaAD, Simpson GV, Arezzo JC, Vaughan Jr HG (1995) Localization ofERP generators and identification of underlying neural processes. Elec-troencephalogr Clin Neurophysiol [Suppl] 44:55–75.
Schroeder CE, Mehta AD, Givre SJ (1998) A spatiotemporal profile ofvisual system activation revealed by current source density analysis inthe awake macaque. Cereb Cortex 8:575–592.
Schroeder CE, Mehta AD, Foxe JJ (2001) Determinants and mecha-nisms of attentional modulation of neural processing. Front Biosci6:672–684.
Seghier M, Dojat M, Delon-Martin C, Rubin C, Warnking J, Segebarth C,Bullier J (2000) Moving illusory contours activate primary visual cor-tex: an fMRI study. Cereb Cortex 10:663–670.
Sekuler AB (1994) Local and global minima in visual completion: effectsof symmetry and orientation. Perception 23:529–545.
Shapley R, Gordon J (1985) Nonlinearity in the perception of form.Percept Psychophys 37:84–88.
Sheth BR, Sharma J, Rao SC, Sur M (1996) Orientation maps of sub-jective contours in visual cortex. Science 274:2110–2115.
Sibson NR, Dhankhar A, Mason GR, Rothman DL, Behar KL, ShulmanRG (1998) Stoichiometric coupling of brain glucose metabolism andglutamatergic neuronal activity. Proc Natl Acad Sci USA 95:316–321.
Simpson GV, Foxe JJ, Vaughan Jr HG, Mehta AD, Schroeder CE(1995a) Integration of electrophysiological source analyses, MRI andanimal models in the study of visual processing and attention. Electro-encephalogr Clin Neurophysiol [Suppl] 44:76–92.
Simpson GV, Pfleiger ME, Foxe JJ, Ahlfors SP, Vaughan Jr HG, HrabeJ, I lmoniemi RJ, Lantos G (1995b) Dynamic neuroimaging of brainfunction. J Clin Neurophysiol 12:1–18.
Spehar B (2000) Degraded illusory contour formation with non-uniforminducers in Kanizsa configurations: the role of contrast polarity. VisionRes 40:2653–2659.
Spillmann L, Werner JS (1996) Long-range interactions in visual per-ception. Trends Neurosci 19:428–434.
Stoffer TH (1994) Attentional zooming and the global-dominance phe-nomenon: effect of level-specific cueing and abrupt visual onset. PsycholRes 56:83–89.
Sugawara M, Morotomi T (1991) Visual evoked potentials elicited bysubjective contour figures. Scand J Psychol 32:352–357.
Sugio T, Inui T, Matsuo K, Matsuzawa M, Glover GH, Nakai T (1999)The role of the posterior parietal cortex in human object recogni-tion: a functional magnetic resonance imaging study. Neurosci Lett276:45– 48.
Tallon-Baudry C, Bertrand O (1999) Oscillatory gamma activity in hu-mans and its role in object representation. Trends Cogn Sci 3:151–162.
Tallon-Baudry C, Bertrand O, Delpuech C, Pernier J (1996) Stimulusspecificity of phase-locked and non-phase-locked 40 Hz visual re-sponses in human. J Neurosci 16:4240–4249.
Tallon-Baudry C, Bertrand O, Wienbruch C, Ross B, Pantev C (1997)Combined EEG and MEG recordings of visual 40Hz responses toillusory triangles in human. NeuroReport 8:1103–1107.
Tootell RB, Switkes E, Silverman MS, Hamilton SL (1988) Functionalanatomy of macaque striate cortex. II. Retinotopic organization. J Neu-rosci 8:1531–1568.
Tootell RBH, Mendola JD, Hadjikhani NK, Liu AK, Dale AM (1998)The representation of the ipsilateral visual field in human cerebralcortex. Proc Natl Acad Sci USA 95:818–824.
Treisman A (1982) Perceptual grouping and attention in visual searchfor features and for objects. J Exp Psychol Hum Percept Perform8:194–214.
Treisman AM, Gelade G (1980) A feature-integration theory of atten-tion. Cogn Psychol 12:97–136.
Treisman A, Schmidt H (1982) Illusory conjunctions in the perceptionof objects. Cogn Psychol 14:107–141.
Tulving E, Schacter DL (1990) Priming and human memory systems.Science 247:301–306.
Urbano A, Babiloni C, Onorati P, Babiloni F (1996) Human corticalactivity related to unilateral movements: a high resolution EEG study.NeuroReport 8:203–206.
Van Essen DC, Newsome WT, Bixby JL (1982) The pattern of inter-hemispheric connections and its relationship to extrastriate visual areasin the macaque monkey. J Neurosci 2:265–283.
Van Essen DC, Anderson CH, Olshausen BA (1994) Dynamic routingstrategies in sensory, motor, and cognitive processing. In: Large-scaleneuronal theories of the train (Koch C, Davis JL, eds), pp. 271–299.Cambridge, MA: MIT.
Vanni S, Revonsuo A, Saarinen J, Hari R (1996) Visual awareness ofobjects correlates with activity of right occipital cortex. NeuroReport8:183–186.
5072 J. Neurosci., June 15, 2002, 22(12):5055–5073 Murray et al. • Dynamics of Illusory Contour Processing

Victor JD, Conte MM (1998) Quantitative study of effects of inducerasynchrony on illusory contour strength. Invest Ophthalmol Vis Sci39:S206.
Vidyasagar TR (1999) A neuronal model of attentional spotlight: pari-etal guiding the temporal. Brain Res Brain Res Rev 30:66–76.
von der Heydt R, Peterhans E (1989) Mechanisms of contour perceptionin monkey visual cortex. I. Lines of pattern discontinuity. J Neurosci9:1731–1748.
von der Heydt R, Peterhans E, Baumgartner G (1984) Illusory contoursand cortical neuron responses. Science 224:1260–1262.
Vuilleumier P, Landis T (1998) Illusory contours and spatial neglect.NeuroReport 9:2481–2484.
Vuilleumier P, Valenza N, Landis T (2001) Explicit and implicit percep-tion of illusory contours in unilateral spatial neglect: behavioural and
anatomical correlates of preattentive grouping mechanisms. Neuropsy-chologia 39:597–610.
Ware C (1981) Subjective contours independent of subjective brightness.Percept Psychophys 29:500–504.
Wasserstein J, Zappulla R, Rosen J, Gerstman L (1984) Evidence fordifferentiation of right hemisphere visual-perceptual functions. BrainCogn 3:51–56.
Worden MS, Foxe JJ, Wang N, Simpson GV (2000) Anticipatory biasingof visuospatial attention indexed by retinotopically specific �-bandelectroencephalography increases over occipital cortex. J Neurosci20:RC63(1–6).
Zhou H, Friedman HS, von der Heydt R (2000) Coding of borderownership in monkey visual cortex. J Neurosci 20:6594–6611.
Zipser K, Lamme VA, Schiller PH (1996) Contextual modulation inprimary visual cortex. J Neurosci 16:7376–7389.
Murray et al. • Dynamics of Illusory Contour Processing J. Neurosci., June 15, 2002, 22(12):5055–5073 5073
Related Documents