Accepted Manuscript The Solid Electrolyte Interphase a key parameter of the high performance of Sb in sodium-ion batteries: Comparative X-ray Photoelectron Spectroscopy study of Sb/Na- ion and Sb/Li-ion batteries Lucille Bodenes, Ali Darwiche, Laure Monconduit, Hervé Martinez PII: S0378-7753(14)01445-1 DOI: 10.1016/j.jpowsour.2014.09.037 Reference: POWER 19767 To appear in: Journal of Power Sources Received Date: 22 July 2014 Revised Date: 26 August 2014 Accepted Date: 7 September 2014 Please cite this article as: L. Bodenes, A. Darwiche, L. Monconduit, H. Martinez, The Solid Electrolyte Interphase a key parameter of the high performance of Sb in sodium-ion batteries: Comparative X- ray Photoelectron Spectroscopy study of Sb/Na-ion and Sb/Li-ion batteries, Journal of Power Sources (2014), doi: 10.1016/j.jpowsour.2014.09.037. This is a PDF file of an unedited manuscript that has been accepted for publication. As a service to our customers we are providing this early version of the manuscript. The manuscript will undergo copyediting, typesetting, and review of the resulting proof before it is published in its final form. Please note that during the production process errors may be discovered which could affect the content, and all legal disclaimers that apply to the journal pertain.

Welcome message from author
This document is posted to help you gain knowledge. Please leave a comment to let me know what you think about it! Share it to your friends and learn new things together.
Transcript
Accepted Manuscript
The Solid Electrolyte Interphase a key parameter of the high performance of Sb insodium-ion batteries: Comparative X-ray Photoelectron Spectroscopy study of Sb/Na-ion and Sb/Li-ion batteries
Lucille Bodenes, Ali Darwiche, Laure Monconduit, Hervé Martinez
PII: S0378-7753(14)01445-1
DOI: 10.1016/j.jpowsour.2014.09.037
Reference: POWER 19767
To appear in: Journal of Power Sources
Received Date: 22 July 2014
Revised Date: 26 August 2014
Accepted Date: 7 September 2014
Please cite this article as: L. Bodenes, A. Darwiche, L. Monconduit, H. Martinez, The Solid ElectrolyteInterphase a key parameter of the high performance of Sb in sodium-ion batteries: Comparative X-ray Photoelectron Spectroscopy study of Sb/Na-ion and Sb/Li-ion batteries, Journal of Power Sources(2014), doi: 10.1016/j.jpowsour.2014.09.037.
This is a PDF file of an unedited manuscript that has been accepted for publication. As a service toour customers we are providing this early version of the manuscript. The manuscript will undergocopyediting, typesetting, and review of the resulting proof before it is published in its final form. Pleasenote that during the production process errors may be discovered which could affect the content, and alllegal disclaimers that apply to the journal pertain.
MANUSCRIP
T
ACCEPTED
ACCEPTED MANUSCRIPT
1
The Solid Electrolyte Interphase a key parameter of the high performance of Sb in
sodium-ion batteries: Comparative X-ray Photoelectron Spectroscopy study of Sb/Na-
ion and Sb/Li-ion batteries.
Lucille Bodenes b, Ali Darwiche a,c, Laure Monconduit a,c, Hervé Martinez b,c*
a ICG-AIME, Bat 15, cc 15-02 Université Montpellier 2, Pl. E. Bataillon, 34095 Montpellier
cedex
b IPREM-ECP CNRS UMR 5254, Université de Pau, Hélioparc Pau Pyrénées, 2 av. Pierre
Angot, 64053 Pau Cedex 9, France
c Réseau sur le Stockage Electrochimique de l’Energie (RS2E), CNRS FR3459, 33 Rue
Saint Leu, 80039 Amiens Cedex, France
*Corresponding author : MARTINEZ Hervé
e-mail : [email protected]
Tel: 33 5 59407599 Fax: 33 5 59407622
MANUSCRIP
T
ACCEPTED
ACCEPTED MANUSCRIPT
2
Abstract
To understand the origin of the better performance of Sb electrode i) vs Na than vs Li and
ii) formulated with CarboxyMethyl Cellulose (CMC) in water rather than with
PolyVinylidene diFluoride (PVdF) in N-Methyl-2-Pyrrolidone (NMP), X-ray Photoelectron
Spectroscopy (XPS) and electrochemical tests have been carried out to carefully investigate
the chemical composition of the SEI layer formed at the Sb electrode surface in the Li- and
Na-system, with the different binders. Sb electrodes were cycled using a standard
EC/PC/3DMC (1M LiPF6) electrolyte containing Vinylene Carbonate (VC) and
FluoroEthylene Carbonate (FEC) for Li system and a standard Propylene Carbonate PC (1M
NaClO4) electrolyte containing FEC for Na system. Surface analysis was performed by a
combined XPS core peaks and quantification data analysis to establish the main components
of the Solid Electrolyte Interphase film (SEI). The key observation is that the thickness of
the SEI layer is strongly related to the nature of the polymer binder used in the formulation
and that its chemical nature is different in Li and Na batteries. Much favorable SEI in the
case of Sb-CMC/Na seems to participate to the excellent performance of this electrode.
Key words: Sodium-ion batteries; Lithium-ion batteries; Antimony; Solid Electrolyte
Interphase; X-ray Photoelectron Spectroscopy; Binder.
MANUSCRIP
T
ACCEPTED
ACCEPTED MANUSCRIPT
3
I. Introduction
Rechargeable Li-ion batteries (LIBs) have been widely used for various portable
applications due to their high energy densities. [1] Recently, sodium (Na)-ion batteries
(NIBs) have attracted wide attention as an alternative to Li-ion batteries (LIBs) [2-7], in
particular for large-scale energy storage applications as perspective. Alloy-based materials
usually provided much higher gravimetric and volumetric specific capacities compared to
carbonaceous materials for LIBs and as recently demonstrated for NIBs as well. Although
high-capacity alloying anodes have undergone intensive development for LIBs, little
research has still been done for alloy-based anode materials for NIBs. For LIBs, the
difficulty to stabilize the capacity upon long cycling of alloy-based materials (Si, Sn, etc.)
has been attributed to the lithiation-/delithiation-induced volume change. Since the sodium
ion possesses a larger radius than the lithium ion, the effect of volume change upon
sodiation/desodiation should be even more severe for the application of alloy-based
materials in NIBs [8]. Thus, the development of stable alloy-based anode materials for NIBs
is expected to be more challenging than for LIBs [8, 9]. Despite this pessimistic projection,
few alloy-based materials [10-12], SnSb [13-15], Cu2Sb [16, 17], AlSb [18], FeSb2 [19] and
as well as metallic Sb or Sn oxides, Sb2O4 [20] have recently shown good performance for
NIBs [12, 15, 21, 22]. Among them antimony (Sb) appears to be the best candidate, since
even under micrometric powder form it can sustain over hundred cycles against Na a
capacity close to 600 mAh g−1 at a high rate with a good coulombic efficiency [23].
In LIBs, the cycling performance is strongly associated to the quality of the SEI layer, which
has been shown to be depended on the structural change of the active material during
MANUSCRIP
T
ACCEPTED
ACCEPTED MANUSCRIPT
4
cycling [24-27]. The latter is a very critical point in the case of conversion reactions, which
are interface driven and go through the continuous restructuration of the electrode material.
The same is true for the alloying reaction, for which the electrochemical grinding produces a
new exposed surface that might negatively interact with the electrolyte [23].
In NIBS, the higher value of the Na+/Na potential compared to Li+/Li is expected to reduce
electrolyte degradation at the surface of the electrode material. Up to now, there have been
limited fundamental explorations on the formation of the SEI layer for Na+ storage materials
[4, 21, 28]. Since the formation of SEI layer plays a crucial role in the cycling ability of the
electrode, it is very important to understand the mechanism which leads to its formation as
well as the composition of this layer.
Moreover in LIBs and in NIBs, the electrode formulation and the choice of the associated
binder are critical for the conductivity properties enhancement and further performances.
The most used polymers during the last few years are a combination of PolyVinylidene
Fluoride (PVdF) and N-MethylPyrrolidone (NMP) as solvent or a combination of
CarboxyMethyl Cellulose (CMC) in water as solvent. It has been reported that the good
electrochemical performance of metalloïds (Sb, P..) based negative electrode material in Li-
ion batteries are correlated with the formulation with the carboxymethyl cellulose binder
[29, 30].
To understand the reason of the best performance of Sb electrode against Na than against Li
and with CMC rather than with PVdF as binder we have decided to explore the SEI in these
different cases. In this study, X-ray Photoelectron Spectroscopy (XPS) and electrochemical
tests were carried out to carefully investigate the chemical composition of the SEI layer
MANUSCRIP
T
ACCEPTED
ACCEPTED MANUSCRIPT
5
formed at the Sb electrode surface in the Li- and Na-system with two different binders,
CMC and PVdF.
II. Experimental details
1. Preparation of the electrodes and electrochemical characterization
The electrochemical performances of Sb as negative electrode materials were examined in a
standard coin cells assembled in an argon-filled glove box. The micrometric powder of
antimony used in this study was provided by Alfa-Aesar (99.5% purity, ∼325 mesh), and
has been used without any additional treatment.
Electrode formulation was made using a mixture of carbon black and vapor ground carbon
fibers (VGCF-S) as conductive additive, and carboxymethyl cellulose (CMC) (DS = 0.7,
Mw = 250 000 Aldrich) for the formulation in water and polyvinylidene fluoride (PVDF) for
the formulation in N-Methyl-2-pyrrolidone (NMP), as the binder. A slurry containing 70 wt.
% active material, 12 wt. % binder and 18 wt. % conductive additive was homogeneously
mixed by a planetary ball-milling for 1 h, tape casted on a 150 µm thick copper foil, dried at
room temperature for 12 h and finally at 100 °C under vacuum for another 2 h. The final
mass loading of active material on the electrode was 2 mg cm-2.
The electrochemical tests vs Na or Li were performed against a counter-electrode of the
corresponding pure metal, using either 1 M NaClO4 in PC: 5%FEC or 1 M LiPF6 in EC: PC:
3DMC: 1% VC (vinylene carbonate) and 5 % FEC (FluoroEthylene Carbonate), as the
electrolyte, respectively. Whatman glass-fiber was used as separator. All tests were carried
out at room temperature (25 °C) using a multichannel VMP system under galvanostatic
mode from 0.02 to 1.5 V vs Li+/Li or vs Na+/Na at C/2 rate (i.e. 0.5 Li or Na in one hour).
MANUSCRIP
T
ACCEPTED
ACCEPTED MANUSCRIPT
6
For XPS analysis, the electrodes were recovered from the coin cell, washed with pure DMC
and dried under vacuum.
2. XPS
XPS measurements were carried out with a Thermo Scientific K-Alpha X-ray photoelectron
spectrometer, using a focused monochromatized Al Kα radiation (hν = 1486.6 eV). The XPS
spectrometer was directly connected through a glove box under argon atmosphere, in order
to avoid moisture/air exposure of the samples. For the Ag 3d5/2 line the full width at half-
maximum (FWHM) was 0.50 eV under the recording conditions. The X-ray spot size was
400 µm. Peaks were recorded with constant pass energy of 20 eV. The pressure in the
analysis chamber was less than 2 × 10⁻⁷ Pa. Short acquisition time spectra were recorded at
the beginning and at the end of each experiment to check that the samples did not suffer
from degradation during the measurements. Peak assignments were made with respect to
reference compounds analyzed in the same conditions. The binding energy scale was
calibrated from the hydrocarbon contamination using the C 1s peak at 285.0 eV. Core peaks
were analyzed using a nonlinear Shirley-type background [31]. The peak positions and areas
were optimized by a weighted least-squares fitting method using 70% Gaussian, 30%
Lorentzian line shapes. Quantification was performed on the basis of Scofield’s relative
sensitivity factors [32]. Sb electrodes were thoroughly rinsed with pure DMC and dried
before XPS measurements; it is assumed that there was no trace of LiPF6 or NaClO4 salt and
solvents left at the electrode surface during these measurements. For each electrode sample,
several XPS analyses were performed at different positions to make the results statistically
reliable.
MANUSCRIP
T
ACCEPTED
ACCEPTED MANUSCRIPT
7
III. Electrochemical properties of Sb electrode
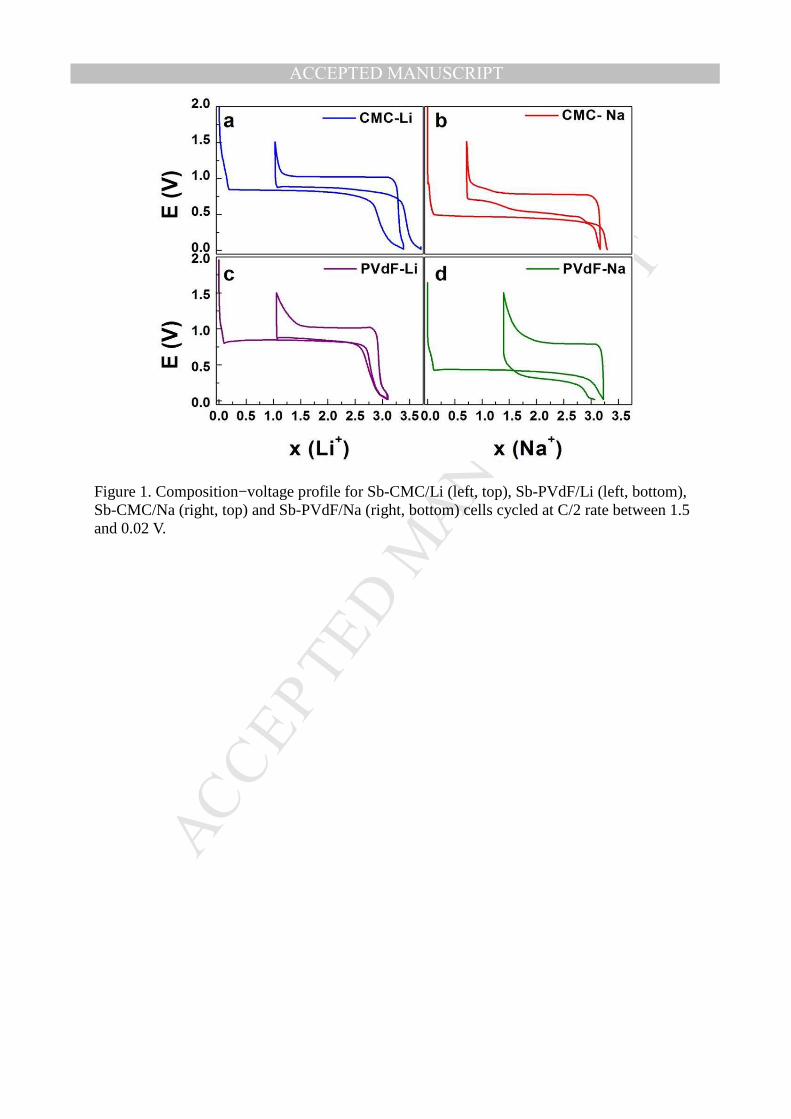
Figure 1 shows the galvanostatic curve of Sb electrode cycled versus lithium and sodium at
C/2 rate (0.5 mole of Na or Li per mole of Sb per hour, respectively) using CMC or PVdF as
binder. In both case, the first lithiation or sodiation occurs on a single plateau at 0.81 V vs
Li+/Li and 0.45 V vs Na+/Na. In our previous work [23], we have shown that, in the case of
lithium with CMC formulation (Figure 1a), a slight tail is visible when the potential gets
close to 0 V at the end of the first insertion, probably representing the decomposition of the
electrolyte at the electrode surface according to the number of inserted Li ions compared to
the theoretical value of 3 (corresponding to the formation of Li3Sb). This phenomenon is
less pronounced when using PVdF as binder (Figure 1c), which can be explained by the fact
that there is less SEI formation in agreement with the number of inserted Li ions which is
close to 3. Differently from the case of Li, with CMC formulation, no tail close to 0 V vs
Na+/Na is observed at the end of the first discharge, suggesting that at this working potential
the electrolyte is less sensitive to decomposition than in the case of Li (figure 1b).
As we can see from the voltage profile, a poor reversibility is observed when using PVdF as
binder in both cases and an increase in polarization is clearly identified (Table 1), in the case
of sodium.
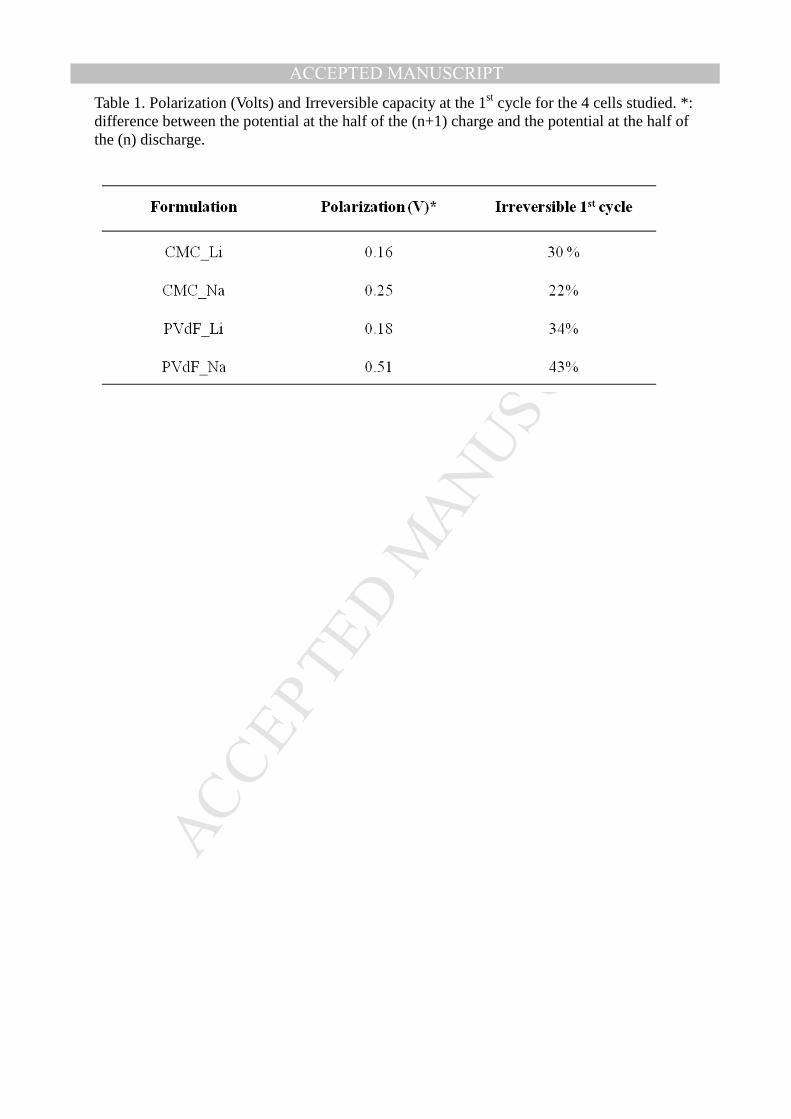
Table 1 shows the polarization and the irreversible at the first cycle for the four systems
studied. In the case of lithium, the polarization is quite similar for CMC and PVdF. The
difference is much more pronounced when cycling versus sodium with a value of 0.51V and
0.25V for PVdF and CMC, respectively. The irreversible capacity at the first cycle is also
MANUSCRIP
T
ACCEPTED
ACCEPTED MANUSCRIPT
8
comparable for CMC and PVdF formulation when cycling versus lithium, which is not the
case with sodium: the irreversible capacity of the PVdF formulation (43%) is twice the value
(22%) of the CMC formulation.
Globally, the number of inserted ions is very close to the theoretical value of 3,
corresponding to the formation of Na3Sb in the case of sodium (with the CMC formulation).
In the case of Li, the number of lithium ions inserted slightly exceeds 3, indicating that
additional Li consumption occurs, most probably by parasitic electrolyte decomposition
reactions. Moreover, antimony electrode formulated with the CMC as binder presents better
performance than the electrode formulated with the PVdF, for Li+ and Na+ as well.
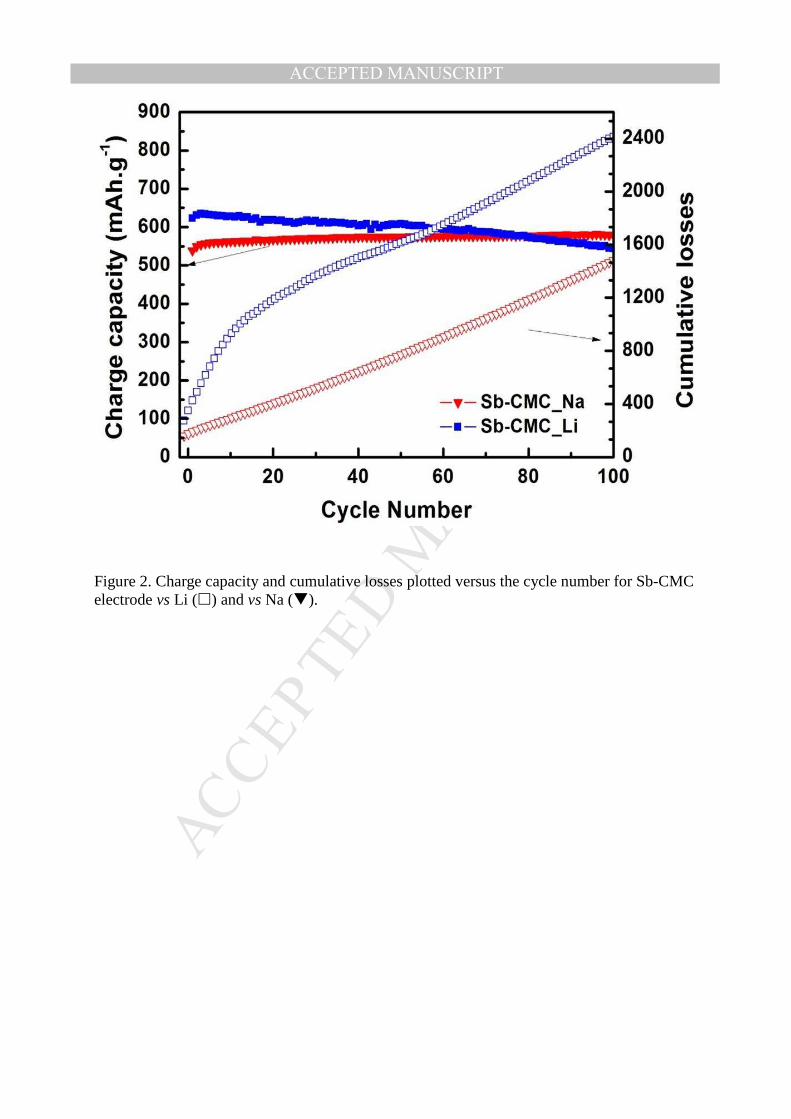
Figure 2 shows the charge capacity and the cumulative losses plotted versus the cycle
number with the electrode formulated with the CMC as binder. As discussed in our previous
work, antimony presents a better electrochemical performance cycled versus sodium than
that observed versus lithium. A sustainable capacity of 560 mAh g-1 for 100 cycles is
observed when cycled with Na+ while in the case of Li+, a gradual drop is observed. If we
take a look at the cumulative losses, we noticed a remarkable difference between the two
systems. In the case of Na, a linear increase is clearly identified during cycling which is not
the case with Li, where a strong increase in the cumulative losses is observed during the first
ten cycles, followed by a linear increase in the next cycles.
To better understand the effect of the SEI layer on the electrochemical performance of these
electrodes, XPS analyses were performed in order to identify the composition and the
thickness of this layer.
MANUSCRIP
T
ACCEPTED
ACCEPTED MANUSCRIPT
9
IV. Surface Analysis Results
1. Sb-PVdF and Sb-CMC reference electrodes
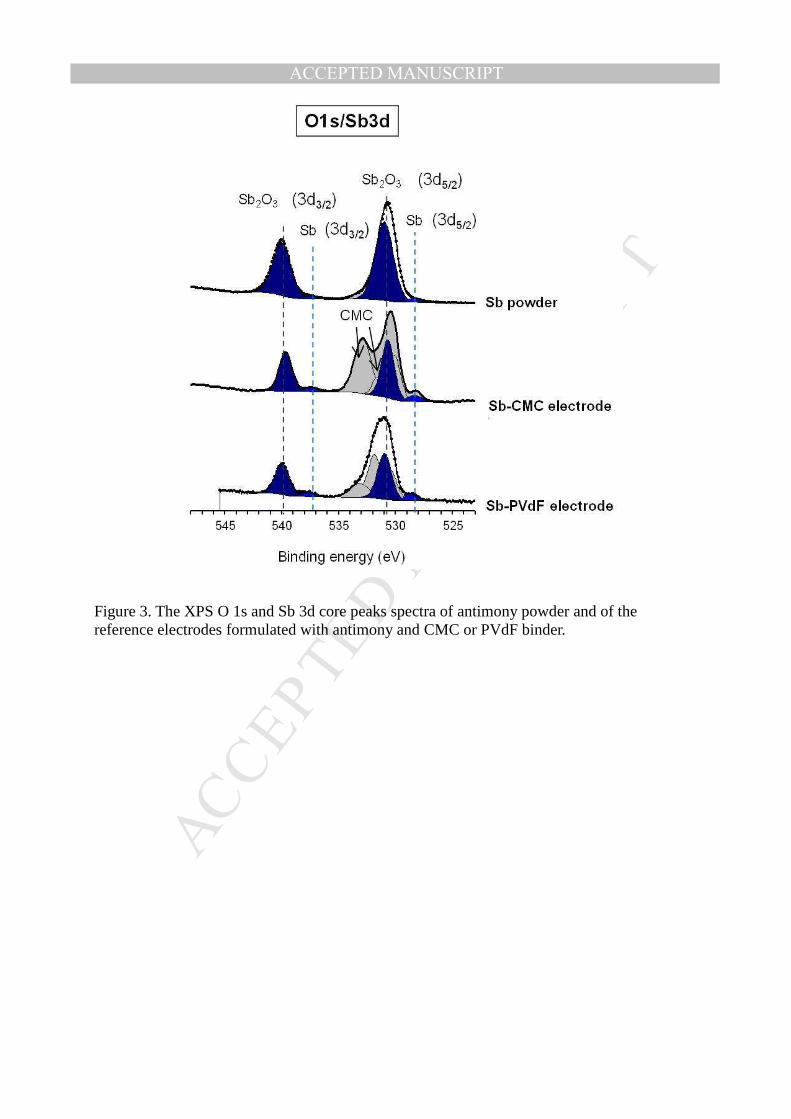
Sb 3d and O 1s XPS core peaks of antimony powder and of fresh electrodes made of
antimony, carbonaceous additives and of CMC or PVdF binder are presented in Figure 3.
Because of the overlapping of Sb 3d and O 1s core peaks, Sb 3d spectrum is fitted according
to area and energy splitting (9 eV) constraints between 3d5/2 and 3d3/2 components. Two
main components are clearly detected in the three spectra; they are identified by two peaks
at 528.5 (3d5/2) and 537.5 eV (3d3/2) for metallic Sb and 531 (3d5/2) and 540 eV (3d3/2) for
Sb2O3. The strong presence of antimony oxide is probably due to the oxidation of the Sb
particle surface.
The component at 530.5 eV is attributed to the Sb2O3 oxide in the O 1s core peak.
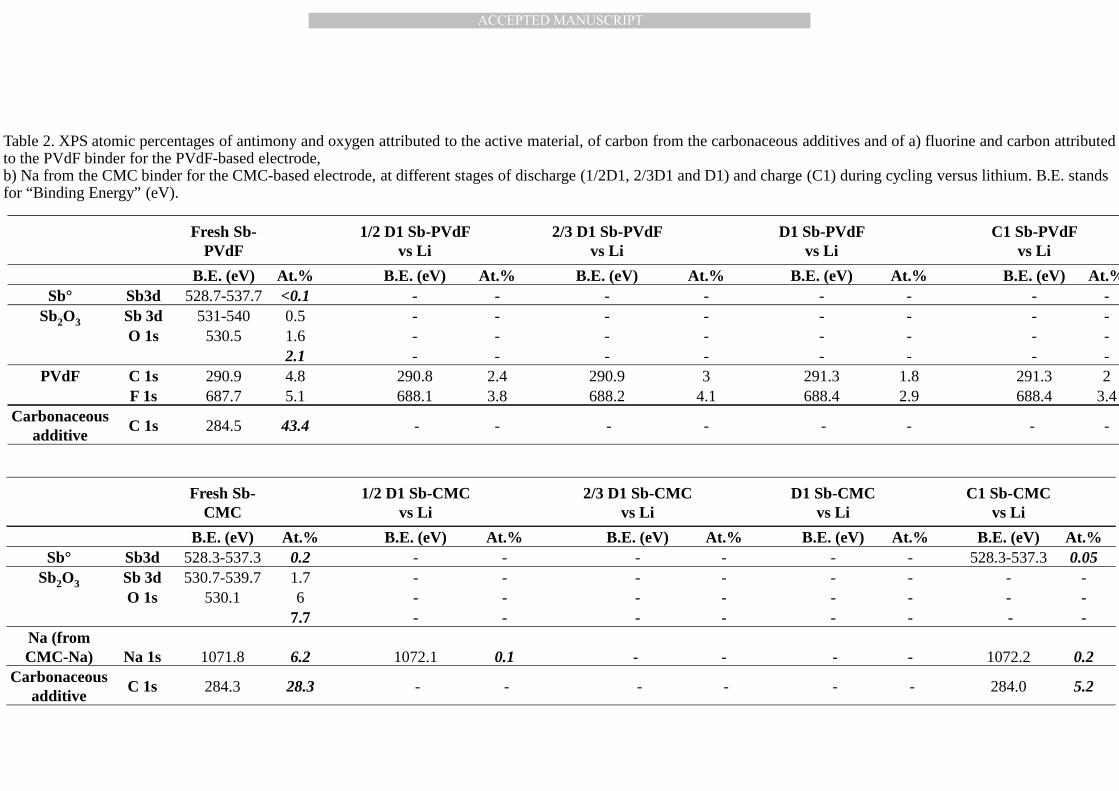
Table 2 reports (in its first columns) the atomic percentages of antimony and oxygen
attributed to Sb° and Sb2O3 and of carbon attributed to the carbonaceous additives measured
by XPS. The atomic percentages of carbon and fluorine attributed to the PVdF binder (Table
2a) and of sodium from the CMC binder (Table 2b) are also reported.
The characteristic peaks of the oxide and of metallic antimony are observed in the same
relative proportions in the CMC-based and in the PVdF-based antimony electrodes. The
main difference between the two spectra lies in the O 1s core peak, where the two
characteristic components of the CMC binder are observed: at 533 eV (C-O-C) and 531.6
eV (O-C=O) [33].
MANUSCRIP
T
ACCEPTED
ACCEPTED MANUSCRIPT
10
2. Nature and thickness of the passivation layer of the Sb electrode vs Li :
The chemical nature of the passivation layer can be studied by X-ray Photoelectron
Spectroscopy (XPS) which offers a global view of the surface layer with a 5 nm thickness.
The analyses were directly performed on fresh electrodes cycled at different stages of
discharge and charge. Several XPS core peaks and valence bands spectra are presented in
the following results.
Tables 2, 3, 4 and 5 also summarize the XPS results: Table 2a reports the atomic percentages
of all the component of the reference electrode (active material, PVdF binder and
carbonaceous additives), and the atomic percentages of these components detected at
different stages of discharge and charge when cycling versus lithium. The evolution of these
percentages is a reliable indicator of the electrode covering by the passivation layer. Table
2b reports the equivalent data concerning the Sb-CMC based electrode cycled versus
lithium, and Table 3 for cycling versus sodium.
The atomic percentages of all the species forming the SEI detected by XPS, for cycling
versus Li and versus Na, are reported in quantification tables in supplementary information.
2.1 Sb-PVdF electrode cycled versus Li
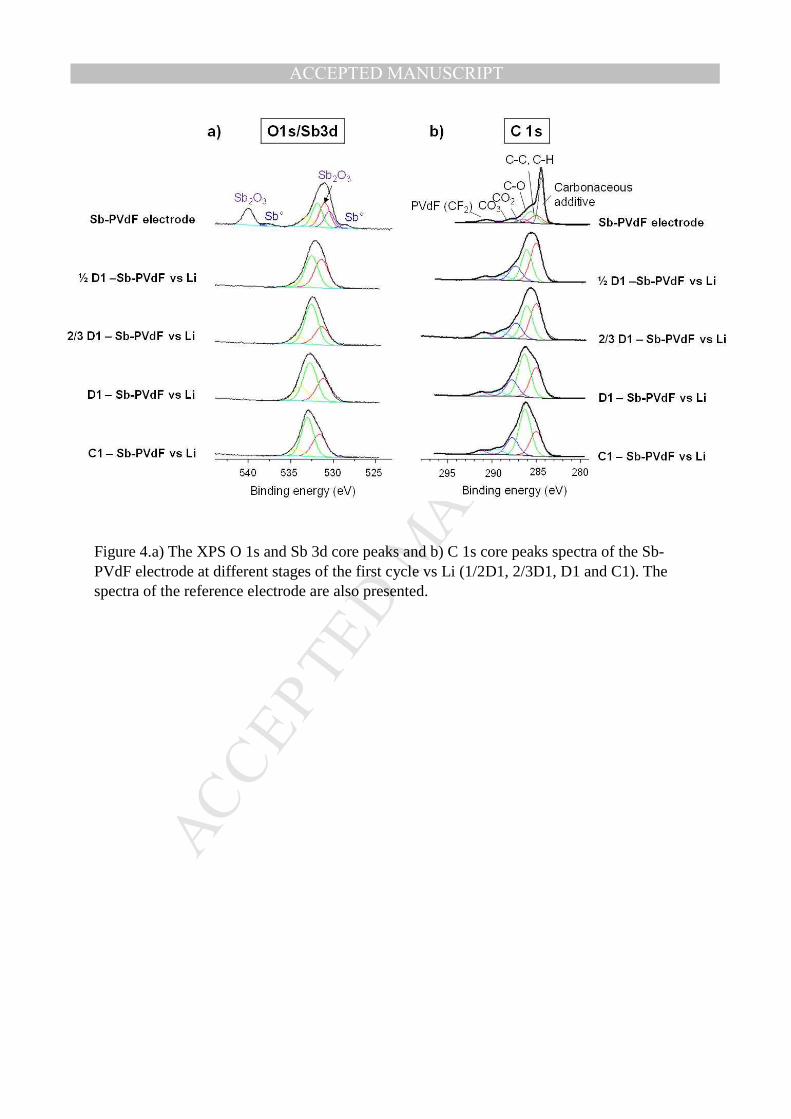
Sb 3d/O 1s and C 1s core peaks are presented in Figure 4. As noted previously, two
components are clearly detected in the Sb-PVdF reference electrode: metallic Sb (528.5 -
537.5 eV) and Sb2O3 (531 - 540 eV). At the half of the first discharge, the peaks
corresponding to metallic and oxidized Sb are no more detected neither at the end of the
discharge, nor at the end of the first charge. This result indicates that the SEI layer formed

MANUSCRIP
T
ACCEPTED
ACCEPTED MANUSCRIPT
11
on the active material is thicker than 5 nm, which is the depth limit of the XPS analysis. The
C 1s spectrum of the reference electrode (Figure 4b) displays an intense peak at 284.5 eV
corresponding to the carbonaceous additives. This component is no longer detected on the
cycled electrode, indicating that the carbonaceous additives are also covered by a
passivation layer thicker than 5 nm. A small peak displayed at 291 eV is observed, which is
characteristic of the CF2-CH2 environment in the PVdF binder. The peak assigned to the
carbon atom in CH2-CF2 is observed at 286.4 eV [34]. The component at 291 eV is detected
on the C 1 core peaks of all the cycled electrodes (discharged and charged): the
decomposition products of the electrolyte do not seem to form a thick SEI on the PVdF
binder, but only on the active material and the conductive additives.
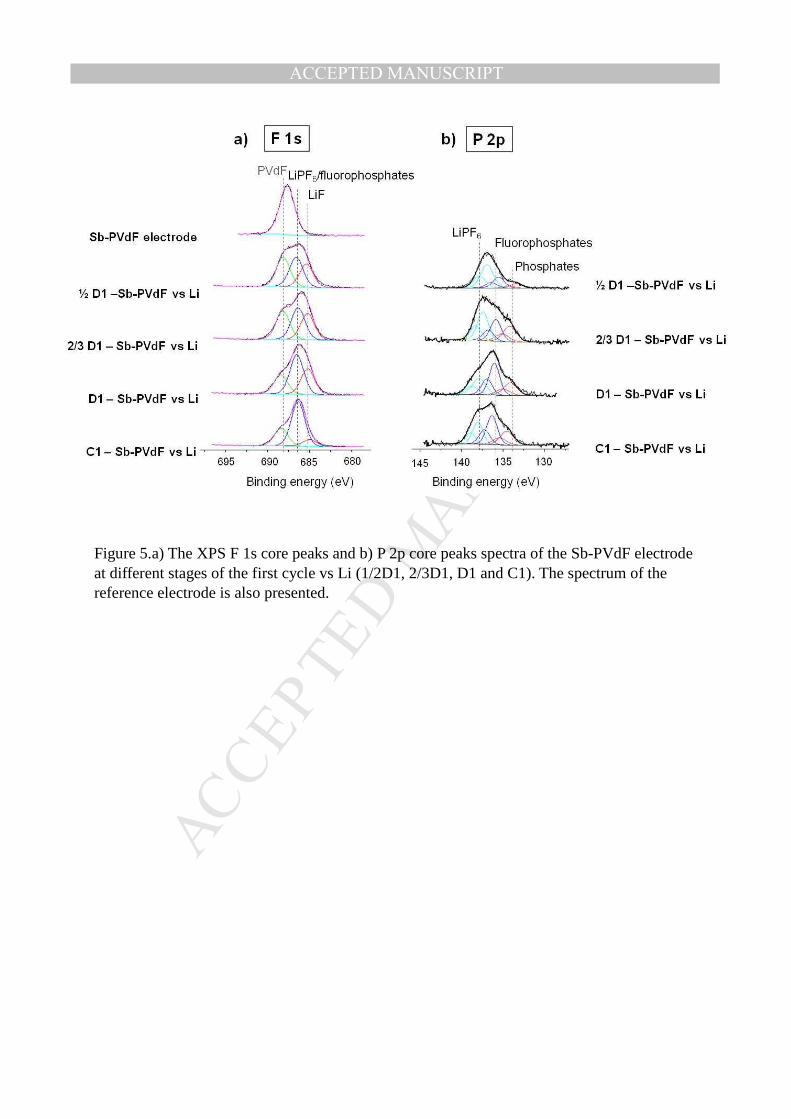
The XPS F 1s core peaks (Figure 5) also show that the PVdF binder (at 687.7 eV) is
detected all over the discharge and also at the end of the charge. This observation confirms
that the passivation layer does not homogeneously cover the active material and the binder.
The XPS C 1s core peaks spectra of the electrode formulated with PVdF binder presented in
Figure 4 also provide valuable information regarding the SEI nature. The component with a
binding energy of 285.0 eV in C 1s spectra is assigned to CHx environment, which is
attributed to hydrocarbon contamination (always detected at the extreme surface) and to
carbon atoms of organic species bound to carbon or hydrogen atoms only. The component
observed at 286.5 eV can be assigned to carbon atoms bound to one oxygen atom (C-O),
while the component at 289.0 eV corresponds to carbon atoms bound to two oxygen atoms
(O=C-O) [35]. The component observed at 290.2 eV is characteristic of carbon bound to
three oxygen atoms, which is typical of carbonate-like species (-CO3) that could be Li2CO3
or lithium alkyl carbonates ROCO2Li [36, 37]. An increase of the relative intensity of the
MANUSCRIP
T
ACCEPTED
ACCEPTED MANUSCRIPT
12
component associated with carbon atoms in C-O bonds is observed all over the discharge.
These ether groups may be attributed to PEO, which is classically formed in the SEI when
cycling with an EC-based electrolyte [38].
The F 1s core peaks of cycled electrodes are characterized by three main components at
685.2, 686.5 and 688 eV, which can be assigned to LiF, LiPF6 and PVdF, respectively. The
P 2p core peaks also shown on Figure 5 have been fitted by considering two resolved
doublets (with a spin-orbit splitting of 0.9 eV between 2p3/2 and 2p1/2). They are
characterized by a broad peak consisting of three main components at 134.2, 136 and 138
eV which corresponds to phosphates, fluorophosphates and LiPF6, respectively [39].
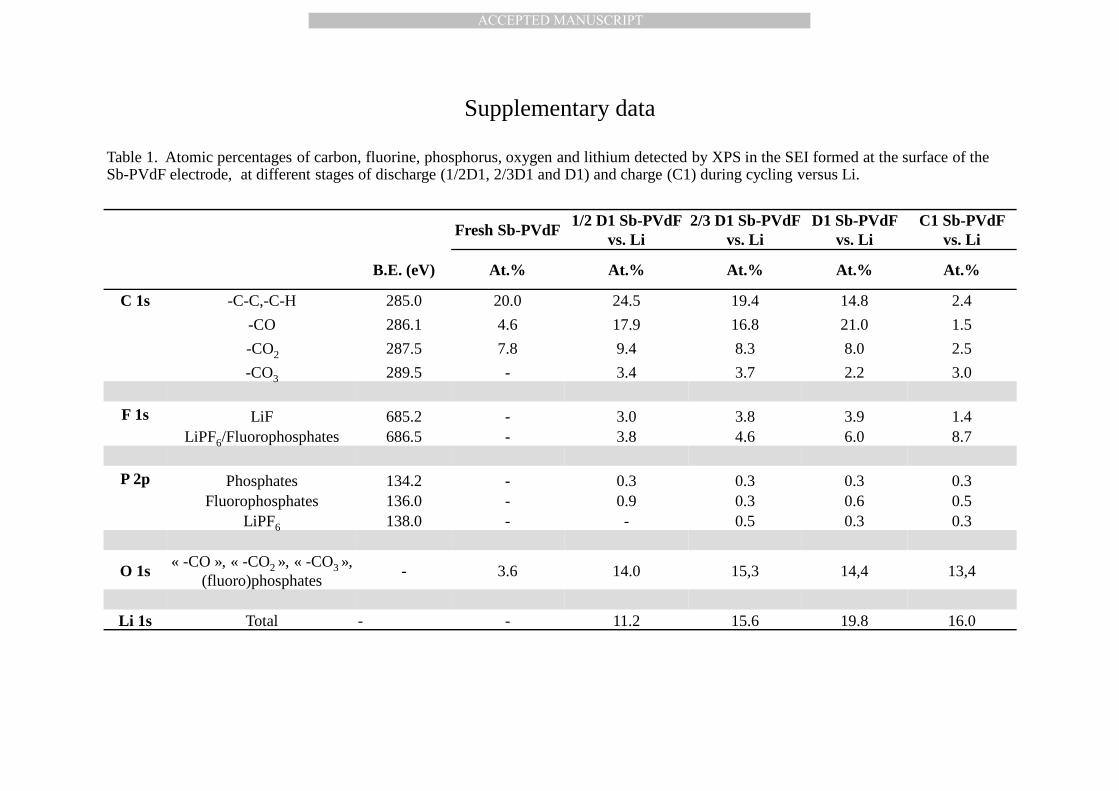
From the beginning of the reaction of Sb with lithium and until the end of the first discharge,
the composition of the SEI remains stable: it is mainly formed of carbonates (from the
decomposition of the solvent of the electrolyte), LiPF6, LiF, and fluorophosphates (from the
decomposition of the electrolyte salt). During the charge, the amount of LiF decreases from
8 to 3 % which can be explained by a partial dissolution of the SEI layer, leading to a better
detection of C-O components (see Table 1 in supplementary data).
2.2 Is the SEI layer of the Sb electrode vs Li formulated with the CMC binder in water is
similar to that with the PVdF binder in NMP?
To answer this question, we performed the same XPS analysis done on the previous system
on the Sb electrode formulated with CMC.
MANUSCRIP
T
ACCEPTED
ACCEPTED MANUSCRIPT
13
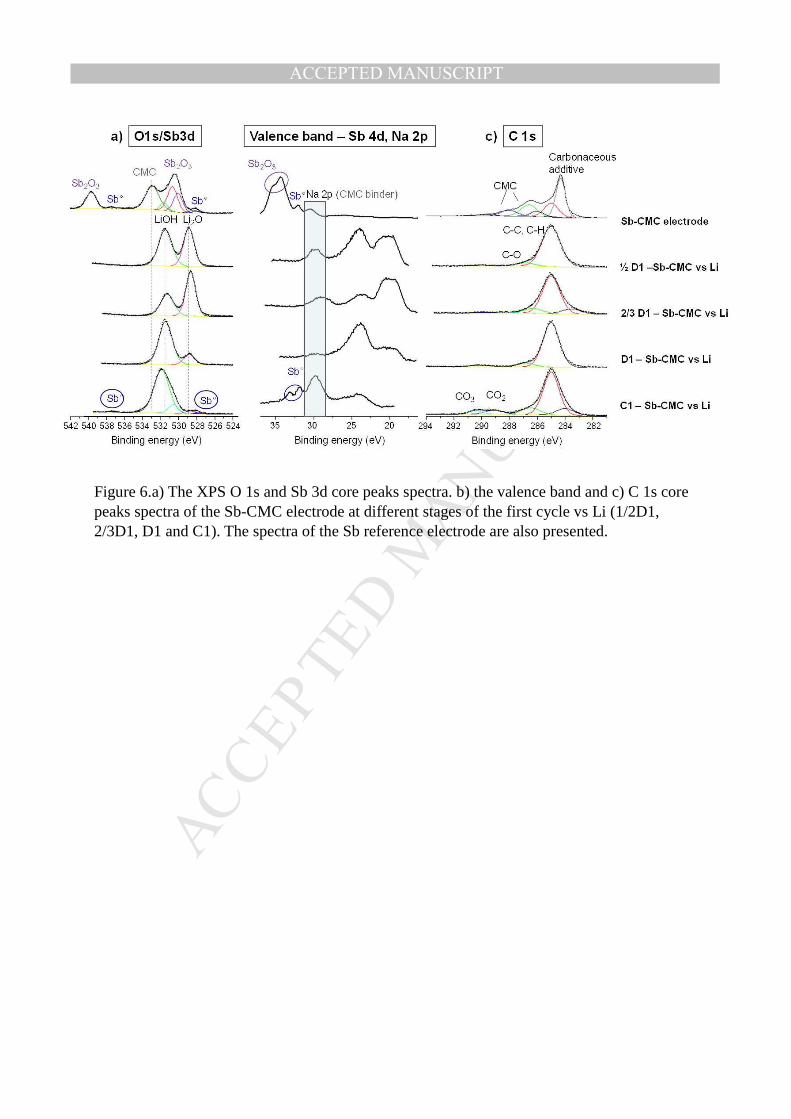
Figure 6 shows the XPS C 1s, O 1s/Sb 3d core peaks of the Sb reference electrode, of the
electrode during discharge and at the end of the charge.
The XPS O 1s and Sb 3d spectra shown in Figure 6a reveal that, like in the case of PVdF,
the Sb active material is covered from the middle of the first discharge until the end of the
discharge, indicating the formation of a thick SEI layer (more than 5 nm). However, the
active material is detected again at the end of charge, which is the consequence of a partial
dissolution of the SEI. However, it should be noted that only Sb° is observed, whereas it was
mostly Sb2O3 on the starting electrode.
Table 2b shows the atomic percentage of Na detected at the surface of the fresh electrode
Sb/CMC and of the cycled electrode by XPS. The presence of Na results from the use of the
CMC binder and is a good probe to estimate its covering along cycling: the atomic
percentage of Na decreases from 6.2% (on the fresh electrode) to 0.1% on the 1/2D1 sample,
indicating that the binder is almost completely covered by the passivation layer at this stage
of discharge. It is no longer observed on 2/3D1 and D1 samples. It is detected again (in
small amount) at the end of the charge, similarly to the active material. Figure 6b displays
the valence band of each electrode during cycling, mostly corresponding to the ionization of
Na 2p and Sb 4d orbitals. The Na 2p component, corresponding to the CMC binder,
decreases during the discharge, indicating a progressive overlap of the binder by the SEI
layer. However, the Sb active material is no longer detected from the half of the first
discharge. At the end of the first charge, the Sb active material and the Na 2p peak of the
binder are detected again which confirms the partial dissolution of the SEI. It should be
noticed that in this range of binding energy, we probe the material with a slightly greater
MANUSCRIP
T
ACCEPTED
ACCEPTED MANUSCRIPT
14
depth than during Na 1s, O 1s and Sb 3d core peaks analysis, because the kinetic energy of
the electrons of the valence band is greater.
At the middle of the discharge, at the 2/3 and at the end of the discharge, the O1s/Sb3d
spectra are mainly consisting of two components, namely LiOH and Li2O (between 50 and
60% - see Table 2 in supplementary data). These latter are present before the XPS analysis,
probably because of the electrode formulation in water. Several tests are done at the
beginning and the end of the analysis, in order to identify if the Li2O species is one of the
SEI components or if it is a degradation product of LiOH under the X-Ray beam. No change
was observed before and after analysis in each electrode which confirms that the Li2O
species is one of the SEI major components.
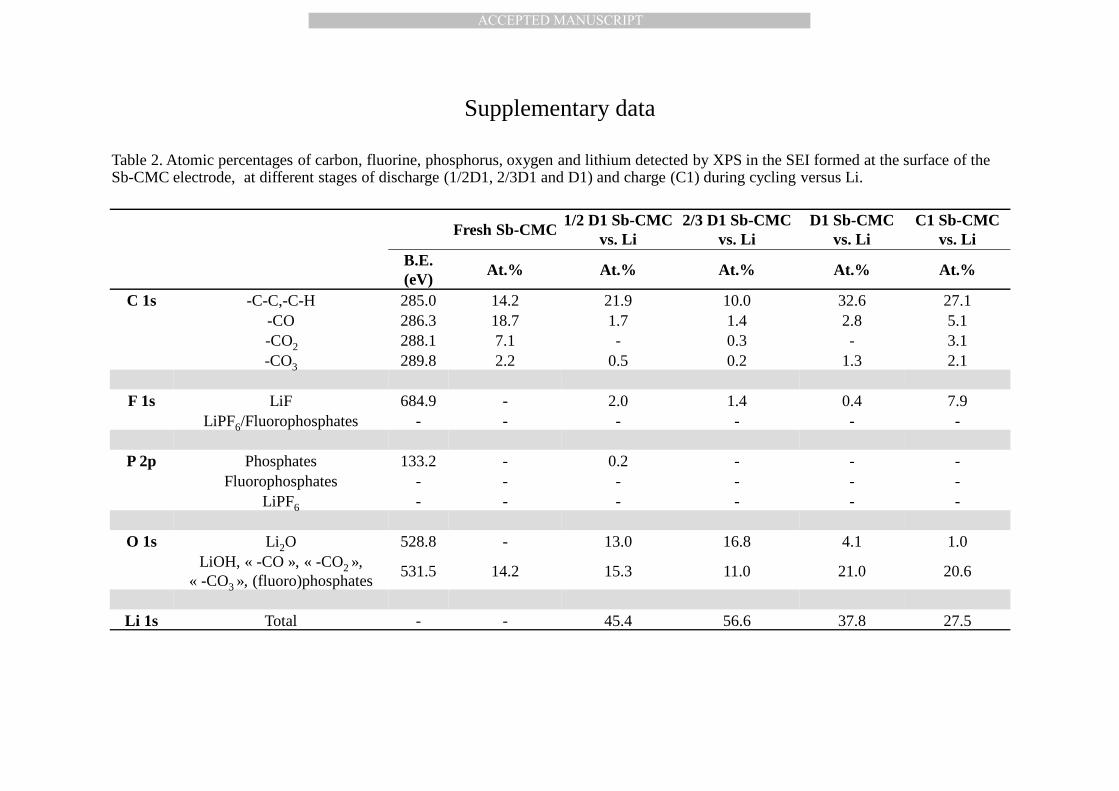
The XPS C 1s core peak spectra show mainly C-C and C-H environments, with a small
amount of C-O for ½ D1, 2/3 D1 and end of the D1 samples, and with no trace of –CO3 and
–CO2 environments. These latter appear at the end of the charge, probably because of the
dissolution of Li2O/LiOH species during the charge: their amount drops down to 15% at the
surface of the electrode at the end of the charge. Few or no fluorinated species are present in
the case of Sb electrode formulated with CMC. Only LiF (16%) is detected at the end of the
charge. The composition of the SEI layer is clearly different than that of the previous
system.
To summarize, concerning the nature of the SEI layer formed, in the case of Sb-PVdF
system, a classical chemical composition is observed considering the electrolyte used
(solvent EC, PC and DMC and LiPF6 lithium salt), since the degradation products detected
are those of solvents (-CO, -CO2, -CO3 environments), and those of the LiPF6 salt (LiF,
MANUSCRIP
T
ACCEPTED
ACCEPTED MANUSCRIPT
15
fluorophosphates and phosphates). Although the active material is not detected at the end of
the charge, the decrease of the content of LiF and of species with a C-O bond allows
considering a slight dissolution of the SEI. In the case of electrodes made with the binder
CMC, most of the species mentioned above are not detected by XPS during the discharge.
Only C-C, C-H and C-O environments in small proportion and few fluorinated and/or no
phosphorus species were observed. The main compounds detected by XPS in the discharge
are LiOH and Li2O. Their presence is probably due to the use of water in the formulation of
the electrodes with the CMC binder. These species are detected in much lower amounts at
the end of the charge, in favor of carbon species and LiF.
Concerning the thickness and the morphology of the SEI layer, in the case of PVdF, the
active material (Sb) is no longer detected from the half of the first discharge and is not re-
detected at the end of the charge: on all the analyzed samples, the SEI covers the active
material with a thickness greater than the depth of analysis of XPS (about 5 nm). However
the increase of the amount of LiF after charging allows considering a slight dissolution of at
least a portion of species of the passivation layer. The observation of C 1s and F 1s core
peaks also indicates that the PVdF binder is detected throughout the discharge and at the end
of the charge, and thus does not seem covered by the SEI, which appears to be preferentially
formed on the active material.
In the case of CMC binder, as in the case of PVdF, antimony is covered from the half of the
first discharge. The analysis of Na 1s and Na 2p core peaks indicates a progressive covering
of the binder by the passivation layer during the discharge. Unlike the previous system, the
dissolution of the SEI during the charge (probably of LiOH/Li 2O species) allows the
detection of the active material and of the binder after charging. The thickness of the SEI is
MANUSCRIP
T
ACCEPTED
ACCEPTED MANUSCRIPT
16
then less than 5nm. It appears to cover the surface of the electrode more homogeneously
than the passivation layer formed at the Sb-PVdF electrode’s surface.
3. Nature and thickness of the passivation layer of the Sb electrode cycled vs Na :
The analyses were performed on the same fresh electrodes than vs Li, cycled at the same
stages of discharge and charge which allow the comparison of electrode/electrolyte
interfaces. The electrolyte used in the case of cycling vs Na was NaClO4 (sodium salt) in PC
(solvent) with 5% FEC (as additive).
3.1. Sb-PVdF vs Na
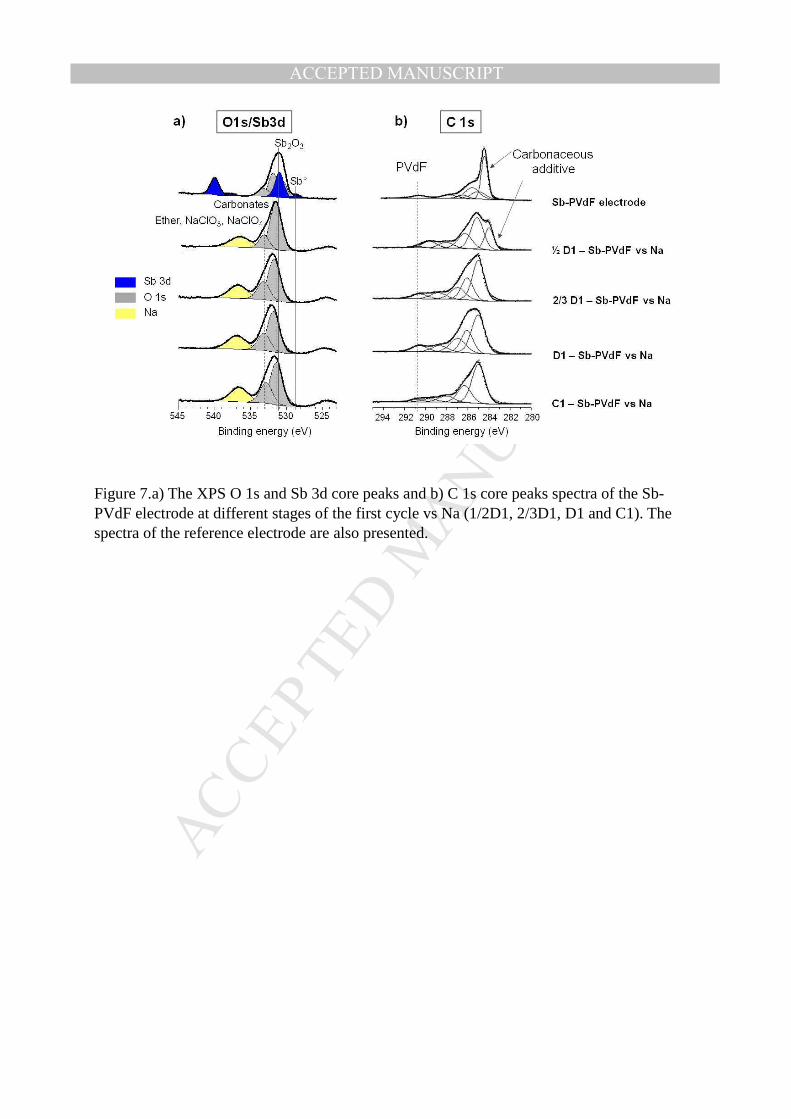
On Figure 7a (O 1s/Sb 3d), upon the half of the first discharge (1/2 D1), the antimony is not
detected. It should be noted that during cycling vs sodium, two Na Auger transition peaks
appear at 536 and 523 eV.
However, in the C 1s core peak of the same sample (Figure 7b), the component located at
284.3 eV, characteristic of the carbonaceous additives, is still detected. The peaks
corresponding to the PVdF binder, located at 291 (C 1s) and 688 eV (F 1s), are observed all
over the first cycle. This observation suggests that the passivation layer formed is
discontinuous and covers preferentially the active material and the carbon additive at the
expense of the PVdF binder.
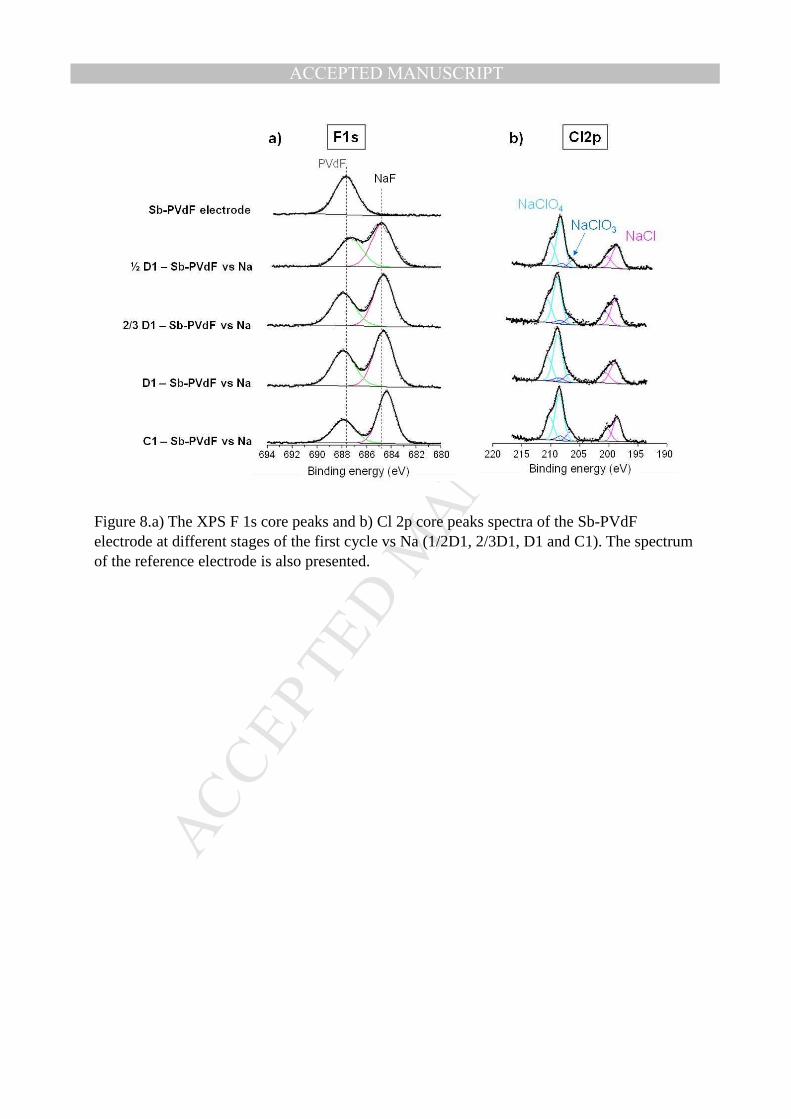
At the half of the first discharge, a new component located at 684.3 eV appears on the F 1s
core peak spectra (figure 8a), corresponding to the deposition of NaF at the electrode’s
surface. This observation is in agreement with Baggetto study [40] on Sb thin films cycled
MANUSCRIP
T
ACCEPTED
ACCEPTED MANUSCRIPT
17
in the presence of FEC. According to their study, these species confer desirable properties in
terms of lifetime to Na-ion batteries cycled with this additive. This species is formed at the
beginning of the discharge and does not seem to re-dissolve during the charge. Figure 8b
shows the XPS Cl 2p core peak spectra of the Sb-PVdF electrode, which indicates a partial
reduction of the electrolyte salt to NaCl and NaClO3 at the electrode surface. A part of this
reduction may be due to X-ray beam as the relative intensity of the NaCl component
increases during the acquisition of the XPS spectra. This reduction of the salt is, however,
also due to electrochemical processes because this component is present from the start of the
XPS acquisition.
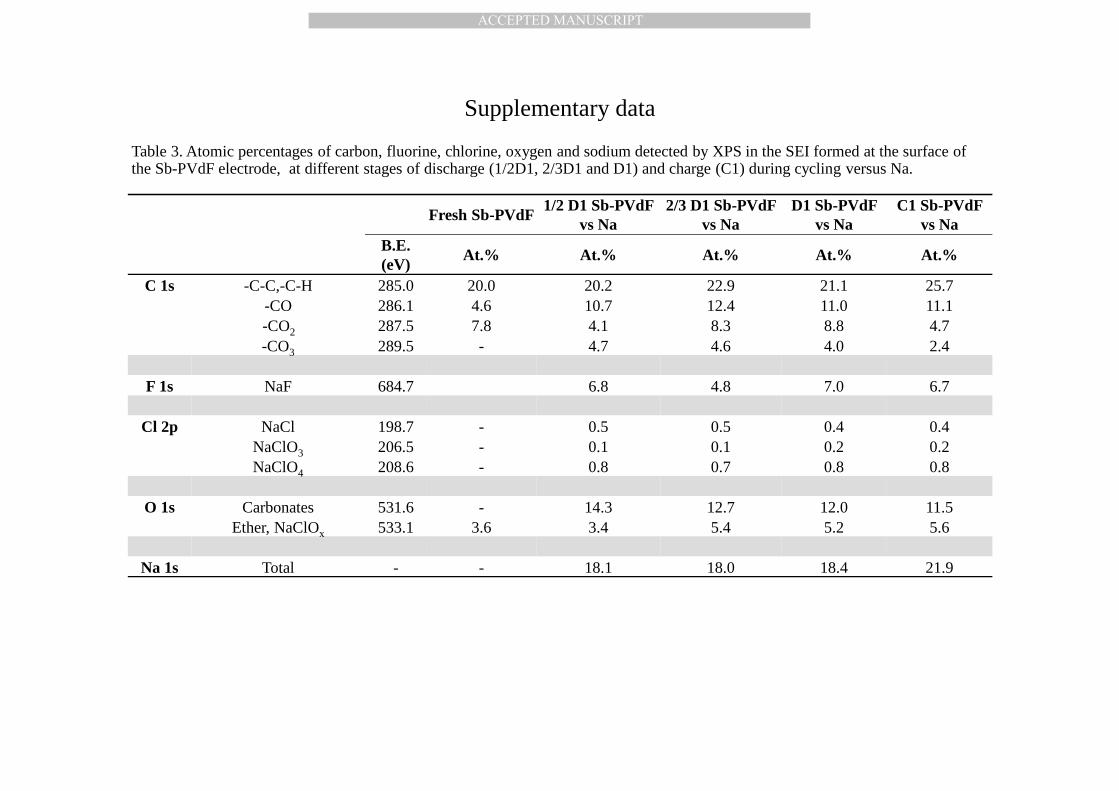
The amount of NaClOx-type compounds remains stable during the discharge and the charge
(6-7%). At the end of the charge, the amount of carbonates and of compounds with a -CO2
group slightly decreases in favor of organic species with C-C, C-H bonds (see Table 3 in
supplementary data). Neither the active material nor the carbonaceous additives are detected
at the end of the first charge, meaning that they are covered with a passivation layer thicker
than 5 nm (but possibly discontinuous at the PVdF binder).
3.2 Sb-CMC vs Na
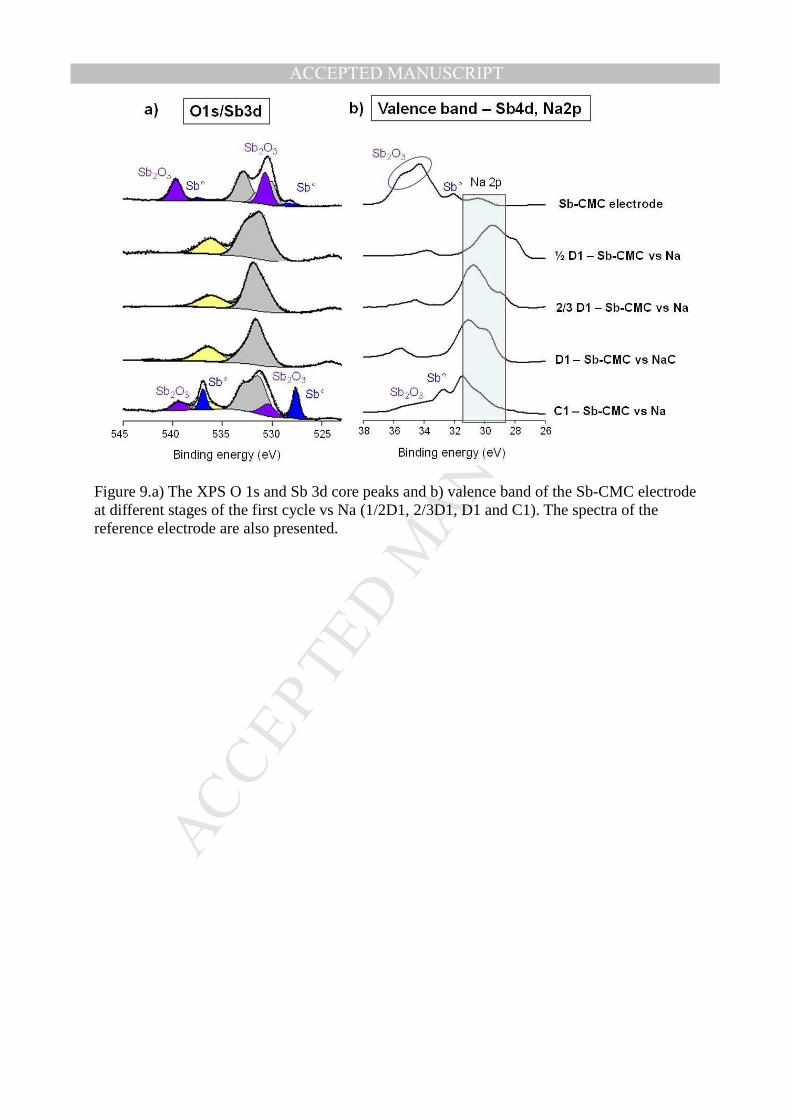
Figure 9 and 10 show the XPS Cl 2p, F 1s, Na 1s, O 1s/Sb 3d and the valence band of Sb
electrode formulated with the CMC as binder and cycled versus sodium. The Sb 3d core
peak spectra (Figure 9a) show, as in the case of the Sb-PVdF system, that the active material
is covered by a passivation layer from the half of the first discharge. However, unlike the
previous system, the carbon additive (C 1s core peak) and the CMC (O 1s core peak) are no
longer detected. The main difference between this system and the previous one is the
MANUSCRIP
T
ACCEPTED
ACCEPTED MANUSCRIPT
18
detection, at the end of the first charge, of antimony characteristic peaks, reflecting a partial
re-dissolution of the SEI during charging. This dissolution is not complete because, as
observed in Table 3b, more antimony is measured at the surface of the starting electrode (1.9
%) compared with the end of the charge (1.2 %). The characteristic peak of carbon additives
is also detected again in large amounts on the C 1s core peak spectra at the end of the
charge.
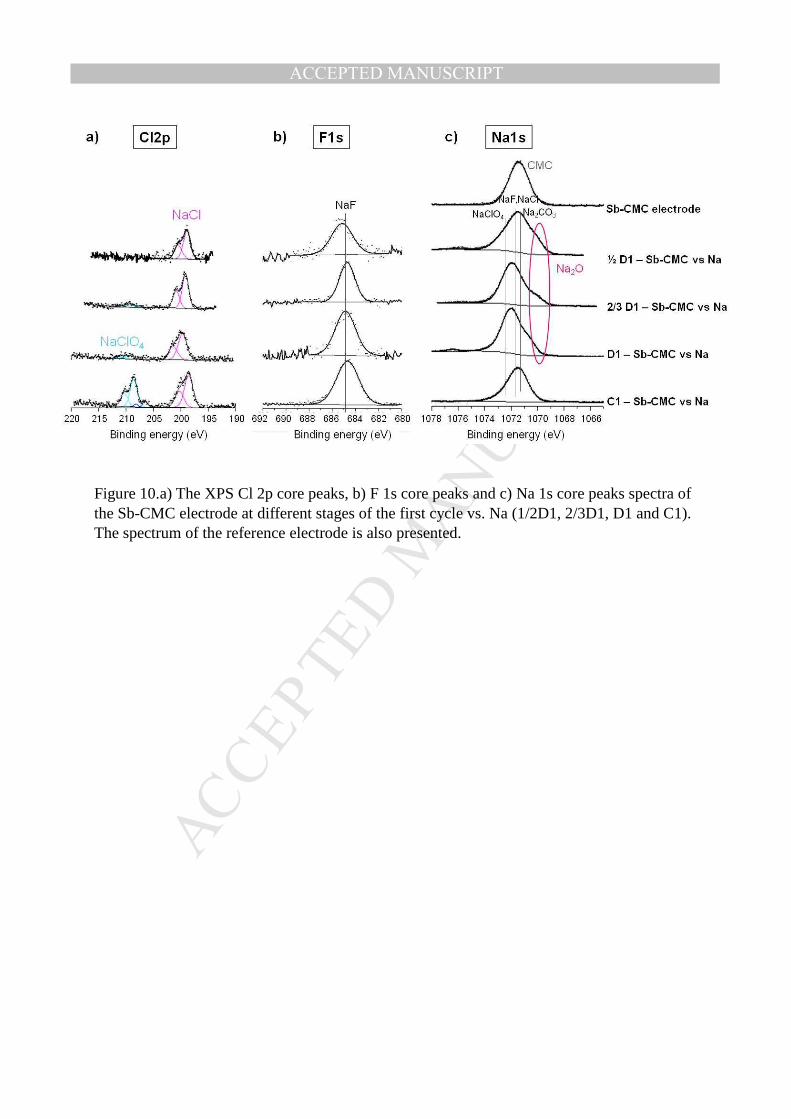
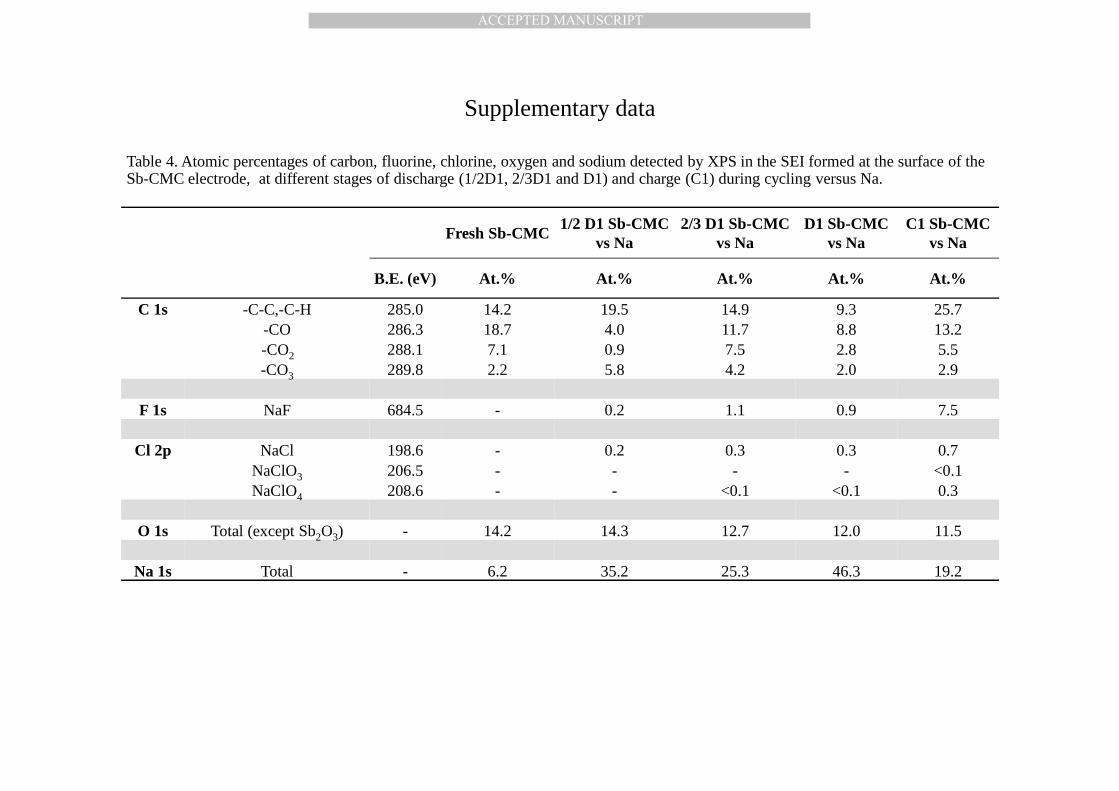
It should be noted that, due to the overlap of all the components in O 1s (Figure 9a) and Na
1s core peaks (Figure 10c), it is difficult to obtain an accurate quantification of all the
species in the SEI (Table 4 in supplementary data). However, being given the global
amounts of Na and the shoulder at low binding energy on the Na 1s core peaks (for 1/2D1,
2/3D1 and D1 samples), we can suppose that a significant amount of Na2O and possibly
NaOH is formed at the electrode surface during discharge. These species would dissolve
during the charge, leading to the detection of NaF (15%) as observed on Figure 10b. This
phenomenon is similar to the cycling vs Li, but with less NaOH/Na2O formed compared to
LiOH/Li 2O.
The observation of the Sb 3d core peak also provides information about the oxidation state
of antimony at the end of charge: compared with Sb 3d core peak of the reference electrode,
the two same doublets are observed, attributed to Sb° and to Sb2O3. However, the ratio
between the two species is different as Sb° is detected in a larger amount than Sb2O3 (Table
3b). This observation suggests a complete conversion of Na3Sb (formed at the end of the
discharge) to Sb° during the charge.
MANUSCRIP
T
ACCEPTED
ACCEPTED MANUSCRIPT
19
The total covering of the active material by the passivation layer during discharge does not
allow the observation by XPS of the signature neither of the “expected” amorphous phase
NaxSb during discharge nor of the Na3Sb phase at the end of the discharge.
In agreement with the literature, in the case of Na-Sb/CMC and Na-Sb/PVdF systems, the
SEI formed on the surface of the antimony electrodes is made of sodium salt (NaClO4) and
its degradation products NaClO3 and NaCl [41]. We also noted the formation of NaF, due to
the presence of the additive FEC. This species does not re-dissolve during the charge. The
degradation of the electrolyte solvents also results in the formation of sodium carbonate
Na2CO3 or ROCO2Na. In the case of system Na-Sb/CMC, the presence of Na2O is noted at
the surface of the sample at the half of the first discharge. It is consistent with the use of
water during the formulation of an electrode with CMC binder.
The difference between the Sb-CMC and the Sb-PVdF systems studied versus sodium lies
rather in the thickness and homogeneity of the SEI formed at the surface of the electrodes
analyzed by XPS: in both cases, the passivation layer is covering the active material (Sb) at
the half of the first discharge. While the binder CMC is also covered at the beginning of the
first discharge, the PVdF binder is detected throughout cycling. These observations suggest
the formation of a discontinuous (inhomogeneous) passivation layer in the case of the
electrode formulated with the PVdF as binder.
At the end of first charge, the antimony is detected by XPS at the surface of the Sb-CMC
electrode, resulting from a partial re-dissolving of the passivation layer during charge
(dissolution of Na2O/NaOH). Instead, antimony is not detected at the surface of the Sb-
PVdF electrode at the end of the first charge; in this case the passivation layer covering the
active material still has a thickness greater than 5 nm.
MANUSCRIP
T
ACCEPTED
ACCEPTED MANUSCRIPT
20
4. Comparison of antimony electrodes cycled versus Li or Na
4.1 Comparison Sb-PVdF vs Li / Sb-PVdF vs Na.
The carbon environments detected at the surface of the various samples analyzed are similar
and characteristic of the degradation of the electrolyte’s carbonate solvents used (PC in the
case of sodium, PC: EC: DMC mixture in the case of lithium). The SEI is also composed of
the degradation products of the electrolyte salt in both cases: - NaClO4 for sodium system,
leading to the detection of the salt itself as well as NaClO3 and NaCl; - LiPF6 for lithium
system, leading to the detection of the salt, phosphates and fluorophosphates as well as the
detection of LiF. In the case of cycling vs sodium, the FEC additive allows the formation of
NaF which plays a role in the stabilization of the passivation layer. The active material is
covered with a SEI layer with a thickness greater than 5 nm throughout cycling in both
cases.
These observations are in agreement with the low performances in cycling and with the
higher polarization which are observed for Sb-PVdF in Li as well as in sodium batteries.
4.2 Comparison Sb-CMC vs Li / Sb-CMC vs Na.
While the passivation layers formed at the Sb-PVdF electrodes surface are comparable
between Na and Li systems, significant differences exist (in terms of chemical nature) for
the SEI formed at the surface of electrodes formulated with the Sb-CMC cycles versus Na,
compared to Sb-CMC vs Li.
MANUSCRIP
T
ACCEPTED
ACCEPTED MANUSCRIPT
21
o The degradation products of the electrolyte salt (NaClO4) were detected by XPS
at the surface of the electrodes cycled versus Na, but few or no phosphorus/
fluorinated species from the degradation of the LiPF6 salt has been detected at the
surface of the electrode cycled in Li system. These results are in agreement with
Komaba studies [4], i.e. a more significant proportion of inorganic compounds
exists at the surface of the electrodes cycled with Na+, whereas the SEI of the
electrodes cycled with Li+ are mainly formed from hydrocarbons compounds.
o Little amount of NaOH/Na2O has also been detected at the surface of the
electrodes cycled in Na-ion system (despite the presence of H2O in their
formulation). In this case the passivation layer is also formed of carbonated
species. On the contrary, high proportions of LiOH and/or Li2O were measured at
the surface of the electrodes in Li-ion system (during discharge).
The atomic percentage of active material measured by XPS at the end of the charge also
provides information on the difference in thickness between the passivation layers at the end
of discharge: 1.2 at.% of Sb is detected by XPS for the Na-ion system and only 0.05% for
the Li-ion system. SEI is then thicker when the electrode is cycled versus Li; this difference
in the thickness of the SEI between the two system was referred in the literature with an
explanation that the potential Na+/Na is higher than that of Li+/Li, which would imply less
degradation of the electrolyte at the surface of the electrodes. It may be also linked to the
dissolution of the SEI species which is more pronounced in the case of electrodes cycled
versus sodium during the charge [41].
MANUSCRIP
T
ACCEPTED
ACCEPTED MANUSCRIPT
22
It has to be noted that, in both case (vs Li or Na), the use of CMC as binder leads to the
formation of a passivation layer that homogeneously covers the active material and the
binder, on the contrary of the PVdF binder. During cycling vs Li and vs Na, less polarization
and less irreversible are measured when using the CMC binder (compared to PVdF): the
formation of a homogeneously thick SEI, obtained with the CMC binder, may contribute to
obtain better electrochemical performances. In the case of cycling versus lithium, this result
is in good agreement with the literature which reports the reactivity of the CMC binder
toward the electrolyte [33] and which suggests that CMC chains can bind to Si via covalent
or hydrogen bonding depending of the pH [42, 43].
Less irreversible at the first cycle is obtained with CMC formulation, especially in the case
of Na-system, where the irreversible is about 22%. This observation can be correlated to the
XPS analysis: in the case of Sb-CMC/Li, the Sb 3d core peak corresponding to the antimony
oxide (Sb2O3) is only visible for the reference electrode. It does not reappear at the end of
charge, which is not the case for Sb-CMC/Na. The consumption of the antimony oxide in
the case of the Sb-CMC/Li can be the reason of this higher irreversible.
Less polarization is also detected for Sb-CMC/Na. This result could be explained by the
formation of a thinner SEI when the formulation with CMC is used. The tail observed at the
end of the charge in the CMC-Li system confirms that the decomposition of the electrolyte
also plays a key role in the formation of the SEI and is enhanced in the working potential of
Li batteries. It should be noticed that the layer of antimony oxide observed by XPS, and
which is not completely consumed during cycling, could limit the degradation of the
electrolyte and the formation of the passivation layer.
In the other hand, the electrodes formulated with PVdF as binder show an important
irreversible at the first cycle, i.e. 43% in the Sb-PVdF/Na system. A higher polarization is
MANUSCRIP
T
ACCEPTED
ACCEPTED MANUSCRIPT
23
also observed with this latter. This phenomenon can be explained by the formation of a
resistant and thicker layer at the surface of the electrode. From XPS analysis, this layer is
thicker than 5 nm. The degradation of the electrolyte is more pronounced when using the
PVdF binder, especially in the Na-system. The rapid increase in the cumulative losses
during cycling in the Sb-CMC/Li system could be explained by the fact that more SEI is
formed during the first ten cycles and which is more stable in the following cycles.
However, in the case of Sb-CMC/Na, a linear increase was observed from the first cycles
and remains linear until the end of the life of the battery (Figure 2).
V. Conclusion
In this work, a systematic study of Sb electrodes cycled versus Li or versus Na has been
carried out. Two electrode formulations have been compared in order to investigate the role
of the binder (CMC or PVdF) on the battery performances. XPS studies highlighted the key
role of the SEI in the good performances of Sb-CMC vs Na compared to the other systems:
thanks to the formation of a thinner passivation layer, a smaller quantity of Na is irreversibly
trapped leading to a better cyclability. We also demonstrated that the choice of the binder
affects the thickness of the SEI, which is homogeneously formed on the active material,
carbonaceous additives and on the CMC binder but not on the PVdF binder. Differences in
the chemical composition of the passivation layer have been evidenced.
This work brings out the key-role of the SEI in the excellent performance of Sb or
antimonides materials as negative electrodes in Na. These results show that a great effort has
to be done in the direction of electrolyte and electrode formulation so that Na-ion batteries
become a reality.

MANUSCRIP
T
ACCEPTED
ACCEPTED MANUSCRIPT
24
Acknowledgments
The RS2E (Réseau sur le Stockage Electrochimique de l’Energie) network is acknowledged
for the financial support of A.D..
MANUSCRIP
T
ACCEPTED
ACCEPTED MANUSCRIPT
25
References
[1] P.G. Bruce, B. Scrosati, J.-M. Tarascon, Angewandte Chemie International Edition, 47
(2008) 2930-2946.
[2] N.-S. Choi, Z. Chen, S.A. Freunberger, X. Ji, Y.-K. Sun, K. Amine, G. Yushin, L.F.
Nazar, J. Cho, P.G. Bruce, Angewandte Chemie International Edition, 51 (2012) 9994-
10024.
[3] S.-W. Kim, D.-H. Seo, X. Ma, G. Ceder, K. Kang, Advanced Energy Materials, 2 (2012)
710-721.
[4] S. Komaba, W. Murata, T. Ishikawa, N. Yabuuchi, T. Ozeki, T. Nakayama, A. Ogata, K.
Gotoh, K. Fujiwara, Advanced Functional Materials, 21 (2011) 3859-3867.
[5] J. Liu, J.-G. Zhang, Z. Yang, J.P. Lemmon, C. Imhoff, G.L. Graff, L. Li, J. Hu, C. Wang,
J. Xiao, G. Xia, V.V. Viswanathan, S. Baskaran, V. Sprenkle, X. Li, Y. Shao, B. Schwenzer,
Advanced Functional Materials, 23 (2013) 929-946.
[6] Y.-U. Park, D.-H. Seo, H.-S. Kwon, B. Kim, J. Kim, H. Kim, I. Kim, H.-I. Yoo, K.
Kang, Journal of the American Chemical Society, 135 (2013) 13870-13878.
[7] M.D. Slater, D. Kim, E. Lee, C.S. Johnson, Advanced Functional Materials, 23 (2013)
947-958.
[8] V.L. Chevrier, G. Ceder, Journal of The Electrochemical Society, 158 (2011) A1011-
A1014.
[9] B.L. Ellis, L.F. Nazar, Current Opinion in Solid State and Materials Science, 16 (2012)
168-177.
[10] M.K. Datta, R. Epur, P. Saha, K. Kadakia, S.K. Park, P.N. Kumta, Journal of Power
Sources, 225 (2013) 316-322.
MANUSCRIP
T
ACCEPTED
ACCEPTED MANUSCRIPT
26
[11] L.D. Ellis, T.D. Hatchard, M.N. Obrovac, Journal of The Electrochemical Society, 159
(2012) A1801-A1805.
[12] Y. Xu, Y. Zhu, Y. Liu, C. Wang, Advanced Energy Materials, 3 (2013) 128-133.
[13] A. Darwiche, M.T. Sougrati, B. Fraisse, L. Stievano, L. Monconduit, Electrochemistry
Communications, 32 (2013) 18-21.
[14] L. Ji, M. Gu, Y. Shao, X. Li, M.H. Engelhard, B.W. Arey, W. Wang, Z. Nie, J. Xiao, C.
Wang, J.-G. Zhang, J. Liu, Advanced Materials, 26 (2014) 2901-2908.
[15] L. Xiao, Y. Cao, J. Xiao, W. Wang, L. Kovarik, Z. Nie, J. Liu, Chemical
Communications, 48 (2012) 3321-3323.
[16] L. Baggetto, E. Allcorn, A. Manthiram, G.M. Veith, Electrochemistry
Communications, 27 (2013) 168-171.
[17] L.c. Baggetto, K.J. Carroll, H.-Y. Hah, C.E. Johnson, D.R. Mullins, R.R. Unocic, J.A.
Johnson, Y.S. Meng, G.M. Veith, The Journal of Physical Chemistry C, 118 (2014) 7856-
7864.
[18] L. Baggetto, M. Marszewski, J. Gòrka, M. Jaroniec, G.M. Veith, Journal of Power
Sources, 243 (2013) 699-705.
[19] L. Baggetto, H.-Y. Hah, C.E. Johnson, C.A. Bridges, J.A. Johnson, G.M. Veith,
Physical Chemistry Chemical Physics, 16 (2014) 9538-9545.
[20] Q. Sun, Q.-Q. Ren, H. Li, Z.-W. Fu, Electrochemistry Communications, 13 (2011)
1462-1464.
[21] J. Qian, Y. Chen, L. Wu, Y. Cao, X. Ai, H. Yang, Chemical Communications, 48
(2012) 7070-7072.
[22] H. Zhu, Z. Jia, Y. Chen, N. Weadock, J. Wan, O. Vaaland, X. Han, T. Li, L. Hu, Nano
Letters, 13 (2013) 3093-3100.
MANUSCRIP
T
ACCEPTED
ACCEPTED MANUSCRIPT
27
[23] A. Darwiche, C. Marino, M.T. Sougrati, B. Fraisse, L. Stievano, L. Monconduit,
Journal of the American Chemical Society, 134 (2012) 20805-20811.
[24] Z. Jian, W. Han, X. Lu, H. Yang, Y.-S. Hu, J. Zhou, Z. Zhou, J. Li, W. Chen, D. Chen,
L. Chen, Advanced Energy Materials, 3 (2013) 156-160.
[25] S.W. Lee, B.M. Gallant, H.R. Byon, P.T. Hammond, Y. Shao-Horn, Energy &
Environmental Science, 4 (2011) 1972-1985.
[26] C. Marino, A. Darwiche, N. Dupré, H.A. Wilhelm, B. Lestriez, H. Martinez, R.
Dedryère, W. Zhang, F. Ghamouss, D. Lemordant, L. Monconduit, The Journal of Physical
Chemistry C, 117 (2013) 19302-19313.
[27] H. Pan, X. Lu, X. Yu, Y.-S. Hu, H. Li, X.-Q. Yang, L. Chen, Advanced Energy
Materials, 3 (2013) 1186-1194.
[28] S. Komaba, T. Ishikawa, N. Yabuuchi, W. Murata, A. Ito, Y. Ohsawa, ACS Applied
Materials & Interfaces, 3 (2011) 4165-4168.
[29] V. Sivasankaran, C. Marino, M. Chamas, P. Soudan, D. Guyomard, J.C. Jumas, P.E.
Lippens, L. Monconduit, B. Lestriez, Journal of Materials Chemistry, 21 (2011) 5076-5082.
[30] H.A. Wilhelm, C. Marino, A. Darwiche, L. Monconduit, B. Lestriez, Electrochemistry
Communications, 24 (2012) 89-92.
[31] D.A. Shirley, Physical Review B, 5 (1972) 4709-4714.
[32] J.H. Scofield, J. Electron Spectrosc. Relat. Phenom., 8 (1976) 129.
[33] L. El Ouatani, R. Dedryvère, J.B. Ledeuil, C. Siret, P. Biensan, J. Desbriéres, D.
Gonbeau, Journal of Power Sources, 189 (2009) 72-80.
[34] L. Bodenes, R. Naturel, H. Martinez, R. Dedryvèe, M. Menetrier, L. Croguennec, J.-P.
Pérès, C. Tessier, F. Fischer, Journal of Power Sources, 236 (2013) 265-275.
MANUSCRIP
T
ACCEPTED
ACCEPTED MANUSCRIPT
28
[35] J. Vetter, P. Novàk, M.R. Wagner, C. Veit, K.C. Möller, J.O. Besenhard, M. Winter, M.
Wohlfahrt-Mehrens, C. Vogler, A. Hammouche, Journal of Power Sources, 147 (2005) 269-
281.
[36] D. Aurbach, B. Markovsky, A. Shechter, Y. Ein Eli, H. Cohen, Journal of The
Electrochemical Society, 143 (1996) 3809-3820.
[37] S. Leroy, H. Martinez, R. Dedryvère, D. Lemordant, D. Gonbeau, Applied Surface
Science, 253 (2007) 4895-4905.
[38] R. Dedryvère, L. Gireaud, S. Grugeon, S. Laruelle, J.M. Tarascon, D. Gonbeau, The
Journal of Physical Chemistry B, 109 (2005) 15868-15875.
[39] S. Leroy, F. Blanchard, R. Dedryvère, H. Martinez, B. Carré, D. Lemordant, D.
Gonbeau, Surface and Interface Analysis, 37 (2005) 773-781.
[40] L. Baggetto, P. Ganesh, C.-N. Sun, R.A. Meisner, T.A. Zawodzinski, G.M. Veith,
Journal of Materials Chemistry A, 1 (2013) 7985-7994.
[41] M. Moshkovich, Y. Gofer, D. Aurbach, Journal of The Electrochemical Society, 148
(2001) E155-E167.
[42] J.S. Bridel, T. Azaïs, M. Morcrette, J.M. Tarascon, D. Larcher, Journal of The
Electrochemical Society, 158 (2011) A750-A759.
[43] B. Key, R. Bhattacharyya, M. Morcrette, V. Seznéc, J.-M. Tarascon, C.P. Grey, Journal
of the American Chemical Society, 131 (2009) 9239-9249.
MANUSCRIP
T
ACCEPTED
ACCEPTED MANUSCRIPT
29
Table captions
Table 1:
Polarization (Volts) and Irreversible capacity at the 1st cycle for the 4 cells studied.
*: difference between the potential at the half of the (n+1) charge and the potential at the half
of the (n) discharge.
Table 2:
XPS atomic percentages of antimony and oxygen attributed to the active material, of carbon
from the carbonaceous additives and of a) fluorine and carbon attributed to the PVdF binder
for the PVdF-based electrode,
b) Na from the CMC binder for the CMC-based electrode, at different stages of discharge
(1/2D1, 2/3D1 and D1) and charge (C1) during cycling versus lithium. B.E. stands for
“Binding Energy” (eV).
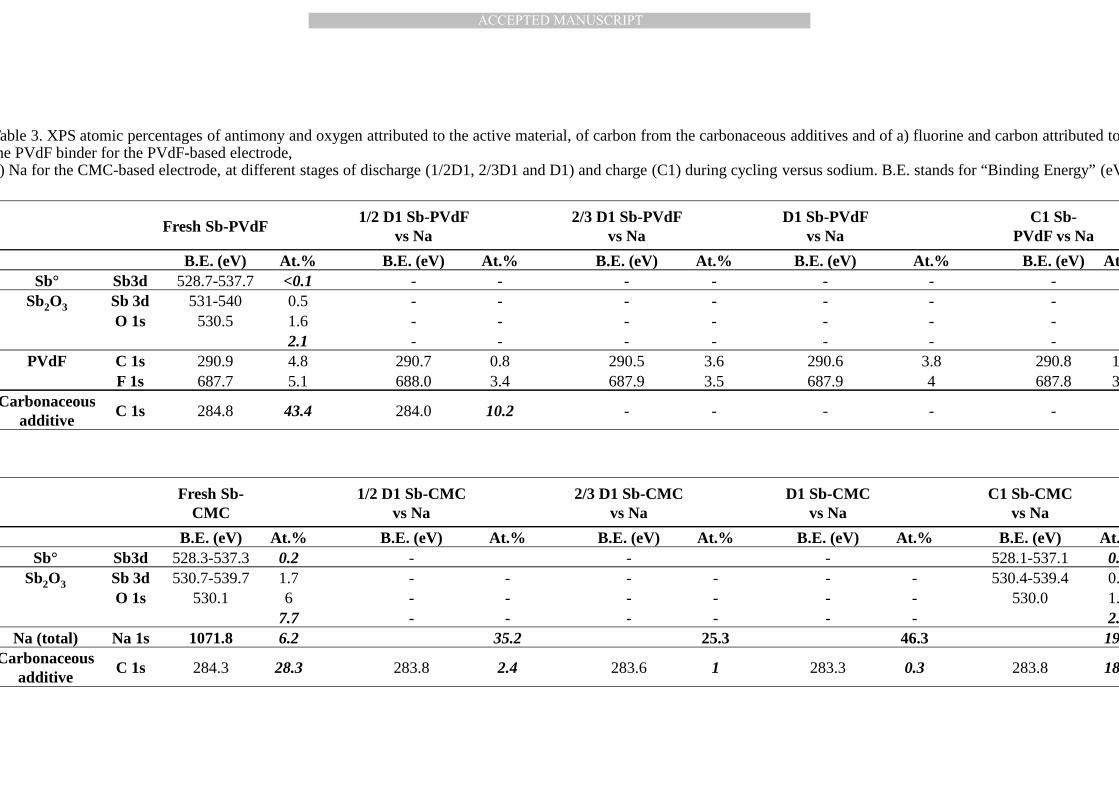
Table 3:
XPS atomic percentages of antimony and oxygen attributed to the active material, of carbon
from the carbonaceous additives and of a) fluorine and carbon attributed to the PVdF binder
for the PVdF-based electrode,
b) Na for the CMC-based electrode, at different stages of discharge (1/2D1, 2/3D1 and D1)
and charge (C1) during cycling versus sodium. B.E. stands for “Binding Energy” (eV).
MANUSCRIP
T
ACCEPTED
ACCEPTED MANUSCRIPT
30
Figure captions
Fig. 1:
Composition−voltage profile for Sb-CMC/Li (left, top), Sb-PVdF/Li (left, bottom), Sb-
CMC/Na (right, top) and Sb-PVdF/Na (right, bottom) cells cycled at C/2 rate between 1.5
and 0.02 V.
Fig. 2:
Charge capacity and cumulative losses plotted versus the cycle number for Sb-CMC
electrode vs Li (�) and vs Na (�).
Fig. 3:
The XPS O 1s and Sb 3d core peaks spectra of antimony powder and of the reference
electrodes formulated with antimony and CMC or PVdF binder.
Fig. 4:
a) The XPS O 1s and Sb 3d core peaks and b) C 1s core peaks spectra of the Sb-PVdF
electrode at different stages of the first cycle vs Li (1/2D1, 2/3D1, D1 and C1). The spectra
of the reference electrode are also presented.
Fig. 5:
a) The XPS F 1s core peaks and b) P 2p core peaks spectra of the Sb-PVdF electrode at
different stages of the first cycle vs Li (1/2D1, 2/3D1, D1 and C1). The spectrum of the
reference electrode is also presented.
Fig. 6:
a) The XPS O 1s and Sb 3d core peaks spectra. b) the valence band and c) C 1s core peaks
spectra of the Sb-CMC electrode at different stages of the first cycle vs Li (1/2D1, 2/3D1,
D1 and C1). The spectra of the Sb reference electrode are also presented.
MANUSCRIP
T
ACCEPTED
ACCEPTED MANUSCRIPT
31
Fig. 7:
a) The XPS O 1s and Sb 3d core peaks and b) C 1s core peaks spectra of the Sb-PVdF
electrode at different stages of the first cycle vs Na (1/2D1, 2/3D1, D1 and C1). The spectra
of the reference electrode are also presented.
Fig. 8:
a) The XPS F 1s core peaks and b) Cl 2p core peaks spectra of the Sb-PVdF electrode at
different stages of the first cycle vs Na (1/2D1, 2/3D1, D1 and C1). The spectrum of the
reference electrode is also presented.
Fig. 9
a) The XPS O 1s and Sb 3d core peaks and b) valence band of the Sb-CMC electrode at
different stages of the first cycle vs Na (1/2D1, 2/3D1, D1 and C1). The spectra of the
reference electrode are also presented.
Fig. 10:
a) The XPS Cl 2p core peaks, b) F 1s core peaks and c) Na 1s core peaks spectra of the Sb-
CMC electrode at different stages of the first cycle vs. Na (1/2D1, 2/3D1, D1 and C1). The
spectrum of the reference electrode is also presented.
MANUSCRIP
T
ACCEPTED
ACCEPTED MANUSCRIPTTable 1. Polarization (Volts) and Irreversible capacity at the 1st cycle for the 4 cells studied. *: difference between the potential at the half of the (n+1) charge and the potential at the half of the (n) discharge.
MANUSCRIP
T
ACCEPTED
ACCEPTED MANUSCRIPT
Fresh Sb-PVdF
1/2 D1 Sb-PVdF vs Li
2/3 D1 Sb-PVdF vs Li
D1 Sb-PVdF vs Li
C1 Sb-PVdF vs Li
B.E. (eV) At.% B.E. (eV) At.% B.E. (eV) At.% B.E. (eV) At.% B.E. (eV) At.%Sb° Sb3d 528.7-537.7 <0.1 - - - - - - - -
Sb2O3 Sb 3d 531-540 0.5 - - - - - - - -O 1s 530.5 1.6 - - - - - - - -
2.1 - - - - - - - -PVdF C 1s 290.9 4.8 290.8 2.4 290.9 3 291.3 1.8 291.3 2
F 1s 687.7 5.1 688.1 3.8 688.2 4.1 688.4 2.9 688.4 3.4Carbonaceous
additiveC 1s 284.5 43.4 - - - - - - - -
Fresh Sb-CMC
1/2 D1 Sb-CMC vs Li
2/3 D1 Sb-CMC vs Li
D1 Sb-CMC vs Li
C1 Sb-CMC vs Li
B.E. (eV) At.% B.E. (eV) At.% B.E. (eV) At.% B.E. (eV) At.% B.E. (eV) At.%Sb° Sb3d 528.3-537.3 0.2 - - - - - - 528.3-537.3 0.05
Sb2O3 Sb 3d 530.7-539.7 1.7 - - - - - - - -O 1s 530.1 6 - - - - - - - -
7.7 - - - - - - - -Na (fromCMC-Na) Na 1s 1071.8 6.2 1072.1 0.1 - - - - 1072.2 0.2
Carbonaceousadditive
C 1s 284.3 28.3 - - - - - - 284.0 5.2
Table 2. XPS atomic percentages of antimony and oxygen attributed to the active material, of carbon from the carbonaceous additives and of a) fluorine and carbon attributed to the PVdF binder for the PVdF-based electrode,b) Na from the CMC binder for the CMC-based electrode, at different stages of discharge (1/2D1, 2/3D1 and D1) and charge (C1) during cycling versus lithium. B.E. stands for “Binding Energy” (eV).
MANUSCRIP
T
ACCEPTED
ACCEPTED MANUSCRIPT
Fresh Sb-PVdF1/2 D1 Sb-PVdF
vs Na2/3 D1 Sb-PVdF
vs NaD1 Sb-PVdF
vs NaC1 Sb-
PVdF vs Na
B.E. (eV) At.% B.E. (eV) At.% B.E. (eV) At.% B.E. (eV) At.% B.E. (eV) At.%Sb° Sb3d 528.7-537.7 <0.1 - - - - - - - -
Sb2O3 Sb 3d 531-540 0.5 - - - - - - - -O 1s 530.5 1.6 - - - - - - - -
2.1 - - - - - - - -PVdF C 1s 290.9 4.8 290.7 0.8 290.5 3.6 290.6 3.8 290.8 1.6
F 1s 687.7 5.1 688.0 3.4 687.9 3.5 687.9 4 687.8 3.9Carbonaceous
additiveC 1s 284.8 43.4 284.0 10.2 - - - - - -
Fresh Sb-CMC
1/2 D1 Sb-CMC vs Na
2/3 D1 Sb-CMC vs Na
D1 Sb-CMC vs Na
C1 Sb-CMCvs Na
B.E. (eV) At.% B.E. (eV) At.% B.E. (eV) At.% B.E. (eV) At.% B.E. (eV) At.%Sb° Sb3d 528.3-537.3 0.2 - - - 528.1-537.1 0.7
Sb2O3 Sb 3d 530.7-539.7 1.7 - - - - - - 530.4-539.4 0.5O 1s 530.1 6 - - - - - - 530.0 1.9
7.7 - - - - - - 2.4Na (total) Na 1s 1071.8 6.2 35.2 25.3 46.3 19.2
Carbonaceousadditive
C 1s 284.3 28.3 283.8 2.4 283.6 1 283.3 0.3 283.8 18.8
Table 3. XPS atomic percentages of antimony and oxygen attributed to the active material, of carbon from the carbonaceous additives and of a) fluorine and carbon attributed to the PVdF binder for the PVdF-based electrode,b) Na for the CMC-based electrode, at different stages of discharge (1/2D1, 2/3D1 and D1) and charge (C1) during cycling versus sodium. B.E. stands for “Binding Energy” (eV).
MANUSCRIP
T
ACCEPTED
ACCEPTED MANUSCRIPT
Figure 1. Composition−voltage profile for Sb-CMC/Li (left, top), Sb-PVdF/Li (left, bottom), Sb-CMC/Na (right, top) and Sb-PVdF/Na (right, bottom) cells cycled at C/2 rate between 1.5 and 0.02 V.
MANUSCRIP
T
ACCEPTED
ACCEPTED MANUSCRIPT
Figure 2. Charge capacity and cumulative losses plotted versus the cycle number for Sb-CMC electrode vs Li (�) and vs Na (�).
MANUSCRIP
T
ACCEPTED
ACCEPTED MANUSCRIPT
Figure 3. The XPS O 1s and Sb 3d core peaks spectra of antimony powder and of the reference electrodes formulated with antimony and CMC or PVdF binder.
MANUSCRIP
T
ACCEPTED
ACCEPTED MANUSCRIPT
Figure 4.a) The XPS O 1s and Sb 3d core peaks and b) C 1s core peaks spectra of the Sb-PVdF electrode at different stages of the first cycle vs Li (1/2D1, 2/3D1, D1 and C1). The spectra of the reference electrode are also presented.
MANUSCRIP
T
ACCEPTED
ACCEPTED MANUSCRIPT
Figure 5.a) The XPS F 1s core peaks and b) P 2p core peaks spectra of the Sb-PVdF electrode at different stages of the first cycle vs Li (1/2D1, 2/3D1, D1 and C1). The spectrum of the reference electrode is also presented.
MANUSCRIP
T
ACCEPTED
ACCEPTED MANUSCRIPT
Figure 6.a) The XPS O 1s and Sb 3d core peaks spectra. b) the valence band and c) C 1s core peaks spectra of the Sb-CMC electrode at different stages of the first cycle vs Li (1/2D1, 2/3D1, D1 and C1). The spectra of the Sb reference electrode are also presented.
MANUSCRIP
T
ACCEPTED
ACCEPTED MANUSCRIPT
Figure 7.a) The XPS O 1s and Sb 3d core peaks and b) C 1s core peaks spectra of the Sb-PVdF electrode at different stages of the first cycle vs Na (1/2D1, 2/3D1, D1 and C1). The spectra of the reference electrode are also presented.
MANUSCRIP
T
ACCEPTED
ACCEPTED MANUSCRIPT
Figure 8.a) The XPS F 1s core peaks and b) Cl 2p core peaks spectra of the Sb-PVdF electrode at different stages of the first cycle vs Na (1/2D1, 2/3D1, D1 and C1). The spectrum of the reference electrode is also presented.
MANUSCRIP
T
ACCEPTED
ACCEPTED MANUSCRIPT
Figure 9.a) The XPS O 1s and Sb 3d core peaks and b) valence band of the Sb-CMC electrode at different stages of the first cycle vs Na (1/2D1, 2/3D1, D1 and C1). The spectra of the reference electrode are also presented.
MANUSCRIP
T
ACCEPTED
ACCEPTED MANUSCRIPT
Figure 10.a) The XPS Cl 2p core peaks, b) F 1s core peaks and c) Na 1s core peaks spectra of the Sb-CMC electrode at different stages of the first cycle vs. Na (1/2D1, 2/3D1, D1 and C1). The spectrum of the reference electrode is also presented.
MANUSCRIP
T
ACCEPTED
ACCEPTED MANUSCRIPTHighlights
• Sb electrodes formulated with CMC or PVdF as a binder cycled versus Li and Na. • Outstanding performances of antimony electrode vs Na when it is prepared with CMC. • Electrochemical performances related to the XPS study of SEI composition/thickness. • Thinner passivation film formed at the Sb electrode when cycled versus Na. • SEI homogeneously thick on the Sb-CMC electrode, not on the Sb-PVdF electrode.
MANUSCRIP
T
ACCEPTED
ACCEPTED MANUSCRIPT
Fresh Sb-PVdF1/2 D1 Sb-PVdF
vs. Li2/3 D1 Sb-PVdF
vs. LiD1 Sb-PVdF
vs. LiC1 Sb-PVdF
vs. Li
B.E. (eV) At.% At.% At.% At.% At.%
C 1s -C-C,-C-H 285.0 20.0 24.5 19.4 14.8 2.4
-CO 286.1 4.6 17.9 16.8 21.0 1.5
-CO2 287.5 7.8 9.4 8.3 8.0 2.5
-CO3 289.5 - 3.4 3.7 2.2 3.0
F 1s LiF 685.2 - 3.0 3.8 3.9 1.4LiPF6/Fluorophosphates 686.5 - 3.8 4.6 6.0 8.7
P 2p Phosphates 134.2 - 0.3 0.3 0.3 0.3Fluorophosphates 136.0 - 0.9 0.3 0.6 0.5
LiPF6 138.0 - - 0.5 0.3 0.3
O 1s« -CO », « -CO2 », « -CO3 »,
(fluoro)phosphates- 3.6 14.0 15,3 14,4 13,4
Li 1s Total - - 11.2 15.6 19.8 16.0
Table 1. Atomic percentages of carbon, fluorine, phosphorus, oxygen and lithium detected by XPS in the SEI formed at the surface of the Sb-PVdF electrode, at different stages of discharge (1/2D1, 2/3D1 and D1) and charge (C1) during cycling versus Li.
Supplementary data
MANUSCRIP
T
ACCEPTED
ACCEPTED MANUSCRIPT
Fresh Sb-CMC1/2 D1 Sb-CMC
vs. Li2/3 D1 Sb-CMC
vs. LiD1 Sb-CMC
vs. LiC1 Sb-CMC
vs. LiB.E. (eV)
At.% At.% At.% At.% At.%
C 1s -C-C,-C-H 285.0 14.2 21.9 10.0 32.6 27.1-CO 286.3 18.7 1.7 1.4 2.8 5.1-CO2 288.1 7.1 - 0.3 - 3.1-CO3 289.8 2.2 0.5 0.2 1.3 2.1
F 1s LiF 684.9 - 2.0 1.4 0.4 7.9LiPF6/Fluorophosphates - - - - - -
P 2p Phosphates 133.2 - 0.2 - - -Fluorophosphates - - - - - -
LiPF6 - - - - - -
O 1s Li2O 528.8 - 13.0 16.8 4.1 1.0LiOH, « -CO », « -CO2 »,
« -CO3 », (fluoro)phosphates531.5 14.2 15.3 11.0 21.0 20.6
Li 1s Total - - 45.4 56.6 37.8 27.5
Table 2. Atomic percentages of carbon, fluorine, phosphorus, oxygen and lithium detected by XPS in the SEI formed at the surface of the Sb-CMC electrode, at different stages of discharge (1/2D1, 2/3D1 and D1) and charge (C1) during cycling versus Li.
Supplementary data
MANUSCRIP
T
ACCEPTED
ACCEPTED MANUSCRIPT
Fresh Sb-PVdF1/2 D1 Sb-PVdF
vs Na2/3 D1 Sb-PVdF
vs NaD1 Sb-PVdF
vs NaC1 Sb-PVdF
vs NaB.E. (eV)
At.% At.% At.% At.% At.%
C 1s -C-C,-C-H 285.0 20.0 20.2 22.9 21.1 25.7-CO 286.1 4.6 10.7 12.4 11.0 11.1-CO2 287.5 7.8 4.1 8.3 8.8 4.7-CO3 289.5 - 4.7 4.6 4.0 2.4
F 1s NaF 684.7 6.8 4.8 7.0 6.7
Cl 2p NaCl 198.7 - 0.5 0.5 0.4 0.4NaClO3 206.5 - 0.1 0.1 0.2 0.2NaClO4 208.6 - 0.8 0.7 0.8 0.8
O 1s Carbonates 531.6 - 14.3 12.7 12.0 11.5Ether, NaClOx 533.1 3.6 3.4 5.4 5.2 5.6
Na 1s Total - - 18.1 18.0 18.4 21.9
Table 3. Atomic percentages of carbon, fluorine, chlorine, oxygen and sodium detected by XPS in the SEI formed at the surface of the Sb-PVdF electrode, at different stages of discharge (1/2D1, 2/3D1 and D1) and charge (C1) during cycling versus Na.
Supplementary data
MANUSCRIP
T
ACCEPTED
ACCEPTED MANUSCRIPT
Fresh Sb-CMC1/2 D1 Sb-CMC
vs Na2/3 D1 Sb-CMC
vs NaD1 Sb-CMC
vs NaC1 Sb-CMC
vs Na
B.E. (eV) At.% At.% At.% At.% At.%
C 1s -C-C,-C-H 285.0 14.2 19.5 14.9 9.3 25.7-CO 286.3 18.7 4.0 11.7 8.8 13.2-CO2 288.1 7.1 0.9 7.5 2.8 5.5-CO3 289.8 2.2 5.8 4.2 2.0 2.9
F 1s NaF 684.5 - 0.2 1.1 0.9 7.5
Cl 2p NaCl 198.6 - 0.2 0.3 0.3 0.7NaClO3 206.5 - - - - <0.1NaClO4 208.6 - - <0.1 <0.1 0.3
O 1s Total (except Sb2O3) - 14.2 14.3 12.7 12.0 11.5
Na 1s Total - 6.2 35.2 25.3 46.3 19.2
Table 4. Atomic percentages of carbon, fluorine, chlorine, oxygen and sodium detected by XPS in the SEI formed at the surface of the Sb-CMC electrode, at different stages of discharge (1/2D1, 2/3D1 and D1) and charge (C1) during cycling versus Na.
Supplementary data
Related Documents