The Solar and Wind Energy Resource Assessment (SWERA) Decision Support System (DSS) Benchmarking Report Eugene A. Fosnight, United States Geological Survey Eric Wood, United States Geological Survey Omar El Gayar, Dakota State University David Rennè, United States National Renewable Energy Laboratory Paul Stackhouse, National Aeronautics and Space Administration Michelle Anthony, SGT contractor for the United States Geological Survey Guleid Artan, ASRC contractor for the United States Geological Survey Shannon Cowlin, United States National Renewable Energy Laboratory Lucas Michels, Dakota State University September 2010

Welcome message from author
This document is posted to help you gain knowledge. Please leave a comment to let me know what you think about it! Share it to your friends and learn new things together.
Transcript

The Solar and Wind Energy Resource Assessment (SWERA) Decision Support System (DSS) Benchmarking Report
Eugene A. Fosnight, United States Geological Survey Eric Wood, United States Geological Survey Omar El Gayar, Dakota State University David Rennè, United States National Renewable Energy Laboratory Paul Stackhouse, National Aeronautics and Space Administration Michelle Anthony, SGT contractor for the United States Geological Survey Guleid Artan, ASRC contractor for the United States Geological Survey Shannon Cowlin, United States National Renewable Energy Laboratory Lucas Michels, Dakota State University
September 2010

Acknowledgements
This report is a joint work of employees of the United States Geological Survey, Stinger Ghafarian Technologies, Arctic Slope Research Corporation Research and Technology Solutions, National Renewable Energy Laboratory, Dakota State University, South Dakota State University and National Aeronautics and Space Administration under NASA ROSES Decisions 05 award NNA06CH74I.
The authors appreciate the contributions of Shahriar Pervez, Melissa Wegner, Melissa Mathias, Kwabena Asante, Yolande Munzimi, and William Chandler.
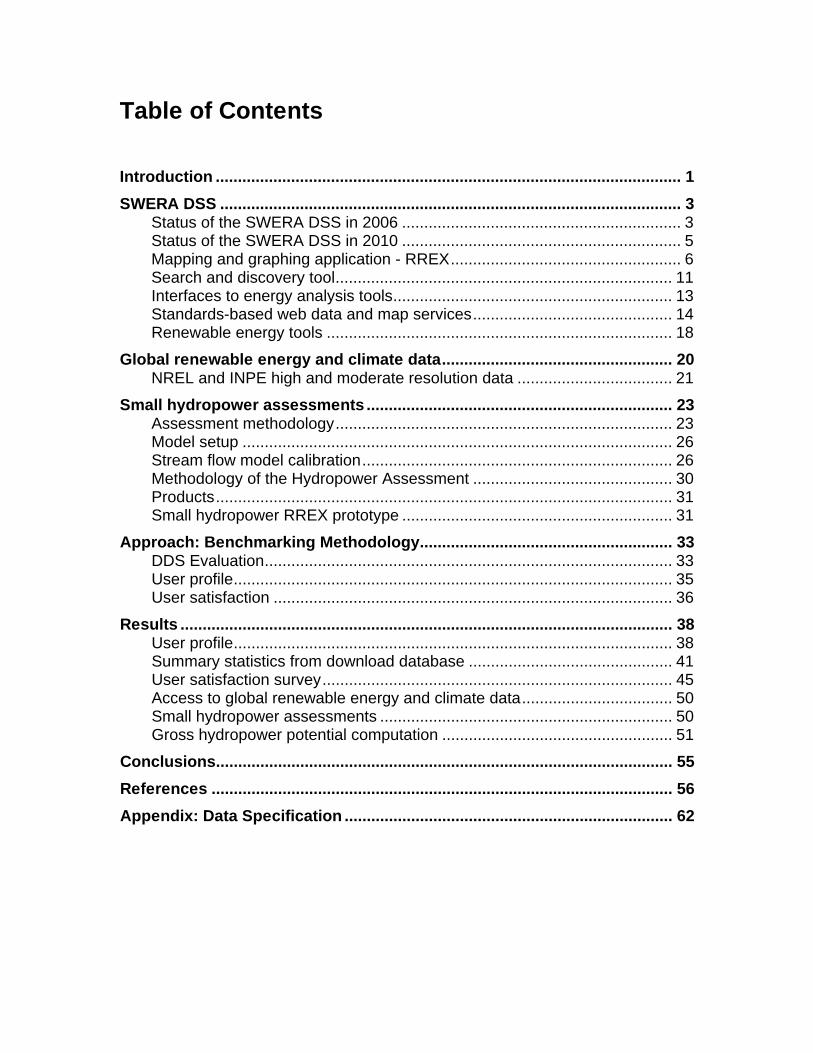
Table of Contents
Introduction ......................................................................................................... 1 SWERA DSS ........................................................................................................ 3
Status of the SWERA DSS in 2006 ............................................................... 3 Status of the SWERA DSS in 2010 ............................................................... 5 Mapping and graphing application - RREX.................................................... 6 Search and discovery tool............................................................................ 11 Interfaces to energy analysis tools............................................................... 13 Standards-based web data and map services............................................. 14 Renewable energy tools .............................................................................. 18
Global renewable energy and climate data.................................................... 20 NREL and INPE high and moderate resolution data ................................... 21
Small hydropower assessments ..................................................................... 23 Assessment methodology............................................................................ 23 Model setup ................................................................................................. 26 Stream flow model calibration...................................................................... 26 Methodology of the Hydropower Assessment ............................................. 30 Products....................................................................................................... 31 Small hydropower RREX prototype ............................................................. 31
Approach: Benchmarking Methodology......................................................... 33 DDS Evaluation............................................................................................ 33 User profile................................................................................................... 35 User satisfaction .......................................................................................... 36
Results ............................................................................................................... 38 User profile................................................................................................... 38 Summary statistics from download database .............................................. 41 User satisfaction survey............................................................................... 45 Access to global renewable energy and climate data.................................. 50 Small hydropower assessments .................................................................. 50 Gross hydropower potential computation .................................................... 51
Conclusions....................................................................................................... 55 References ........................................................................................................ 56 Appendix: Data Specification .......................................................................... 62

1
Introduction This Benchmark Report is the third in a series of three reports. The evaluation report defined the requirements of the Solar and Wind Energy Resource Assessment (SWERA) project and investigated the NASA alternatives for improving the SWERA Decision Support System (DSS). Among the alternatives were the inclusion of the NASA Power results to provide global coverage, and the inclusion of NASA Digital Elevation Models (DEM) and precipitation results for the implementation of small-hydropower assessments. The Verification & Validation report focused on the integration of NASA POWER research results and the use of high-resolution elevation data and precipitation data within the scope of this project. In the Benchmarking report, we will attempt to quantify our success in meeting the goal of using NASA Earth Science results to improve the SWERA DSS designed to provide quantitative renewable energy information to individuals and organizations so informed decisions can be made in the development of renewable energy resources. The Solar and Wind Energy Resource Assessment (SWERA) began in 2001 with support from the Global Environment Facility within the United Nations Environment Programme (UNEP) with contributions by many national agencies. SWERA was initially a country-centric project focused on the production of National Solar and Wind Assessments supporting renewable energy decision makers in 13 countries within a global framework that included several continental datasets.
In 2005 with support from NASA, SWERA began the transition into a global decision support system DSS with integrated tools including prototype small hydropower assessments to complement the solar and wind assessments. NASA global renewable energy assessments and climate data were integrated into SWERA to provide global coverage and a more complete portfolio of information needed to assess the global renewable energy potential.
The United States National Renewable Energy Laboratory (NREL) contributed renewable energy expertise and 27 national data sets. The United States Geological Survey (USGS) developed prototype hydropower datasets for two countries. The UNEP office at USGS EROS partnered with Dakota State University (DSU) to evolve the SWERA DSS and to develop the Renewable energy Resource EXplorer (RREX) for query and visualization of the renewable energy data including a prototype small hydropower mapping tool. Standards-compliant map and data web services were integrated into GIS and energy analysis system. DSU developed the user survey used to assess the usability of the SWERA DSS.
The goal of the SWERA DSS is to provide access to renewable energy information to anyone (Figure 1). This is accomplished by working with national
2
producers of renewable energy assessments and by providing a common mapping and database interface for consumers of the information.
Figure 1. SWERA overview
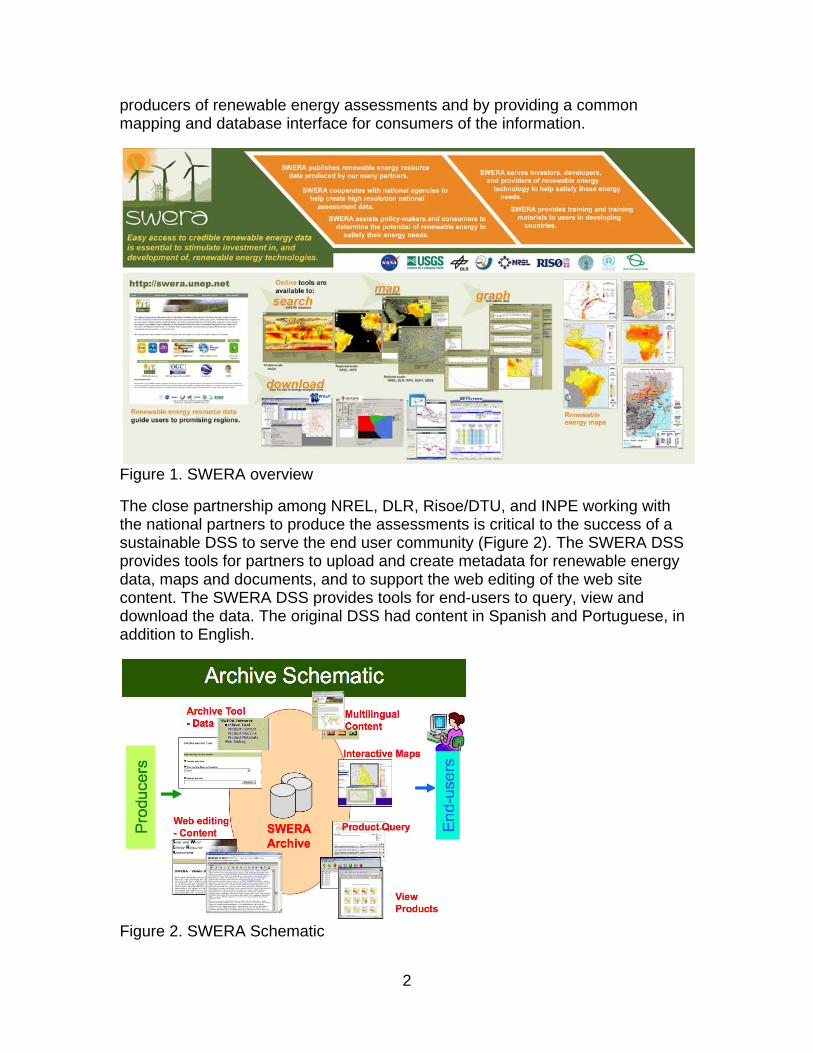
The close partnership among NREL, DLR, Risoe/DTU, and INPE working with the national partners to produce the assessments is critical to the success of a sustainable DSS to serve the end user community (Figure 2). The SWERA DSS provides tools for partners to upload and create metadata for renewable energy data, maps and documents, and to support the web editing of the web site content. The SWERA DSS provides tools for end-users to query, view and download the data. The original DSS had content in Spanish and Portuguese, in addition to English.
Figure 2. SWERA Schematic
3
The NASA ROSES SWERA project support the evolution of the underlying system architecture to support improved analysis tools within the SWERA DSS and to support standard-compliant map and data web services throughout the renewable energy user community. The incorporation of NASA’s global database of renewable energy and climate data makes SWERA truly global in scope. The depth of the time series of the NASA Science data provides needed information describing the variability of the resource data. The small hydropower prototype builds on the NASA SRTM elevation and TRMM rainfall estimates for estimates of small hydropower potential.
SWERA DSS
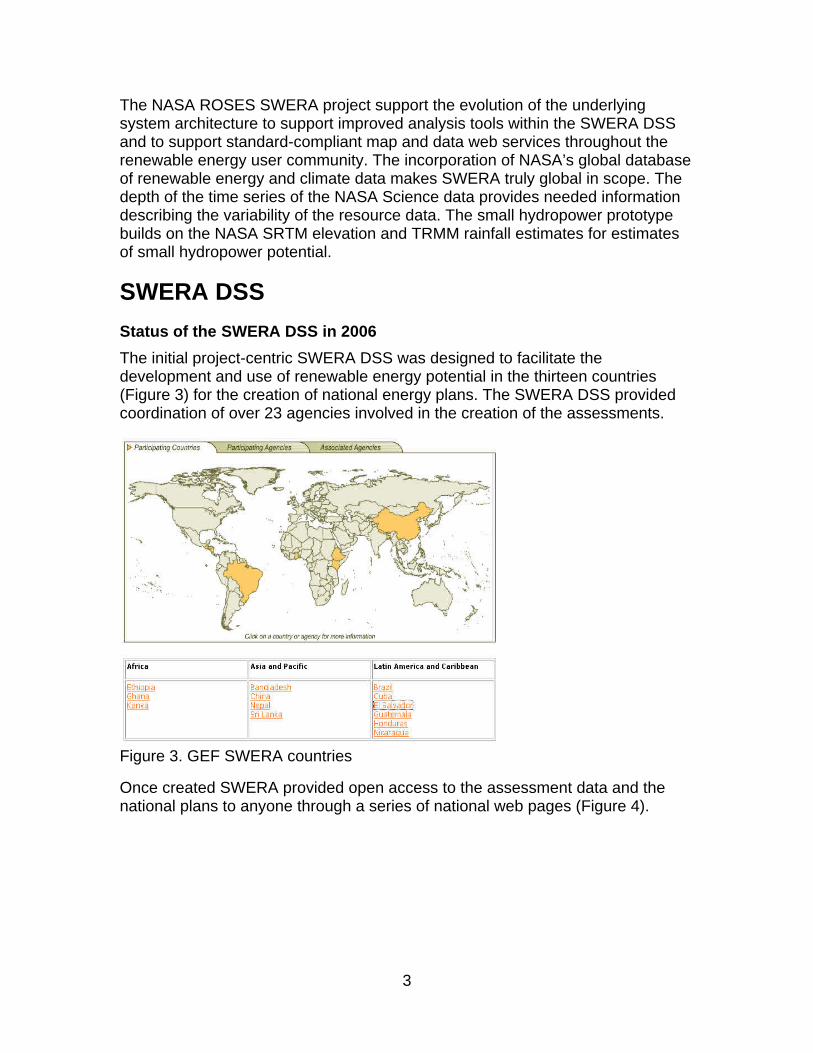
Status of the SWERA DSS in 2006 The initial project-centric SWERA DSS was designed to facilitate the development and use of renewable energy potential in the thirteen countries (Figure 3) for the creation of national energy plans. The SWERA DSS provided coordination of over 23 agencies involved in the creation of the assessments.
Figure 3. GEF SWERA countries
Once created SWERA provided open access to the assessment data and the national plans to anyone through a series of national web pages (Figure 4).
4
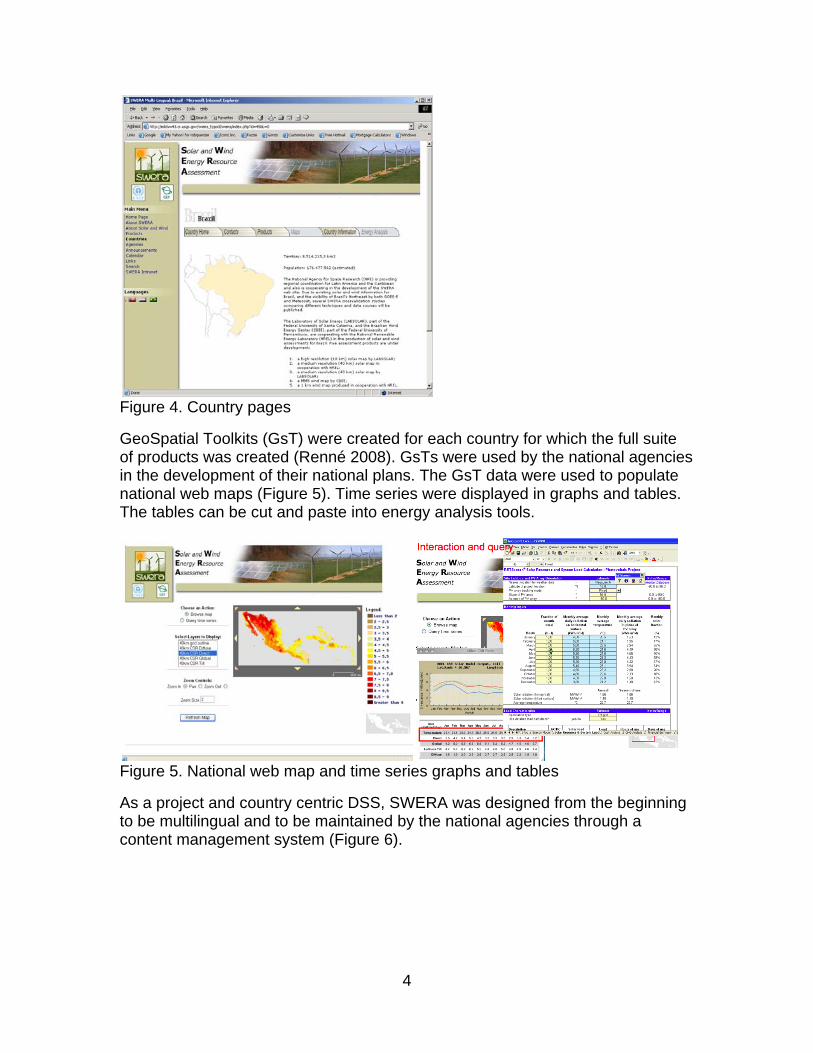
Figure 4. Country pages
GeoSpatial Toolkits (GsT) were created for each country for which the full suite of products was created (Renné 2008). GsTs were used by the national agencies in the development of their national plans. The GsT data were used to populate national web maps (Figure 5). Time series were displayed in graphs and tables. The tables can be cut and paste into energy analysis tools.
Figure 5. National web map and time series graphs and tables
As a project and country centric DSS, SWERA was designed from the beginning to be multilingual and to be maintained by the national agencies through a content management system (Figure 6).
5
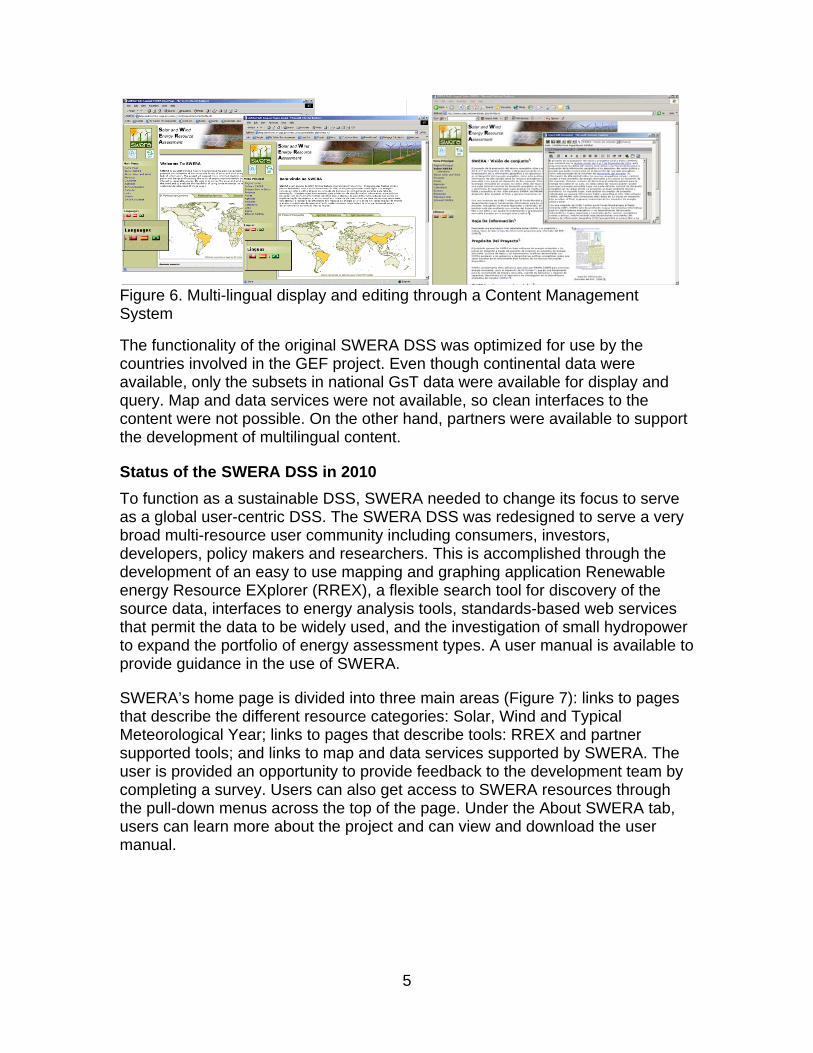
Figure 6. Multi-lingual display and editing through a Content Management System
The functionality of the original SWERA DSS was optimized for use by the countries involved in the GEF project. Even though continental data were available, only the subsets in national GsT data were available for display and query. Map and data services were not available, so clean interfaces to the content were not possible. On the other hand, partners were available to support the development of multilingual content.
Status of the SWERA DSS in 2010 To function as a sustainable DSS, SWERA needed to change its focus to serve as a global user-centric DSS. The SWERA DSS was redesigned to serve a very broad multi-resource user community including consumers, investors, developers, policy makers and researchers. This is accomplished through the development of an easy to use mapping and graphing application Renewable energy Resource EXplorer (RREX), a flexible search tool for discovery of the source data, interfaces to energy analysis tools, standards-based web services that permit the data to be widely used, and the investigation of small hydropower to expand the portfolio of energy assessment types. A user manual is available to provide guidance in the use of SWERA.
SWERA’s home page is divided into three main areas (Figure 7): links to pages that describe the different resource categories: Solar, Wind and Typical Meteorological Year; links to pages that describe tools: RREX and partner supported tools; and links to map and data services supported by SWERA. The user is provided an opportunity to provide feedback to the development team by completing a survey. Users can also get access to SWERA resources through the pull-down menus across the top of the page. Under the About SWERA tab, users can learn more about the project and can view and download the user manual.

6
Figure 7. SWERA home page as of August 2010
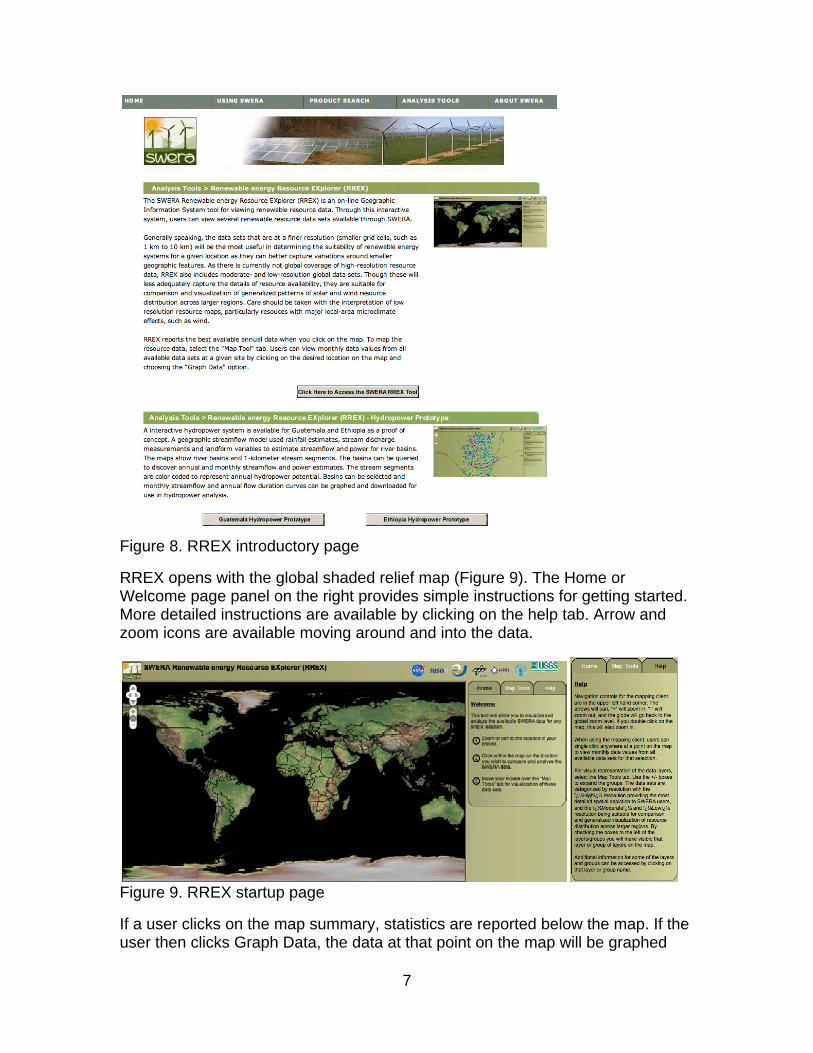
Mapping and graphing application - RREX RREX, SWERA’s online interactive mapping and graphing application, permits users to map, query and graph renewable energy information provided by the SWERA partners through a consistent and easy to use interface. RREX’s introductory page can be reached from SWERA’s home page where links to the primary solar and wind RREX and the prototype small hydropower RREX applications can be found (Figure 8).
7
Figure 8. RREX introductory page
RREX opens with the global shaded relief map (Figure 9). The Home or Welcome page panel on the right provides simple instructions for getting started. More detailed instructions are available by clicking on the help tab. Arrow and zoom icons are available moving around and into the data.
Figure 9. RREX startup page
If a user clicks on the map summary, statistics are reported below the map. If the user then clicks Graph Data, the data at that point on the map will be graphed

8
(Figure 10). The default graph option is to show the highest spatial resolution data available for each resource type. Multiple sources may be available and are represented by colored labels. These can be turned on individually or the default can be changed to show all available layers.
Figure 10. RREX map with graphs
The Map Tools tab has functionality to support zooming to regions and plotting resource data over the shaded relief (Figure 11). The example shows the high resolution Direct Normal Irradiance data plotted over the moderate resolution data representing the highest resolution data for Africa. The graph shows the three sources of DNI available for a location in Ethiopia. Investors and funding organizations often require multiple independent energy resource estimates. For many resources monthly data are available and for some monthly min/max values represented by vertical bars are available that bound the estimates. If monthly data are not available, the annual estimate is plotted as a dotted line.
Figure 11. Direct Normal Irradiance maps and graphs

9
If monthly data are available, a map of the monthly estimates can be mapped by clicking on a data point on the graph (Figure 12). The monthly maps show the spatial distribution of the resource in the vicinity of the graphed point and by clicking on the individual months or play a user can see how the region changes through time.
Figure 12. Monthly renewable resource maps
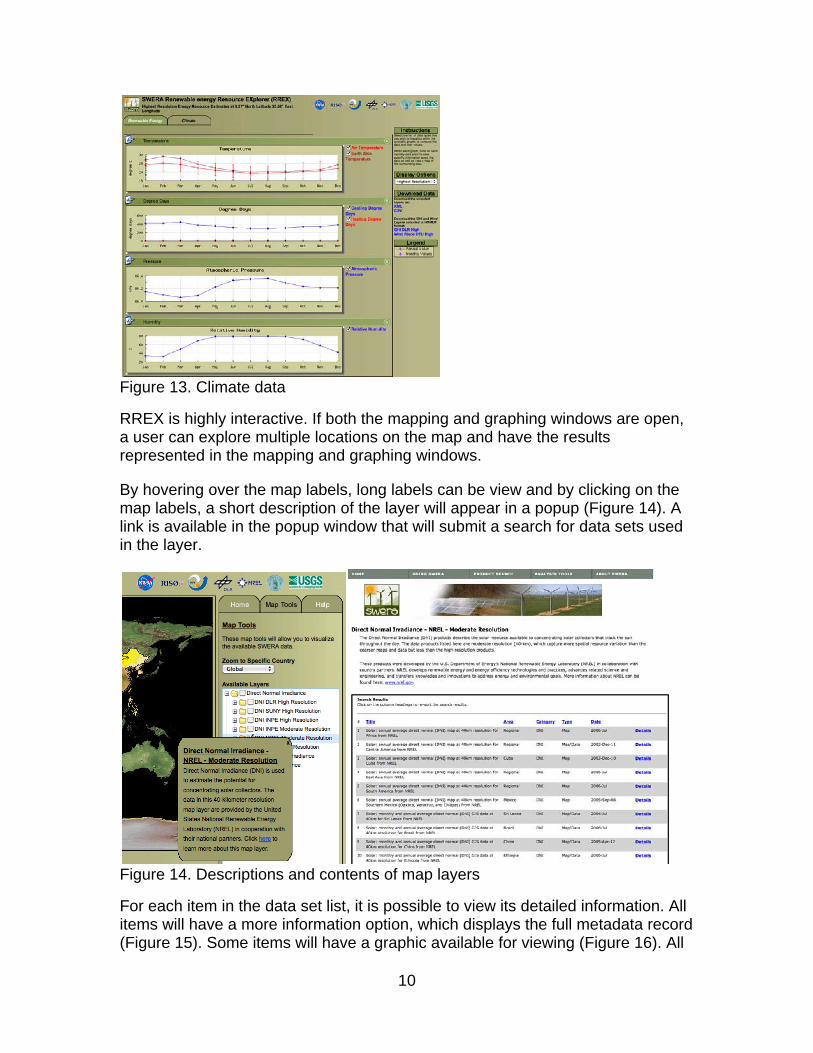
The climate tab on the graphing page shows the time series for climate data (Figure 13). The data available for graphing are air temperature at 10 m above ground, cooling degree-days above 10 degrees Celsius, heating degree-days below 18 degrees Celsius, atmospheric pressure, relative humidity at 10 meters above ground, and Earth skin temperature. All climate data have monthly mean estimates. Air temperature has 10% and 90% quantiles about the mean monthly estimates. These data are needed for renewable energy models.
10
Figure 13. Climate data
RREX is highly interactive. If both the mapping and graphing windows are open, a user can explore multiple locations on the map and have the results represented in the mapping and graphing windows.
By hovering over the map labels, long labels can be view and by clicking on the map labels, a short description of the layer will appear in a popup (Figure 14). A link is available in the popup window that will submit a search for data sets used in the layer.
Figure 14. Descriptions and contents of map layers
For each item in the data set list, it is possible to view its detailed information. All items will have a more information option, which displays the full metadata record (Figure 15). Some items will have a graphic available for viewing (Figure 16). All

11
items will have an option to download from SWERA, a link to a partner download site, or both.
Figure 15. Metadata summary and detail
Figure 16. View image and download product
Search and discovery tool SWERA provides many avenues of access to partner data. In addition to the option to download within RREX, under the Using SWERA pull-down menu and through the Resource Information icons, a user can learn more about the resource types and then submit searches for those resources. From the Product Search pull-down menu, a user can directly search the SWERA database by energy category, product type, geography, or can build their own search (Figure 17).

12
Figure 17. Product search
Entering SWERA through the Resource Information icons provides users access to information about the different energy categories and product types, and to direct searches for those energy categories and product types (Figure 18). Once a user gets the search results, they can further restrict their search to a geographic area.
Figure 18. Resource Information page

13
Partners can provide data for inclusion in the SWERA database, can provide links to data held on the partners website, or both. The only requirement is that the data be open to access by anyone with no restrictions on use or redistribution beyond citing the data provider.
Interfaces to energy analysis tools RREX is only one of the analysis tools available through SWERA (Figure 19). Geospatial Toolkits (GsT) are available for the original 13 GEF countries (from SWERA and NREL), plus Afghanistan and Pakistan (from NREL). Homer developed at NREL and RETScreen developed and supported at Natural Resource Canada are energy analysis tools for performing detailed analysis of the costs and benefits of renewable energy alternatives (Lambert et al. 2006; Renné 2008; CanREN 2006; Georgilakis 2005). Data from the graphing tool can be download as comma separated variable (CSV) files or as extended Markup Language (XML) files for ingest into Homer, RETScreen or other energy analysis tools including statistical, database, spreadsheet, and graphing packages.
Figure 19. Analysis tools
The GsT data bundled with the software can be downloaded to implement simple geographic models to identify areas that not only have good potential, but that are developable. The GsTs provide an introduction to these models, but intensive analysis requires the source data be modeled within a more comprehensive GIS. Geographic Information Systems (GIS) are needed to implement complex geographic models and detailed site models using data, such terrain, terrain shadows, infrastructure, existing capacity, protected areas, vegetation and population, that may be available to the local user community to complement the renewable energy and climate data.
14
Standards-based web data and map services RREX provides an easy to use system to explore, query, compare and visualize renewable data. The map and data services used by RREX to generate the maps and graphs are also available for use by the energy analysis community to ingest and utilize the renewable energy and climate data from the SWERA Database into mapping and analysis tools.
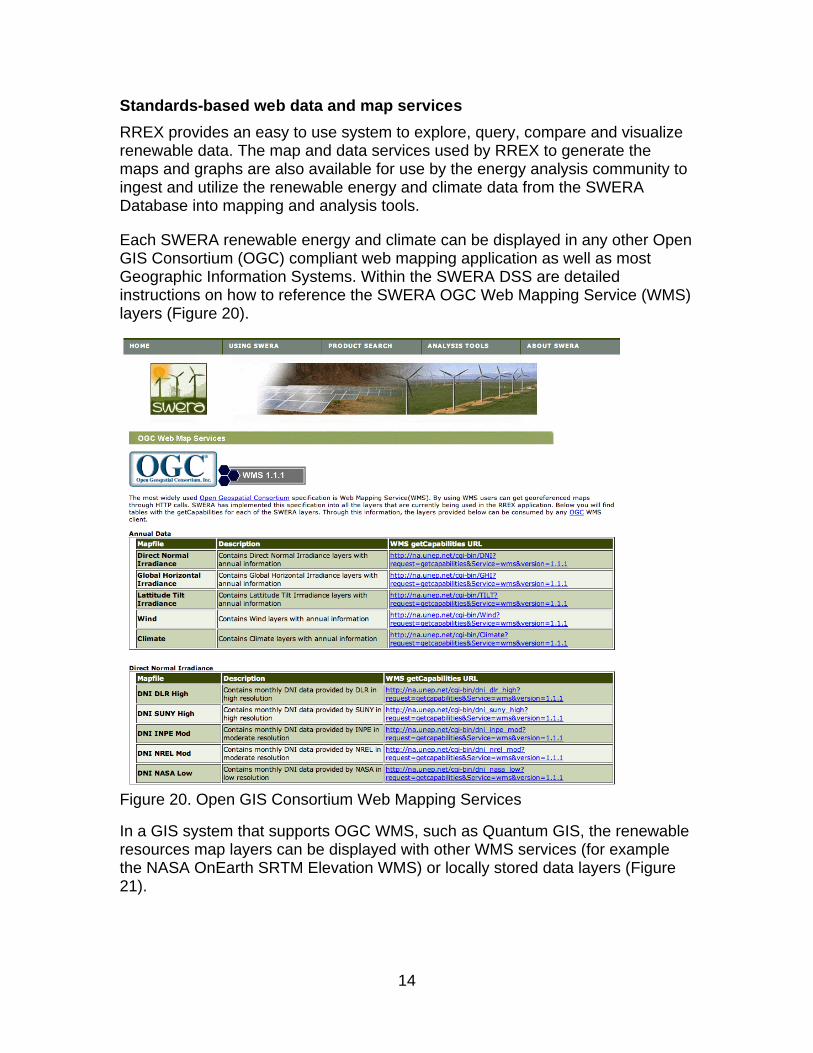
Each SWERA renewable energy and climate can be displayed in any other Open GIS Consortium (OGC) compliant web mapping application as well as most Geographic Information Systems. Within the SWERA DSS are detailed instructions on how to reference the SWERA OGC Web Mapping Service (WMS) layers (Figure 20).
Figure 20. Open GIS Consortium Web Mapping Services
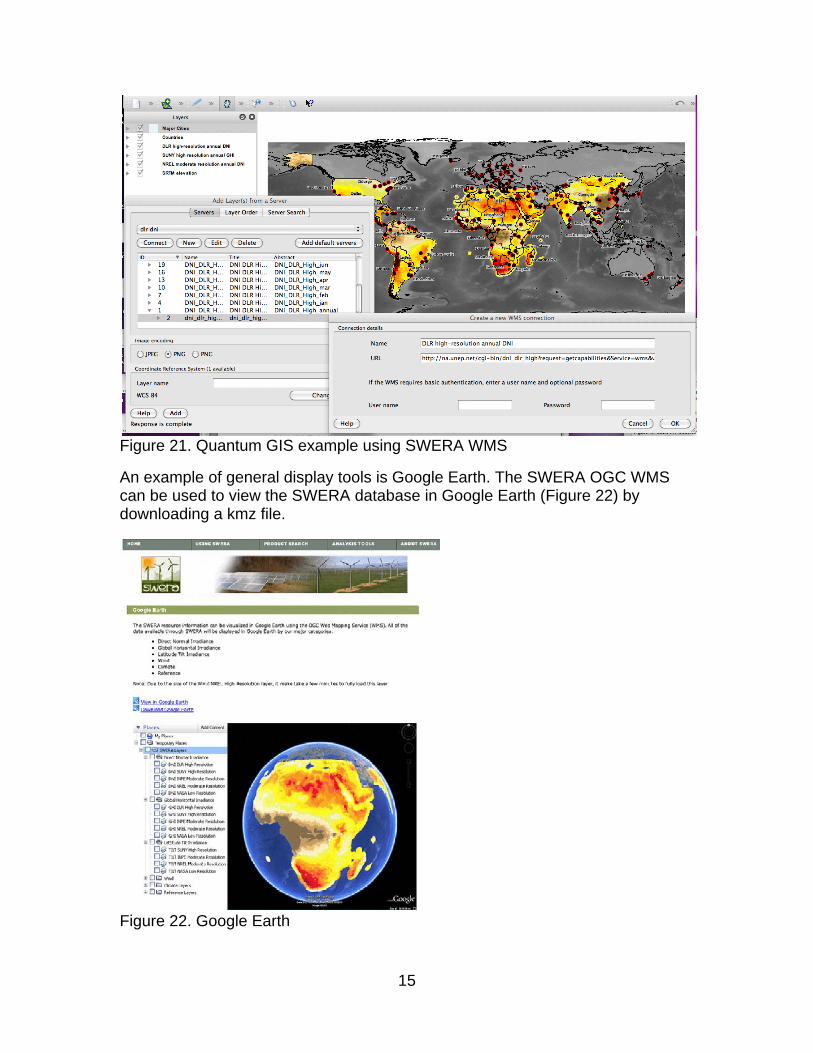
In a GIS system that supports OGC WMS, such as Quantum GIS, the renewable resources map layers can be displayed with other WMS services (for example the NASA OnEarth SRTM Elevation WMS) or locally stored data layers (Figure 21).
15
Figure 21. Quantum GIS example using SWERA WMS
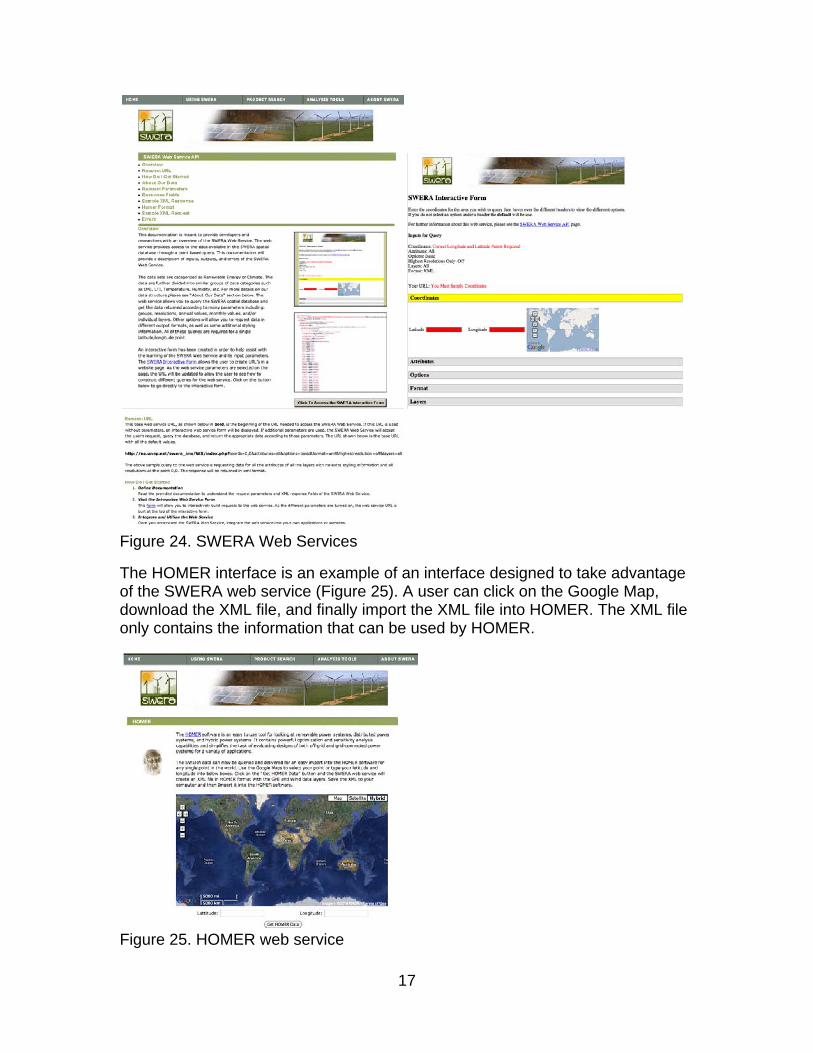
An example of general display tools is Google Earth. The SWERA OGC WMS can be used to view the SWERA database in Google Earth (Figure 22) by downloading a kmz file.
Figure 22. Google Earth

16
The SWERA DSS provides many paths to download data at specific point locations for use in energy analysis systems. The simplest path is select XML or CSV on the Download Data section of the graphing page (Figure 23). This option will create a text file in either XML or CSV format. These formats are supported by most spreadsheet, statistics and database packages. They are also formats supported by most energy analysis tools. The HOMER formatted XML files, for example, can be opened by NREL’s HOMER energy analysis tool.
Figure 23. Download Data option from the Graph in Figure 11.
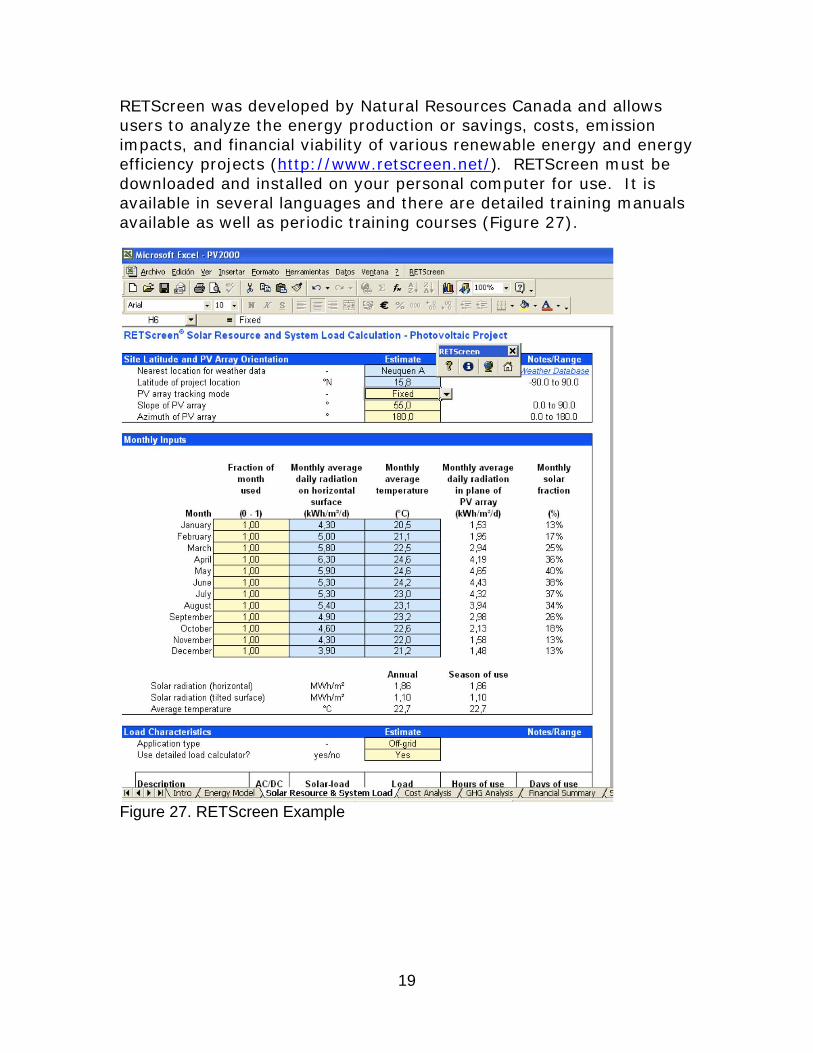
SWERA Web Services provide access to data services that can ingest the SWERA variables at a specific point location directly into mapping, graphing or analysis applications (Figure 24). The SWERA Web Service Application Programmer Interface (API) can be used to design a data service that returns the specific variables needed meet a user’s specific requirements. The SWERA interactive form helps a user design and construct a query that can be used to extract specific variables from the SWERA database.
17
Figure 24. SWERA Web Services
The HOMER interface is an example of an interface designed to take advantage of the SWERA web service (Figure 25). A user can click on the Google Map, download the XML file, and finally import the XML file into HOMER. The XML file only contains the information that can be used by HOMER.
Figure 25. HOMER web service

18
Renewable energy tools The SWERA user community is served by a range of product types. Among the simplest are maps and documents that can be downloaded and read. The second tire products are RREX, and Geospatial Toolkits. Finally the source spatial data sets can be downloaded for use in energy analysis tools and Geographic Information Systems.
The relationship between SWERA and energy analysis tools is critical to the successful deployment of renewable energy technologies. HOMER and RETScreen are examples of energy analysis tools that accept output from SWERA as input.
HOMER is a hybrid optimization model that was developed at NREL and is now licensed through HOMER Energy (http://www.homerenergy.com/). HOMER is a stand-alone model that can be installed and run on any PC, and there are various versions of HOMER to suit a range of user groups (Figure 26).
Figure 26. HOMER Example
19
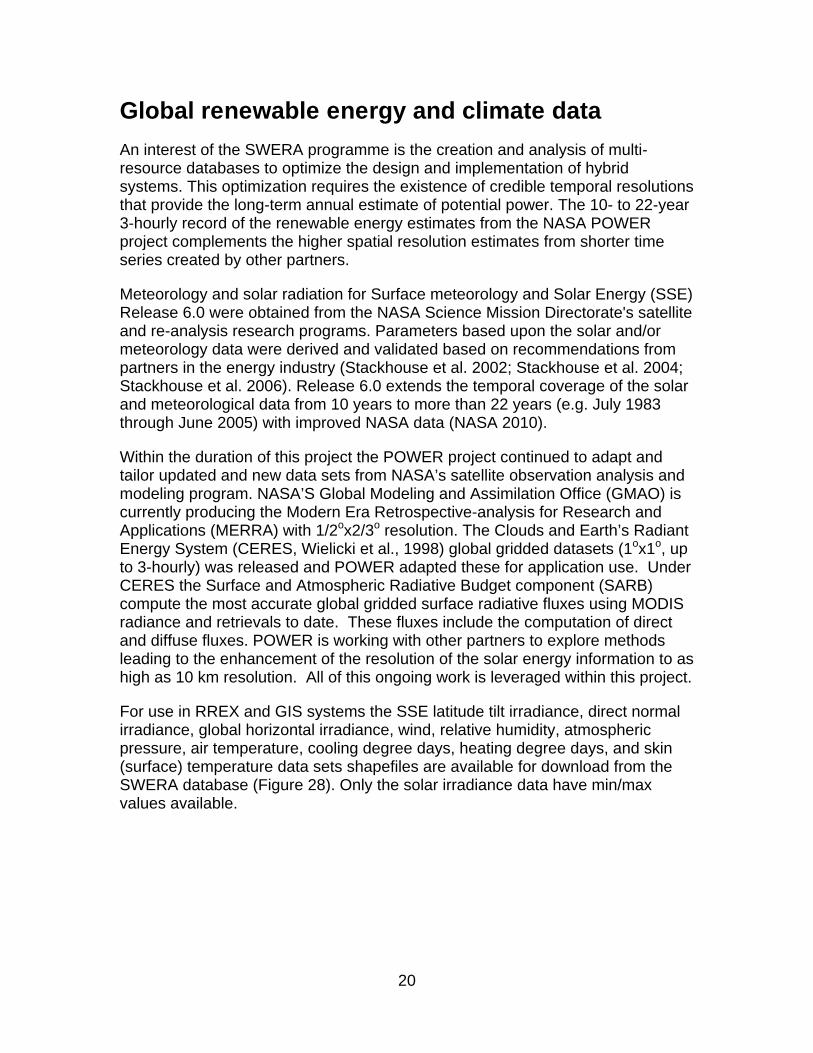
RETScreen was developed by Natural Resources Canada and allows users to analyze the energy production or savings, costs, emission impacts, and financial viability of various renewable energy and energy efficiency projects (http://www.retscreen.net/). RETScreen must be downloaded and installed on your personal computer for use. It is available in several languages and there are detailed training manuals available as well as periodic training courses (Figure 27).
Figure 27. RETScreen Example
20
Global renewable energy and climate data An interest of the SWERA programme is the creation and analysis of multi-resource databases to optimize the design and implementation of hybrid systems. This optimization requires the existence of credible temporal resolutions that provide the long-term annual estimate of potential power. The 10- to 22-year 3-hourly record of the renewable energy estimates from the NASA POWER project complements the higher spatial resolution estimates from shorter time series created by other partners.
Meteorology and solar radiation for Surface meteorology and Solar Energy (SSE) Release 6.0 were obtained from the NASA Science Mission Directorate's satellite and re-analysis research programs. Parameters based upon the solar and/or meteorology data were derived and validated based on recommendations from partners in the energy industry (Stackhouse et al. 2002; Stackhouse et al. 2004; Stackhouse et al. 2006). Release 6.0 extends the temporal coverage of the solar and meteorological data from 10 years to more than 22 years (e.g. July 1983 through June 2005) with improved NASA data (NASA 2010).
Within the duration of this project the POWER project continued to adapt and tailor updated and new data sets from NASA’s satellite observation analysis and modeling program. NASA’S Global Modeling and Assimilation Office (GMAO) is currently producing the Modern Era Retrospective-analysis for Research and Applications (MERRA) with 1/2ox2/3o resolution. The Clouds and Earth’s Radiant Energy System (CERES, Wielicki et al., 1998) global gridded datasets (1ox1o, up to 3-hourly) was released and POWER adapted these for application use. Under CERES the Surface and Atmospheric Radiative Budget component (SARB) compute the most accurate global gridded surface radiative fluxes using MODIS radiance and retrievals to date. These fluxes include the computation of direct and diffuse fluxes. POWER is working with other partners to explore methods leading to the enhancement of the resolution of the solar energy information to as high as 10 km resolution. All of this ongoing work is leveraged within this project.
For use in RREX and GIS systems the SSE latitude tilt irradiance, direct normal irradiance, global horizontal irradiance, wind, relative humidity, atmospheric pressure, air temperature, cooling degree days, heating degree days, and skin (surface) temperature data sets shapefiles are available for download from the SWERA database (Figure 28). Only the solar irradiance data have min/max values available.

21
Figure 28. NASA SSE datasets in the SWERA database
For solar energy, NASA data exist for 22 years globally at 1ox1o. Other available data sets include one having 40-km data available for much of the world, and 10-km data for countries and regions. These publicly available data derived from satellite data (Schillings et al. 2002; Renné et al 1999) are integrated into and can be mapped and graphed in SWERA. An underlying assumption is that higher resolution national data are better verified and validated given additional local measurement data provided by national partners. However the NASA data have longer records through time. The measurement records for the national data are on the order of three years. Where the individual years were available min/max bounds are plotted around the mean value giving a coarse estimate of uncertainty.
NREL and INPE high and moderate resolution data NREL provided 27 new high and moderate resolution data sets for use in RREX (Table 1). The source GIS data are available from NREL.

22
Table 1. New high and moderate resolution renewable energy data from NREL Country Resource type US DNI, GHI, Tilt,
wind UAE DNI, GHI Mexico – Oaxaca, Yucatan, Baja
DNI, GHI, Tilt, wind
India – NW DNI, GHI, Tilt Bhutan DNI, GHI, Tilt,
wind Armenia wind Mongolia wind Timor wind Philippines wind Russia - NW wind Chile – SW wind
INPE and SOLARLAB continued to provide new and updated data for the SWERA database and for use in RREX (Figure 29). The new data provide are independent moderate resolution DNI, GHI and LTI data sets for South America.
Figure 29. New renewable energy data from INPE

23
Small hydropower assessments Hydropower is an important source of renewable energy and is a natural extension to SWERA’s solar and wind portfolio. Run-of-river small hydropower plants do not require storage of the stream water resulting in fewer negative environmental impacts. Small hydropower plants offer the opportunity to provide off grid power in remote areas where the installation of power grids is often prohibitively expensive. Small hydropower plants work well within hybrid solar/wind/hydro/biofuels power systems.
The assessment of hydropower potential requires the calculation of the drop in elevation and the estimation of the potentially available stream flow. Prototype hydropower assessments and tools were completed for Guatemala and Ethiopia. Publically available global rainfall estimates from satellite platforms and elevation data, and rainfall and stream gauge (Vörösmarty et al., 1998) were used to estimate potential stream flow and stream head drops. The gauge recorded rainfall and discharge data were from national partners.
Assessment methodology In this study we used the USGS Geospatial Stream Flow Model (GeoSFM; Artan et al., 2007a; Asante et al., 2007a). Given rainfall estimates and landform, stream flow can be estimated. The GeoSFM accumulates spatially distributed rainfall estimates within sub-basins units and routes the runoff through the network of basins and their streams downstream. Given an estimate of stream flow and the difference in elevation, the calculation of the hydropower potential is a straightforward process.
The GeoSFM is a semi-distributed physically based rainfall-runoff model that is parsimonious in parameter requirement (Artan et al., 2007a; Artan et al., 2007b; Asante et al., 2007a; Asante et al., 2007b; Asante et al., 2008b). The GeoSFM rainfall-runoff component has three main modules: water balance, catchment routing, and distributed channel routing (Artan et al., 2007a, Asante et al., 2007a). Sub-basins are the subject of a daily (or hourly) water balance calculation. This calculation determines how much water enters the stream network from each sub-basin. The catchment runoff mechanisms considered in the model are excess precipitation runoff, direct runoff from impermeable areas of the basin, rapid subsurface flow (interflow), and base flow contribution from groundwater.
The runoff is estimated in two phases. First, the catchment runoff is routed at the sub-basin level to its outlet, and second, the flow is routed through the main river channel network. The surface runoff routing is carried out in a GIS environment (Olivera and Maidment, 1999) using land cover and Digital Elevation Model (DEM) data to determine the rate at which runoff is transported from the point of generation to the catchment outlet. The GeoSFM has been used in several basins around the globe with good results (Artan et al., 2007b; Asante et al.,
24
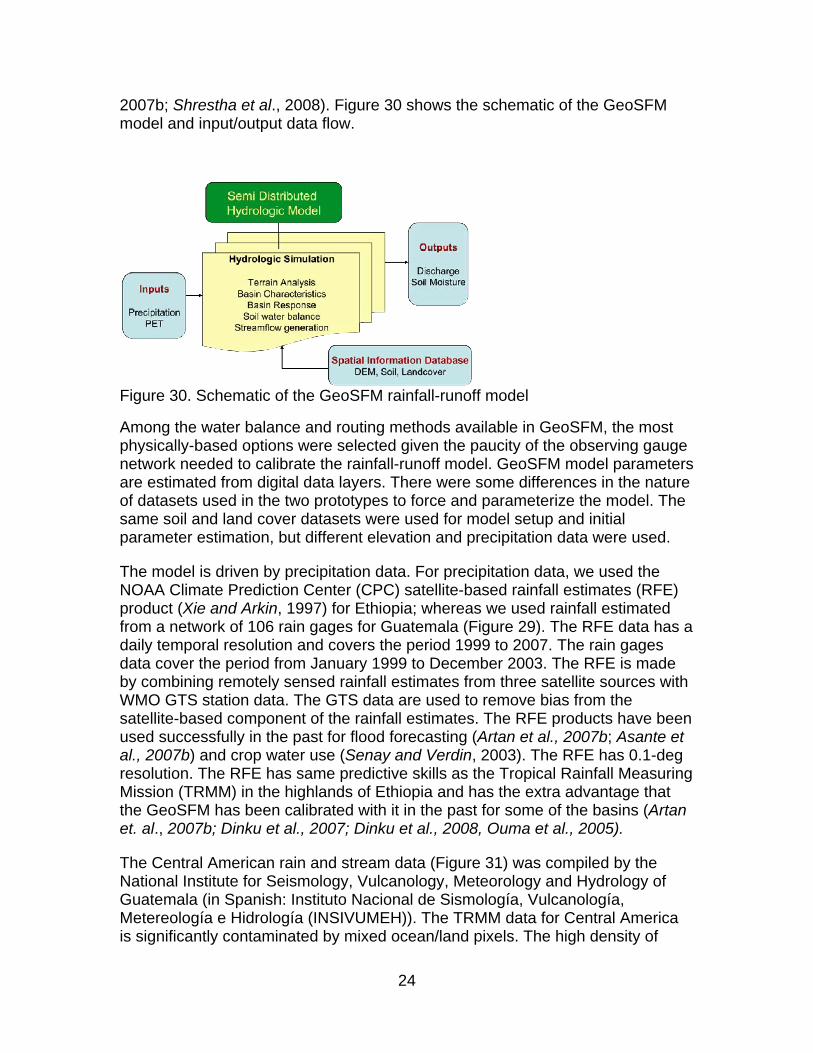
2007b; Shrestha et al., 2008). Figure 30 shows the schematic of the GeoSFM model and input/output data flow.
Figure 30. Schematic of the GeoSFM rainfall-runoff model
Among the water balance and routing methods available in GeoSFM, the most physically-based options were selected given the paucity of the observing gauge network needed to calibrate the rainfall-runoff model. GeoSFM model parameters are estimated from digital data layers. There were some differences in the nature of datasets used in the two prototypes to force and parameterize the model. The same soil and land cover datasets were used for model setup and initial parameter estimation, but different elevation and precipitation data were used.
The model is driven by precipitation data. For precipitation data, we used the NOAA Climate Prediction Center (CPC) satellite-based rainfall estimates (RFE) product (Xie and Arkin, 1997) for Ethiopia; whereas we used rainfall estimated from a network of 106 rain gages for Guatemala (Figure 29). The RFE data has a daily temporal resolution and covers the period 1999 to 2007. The rain gages data cover the period from January 1999 to December 2003. The RFE is made by combining remotely sensed rainfall estimates from three satellite sources with WMO GTS station data. The GTS data are used to remove bias from the satellite-based component of the rainfall estimates. The RFE products have been used successfully in the past for flood forecasting (Artan et al., 2007b; Asante et al., 2007b) and crop water use (Senay and Verdin, 2003). The RFE has 0.1-deg resolution. The RFE has same predictive skills as the Tropical Rainfall Measuring Mission (TRMM) in the highlands of Ethiopia and has the extra advantage that the GeoSFM has been calibrated with it in the past for some of the basins (Artan et. al., 2007b; Dinku et al., 2007; Dinku et al., 2008, Ouma et al., 2005).
The Central American rain and stream data (Figure 31) was compiled by the National Institute for Seismology, Vulcanology, Meteorology and Hydrology of Guatemala (in Spanish: Instituto Nacional de Sismología, Vulcanología, Metereología e Hidrología (INSIVUMEH)). The TRMM data for Central America is significantly contaminated by mixed ocean/land pixels. The high density of

25
rainfall recording stations in Guatemala permitted the creation of a precipitation surface suitable for use in GeoSFM.
Figure 31. Location of the rainfall recording stations in CA used to drive GeoSFM of the total 106 stations 58 are in Guatemala. Data period goes from 1971 to 2004
The GeoSFM uses the DEM to establish the modeling units and the linkages of the units; a variety of topographic derivatives are extracted from the DEM: slope, distance to the nearest stream channel, distance to the basin outlet, downstream river reach number, and watersheds. For the Ethiopian modeling window, the GTOPO30 was used for the DEM (Gesch et al., 1999) (http://edcdaac.usgs.gov/gtopo30/gtopo30.html). The GTOPO30 dataset has 30 arc-seconds of latitude and longitude resolution (approximately 1 km). In Guatemala the Shuttle Radar Topography Mission (SRTM) datasets were used as the DEM (Lehner et al., 2008). The SRTM DEM has 3 arc-seconds (approximately 90 m) resolution.
GeoSFM uses land cover data, in conjunction with the soils data, to partition the incident rainfall on a basin into surface runoff from water infiltrating into the soil. For this study we used the USGS Global Land Cover Characteristics (GLCC). The GLCC land cover data was created from twelve-month series of 1-km global vegetation index imagery (Loveland and Belward, 1997).
The rainfall-runoff model requires soil parameters (i.e., soil water holding capacity, saturated soil hydraulic conductivity, hydrologically active soil layer depth, and soil texture). The rate at which subsurface soil layers release water to the stream network depends on physical attributes of the soil. The soil parameters used in this study were extracted from the Digital Soil Map of the World (FAO, 1995) and the World Soil File (WSF; Zobler, 1986). The FAO digital
26
soil data were derived from an original compilation at 1:5,000,000 scales. The impervious area associated with water bodies, such as lakes, wetlands and large rivers, was extracted from the Global Lakes and Wetlands Database (GLWD) (Lehner and Döll, 2004).
The potential evapotranspiration (PET) data set represents atmospheric demand for water from the Earth’s surface and is a function of solar radiation, air temperature, wind, humidity, and atmospheric pressure. The PET data set is a global product produced by the USGS on a daily basis and calculated according to the Penman-Monteith equation (Verdin and Klaver, 2002). The PET model uses USGS-developed GIS routines that ingest grids of input variables produced by NOAA’s Global Data Assimilation System (GDAS) on a 1-degree grid. The PET fields are downscaled to a 0.1-degree resolution.
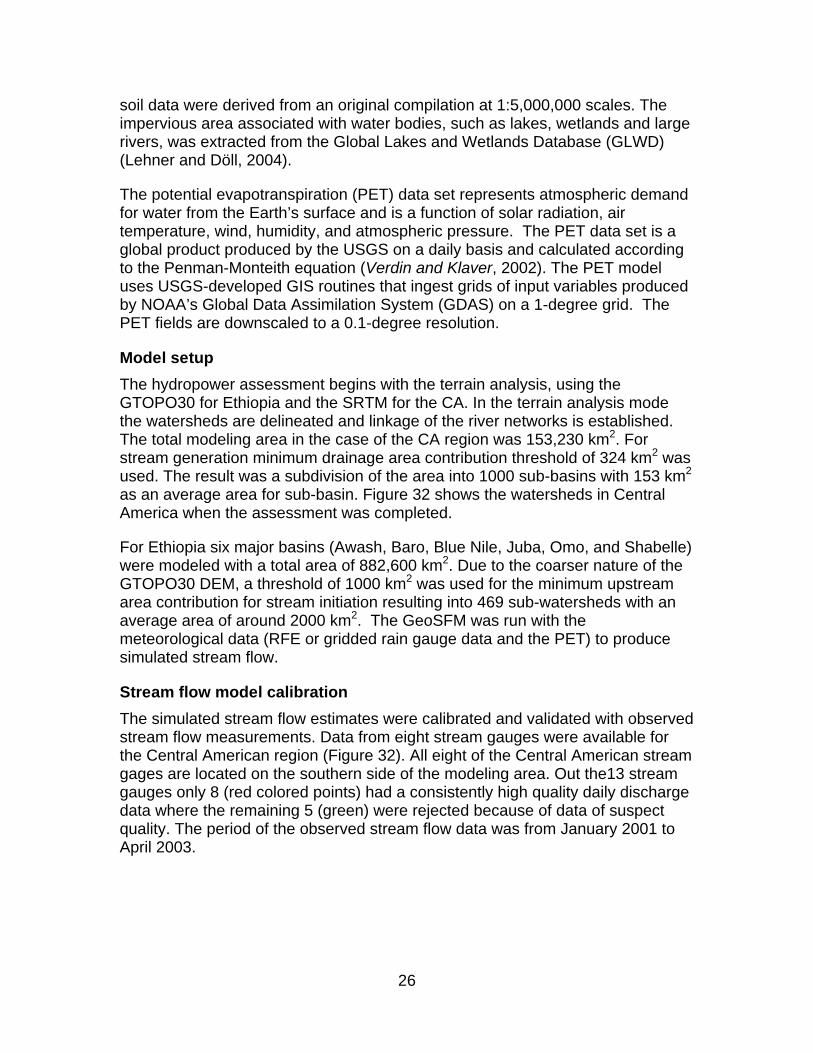
Model setup The hydropower assessment begins with the terrain analysis, using the GTOPO30 for Ethiopia and the SRTM for the CA. In the terrain analysis mode the watersheds are delineated and linkage of the river networks is established. The total modeling area in the case of the CA region was 153,230 km2. For stream generation minimum drainage area contribution threshold of 324 km2 was used. The result was a subdivision of the area into 1000 sub-basins with 153 km2 as an average area for sub-basin. Figure 32 shows the watersheds in Central America when the assessment was completed.
For Ethiopia six major basins (Awash, Baro, Blue Nile, Juba, Omo, and Shabelle) were modeled with a total area of 882,600 km2. Due to the coarser nature of the GTOPO30 DEM, a threshold of 1000 km2 was used for the minimum upstream area contribution for stream initiation resulting into 469 sub-watersheds with an average area of around 2000 km2. The GeoSFM was run with the meteorological data (RFE or gridded rain gauge data and the PET) to produce simulated stream flow.
Stream flow model calibration The simulated stream flow estimates were calibrated and validated with observed stream flow measurements. Data from eight stream gauges were available for the Central American region (Figure 32). All eight of the Central American stream gages are located on the southern side of the modeling area. Out the13 stream gauges only 8 (red colored points) had a consistently high quality daily discharge data where the remaining 5 (green) were rejected because of data of suspect quality. The period of the observed stream flow data was from January 2001 to April 2003.
27
Figure 32. Available stream gauge stations for the Central American region
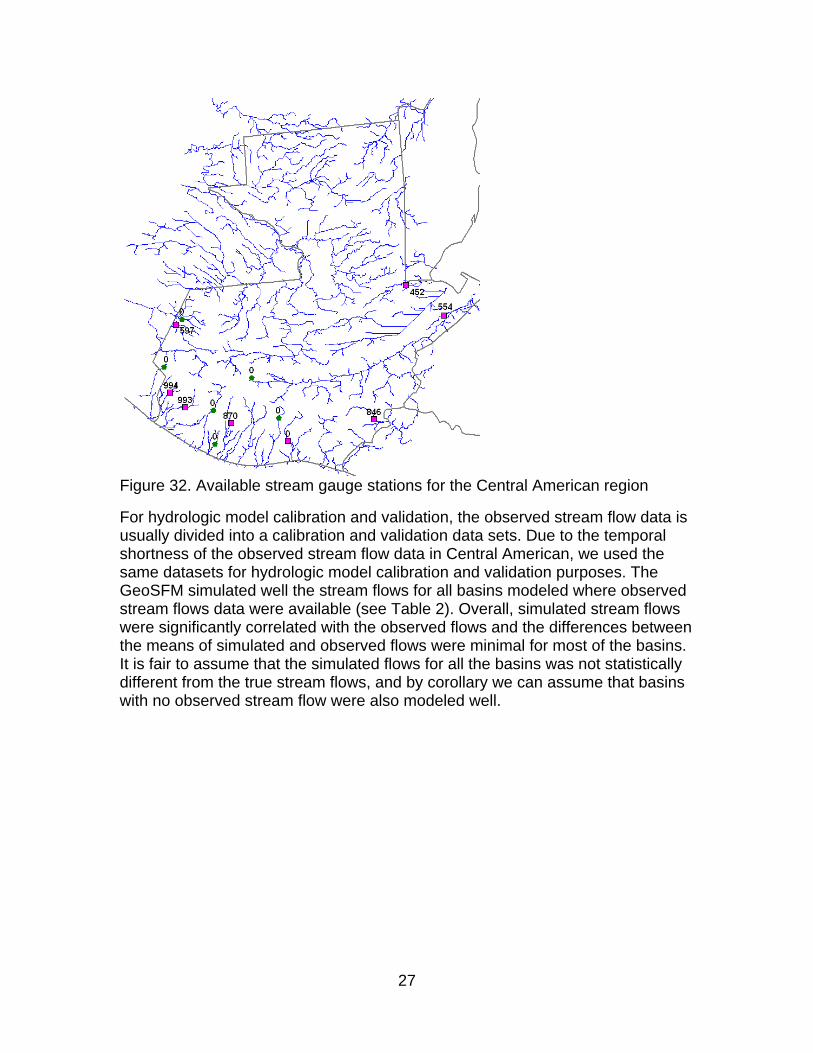
For hydrologic model calibration and validation, the observed stream flow data is usually divided into a calibration and validation data sets. Due to the temporal shortness of the observed stream flow data in Central American, we used the same datasets for hydrologic model calibration and validation purposes. The GeoSFM simulated well the stream flows for all basins modeled where observed stream flows data were available (see Table 2). Overall, simulated stream flows were significantly correlated with the observed flows and the differences between the means of simulated and observed flows were minimal for most of the basins. It is fair to assume that the simulated flows for all the basins was not statistically different from the true stream flows, and by corollary we can assume that basins with no observed stream flow were also modeled well.
28
Table 2. Statistics of the comparison between simulated and observed stream flows for the Central American watersheds.
Station Observed Simulated Correlation Amatillo 9 7 0.83 Chojil 27 24 0.90 Coatepeque 49 38 0.85 Laslechuzas 4 4 0.90 Malacatan 29 27 0.80 Modesto-Mendez 32 26 0.53 Montecristo 7 5 0.89 Morales 142 146 0.71
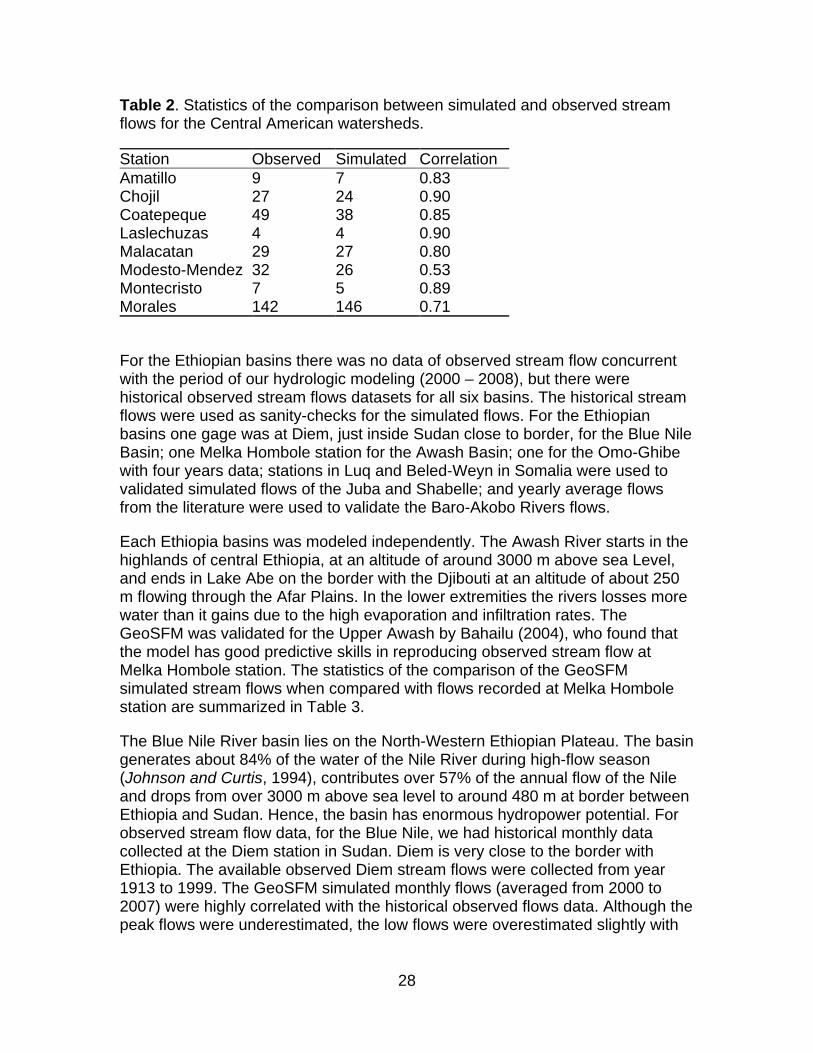
For the Ethiopian basins there was no data of observed stream flow concurrent with the period of our hydrologic modeling (2000 – 2008), but there were historical observed stream flows datasets for all six basins. The historical stream flows were used as sanity-checks for the simulated flows. For the Ethiopian basins one gage was at Diem, just inside Sudan close to border, for the Blue Nile Basin; one Melka Hombole station for the Awash Basin; one for the Omo-Ghibe with four years data; stations in Luq and Beled-Weyn in Somalia were used to validated simulated flows of the Juba and Shabelle; and yearly average flows from the literature were used to validate the Baro-Akobo Rivers flows.
Each Ethiopia basins was modeled independently. The Awash River starts in the highlands of central Ethiopia, at an altitude of around 3000 m above sea Level, and ends in Lake Abe on the border with the Djibouti at an altitude of about 250 m flowing through the Afar Plains. In the lower extremities the rivers losses more water than it gains due to the high evaporation and infiltration rates. The GeoSFM was validated for the Upper Awash by Bahailu (2004), who found that the model has good predictive skills in reproducing observed stream flow at Melka Hombole station. The statistics of the comparison of the GeoSFM simulated stream flows when compared with flows recorded at Melka Hombole station are summarized in Table 3.
The Blue Nile River basin lies on the North-Western Ethiopian Plateau. The basin generates about 84% of the water of the Nile River during high-flow season (Johnson and Curtis, 1994), contributes over 57% of the annual flow of the Nile and drops from over 3000 m above sea level to around 480 m at border between Ethiopia and Sudan. Hence, the basin has enormous hydropower potential. For observed stream flow data, for the Blue Nile, we had historical monthly data collected at the Diem station in Sudan. Diem is very close to the border with Ethiopia. The available observed Diem stream flows were collected from year 1913 to 1999. The GeoSFM simulated monthly flows (averaged from 2000 to 2007) were highly correlated with the historical observed flows data. Although the peak flows were underestimated, the low flows were overestimated slightly with
29
the net effect that the simulated annual flows very closely matched the historical annual flows.
The Omo River rises in the central south-western plateaus in Ethiopia and flows southward into Lake Turkana. For the Ghibe–Omo Basin we had observed stream flow data period of 1977 to 1980 where the simulated stream flow was for the period 2001 to 2008. Although the periods of the two flow datasets did not overlap, we can evaluate the predictive potential of the hydrologic model from the comparison between observed and simulated flows. We compared the simulated and observed average monthly stream flows. Simulated flows were significantly correlated (d.f.=10, p=0.05) with observed monthly averages for the years 1977-1980, but the simulated flows underestimated observed flows by about 9%.
The Baro-Akobo Rivers flows in southwestern Ethiopia. The rivers are part of the Nile Basin system. The Baro River is the only year around navigable river in Ethiopia with a mild slope for most of its course. The mean annual discharge of Baro River published by the Ethiopian Water Resources Ministry is 241 m³/sec where the GeoSFM estimated mean annual stream flow value of the Baro River was 271 m3/sec for the years 2000 to 2007. The annual mean discharge for Baro-Akobo Rivers system according to Woube (1999) is 374 m3/sec where the GeoSFM predicted mean annual flow of the river system 387 m3/sec. The GeoSFM discharge estimated for the Baro-Akobo Rivers system was formed by adding the annual discharges of basin with IDs of 268623, 268634, and 268626 that respectively represent Rivers Baro, Gilo, and Akobo.
The Wabi Shabelle and Juba is in essence one single basin system. In most years, the Shabelle flows through eastern Ethiopia and then Somalia draining into sand dunes before it reaches Indian Ocean, but every decade it joins the Juba before it reaches the Indian Ocean. The Juba is formed by the joining of the Dawa and Genele Rivers at the Ethiopia-Kenya-Somalia border. The long-term historical (1951 – 1989) observed average flows recorded in Somalia at Luq for the Juba and at Beled-Weyn for the Shabelle (Artan et al., 2007c) were highly correlated (p=0.01) with the simulated flows at both locations (see Table 3). The model slightly over estimated the low flow, but under predicted the high flows (the same effects we saw in the other basins). Nevertheless overall there was good agreement between simulated and the observed historically flows at two locations. Table 3 summarizes the statistics of the comparison between the simulated stream flow with climatological means.

30
Table 3. Statistics of the comparison between simulated and observed stream flows for the Ethiopian watersheds. Station Observed Simulated Correlation Diem 1502 1567 0.81 Melka Hombole 48 55.6 0.80 Omo-Ghibe 873 796 0.68 Juba 188 254 0.87 Shabelle 80 90 0.88
Methodology of the Hydropower Assessment Annual hydropower estimates are calculated for the basin and are then disaggregated in 1-km sub-segments by a proportional rule to permit subbasin analysis of the data along the steam.
The hydropower potential of the streams was assessed using the synthetic stream flow data and elevation drops estimated from the DEM. The annual hydropower was estimated for every 1 km segment of stream. The hydraulic head were estimated from SRTM and GTOPO30 elevation datasets. The GeoSFM simulated flows were for basin outlets. For the hydropower assessment, we need stream flow estimates for every 1-km river segment. The discharge in river segments was calculated as:
Where qij is the stream flow of the segment of interest [m3/sec], FACCij is the area of the contributing watershed above the segment, FACCi the flow accumulation of the basin outlet, Qi basin simulated stream flow [m3/sec]. The hydropower for the river segments was then estimated as:
P= Hij * qij * p *g * 10-6
Where P is hydropower potential [MW], H is hydraulic head [m] of the stream segment, p is the water density of 1000 kg/m3, and g is gravitational acceleration of 9.81 m /s2. Turbine efficiency was assumed to be 100% and no hydraulic head loss was considered in the calculation, therefore the resulting hydropower estimates are for gross potential.
Most energy analysis tools for small hydropower assessment require stream flow as input. Stream flow data is made available as annual and monthly estimates and as a flow duration curve. In addition to the average yearly potential hydropower and flows, twenty values of the stream flow duration curves are given, and monthly average, maximum, and minimum flows are provided. With the flow duration datasets the users should be able to calculate reliable levels of firm hydropower potentials.
31
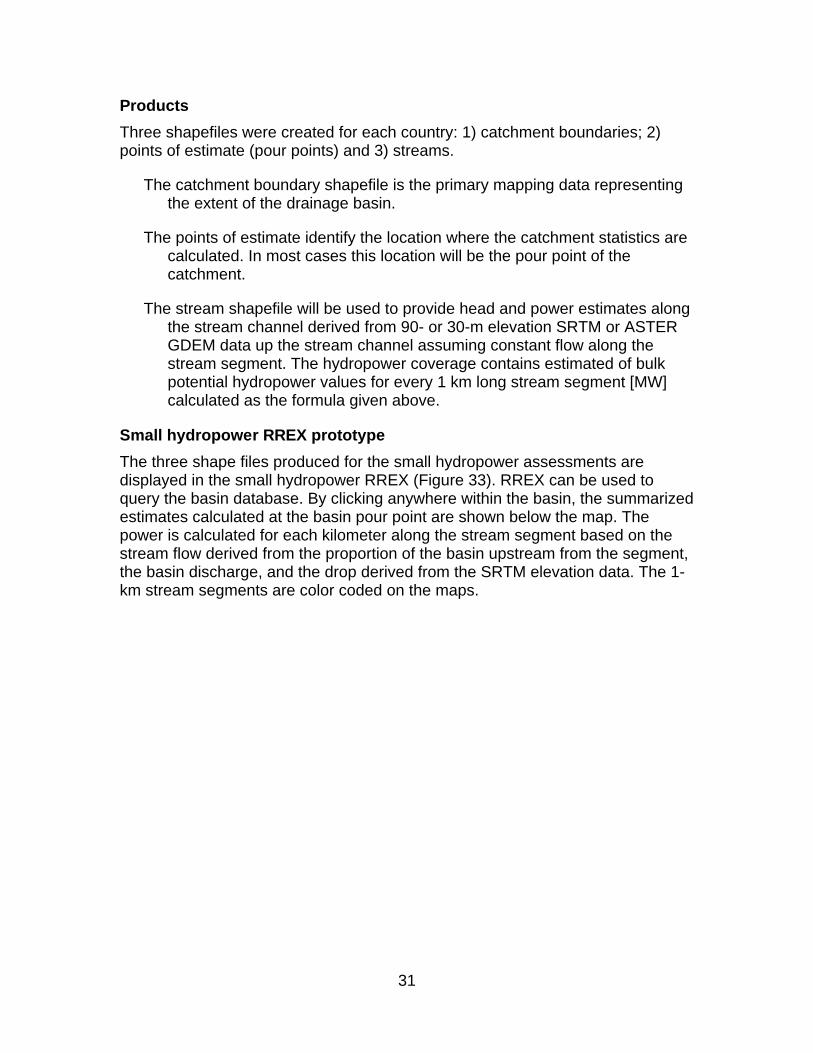
Products Three shapefiles were created for each country: 1) catchment boundaries; 2) points of estimate (pour points) and 3) streams.
The catchment boundary shapefile is the primary mapping data representing the extent of the drainage basin.
The points of estimate identify the location where the catchment statistics are calculated. In most cases this location will be the pour point of the catchment.
The stream shapefile will be used to provide head and power estimates along the stream channel derived from 90- or 30-m elevation SRTM or ASTER GDEM data up the stream channel assuming constant flow along the stream segment. The hydropower coverage contains estimated of bulk potential hydropower values for every 1 km long stream segment [MW] calculated as the formula given above.
Small hydropower RREX prototype The three shape files produced for the small hydropower assessments are displayed in the small hydropower RREX (Figure 33). RREX can be used to query the basin database. By clicking anywhere within the basin, the summarized estimates calculated at the basin pour point are shown below the map. The power is calculated for each kilometer along the stream segment based on the stream flow derived from the proportion of the basin upstream from the segment, the basin discharge, and the drop derived from the SRTM elevation data. The 1-km stream segments are color coded on the maps.

32
Figure 33. RREX Small hydropower map of Guatemala
The selected basin is highlighted in yellow (Figure 34). When graph data is selected, two graphs are produced. The top graph shows the monthly distribution of stream flow throughout the year. The monthly stream flow graph can be modeled in HOMER with solar and wind power to determine available power from each resource throughout the year. The bottom graph shows the flow duration curve. The flow duration curve is used to determine what percentage of the time sufficient stream flow is available to produce power. In the example, 50 cu meters/sec is available 65% of the time. This information can be used in RETScreen to determine what type of hydroelectric plant is feasible.

33
Figure 34. RREX hydropower map and graphs
Approach: Benchmarking Methodology The SWERA project had three broad goals. One, evolve the underlying structure of the DSS incorporating standards compliant metadata, and web services to better serve a diverse renewable energy user community from consumers through energy analysts and developers to investors and policy makers. Two, use NASA Earth Science results to go global through the incorporation of SSE renewable energy and climate data sets. Three, incorporate NASA Earth Science results in a small hydropower prototype. In this benchmarking report, the success to which these goals are achieved are discussed (Figure 35).
Figure 35. Verification and Validation of NASA-Supported Enhancements to SWERA (adapted from Bahill and Gissing 1998).
DDS Evaluation The evolution of the DSS as a system is evaluated by comparing the function of the GEF SWERA DSS to the NASA SWERA DSS qualitatively, and through an analysis of the download statistics and the SWERA user survey. The SWERA survey has been active since the fall of 2009. An analysis of the results has been published and is summarized below (Michels et al 2010). El-Gayar et al (2011) explore the underlying technologies supporting the development of the DSS.

34
Renewable energy is of growing interest particularly in the environmental community. However planning for Renewable Energy projects to harness the power of renewable energy resources can be costly in terms of money, time, and other resources. The minimization of these costs is considered a high priority. Decision Support Systems (DSS) have been shown to help with decision making (Sauter 1999; Sauter 2005; Sartipi et al., 2007). Terry and Spence (2005) also studies the types of decision making that makes for a more successful project. It was shown that through the difference in decision making processes that times to completion of the project, as well as the accuracy were found to be greatly enhanced when using a tool to help in this process. Another key aspect to this research is the acceptance of the DSS. Technology resistance is something that needs to be considered. When trying to affect the perceived usefulness, affecting the perception that the DSS is easy to use has a direct affect. Diez and McIntosh, (2009) considered the factors that impact the use and usefulness of Information Systems while Turner and Kitchenham (2010) conduct a meta-literature review of the technology acceptance literature and the relationship to actual use. The use of a DSS within the confines of the renewable energy field has also been discussed in literature. One such demonstration of a DSS and its implementation is shown by van der Meulen (1992). Other such implementations instances of DSS furthering RE use can be found in (Cherni et al., 2007; Georgopoulou et al., 1998).
The decision to implement the use of such technology in regions around the world can be a costly endeavor in terms of the effort to design, construct, and implement a working renewable energy resource energy plant of any kind. Accordingly, access to reliable region-specific RE assessment is vital to understanding whether candidate locations are viable or cost effective to implement such a plant. The Solar Wind and Energy Resource Assessment (SWERA) project came into being to try to help fill this need. With the information that would be provided through SWERA, it is the hope that future solar and wind projects would be aided in their decisions to plan and execute renewable energy projects.
Another main focus of SWERA was to act as a sharing center for countries and organizations. Through the project government agencies would be allowed to share information with interested parties. Industry personnel, investors, and other researchers would be able to find this information accessible and incorporate the shared information within their research and decision making. SWERA makes data for developing countries further accessible and the use of such energy resources appealing to private as well as public investors. In effect, renewable energy resource potential is helped to be fully realized within the different locations. Through SWERA, consistent, reliable and verifiable data is shared with investors, lawmakers, government agencies, and any other concerned parties. Not only are the data shared through SWERA, but geospatial toolkits are available to analyze and visualize the data. High resolution data are also available to analyze, use, and interpret to further the interest and potential use of renewable energy resources. SWERA provides an interface within which to
35
easily find and access information in such a way as to make the information easily accessible to the public.
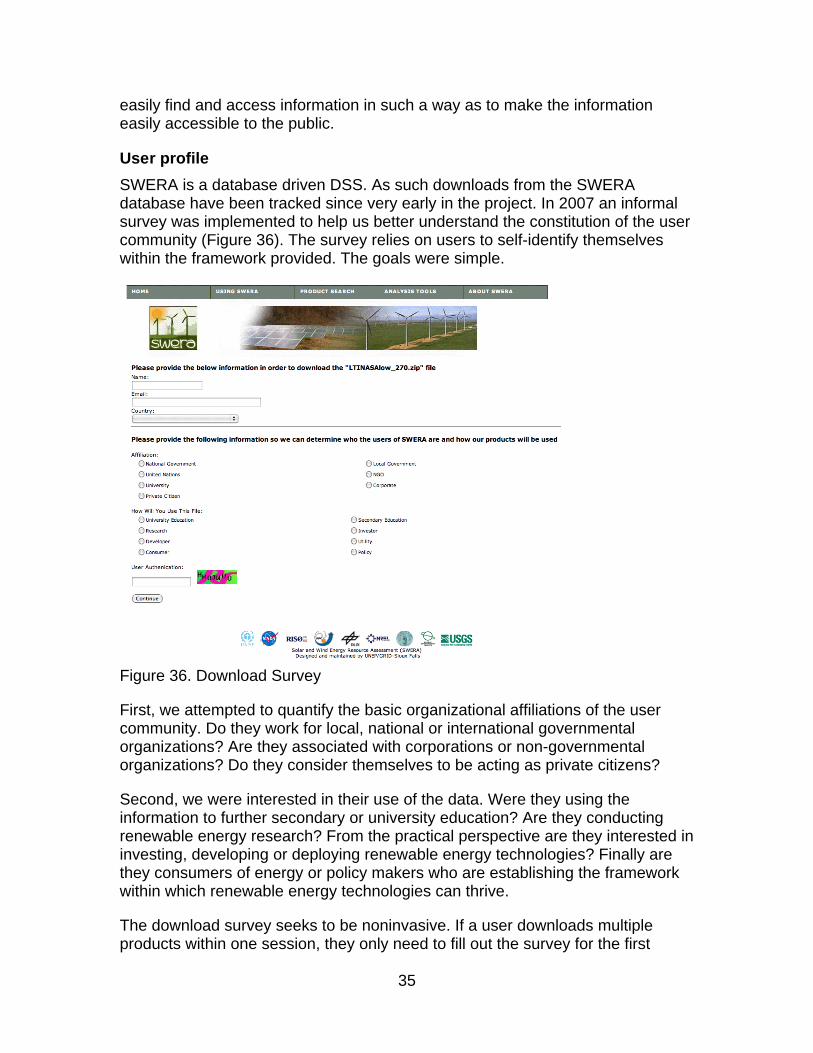
User profile SWERA is a database driven DSS. As such downloads from the SWERA database have been tracked since very early in the project. In 2007 an informal survey was implemented to help us better understand the constitution of the user community (Figure 36). The survey relies on users to self-identify themselves within the framework provided. The goals were simple.
Figure 36. Download Survey
First, we attempted to quantify the basic organizational affiliations of the user community. Do they work for local, national or international governmental organizations? Are they associated with corporations or non-governmental organizations? Do they consider themselves to be acting as private citizens?
Second, we were interested in their use of the data. Were they using the information to further secondary or university education? Are they conducting renewable energy research? From the practical perspective are they interested in investing, developing or deploying renewable energy technologies? Finally are they consumers of energy or policy makers who are establishing the framework within which renewable energy technologies can thrive.
The download survey seeks to be noninvasive. If a user downloads multiple products within one session, they only need to fill out the survey for the first
36
product. Only summary statistics are shared or published. Examples of the information shared are shown in the results section.
User satisfaction The objective of the user survey is to evaluate user satisfaction with the system as well as highlight factors affecting user satisfaction and experience. The subjects of the test consisted of registered users of the system and anonymous (unregistered) users. Registered users had downloaded a data product through the archive tool and registered their information. Registered users were sent out emails that contained a direct link to the survey. Unregistered users accessed the survey through a link on the homepage of SWERA. In both cases, the anonymity of the subjects was maintained during the survey. Their email, if provided, was stripped from the results prior to analysis.
The SWERA DSS is made up of two major components. The first is an archive tool that allows for the creation, storage, searching, and downloading of renewable energy data products, tools, and information. The other component is the Renewable Resource EXplorer (RREX). The first page of the survey describes the objectives of the survey and contains an informed consent. The user is then offered a choice between a survey on the SWERA product search or on RREX (Figure 37).

37
Figure 37. SWERA user survey introduction page
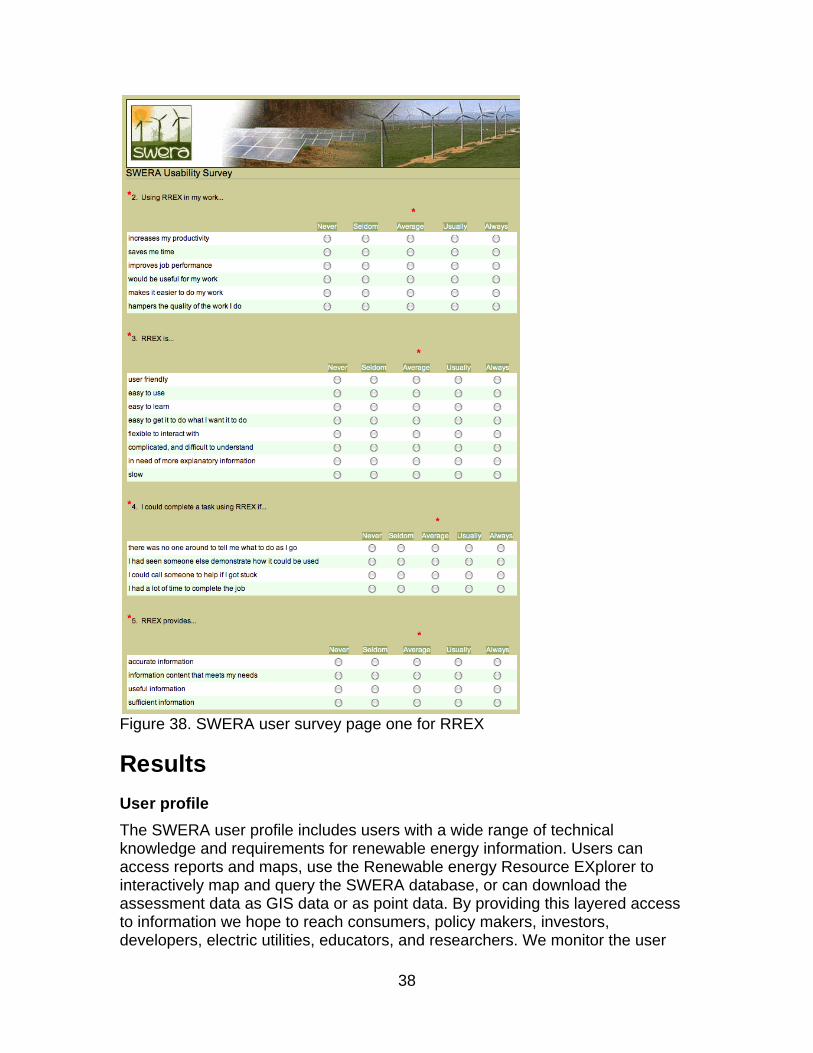
The survey was conducted through an online survey system. Page one of the RREX user satisfaction survey shows the general layout of the survey in which groups of related questions are asked to quantify the user satisfaction with the Content, Accuracy, Format, Ease of Use, Timeliness and overall utility of SWERA (Figure 38).
38
Figure 38. SWERA user survey page one for RREX
Results User profile The SWERA user profile includes users with a wide range of technical knowledge and requirements for renewable energy information. Users can access reports and maps, use the Renewable energy Resource EXplorer to interactively map and query the SWERA database, or can download the assessment data as GIS data or as point data. By providing this layered access to information we hope to reach consumers, policy makers, investors, developers, electric utilities, educators, and researchers. We monitor the user

39
community through the download of products from the SWERA database. Total downloads (Figure 39a), downloads by organizational type (Figure 39b), and downloads by use category (Figure 39C) have been tracked since October 2007. These are tracked through a minimally invasive survey when downloads are requested. The impact of the first major releases of the new user interface became notable in mid 2008.

40
Figure 39. SWERA download statistics since October 2007: (a) total downloads; (b) summary by organization; and (c) summary by use
2007!Oct 2008!Feb 2008!Jun 2008!Oct 2009!Feb 2009!Jun 2009!Oct 2010!Feb 2010!Jun
SWERA Usage Statistics
29342 products were downloaded
020
040
060
080
010
00
670
554
433
595 591509 506
627
412
1057982
878
1052
910
757
668
845887 914 944
799865
753
919
1046984
703
829 807
11071122
972908
958
823
9560
100
200
300
400
by Organization
Month
Numb
er o
f pro
ducts
dow
nload
ed
2007!Oct 2008!Feb 2008!Jun 2008!Oct 2009!Feb 2009!Jun 2009!Oct 2010!Feb 2010!Jun
CorporateLocal GovernmentNational GovernmentNGOPrivate CitizenUNUniversity
010
020
030
040
050
0
by Use
Month
Numb
er o
f pro
ducts
dow
nload
ed
2007!Oct 2008!Feb 2008!Jun 2008!Oct 2009!Feb 2009!Jun 2009!Oct 2010!Feb 2010!Jun
ConsumerDeveloperInvestorPolicyResearchSecondary EducationUniversity EducationUtility
41
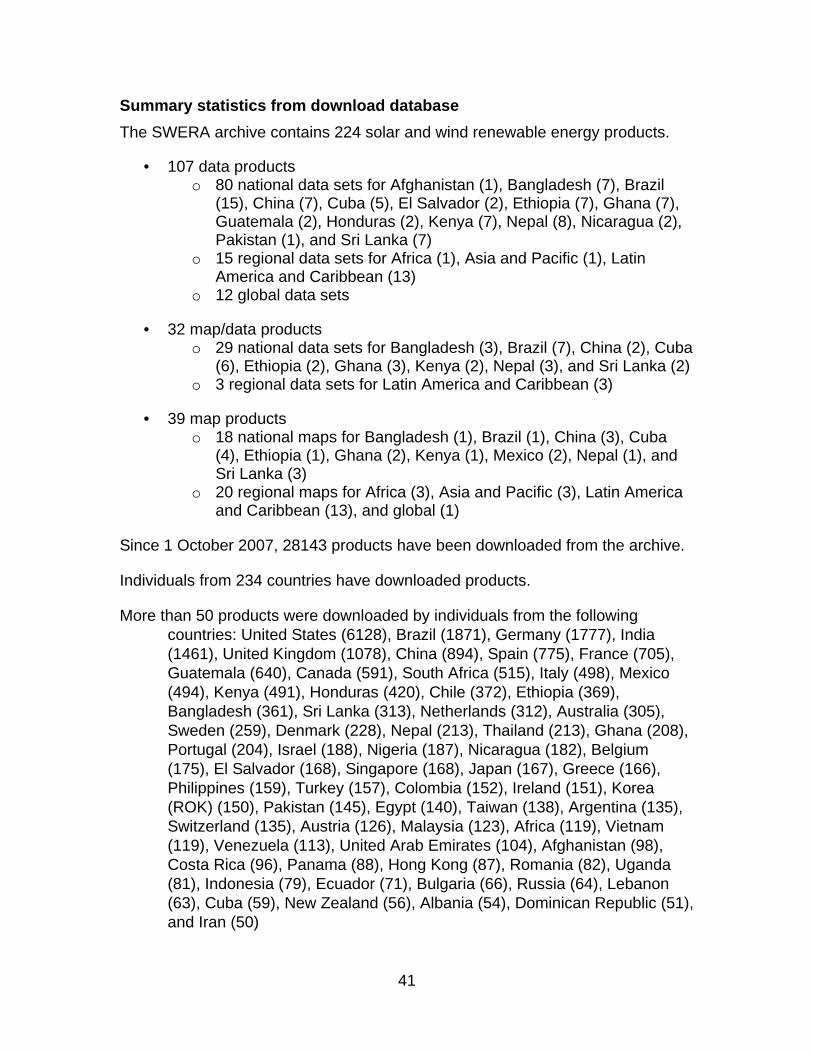
Summary statistics from download database The SWERA archive contains 224 solar and wind renewable energy products.
• 107 data products o 80 national data sets for Afghanistan (1), Bangladesh (7), Brazil
(15), China (7), Cuba (5), El Salvador (2), Ethiopia (7), Ghana (7), Guatemala (2), Honduras (2), Kenya (7), Nepal (8), Nicaragua (2), Pakistan (1), and Sri Lanka (7)
o 15 regional data sets for Africa (1), Asia and Pacific (1), Latin America and Caribbean (13)
o 12 global data sets
• 32 map/data products o 29 national data sets for Bangladesh (3), Brazil (7), China (2), Cuba
(6), Ethiopia (2), Ghana (3), Kenya (2), Nepal (3), and Sri Lanka (2) o 3 regional data sets for Latin America and Caribbean (3)
• 39 map products o 18 national maps for Bangladesh (1), Brazil (1), China (3), Cuba
(4), Ethiopia (1), Ghana (2), Kenya (1), Mexico (2), Nepal (1), and Sri Lanka (3)
o 20 regional maps for Africa (3), Asia and Pacific (3), Latin America and Caribbean (13), and global (1)
Since 1 October 2007, 28143 products have been downloaded from the archive.
Individuals from 234 countries have downloaded products.
More than 50 products were downloaded by individuals from the following countries: United States (6128), Brazil (1871), Germany (1777), India (1461), United Kingdom (1078), China (894), Spain (775), France (705), Guatemala (640), Canada (591), South Africa (515), Italy (498), Mexico (494), Kenya (491), Honduras (420), Chile (372), Ethiopia (369), Bangladesh (361), Sri Lanka (313), Netherlands (312), Australia (305), Sweden (259), Denmark (228), Nepal (213), Thailand (213), Ghana (208), Portugal (204), Israel (188), Nigeria (187), Nicaragua (182), Belgium (175), El Salvador (168), Singapore (168), Japan (167), Greece (166), Philippines (159), Turkey (157), Colombia (152), Ireland (151), Korea (ROK) (150), Pakistan (145), Egypt (140), Taiwan (138), Argentina (135), Switzerland (135), Austria (126), Malaysia (123), Africa (119), Vietnam (119), Venezuela (113), United Arab Emirates (104), Afghanistan (98), Costa Rica (96), Panama (88), Hong Kong (87), Romania (82), Uganda (81), Indonesia (79), Ecuador (71), Bulgaria (66), Russia (64), Lebanon (63), Cuba (59), New Zealand (56), Albania (54), Dominican Republic (51), and Iran (50)
42
238 different products have been downloaded.
The most popular products (more than 50 downloads) are: globalWINDmaps_200.zip (4460), globalWINDdata_199.zip (1387), africadir_216.pdf (1047), asiaDIRnrel_211.pdf (871), africatilt_218.pdf (848), NASAwspd50m_283.zip (716), csrafricadata_219.zip (674), camwindmaps_71.zip (662), LTINASAlow_270.zip (661), asiaTILTnrel_213.pdf (594), csreasia_214.zip (574), samdir_233.pdf (560), NASADNI_277.zip (541), samtilt_235.pdf (509), chinawindmaps_192.zip (441), brazilsolaratlas_247.pdf (376), africaglo_217.pdf (359), csrsoamdata_232.zip (335), asiaGLOnrel_212.pdf (332), camwindreport_242.pdf (289), samglo_234.pdf (282), campwr50_70.zip (257), tiltcarib_45.pdf (239), KenyaRisoeDTUData_267.zip (231), slwindmaps_73.zip (222), ghanawindmaps_92.zip (221), BrazilWindData10km_160.zip (213), chinawindreport_244.pdf (210), NASAGHI_278.zip (200), chinaDNI40kmNREL_137.zip (181), Schillings_4.pdf (181), BrazilHR_148.zip (172), Perez2002_14.pdf (157), csrcaribdata_225.zip (153), brazgst_172.zip (149), BrazilDirectRanges_163.zip (149), china50mwindData_191.zip (146), westchainaDLRsolarrep_122.zip (144), dircarib_43.pdf (140), camdirann_46.pdf (135), BrazilTiltedRanges_165.zip (134), EthiopiaRisoeDTUData_265.zip (134), chinaTILT40kmNREL_139.zip (131), guatgst_181.zip (131), BrazilWindData40km_161.zip (127), ChinaHR_150.zip (126), ghanawind_90.zip (125), ghanawindreport_245.pdf (119), brazilTMY_144.zip (118), camtiltann_50.pdf (113), brazilDIRnrel_237.zip (109), slpwr50_72.zip (105), chinaTimeSeriesDLR_123.zip (104), glocarib_44.pdf (103), hondgst_183.zip (99), kenDLRsolarreport_116.zip (99), mexDNI_159.pdf (99), tmycam_84.zip (96), cubawindmaps_91.zip (95), CamHR_149.zip (93), ghangst_179.zip (88), SWERAprodoc_6.pdf (88), BangladeshKAMMv2_157.zip (86), UCASolarAssessment_206.pdf (85), tiltcam_51.pdf (84), SWERAoverviewRETRUD_40.ppt (79), measestsun_35.pdf (76), BrazilDiffuseRanges_162.zip (74), camdir10km_93.zip (74), kenyaDIR_230.zip (73), Gua10kmSolarSites_75.zip (71), NepalRisoeDTUData_266.zip (71), chinaTMY_146.zip (68), CaribSolar40kmTLT_67.zip (67), CaribSolar40kmDIR_65.zip (66), dircam_47.pdf (65), kenyametst_229.pdf (64), CaribSolar40kmDIF_64.zip (63), ghanaDLRreport_102.zip (63), slDLRreport_107.zip (63), ethiopiaTMY_145.zip (62), brazilTMYst_238.pdf (59), ethDLRreport_111.zip (59), ethiopiametst_226.pdf (58), NASAT10_281.zip (58), camglo10km_94.zip (57), ethDLRtimeseries_110.zip (57), ghanaTMY_142.zip (57), SAmericaPar40km_286.zip (56), cubawindreport_243.pdf (55), EthiopiaHR_152.zip (55), nicagst_187.zip (55), westchina10kmDNI_120.zip (55), banggst_170.zip (54),

43
camgloann_54.pdf (54), Perez2003_18.pdf (52), borrador_209.pdf (50), and kenyaTMY_140.zip (50)
Individuals identified themselves
by organizations as: University (9461), Private Citizen (8267), Corporate (7656), NGO (1658), National Government (1469), UN (452), and Local Government (379)
by use as: Research (13,949), University Education (6160), Developer (4025), Investor (1764), Consumer (1313), Utility (992), Secondary Education (805), and Policy (334)
The download survey is biased toward users who download data, even though maps and documents are also available. Most users whose needs are satisfied through a visual analysis of the data through the RREX mapping and graphing interface, including those who download point data for use in energy analysis systems are under-represented in the statistics. Furthermore the education and research communities are likely over-represented.
The strong representation of the corporate community and users who identify themselves as developers is very encouraging. Policy as a use was not added until November 2008. It is not surprising that investor, policy, consumer, secondary education use categories are low, since these are the users we would expect to be primary users of RREX. Users within these use categories who download products may very well self identify themselves as researchers.
Nonetheless, an inspection of use categories within corporations shows strong usage by utilities, investors and developers, in addition to researchers, within the corporate community (Figure 40). Likewise within the private citizen organizational type investors and developers are well represented.

44
Figure 40. Summary statistics use category within organization type.
ConsumerDeveloperInvestorPolicyResearchSecondary EducationUniversity EducationUtility
ConsumerDeveloperInvestorPolicyResearchSecondary EducationUniversity EducationUtility
ConsumerDeveloperInvestorPolicyResearchSecondary EducationUniversity EducationUtility
ConsumerDeveloperInvestorPolicyResearchSecondary EducationUniversity EducationUtility
ConsumerDeveloperInvestorPolicyResearchSecondary EducationUniversity EducationUtility
ConsumerDeveloperInvestorPolicyResearchSecondary EducationUniversity EducationUtility
ConsumerDeveloperInvestorPolicyResearchSecondary EducationUniversity EducationUtility
51111
507
4196159
486027
416750
3523173
9141168
62234
3992410
916211
56190
7647
10137710396
2996
37121
89236
19761
10583619
159301948
2492386
93656
334590
48546
!
!
!
!
!
!
!
!
!
!
!
!
!
!
!
!
!
!
!
!
!
!
!
!
!
!
!
!
!
!
!
!
!
!
!
!
!
!
!
!
!
!
!
!
!
!
!
!
!
!
!
!
!
!
!
!
Corporate
Local Government
National Government
NGO
Private Citizen
UN
University
0 1000 2000 3000 4000 5000
SWERA Usage Statistics 2007!10!01 to 2010!09!30
45
We recognize the need to better understand users of the SWERA DSS who do not download products. The user survey attempts to address this shortcoming, but can only provide oblique understanding of the broader user community. Ultimately we decided to error on the side of less invasive methods.
The goal of the SWERA project is to encourage the development of renewable energy resources. As such the strong showing of investors and developers is very encouraging. There is a need to improve outreach to secondary education and local governmental organizations to build for the future. The very strong use in research and university education demonstrates the SWERA is serving these communities well.
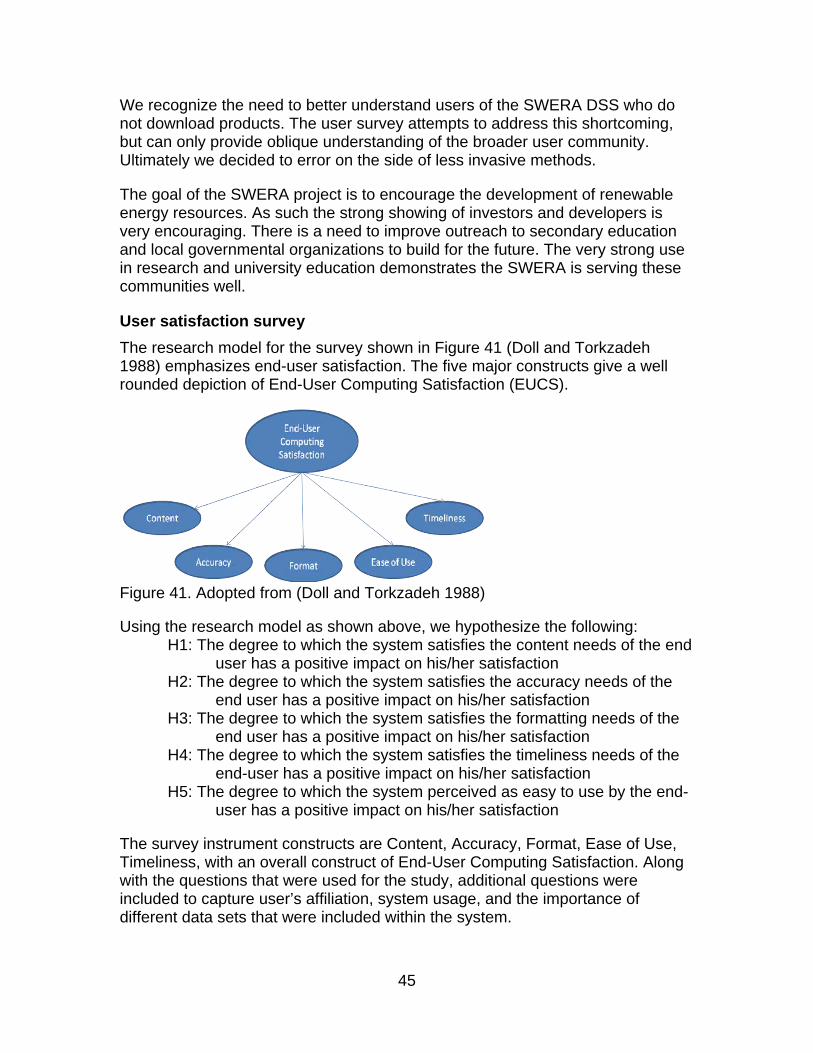
User satisfaction survey The research model for the survey shown in Figure 41 (Doll and Torkzadeh 1988) emphasizes end-user satisfaction. The five major constructs give a well rounded depiction of End-User Computing Satisfaction (EUCS).
Figure 41. Adopted from (Doll and Torkzadeh 1988)
Using the research model as shown above, we hypothesize the following:
H1: The degree to which the system satisfies the content needs of the end user has a positive impact on his/her satisfaction
H2: The degree to which the system satisfies the accuracy needs of the end user has a positive impact on his/her satisfaction
H3: The degree to which the system satisfies the formatting needs of the end user has a positive impact on his/her satisfaction
H4: The degree to which the system satisfies the timeliness needs of the end-user has a positive impact on his/her satisfaction
H5: The degree to which the system perceived as easy to use by the end-user has a positive impact on his/her satisfaction
The survey instrument constructs are Content, Accuracy, Format, Ease of Use, Timeliness, with an overall construct of End-User Computing Satisfaction. Along with the questions that were used for the study, additional questions were included to capture user’s affiliation, system usage, and the importance of different data sets that were included within the system.
46
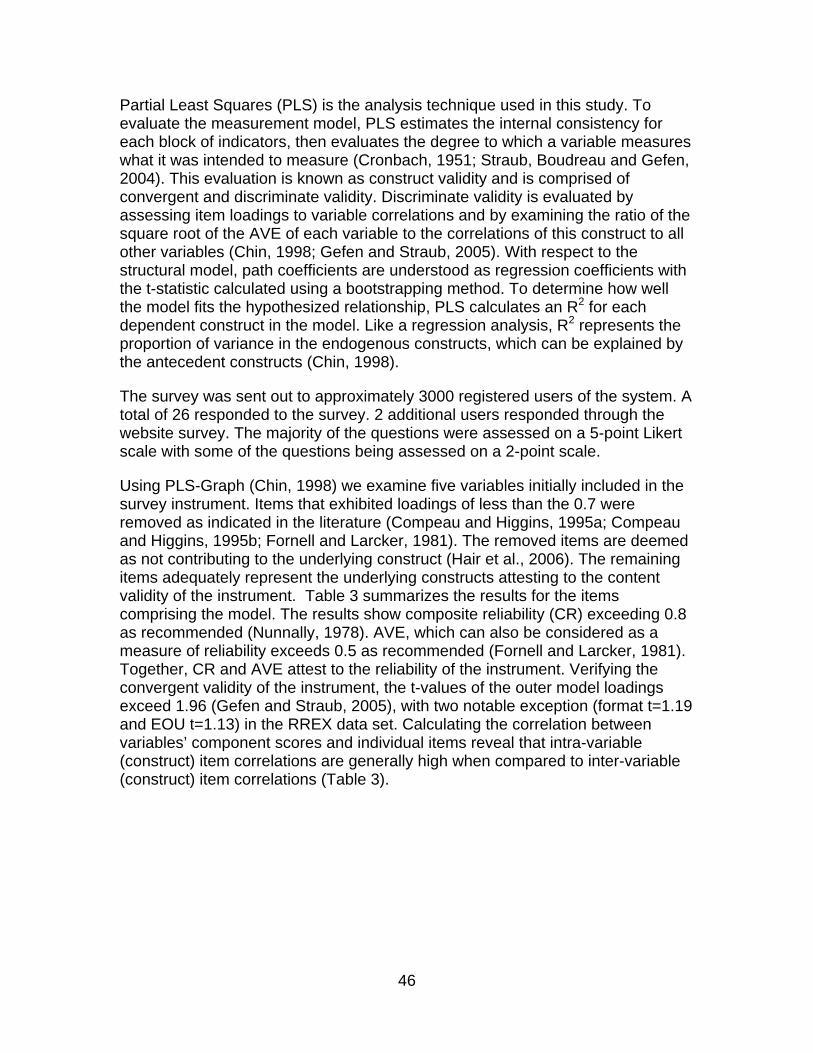
Partial Least Squares (PLS) is the analysis technique used in this study. To evaluate the measurement model, PLS estimates the internal consistency for each block of indicators, then evaluates the degree to which a variable measures what it was intended to measure (Cronbach, 1951; Straub, Boudreau and Gefen, 2004). This evaluation is known as construct validity and is comprised of convergent and discriminate validity. Discriminate validity is evaluated by assessing item loadings to variable correlations and by examining the ratio of the square root of the AVE of each variable to the correlations of this construct to all other variables (Chin, 1998; Gefen and Straub, 2005). With respect to the structural model, path coefficients are understood as regression coefficients with the t-statistic calculated using a bootstrapping method. To determine how well the model fits the hypothesized relationship, PLS calculates an R2 for each dependent construct in the model. Like a regression analysis, R2 represents the proportion of variance in the endogenous constructs, which can be explained by the antecedent constructs (Chin, 1998).
The survey was sent out to approximately 3000 registered users of the system. A total of 26 responded to the survey. 2 additional users responded through the website survey. The majority of the questions were assessed on a 5-point Likert scale with some of the questions being assessed on a 2-point scale.
Using PLS-Graph (Chin, 1998) we examine five variables initially included in the survey instrument. Items that exhibited loadings of less than the 0.7 were removed as indicated in the literature (Compeau and Higgins, 1995a; Compeau and Higgins, 1995b; Fornell and Larcker, 1981). The removed items are deemed as not contributing to the underlying construct (Hair et al., 2006). The remaining items adequately represent the underlying constructs attesting to the content validity of the instrument. Table 3 summarizes the results for the items comprising the model. The results show composite reliability (CR) exceeding 0.8 as recommended (Nunnally, 1978). AVE, which can also be considered as a measure of reliability exceeds 0.5 as recommended (Fornell and Larcker, 1981). Together, CR and AVE attest to the reliability of the instrument. Verifying the convergent validity of the instrument, the t-values of the outer model loadings exceed 1.96 (Gefen and Straub, 2005), with two notable exception (format t=1.19 and EOU t=1.13) in the RREX data set. Calculating the correlation between variables’ component scores and individual items reveal that intra-variable (construct) item correlations are generally high when compared to inter-variable (construct) item correlations (Table 3).

47
Table 3. Survey analysis results
Dimension
Code Question Mean
S.D. Item Loading
CR AVE
Content C 0.923 0.670 C2 The system provides
information content that meets my needs
3.5 1 0.876
C3 The system provides useful information
3.89 .99 0.886
C4 The system provides sufficient information
3.46 .96 0.812
C5 Use of terminology throughout the system was
3.46 1.2 0.602
C6 Overall, I feel the system meets my needs
3.39 .88 0.839
C7 Overall, I feel the terminology relates well to the work I am doing
3.5 .92 0.863
Accuracy A 0.939 0.885 A1 The system provides accurate
information 3.64 .87 0.933
A2 Overall, I feel satisfied with the accuracy of the system
3.54 .79 0.949
Format F 0.843 0.642 F1 Overall, I feel the output is
presented in a useful format 3.5 1 0.726
F2 Overall, I feel the presentation of the system is attractive
3.32 .98 0.831
F3 Overall, I feel everything on the system is easy to understand
3.5 1.04 0.842
Timeliness
T 0.846 0.650
T2 Length of delay between operations is
3.07 .98 0.795
T3 Overall, I feel the system keeps me informed about what it is doing
3.18 1.02 0.687
T4 Overall, I can get the information I need in time
3.46 .92 0.726
Ease-of-Use
0.962 0.698
EoU1 The system is user friendly 3.54 1.04 0.857 EoU2 The system is easy to use 3.71 .98 0.899 EoU3 The system is easy to learn 3.57 1 0.904
48
EoU4 The system is easy to get it to do what I want it to do
3.46 .96 0.803
EoU7 I feel learning to operate the system was
3.14 1.04 0.856
EoU8 I feel getting started was 3.11 1.1 0.823 EoU9 I feel learning advanced features
was 2.82 1.09 0.819
EoU10
I feel the time to learn to use the system was
3.21 .99 0.825
EoU11
I feel discovering new features was
2.93 1.12 0.787
EoU13
The number of steps per task was
3.18 1 .06 0.799
EoU14
Overall, I feel the tasks can be performed in a straight-forward manner
3.25 1 0.808
End-User Satisfaction
OS 0.949 0.756
OS1 Overall the system was satisfying
4 1.22 0.898
OS2 Overall the system was easy 3.68 1.09 0.767 OS3 Overall how satisfied are you
with the SWERA website 4.21 1.1 0.918
OS4 Overall how satisfied are you with the SWERA mapping and graphing tools (RREX)
3.61 1.17 0.793
OS5 Overall how satisfied are you with the SWERA product search
3.82 1.17 0.895
OS6 Overall how satisfied were you with the SWERA system
3.93 1.25 0.930
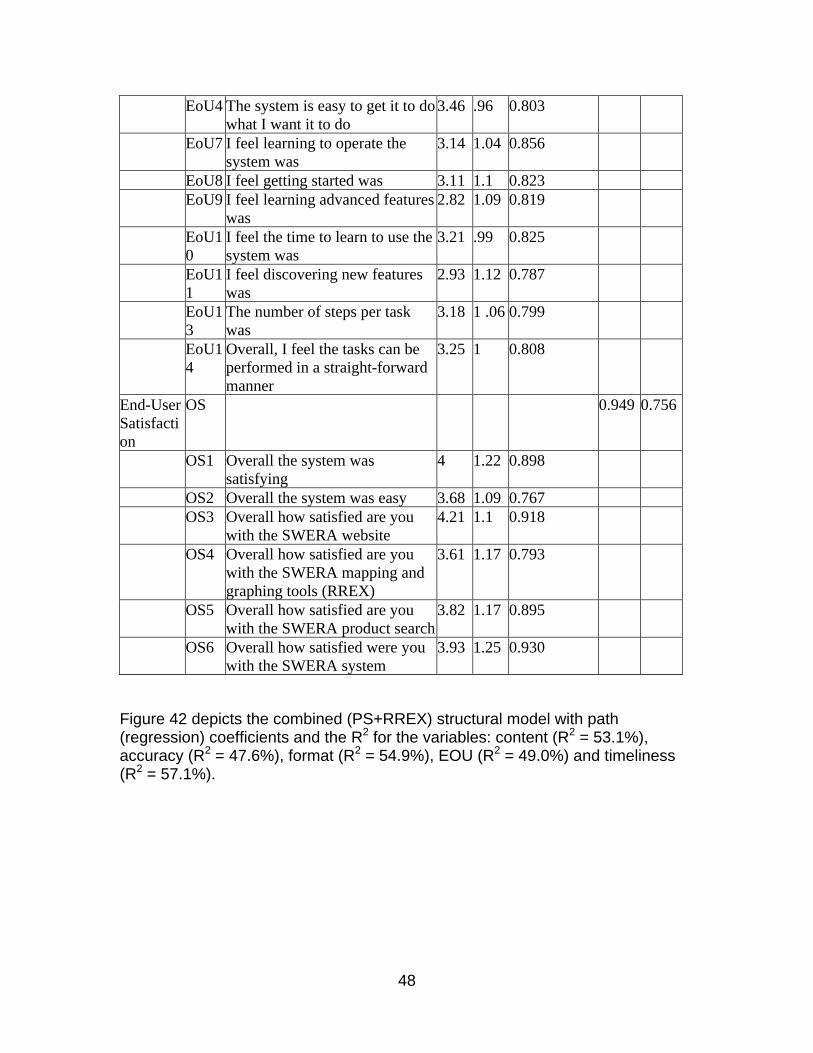
Figure 42 depicts the combined (PS+RREX) structural model with path (regression) coefficients and the R2 for the variables: content (R2 = 53.1%), accuracy (R2 = 47.6%), format (R2 = 54.9%), EOU (R2 = 49.0%) and timeliness (R2 = 57.1%).
49
Figure 42. PS+RREX Structural Model With respect to the determinants of end-user satisfaction in the combined model (PS+RREX), all constructs are significant: content (β = 0.729 p < 0.0001), accuracy (β = 0.690 p < 0.0001), format (β = 0.741 p < 0.0001), EOU (β = 0.700 p < 0.0001) and timeliness (β = 0.756 p < 0.0001). These findings are consistent with prior work (Doll and Torkzadeh, 1988). Examining the PS model data alone, content (β = 0.640 p < 0.0001) is statistically significant, along with EOU (β = 0.763 p < 0.0001), Timeliness (β = 0.679 p < 0.0001), format (β = 0.542 p = 0.0006) and accuracy (β = 0.512 p = 0.0069). The RREX data alone is notable in that content, accuracy, and timeliness are all significant at the p < 0.0001 level, while format (β = 0.792 p < 0.2591) and EOU (β = 0.797 p < 0.2825) are insignificant. The combined data suggests that end-user satisfaction with the system is a function of the measured variables of content, accuracy, format and timeliness. Overall, user evaluations for the five dimensions of end-user satisfaction considered in this study are positive. Moreover, the model exhibits a good fit with the data and provides a satisfactory explanatory power for end-user satisfaction with the system.
The use of the EUCS construct (Doll and Torkzadeh 1988), allows for the validation of the user satisfaction construct with the system. Through the PLS analysis, the constructs are shown to be significant when looking at the system as a whole. Overall, the users were satisfied with the system. As a generalization, the results further validate the significance of the content, timeliness, ease of use, accuracy, and format on user satisfaction with environmental decision support systems. The limitation of this work is the relatively small sample size. Additional work could be done to expand the sample size to further validate the findings. With respect to the SWERA-DSS, additional

50
work could be done to find new ways to reduce delays within the system being as timeliness had the lowest average mean amongst the constructs.
Access to global renewable energy and climate data The incorporation of the SSE renewable energy and climate data was a major evolutionary step. For the first time SWERA has access to global data and to climate variables. Equally important the Surface meteorology and Solar Energy (SSE) data provides a second independent estimate that builds on a long (22 year) time series that itself continues to evolve. This long record permits the estimation of uncertainty and provides a more stable estimate. Documentation of uncertainty of the estimates is not trivial, particularly with the mix of multiple producers supporting different temporal and spatial resolutions that build on different historical records. Nonetheless the importance of documenting the uncertainty is critical to ensure confidence in the use of the products by investors and others seeking information to support the development of renewable energy technologies. The NASA POWER research results provide renewable energy and climatology data for the entire world. These data provide a vital source of information to countries with no access to publicly available national renewable energy assessments and also provide information needed to create national renewable energy assessments and plans. Incremental improvements to the NASA POWER research results are beyond the scope of this project, but the long-term incorporation of improvements are in the life cycle process of the evolution of the SWERA DSS. Parallel to this activity is the continued improvement of the estimates by our partners working with NASA and other GEOSS organizations. SWERA provides access to multiple independent sources of renewable energy resource estimates, as is required by many investors. NASA POWER research results will continue to exist in the mix from multiple sources.
Small hydropower assessments The prototype small hydropower assessments build on global NASA data that were complemented by NOAA, USGS, FAO and national data. This prototype provided two learning opportunities. In year one, a continental small hydropower database was created and alternatives on how to serve the data to the community and how to implement a continental- or global-scale small hydropower framework were investigated Overall, the initial results of the Africa continental assessment are very promising and could lead to a verifiable continental assessment in the future. Following this large area investigation, the SWERA small hydropower study focused on two countries – one in Africa and one in Central America – where the team had experience and where past SWERA high resolution assessments have been completed. The Ethiopian experience builds directly on past flood monitoring applications. The intent is to build on this experience and tie future small hydropower assessments to flood and drought monitoring projects thereby

51
significantly reducing the cost of implementation. Estimates of stream flow and head are two key components in hydropower assessment. Indeed, it is the flow of water and the height of the drop of the water that determines the size [potential] of a hydroelectric facility (CanREN, 2006). SWERA addresses the shortage of ground-based hydrological data (discharge gauge station data) necessary to study hydropower potential by estimating stream flow.
The methodology and alternative hydropower assessment structures were investigated during the African assessment. The two renewable energy analysis systems: RETScreen and HOMER require a flow duration curve and month flow estimates respectively.
Gross hydropower potential computation For the continental assessment, gross hydropower potential was computed for each river reach. The estimates of gross hydropower potential are compared with published Africa-wide and national estimates reported in the Small Hydro Atlas (http://www.small-hydro.com/). The gross hydropower potential (GHP) of all of Africa was computed by GeoSFM as 3,517 TWh/year compared to a published estimate of 3,884 TWh/year.
Figure 43. Gross Hydropower comparison by basin.
Figure 43 compares the national gross hydropower estimates of 50 African countries computed by GeoSFM with those from the World Energy Council (WEC) Survey of Energy Resources (2007). The results indicate a slightly higher tendency towards under-prediction of the gross hydropower estimates of individual countries. The average over-predictions is +50% while the average under-prediction is -190%.

52
A defining characteristic of small hydropower plants is the absence of local flow storage. The plants must consequently rely on run-of-river flows. An important feature of the GeoSFM simulations, which does not exist in the WEC dataset, is the characterization of daily, seasonal and interannual variations of hydropower. This variation allows for the estimation of reliability of hydropower at each location in the form of flow duration curves or power duration curves.
Other information is available that may provide important alternate representation of the hydropower potential for use by policy makers and investors. For example it is possible to quantify the potential of basins and stream reaches by their potential for different classes of hydropower development, such as micro-hydro (10KW to 500KW), mini-hydro (500KW to 10MW) and large-hydro (>10MW) (Figure 6). Hydropower plants with capacity smaller than 10KW (referred to as Pico-hydro) may still be installed in some sites. (Asante et al, 2008a). However, hydropower potential at such tiny scales cannot reliably be assessed using the continental scale datasets available for this study. To be able to capture these distinctive hydropower classes, a high level of precision is needed for stream flow and head data. Also, the large hydropower class could further be divided into medium hydro, ranging from 10MW to 500MW and large-hydro for anything in excess of 500MW. However, both the medium and large-hydropower classes require the installation of equipment in excess of what would be regarded as small-hydropower plants. A single large hydropower class is however retained because of the possibility of applying site-specific technical solutions such as side channels to extract a portion of the stream flow for power generation. For each of the resulting three power classes, an estimate is made for each river reach of the number of days during a normal month when hydropower potential falls within the defined class. Sample results of the Africa-wide analysis are shown in Figure 44.

53
Figure 44. An alternate presentation of the power variability data comparing the average number of days each year when hydropower potential along each river in Africa is within the limits defined for (a) micro-hydro, (b) mini-hydro and (c) large-hydro. Three colors classes (grey, red and maroon) are defined for intervals of (0 – 120), (120 – 240) and (240 – 365) days, respectively. (d) The number of days during an average year when hydropower potential at a sample location could be classified as micro, mini and large respectively.
The runoff, stream flow and hydropower results have been compared with existing datasets available in the public domain. These comparisons show that, in some locations, significant differences exist between the simulations and observations. However, the simulations provide information on interannual, seasonal and even daily variations of stream flow, which is currently not available in the public domain. The stream flow variations in turn allow estimates of small hydropower potential to be made based on run-of-river flows.

54
The products generated in this study are best suited to the identification of regions with relatively high small hydropower potential as a guide to more detailed local study and resource quantification. They also serve to expand SWERA’s renewable energy portfolio to include hydropower assessments, thus allowing for rapid comparison of alternate renewable energy resources when considering an integrated resource implementation in a particular region.
However, the spatial resolution and accuracy of the satellite-derived rainfall estimates limit the quantitative accuracy of the result. Some of the data and model limitations can be addressed to increase the applicability of the assessments to decision making at national and subnational scales. For example, the inclusion of nationally held in-situ rainfall datasets would improve the quality of model inputs. In addition, higher resolution elevation datasets available from the SRTM mission were not included in the initial Africa or Ethiopia hydropower assessment because they are too large to be processed.
Calibration of GeoSFM’s runoff generation and stream flow routing parameters using nationally-held stream flow datasets would improve the accuracy of flow magnitude and timing and consequently hydropower estimates. The inclusion of higher resolution and nationally-held datasets can only be achieved through partnership with international and local agencies with the appropriate mandate. The small hydropower component of the project relies on many NASA science results including elevation, precipitation, and land cover. The continued evolution of these products will permit continued improvement of renewable energy resource assessments.

55
Conclusions Investors prefer multiple independent sources of estimates before committing funds for development. SWERA provides an opportunity to compare and contrast data from multiple providers. The NASA SSE renewable energy resource data provide an independent source of renewable energy data with a long time series to complement higher spatial resolution data. The NASA SSE climate data provide information needed by energy analysis tools in the analysis and sizing of alternative renewable energy technologies.
The large variability among the estimates emphasizes the need to provide multiple estimates to possible investors and the importance of collecting local measurements prior to investment. The estimates provided by SWERA, guide pre-feasibility and feasibility studies. The variability of the estimates emphasizes the need for further studies. The renewable energy resource data can be downloaded in its entirety as individual GIS data sets or all layers can be downloaded at a point for analysis in a statistical or GIS package for intercomparison studies and comparison to local measurements.
Large area small hydropower assessments were shown to be practical. Available rainfall and stream discharge estimates limit the accuracy of small hydropower assessments. The NASA Global Precipitation Measurement mission building on the success of TRMM will advance the science of rainfall estimation for use in applications, such as SWERA. With improved rainfall estimates, the emergence of the ASTER GDEM to complement SRTM, and better land cover mapping, the stream flow models will continue to improve. Continental scale assessments are feasible given sufficient national control over the estimates in the form of local rainfall estimates and steam flow information. At this time the infrastructure to create continental scale assessments does not exist. However the potential for adding national small hydropower assessments as a value added product to flood and drought studies exists. SWERA could provide the framework and specifications for producing small hydropower assessments that could readily be used by the small hydropower community.
High resolution renewable energy data remain the heart of the SWERA database. High-resolution data created in partnership with national agencies with access to calibration data provide the best estimates of renewable energy potential for use in energy analysis packages. The involvement of national agencies as stakeholders further increases the likelihood that results of the renewable energy assessments will become national policy. UNEP and its team of international partners are uniquely positioned to build national partnerships.

56
References Artan, G.A., Asante, K.O., Smith, J.L., Pervez, S., Entenmann, D., Verdin, J. P., and Rowland J. (2007a). Users Manual for the Geospatial Stream Flow Model (GeoSFM), Reston, Virginia, U.S. Geological Survey Open-File Report 2007-1440, p.194.
Artan, G., Gadain, H., Smith, J. L., Asante, K., Bandaragoda, C. J., and Verdin, J. P. (2007b). Adequacy of satellite derived rainfall data for stream flow modeling. Natural Hazards, 43, 167-185.
Artan, G., Gadain, H., Muthusi F. and Muchiri, P. (2007c). Improving Flood. Forecasting and Early Warning in Somalia, Feasibility Study, Technical Report No W-10, FAO-SWALIM, Nairobi, Kenya.
Asante, K.O., Artan, G.A., Pervez, S., Bandaragoda, C. and Verdin, J.P., (2007a). Technical Manual for the Geospatial Streamflow Model (GeoSFM), Reston, Virginia, U.S. Geological Survey Open-File Report 2007-1441, p. 99.
Asante K., Macuacua, R.. Artan, G., Lietzow, R. and Verdin, J. P. (2007b). Developing a Flood Monitoring System from Remotely Sensed Data for the Limpopo Basin, IEEE Transactions on Geoscience and Remote Sensing, 45(6): 1709-1714.
Asante, K.O., Munzimi, Y. and Fosnight, E. (2008a). Assessment of Small Hydropower Potential of Africa with Remotely Sensed Data, USGS /SWERA/UNEP
Asante, K. O., Artan, G. A., Pervez, S., and Rowland, J. R. (2008b). A linear geospatial stream flow modeling system for data sparse environments. International Journal River Basin Management, 6(3), 233-241.
Bahailu, S., (2004). Stream flow simulation for the upper Awash Basin, M.Sc. thesis Addis Ababa University, Department of Civil Engineering.
Bahill, A. T. and Gissing, B. (1998). Re-evaluating systems engineering concepts using systems thinking. Systems, Man, and Cybernetics, Part C: Applications and Reviews, IEEE Transactions on, 28(4), 516-527.
Canada Renewable Energy Network (CanREN), (2006). Technology and applications: Planning a small hydroelectric facility. Available at http://www.canren.gc.ca/tech_appl/index.asp?CaID=4&PgID=270; accessed on May13, 2008.
Cherni, J. A., Dyner, I., Henao, F., Jaramillo, P., Smith, R., and Font, R. O. (2007). Energy supply for sustainable rural livelihoods. A multi-criteria decision-support system. Energy Policy, 35(3), 1493-1504.

57
Chin, W. W. (1998). Commentary: Issues and opinion on structural equation modeling, MIS Quarterly, 22, 1, 7-16
Compeau, D. R. and Higgins, C. A. (1995a). Application of Social Cognitive Theory to Training for Computer Skills, Information Systems Research, 6, 2, 118-143.
Compeau, D. R. and Higgins, C. A. (1995b). Computer Self-Efficacy - Development of a Measure and Initial Test, MIS Quarterly, 19, 2, 189-211.
Cronbach, L. (1951). Coefficient alpha and the internal structure of tests, Psychometrika, 16, 297-334.
Díez, E. and McIntosh, B. S. (2009). "A review of the factors which influence the use and usefulness of information systems." Environmental Modelling & Software 24(5): 588-602.
Dinku, T., Caccetta, P., Grover-Kopec, E., Lemma, M., Conner, S. J., and Ropelewski, C. F. (2007). Validation of satellite rainfall products over East Africa's complex topography. International Journal of Remote Sensing, 28(7), 1503-1526.
Dinku, T., Conner, S. J., Ceccato, P., and Ropelewski, C. F. (2008). Comparison of global gridded precipitation products over a mountainous region of Africa. International Journal of Climatology, 28, 1627-1638.
Doll, W. and Torkzadeh, G. (1988). The Measurement of End-User Computing Satisfaction. MIS Quarterly 12(2): 259-274.
FAO (Food and Agriculture Organization of the United Nations), (1995). Digital soil map of the world and derived soil properties. CD-ROM, version 3.5, November 1995.
El-Gayar, O., Deokar, A., Michels, L., and Fosnight, G. (2011). “The Development of an EDSS: Lessons Learned and Implications for DSS Research: in: Proceedings of the 44th Annual Hawaii International Conference on System Sciences (HICSS-44 '11), IEEE Computer Society, Kauai, HI.
Fornell, C., and Larcker, D. F. (1981). Structural Equation Models with Unobservable Variables and Measurement Error - Algebra and Statistics, Journal of Marketing Research, 18, 3, 382-388.
Gefen, D. and Straub, D. (2005). A practical guide to factorial validity using PLS-GRAPH: Tutorial and annotated example, Communication of the AIS, 16, 91-109.
Georgilakis, P. S. (2005). State-of-the-art of decision support systems for the choice of renewable energy sources for energy supply in isolated regions, International Journal of Distributed Energy Resources, 2, 129-150.
58
Georgopoulou, E., Sarafidis, Y. and Diakoulaki, D. (1998). Design and implementation of a group DSS for sustaining renewable energies exploitation. European Journal of Operational Research, 109(2), 483-500.
Gesch, D.B., Verdin, K.L., and Greenlee, S.K. (1999). New land surface digital elevation model covers the Earth. Eos. Transactions. American Geophysical Union, 80(6), 69-70.
Hair, J. F., Black, B., Babin, B., Anderson, R. E., and Tatham, R. L. (2006). Multivariate Data Analysis, 6th ed., Prentice Hall, 928.
Johnson, P.A., and Curtis D. 1994. Water balance of Blue Nile Basin in Ethiopia. Journal of Irrigation and Drainage Engineering, 120(3), 573–590.
Lambert, T., Gilman, P., and Lilienthal, P. (2006). Chapter 15: Micropower system modeling with HOMER. In F. A. Farret & M. G. Simoes (Eds.), Integration of Alternative Sources of Energy. (pp. 379-418).
Lehner, B. and Döll, P. (2004), Development and validation of a global database of lakes, reservoirs and wetlands, Journal of Hydrology, 296(1-4), 1 – 22.
Lehner, B., Verdin, K. L., and Jarvis, A. (2008). New Global Hydrography Derived from Spaceborne Elevation Data. EOS, Transactions, American Geophysical Union, 89(10), 93-94.
Loveland, T. R. and Belward, A. S. (1997). The IGBP-DIS Global 1 km Land Cover Data Set, DISCover First Results. International Journal of Remote Sensing, 18(5), 3,289-3,295.
Michels, L, El-Gayar, O., & Wills, M. (2010) Solar and Wind Energy Resource Assessment (SWERA): A Usability Case Study. In International Environmental Modelling and Software Society (IEMSS) 2010 International Congress on Environmental Modelling and Software Modelling for Environment’s Sake, Fifth Biennial Meeting, Ottawa, Canada. Swayne, D. a. , Yang W, Voinov, A. A., Rizzoli, A., & Filatova, T. (Eds.) http://www.iemss.org/iemss2010/index.php?n=Main .Proceedings
NASA. (2010). Surface meteorology and Solar Energy (SSE) Release 6.0 Methodology, Version 2.3. Available at: (http://power.larc.nasa.gov/common/MethodologySSE6/POWER_Methodology_Content.html) on 25 September 2010.
Nunnally, J. C. (1978). Psychometric Theory, 2nd ed., McGraw Hill, New York.
Olivera, F., and Maidment, D., (1999). Geographic Information Systems (GIS)-based spatially distributed model for runoff routing. Water Resource Res. 35(4), 1155-1164.

59
Ouma G. O, Adafre C. and Muthama, N. J. (2005). Validation of Satellite-Derived Rainfall Estimates: The Ethiopian Case Study, Proc. 7th Kenya Meteorological Society Workshop on Meteorological Research, Applications and Services, Nairobi, 17-21 0ctober 2005
Renné, D. S. (2008). Chapter 3: Decision support system for assessing hydrid renewable energy systems. In J. Koziana, F. Vukovich, M. Macauley, C. Churchwell, & P. Gregory (Eds.), Uses and limitations of observations, data, forecasts, and other projections in decision support of selected sectors and regions: Synthesis and Assessments Product 5.1. (pp. 17-28). U.S. Climate Change Science Program.
Renné, D. S., Perez, R., Zelenka, A., Whitlock, C. H., and DiPasquale, R. (1999). Chapter 5: Use of Weather and Climate Research Satellites for Estimating Solar Resources. In D. Y. Goswami & K. W. Boer (Eds.), Advances in Solar Energy. (pp. 171-240). Boulder: The American Solar Energy Society.
Sartipi, K., Yarmand, M. H., and Down, D. G. (2007). Mined-Knowledge and Decision Support Services in Electronic Health. Paper presented at the International Workshop on Systems Development in SOA Environments (SDSOA'07: ICSE Workshops 2007), Minneapolis, Minnesota.
Schillings, C., Pereira, E. B., Perez, R., Meyer, R., Trieb, F., and Renné, D. S. (2002). High resolution solar energy resource assessment within the UNEP project SWERA. Paper presented at the World Renewable Energy Congress VII, Cologne, Germany.
Senay, G. B. and Verdin, J. P, (2003). Characterization of Yield Reduction in Ethiopia Using a GIS-Based Crop Water Balance Model. Canadian Journal of Remote Sensing, 29(6), 687-692.
Shrestha, M. S., Artan, G. A., Bairacharya, S. R., and Sharma, R. R. (2008). Using satellite-based rainfall estimates for streamflow modelling-Bagmati Basin. Journal of Flood Risk Management, 1(2), 89-99.
Stackhouse, P.W., Jr., C.H. Whitlock, R.C. DiPasquale, D.E. Brown II, W.S. Chandler, (2002). Meeting Energy-Sector Needs with NASA Climate Datasets, Earth Observing Magazine, 11(8), 6-10.
Stackhouse, P. W., Jr, Whitlock, C. H., Chandler, W. S., Hoell, J. M., & Zhang, T. (2004). Solar renewable energy data sets from NASA Satellites and research. Paper presented at the Proceedings of the solar conference.
Stackhouse, P. W., Jr., Eckman, R. S., Whitlock, C. H., Chandler, W. S., Hoell, J. M., Zhang, T., Mikovitz, J. C., Leng, G. S., and Lilienthal, P, (2006). Supporting Energy-Related Societal Applications Using NASA’s Satellite and Modeling Data.

60
IEEE International Geoscience and Remote Sensing Symposium, Geoscience and Remote Sensing, Denver, CO, 31 July – 4 August.
Straub, D. W., Boudreau, M.-C., and Gefen, D. (2004). Validation guidelines for IS positivist research, Communications of the AIS, 13, 24, 380-427.
Terry, L. F. and Spence, J. W. (2005). The effect of decision style on the use of a project management tool: an empirical laboratory study. SIGMIS Database, 36(2), 28-42.
Turner, M., and Kitchenham, B. (2010). Does the technology acceptance model predict actual use? A systematic literature review. Information and Software Technology, 52(5), 463-479.
van der Meulen, G. G. (1992). Geographical information and decision support system. Computers, Environment and Urban Systems, 16(3), 187-193.
Verdin, J. and Klaver, R. (2002). Grid cell based crop water accounting for the famine early warning system. Hydrological Processes, 16,1617-1630.
Sauter, V. L. (1999). "Intuitive decision-making." Commun. ACM, 42(6), 109-115.
Sauter, V. L. and Free, D. (2005). Competitive intelligence systems: qualitative DSS for strategic decision making. SIGMIS Database 36(2), 43-57.
Vörösmarty, C.J., Fekete, B. and Tucker, B. A. (1998). River Discharge Database, Version 1.1 (RivDIS v1.0 supplement). Available through the Institute for the Study of Earth, Oceans, and Space / University of New Hampshire, Durham NH (USA).
World Energy Council (WEC). (2007). 2007 Survey of Energy Resources, World Energy Council, London, 600 p. available at http://www.worldenergy.org/documents/ser2007_final_online_version_1.pdf on 24 November 2008.
Wielicki, B. A., Barkstrom, B. R., Baum, B. A., Charlock, T. P., Green, R. N., Kratz, D. P., Lee, R. B., Minnis, P., Smith, G. L. Wong, T., Young, D. F., Cess, R. D., Coakley, J. A., Crommelynck, D. A. H., Donner, L., Kandel, R., King, M.D., Miller, A. J., Ramanathan, V, Randall, D. A., Stowe, L. L., and Welch, R. M. (1998). Clouds and the Earth's Radiant Energy System (CERES): algorithm overview. Geoscience and Remote Sensing, IEEE Transactions on, 36(4), 1127-1141.
Woube, M. (1999). Flooding and sustainable land–water management in the lower Baro–Akobo river basin, Ethiopia, Applied Geography, 19(3), 235-251.

61
Xie, P. and Arkin, P.A. (1997). A 17-year monthly analysis based on gauge observations, satellite estimates, and numerical model outputs. Bulletin of the American Meteorological Society, 78(11), 2539–2558.
Zobler, L. (1986). A world soil file for global climate modeling, NASA Tech. Memo. 87802, NASA Goddard Institute for Space Studies, New York, NY.
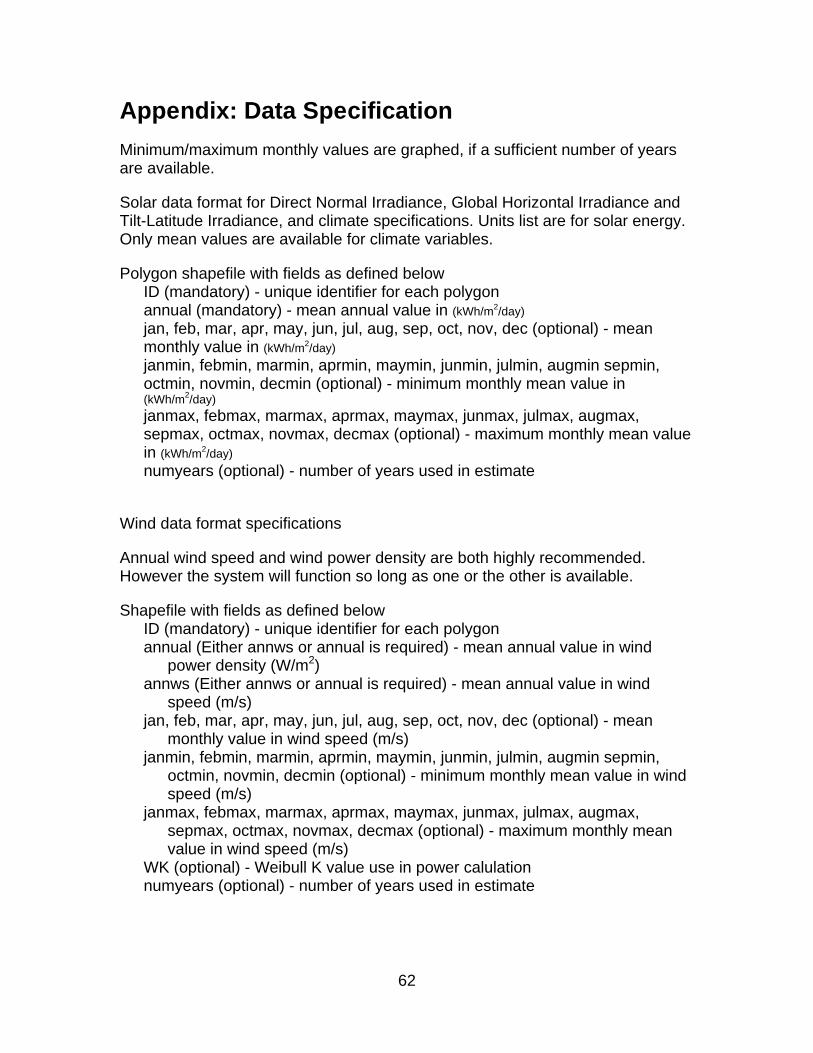
62
Appendix: Data Specification Minimum/maximum monthly values are graphed, if a sufficient number of years are available.
Solar data format for Direct Normal Irradiance, Global Horizontal Irradiance and Tilt-Latitude Irradiance, and climate specifications. Units list are for solar energy. Only mean values are available for climate variables.
Polygon shapefile with fields as defined below ID (mandatory) - unique identifier for each polygon annual (mandatory) - mean annual value in (kWh/m2/day) jan, feb, mar, apr, may, jun, jul, aug, sep, oct, nov, dec (optional) - mean monthly value in (kWh/m2/day) janmin, febmin, marmin, aprmin, maymin, junmin, julmin, augmin sepmin, octmin, novmin, decmin (optional) - minimum monthly mean value in (kWh/m2/day) janmax, febmax, marmax, aprmax, maymax, junmax, julmax, augmax, sepmax, octmax, novmax, decmax (optional) - maximum monthly mean value in (kWh/m2/day) numyears (optional) - number of years used in estimate
Wind data format specifications
Annual wind speed and wind power density are both highly recommended. However the system will function so long as one or the other is available.
Shapefile with fields as defined below ID (mandatory) - unique identifier for each polygon annual (Either annws or annual is required) - mean annual value in wind
power density (W/m2) annws (Either annws or annual is required) - mean annual value in wind
speed (m/s) jan, feb, mar, apr, may, jun, jul, aug, sep, oct, nov, dec (optional) - mean
monthly value in wind speed (m/s) janmin, febmin, marmin, aprmin, maymin, junmin, julmin, augmin sepmin,
octmin, novmin, decmin (optional) - minimum monthly mean value in wind speed (m/s)
janmax, febmax, marmax, aprmax, maymax, junmax, julmax, augmax, sepmax, octmax, novmax, decmax (optional) - maximum monthly mean value in wind speed (m/s)
WK (optional) - Weibull K value use in power calulation numyears (optional) - number of years used in estimate
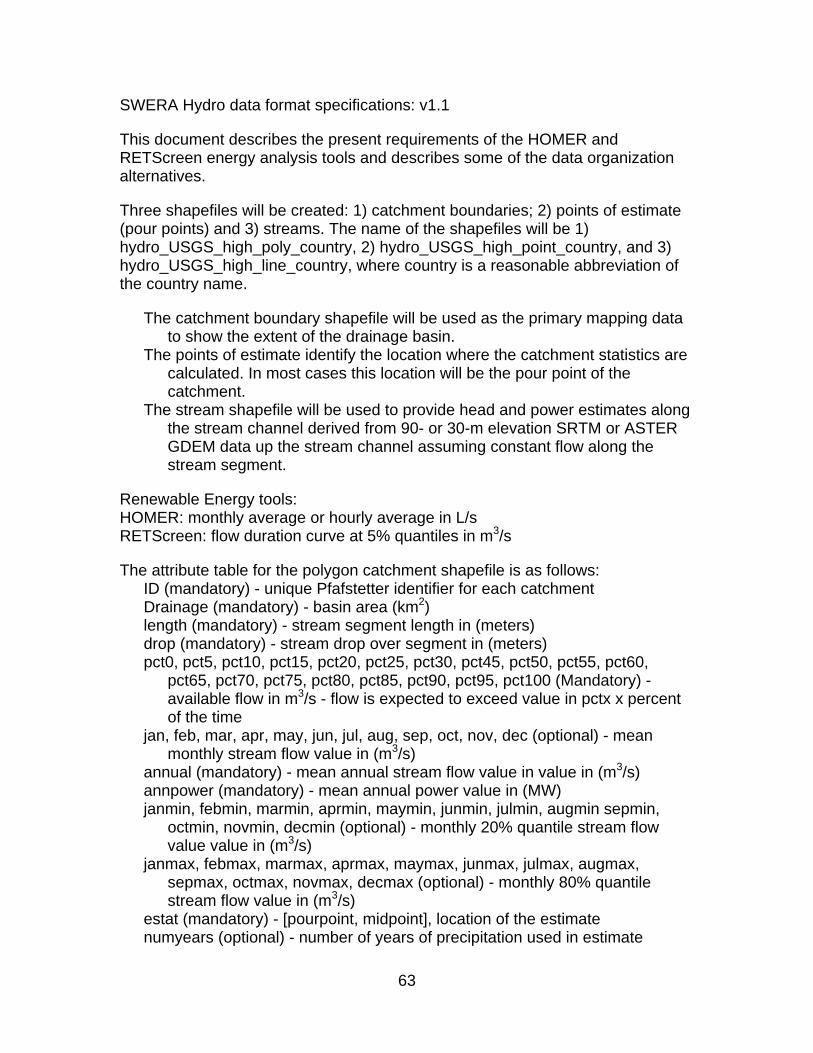
63
SWERA Hydro data format specifications: v1.1
This document describes the present requirements of the HOMER and RETScreen energy analysis tools and describes some of the data organization alternatives.
Three shapefiles will be created: 1) catchment boundaries; 2) points of estimate (pour points) and 3) streams. The name of the shapefiles will be 1) hydro_USGS_high_poly_country, 2) hydro_USGS_high_point_country, and 3) hydro_USGS_high_line_country, where country is a reasonable abbreviation of the country name.
The catchment boundary shapefile will be used as the primary mapping data to show the extent of the drainage basin.
The points of estimate identify the location where the catchment statistics are calculated. In most cases this location will be the pour point of the catchment.
The stream shapefile will be used to provide head and power estimates along the stream channel derived from 90- or 30-m elevation SRTM or ASTER GDEM data up the stream channel assuming constant flow along the stream segment.
Renewable Energy tools: HOMER: monthly average or hourly average in L/s RETScreen: flow duration curve at 5% quantiles in m3/s
The attribute table for the polygon catchment shapefile is as follows: ID (mandatory) - unique Pfafstetter identifier for each catchment Drainage (mandatory) - basin area (km2) length (mandatory) - stream segment length in (meters) drop (mandatory) - stream drop over segment in (meters) pct0, pct5, pct10, pct15, pct20, pct25, pct30, pct45, pct50, pct55, pct60,
pct65, pct70, pct75, pct80, pct85, pct90, pct95, pct100 (Mandatory) - available flow in m3/s - flow is expected to exceed value in pctx x percent of the time
jan, feb, mar, apr, may, jun, jul, aug, sep, oct, nov, dec (optional) - mean monthly stream flow value in (m3/s)
annual (mandatory) - mean annual stream flow value in value in (m3/s) annpower (mandatory) - mean annual power value in (MW) janmin, febmin, marmin, aprmin, maymin, junmin, julmin, augmin sepmin,
octmin, novmin, decmin (optional) - monthly 20% quantile stream flow value value in (m3/s)
janmax, febmax, marmax, aprmax, maymax, junmax, julmax, augmax, sepmax, octmax, novmax, decmax (optional) - monthly 80% quantile stream flow value in (m3/s)
estat (mandatory) - [pourpoint, midpoint], location of the estimate numyears (optional) - number of years of precipitation used in estimate

64
The attribute table for the point shapefile is as follows: ID (mandatory) - unique Pfafstetter identifier for each catchment
The attribute table for the line stream shapefile is as follows: IDseg (mandatory) - unique identifier for each stream segment ID (mandatory) - unique Phafstetter identifier for each catchment length (mandatory) - stream segment length in (meters) drop (manadatory) - stream drop over segment in (meters) annpower (mandatory) - mean annual power value in (MW) UpBasnArea (mandatory) – Upbasin Area (km)
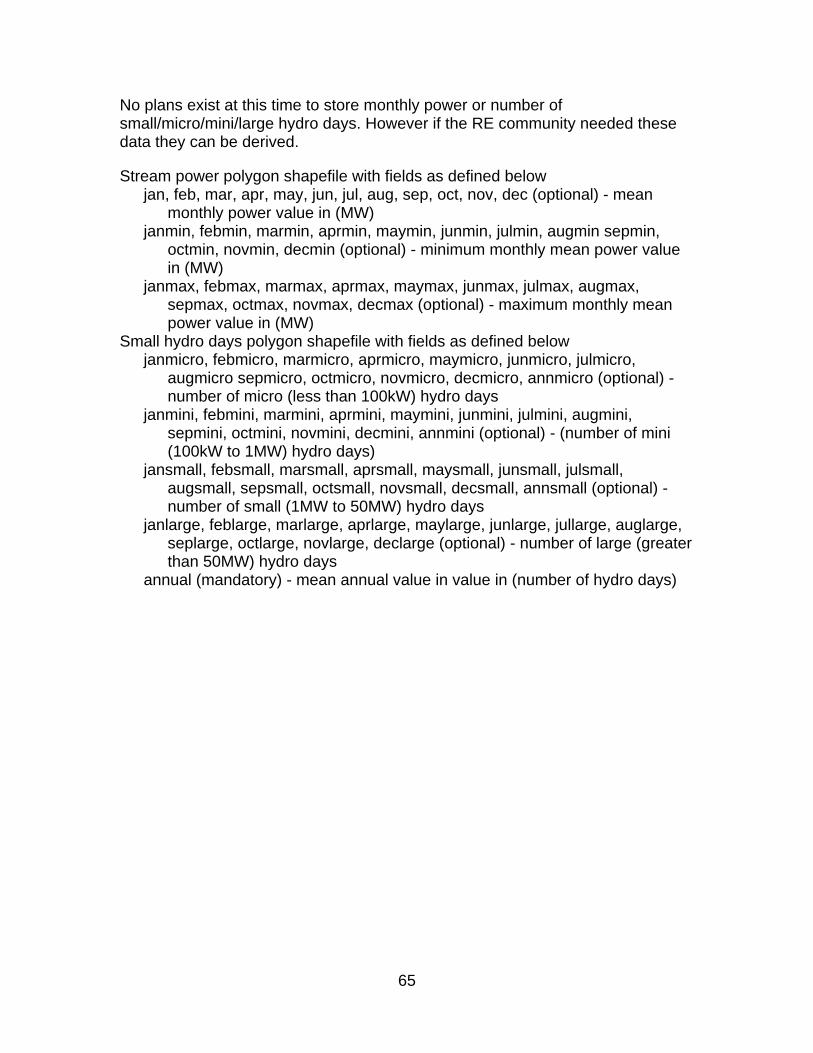
65
No plans exist at this time to store monthly power or number of small/micro/mini/large hydro days. However if the RE community needed these data they can be derived.
Stream power polygon shapefile with fields as defined below jan, feb, mar, apr, may, jun, jul, aug, sep, oct, nov, dec (optional) - mean
monthly power value in (MW) janmin, febmin, marmin, aprmin, maymin, junmin, julmin, augmin sepmin,
octmin, novmin, decmin (optional) - minimum monthly mean power value in (MW)
janmax, febmax, marmax, aprmax, maymax, junmax, julmax, augmax, sepmax, octmax, novmax, decmax (optional) - maximum monthly mean power value in (MW)
Small hydro days polygon shapefile with fields as defined below janmicro, febmicro, marmicro, aprmicro, maymicro, junmicro, julmicro,
augmicro sepmicro, octmicro, novmicro, decmicro, annmicro (optional) - number of micro (less than 100kW) hydro days
janmini, febmini, marmini, aprmini, maymini, junmini, julmini, augmini, sepmini, octmini, novmini, decmini, annmini (optional) - (number of mini (100kW to 1MW) hydro days)
jansmall, febsmall, marsmall, aprsmall, maysmall, junsmall, julsmall, augsmall, sepsmall, octsmall, novsmall, decsmall, annsmall (optional) - number of small (1MW to 50MW) hydro days
janlarge, feblarge, marlarge, aprlarge, maylarge, junlarge, jullarge, auglarge, seplarge, octlarge, novlarge, declarge (optional) - number of large (greater than 50MW) hydro days
annual (mandatory) - mean annual value in value in (number of hydro days)
Related Documents