The Smart Thermostat: Using Occupancy Sensors to Save Energy in Homes Jiakang Lu, Tamim Sookoor, Vijay Srinivasan, Ge Gao, Brian Holben, John Stankovic, Eric Field, Kamin Whitehouse SenSys 2010 Zurich, Switzerland

The Smart Thermostat: Using Occupancy Sensors to Save Energy in Homes Jiakang Lu, Tamim Sookoor, Vijay Srinivasan, Ge Gao, Brian Holben, John Stankovic,
Dec 25, 2015
Welcome message from author
This document is posted to help you gain knowledge. Please leave a comment to let me know what you think about it! Share it to your friends and learn new things together.
Transcript

The Smart Thermostat: Using Occupancy Sensors to Save Energy in Homes
Jiakang Lu, Tamim Sookoor, Vijay Srinivasan, Ge Gao, Brian Holben,John Stankovic, Eric Field, Kamin Whitehouse
SenSys 2010Zurich, Switzerland

Motivation
2
43%

State of the Art
3
$5,000 - $25,000Too much cost!

00:00 24:0008:00 18:00
Home
State of the Art
4
55
60
65
70
75
Te
mp
era
ture
(oF
)
Too much hassle! Too much hassle!
Home Home
Setpoint Setpoint
Setback
Home
User discomfort
Energy waste

5
“How much energy can be savedwith occupancy sensors?”
Using Occupancy Sensors
6
00:00 24:0008:00 18:00
55
60
65
70
75
Te
mp
era
ture
(oF
)
HomeHome HomeHome

“Reactive” Thermostat
The Wrong Way
7
00:00 24:0008:00 18:00
55
60
65
70
75
Te
mp
era
ture
(oF
)
Home Home
Shallow Setback
Increase energy usage!
Slow Reaction Inefficient Reaction

00:00 24:0008:00 18:00
Our Approach Smart Thermostat
8
55
60
65
70
75
Te
mp
era
ture
(oF
)
Home Home
Fast reaction Deep setback Preheating
Automatically save energy!

Rest of the talk System Design
Fast Reaction Preheating Deep Setback
Evaluation
9

1. Fast Reaction “Reactive" Thermostat
10
00:00 24:0008:00 18:00
55
60
65
70
75
Te
mp
era
ture
(oF
)
Home Home
Inactivity detector
Active/Inactive
User discomfort
Energy waste

1. Fast Reaction Smart Thermostat
11
Pattern detector
Active/Away/Asleep
00:00 24:0008:00 18:00
55
60
65
70
75
Te
mp
era
ture
(oF
)
Home Home
Detect within minutesWithout increasing false positives
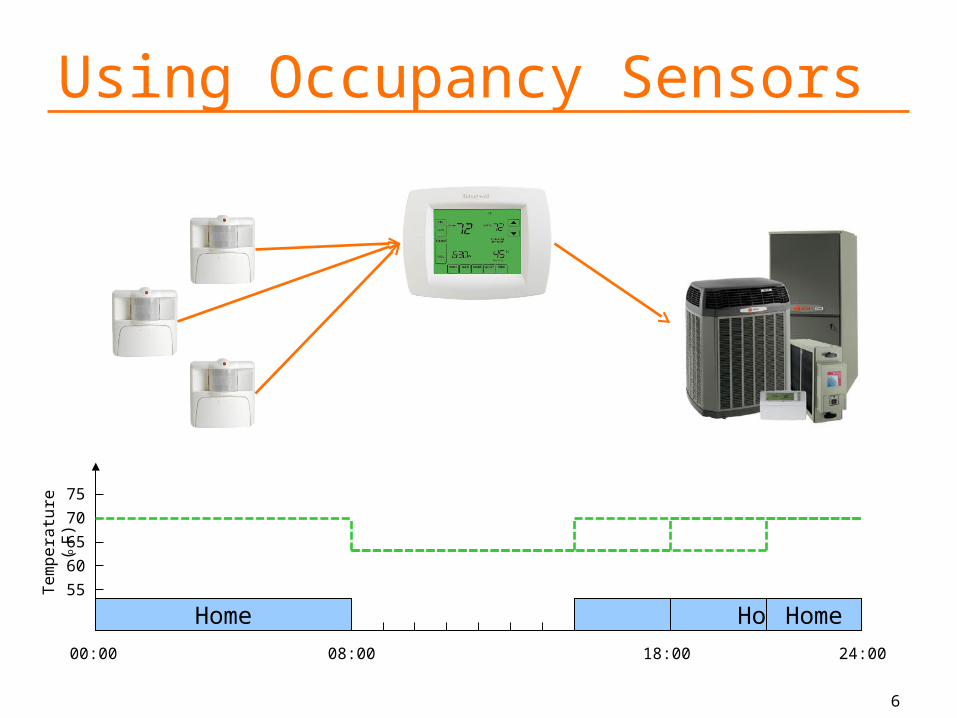
2. Preheating“Why preheat?” Preheat – slow but efficient
Heat pump
React – fast but inefficient Electric coils Gas furnace
12
00:00 24:0008:00 18:00
55
60
65
70
75
Te
mp
era
ture
(oF
)
Home Home
Energy wasteEnergy waste
How to decide when to preheat?

16:00 18:00 20:00
PreheatReact
Arrival Time Distribution
2. Preheating
13
Exp
ecte
d E
nerg
y U
sage
(k
Wh)
3
2
1
016:00 18:00 20:00
Time
Optimal Preheat
Time

16:00 18:00 20:00
3. Deep Setback
14
Arrival Time Distribution
00:00 24:0008:00 18:00
HomeHome55
60
65
70
75
Te
mp
era
ture
(oF
)
Earliest expectedarrival time
Optimal preheat time
Deep setback
Shallow setback
??

Rest of the talk System Design
Fast Reaction Preheating Deep Setback
Evaluation
15

Home #Residents # MotionSensors
#DoorSensors
A 1 7 3
B 1 3 2
C 1 4 1
D 1 4 1
E 2 5 1
F 3 5 2
G 3 4 1
H 2 5 2
EnergyPlus Simulator
Evaluation Occupancy Data
16
Energy Measurements

Energy Savings
17
OptimalReactiveSmart
Smart: 28.8%
Reactive: 6.8%
A B C D E F G H
En
erg
y S
avin
gs
(%)
-10
0
10
20
30
40
50
60
Home Deployments
Optimal: 35.9%
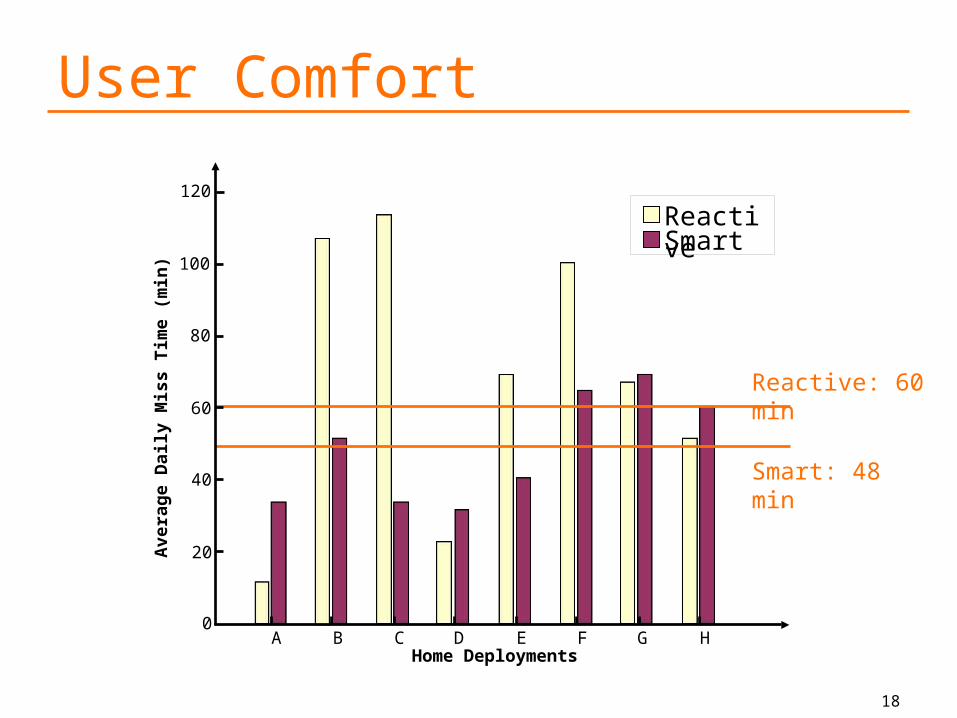
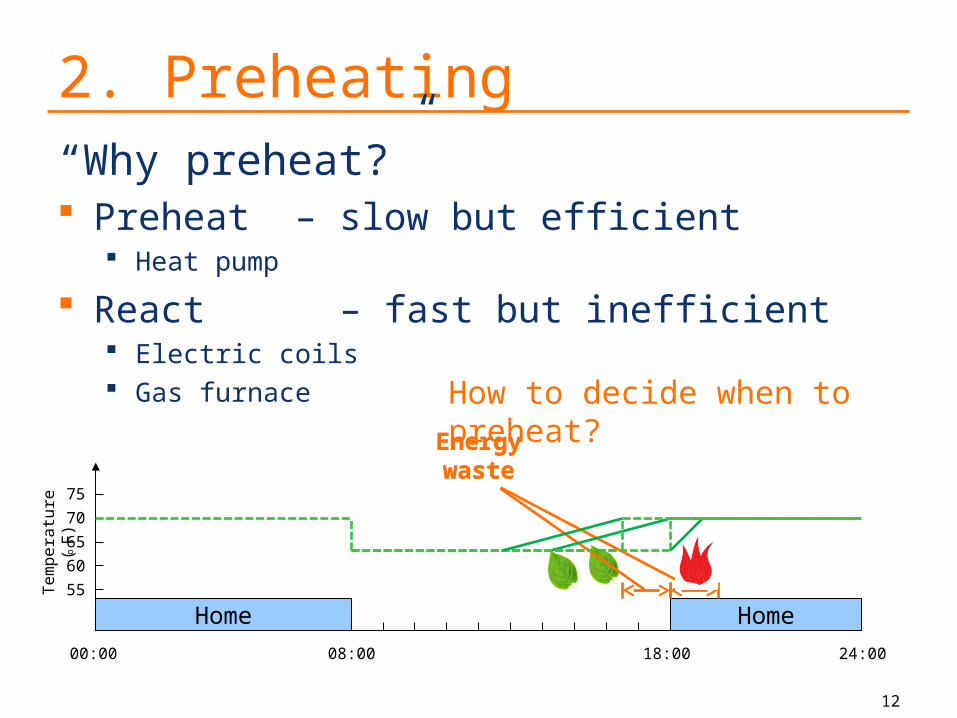
User Comfort
18
ReactiveSmart
Smart: 48 min
Reactive: 60 min
80
A B C D E F G H0
Ave
rag
e D
aily
Mis
s T
ime
(min
)
40
20
60
100
120
Home Deployments

Person Types
Generalization
House Types
19
Zone 1 Minneapolis, MN
Zone 2 Pittsburg, PA
Zone 3 Washington, D.C.
Zone 4 San Francisco, CA
Zone 5 Houston, TX
Climate Zones

Impact Nationwide Savings
save over 100 billion kWh per year prevent 1.12 billion tons of air pollutants
“Bang for the buck” $5 billion for weatherization Our technique is ~$25 in sensors per home
20

Conclusions Three simple techniques, but able to achieve
large savings: 28% on average low cost: $25 in sensors per home low hassle: automatic temperature control
Promising sensing-based solution
21

Q & A
22
Thank you!
Related Documents