The size distribution of desert dust aerosols and its impact on the Earth system q Natalie Mahowald a,⇑ , Samuel Albani a , Jasper F. Kok a,b , Sebastian Engelstaeder c , Rachel Scanza a , Daniel S. Ward a , Mark G. Flanner d a Department of Earth and Atmospheric Sciences, Cornell University, Ithaca, NY 14853, United States b Department of Atmospheric and Oceanic Sciences, University of California, Los Angeles, CA 90095, United States c School of Geography and the Environment, University of Oxford, South Parks Road, Oxford OX1 3QY, UK d Department of Atmospheric, Oceanic and Space Sciences, University of Michigan, Ann Arbor, MI 48105, United States article info Article history: Available online xxxx Keywords: Desert dust Size distribution Biogeochemistry Radiative effects Indirect effects on clouds abstract The global cycle of desert dust aerosols responds strongly to climate and human perturbations, and, in turn, impacts climate and biogeochemistry. Here we focus on desert dust size distributions, how these are characterized, emitted from the surface, evolve in the atmosphere, and impact climate and biogeo- chemistry. Observations, theory and global model results are synthesized to highlight the evolution and impact of dust sizes. Individual particles sizes are, to a large extent, set by the soil properties and the mobilization process. The lifetime of different particle sizes controls the evolution of the size distri- bution as the particles move downwind, as larger particles fall out more quickly. The dust size distribu- tion strongly controls the radiative impact of the aerosols, as well as their interactions with clouds. The size of particles controls how far downwind they travel, and thus their ability to impact biogeochemistry downwind of the source region. Ó 2013 The Authors. Published by Elsevier B.V. All rights reserved. 1. Introduction Mineral aerosols or desert dust particles are soil particles sus- pended in the atmosphere in regions with easily erodible dry soils, little vegetation and strong winds. Mineral aerosols represent one of the most important aerosols in mass and aerosol optical depth (Tegen et al., 1997), and can significantly impact radiation during strong events or even in the annual mean (Li et al., 2004). Desert dust can interact with liquid or ice clouds, and thereby modify cloud optical properties and lifetimes (DeMott et al., 2003; Maho- wald and Kiehl, 2003), as well as affect precipitation processes (Creamean et al., 2013). Once dust particles are deposited to the surface, they provide micro nutrients to the ocean (e.g. Jickells et al., 2005; Martin et al., 1991) or to land ecosystems (e.g. Okin et al., 2008; Swap et al., 1992), as well as modify snow albedo (Painter et al., 2007). Furthermore, inhalation of dust aerosol poses a hazard to human health. The smaller the aerosol, the greater the chance of it getting deposited in the gas-exchange region of the lungs, and the greater the adverse effect (e.g., Brunekreef and Holgate (2002)). Thus mineral aerosols are important for human health, weather, climate, and biogeochemistry (Fig. 1). Soil dust particles are entrained into the atmosphere in a several step process (e.g. Marticorena and Bergametti, 1995; Kok et al., 2012). First strong winds force particles of about 100– 200 lm diameter to move in ballistic trajectories (‘saltation’) close to the surface (Bagnold, 1941; Alfaro et al., 1998b). These saltating particles can break apart or eject smaller soil particles upon impacting the soil. These smaller particles (< 50 lm) are en- trained into the boundary layer, after which they can be trans- ported long distances (Prospero, 1996; Grousset et al., 2003). Mineral aerosols are highly variable in space and time, with var- iability in mass of more than 4 orders of magnitude (e.g. Mahowald et al., 2009). Much of the desert dust mass transported in the atmo- sphere occurs during a few events (e.g. Mahowald et al., 2009). Globally averaged mineral aerosols have varied by a factor of 2–3 between glacial and interglacial time periods (Mahowald et al., 2006; Petit et al., 1999), and on the regional and decadal time scale can change by a factor of 2–4 depending on climate or land use by humans (Ginoux et al., 2012; Mahowald et al., 2010; Prospero and Lamb, 2003). For aerosols, chemical composition and size are critical in con- sidering the impacts (e.g. Mahowald et al., 2011a,b). For mineral aerosols, both composition and size vary greatly over space and time. Here we focus on size. The lifetime of a particle is heavily dependent on the size of the particle, because smaller particles fall 1875-9637/$ - see front matter Ó 2013 The Authors. Published by Elsevier B.V. All rights reserved. http://dx.doi.org/10.1016/j.aeolia.2013.09.002 q This is an open-access article distributed under the terms of the Creative Commons Attribution NonCommercial-No Derivative Works License, which permits non-commercial use, distribution, and reproduction in any medium, provided the original author and source are credited. ⇑ Corresponding author. Tel.: +1 607 255 5166. E-mail address: [email protected] (N. Mahowald). Aeolian Research xxx (2013) xxx–xxx Contents lists available at ScienceDirect Aeolian Research journal homepage: www.elsevier.com/locate/aeolia Please cite this article in press as: Mahowald, N., et al. The size distribution of desert dust aerosols and its impact on the Earth system. Aeolian Research (2013), http://dx.doi.org/10.1016/j.aeolia.2013.09.002

Welcome message from author
This document is posted to help you gain knowledge. Please leave a comment to let me know what you think about it! Share it to your friends and learn new things together.
Transcript

Aeolian Research xxx (2013) xxx–xxx
Contents lists available at ScienceDirect
Aeolian Research
journal homepage: www.elsevier .com/locate /aeol ia
The size distribution of desert dust aerosols and its impact on the Earthsystem q
1875-9637/$ - see front matter � 2013 The Authors. Published by Elsevier B.V. All rights reserved.http://dx.doi.org/10.1016/j.aeolia.2013.09.002
q This is an open-access article distributed under the terms of the CreativeCommons Attribution NonCommercial-No Derivative Works License, which permitsnon-commercial use, distribution, and reproduction in any medium, provided theoriginal author and source are credited.⇑ Corresponding author. Tel.: +1 607 255 5166.
E-mail address: [email protected] (N. Mahowald).
Please cite this article in press as: Mahowald, N., et al. The size distribution of desert dust aerosols and its impact on the Earth system. Aeolian R(2013), http://dx.doi.org/10.1016/j.aeolia.2013.09.002
Natalie Mahowald a,⇑, Samuel Albani a, Jasper F. Kok a,b, Sebastian Engelstaeder c, Rachel Scanza a,Daniel S. Ward a, Mark G. Flanner d
a Department of Earth and Atmospheric Sciences, Cornell University, Ithaca, NY 14853, United Statesb Department of Atmospheric and Oceanic Sciences, University of California, Los Angeles, CA 90095, United Statesc School of Geography and the Environment, University of Oxford, South Parks Road, Oxford OX1 3QY, UKd Department of Atmospheric, Oceanic and Space Sciences, University of Michigan, Ann Arbor, MI 48105, United States
a r t i c l e i n f o
Article history:Available online xxxx
Keywords:Desert dustSize distributionBiogeochemistryRadiative effectsIndirect effects on clouds
a b s t r a c t
The global cycle of desert dust aerosols responds strongly to climate and human perturbations, and, inturn, impacts climate and biogeochemistry. Here we focus on desert dust size distributions, how theseare characterized, emitted from the surface, evolve in the atmosphere, and impact climate and biogeo-chemistry. Observations, theory and global model results are synthesized to highlight the evolutionand impact of dust sizes. Individual particles sizes are, to a large extent, set by the soil properties andthe mobilization process. The lifetime of different particle sizes controls the evolution of the size distri-bution as the particles move downwind, as larger particles fall out more quickly. The dust size distribu-tion strongly controls the radiative impact of the aerosols, as well as their interactions with clouds. Thesize of particles controls how far downwind they travel, and thus their ability to impact biogeochemistrydownwind of the source region.
� 2013 The Authors. Published by Elsevier B.V. All rights reserved.
1. Introduction Holgate (2002)). Thus mineral aerosols are important for human
Mineral aerosols or desert dust particles are soil particles sus-pended in the atmosphere in regions with easily erodible dry soils,little vegetation and strong winds. Mineral aerosols represent oneof the most important aerosols in mass and aerosol optical depth(Tegen et al., 1997), and can significantly impact radiation duringstrong events or even in the annual mean (Li et al., 2004). Desertdust can interact with liquid or ice clouds, and thereby modifycloud optical properties and lifetimes (DeMott et al., 2003; Maho-wald and Kiehl, 2003), as well as affect precipitation processes(Creamean et al., 2013). Once dust particles are deposited to thesurface, they provide micro nutrients to the ocean (e.g. Jickellset al., 2005; Martin et al., 1991) or to land ecosystems (e.g. Okinet al., 2008; Swap et al., 1992), as well as modify snow albedo(Painter et al., 2007). Furthermore, inhalation of dust aerosol posesa hazard to human health. The smaller the aerosol, the greater thechance of it getting deposited in the gas-exchange region of thelungs, and the greater the adverse effect (e.g., Brunekreef and
health, weather, climate, and biogeochemistry (Fig. 1).Soil dust particles are entrained into the atmosphere in a
several step process (e.g. Marticorena and Bergametti, 1995; Koket al., 2012). First strong winds force particles of about 100–200 lm diameter to move in ballistic trajectories (‘saltation’) closeto the surface (Bagnold, 1941; Alfaro et al., 1998b). These saltatingparticles can break apart or eject smaller soil particles uponimpacting the soil. These smaller particles (< �50 lm) are en-trained into the boundary layer, after which they can be trans-ported long distances (Prospero, 1996; Grousset et al., 2003).
Mineral aerosols are highly variable in space and time, with var-iability in mass of more than 4 orders of magnitude (e.g. Mahowaldet al., 2009). Much of the desert dust mass transported in the atmo-sphere occurs during a few events (e.g. Mahowald et al., 2009).Globally averaged mineral aerosols have varied by a factor of 2–3between glacial and interglacial time periods (Mahowald et al.,2006; Petit et al., 1999), and on the regional and decadal time scalecan change by a factor of 2–4 depending on climate or land use byhumans (Ginoux et al., 2012; Mahowald et al., 2010; Prospero andLamb, 2003).
For aerosols, chemical composition and size are critical in con-sidering the impacts (e.g. Mahowald et al., 2011a,b). For mineralaerosols, both composition and size vary greatly over space andtime. Here we focus on size. The lifetime of a particle is heavilydependent on the size of the particle, because smaller particles fall
esearch
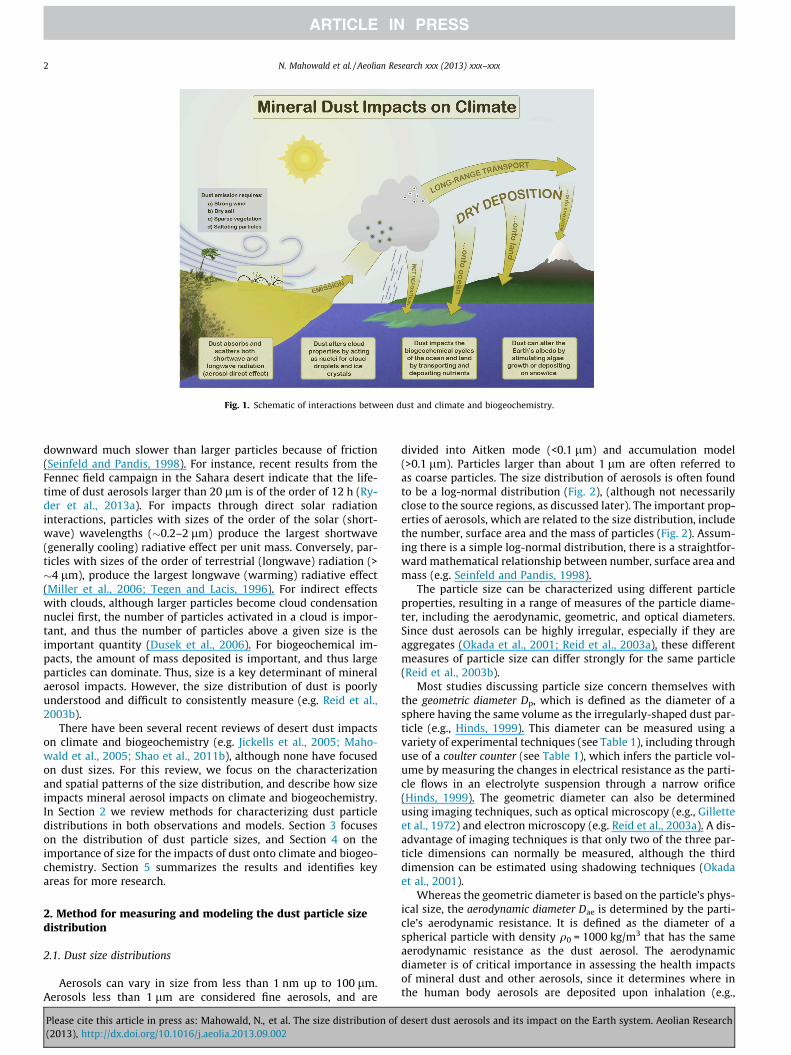
Fig. 1. Schematic of interactions between dust and climate and biogeochemistry.
2 N. Mahowald et al. / Aeolian Research xxx (2013) xxx–xxx
downward much slower than larger particles because of friction(Seinfeld and Pandis, 1998). For instance, recent results from theFennec field campaign in the Sahara desert indicate that the life-time of dust aerosols larger than 20 lm is of the order of 12 h (Ry-der et al., 2013a). For impacts through direct solar radiationinteractions, particles with sizes of the order of the solar (short-wave) wavelengths (�0.2–2 lm) produce the largest shortwave(generally cooling) radiative effect per unit mass. Conversely, par-ticles with sizes of the order of terrestrial (longwave) radiation (>�4 lm), produce the largest longwave (warming) radiative effect(Miller et al., 2006; Tegen and Lacis, 1996). For indirect effectswith clouds, although larger particles become cloud condensationnuclei first, the number of particles activated in a cloud is impor-tant, and thus the number of particles above a given size is theimportant quantity (Dusek et al., 2006). For biogeochemical im-pacts, the amount of mass deposited is important, and thus largeparticles can dominate. Thus, size is a key determinant of mineralaerosol impacts. However, the size distribution of dust is poorlyunderstood and difficult to consistently measure (e.g. Reid et al.,2003b).
There have been several recent reviews of desert dust impactson climate and biogeochemistry (e.g. Jickells et al., 2005; Maho-wald et al., 2005; Shao et al., 2011b), although none have focusedon dust sizes. For this review, we focus on the characterizationand spatial patterns of the size distribution, and describe how sizeimpacts mineral aerosol impacts on climate and biogeochemistry.In Section 2 we review methods for characterizing dust particledistributions in both observations and models. Section 3 focuseson the distribution of dust particle sizes, and Section 4 on theimportance of size for the impacts of dust onto climate and biogeo-chemistry. Section 5 summarizes the results and identifies keyareas for more research.
2. Method for measuring and modeling the dust particle sizedistribution
2.1. Dust size distributions
Aerosols can vary in size from less than 1 nm up to 100 lm.Aerosols less than 1 lm are considered fine aerosols, and are
Please cite this article in press as: Mahowald, N., et al. The size distribution of(2013), http://dx.doi.org/10.1016/j.aeolia.2013.09.002
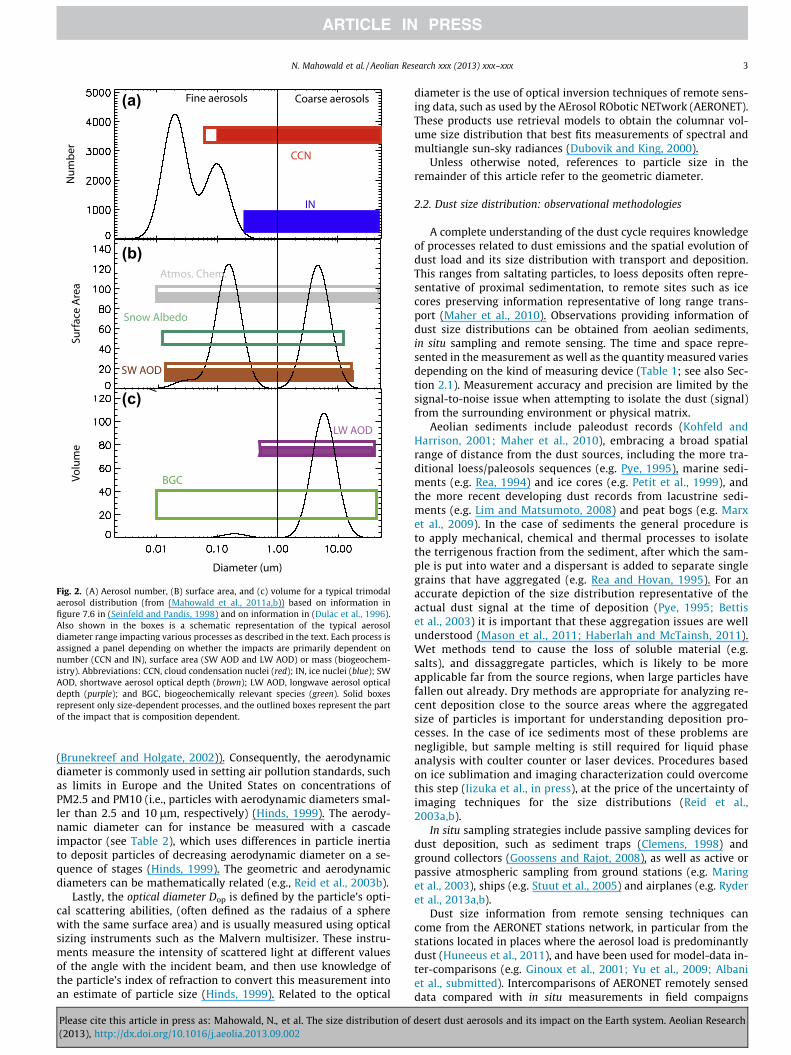
divided into Aitken mode (<0.1 lm) and accumulation model(>0.1 lm). Particles larger than about 1 lm are often referred toas coarse particles. The size distribution of aerosols is often foundto be a log-normal distribution (Fig. 2), (although not necessarilyclose to the source regions, as discussed later). The important prop-erties of aerosols, which are related to the size distribution, includethe number, surface area and the mass of particles (Fig. 2). Assum-ing there is a simple log-normal distribution, there is a straightfor-ward mathematical relationship between number, surface area andmass (e.g. Seinfeld and Pandis, 1998).
The particle size can be characterized using different particleproperties, resulting in a range of measures of the particle diame-ter, including the aerodynamic, geometric, and optical diameters.Since dust aerosols can be highly irregular, especially if they areaggregates (Okada et al., 2001; Reid et al., 2003a), these differentmeasures of particle size can differ strongly for the same particle(Reid et al., 2003b).
Most studies discussing particle size concern themselves withthe geometric diameter Dp, which is defined as the diameter of asphere having the same volume as the irregularly-shaped dust par-ticle (e.g., Hinds, 1999). This diameter can be measured using avariety of experimental techniques (see Table 1), including throughuse of a coulter counter (see Table 1), which infers the particle vol-ume by measuring the changes in electrical resistance as the parti-cle flows in an electrolyte suspension through a narrow orifice(Hinds, 1999). The geometric diameter can also be determinedusing imaging techniques, such as optical microscopy (e.g., Gilletteet al., 1972) and electron microscopy (e.g. Reid et al., 2003a). A dis-advantage of imaging techniques is that only two of the three par-ticle dimensions can normally be measured, although the thirddimension can be estimated using shadowing techniques (Okadaet al., 2001).
Whereas the geometric diameter is based on the particle’s phys-ical size, the aerodynamic diameter Dae is determined by the parti-cle’s aerodynamic resistance. It is defined as the diameter of aspherical particle with density q0 = 1000 kg/m3 that has the sameaerodynamic resistance as the dust aerosol. The aerodynamicdiameter is of critical importance in assessing the health impactsof mineral dust and other aerosols, since it determines where inthe human body aerosols are deposited upon inhalation (e.g.,
desert dust aerosols and its impact on the Earth system. Aeolian Research
Diameter (um)
Nu
mb
erSu
rfac
e A
rea
Volu
me
CCN
IN
SW AOD
LW AOD
BGC
Fine aerosols Coarse aerosols
Snow Albedo
Atmos. Chem.
(a)
(b)
(c)
Fig. 2. (A) Aerosol number, (B) surface area, and (c) volume for a typical trimodalaerosol distribution (from (Mahowald et al., 2011a,b)) based on information infigure 7.6 in (Seinfeld and Pandis, 1998) and on information in (Dulac et al., 1996).Also shown in the boxes is a schematic representation of the typical aerosoldiameter range impacting various processes as described in the text. Each process isassigned a panel depending on whether the impacts are primarily dependent onnumber (CCN and IN), surface area (SW AOD and LW AOD) or mass (biogeochem-istry). Abbreviations: CCN, cloud condensation nuclei (red); IN, ice nuclei (blue); SWAOD, shortwave aerosol optical depth (brown); LW AOD, longwave aerosol opticaldepth (purple); and BGC, biogeochemically relevant species (green). Solid boxesrepresent only size-dependent processes, and the outlined boxes represent the partof the impact that is composition dependent.
N. Mahowald et al. / Aeolian Research xxx (2013) xxx–xxx 3
(Brunekreef and Holgate, 2002)). Consequently, the aerodynamicdiameter is commonly used in setting air pollution standards, suchas limits in Europe and the United States on concentrations ofPM2.5 and PM10 (i.e., particles with aerodynamic diameters smal-ler than 2.5 and 10 lm, respectively) (Hinds, 1999). The aerody-namic diameter can for instance be measured with a cascadeimpactor (see Table 2), which uses differences in particle inertiato deposit particles of decreasing aerodynamic diameter on a se-quence of stages (Hinds, 1999). The geometric and aerodynamicdiameters can be mathematically related (e.g., Reid et al., 2003b).
Lastly, the optical diameter Dop is defined by the particle’s opti-cal scattering abilities, (often defined as the radaius of a spherewith the same surface area) and is usually measured using opticalsizing instruments such as the Malvern multisizer. These instru-ments measure the intensity of scattered light at different valuesof the angle with the incident beam, and then use knowledge ofthe particle’s index of refraction to convert this measurement intoan estimate of particle size (Hinds, 1999). Related to the optical
Please cite this article in press as: Mahowald, N., et al. The size distribution of(2013), http://dx.doi.org/10.1016/j.aeolia.2013.09.002
diameter is the use of optical inversion techniques of remote sens-ing data, such as used by the AErosol RObotic NETwork (AERONET).These products use retrieval models to obtain the columnar vol-ume size distribution that best fits measurements of spectral andmultiangle sun-sky radiances (Dubovik and King, 2000).
Unless otherwise noted, references to particle size in theremainder of this article refer to the geometric diameter.
2.2. Dust size distribution: observational methodologies
A complete understanding of the dust cycle requires knowledgeof processes related to dust emissions and the spatial evolution ofdust load and its size distribution with transport and deposition.This ranges from saltating particles, to loess deposits often repre-sentative of proximal sedimentation, to remote sites such as icecores preserving information representative of long range trans-port (Maher et al., 2010). Observations providing information ofdust size distributions can be obtained from aeolian sediments,in situ sampling and remote sensing. The time and space repre-sented in the measurement as well as the quantity measured variesdepending on the kind of measuring device (Table 1; see also Sec-tion 2.1). Measurement accuracy and precision are limited by thesignal-to-noise issue when attempting to isolate the dust (signal)from the surrounding environment or physical matrix.
Aeolian sediments include paleodust records (Kohfeld andHarrison, 2001; Maher et al., 2010), embracing a broad spatialrange of distance from the dust sources, including the more tra-ditional loess/paleosols sequences (e.g. Pye, 1995), marine sedi-ments (e.g. Rea, 1994) and ice cores (e.g. Petit et al., 1999), andthe more recent developing dust records from lacustrine sedi-ments (e.g. Lim and Matsumoto, 2008) and peat bogs (e.g. Marxet al., 2009). In the case of sediments the general procedure isto apply mechanical, chemical and thermal processes to isolatethe terrigenous fraction from the sediment, after which the sam-ple is put into water and a dispersant is added to separate singlegrains that have aggregated (e.g. Rea and Hovan, 1995). For anaccurate depiction of the size distribution representative of theactual dust signal at the time of deposition (Pye, 1995; Bettiset al., 2003) it is important that these aggregation issues are wellunderstood (Mason et al., 2011; Haberlah and McTainsh, 2011).Wet methods tend to cause the loss of soluble material (e.g.salts), and dissaggregate particles, which is likely to be moreapplicable far from the source regions, when large particles havefallen out already. Dry methods are appropriate for analyzing re-cent deposition close to the source areas where the aggregatedsize of particles is important for understanding deposition pro-cesses. In the case of ice sediments most of these problems arenegligible, but sample melting is still required for liquid phaseanalysis with coulter counter or laser devices. Procedures basedon ice sublimation and imaging characterization could overcomethis step (Iizuka et al., in press), at the price of the uncertainty ofimaging techniques for the size distributions (Reid et al.,2003a,b).
In situ sampling strategies include passive sampling devices fordust deposition, such as sediment traps (Clemens, 1998) andground collectors (Goossens and Rajot, 2008), as well as active orpassive atmospheric sampling from ground stations (e.g. Maringet al., 2003), ships (e.g. Stuut et al., 2005) and airplanes (e.g. Ryderet al., 2013a,b).
Dust size information from remote sensing techniques cancome from the AERONET stations network, in particular from thestations located in places where the aerosol load is predominantlydust (Huneeus et al., 2011), and have been used for model-data in-ter-comparisons (e.g. Ginoux et al., 2001; Yu et al., 2009; Albaniet al., submitted). Intercomparisons of AERONET remotely senseddata compared with in situ measurements in field compaigns
desert dust aerosols and its impact on the Earth system. Aeolian Research
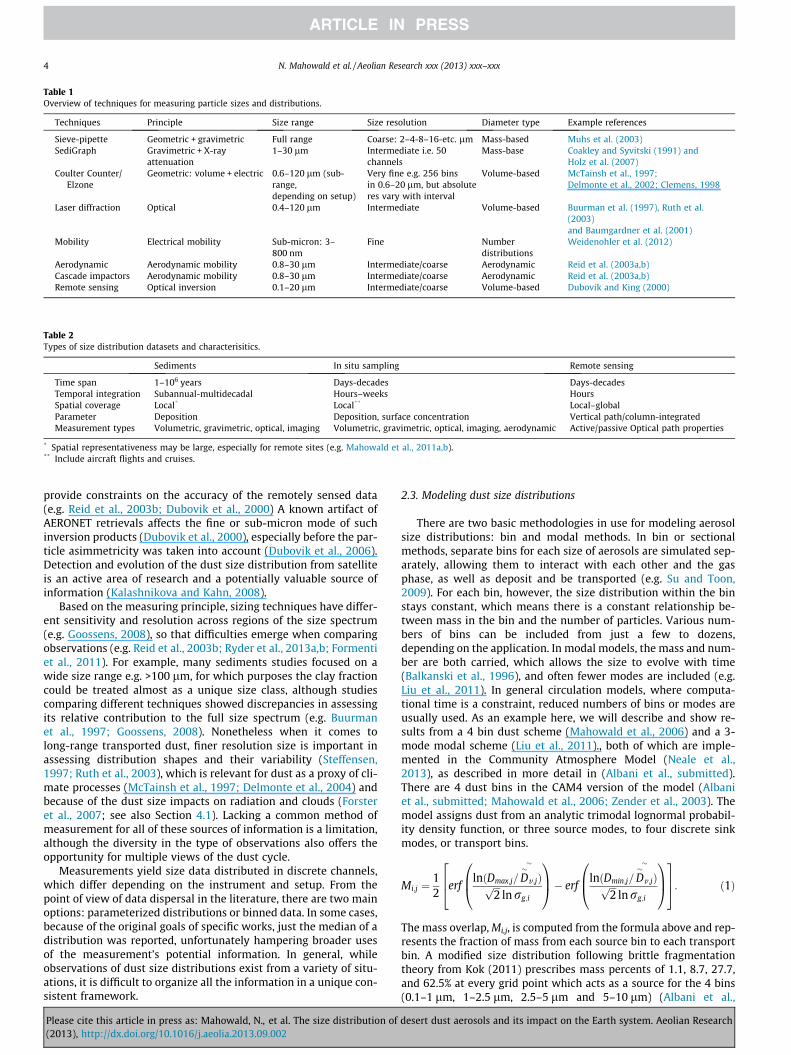
Table 1Overview of techniques for measuring particle sizes and distributions.
Techniques Principle Size range Size resolution Diameter type Example references
Sieve-pipette Geometric + gravimetric Full range Coarse: 2–4-8–16-etc. lm Mass-based Muhs et al. (2003)SediGraph Gravimetric + X-ray
attenuation1–30 lm Intermediate i.e. 50
channelsMass-base Coakley and Syvitski (1991) and
Holz et al. (2007)Coulter Counter/
ElzoneGeometric: volume + electric 0.6–120 lm (sub-
range,depending on setup)
Very fine e.g. 256 binsin 0.6–20 lm, but absoluteres vary with interval
Volume-based McTainsh et al., 1997;Delmonte et al., 2002; Clemens, 1998
Laser diffraction Optical 0.4–120 lm Intermediate Volume-based Buurman et al. (1997), Ruth et al.(2003)and Baumgardner et al. (2001)
Mobility Electrical mobility Sub-micron: 3–800 nm
Fine Numberdistributions
Weidenohler et al. (2012)
Aerodynamic Aerodynamic mobility 0.8–30 lm Intermediate/coarse Aerodynamic Reid et al. (2003a,b)Cascade impactors Aerodynamic mobility 0.8–30 lm Intermediate/coarse Aerodynamic Reid et al. (2003a,b)Remote sensing Optical inversion 0.1–20 lm Intermediate/coarse Volume-based Dubovik and King (2000)
Table 2Types of size distribution datasets and characterisitics.
Sediments In situ sampling Remote sensing
Time span 1–106 years Days-decades Days-decadesTemporal integration Subannual-multidecadal Hours–weeks HoursSpatial coverage Local* Local** Local–globalParameter Deposition Deposition, surface concentration Vertical path/column-integratedMeasurement types Volumetric, gravimetric, optical, imaging Volumetric, gravimetric, optical, imaging, aerodynamic Active/passive Optical path properties
* Spatial representativeness may be large, especially for remote sites (e.g. Mahowald et al., 2011a,b).** Include aircraft flights and cruises.
4 N. Mahowald et al. / Aeolian Research xxx (2013) xxx–xxx
provide constraints on the accuracy of the remotely sensed data(e.g. Reid et al., 2003b; Dubovik et al., 2000) A known artifact ofAERONET retrievals affects the fine or sub-micron mode of suchinversion products (Dubovik et al., 2000), especially before the par-ticle asimmetricity was taken into account (Dubovik et al., 2006).Detection and evolution of the dust size distribution from satelliteis an active area of research and a potentially valuable source ofinformation (Kalashnikova and Kahn, 2008).
Based on the measuring principle, sizing techniques have differ-ent sensitivity and resolution across regions of the size spectrum(e.g. Goossens, 2008), so that difficulties emerge when comparingobservations (e.g. Reid et al., 2003b; Ryder et al., 2013a,b; Formentiet al., 2011). For example, many sediments studies focused on awide size range e.g. >100 lm, for which purposes the clay fractioncould be treated almost as a unique size class, although studiescomparing different techniques showed discrepancies in assessingits relative contribution to the full size spectrum (e.g. Buurmanet al., 1997; Goossens, 2008). Nonetheless when it comes tolong-range transported dust, finer resolution size is important inassessing distribution shapes and their variability (Steffensen,1997; Ruth et al., 2003), which is relevant for dust as a proxy of cli-mate processes (McTainsh et al., 1997; Delmonte et al., 2004) andbecause of the dust size impacts on radiation and clouds (Forsteret al., 2007; see also Section 4.1). Lacking a common method ofmeasurement for all of these sources of information is a limitation,although the diversity in the type of observations also offers theopportunity for multiple views of the dust cycle.
Measurements yield size data distributed in discrete channels,which differ depending on the instrument and setup. From thepoint of view of data dispersal in the literature, there are two mainoptions: parameterized distributions or binned data. In some cases,because of the original goals of specific works, just the median of adistribution was reported, unfortunately hampering broader usesof the measurement’s potential information. In general, whileobservations of dust size distributions exist from a variety of situ-ations, it is difficult to organize all the information in a unique con-sistent framework.
Please cite this article in press as: Mahowald, N., et al. The size distribution of(2013), http://dx.doi.org/10.1016/j.aeolia.2013.09.002
2.3. Modeling dust size distributions
There are two basic methodologies in use for modeling aerosolsize distributions: bin and modal methods. In bin or sectionalmethods, separate bins for each size of aerosols are simulated sep-arately, allowing them to interact with each other and the gasphase, as well as deposit and be transported (e.g. Su and Toon,2009). For each bin, however, the size distribution within the binstays constant, which means there is a constant relationship be-tween mass in the bin and the number of particles. Various num-bers of bins can be included from just a few to dozens,depending on the application. In modal models, the mass and num-ber are both carried, which allows the size to evolve with time(Balkanski et al., 1996), and often fewer modes are included (e.g.Liu et al., 2011). In general circulation models, where computa-tional time is a constraint, reduced numbers of bins or modes areusually used. As an example here, we will describe and show re-sults from a 4 bin dust scheme (Mahowald et al., 2006) and a 3-mode modal scheme (Liu et al., 2011)., both of which are imple-mented in the Community Atmosphere Model (Neale et al.,2013), as described in more detail in (Albani et al., submitted).There are 4 dust bins in the CAM4 version of the model (Albaniet al., submitted; Mahowald et al., 2006; Zender et al., 2003). Themodel assigns dust from an analytic trimodal lognormal probabil-ity density function, or three source modes, to four discrete sinkmodes, or transport bins.
Mi;j ¼12
erflnðDmax;j=D
�v;j
�
Þffiffiffi2p
ln rg;i
0B@
1CA� erf
lnðDmin;j=D�
v ;j
�
Þffiffiffi2p
ln rg;i
0B@
1CA
264
375: ð1Þ
The mass overlap, Mi,j, is computed from the formula above and rep-resents the fraction of mass from each source bin to each transportbin. A modified size distribution following brittle fragmentationtheory from Kok (2011) prescribes mass percents of 1.1, 8.7, 27.7,and 62.5% at every grid point which acts as a source for the 4 bins(0.1–1 lm, 1–2.5 lm, 2.5–5 lm and 5–10 lm) (Albani et al.,
desert dust aerosols and its impact on the Earth system. Aeolian Research
(a)
(b)
N. Mahowald et al. / Aeolian Research xxx (2013) xxx–xxx 5
submitted). The sub-bin size distribution is identical for each binand is fully described by a lognormal distribution with mass mediandiameter, �Dv = 3.5 lm and geometric standard deviation, rg = 2.0(Reid et al., 2003b; Zender et al., 2003). While the mass within eachbin changes at each model time step due to deposition processes,the sub-bin size distribution is fixed (Zender et al., 2003). At eachtime step, the mass in each bin in each grid box is subject to trans-port or deposition separately, with no interaction between bins.This method is characterized as a bulk aerosol method as all aerosolspecies are distinct and externally mixed.
Dust size distributions in CAM5 are treated as lognormal modesinstead of bins (called the MAM3 or modal aerosol model, with 3modes) (Albani et al., submitted; Liu et al., 2011). Whereas differ-ent particle types were carried in distinctive bins in CAM4, the log-normal modes in CAM5 can carry more than one species, and anintra-mode internal mixture is assumed. More specifically, inMAM3, dust is prescribed in two lognormal modes, an accumula-tion mode and a coarse mode, where each of these modes is notexclusive to dust but also carries other aerosol species, i.e. sea salt,black carbon, organic carbon, and sulfate. Mixing between modesis assumed to be negligible for dust, however mixing within modesand water uptake changes the mass median diameter and numberconcentration of the mode while the geometric standard deviationis held constant. The mass median diameter and number concen-tration are allowed to change within each mode with fixed geo-metric standard deviation, and cutoff boundaries for the fine dustand coarse dust mode are 0.1–2 lm and 2–10 lm, respectively.Similar to CAM4, dust in the updated model uses Kok (2011) toparameterize the distribution of dust mass between the modes,and the mass percents in each mode are 1.1 and 98.9% for the accu-mulation and coarse modes, respectively.
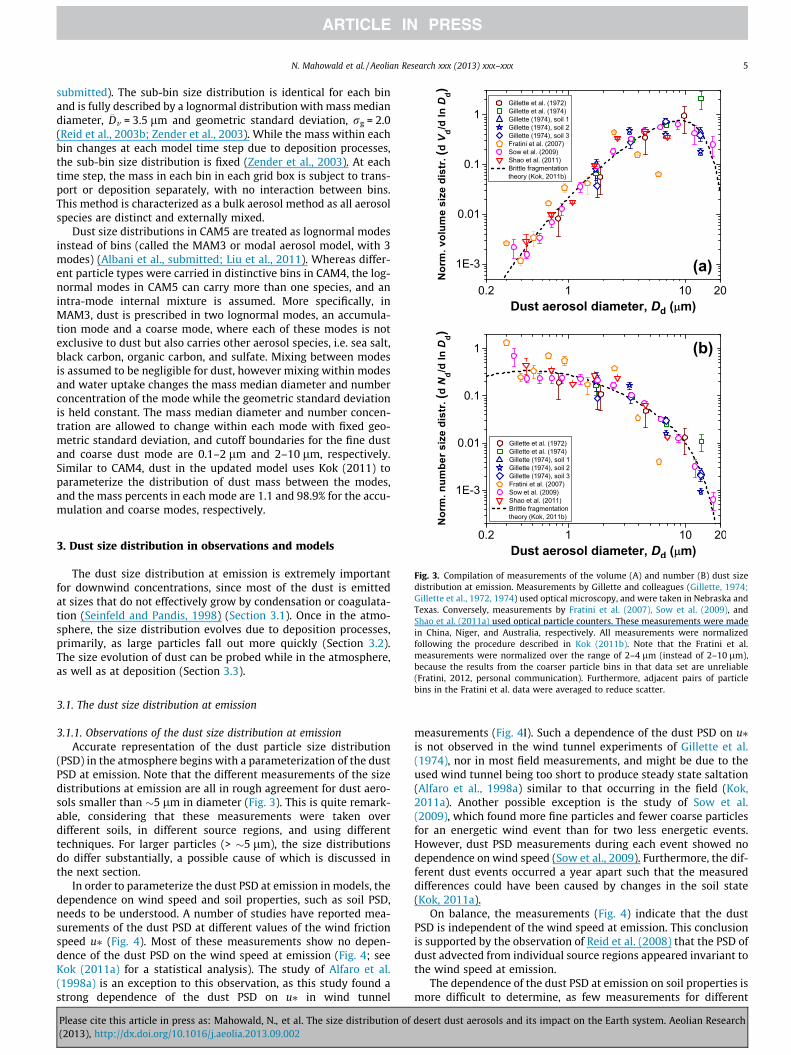
Fig. 3. Compilation of measurements of the volume (A) and number (B) dust sizedistribution at emission. Measurements by Gillette and colleagues (Gillette, 1974;Gillette et al., 1972, 1974) used optical microscopy, and were taken in Nebraska andTexas. Conversely, measurements by Fratini et al. (2007), Sow et al. (2009), andShao et al. (2011a) used optical particle counters. These measurements were madein China, Niger, and Australia, respectively. All measurements were normalizedfollowing the procedure described in Kok (2011b). Note that the Fratini et al.measurements were normalized over the range of 2–4 lm (instead of 2–10 lm),because the results from the coarser particle bins in that data set are unreliable(Fratini, 2012, personal communication). Furthermore, adjacent pairs of particle
3. Dust size distribution in observations and models
The dust size distribution at emission is extremely importantfor downwind concentrations, since most of the dust is emittedat sizes that do not effectively grow by condensation or coagulata-tion (Seinfeld and Pandis, 1998) (Section 3.1). Once in the atmo-sphere, the size distribution evolves due to deposition processes,primarily, as large particles fall out more quickly (Section 3.2).The size evolution of dust can be probed while in the atmosphere,as well as at deposition (Section 3.3).
bins in the Fratini et al. data were averaged to reduce scatter.
3.1. The dust size distribution at emission
3.1.1. Observations of the dust size distribution at emissionAccurate representation of the dust particle size distribution
(PSD) in the atmosphere begins with a parameterization of the dustPSD at emission. Note that the different measurements of the sizedistributions at emission are all in rough agreement for dust aero-sols smaller than �5 lm in diameter (Fig. 3). This is quite remark-able, considering that these measurements were taken overdifferent soils, in different source regions, and using differenttechniques. For larger particles (> �5 lm), the size distributionsdo differ substantially, a possible cause of which is discussed inthe next section.
In order to parameterize the dust PSD at emission in models, thedependence on wind speed and soil properties, such as soil PSD,needs to be understood. A number of studies have reported mea-surements of the dust PSD at different values of the wind frictionspeed u⁄ (Fig. 4). Most of these measurements show no depen-dence of the dust PSD on the wind speed at emission (Fig. 4; seeKok (2011a) for a statistical analysis). The study of Alfaro et al.(1998a) is an exception to this observation, as this study found astrong dependence of the dust PSD on u⁄ in wind tunnel
Please cite this article in press as: Mahowald, N., et al. The size distribution of(2013), http://dx.doi.org/10.1016/j.aeolia.2013.09.002
measurements (Fig. 4I). Such a dependence of the dust PSD on u⁄is not observed in the wind tunnel experiments of Gillette et al.(1974), nor in most field measurements, and might be due to theused wind tunnel being too short to produce steady state saltation(Alfaro et al., 1998a) similar to that occurring in the field (Kok,2011a). Another possible exception is the study of Sow et al.(2009), which found more fine particles and fewer coarse particlesfor an energetic wind event than for two less energetic events.However, dust PSD measurements during each event showed nodependence on wind speed (Sow et al., 2009). Furthermore, the dif-ferent dust events occurred a year apart such that the measureddifferences could have been caused by changes in the soil state(Kok, 2011a).
On balance, the measurements (Fig. 4) indicate that the dustPSD is independent of the wind speed at emission. This conclusionis supported by the observation of Reid et al. (2008) that the PSD ofdust advected from individual source regions appeared invariant tothe wind speed at emission.
The dependence of the dust PSD at emission on soil properties ismore difficult to determine, as few measurements for different
desert dust aerosols and its impact on the Earth system. Aeolian Research

(a) (b) (c)
(f)(e)(d)
(g) (h) (i)
Fig. 4. Compilation of measurements of the dust size distribution at emission measured at different wind friction velocities. Shown are results of the field studies of (A)Gillette et al. (1974), (B–D) soils 1–3 of Gillette (1974), (E) Fratini et al. (2007), (F) Sow et al. (2009), and (G) Shao et al. (2011a). In addition, panels (H) and (I) show resultsfrom the wind tunnel measurements of Gillette et al. (1974) and Alfaro et al. (1998a), respectively.
6 N. Mahowald et al. / Aeolian Research xxx (2013) xxx–xxx
soils exist (e.g. DO4Models, http://www.geog.ox.ac.uk/research/climate/projects/do4models.html). However, the available experi-mental data sets show, as mentioned above, remarkably similarsize distributions for Dp < �5 lm (see Fig. 3). Since the measure-ments in Fig. 3 were taken for a range of soil types, this result sug-gests a limited dependence of the PSD of <5 lm dust on soilproperties. This is highly fortuitous for parameterizing the emitteddust size distribution in models, although it should be verified byfurther measurements.
The different measurements of the PSD of particles >5 lm doshow substantial scatter, which is likely largely due to differencesin the state and PSD of the soil. Therefore, more research is neededto better quantify the influence of the soil size distribution on theemitted dust size distribution.
3.1.2. Theories and parameterizations of the dust size distribution atemission
As discussed in Section 1, most dust aerosols are emitted intothe atmosphere through the mechanical impacts of saltating parti-cles. These impacts create elastic waves that are necessary to rup-ture the interparticle bonds binding dust particles to other soilparticles. The patterns in which these bonds are ruptured deter-
Please cite this article in press as: Mahowald, N., et al. The size distribution of(2013), http://dx.doi.org/10.1016/j.aeolia.2013.09.002
mines the size distribution of dust aerosols. The studies of Alfaroand Gomes (2001), Shao (2001, 2004), and Kok (2011b) proposeddistinct theories that use this knowledge of the origin of dust aero-sols to predict the dust PSD at emission.
The Dust Production Model (DPM), proposed by Alfaro andcolleagues (Alfaro et al., 1997; Alfaro and Gomes, 2001), predictsthat the mechanical impacts of saltators produce dust particles inthree distinct lognormal modes. A critical ingredient of the DPMis that the relative contribution of each of the three modesdepends on the bonding energy for each mode. The bondingenergy and median diameter of these modes was determinedfrom fitting to wind tunnel experiments (Alfaro et al., 1997),and recent results suggest that these parameters might need tobe adjusted for each soil (Sow et al., 2011). Since the DPMassumes that the saltator impact speed scales with wind speed,this model predicts a strong dependence of dust PSD on u⁄.Although an increase of the saltator impact speed with u⁄ is intu-itive, recent measurements and theories indicate that the saltatorimpact speed actually stays constant with u⁄ (Kok et al., 2012).Consequently, the DPM predicts a strong dependence of the emit-ted dust PSD on u⁄, which is not shown by most measurements(see Fig. 4).
desert dust aerosols and its impact on the Earth system. Aeolian Research

(a)
(b)
Fig. 5. Compilation of in situ measurements of the dust PSD close to North Africansource regions. Shown are measurements from the DODO (Fig. 7 in McConnell et al.(2008)), DABEX (Fig. 6 in Chou et al. (2008) and Fig. 10 in Osborne et al. (2008)),SAMUM-1 (Fig. 8 in Weinzierl et al. (2009)), and Fennec (Fig. 5 in Ryder et al.(2013b)) field campaigns. Error bars have been omitted to prevent clutter, and canbe found in the original references. Only dust PSD measurements of aerosols withdiameters >0.5 lm are plotted because a substantial fraction of smaller aerosols arenot mineral dust (Chou et al., 2008; Kandler et al., 2009; Weinzierl et al., 2009).Instruments used in determining the dust PSD include electron microscopy (Chouet al., 2008; McConnell et al., 2008) and optical sizing instruments (McConnell et al.,2008; Osborne et al., 2008; Ryder et al., 2013b; Weinzierl et al., 2009). All measureddust PSDs were normalized by fitting the number (N) size distribution to the powerlaw dN/d log Dd = cDd
�2 in the size range 2–4 lm, and dividing all measurements bythe fitted proportionality constant c (Kok, 2011b). Measurements from the SHADE(Haywood et al., 2003) and SAMUM-2 (Schladitz et al., 2011) measurementcampaigns were not included, since these measurements were not taken oversource regions. Measurements from the GERBILS field campaign (Johnson andOsborne, 2011) were also not used, because the measurement ranges of the twoused instruments did not overlap, possibly introducing substantial systematicerrors.
N. Mahowald et al. / Aeolian Research xxx (2013) xxx–xxx 7
Following the DPM, Shao (2001, 2004) proposed a different the-ory based on the insight that the emitted dust size distribution isintermediate between the undisturbed and the fully disturbed(i.e., fully disaggregated) soil size distributions. Specifically,
PdðDpÞ ¼ cpmðDpÞ þ ð1� cÞpfðDpÞ; ð2Þ
where pd, pm, and pf denote the size distributions of the emitteddust aerosols, the undisturbed soil, and the fully disturbed soil.The problem then is how to estimate the weighting factor c; Shao(2001, 2004) postulated that c increases monotonically with u⁄.However, in more recent work, Shao et al. (2011a) suggested thatc is independent of u⁄, based on the observation that field measure-ments of the dust PSD show no clear dependence on u⁄ (see Fig. 4G).
Most recently, Kok (2011b) proposed a theory for the size distri-bution of emitted dust aerosols that assumes that most dust emis-sion is the result of fragmentation of soil dust aggregates byimpacting saltators. As also noted by Gill et al. (2006), stresseddry soil aggregates are known to fail as brittle materials (Braunacket al., 1979; Lee and Ingles, 1968; Perfect and Kay, 1995; Zobecket al., 1999). Therefore, Kok (2011b) hypothesized that the impactenergy of a saltating particle shatters aggregates of dust particles insoils in much the same way that glass shatters upon a sufficientlyenergetic impact. Since the patterns in which cracks are createdand eventually merge in brittle materials is scale-invariant (Astrom,2006), and thus does not require detailed knowledge of thestrength of interparticle bonds in the dust aggregate, this hypoth-esis produced a relatively straightforward expression for the sizedistribution of emitted dust aerosols. Specifically, Kok (2011b)derived
dVd
d ln Dd¼ Dd
cv1þ erf
lnðDd=DsÞffiffiffi2p
ln rs
!" #exp � Dd
k
� �3" #
; ð3Þ
where Vd is the normalized volume of dust aerosols with size Dd,cV = 12.62 lm is a normalization constant, and rs � 3.0 and�DÞs � 3.4 lm are the geometric standard deviation and mediandiameter by volume of the log-normal distribution of a typical aridsoil size distribution in the 6 20 lm size range. The parameter k de-notes the propagation distance of side branches of cracks created inthe dust aggregate by a fragmenting impact, and Kok (2011b) ob-tained k = 12 ± 1 lm using least-square fitting to dust PSD measure-ments. Eq. (3) is in surprisingly good agreement withmeasurements (Fig. 3), and correctly predicts the independence ofthe emitted dust PSD with u⁄ (Fig. 4). Furthermore, implementationof Eq. (3) into models has improved agreement against measure-ments in several regional and global models (Albani et al., submit-ted; Johnson et al., 2012; Nabat et al., 2012; Zhang et al., 2013). Thisapproach assumes that the dust size distribution is not a strongfunction of soil properties which matches many observations (e.g.Fig. 3), but is not consistent with all observations (e.g. Reid et al.,2003a,b).
Note that the side crack propagation length k remains highlyuncertain. In particular, the recent measurements of Shao et al.(2011a) suggest a smaller value of k; measurements of Fratiniet al. (2007), which were overlooked in Kok (2011b), also suggesta smaller value of k. However, the coarse particle bins of Fratiniet al. (2007) might be unreliable since the cut-off diameter of theinlet system was not determined and might be smaller than the as-sumed 10 lm (aerodynamic) diameter (Fratini, personal commu-nication, 2012). Considering the large scatter in PSDmeasurements for dust with diameters > �5 lm, which is the por-tion of the theoretical curve that is sensitive to the value of k, it islikely that the exact value of k is highly dependent on the proper-ties of the soil (Kok, 2011a).
Please cite this article in press as: Mahowald, N., et al. The size distribution of(2013), http://dx.doi.org/10.1016/j.aeolia.2013.09.002
3.1.3. Treatment in atmospheric circulation modelsAs discussed in Section 2.2, atmospheric circulation models use
either a modal or a sectional (bin) method to represent the dustsize distribution at emission and during transport. Following theprevailing treatment of other aerosol species (e.g., sulfates; Sein-feld and Pandis, 1998), many models simulate the dust size distri-bution as a sum of lognormal modes (e.g., Balkanski et al. (2007),Zhao et al. (2010)). Although this approach is computationally effi-cient for models using the modal method, measurements of thedust size distribution at emission and in situ near source regionsdo not generally support the idea that the dust PSD at emissionis a sum of a few lognormal modes (Figs. 4 and 5).
desert dust aerosols and its impact on the Earth system. Aeolian Research
8 N. Mahowald et al. / Aeolian Research xxx (2013) xxx–xxx
Many models also include an explicit dependence of the dustsize distribution at emission on the soil size distribution (e.g., Gi-noux et al., 2001; Tegen and Lacis, 1996), an idea that is supportedby theory (see above). However, measurements only show sub-stantial variation in the dust PSD emitted by different soils for dustparticles > �5 lm; the dust PSD for smaller particles shows rela-tively little variation between soils (Figs. 4 and 5). Many modelsalso include a dependence of the dust PSD on the wind speed atemission (e.g., Ginoux et al., 2001), an idea that is mainly basedon the wind tunnel studies of Alfaro et al. (1997, 1998a). However,as discussed above, field measurements show no statistically sig-nificant dependence of the dust PSD on u⁄ (Fig. 4; Kok (2011a)).These results suggests that the dependence of the emitted dustPSD on the soil type and wind speed might be over-parameterizedin certain models.
3.2. Atmospheric removal processes and dust size
Desert dust particles, like other aerosols, are effectively re-moved by both wet and dry deposition processes. Both removalprocesses are size dependent. For removal processes, the lifetimeis defined as the amount of mass in the atmosphere divided bythe surface flux, and we can define total lifetime to deposition pro-cesses, as well as separate lifetimes to wet and dry processes.
Turbulent motions in the atmosphere bring aerosols in theboundary layer down to the surface, as they are transported withthe eddies. Close to the surface there is a thin layer of stagnantquasi-laminar air, which the aerosol has to transverse. Once an aer-osol makes contact with the ground, it can be deposited onto thesurface, called dry deposition. Most often the deposition flux isparameterized as equal to a deposition velocity times the concen-tration of particles. The deposition velocity is derived using a resis-tance model, where the deposition velocity is the inverse of thesum of the aerodynamic resistance (from the eddies), quasi-lami-nar layer resistance, and the canopy resistance of the surface todeposition (Seinfeld and Pandis, 1998).
In addition to this turbulent dry deposition, aerosols can gravi-tationally settle and deposit on the surface. Because aerosols aresolids or liquids suspended in the atmosphere, and thus are lessbuoyant than the air around them, they accelerate downward. Thismotion is opposed by friction, and the terminal velocity is thespeed at which a particle falls at equilibrium. Larger particles fallmuch faster than smaller particles, giving them a larger depositionvelocity; for example, particles of size 0.1, 1, and 10 lm will havedeposition velocities of 0.001, 0.05 and 1 cm/s, respectively, underthe same atmospheric conditions (Seinfeld and Pandis, 1998).
The theory of dry deposition that is used in model and dataanalysis is fairly standard (e.g. Seinfeld and Pandis, 1998), howeverthere have been few detailed field campaigns in the last 30 yearsthat would allow us to verify these theories (e.g. Slinn and Slinn,1980; Prospero et al., 1996; Schulz et al., 2012), and some mea-surements along transport pathways indicate a longer lifetime ofcoarse aerosols than expected from deposition theories (Maringet al., 2003; Ryder et al., 2013a). Because of the different sedimen-tation rates, there is a strong dependence of dry deposition lifetimeonto size (Fig. 6). In addition, the lifetime of dust particles also var-ies spatially (Fig. 6). This is because the dry deposition removal oc-curs at the surface, and so occurs more quickly for particles close tothe surface, or in bouyant boundary layers (which can extend up to6 km over desert regions e.g. Mahowald and Dufresne (2004),where the dust can be quickly brought to the surface anddeposited.
Wet deposition refers to removal of aerosols during cloud orprecipitation processes, which cause the aerosol to be depositedonto the surface. Dust aerosols are readily incorporated intoclouds, either as cloud condensation nuclei or ice nuclei, where
Please cite this article in press as: Mahowald, N., et al. The size distribution of(2013), http://dx.doi.org/10.1016/j.aeolia.2013.09.002
aerosols are important for the formation of clouds (e.g. DeMottet al., 2003; Rosenfeld and Nirel, 1996), or when the aerosols makecontact with the cloud droplets and are captured by the clouddroplets within clouds. While desert dust particles are insoluble,they readily attract water to their surfaces (Koretsky et al., 1997),and can act as cloud condensation nuclei by adsorption of watervapor (Kumar et al., in press). There is also growing evidence thatdust aerosols are one of the most important sources of ice nuclei,and thereby can substantially affect cloud processes (Creameanet al., 2013; DeMott et al., 2010). Thus, processing of atmosphericdust particles with sulfate or other pollutants is not necessary forthem to be readily incorporated into clouds (e.g. Fan et al., 2004).These cloud droplets can grow to a size (1–100 lm) where theirterminal velocity is much larger than for the original aerosols,causing clouds that are in contact with the ground (e.g. fog) toaccelerate the deposition of aerosols (e.g. Seinfeld and Pandis,1998). These processes are called in-cloud scavenging.
Once cloud droplets grow to where their terminal velocities arelarge enough to cause deposition in minutes (100 lm to 1 mm),they are called rain droplets, and can cause the deposition of aero-sols to the surface from high in the atmosphere. Below the cloud,rain drops can hit and collect more aerosols, which is called be-low-cloud scavenging.
Wet deposition is sometimes parameterized as a simple scav-enging rate, where one assumes a constant removal of aerosolsper amount of water precipitated (e.g. Tegen and Fung, 1994).However, using surface concentration to infer wet deposition canproduce errors in situations where the aerosols are carried inplumes elevated above the boundary layer (e.g. Heimburgeret al., 2012). For modeling, there are many more physically basedschemes (e.g. Giorgi and Chameides, 1985), but models using dif-ferent parameterizations produce varying results (e.g. Huneeuset al., 2011; Rasch et al., 2000). There are few measurements ofwet deposition processes, implying that there are large uncertain-ties in model estimates (Huneeus et al., 2011).
Wet deposition is also size dependent. In-cloud scavengingshould incorporate most aerosols, especially larger particles, suchas most desert dust, that more readily act as CCN or IN (e.g. Cziczoet al., 2013; Dusek et al., 2006) and thus we do not expect strongsize-segregation during in-cloud scavenging (Seinfeld and Pandis,1998). Theory suggests that below-cloud scavenging should bestrongly size dependent, with a maximum rates of depositionoccurring when particles are close to 1 lm (Seinfeld and Pandis,1998), although there is limited field data to evaluate theories. Aer-osol wet deposition lifetimes are difficult to assess, but are esti-mated to be close to 1–2 weeks on average (e.g. Balkanski et al.,1993; Huneeus et al., 2011). Wet removal occurs only during pre-cipitation events, but such events cause removal of most of the aer-osol load. Overall, the deposition lifetime of aerosols depends onwhether there is precipitation at a given time and place, as wellas how large and high particles are at that location (e.g. Fig. 7).
Cloud processing of aerosols can also be important for aggregat-ing aerosols, and thereby changing their size distribution, as wellas mixing aerosols, causing externally mixed aerosols to becomeinternally mixed (e.g. Seinfeld and Pandis, 1998). If individual aero-sols have mixed compositions, these aerosols are referred to asinternally mixed aerosols, whereas if each aerosol is unmixed,but is in a mixed population, this is referred to as an externallymixed aerosol population.
3.3. Atmospheric concentration size fraction: observations and models
3.3.1. Measurements of the atmospheric dust size distribution nearsource areas
In recent years, a range of in situ measurements of the dust sizedistribution have been published, especially of measurements
desert dust aerosols and its impact on the Earth system. Aeolian Research

Fig. 6. Spatial distribution of dry deposition lifetimes in CAM4 (Albani et al., submitted) for bins 1–4 (a–d) in days. Dry deposition lifetimes are calculated as the columnamount (kg/m2) divided by the dry deposition flux (kg/m2/day).
Fig. 7. Desert dust aerosol lifetimes in CAM4 in days (Albani et al., submitted).
N. Mahowald et al. / Aeolian Research xxx (2013) xxx–xxx 9
close to the North African source regions. These include measure-ments performed during the SaHAran Dust Experiment (SHADE;Haywood et al. (2003)), Bodele Dust Experiment (BoDEx 2005;Washington et al. (2006), Todd et al. (2007)), the Dust And BiomassBurning Experiment (DABEX; Chou et al. (2008), Osborne et al.(2008)), the Saharan Mineral Dust Experiments (SAMUM-1 and SA-MUM-2; Schladitz et al. (2011), Weinzierl et al. (2009)), the Geo-stationary Earth Radiation Budget Intercomparison of Longwaveand Shortwave radiation (GERBILS; Johnson and Osborne (2011)),and the recent Fennec campaign (Ryder et al., 2013b).These fieldcampaigns determined the dust PSD using a variety of optical par-ticle counters, as well as electron microscopy analyses of collected
Please cite this article in press as: Mahowald, N., et al. The size distribution of(2013), http://dx.doi.org/10.1016/j.aeolia.2013.09.002
samples. The results of these different campaigns appear consis-tent for particles between 1 and 5 lm, but differ substantially forthe large particle fraction (see Fig. 5). This observation mirrorsthe results of measurements of the emitted dust size distributionat emission (Fig. 3), and supports the hypothesis that the emissionof small dust aerosols (< �5 lm) is relatively invariant to soil typeand state, whereas emission of larger dust aerosols (> �5 lm) canvary substantially (Kok, 2011a,b). Furthermore, differences in dis-tance from the source will create differences in the gravitationalsettling rate, which will in turn cause differences mainly in the sizedistribution of the coarse fraction. Another factor contributing tothe scatter in the data for coarser aerosols is that relatively few
desert dust aerosols and its impact on the Earth system. Aeolian Research
10 N. Mahowald et al. / Aeolian Research xxx (2013) xxx–xxx
PSD measurements are available that extend to coarser sizes, andthat the few available measurements of coarser aerosols have lar-ger uncertainty than for finer aerosols because of poor countingstatistics (e.g., Ryder et al., 2013b).
Another interesting result from Fig. 3 is that aerosols <1 lm areoverrepresented relative to measurements at emission (Fig. 3). Thisis puzzling since dry deposition is inefficient for particles thatsmall (Miller et al., 2006), and wet deposition is generally insignif-icant over the Sahara (Ginoux et al., 2001). This apparent discrep-ancy between in situ measurements and measurements atemission could be due to several reasons. First, there could be sys-tematic differences between the size distributions at emission(Fig. 3) and the in situ size distributions (Fig. 5), for instance dueto systematic differences of soil properties in the Sahara with soilsin the measurement locales represented in Fig. 3 (Texas, Niger, Chi-na, and Australia). Second, there could be systematic differences inthe measurement techniques, although both sets of measurementsused a mix of (electron) microscopy and optical sizing instruments.Finally, the in situ measurements could contain a substantial frac-tion of other species of aerosols, especially sulfates (Kandler et al.,2009; Schladitz et al., 2011). The measurements of Chou et al.(2008) and Weinzierl et al. (2009) eliminated volatiles such as sul-fates, and these measurements are indeed in closer agreementwith measurements at emission than other in situ measurements.In particular, the Osborne et al. (2008) measurements, taken duringthe same flights as the Chou et al. (2008) measurements, showmore of an overestimation relative to measurements at emission,supporting this notion.
In addition to measurements near the North African source re-gions, some field campaigns have determined the dust size distri-bution near other source regions, such as the Middle East (Reidet al., 2008), as well as dust transported to the Canary Islands,Puerto Rico, and Florida (Maring et al., 2003; Prospero and Custals,2012; Reid et al., 2003b). The deployment of sun-photometers,including from the AERONET stations, in sites or areas where inten-sive field campaigns are carried out gives the chance to comparethe different measurements. Results from the Puerto Rico DustExperiment (PRIDE) campaign highlighted how inversion esti-mates yielded volume median diameter around 4 lm, slightly lar-ger than the more reliable measurements from aerodynamic sizing(3.5 lm), but pointed to large uncertainties (Maring et al., 2003).More recently, size distributions from in situ aircraft samplingduring the SAMUM-1 and Fennec 2011 campaign showed a signif-icant discrepancy in comparison with AERONET for larger particles(i.e. diameters >6 lm), with the inversions tending towards finerdistributions compared to the aircraft samples (Muller et al.,2012; Ryder et al., 2013a,b).
3.3.2. Evolution of dust size distributions: example of North Africandust
Close to dust source regions, there is a significant amount ofcoarse desert dust particles (Figs. 4 and 5), which fall out as thedust travels downwind (Fig. 8). Several observational studies havefocused on understanding the evolution of dust size in the NorthAtlantic (e.g. Reid et al., 1998, 2003b; Maring et al., 2003; Kalash-nikova and Kahn, 2008). Here we compare the observed and mod-eled evolution (from CAM4; Albani et al., submitted). Notice thatAERONET data in the smallest size bin are not included, becauseof possible contamination by other aerosols and large uncertainties(e.g. Albani et al., submitted; Dubovik et al., 2000). In evaluatingthe model against the different types of observations, one mustkeep in mind both the different metrics used (geometric vs. aero-dynamic diameter, as discussed in 2.1), as well as the differencesin measurement techniques (see Figure 20 in Reid et al.,2003a,b). While the model appears to capture the size distributionin the source regions, according to the AERONET observations
Please cite this article in press as: Mahowald, N., et al. The size distribution of(2013), http://dx.doi.org/10.1016/j.aeolia.2013.09.002
(Fig. 8c; Albani et al., submitted), and in downwind regions (e.g.Barbados; Fig. 8d), the transition to smaller particles appears to oc-cur too quickly in this model. The loss of the big particles in wind-blown dust over the Eastern Atlantic is due to preferential settlingby dry deposition in the model.
Another important quality of dust size distributionsdownwind of a large source area is that the atmospheric surfaceconcentrations tend to be finer than the deposition (e.g.Fig. 8f–m), as the bigger particles fall out preferentially. This alsohelps explain why the surface observations at Izaña (Maringet al., 2003) or for off-shore sampling (Stuut et al., 2005) showa tendency towards a finer distribution than the deposition usedas a proxy for dust deposition in marine sediment cores (Mulitzaet al., 2010): in fact the deposition observations which areinterpreted to be wind-blown show a similar peak as the modeljust off the coast of Africa (Fig. 8). Also note how the observedsize fraction larger than 10 lm is much larger for sea levelobservations (Stuut et al., 2005) than for a high-elevation sitesuch as Izaña (Maring et al., 2003), although different techniqueswere used. This analysis supports the use of the coarse mode inthe deposition as a proxy for dust variability (e.g. Tjallingiiet al., 2008; Mulitza et al., 2010) However, Mulitza et al. (2010)does interpret fine particles in the sediment core as riverineinput, although they are in the correct size distribution (0.1–10um) for wind-blown dust from North African sources fartherinland.
3.4. Deposition size distribution: observations and models
The size distribution of dust at deposition can be measuredthrough in situ observations as well as from paleoarchives (e.g.Fig. 8). Similar to Fig. 7, one can see the dust size distributionevolution during transport towards finer distributions (e.g. Junge,1977; Derbyshire et al., 1998; Maring et al., 2003; Lawrence andNeff, 2009), and is represented here for a collection of observa-tional estimates of present-day dust deposition (Fig. 8). Largerparticles are usually more prevalent close to the source regions,where there are also greater deposition fluxes (Fig. 9). There is atendency for an inverse relationship between the fraction of coarseparticles and dust deposition fluxes in models (Fig. 10) and obser-vations (Fig. 9), although the relationship is not tightly constrained.Notice that the model used here suggests that in the SouthernOcean/Antarctic region, the dust deposition is relatively coarse,which is not seen in the observations (Albani et al., submitted).This is due predominately in the model to South American dust(not shown), and it suggests too many coarse particles are beingtransported long distances in the model in this region. Because ofthe lack of observations, it is not clear if this is due to an incorrectsource size distribution or if the dry and wet deposition processesin the model are in error.
For paleodust archives, the size distribution is used for many pur-poses. In some cases the information on size distribution is used toseparate aeolian versus riverine inputs (Weltje, 1997; Tjallingiiet al., 2008) or highlight sediment redistribution (Rea and Hovan,1995) in marine sediments, and to contribute to differentiating localversus remote aeolian contributions (Delmonte et al., 2010; Albaniet al., 2012a; Marx et al., 2009).
Observed variability in size distribution has been the basis forinterpreting changes in the grain size of dust as a paleoclimateproxy, a possible indicator of changes in source area proximity,wind strength and/or changes in the type of deposition processes(e.g. Xiao et al., 1995; Kohfeld and Harrison, 2001; Ruth et al.,2003; Delmonte et al., 2004). For example coarser grain size fromloess deposits (Porter and An, 1995) and marine sediments (Ho-van et al., 1991) during cold stages have been interpreted in rela-tion to stronger winds – while conversely finer sizes were
desert dust aerosols and its impact on the Earth system. Aeolian Research
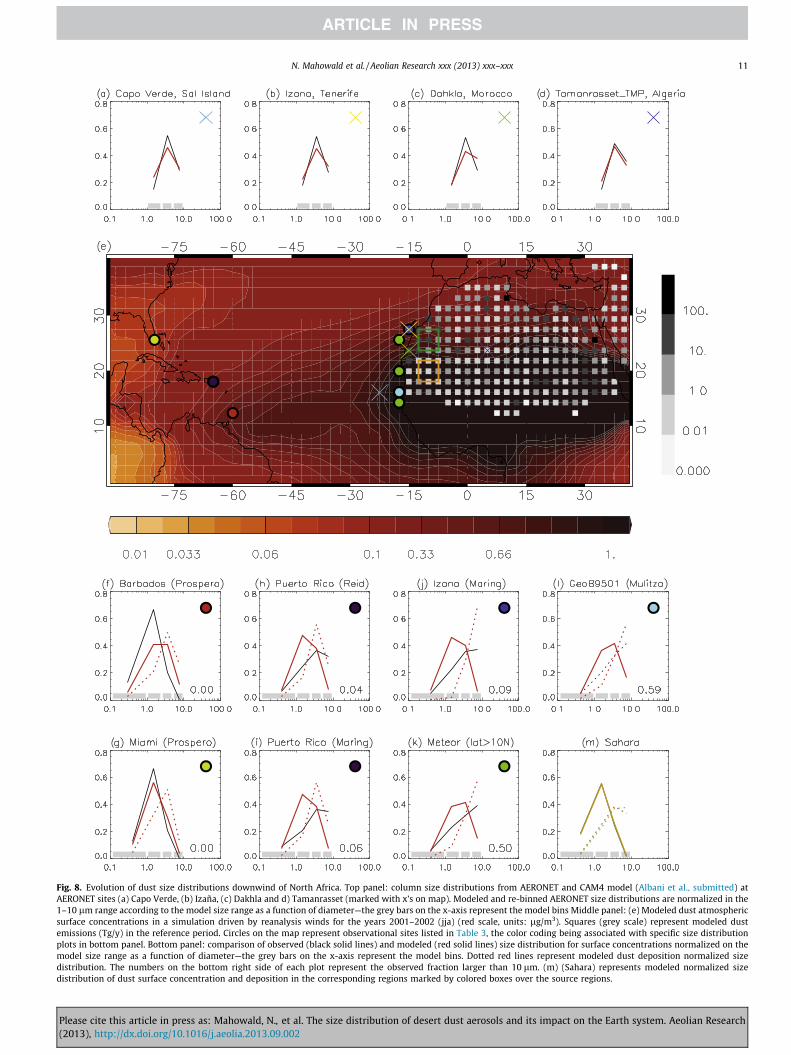
Fig. 8. Evolution of dust size distributions downwind of North Africa. Top panel: column size distributions from AERONET and CAM4 model (Albani et al., submitted) atAERONET sites (a) Capo Verde, (b) Izaña, (c) Dakhla and d) Tamanrasset (marked with x’s on map). Modeled and re-binned AERONET size distributions are normalized in the1–10 lm range according to the model size range as a function of diameter—the grey bars on the x-axis represent the model bins Middle panel: (e) Modeled dust atmosphericsurface concentrations in a simulation driven by reanalysis winds for the years 2001–2002 (jja) (red scale, units: lg/m3). Squares (grey scale) represent modeled dustemissions (Tg/y) in the reference period. Circles on the map represent observational sites listed in Table 3, the color coding being associated with specific size distributionplots in bottom panel. Bottom panel: comparison of observed (black solid lines) and modeled (red solid lines) size distribution for surface concentrations normalized on themodel size range as a function of diameter—the grey bars on the x-axis represent the model bins. Dotted red lines represent modeled dust deposition normalized sizedistribution. The numbers on the bottom right side of each plot represent the observed fraction larger than 10 lm. (m) (Sahara) represents modeled normalized sizedistribution of dust surface concentration and deposition in the corresponding regions marked by colored boxes over the source regions.
N. Mahowald et al. / Aeolian Research xxx (2013) xxx–xxx 11
Please cite this article in press as: Mahowald, N., et al. The size distribution of desert dust aerosols and its impact on the Earth system. Aeolian Research(2013), http://dx.doi.org/10.1016/j.aeolia.2013.09.002
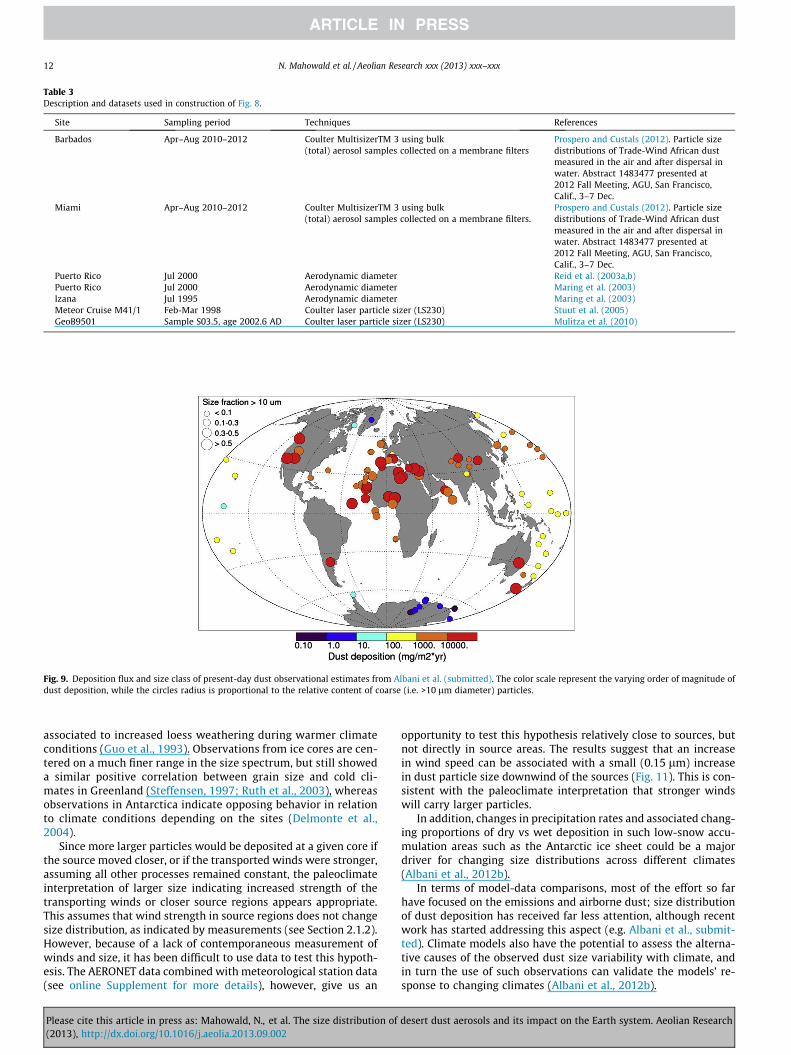
Table 3Description and datasets used in construction of Fig. 8.
Site Sampling period Techniques References
Barbados Apr–Aug 2010–2012 Coulter MultisizerTM 3 using bulk(total) aerosol samples collected on a membrane filters
Prospero and Custals (2012). Particle sizedistributions of Trade-Wind African dustmeasured in the air and after dispersal inwater. Abstract 1483477 presented at2012 Fall Meeting, AGU, San Francisco,Calif., 3–7 Dec.
Miami Apr–Aug 2010–2012 Coulter MultisizerTM 3 using bulk(total) aerosol samples collected on a membrane filters.
Prospero and Custals (2012). Particle sizedistributions of Trade-Wind African dustmeasured in the air and after dispersal inwater. Abstract 1483477 presented at2012 Fall Meeting, AGU, San Francisco,Calif., 3–7 Dec.
Puerto Rico Jul 2000 Aerodynamic diameter Reid et al. (2003a,b)Puerto Rico Jul 2000 Aerodynamic diameter Maring et al. (2003)Izana Jul 1995 Aerodynamic diameter Maring et al. (2003)Meteor Cruise M41/1 Feb-Mar 1998 Coulter laser particle sizer (LS230) Stuut et al. (2005)GeoB9501 Sample S03.5, age 2002.6 AD Coulter laser particle sizer (LS230) Mulitza et al. (2010)
Fig. 9. Deposition flux and size class of present-day dust observational estimates from Albani et al. (submitted). The color scale represent the varying order of magnitude ofdust deposition, while the circles radius is proportional to the relative content of coarse (i.e. >10 lm diameter) particles.
12 N. Mahowald et al. / Aeolian Research xxx (2013) xxx–xxx
associated to increased loess weathering during warmer climateconditions (Guo et al., 1993). Observations from ice cores are cen-tered on a much finer range in the size spectrum, but still showeda similar positive correlation between grain size and cold cli-mates in Greenland (Steffensen, 1997; Ruth et al., 2003), whereasobservations in Antarctica indicate opposing behavior in relationto climate conditions depending on the sites (Delmonte et al.,2004).
Since more larger particles would be deposited at a given core ifthe source moved closer, or if the transported winds were stronger,assuming all other processes remained constant, the paleoclimateinterpretation of larger size indicating increased strength of thetransporting winds or closer source regions appears appropriate.This assumes that wind strength in source regions does not changesize distribution, as indicated by measurements (see Section 2.1.2).However, because of a lack of contemporaneous measurement ofwinds and size, it has been difficult to use data to test this hypoth-esis. The AERONET data combined with meteorological station data(see online Supplement for more details), however, give us an
Please cite this article in press as: Mahowald, N., et al. The size distribution of(2013), http://dx.doi.org/10.1016/j.aeolia.2013.09.002
opportunity to test this hypothesis relatively close to sources, butnot directly in source areas. The results suggest that an increasein wind speed can be associated with a small (0.15 lm) increasein dust particle size downwind of the sources (Fig. 11). This is con-sistent with the paleoclimate interpretation that stronger windswill carry larger particles.
In addition, changes in precipitation rates and associated chang-ing proportions of dry vs wet deposition in such low-snow accu-mulation areas such as the Antarctic ice sheet could be a majordriver for changing size distributions across different climates(Albani et al., 2012b).
In terms of model-data comparisons, most of the effort so farhave focused on the emissions and airborne dust; size distributionof dust deposition has received far less attention, although recentwork has started addressing this aspect (e.g. Albani et al., submit-ted). Climate models also have the potential to assess the alterna-tive causes of the observed dust size variability with climate, andin turn the use of such observations can validate the models’ re-sponse to changing climates (Albani et al., 2012b).
desert dust aerosols and its impact on the Earth system. Aeolian Research

Fig. 10. Scatterplot of fraction of dust >5 lm versus magnitude of dust deposition in CAM4. (a) Source areas (red) versus regions away from sources (black). Source areas aredefined here as the model grid cells with dust emissions >0 (b) Ocean areas (blues) versus land regions (black). (c) Regional definitions (c) used in the scatter plot(d), wherethe colors correspond between (c) and (d).
(a)
0.01 0.1 1 10 100
particle size [µm]
0.0
0.1
0.2
0.3
0.4
0.5
dV(r
)/dl
nr[µ
m3 /µ
m2 ]
0.1>
x<5.
0
5.0>
x<7.
5
7.5>
x<10
.0
10.0
>x<1
2.5
12.5
>x<1
5.0
15.0
>x<1
7.5
17.5
>x<2
0.0
1.50
1.75
2.00
2.25
r Eff,
CO
AR
SE
[µm
]
1260
0
3788
497
36 1 0 1
11
2
2
3
3
4
4
5
5
6
6
7
7
bins
+ + ++ +
(b) (c)
Fig. 11. Relationship between particle size and wind speed derived from 19 AERONET sites and nearby meteorological stations (see online supplement for details). (a) Meanvolume particle size distribution for different wind speed classes whereby each color corresponds to the color of the wind speed class presented in plot b. (b) Mean effectiveradius for the coarse size fraction for different wind speed classes. The number of observations is given above each class on the top axis of the figure. Bars are shown for windclasses with sufficient data for statistical signficance. (c) Plot shows whether the difference in the mean effective radius between the wind speed bins is statisticallysignificant. A plus (minus) symbol indicates a statistically significant increase (decrease) between the mean values. No symbol indicates that the difference is not statisticallysignificant. (For interpretation of the references to colour in this figure legend, the reader is referred to the web version of this article.)
N. Mahowald et al. / Aeolian Research xxx (2013) xxx–xxx 13
4. Impacts of desert dust and sensitivity to size
4.1. Direct radiative effects dependence on size distribution
Mineral dust is an active component of the climate system, con-tributing to global radiative balance. Changes in mineral aerosolsover the anthropocene are thought to contribute to aerosol radia-tive forcing (Forster et al., 2007). In this section we focus on theinfluence that dust size has on the direct effects i.e. the alterationof the atmosphere energy balance by scattering and absorptionof electromagnetic radiation in the solar (short-wave: SW) and ter-restrial (long-wave: LW) parts of the frequency spectrum. Giventhe size range of dust particles (>0.1 lm) scattering and absorptionin models is described in terms of Mie theory. Assuming
Please cite this article in press as: Mahowald, N., et al. The size distribution of(2013), http://dx.doi.org/10.1016/j.aeolia.2013.09.002
homogeneous spherical particles, and based on particle size andwavelength dependent refractive indices of the effective medium,it provides intrinsic optical properties such as the single scatteringalbedo, mass specific extinction, and asymmetry parameter as afunction of the wavelength and particle size (e.g. Tegen and Lacis,1996). Those optical properties are then used by radiative transfermodels to calculate the radiative forcing based on dust mixing ratiodistributions in climate models. The accuracy of such representa-tions depends on the representativeness of the discretization ofspectral bands and size-dependent optical properties in modelswith respect to the modeled size distribution of dust aerosols(e.g. Miller et al., 2004). The approximation of particles to spheresis thought to be of second order importance for estimating theradiative flux divergence in climate models, despite its relevance
desert dust aerosols and its impact on the Earth system. Aeolian Research

14 N. Mahowald et al. / Aeolian Research xxx (2013) xxx–xxx
for remote sensing applications (Mishchenko et al., 1995; Duboviket al., 2002).
Besides the magnitude of dust load, size distribution is a dom-inant factor in determining the direct radiative forcing (Tegenand Lacis, 1996; Liao and Seinfeld, 1998; Perlwitz et al., 2001).Actually, the relevance of size is tightly related to mineralogicalcomposition in determining the optical properties of dust, as sum-marized by the size dependence of the refractive indices (e.g. Kan-dler et al., 2011).
Scattering tends to prevail over absorption in the short wave(SW), as indicated by the observationally derived values >0.9 forthe single-scattering albedo (the ratio of scattering efficiency to to-tal extinction efficiency) at visible wavelengths >0.5 lm (Tanréet al., 2001), with smaller particles being the most effective in scat-tering (e.g. Tegen and Lacis, 1996; Miller et al., 2004). NonethelessSW absorption is a relevant process throughout the atmosphericcolumn that needs to be considered for an accurate budget of theSW Top-Of-the-Atmosphere (TOA) radiative forcing (e.g. Milleret al., 2004; Balkanski et al., 2007; Yoshioka et al., 2007). On theother hand dust absorption is dominant over scattering in the longwave (LW) especially for super-micron particles, and LW scatteringis often not represented explicitly in climate models (e.g. Milleret al., 2006).
The net TOA direct RF from dust eventually depends on the bal-ance between the opposing effects of SW and LW scattering andabsorption, where slight variations of the relative magnitude ofthose factors can significantly alter the overall balance (e.g. Liaoand Seinfeld, 1998; Claquin et al., 1998; Albani et al., submitted),as emerging from the large uncertainties in both magnitude anddirection (�0.56 to +0.1 W/m2) of direct dust RF from IPCC AR4model estimates (Forster et al., 2007). The sensitivity to the SW-LW balance at the TOA needs to be considered also in relation tothe evolution of dust size distribution with transport (e.g. Maringet al., 2003), together with changing surface albedo (Carlson andBenjamin, 1980; Li et al., 2004; Patadia et al., 2008 Yoshiokaet al., 2007). In fact dust tends to give a positive net surface RF overbright surfaces, being instead negative over dark surfaces such asthe oceans (e.g. Miller and Tegen, 1998; Balkanski et al., 2007).
For the estimation of dust direct RF in climate models the pri-mary goal in terms of dust size would be to achieve a good repre-sentation in the 1–10 lm range, where most of dust mass withsignificant lifetimes is concentrated. An additional step would thenbe to focus on the uncertainties in the small and large tails of thedistributions. Small (sub-micron) particles have long lifetimesand are effective scatterers, whereas large particles are LW absorb-ers with huge mass over source areas (e.g. Ryder et al., 2013a,b).Uncertainties in observational constraints in the magnitude andspatial distribution of dust prevent a full assessment of the impor-tance of dust size to the global RF budget, although the resultingregional effects on e.g. the hydrological cycle (Miller et al., 2004)or atmospheric stability (Luo et al., 2003) can be important.
4.2. Aerosol-cloud indirect effects
As with other aerosol species, dust particles can act as cloudcondensation nuclei (CCN) for cloud droplet formation undersupersaturated conditions. For a population of dust aerosol in asupersaturated environment, all particles larger than a thresholdsize, known as the critical diameter, will nucleate cloud droplets(Andreae and Rosenfeld, 2008). This makes the number of dustparticles acting as CCN highly sensitive to the ambient (or modelpredicted) number size distribution(s) shape and median (Karydiset al., 2011).
The critical diameter required for cloud droplet formationdepends on the particle solubility, as well as the ambientconditions. Dust particles are often large, increasing their
Please cite this article in press as: Mahowald, N., et al. The size distribution of(2013), http://dx.doi.org/10.1016/j.aeolia.2013.09.002
likelihood of exceeding the critical diameter and acting as CCN,and they readily attract water vapor, although insoluble (Koretskyet al., 1997; Karydis et al., 2011).Recent studies suggest that min-eral aerosols are the dominant ice nuclei for cirrus clouds (Cziczoet al., 2013). Demott et al. (2010) introduced a scheme for predict-ing the number of particles that will form ice crystals, known as icenuclei (IN), based on the ambient temperature and the numberconcentration of particles with diameters greater than 0.5 lm.They show that much of the variability in IN activity can be ex-plained with this simple relation.
The dual, and competing, roles of dust as CCN and IN cloud ourunderstanding of the global impact of dust on the climate (Maho-wald and Kiehl, 2003). Increases in dust acting as CCN would in-crease cloud albedo and suppress precipitation in warm,stratiform clouds (Rosenfeld et al., 2001), although the global im-pact of dust in this role is unknown. The impacts of dust on convec-tive clouds are complex and lead to vastly different, even oppositeresponses in cloud albedo and precipitation (van den Heever et al.,2006). These uncertainties highlight the importance of knowingdust size for predicting CCN and IN and the accompanying climateeffects.
4.3. Snow albedo impacts of dust
Dust particles that deposit to snow and ice surfaces reduce theirsolar albedo, exerting an additional positive RF on the climate sys-tem. Albedo reduction from dust occurs primarily in the visiblespectrum, where ice absorbs very weakly and snow crystals scatterefficiently. Because scattering is dominated by the ice crystals, fac-tors which determine dust absorptivity, much more so than scat-tering, determine the RF of dust in snow. These factors includesize distribution and imaginary component of the refractive index.While larger particles absorb more solar radiation per particle, themass-normalized absorption has a non-linear relationship withsize, peaking around 0.3 lm in the mid-visible for a typical Saharandust mixture and wavelength (Fig. 12a). There are Mie resonancefeatures in absorption by individual particles (monodisperse sizedistributions) that are averaged out in the lognormal size distribu-tions. The albedo reduction caused by a given mass of dust gener-ally peaks close to the radius of maximum 500 nm mass absorptioncross-section though deviation from this appears with large dustconcentration (Fig. 12b).
Another way in which particle size distribution influences theRF of dust in snow is by determining the mobility of particles withmeltwater, and consequently the length of time that the particlesalter snow albedo. Several studies have noted that particulate mat-ter becomes concentrated near the snow surface during melt,though few have linked the effectiveness of particle retention tosize. Higuchi and Nagoshi (1977) found that dust particles largerthan 4–10 lm were relatively immobile with meltwater, whileConway et al. (1996) reported that volcanic ash particles withdiameters larger than 5 lm tended to remain near the snowsurface during melt. Using Stokes Law to model particle drag,Conway et al. (1996) argue that particles larger than about 6 lmshould be immobile with melt fluxes of 500 mm d-1, consistentwith observations, while particles smaller than �1 lm shouldbecome mobile when flow rates exceed about 20 mm d�1.
Size distributions of dust in snow depend strongly on proximityto source regions, as discussed previously (Section 3.3). Most of themeasurements of dust size distributions in the cryosphere comefrom ice cores records, used to interpret past climate variability.Measurements from Greenland indicate variations in volume moderadius of�0.6–1.1 lm throughout the 120ky GRIP core (Steffensen,1997), ranges in number mean radius of about 0.5–0.7 lm from10.5–14 kya in the GISP2 core (Zielinski and Mershon, 1997), andvariations in volume mode radius of �0.6–0.85 lm during
desert dust aerosols and its impact on the Earth system. Aeolian Research
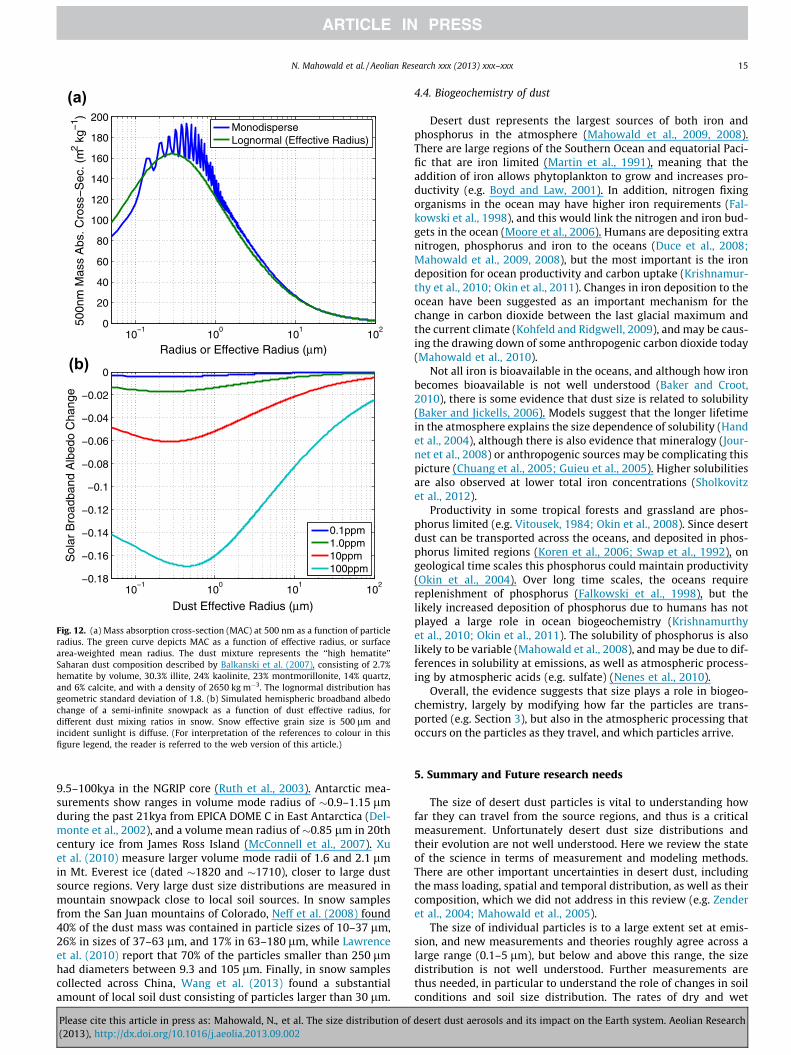
10−1
100
101
102
0
20
40
60
80
100
120
140
160
180
200
Radius or Effective Radius (µm)
500n
m M
ass
Abs
. Cro
ss−
Sec
. (m
2 kg−
1 )
MonodisperseLognormal (Effective Radius)
10−1
100
101
102
−0.18
−0.16
−0.14
−0.12
−0.1
−0.08
−0.06
−0.04
−0.02
0
Dust Effective Radius (µm)
Sol
ar B
road
band
Alb
edo
Cha
nge
0.1ppm1.0ppm10ppm100ppm
(a)
(b)
Fig. 12. (a) Mass absorption cross-section (MAC) at 500 nm as a function of particleradius. The green curve depicts MAC as a function of effective radius, or surfacearea-weighted mean radius. The dust mixture represents the ‘‘high hematite’’Saharan dust composition described by Balkanski et al. (2007), consisting of 2.7%hematite by volume, 30.3% illite, 24% kaolinite, 23% montmorillonite, 14% quartz,and 6% calcite, and with a density of 2650 kg m�3. The lognormal distribution hasgeometric standard deviation of 1.8. (b) Simulated hemispheric broadband albedochange of a semi-infinite snowpack as a function of dust effective radius, fordifferent dust mixing ratios in snow. Snow effective grain size is 500 lm andincident sunlight is diffuse. (For interpretation of the references to colour in thisfigure legend, the reader is referred to the web version of this article.)
N. Mahowald et al. / Aeolian Research xxx (2013) xxx–xxx 15
9.5–100kya in the NGRIP core (Ruth et al., 2003). Antarctic mea-surements show ranges in volume mode radius of �0.9–1.15 lmduring the past 21kya from EPICA DOME C in East Antarctica (Del-monte et al., 2002), and a volume mean radius of �0.85 lm in 20thcentury ice from James Ross Island (McConnell et al., 2007). Xuet al. (2010) measure larger volume mode radii of 1.6 and 2.1 lmin Mt. Everest ice (dated �1820 and �1710), closer to large dustsource regions. Very large dust size distributions are measured inmountain snowpack close to local soil sources. In snow samplesfrom the San Juan mountains of Colorado, Neff et al. (2008) found40% of the dust mass was contained in particle sizes of 10–37 lm,26% in sizes of 37–63 lm, and 17% in 63–180 lm, while Lawrenceet al. (2010) report that 70% of the particles smaller than 250 lmhad diameters between 9.3 and 105 lm. Finally, in snow samplescollected across China, Wang et al. (2013) found a substantialamount of local soil dust consisting of particles larger than 30 lm.
Please cite this article in press as: Mahowald, N., et al. The size distribution of(2013), http://dx.doi.org/10.1016/j.aeolia.2013.09.002
4.4. Biogeochemistry of dust
Desert dust represents the largest sources of both iron andphosphorus in the atmosphere (Mahowald et al., 2009, 2008).There are large regions of the Southern Ocean and equatorial Paci-fic that are iron limited (Martin et al., 1991), meaning that theaddition of iron allows phytoplankton to grow and increases pro-ductivity (e.g. Boyd and Law, 2001). In addition, nitrogen fixingorganisms in the ocean may have higher iron requirements (Fal-kowski et al., 1998), and this would link the nitrogen and iron bud-gets in the ocean (Moore et al., 2006). Humans are depositing extranitrogen, phosphorus and iron to the oceans (Duce et al., 2008;Mahowald et al., 2009, 2008), but the most important is the irondeposition for ocean productivity and carbon uptake (Krishnamur-thy et al., 2010; Okin et al., 2011). Changes in iron deposition to theocean have been suggested as an important mechanism for thechange in carbon dioxide between the last glacial maximum andthe current climate (Kohfeld and Ridgwell, 2009), and may be caus-ing the drawing down of some anthropogenic carbon dioxide today(Mahowald et al., 2010).
Not all iron is bioavailable in the oceans, and although how ironbecomes bioavailable is not well understood (Baker and Croot,2010), there is some evidence that dust size is related to solubility(Baker and Jickells, 2006). Models suggest that the longer lifetimein the atmosphere explains the size dependence of solubility (Handet al., 2004), although there is also evidence that mineralogy (Jour-net et al., 2008) or anthropogenic sources may be complicating thispicture (Chuang et al., 2005; Guieu et al., 2005). Higher solubilitiesare also observed at lower total iron concentrations (Sholkovitzet al., 2012).
Productivity in some tropical forests and grassland are phos-phorus limited (e.g. Vitousek, 1984; Okin et al., 2008). Since desertdust can be transported across the oceans, and deposited in phos-phorus limited regions (Koren et al., 2006; Swap et al., 1992), ongeological time scales this phosphorus could maintain productivity(Okin et al., 2004). Over long time scales, the oceans requirereplenishment of phosphorus (Falkowski et al., 1998), but thelikely increased deposition of phosphorus due to humans has notplayed a large role in ocean biogeochemistry (Krishnamurthyet al., 2010; Okin et al., 2011). The solubility of phosphorus is alsolikely to be variable (Mahowald et al., 2008), and may be due to dif-ferences in solubility at emissions, as well as atmospheric process-ing by atmospheric acids (e.g. sulfate) (Nenes et al., 2010).
Overall, the evidence suggests that size plays a role in biogeo-chemistry, largely by modifying how far the particles are trans-ported (e.g. Section 3), but also in the atmospheric processing thatoccurs on the particles as they travel, and which particles arrive.
5. Summary and Future research needs
The size of desert dust particles is vital to understanding howfar they can travel from the source regions, and thus is a criticalmeasurement. Unfortunately desert dust size distributions andtheir evolution are not well understood. Here we review the stateof the science in terms of measurement and modeling methods.There are other important uncertainties in desert dust, includingthe mass loading, spatial and temporal distribution, as well as theircomposition, which we did not address in this review (e.g. Zenderet al., 2004; Mahowald et al., 2005).
The size of individual particles is to a large extent set at emis-sion, and new measurements and theories roughly agree across alarge range (0.1–5 lm), but below and above this range, the sizedistribution is not well understood. Further measurements arethus needed, in particular to understand the role of changes in soilconditions and soil size distribution. The rates of dry and wet
desert dust aerosols and its impact on the Earth system. Aeolian Research
16 N. Mahowald et al. / Aeolian Research xxx (2013) xxx–xxx
deposition have established theories, which are commonly used tointerpret observations and parameterize models, however, thereare few measurements, especially size resolved, of deposition.Since there is also a scarcity of measurements of the evolution ofthe dust size distribution during transport, we have a generallypoor understanding of processes that affect the atmospheric dustsize distribution, including deposition and aggregation. The obser-vations of dust aerosols that are available do not consistently showlog normal distributions, as often used to model aerosols.
Field campaigns are vital for understanding both size distribu-tions, as well as how to interpret different measurement tech-niques (e.g. Reid et al., 2003a; Weinzierl et al., 2009; Ryder et al.,2013a,b), and we encourage efforts to embrace size measurementswhich can be used in sediments for deposition measurements too,which would help produce a consistent view also across timescales and in a wider spatial and environmental domain. Methodsbased on laser diffraction seem to have the wider applicabilityranging from sediment analysis to aircraft measurements,although the technical differences may be relevant. In additionthe application of coulter counter measurements to atmosphericsamples would help bridging further the gap while having a finerresolution free of assumptions on dust composition (e.g. Ruthet al., 2003) in the fine size range. Better understanding of the roleof different sizes on climate and biogeochemistry are importantareas of research as well, which have not been fully undrstood.
Currently models do not commonly include dust particles above10 lm, but a substantial fraction of airborne dust may be abovethis threshold (Lawrence et al., 2010; Ryder et al., 2013a). This dustis likely important for longwave radiative interactions, as well asfor biogeochemistry, even if it does not travel significant distances.Models should improve their ability to capture the evolution of thedust size distribution as the plumes move downwind of the sourceregions, although this does require more cross-comparison of dif-fering observational methods.
Acknowledgements
We would like to acknowledge funding from NSF (0932946,1003509, and 1137716) and DOE (DE-SC00006735), and the valu-able input of two anonymous reviewers.
Appendix A. Supplementary data
Supplementary data associated with this article can be found, inthe online version, at http://dx.doi.org/10.1016/j.aeolia.2013.09.002.
References
Andreae, M.O., Rosenfeld, D., 2008. Aerosol–cloud–precipitation interactions. Part 1.The nature and sources of cloud-active aerosols. Earth-Sci. Rev. 89, 13–41(doi:10.1016/j.earscirev.2008.03.001).
Albani, S., Delmonte, B., Maggi, V., Baroni, C., Petit, J.R., Stenni, B., Mazzola, C.,Frezzotti, M., 2012a. Interpreting last glacial to Holocene dust changes at TalosDome (East Antarctica): implications for atmospheric variations from regionalto hemispheric scales. Clim. Past 8, 741–750 (doi: 10.5194/cp-8-741-2012).
Albani, S., Mahowald, N.M., Delmonte, B., Maggi, V., Winckler, G., 2012b. Comparingmodeled and observed changes in mineral dust transport and deposition toAntarctica between the Last Glacial maximum and current climates. Clim. Dyn.38 (9), 1731–1755 (doi: 10.1007/s00382-011-1139-5).
Albani, S., Mahowald, N.M., Perry, A.T., Scanza, R.A., Zender, C.S., Heavens, N.G.,Maggi, V., Kok, J.F., Otto-Bliesner, B.L., submitted. Improved dust representationin the Community Atmospheric Model. J. Adv. Model. Earth Syst.
Alfaro, S.C., Gaudichet, A., Gomes, L., Maille, M., 1997. Modeling the size distributionof a soil aerosol produced by sandblasting. J. Geophys. Res. 102, 11239–11249.
Alfaro, S.C., Gaudichet, A., Gomes, L., Maille, M., 1998a. Mineral aerosol productionby wind erosion: aerosol particle sizes and binding energies. Geophys. Res. Lett.25, 991–994.
Please cite this article in press as: Mahowald, N., et al. The size distribution of(2013), http://dx.doi.org/10.1016/j.aeolia.2013.09.002
Alfaro, S.C., Gaudichet, A., Gomes, L., Maille, M., 1998b. Mineral aerosol productionby wind erosion:aerosol particle sizes and binding energies. Geophys. Res. Lett.25, 991–994.
Alfaro, S.C., Gomes, L., 2001. Modeling mineral aerosol production by wind erosion:emission intensities and aerosol size distributions in source areas. J. Geophys.Res. 106, 18075–18084.
Bagnold, R.A., 1941. The Physics of Blown Sand and Desert Dunes. Methuen, NewYork.
Baker, A., Croot, P., 2010. Atmospheric and marine controls on aerosol iron solubilityin seawater. Mar. Chem. 120, 4–13.
Baker, A., Jickells, T., 2006. Mineral particle size as a control on aerosol ironsolubility. Geophys. Res. Lett. 33 (doi: 10.1029/2006GL026557).
Balkanski, Y., Schulz, M., Claquin, T., Guibert, S., 2007. Reevaluation of mineralaerosol radiative forcings suggests a better agreement with satellite andAERONET data. Atmos. Chem. Phys. 7, 81–95.
Balkanski, Y., Schulz, M., Marticorena, B., Bergametti, G., Guelle, W., Dulac, F.,Moulin, C., Lambert, C.E., 1996. Importance of the source term and of the sizedistribution to model the mineral dust cycle. In: Guerzoni, S., Chester, R. (Eds.),The Impact of Desert Dust Across the Mediterranean. Kluwer AcademicPublishers, Netherlands, pp. 69–76.
Balkanski, Y.J., Jacob, D.J., Gardner, G.M., Graustein, W.C., Turekian, K.K., 1993.Transport and residence times of tropospheric aerosols inferred from a globalthree-dimensional simulation of 210Pb. J. Geophys. Res. 98, 20,573–520,586.
Baumgardner, D., Jonsson, H., Dawson, W., O’Connor, D., Newton, R., 2001. Thecloud, aerosol and precipitation spectrometer: a new instrument for cloudinvestigations. Atmos. Res. 59–60, 251–264.
Bettis III, E.A., Muhs, D.R., Roberts, H.M., Wintle, A.G., 2003. Last Glacial loess in theconterminous USA. Quatern. Sci. Rev. 22, 1907–1946.
Boyd, P.W., Law, C.S., 2001. The Southern Ocean Iron RElease Experiment (SOIREE)introduction and summary. Deep-Sea Res. II 48, 2425–2438.
Braunack, M.V., Hewitt, J.S., Dexter, A.R., 1979. Brittle-fracture of soil aggregates andthe compaction of aggregate beds. J. Soil Sci. 30, 653.
Brunekreef, B., Holgate, S.T., 2002. Air pollution and health. Lancet 360, 1233–1242.Buurman, P., Pape, T., Muggler, C.C., 1997. Laser grain-size determination in soil
genetic studies 1. Practical problems. Soil Sci. 162 (3), 211–218.Carlson, Toby.N., Benjamin, Stanley.G., 1980. Radiative Heating Rates for Saharan
Dust. J. Atmos. Sci. 37, 193–213. http://dx.doi.org/10.1175/1520-0469(1980)037<0193:RHRFSD>2.0.CO;2.
Chou, C., Formenti, P., Maille, M., Ausset, P., Helas, G., Harrison, M., Osborne, S.,2008. Size distribution, shape, and composition of mineral dust aerosolscollected during the African Monsoon Multidisciplinary Analysis SpecialObservation Period 0: Dust and Biomass-Burning Experiment field campaignin Niger, January 2006. J. Geophys. Res. 113, D00c10.
Chuang, P., Duvall, R., Shafer, M., Schauer, J., 2005. The origin of water solubleparticulate iron in the Asian atmospheric outflow. Geophys. Res. Lett. 32 (doi:10.1029/2004GL021946).
Claquin, T., Schulz, M., Balkanski, Y., Boucher, O., 1998. Uncertainties in assessingradiative forcing by mineral dust. Tellus 50B, 491–505.
Clemens, S.C., 1998. Dust response to seasonal atmospheric forcing: proxyevaluation and calibration. Paleoceanography 13, 471–490.
Coakley, J.P., Syvitski, J.P.M., 1991. Sedigraph techniques. In: Syvitski, J.P.M. (Ed.),Principles, Methods, and Application of Particle Size Analysis. CambridgeUniversity Press, New York, pp. 129–142.
Conway, H., Gades, A., Raymond, C.F., 1996. Albedo of dirty snow during conditionsof melt. Water Resour. Res. 32 (6), 1713–1718.
Creamean, J.M., Suski, K.J., Rosenfeld, D., Cazorla, A., DeMott, P.J., Sullivan, R.C.,White, A.B., Ralph, F.M., Minnis, P., Comstock, J.M., Tomlinson, J.M., Prather, K.A.,2013. Dust and biological aerosols from the Sahara and Asia influenceprecipitation in the western US. Science 339, 1572–1578.
Cziczo, D., Froyd, K., Hoose, C., Jensen, E., Diao, M., Zondio, M., Smith, J., Twohy, C.H.,Murphy, D.M., 2013. Clarifying the dominant sources and mechansism of cirruscloud formation. Sci. Express (doi: 10.10126/science.1234145).
Delmonte, B., Petit, J.-R., Andersen, K.K., Basile-Doelsch, I., Maggi, V., Lipenkov, V.Y.,2004. Dust size evidence for opposite regional atmospheric circulation changesover east Antarctica during the last climatic transition. Clim. Dyn. 23, 427–438(doi: 10.1007/s00382-004-0450-9).
Delmonte, B., Baroni, C., Andersson, P.S., Schöberg, H., Hansson, M., Aciego, S., Petit,J.-R., Albani, S., Mazzola, C., Maggi, V., Frezzotti, M., 2010. Aeolian dust in theTalos Dome ice core (East Antarctica, Pacific/Ross Sea sector): Victoria Landversus remote sources over the last two climate cycles. J. Quat. Sci. 25 (8),1327–1337.
Delmonte, B., Petit, J.R., Maggi, V., 2002. Glacial to Holocene implications of the new27,000-year dust record from the EPICA Dome C (East Antarctica) ice core. Clim.Dyn. 18, 647–660 (doi: 10.1007/s00382-001-0193-9).
DeMott, P., Sassen, K., Poellot, M., Baumgardner, D., Rogers, D., Brooks, S., Prenni, A.,Kreidenweis, S., 2003. African dust aerosols as atmospheric ice nuclei. Geophys.Res. Lett. 30, 1732 (doi: 1710.1029/2003GL017410).
DeMott, P.J., Prenni, A.J., Liu, X., Kreidenweis, S.M., Petters, M.D., Twohy, C.H.,Richardson, M.S., Eidhammer, T., Rogers, D.C., 2010. Predicting globalatmospheric ice nuclei distributions and their impacts on climate. Proc. Nat.Acad. Sci. USA 107, 11217–11222.
Derbyshire, E., Meng, X., Kemp, R.A., 1998. Provenance, transport and characteristicsof modern Aeolian dust in western Gansu Province, China, and interpretation ofthe Quaternary loess record. J. Arid Env. 39, 497–516.
desert dust aerosols and its impact on the Earth system. Aeolian Research
N. Mahowald et al. / Aeolian Research xxx (2013) xxx–xxx 17
Dubovik, O., Holben, B., Eck, T.F., Smirnov, A., Kaufman, Y.J., King, M.D., Tanré, D.,Slutsker, I., 2002. Variability of absorption and optical properties of key aerosoltypes observed in worldwide locations. J. Atmos. Sci., 590–608.
Dubovik, O., King, M.D., 2000. A flexible inversion algorithm for retrieval of aerosoloptical properties from Sun and sky radiance measurements. J. Geophys. Res.105, 20673–20696.
Dubovik, O., Smirnov, A., Holben, B.N., King, M.D., Kaufman, Y.J., Eck, T.F., Slutsker, I.,2000. Accuracy assessments of aerosol optical properties retrieved fromAerososl Robotic Network (AERONET) Sun and sky radiance measurments. J.Geophys. Res. 105, 9791–9806.
Dubovik, O., Sinyuk, A., Lapyonok, T., Holben, B., Mishenko, M., Yang, P., Eck, T.F.,Volten, H., Munoz, O., Veihelmann, B., van der Zande, W., Leon, J.-F., Sorokin, M.,Slutser, I., 2006. Application of spheroid models to account for aerosol particlenonsphericity in remote sensng of desert dust. J. Geophys. Res. 111. http://dx.doi.org/10.1029/2005JD006619.
Duce, R.A. et al., 2008. Impacts of atmospheric anthropogenic nitrogen on the openocean. Science 320 (doi: 10.1126/science.1150369).
Dulac, F., Moulin, C., Lambert, C.E., Guillard, F., Poitou, J., Guelle, W., Quetel, C.R.,Schneider, X., Ezat, U., 1996. Quantitative remote sensing of African dusttransport to the mediterranean. In: Guerzoni, S., Chester, R. (Eds.), The Impact ofDesert Dust Across the Mediterranean. Kluwer Academic Publishers,Netherlands, pp. 25–49.
Dusek, U., Frank, G., Hildebrandt, L., Curtis, J., et al., 2006. Size matters more thanchemistry for cloud-nucleating ability of aerosol particles. Science 312, 1375–1378.
Falkowski, P.G., Barber, R.T., Smetacek, V., 1998. Biogeochemical controls andfeedbacks on ocean primary production. Science 281, 200–206.
Fan, S.-M., Horowitz, L., Levy, H., Moxim, W., 2004. Impact of air pollution on wetdeposition of mineral dust aerosols. Geophys. Res. Lett. 31 (doi: 10.1029/2003GL018501).
Formenti, P., Schütz, L., Balkanski, Y., Desboeufs, K., Ebert, M., Kandler, K., Petzold, A.,Scheuvens, D., Weinbruch, S., Zhang, D., 2011. Recent progress in understandingphysical and chemical properties of African and Asian mineral dust. Atmos.Chem. Phys. 11, 8231–8256.
P. Forster, Ramaswamy, V., Artaxo, P., Berntsen, T., Betts, R., Fahey, D.W., Haywood,J., Lean, J., Lowe, D.C., Myhre, G., Nganga, J., Prinn, R., Raga, G., Schulz, M.,Dorland, R.V., 2007. Changes in atmospheric constituents and in radiativeforcing. In: Solomon, S., Qin, D., Manning, M., Chen, Z., Marquis, M., Averyt, K.B.,Tignor, M., and Miller, H.L. (Eds.), Climate Change 2007: The Physical ScienceBasis, Contribution of Working Group I to the Fourth Assessment Report of theIntergovernmental Panel on Climate Change, Cambridge University Press,Cambridge, UK and New York, NY, USA, pp. 130–234.
Fratini, G., Ciccioli, P., Febo, A., Forgione, A., Valentini, R., 2007. Size-segregatedfluxes of mineral dust from a desert area of northern China by eddy covariance.Atmos. Chem. Phys. 7, 2839–2854.
Gill, T.E., Zobeck, T.M., Stout, J.E., 2006. Technologies for laboratory generation ofdust from geological materials. J. Hazard. Mater. 132, 1–13.
Gillette, D.A., 1974. On the production of soil wind erosion having the potential forlong range transport. J. Rech. Atmos. 8, 734–744.
Gillette, D.A., Blifford, I.H., Fenster, C.R., 1972. Measurements of aerosol sizedistributions and vertical fluxes of aerosols on land subject to wind erosion. J.Appl. Meteorol. 11, 977–987.
Gillette, D.A., Blifford, I.H., Fryrear, D.W., 1974. Influence of wind velocity on sizedistributions of aerosols generated by wind erosion of soils. J. Geophys. Res. 79,4068–4075.
Ginoux, P., Chin, M., Tegen, I., Prospero, J.M., Holben, B., Dubovik, O., Lin, S.J., 2001.Sources and distributions of dust aerosols simulated with the GOCART model. J.Geophys. Res. 106, 20255–20273.
Ginoux, P., Prospero, J., Gill, T.E., Hsu, N.C., Zhao, M., 2012. Global scale attribution ofanthropogenic and natural dust sources and their emission rates based on MODISdeep blue aerosol products. Rev. Geophys. 50 (doi: 10.1029/2012RG000388).
Giorgi, F., Chameides, W.L., 1985. The rainout parameterization in a photochemicalmodel. J. Geophys. Res. 90, 7872–7880.
Goossens, D., 2008. Techniques to measure grain-size distributions of loamysediments: a comparative study of ten instruments for wet analysis.Sedimentology 55, 65–96.
Goossens, D., Rajot, J.L., 2008. Techniques to measure the dry Aeolian deposition ofdust in arid and semi-arid landscapes: a comparative study in West Niger. EarthSurf. Processes Landforms 33, 178–195.
Grousset, F.E., Ginoux, P., Bory, A., Biscaye, P.E., 2003. Case study of a chinese dustplume reaching the French Alps. Geophys. Res. Lett. 30, 1277 (doi: 1210.1029/2002/gl016833).
Guieu, C., Bonnet, S., Wagener, T., Loye-Pilot, M.-D., 2005. Biomass burning as asource of dissolved iron to the open ocean? Geophys. Res. Lett. 22, L19608,doi:19610.11029/12005GL022962.
Guo, Z., Fedoroff, N., An, Z.S., Liu, T.S., 1993. Interglacial dustfall and origin of ironoxides-hydroxides in the paleosols of the Xifeng loess section, China. Sci. Geol.Sin. 2, 91–100.
Haberlah, D., McTainsh, G.H., 2011. Quantifying particle aggregation in sediments.Sedimentology 58, 1208–1216.
Hand, J., Mahowald, N., Chen, Y., Siefert, R., Luo, C., Subramaniam, A., Fung, I., 2004.Estimates of soluble iron from observations and a global mineral aerosol model:biogeochemical implications. J. Geophys. Res. 109, D17205, 17210.11029/12004JD004574.
Haywood, J., Francis, P., Osborne, S., Glew, M., Loeb, N., Highwood, E., Tanre, D.,Myhre, G., Formenti, P., Hirst, E., 2003. Radiative properties and direct radiative
Please cite this article in press as: Mahowald, N., et al. The size distribution of(2013), http://dx.doi.org/10.1016/j.aeolia.2013.09.002
effect of Saharan dust measured by the C-130 aircraft during SHADE: 1. Solarspectrum. J. Geophys. Res. 108.
Heimburger, A., Losno, R., Triquet, S., Dulac, F., Mahowald, N., 2012. Direct measurementof atmospheric iron, cobalt and aluminum-derived dust deposition at KerguelenIslands. Global Biogeochem. Cycles 26 (doi: 10.1029/2012GB004301).
Higuchi, K., Nagoshi, A., 1977. Effect of particulate matter in surface snow layers onthe albedo of perennial snow patches, in Isotopes and Impurities in Snow andIce, IAHS-AISH Publ No. 118, pp. 95–97.
Hinds, W.C., 1999. Aerosol Technology: Properties, Behavior, and measurement ofAirborne Particles, second ed. John Wiley & Sons, New York.
Holz, C., Stuut, J.-B.W., Henrich, R., Meggers, H., 2007. Variability in terrigenoussedimentation processes off northwest Africa and its relation to climatechanges: inferences from grain-size distributions of a Holocene marinesediment record. Sed. Geol. 202 (3), 499–508.
Hovan, S.A., Rea, D.K., Pisias, N.G., 1991. Late Pleistocene continental climate andoceanic variability recorded in Northwest Pacific sediments. Paleoceanography6 (3), 349–370 (doi: 10.1029/91PA00559).
Huneeus, N., Schulz, M., Balkanski, Y., Griesfeller, J., Kinne, S., Prospero, J., Bauer, S.,Boucher, O., Chin, M., Dentener, F., Diehl, T., Easter, R., Fillmore, D., Ghan, S.,Ginoux, P., Grini, A., Horowitz, L., Koch, D., Krol, M.C., Landing, W., Liu, X.,Mahowald, N., Miller, R., Morccrette, J.-J., Myhre, G., Penner, J., Perlwitz, J., Siter,P., Takemura, T., Zender, C., 2011. Global dust model intercomparison inAEROCOM. Atmos. Chem. Phys. 11, 1–36.
Iizuka, Y., Delmonte, B., Oyabu, I., Karlin, T., Maggi, V., Albani, S., Fukui, M., Hondoh,T., Hansson, M., in press. Sulfate and chloride aerosols during Holocene and lastglacial periods preserved in the Talos Dome Ice Core, a peripheral region ofAntarctica. Tellus B.
Jickells, T., An, Z., Andersen, K., Baker, A., Bergametti, G., Brooks, N., Cao, J., Boyd, P.,Duce, R., Hunter, K., Kawahata, H., Kubilay, N., laRoche, J., Liss, P., Mahowald, N.,Prospero, J., Ridgwell, A., Tegen, I., Torres, R., 2005. Global iron connectionsbetween dust, ocean biogeochemistry and climate. Science 308, 67–71.
Johnson, B.T., Osborne, S.R., 2011. Physical and optical properties of mineral dustaerosol measured by aircraft during the GERBILS campaign. Q. J. Roy. Meteorol.Soc. 137, 1117–1130.
Johnson, M.S., Meskhidze, N., Kiliyanpilakkil, V.P., 2012. A global comparison ofGEOS-Chem-predicted and remotely-sensed mineral dust aerosol optical depthand extinction profiles. J. Adv. Model. Earth Syst. 4.
Journet, E., Desbouefs, K., Caqineau, S., Colin, J.-L., 2008. Mineralogy as a criticalfactor of dust iron solubility. Geophys. Res. Lett. 35 (doi: 10.1029/2007GL031589).
Junge, C.E., 1977. Processes responsible for the trace content in precipitation. In:Isotopes and impurities in ice and snow, IAHSAISH Publ. 118, Int. Assoc. Hydrol.Sci. Grenoble.
Kandler, D., Schutz, L., Jackel, S., Lieke, K., Emmel, C., Mueller-Ebert, D., Ebert, M.,Scheuvens, D., Schladitz, A., Segvic, B., Wiedensohler, A., Weinbruch, S., 2011.Ground-based off-line aerosol measurements at Praia, Cape Verde during theSaharan Mineral Dust Experiment: microphysical properties and mineralogy.Tellus B 63, 459–474.
Kohfeld, K.E., Harrison, S.P., 2001. DIRTMAP: the geological record of dust. Earth-Sci.Rev. 54, 81–114.
Kalashnikova, O., Kahn, R.A., 2008. Mineral dust plume evolution over the Atlanticfrom MISR and MODIS aerosol retrievals. J. Geophys. Res. 113 (doi: 10.1029/2008JD010083).
Kandler, K., Schutz, L., Deutscher, C., Ebert, M., Hofmann, H., Jackel, S., Jaenicke, R.,Knippertz, P., Lieke, K., Massling, A., Petzold, A., Schladitz, A., Weinzierl, B.,Wiedensohler, A., Zorn, S., Weinbruch, S., 2009. Size distribution, massconcentration, chemical and mineralogical composition and derived opticalparameters of the boundary layer aerosol at Tinfou, Morocco, during SAMUM2006. Tellus Ser. B-Chem. Phys. Meteorol. 61, 32–50.
Karydis, V.A., Kumar, P., Barahona, D., Sokolik, I.N., and Nenes, A. 2011. On the effectof dust particles on global cloud condensation nuclei and cloud droplet number.J. Geophys. Res.-Atmos. 116, D23, doi:10.1029/2011JD016283.
Kohfeld, K., Ridgwell, A., 2009. Glacial-interglacial variability in atmospheric CO2,Surface ocean-lower atmosphere processes. Am Geophys. Union, 251–286.
Kok, J.F., 2011a. Does the size distribution of mineral dust aerosols depend on thewind speed at emission? Atmos. Chem. Phys. 11, 10149–10156.
Kok, J.F., 2011b. A scaling theory for the size distribution of emitted dust aerosolssuggests climate models underestimate the size of the global dust cycle. Proc.Nat. Acad. Sci. USA 108, 1016–1021.
Kok, J.F., Parteli, E.J.R., Michaels, T.I., Karam, D.B., 2012. The physics of wind-blownsand and dust. Rep. Prog. Phys. 75, 106901.
Koren, I., Kaufman, Y., Washington, R., Todd, M., Rudich, Y., Martins, J., Rosenfeld, D.,2006. The Bodele depression: a single spot in the Sahara that provides most ofhte mineral dust to the Amazon forest. Environ. Res. Lett. 1 (doi: 10.1088/1748-9326/1081/014005).
Koretsky, C., Sverjensky, D., Salisbury, J., D’Aria, D., 1997. Detection of surfacehydroxyl speies on quart, gamma-alumina and feldspars using diffusereflectance infrared spectroscopy. Geochim. Cosmochim. Acta 61, 2193–2210.
Krishnamurthy, A., Moore, J.K., Mahowald, N., Luo, C., Zender, C.S., 2010. TheImpacts of atmospheric nutrient inputs on marine biogeochemistry. J. Geophys.Res. 115 (doi: 10.1029/2009JG001115).
Kumar, P., Nenes, A., Sokolik, I., in press. The importance of adsoption for CCNactivity and hygroscopic properties of mineral dust aerosol. Geophy. Res. Lett.
Lawrence, C.R., Neff, J.C., 2009. The contemporary physical and chemical flux ofAeolian dust: a synthesis of direct measurements of dust deposition. Chem.Geol. 257, 46–63.
desert dust aerosols and its impact on the Earth system. Aeolian Research
18 N. Mahowald et al. / Aeolian Research xxx (2013) xxx–xxx
Lawrence, C.R., Painter, T.H., Landry, C.C., Neff, J.C., 2010. Contemporarygeochemical composition and flux of aeolian dust to the San Juan Mountains,Colorado, United States. J. Geophys. Res.-Biogeosci. 115.
Lee, I.K., Ingles, O.G., 1968. Soil mechanics selected topics. In: Lee, I.K. (Ed.), TheBrittle Failure of Unsaturated Soils, Stabilized Soils, and Rocks. Elsevier, NewYork, pp. 251–294.
Li, F., Vogelman, A., Ramanathan, V., 2004. Saharan dust aerosol radiative forcingmeasured from space. J. Clim. 17, 2558–2571.
Liao, H., Seinfeld, J.H., 1998. Radiative forcing by mineral dust aerosols: sensitivityto key variables. J. Geophys. Res. 103, 31637–31645.
Lim, J., Matsumoto, E., 2008. Estimation of aeolian dust flux on Cheju Island, Korea,during the Mid- to Late Holocene. Quatern. Int. 176–177, 104–111.
Liu, X., Easter, R., Ghan, S., Zaveri, R., Rasch, P., Shi, X., Lamarque, J.-F., Gettelman, A.,Morrison, H., Vitt, F., Conley, A., Park, S., Neale, R., Hannay, C., Eckman, A., Hess,P., Mahowald, N., Collins, W., Iacono, M., Bretherton, C., Flanner, M., Mitchell, D.,2011. Toward a minimal representation of aerosol direct and indirect effects:model description and evaluation. Geosci. Model Dev. Discuss. 4, 3485–3598.
Luo, C., Mahowald, N., Corral, J.d., 2003. Sensitivity study of meteorologicalparameters on mineral aerosol mobilization, transport and idstribution. J.Geophys. Res. 108 (4447), 44. http://dx.doi.org/10.1029/2003JD0003483.
Maher, B.A., Prospero, J.M., Mackie, D., Gaiero, D., Hesse, P.P., Balkanski, Y., 2010.Global connections between aeolian dust, climate and ocean biogeochemistryat the present day and at the last glacial maximum. Earth Sci. Rev. 99, 61–97.
Mahowald, N., Baker, A., Bergametti, G., Brooks, N., Duce, R., Jickells, T., Kubilay, N.,Prospero, J., Tegen, I., 2005. The atmospheric global dust cycle and iron inputs tothe ocean. Global Biogeochem. Cycles 19, GB4025, 4010.1029/2004GB002402.
Mahowald, N., Muhs, D., Levis, S., Rasch, P., Yoshioka, M., Zender, C., 2006. Change inatmospheric mineral aerosols in response to climate: last glacial period, pre-industrial, modern and doubled-carbon dioxide climates. J. Geophys. Res. 111,D10202 (doi: 10210.11029/12005JD006653).
Mahowald, N., Albani, S., Engelstaedter, S., Winckler, G., Goman, M., 2011a. Modelinsight into glacial-interglacial paleodust records. Quat. Sci. Rev. 30 (7–8), 832–854.
Mahowald, N., Ward, Daniel S., Kloster, Silvia, Flanner, Mark G., Heald, Colette L.,Heavens, Nicholas G., Hess, Peter G., Lamarque, Jean-Francois, Chuang, PatrickY., 2011b. Aerosol impacts on climate and biogeochemistry. Annu. Rev. Environ.Resour. 36, 45–74.
Mahowald, N., Engelstaedter, S., Luo, Chao, Sealy, Andrea, Artaxo, Paulo, Benitez-Nelson, Claudia, Bonnet, Sophie, Chen, Ying, Chuang, Patrick Y., Cohen, David D.,Dulac, Francois, Herut, Barak, Johansen, Anne M., Kubilay, Nilgun, Losno, Remi,Maenhaut, Willy, Paytan, Adina., Prospero, Joseph M., Shank, Lindsay M., Siefert,R.L., 2009. Atmospheric Iron deposition: global distribution, variability andhuman perturbations. Annu. Rev. Mar. Sci. 1, 245–278 (doi: 210.1146/annurev/marine.010908.163727).
Mahowald, N., Jickells, T.D., Alex R. Baker, P.A., Claudia R. Benitez-Nelson, GillesBergametti, Tami C. Bond, Ying Chen, David D. Cohen, Barak Herut, NilgunKubilay, Remi Losno, Chao Luo, Willy Maenhaut, Kenneth A. McGee, Gregory S.Okin, Ronald L. Siefert, Seigen Tsukuda, 2008. The global distribution ofatmospheric phosphorus deposition and anthropogenic impacts. GlobalBiogeochem. Cycles 22, doi:10.1029/2008GB003240.
Mahowald, N., Kiehl, L., 2003. Mineral aerosol and cloud interactiocns. Geophys.Res. Lett. 30, 10.109/2002GL016762.
Mahowald, N., Kloster, S., Engelstaedter, S., Moore, J.K., Mukhopadhyay, S.,McConnell, Albani S., Doney, S., Bhattacharya, A., Curran, M., Flanner, M.,Hoffman, F., Lawrence, D., Lindsay, K., Mayewski, P., Neff, J., Rothenberg, D.,Thomas, E., Thornton, P., Zender, C., 2010. Observed 20th century desert dustvariability: impact on climate and biogeochemistry. Atmos. Chem. Phys. 10,10875–10893.
Mahowald, N., Dufresne, J.-L., 2004. Sensitivity of TOMS aerosol index to boundarylayer height: implications for detection of mineral aerosol sources. Geophys.Res. Lett. 31 (doi: 10.1029/2003GL018865).
Maring, J., Savoie, D., Izaguirre, M., Custals, L., Reid, J., 2003. Mineral dust aerosolsize distribution change during atmospheric transport. J. Geophys. Res. 108,8592.
Marticorena, B., Bergametti, G., 1995. Modeling the atmospheric dust cycle: 1.Design of a soil-derived dust emission scheme. J. Geophys. Res. 100, 16,415–416,430.
Martin, J., Gordon, R.M., Fitzwater, S.E., 1991. The case for iron. Limnol. Oceanogr.36, 1793–1802.
Marx, S.K., McGowan, H.A., Kamber, B.S., 2009. Long-range dust transport fromeastern Australia: a proxy for Holocene aridity and ENSO-type climatevariability. Earth Planet. Sci. Lett. 282, 167–177.
Mason, J.A., Greene, R.S.B., Joeckel, R.M., 2011. Laser diffraction analysis of thedisintegration of Aeolian sedimentary aggregates in water. Catena 87, 107–118.
McConnell, C.L., Highwood, E.J., Coe, H., Formenti, P., Anderson, B., Osborne, S.,Nava, S., Desboeufs, K., Chen, G., Harrison, M.A.J., 2008. Seasonal variationsof the physical and optical characteristics of Saharan dust: Results from theDust Outflow and Deposition to the Ocean (DODO) experiment. J. Geophys.Res. 113.
McConnell, J.R., Aristarain, A.J., Banta, J.R., Edwards, P.R., Simões, J.C., 2007. 20thCentury doubling in dust archived in an Antarctic Peninsula ice core parallelsclimate change and desertification in South America. Proc. Nat. Acad. Sci. 104(14), 5743–5748 (doi: 10.1073/pnas.0607657104).
McTainsh, G.H., Lynch, A.W., Hales, R., 1997. Particle-size analysis of aeolian dusts,soils and sediments in very small quantities using a Coulter Multisizer. EarthSurf. Proc. Land. 22 (13), 1207–1216.
Please cite this article in press as: Mahowald, N., et al. The size distribution of(2013), http://dx.doi.org/10.1016/j.aeolia.2013.09.002
Miller, R., Tegen, I., 1998. Climate response to soil dust aerosols. Am. Meteorl. Soc.11, 3247–3267.
Miller, R., Tegen, I., Perlwitz, J., 2004. Surface radiative forcing by soil dust aerosolsand the hydrologic cycle. J. Geophys. Res. 109. http://dx.doi.org/10.1029/2003JD004085.
Miller, R.L., Cakmur, R.V., Perlwitz, J., Geogdzhayev, I.V., Ginoux, P., Koch, D.,Kohfeld, K.E., Prigent, C., Ruedy, R., Schmidt, G.A., Tegen, I., 2006. Mineral dustaerosols in the NASA goddard institute for space sciences ModelE atmosphericgeneral circulation model. J. Geophys. Res. 111, D06208.
Mishenko, M., Lacis, A., Carlson, B., Travis, L., 1995. Nonsphericity of dust-liketropospheric aerosols: implications for aerosol remote sensing and climatemodeling. Geophys. Res. Lett. 22. http://dx.doi.org/10.1029/1095GL00798.
Moore, J.K., Doney, S., Lindsay, K., Mahowald, N., Michaels, A., 2006. Nitrogenfixation amplifies the ocean biogeochemical response to decadal timesclaevariations in mineral dust deposition. Tellus 58B, 560–572.
Muhs, D.R., Ager, T.A., Bettis III, E.A., McGeehin, J., Been, J.M., Begét, J.A., Pavich, M.J.,Stafford Jr., T.W., Stevens, D.A.S.P., 2003. Stratigraphy and palaeoclimaticsignificance of late quaternary loess–palaeosol sequences of the lastinterglacial–glacial cycle in central Alaska. Quatern. Sci. Rev. 22, 1947–1986.
Mulitza, S., Heslop, D., Pittauerova, D., Fischer, H., Meyer, I., Stuut, J.-B., Zabel, M.,Mollenhauer, G., Collins, J., Kuhnert, H., Schulz, M., 2010. Increase in Africandust flux at the onset of commercial agriculture in the Sahel region. Nature 466(doi: 10.1038/nature09213, 09226-09228).
Muller, D., Lee, K.H., Gasteiger, J., Tesche, M., Weinzierl, B., Kandler, K., Muller, T.,Toledano, C., Otto, S., Althausen, D., Ansmann, A., 2012. Comparison of opticaland microphysical properties of pure Saharan mineral dust observed withAERONET Sun photometer, Raman lidar, and in situ instruments during SAMUM2006. J. Geophys. Res. 117, 25.
Nabat, P., Solmon, F., Mallet, M., Kok, J.F., Somot, S., 2012. Dust emission sizedistribution impact on aerosol budget and radiative forcing over theMediterranean region: a regional climate model approach. Atmos. Chem.Phys. 12, 10545–10567.
Neale, Richard B., Jadwiga Richter, Sungsu Park, Peter H. Lauritzen, Stephen J. Vavrus,Philip J. Rasch, Minghua Zhang, 2013: The Mean Climate of the CommunityAtmosphere Model (CAM4) in Forced SST and Fully Coupled Experiments. J. Clim.,26, 5150–5168. http://dx.doi.org/10.1175/JCLI-D-12-00236.1.
Neff, J.C. et al., 2008. Increasing eolian dust deposition in the western United Stateslinked to human activity. Nat. Geosci. 1 (3), 189–195 (doi: 10.1038/ngeo133).
Nenes, A., Krom, M., Mihalopoulos, N., VanCapellen, P., Shin, Z., Bougiatioti, A.,Zarmpas, P., Herut, B., 2010. Atmospheric acidification of mineral aerosols: asource of bioavailable phosphorus to the oceans. Atmos. Chem. Phys. Discuss.11, 6163–6185.
Okada, K., Heintzenberg, J., Kai, K.J., Qin, Y., 2001. Shape of atmospheric mineralparticles collected in three Chinese arid-regions. Geophys. Res. Lett. 28, 3123–3126.
Okin, G., Baker, A., Tegen, I., Mahowald, N., Dentener, F., Duce, R., Galloway, J.,Hunter, K., Kanakidou, M., Kubilay, N., Prospero, J., Sarin, M., Surpipith, V.,Uematsu, M., Zhu, T., 2011. Impacts of atmospheric nutrient deposition onmarine productivity: roles of nitrogen, phosphorus and iron. GlobalBiogeochem. Cycles 25 (doi: 10.1029/2010GB003858).
Okin, G., Mahowald, N., Chadwick, O., Artaxo, P., 2004. The impact of desert dust onthe biogeochemistry of phosphorus in terrestrial ecosystems. GlobalBiogeochem. Cycles 18, GB2005, doi:2010.1029/2003GB002145.
Okin, G.S., Mladenov, N., Wang, L., Cassel, D., Caylor, K.K., Ringros, S., Macko, S.A.,2008. Spatial pattern of soil nutrients in two southern African savannas. J.Geophys. Res. 111 (doi: 10.1029/2007JG000584).
Osborne, S.R., Johnson, B.T., Haywood, J.M., Baran, A.J., Harrison, M.A.J., McConnell,C.L., 2008. Physical and optical properties of mineral dust aerosol during theDust and Biomass-burning Experiment. J. Geophys. Res. 113, D00c03.
Painter, T., Barrett, A., Landry, C.C., Neff, J.C., Cassidy, M.P., Lawrence, C.R., McBride,K.E., Farmer, G.L., 2007. Impact of disturbed desert soils on duration ofmountain snow cover. Geophys. Res. Lett. 34 (doi: 10.1029/2007GL030284).
Patadia, F., Yang, E.-S., Christopher, S., 2009. Does dust change the clear sky top ofatmosphere shortwave flux over high surface reflectance regions? Geophys.Res. Lett. 36. http://dx.doi.org/10.1029/2009GL039092.
Perfect, E., Kay, B.D., 1995. Brittle-fracture of fractal cubic aggregates. Soil Sci. Soc.Am. J. 59, 969–974.
Petit, J.-R., Jouzel, J., Raynaud, D., Barkov, N.I., Barnola, J.-M., Basile, I., Bender, M.,Chappellaz, J., Davisk, M., Delaygue, G., Delmotte, M., Kotlyakov, V.M., Legrand,M., Lipenkov, V.Y., Lorius, C., Pepin, L., Ritz, C., Saltzmank, E., Stievenard, M.,1999. Climate and atmospheric history of the past 420,000 years from theVostok ice core, Antarctica. Nature 399, 429–436.
Perlwitz, J., Tegen, I., Miller, R., 2001. Interactive soil dust aerosol model in the GISSGCM 1. Sensitivity of the soil dust cycle to radiative properties of soil dustaerosols. Journal of Geophysical Research 106, 18,167–118,192.
Porter, S.C., An, Z.S., 1995. Correlation between climate events in the North Atlanticand China during the last glaciation. Nature 375, 305–308.
Prospero, J., Lamb, P., 2003. African droughts and dust transport to the Caribbean:climate change implications. Science 302, 1024–1027.
Prospero, J.M., 1996. Saharan dust transport over the North Atlantic Ocean andmediterranean: an overview. In: Guerzoni, S., Chester, R. (Eds.), The Impact ofDesert Dust Across the Mediterranean. Kluwer Academic Publishers,Netherlands, pp. 133–151.
Prospero, J.M., Barrett, K., Church, T., Dentener, F., Duce, R.A., Galloway II, J.N.,Moody, H.L.J., Quinn, P., 1996. Atmospheric deposition of nutrients to the NorthAtlantic Basin. Biogeochemistry 35, 27–73.
desert dust aerosols and its impact on the Earth system. Aeolian Research
N. Mahowald et al. / Aeolian Research xxx (2013) xxx–xxx 19
Prospero, J.M., Custals, L., 2012. Particle size distributions of Trade-Wind Africandust measured in the air and after dispersal in water. Eos Trans. AGU, FallMeeting (San Francisco, CA) Supplement PP21C-01.
Pye, K., 1995. The origin, nature and accumulation of loess. Quat. Sci. Rev. 14 (7–8),653–667.
Rasch, P.J., Feichter, H., Law, K., Mahowald, N., Penner, J., Benkovitz, C., Genthon, C.,Giannakopoulos, C., Kasibhatla, P., Koch, D., Levy, H., Maki, T., Prather, M.,Roberts, D.L., Roelofs, G.-J., Stevenson, D., Stockwell, Z., Taguchi, S., Chipperfield,M., Baldocchi, D., McMurry, P., Barrie, L., Balkanski, Y., Chatfield, B., Jacob, D.,Kritz, M., Lawrence, M., Lee, H.N., Leaitch, R., Lelieveld, J., Noone, K.J., Seinfeld, J.,Stenchikov, G., Schwarz, S., Walcek, C., Williamson, D., 2000. An assessment ofscavenging and deposition processes in global models: results from the WCRPCambridge workshop of 1995. Tellus 52B, 1025–1056.
Rea, D.K., 1994. The paleoclimatic record provided by eolian deposition in the deepsea: the geologic history of wind. Rev. Geophys. 32 (2), 159–195.
Rea, D.K., Hovan, S.A., 1995. Grain size distribution and depositional processes ofthe mineral component of abyssal sediments: lessons from the North Pacific.Paleoceanography 10 (2), 251–258.
Reid, E., Reid, J., Meier, M., Dunlap, M., Cliff, S., Broumas, A., Perry, K., Maring, H.,2003a. Characterization of African dust transported to Puerto Rico by individualparticle and size segregated bulk analysis. JGR-Atmos. 108 (doi: 10.1029/1200dJD002935).
Reid, J., Hobbs, P., Ferek, R., Blake, D., Martins, J., Dunlap, M., Liousse, C., 1998.Physical, chemical and optical properties of regional hazes dominated by smokein Brazil. JGR 103, 32059–32080.
Reid, J.S., Jonson, H., Maring, H., Smirnov, A., Savoie, D., Cliff, S., Reid, E., Livingston, J.,Meier, M., Dubovik, O., Tsay, S.-C., 2003b. Comparison of size and morphologicalmeasurements of dust particles from Africa. Journal of Geophysical Research108, 8593, doi:1029/2002JD002485.
Reid, J.S., Reid, E.A., Walker, A., Piketh, S., Cliff, S., Al Mandoos, A., Tsay, S.C., Eck, T.F.,2008. Dynamics of southwest Asian dust particle size characteristics withimplications for global dust research. J. Geophys. Res. 113.
Rosenfeld, D., Nirel, R., 1996. Seeding effectiveness-the interaction of desert dustand the southern margins of rain cloud systems in Isreal. J. Appl. Meteorol. 35,1502–1509.
Rosenfeld, D., Rudich, Y., Lahav, R., 2001. Desert dust suppressing precipitation: apossible desertification feedback loop. Proc. Natl. Acad. Sci. USA 98, 5975–5980.
Ruth, U., Wagenbach, D., Steffensen, J. P., Bigler, M., 2003. Continuous record ofmicroparticle concentration and size distribution in the central GreenlandNGRIP ice core during the last glacial period. J. Geophys. Res., vol. 108, NO. D3,doi:10.1029/2002JD002376.
Ryder, C.L., Highwood, E.J., Lai, T.M., Sodeman, H., Masham, J.H., 2013a. Impact ofatmospheric transport on the evolution of microphysical and optical propertiesof Saharan dust. Geophys. Res. Lett. 40.
Ryder, C.L., Highwood, E.J., Rosenberg, P.D., Trembath, J., Brooke, J.K., Bart, M., Dean,A., Crosier, J., Dorsey, J., Brindley, H., Banks, J., Marsham, J.H., McQuaid, J.B.,Sodemann, H., Washington, R., 2013b. Optical properties of Saharan dustaerosol and contribution from the coarse mode as measured during the Fennec2011 aircraft campaign. Atmos. Chem. Phys. 13, 303–325.
Schladitz, A., Muller, T., Nowak, A., Kandler, K., Lieke, K., Massling, A., Wiedensohler,A., 2011. In situ aerosol characterization at Cape Verde Part 1: particle numbersize distributions, hygroscopic growth and state of mixing of the marine andSaharan dust aerosol. Tellus Ser., B-Chem. Phys. Meteorol. 63, 531–548.
Schulz, M., Prospero, J., Baker, A., Dentener, F., Ickes, L., Liss, P., Mahowald, N.,Nickovic, S., Perez, C., Rodriguez, S., Sarin, M., Tegen, I., Duce, R., 2012. Theatmospheric transport and deposition of mineral aerosols to the ocean:implications for reseach needs. Environ. Sci. Technol. 46, 10390–10404 (doi:10310.11021/es300073u).
Seinfeld, J.H., Pandis, S.N., 1998. Atmospheric chemistry and physics: From airpollution to climate change. John Wiley & Sons Inc., New York.
Shao, Y., 2001. A model for mineral dust emission. J. Geophys. Res. 106, 20239–20254.
Shao, Y., Ishizuka, M., Mikami, M., Leys, J.F., 2011a. Parameterization of size-resolved dust emission and validation with measurements. J. Geophys. Res. 116,D08203.
Shao, Y., Wyrwoll, K.-H., Chappel, A., Huang, J., Lin, Z., McTainsh, G., Mikami, M.,Tanaka, T., Wang, X., Yoon, S., 2011b. Dust cycle: an emerging core theme inearth system science. Aeolian Res. 2, 181–204.
Shao, Y.P., 2004. Simplification of a dust emission scheme and comparison withdata. J. Geophys. Res. 109.
Sholkovitz, E., Sedwick, P., Church, T., Baker, A., Powell, C., 2012. Fractional solubilityof aerosol iron: synthesis of a global-scale data set. Geochim. Cosmochim. Acta89, 173–189.
Slinn, S.A., Slinn, W.G.N., 1980. Predictions for particle deposition on natural waters.Atmos. Environ. 14, 1013–1016.
Sow, M., Alfaro, S.C., Rajot, J.L., 2011. Comparison of the size-resolved dust emissionfluxes measured over a Sahelian source with the dust production model (DPM)predictions. Atmos. Chem. Phys. Discuss. 11, 11077–11107.
Sow, M., Alfaro, S.C., Rajot, J.L., Marticorena, B., 2009. Size resolved dust emissionfluxes measured in Niger during 3 dust storms of the AMMA experiment.Atmos. Chem. Phys. 9, 3881–3891.
Please cite this article in press as: Mahowald, N., et al. The size distribution of(2013), http://dx.doi.org/10.1016/j.aeolia.2013.09.002
Steffensen, J.P., 1997. The size distribution of microparticles from selected segmentsof the Greenland Ice Core Project ice core representing different climaticperiods. J. Geophys. Res. 102, C12, 26,755–26,763.
Stuut, J.B., Zabel, M., Ratmeier, V., Helmke, P., Schefuss, E., Lavik, G., Schneide, R.,2005. Provenance of present day eolian dust collected off NW Africa. J. Geophys.Res. 110, D4 (doi: 10.1029/2004JD005161).
Su, L., Toon, O., 2009. Numerical simulations of Asian dust storms using a coupledclimate-aerosol microphysical model. J. Geophys. Res. 114 (doi: 10.1029/2008JD010956).
Swap, R., Garstang, M., Greco, S., Talbot, R., Kallberg, P., 1992. Saharan dust in theAmazon Basin. Tellus 44B, 133–149.
Tegen, I., Fung, I., 1994. Modeling of mineral dust in the atmosphere: Sources,transport, and optical thickness. J. Geophys. Res. 99, 22,897–822,914.
Tegen, I., Hollrig, P., Chin, M., Fung, I., Jacob, D., Penner, J., 1997. Contribution ofdifferent aerosol species to the global aerosol extinction optical thickness:Estimates from model results. J. Geophys. Res. 102, 23,895–823,915, October827 1997.
Tegen, I., Lacis, A.A., 1996. Modeling of particle size distribution and its influence onthe radiative properties of mineral dust aerosol. J. Geophys. Res. 101, 19237–19244.
Tjallingii, R., Claussen, M., Stuut, J.-B., Fohlmeister, J., Jahn, A., Bickert, T., Lamy, F.,Rohl, U., 2008. Coherent high- and low-latitude control of the northwest Africanhydrological balance. Nat. Geosci. 1, 670–675.
Todd, M.C., Washington, R., Martins, J.V., Dubovik, O., Lizcano, G., M’Bainayel, S.,Engelstaedter, S., 2007. Mineral dust emission from the Bodele Depression,northern Chad, during BoDEx 2005. J. Geophys. Res.-Atmos., 112, D06207.
van den Heever, S., Carrio, G., Cotton, W., DeMott, P., Prenni, A., 2006. Impacts ofnucleating aerosols on Florida convection. Part 1: Mesoscale simulations. J.Atmos. Sci. 63, 1752–1775.
Vitousek, P., 1984. Litterfall, nutrient cycling and nutrient limitations in tropicalforests. Ecology 65, 285–298.
Wang, X., Doherty, S.J., Huang, J., 2013. Black carbon and other light-absorbingimpurities in snow across Northern China. J. Geophys. Res. 118 (3), 1471–1492(doi: 10.1029/2012JD018291).
Washington, R., Todd, M.C., Engelstaedter, S., Mbainayel, S., Mitchell, F., Dust andthe low-level circulation over the Bodele depression, Chad: observations fromBoDEx 2005. J. Geophys. Res.-Atmos. 111, D03201.
Weidenohler, A. et al., 2012. Mobility particle size spectrometers: harmonization oftechnical standards and data structure to facilitate high quality long-termobservations of atmospheric particle number size distributions. Atmos. Meas.Technol. 5, 657–685.
Weinzierl, B., Petzold, A., Esselborn, M., Wirth, M., Rasp, K., Kandler, K., Schutz, L.,Koepke, P., Fiebig, M., 2009. Airborne measurements of dust layer properties,particle size distribution and mixing state of Saharan dust during SAMUM 2006.Tellus Ser., B-Chem. Phys. Meteorol. 61, 96–117.
Weltje, G.J., 1997. Algorithms for solving the explicit mixing problem. Math. Geol.29 (4), 503–550.
Xiao, J., Porter, S.C., An, Z., Kumai, H., Yoshikawa, S., 1995. Grain size of quartz as anindicator of winter monsoon strength on the Loess Plateau of central Chinaduring the last 130,000 yr. Quatern. Res. 43 (1), 22–29.
Xu, J. et al., 2010. A 108.83-m ice-core record of atmospheric dust deposition at Mt.Qomolangma (Everest), Central Himalaya. Quatern. Res. 73 (1), 33–38 (doi:10.1016/j.yqres.2009.09.005).
Yoshioka, M., Mahowald, N., Conley, A., Collins, W., Fillmore, D., Coleman, D., 2007.Impact of desert dust radiative forcing on Sahel precipitation: relativeimportance of dust compared to sea surface temperature variations,vegetation changes and greenhouse gas warming. J. Clim. 20, 1445–1467.
Yu, H., Chin, M., Remer, L., Kleideman, R., Bellouin, N., Bian, H., Diehl, T., 2009.Variabilty of marine aerosol fine-mode fraction and estimates of anthropogenicaerosol component over cloud-free oceans from the Moderate ResolutionImaging Spectroradiometer (MODIS). J. Geophys. Res. 114. http://dx.doi.org/10.1029/2008JD010648.
Zender, C., Bian, H., Newman, D., 2003. Mineral dust entrainment and deposition(DEAD) model: description and 1990s dust climatology. J. Geophys. Res. 108,4416 (doi: 4410.1029/2002JD002775).
Zender, C., Miller, R., Tegen, I., 2004. Quantifying mineral dust mass budgets:terminology, constraints and current estimates. EOS 85, 509–512.
Zhang, L., Kok, J.F., Henze, D.K., Li, Q., Zhao, C., 2013. Improving simulations of finedust surface concentrations over the Western United States by optimizing theparticle size distribution. Geophys. Res. Lett. 40, 3270–3275.
Zielinski, G.A., Mershon, G.R., 1997. Paleoenvironmental implications of theinsoluble microparticle record in the GISP2 (Greenland) ice core during therapidly changing climate of the Pleistocene–Holocene transition. Geol. Soc. Am.Bull. 109 (5), 547–559.
Zhao, C., Liu, X., Leung, L.R., Johnson, B., McFarlane, S.A., Gustafson, W.I., Fast, J.D.,Easter, R., 2010. The spatial distribution of mineral dust and its shortwaveradiative forcing over North Africa: modeling sensitivities to dust emissions andaerosol size treatments. Atmos. Chem. Phys. 10, 8821–8838.
Zobeck, T.M., Gill, T.E., Popham, T.W., 1999. A two-parameter Weibull function todescribe airborne dust particle size distributions. Earth Surf. Proc. Landforms24, 943–955.
desert dust aerosols and its impact on the Earth system. Aeolian Research
Related Documents