417 [ Journal of Political Economy, 2009, vol. 117, no. 3] 2009 by The University of Chicago. All rights reserved. 0022-3808/2009/11703-0002$10.00 The Simple Economics of Extortion: Evidence from Trucking in Aceh Benjamin A. Olken Massachusetts Institute of Technology and National Bureau of Economic Research Patrick Barron World Bank This paper tests whether the behavior of corrupt officials is consistent with standard industrial organization theory. We designed a study in which surveyors accompanied Indonesian truck drivers on 304 trips, during which they observed over 6,000 illegal payments to police, soldiers, and weigh station attendants. Using plausibly exogenous changes in the number of checkpoints, we show that market structure affects the level of illegal payments. We further show that corrupt officials use complex pricing schemes, including third-degree price discrimination and a menu of two-part tariffs. Our findings illustrate the importance of considering the market structure for bribes when designing anticorruption policy. We thank David Abrams, Tim Bresnahan, Liran Einav, Amy Finkelstein, Asim Khwaja, Michael Kremer, Steve Levitt, Jesse Shapiro, Andrei Shleifer, Justin Wolfers, Elmar Wolf- stetter, two anonymous referees, and numerous seminar participants for helpful comments. Special thanks are due to Yuhki Tajima for outstanding research assistance and to Scott Guggenheim for his support and assistance throughout the project. The field work would have been impossible without the dedication of Zejd Muhammad and numerous field surveyors. Kevin Evans and his team at the Aceh Rehabilitation and Reconstruction Board (BRR) provided assistance. We also thank the many people from the Aceh Monitoring Mission (AMM) who provided information on troop and police withdrawals and general assistance and support. This project was supported by World Bank trust funds from the Royal Netherlands Embassy in Jakarta and the British Department for International De- velopment (DfID) and was conducted with the support of the BRR, the Decentralization Support Facility (DSF), and the World Bank. All views expressed are those of the authors and do not necessarily reflect the opinions of BRR, the Royal Netherlands Embassy, DfID, DSF, or the World Bank.

Welcome message from author
This document is posted to help you gain knowledge. Please leave a comment to let me know what you think about it! Share it to your friends and learn new things together.
Transcript
417
[ Journal of Political Economy, 2009, vol. 117, no. 3]� 2009 by The University of Chicago. All rights reserved. 0022-3808/2009/11703-0002$10.00
The Simple Economics of Extortion: Evidence
from Trucking in Aceh
Benjamin A. OlkenMassachusetts Institute of Technology and National Bureau of Economic Research
Patrick BarronWorld Bank
This paper tests whether the behavior of corrupt officials is consistentwith standard industrial organization theory. We designed a study inwhich surveyors accompanied Indonesian truck drivers on 304 trips,during which they observed over 6,000 illegal payments to police,soldiers, and weigh station attendants. Using plausibly exogenouschanges in the number of checkpoints, we show that market structureaffects the level of illegal payments. We further show that corruptofficials use complex pricing schemes, including third-degree pricediscrimination and a menu of two-part tariffs. Our findings illustratethe importance of considering the market structure for bribes whendesigning anticorruption policy.
We thank David Abrams, Tim Bresnahan, Liran Einav, Amy Finkelstein, Asim Khwaja,Michael Kremer, Steve Levitt, Jesse Shapiro, Andrei Shleifer, Justin Wolfers, Elmar Wolf-stetter, two anonymous referees, and numerous seminar participants for helpful comments.Special thanks are due to Yuhki Tajima for outstanding research assistance and to ScottGuggenheim for his support and assistance throughout the project. The field work wouldhave been impossible without the dedication of Zejd Muhammad and numerous fieldsurveyors. Kevin Evans and his team at the Aceh Rehabilitation and Reconstruction Board(BRR) provided assistance. We also thank the many people from the Aceh MonitoringMission (AMM) who provided information on troop and police withdrawals and generalassistance and support. This project was supported by World Bank trust funds from theRoyal Netherlands Embassy in Jakarta and the British Department for International De-velopment (DfID) and was conducted with the support of the BRR, the DecentralizationSupport Facility (DSF), and the World Bank. All views expressed are those of the authorsand do not necessarily reflect the opinions of BRR, the Royal Netherlands Embassy, DfID,DSF, or the World Bank.
418 journal of political economy
I. Introduction
Most theoretical and empirical work on corruption focuses on a singletransaction: potentially corrupt officials weigh the benefits from cor-ruption against the expected punishments if they are caught and chooseaccordingly. However, the level of corruption may also be influencedby market forces. In this view, first articulated by Shleifer and Vishny(1993), corrupt officials behave like profit-maximizing firms, and thelevel of corruption is determined by the structure of the “market” forbribes, the elasticity of demand for the officials’ services, and the degreeto which corrupt officials can coordinate with one another in settingprices.
This paper takes the market forces view of corruption seriously andexamines the degree to which standard pricing theories from industrialorganization are consistent with actual patterns of bribes and extortionpayments. We study these questions in the context of bribes paid bytruck drivers to police, soldiers, and weigh station attendants on theirtrips to and from the Indonesian province of Aceh.
To investigate these payments, we designed a study in which enu-merators accompanied truck drivers on 304 trips to and from Aceh,directly observing more than 6,000 illegal payments. To the best of ourknowledge, this represents the first large-scale survey that has ever di-rectly observed bribes in the field.1 On average, drivers spent aboutUS$40 per trip, or about 13 percent of the total cost of a trip, on bribes,extortion, and protection payments.
Using these data, we first examine how the bribes charged at check-points respond to changes in market structure. During the period westudy, the Indonesian government withdrew over 30,000 police and mil-itary from Aceh province in accordance with a peace agreement signedearlier in the year to end a 30-year civil war between separatists and theIndonesian government. Since the troops and police that were with-drawn manned many of the checkpoints that extracted payments fromtruck drivers, this withdrawal represents a plausibly exogenous changein the market structure for illegal payments. Moreover, the roads to andfrom Aceh pass through two provinces, Aceh and North Sumatra,whereas the military withdrawal affected troops and police stationedonly in Aceh province. We therefore examine how the bribes charged
1 The only other data set consisting of observed bribe payments, as opposed to reportedbribe payments, is the one used in the study by McMillan and Zoido (2004), which consistsof videotapes the bribe giver (Vladimiro Montesinos Torres, the head of Peruvian intel-ligence under President Alberto Fujimori) took to help him maintain leverage over briberecipients later on. Much of the other recent work with objective measures of corruptionfocuses on graft and tax evasion, not bribes (e.g., Di Tella and Schargrodsky 2003; Fismanand Wei 2004; Reinnika and Svensson 2004; Hsieh and Moretti 2006; Olken 2007; Yang,forthcoming), though this work suggests the presence of bribes.

economics of extortion 419
in North Sumatra changed in response to the reduction in checkpointsin Aceh to examine how bribes respond to market forces.
We find that the average bribe paid in North Sumatra increased sig-nificantly in response to the reduction in the number of checkpointsin Aceh. Specifically, the elasticity of the average bribe paid at a check-point in North Sumatra province with respect to the expected totalnumber of checkpoints encountered along a trip is between �0.54 and�0.81. These results provide evidence for the Shleifer-Vishny view thatthe market structure has a substantial impact on the amount of bribescharged.
Second, since a driver needs to successfully pass all checkpoints ona route in order for the journey to be completed, the amount of surplusto be extracted by officials at checkpoints at the beginning of the tripmay differ from the amount of surplus to be extracted at the end ofthe trip. If prices are not fully set in advance, this will translate intosystematic differences in bribes paid at different points in the route. Wefirst show that different officials have different amounts of bargainingpower and, indeed, that prices are in part set through ex post bargainingrather than being fully determined ex ante. Then, taking advantage ofthe fact that our data include trips in both directions, we show that,consistent with the holdup theory, “downstream” checkpoints—that is,those that are closest to the final destination—receive higher bribesthan “upstream” checkpoints—that is, those that are closer to the originof the trip.
Third, we show that corrupt officials practice several types of pricediscrimination. Officials at checkpoints appear to practice third-degreeprice discrimination, charging higher prices to those drivers with ob-servable characteristics that indicate a higher willingness to pay, suchas those driving newer trucks or carrying valuable cargo. Moreover,officials at one weigh station have implemented a complex system ofsecond-degree price discrimination, involving a coupon system wherebydrivers self-select, before the trip starts, into one of multiple two-parttariffs. The fact that such types of price discrimination exist suggeststhat the illegal nature of the market does not prevent the emergenceof quite sophisticated contracts.
The remainder of the paper is organized as follows. Section II de-scribes the setting in more detail. Section III describes the data collec-tion and presents descriptive statistics. Section IV examines the degreeto which market structure affects the level of bribe payments. SectionV examines price discrimination. Section VI presents conclusions.
420 journal of political economy
II. Setting
A. Trucking in Aceh
The data in this study come from the two Indonesian provinces locatedat the northern tip of the island of Sumatra, the province of NanggroeAceh Darussalam (hereafter referred to as Aceh) and the province ofNorth Sumatra. Aceh was the site of the December 2004 tsunami, whichkilled an estimated 167,000 people. It was also the site of a 30-year civilwar between the separatist Free Aceh Movement (GAM in Indonesian)and the Indonesian government, which ended with the signing of apeace agreement in August 2005.
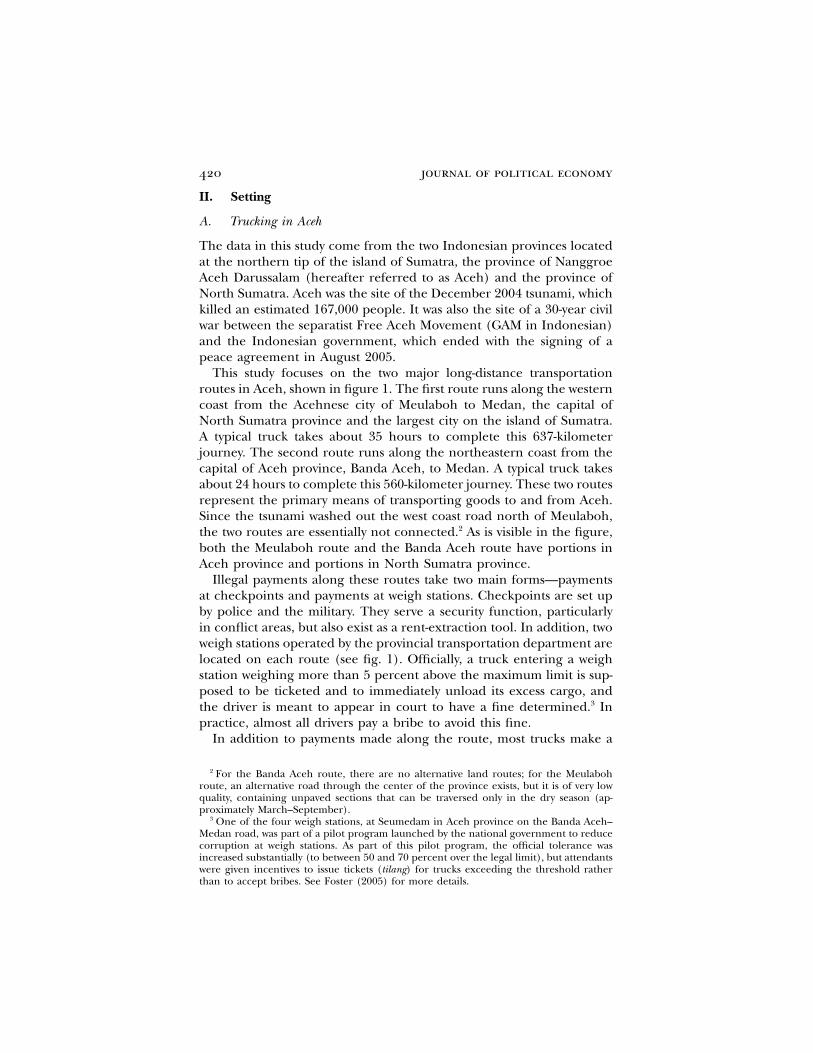
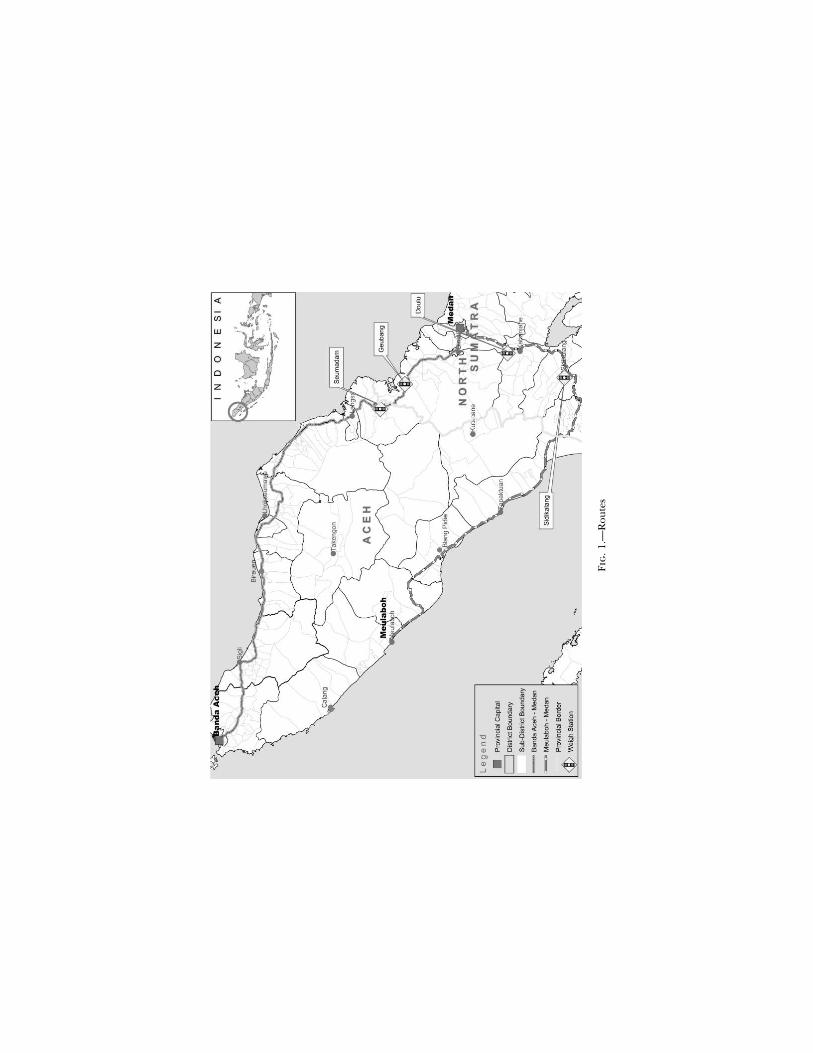
This study focuses on the two major long-distance transportationroutes in Aceh, shown in figure 1. The first route runs along the westerncoast from the Acehnese city of Meulaboh to Medan, the capital ofNorth Sumatra province and the largest city on the island of Sumatra.A typical truck takes about 35 hours to complete this 637-kilometerjourney. The second route runs along the northeastern coast from thecapital of Aceh province, Banda Aceh, to Medan. A typical truck takesabout 24 hours to complete this 560-kilometer journey. These two routesrepresent the primary means of transporting goods to and from Aceh.Since the tsunami washed out the west coast road north of Meulaboh,the two routes are essentially not connected.2 As is visible in the figure,both the Meulaboh route and the Banda Aceh route have portions inAceh province and portions in North Sumatra province.
Illegal payments along these routes take two main forms—paymentsat checkpoints and payments at weigh stations. Checkpoints are set upby police and the military. They serve a security function, particularlyin conflict areas, but also exist as a rent-extraction tool. In addition, twoweigh stations operated by the provincial transportation department arelocated on each route (see fig. 1). Officially, a truck entering a weighstation weighing more than 5 percent above the maximum limit is sup-posed to be ticketed and to immediately unload its excess cargo, andthe driver is meant to appear in court to have a fine determined.3 Inpractice, almost all drivers pay a bribe to avoid this fine.
In addition to payments made along the route, most trucks make a
2 For the Banda Aceh route, there are no alternative land routes; for the Meulabohroute, an alternative road through the center of the province exists, but it is of very lowquality, containing unpaved sections that can be traversed only in the dry season (ap-proximately March–September).
3 One of the four weigh stations, at Seumedam in Aceh province on the Banda Aceh–Medan road, was part of a pilot program launched by the national government to reducecorruption at weigh stations. As part of this pilot program, the official tolerance wasincreased substantially (to between 50 and 70 percent over the legal limit), but attendantswere given incentives to issue tickets (tilang) for trucks exceeding the threshold ratherthan to accept bribes. See Foster (2005) for more details.
Fig
.1.
—R
oute
s
422 journal of political economy
regular monthly payment to a criminal organization for protection pur-poses; those firms that do not run the risk of their trucks being hijackedand the cargo stolen. Trucks also pay police and/or the military in orderto travel as part of a protected convoy.4
B. Military Presence in Aceh
Intermittent military conflicts between the Indonesian Army and theseparatist GAM occurred from the mid-1970s until the signing of thepeace agreement in August 2005. At the time the peace agreement wassigned, 55,480 police and military were in Aceh. These were dividedamong three primary groups: the army (TNI), the militarized police(Brimob), and the regular police force (Polri).
As a result of the peace agreement, 31,690 military and police per-sonnel were withdrawn from Aceh in four waves, from September 2005to January 2006. Since there was no longer personnel to staff many ofthe checkpoints after the troops withdrew, the withdrawal provides asource of plausibly exogenous variation in the number of checkpointsand, hence, in the market structure for bribes. These withdrawals af-fected only checkpoints in Aceh province; there was no change in theallocation of troops or police in North Sumatra province during thistime. We obtained data on army withdrawals from each district fromthe EU-led Aceh Monitoring Mission (AMM) and data on police andmilitarized police withdrawals from the provincial police command inBanda Aceh.5
III. Data
A. Data Collection
We collected data on bribes by having locally recruited Acehnese sur-veyors accompany drivers on their regular routes. Data were collectedbetween November 2005 and July 2006 and so encompass the third and
4 Convoys were run by the army, the militarized police (Brimob), and the military policefor a fee of between 300,000 and 600,000 rupiah (US$32–$64). Convoys supposedly pro-vided protection from GAM rebels, although the rebels were no longer active by the timeour survey began. Convoys were used by trucks traveling from Banda Aceh to Medan(many of which were carrying scrap metal of questionable legal status) and by truckstraveling in both directions on the Medan–Meulaboh route (until March 2006). The resultsin the paper are similar if we restrict the data to the period in which all trucks on theMeulaboh route used convoys.
5 The AMM data are broken down by AMM’s 12 subregions, whereas the police dataare available for each of Aceh’s 21 districts. When we use the AMM data at the districtlevel, we allocate troops in each AMM subregion to districts in the same proportions inwhich police are allocated to those districts. Conducting all the analysis at the AMMsubregion level rather than the district level does not substantively change the results.
economics of extortion 423
fourth waves of the military withdrawal as well as a substantial postperiod.Surveyors recorded the time, location, and amount paid at every check-point and weigh station.6 At each checkpoint, they noted the organi-zation manning the checkpoint (police, army, etc.), the number of of-ficers visible, and whether any officers were visibly carrying a gun. Theyalso recorded detailed information about other expenditures, the weightof the truck reported at the weigh stations, and characteristics aboutthe truck and the driver. Drivers were aware of the surveyor, but sincetruck drivers usually have at least one assistant anyway, the surveyorsblended in and those manning the checkpoints were, to the best of ourknowledge, unaware of their presence.
Owing to the clandestine nature of the survey and the military oc-cupation under way when the survey began, we could not obtain a strictlyrandom sample of trucks operating on the routes. Instead, we soughtout several cooperative firms on each route that agreed to let our sur-veyors accompany their drivers. Within firms, enumerators accompaniedwhichever driver was next departing, provided that the driver gave per-mission, that the surveyor had not ridden with that driver in the previousmonth, that the truck was transporting cargo rather than travelingempty, and that no other surveyor was departing with the same firm onthe same day. The survey is therefore approximately representative ofthe trips undertaken by these particular firms but is not necessarilyrepresentative of all trucks traveling on the route.7
There are advantages and disadvantages of obtaining data by directobservation. In interviews, drivers usually cannot remember the preciselocations of checkpoints or even the total number of checkpoints. Driv-ers may also exaggerate bribe payments in the hopes of extracting moremoney from their bosses.8 Direct observation ameliorates these prob-lems but raises concerns about Hawthorne effects: that is, drivers may
6 In most cases, the surveyor directly observed the amount paid. This occurred whenthe payment was in-kind (e.g., one or two packets of cigarettes), when the driver countedout the money in front of the surveyor, or when the driver gave the money to his assistant,who in turn gave it to the officer. In those cases in which the actual transaction was notdirectly observed, the surveyor asked the driver for the amount paid.
7 For the Meulaboh road, we expect that we have a roughly random sample of trips,since there are few firms and they do not appear to be differentiated in terms of thegoods they transport. For the Banda Aceh road, certain types of goods, such as timber,are carried by special trucks and hence are not included in our survey. In addition toexcluding empty trucks, which pay few bribes, our survey also did not include humanitarianaid to tsunami victims, which was often sent in special convoys and was typically exemptfrom bribe payments. We focused on non-tsunami, nonempty trucks in order to maximizeour statistical power to detect changes in bribe payments.
8 In fact, we compared the amount of bribes we observed on 40 trips between January25, 2006, and February 20, 2006, with 12 interviews we conducted around the same timewith drivers who had just completed their trips, and we found that on average the bribesdrivers reported in interviews were more than double the amount of the bribes we recordedby direct observation.
424 journal of political economy
change their bribe decisions because they are observed. Several reasons,however, suggest that Hawthorne effects will have a minimal impact onthis study. First, the truck driver is the residual claimant for all bribepayments: the driver receives a flat payment for all expenses on theroad, including bribes, and keeps whatever remains. Under all circum-stances, he has a strong incentive to minimize bribe payments. Second,there is no stigma or risk associated with making these types of illegalpayments since they are completely common and well known. Mostimportant, any Hawthorne effects would be constant, affecting the levelsof our reported bribe payments, but not affecting our analysis of thedifferences in bribe payments across checkpoints, trips, or routes.
The survey was kept entirely secret until April 4, 2006, when thepreliminary time-series results for the Banda Aceh–Medan route werereleased at a joint Aceh Reconstruction and Rehabilitation Agency(BRR)–World Bank press conference in Banda Aceh.9 The press con-ference generated substantial media attention in Aceh province: theresults and reaction to the study were the lead story of the Aceh pro-vincial newspaper, Serambi, for 4 days, including a reporter’s own exposeof bribes on the Meulaboh road. In our data, the number of checkpointsin Aceh province fell by more than 25 percent starting about 2 weeksafter the press conference took place, suggesting that publicizing cor-ruption may play an important role in reducing it (Ferraz and Finan2008).10 Despite the publicity, surveyors were able to continue collectingdata unobserved.
B. Descriptive Statistics
Summary statistics are presented in table 1. The table indicates that theaverage marginal cost of a one-way trip was approximately Rp. 3 million(US$325).11 Of these costs, fuel represents the largest component (about53 percent). The remainder is attributable to loading and unloading
9 As we show below, the main results are robust to limiting the sample to the pre–pressconference period (i.e., before April 4, 2006).
10 To estimate the impact of the press conference, we restricted the data to a 3-monthperiod before and after the press conference and ran a regression of the number ofcheckpoints on a time trend and a post–press conference dummy. The results suggestthat the number of checkpoints fell by 3.5 on the Meulaboh road and 1.2 on the BandaAceh road following the press conference, although the results are sensitive to specification(results available on request). Qualitative evidence confirms that there was indeed a policecrackdown 2 weeks after the press conference: on April 19, 2006 (2 weeks after the pressconference), Serambi reported that the Aceh police conducted a raid to shut down acheckpoint illegally collecting bribes in Aceh Timur district (Serambi, April 22, 2008).
11 All prices have been normalized to October 2006 prices using monthly consumerprice index data, though doing so does not meaningfully change any of the results sinceannual inflation rates over the period averaged only 6 percent.
economics of extortion 425
TABLE 1Summary Statistics
Both Roads(1)
MeulabohRoad(2)
Banda AcehRoad(3)
Total expenditures during trip (rupiah) 2,901,345 2,932,687 2,863,637(725,003) (561,736) (883,308)
Bribes, extortion, and protectionpayments 361,323 415,263 296,427
(182,563) (180,928) (162,896)Payments at checkpoints 131,876 201,671 47,905
(106,386) (85,203) (57,293)Payments at weigh stations 79,195 61,461 100,531
(79,405) (43,090) (104,277)Convoy fees 131,404 152,131 106,468
(176,689) (147,927) (203,875)Coupons/protection fees 18,848 . . . 41,524
(57,593) (79,937)Fuel 1,553,712 1,434,608 1,697,010
(477,207) (222,493) (637,442)Salary for truck driver and assistant 275,058 325,514 214,353
(124,685) (139,233) (65,132)Loading and unloading of cargo 421,408 471,182 361,523
(336,904) (298,246) (370,621)Food, lodging, etc. 148,872 124,649 178,016
(70,807) (59,067) (72,956)Other 140,971 161,471 116,308
(194,728) (236,202) (124,755)Number of checkpoints 20 27 11
(13) (12) (6)Average payment at checkpoint 6,262 7,769 4,421
(3,809) (1,780) (4,722)Number of trips 282 154 128
Note.—Standard deviations are in parentheses. Summary statistics include only those trips for which salary informationwas available. All figures are in October 2006 rupiah (US$1.00 p Rp. 9,200).
of cargo (14 percent), illegal payments (13 percent), salaries (10 per-cent), and food and lodging (5 percent).
The magnitude and composition of illegal payments vary substantiallyacross the two routes, as can be seen by comparing columns 2 and 3 oftable 1. Checkpoints were much more important on the Meulaboh road:the average Meulaboh trip stopped at more than double the numberof checkpoints (27 vs.11) and paid nearly four times as much at check-points (US$23 vs. US$5) as the average Banda Aceh trip. Conversely,weigh station payments appear much more substantial on the BandaAceh route than on the Meulaboh route.
1. Checkpoints
Transactions at checkpoints work as follows. The officer manning thecheckpoint flags down trucks (or, anticipating this, in 30 percent of
426 journal of political economy
cases, drivers stop on their own). The driver offers the officer a paymentof Rp. 5,000–Rp. 10,000 (US$0.55–$1.10). On the Banda Aceh route,these payments are in cash; on the Meulaboh route, they often take theform of one or two packets of cigarettes. The officer usually accepts theoffer; in only 13 percent of cases does he reject the offer and try tobargain for more. If no payment is made, the officer may chase thetruck down and harass the driver, either physically (drivers have reportedbeing beaten for failing to pay bribes or for offering too little), bydelaying the truck, or by finding a violation and issuing a ticket, whichrequires the driver to come to court and lose several days of work.
These payments appear closer to outright extortion (or, perhaps lesspejoratively, to a toll) than to bribes paid to avoid a fine. In fact, outof the 5,387 checkpoint transactions in which we observed money chang-ing hands, on only 21 occasions—that is, less than 0.5 percent of alltransactions—did the officer even mention a specific violation. Instead,in most cases, the driver simply handed over the payment without dis-cussion and continued on his way.12
An interesting question is whether drivers know the “going price” foreach checkpoint or simply make the same offer everywhere. A decom-position of variance of checkpoint payments shows that the majority ofthe variance comes within trips rather than between trips (the within-trip standard deviation of log bribes is 0.83, whereas the between-tripstandard deviation is 0.32). This suggests that drivers tailor their offersto each checkpoint. Moreover, across all trips, the variation betweencheckpoints is larger than the variation within checkpoints (standarddeviation of 0.68 between checkpoints compared to only 0.58 withincheckpoints). These facts suggest that drivers vary their offers check-point by checkpoint in systematically similar ways.
2. Weigh Stations
In equilibrium, almost all trucks operate overweight: in our data, 84percent of trucks weighed more than 5 percent above the limit, and 42percent weighted more than 50 percent above the limit. At weigh sta-tions, however, only 3 percent of these trucks received a ticket; instead,the remaining truck drivers paid a bribe at the weigh station to avoidpenalties.
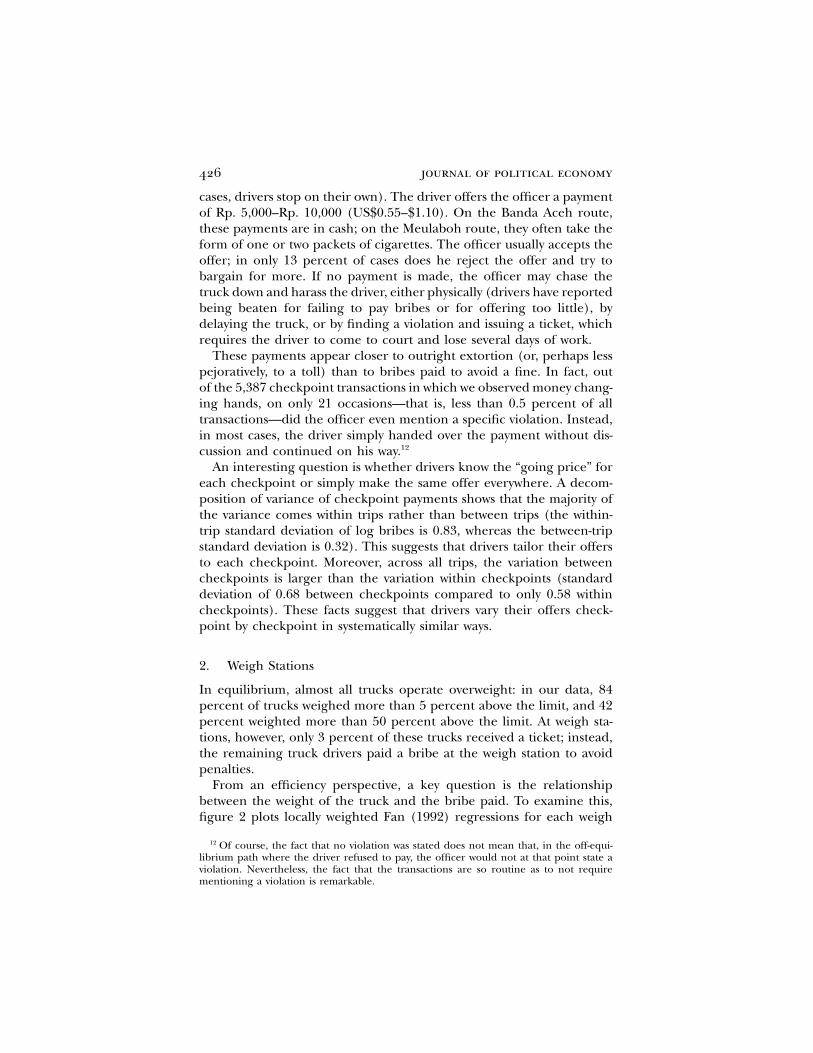
From an efficiency perspective, a key question is the relationshipbetween the weight of the truck and the bribe paid. To examine this,figure 2 plots locally weighted Fan (1992) regressions for each weigh
12 Of course, the fact that no violation was stated does not mean that, in the off-equi-librium path where the driver refused to pay, the officer would not at that point state aviolation. Nevertheless, the fact that the transactions are so routine as to not requirementioning a violation is remarkable.
economics of extortion 427
Fig. 2.—Payments at weigh stations. Each graph shows the results of a nonparametricFan (1992) locally weighted regression, where the dependent variable is the amount ofbribe paid at the weigh station and the independent variable is the number of tons thetruck is overweight. The bandwidth is equal to one-third of the range of the independentvariable. Bootstrapped 95 percent confidence intervals are shown in dashes, where boot-strapping is clustered by trip. When the dashed lines are not shown, it indicates that the95 percent confidence interval exceeds the y-axis of the graph.
station, where the dependent variable is the total bribe paid at the weighstation and the independent variable is the number of tons the truckis overweight. Figure 2 shows that, at all four weigh stations, bribesincrease in the amount the truck is overweight.13 On average, driverspay Rp. 3,345 (US$0.36) for each additional ton overweight. This pos-itive relationship means that, although official fines are almost neverlevied, weigh stations at least create some marginal disincentive for beingoverweight. However, the slope is not nearly as convex as the official
13 Separate linear regressions for each weigh station of the total bribe on the numberof tons the truck is overweight confirm that the slope is positive and statistically significant( ) for all four weigh stations.p ! 0.01
428 journal of political economy
fine and likely not as steep or convex as would be socially optimal.14
There also exists evidence of outright extortion: two-thirds of trucks thatwere not overweight at all also paid bribes at weigh stations (results notreported).
IV. Does Market Structure Matter? Evidence from Checkpoints
A. Theoretical Framework
We first present a very simple theoretical framework to demonstratehow the number and location of checkpoints may affect the bribescharged at each checkpoint. The idea is to model checkpoints as a chainof vertical monopolies. To illustrate the potential for double margin-alization in such a situation (as in Spengler [1950], Bresnahan and Reiss[1985], and Shleifer and Vishny [1993]), we first discuss the case inwhich checkpoints announce a fixed, posted price. We then relax theassumption of full commitment to illustrate the potential for increasingholdup by downstream checkpoints (following Grossman and Hart[1986], Hart and Moore [1990], and Blanchard and Kremer [1997]).
1. Model with Fixed Prices
Suppose that there are n identical checkpoints arrayed throughout theroad. Each checkpoint announces, in advance, a price p for the truckto pass. The demand for trucking depends on the total price to passall checkpoints, . Given this demand function, each checkpointq(� p )jj
i maximizes
p q p � p . (1)�i i j( )j(i
The first-order condition is
′p q p � p p �q p � p . (2)� �i i j i j( ) ( )j(i j(i
In equilibrium, symmetry implies that . Define the total pricep p p p pi j
. Then, in equilibrium, equation (2) implies thatp p np
′q (P)Pp �n; (3)
q(P)
that is, the total price is set so that the elasticity of demand is equale(P)to �n.
14 The standard engineering estimate is that the damage a truck does to a road isproportional to the fourth power of the truck’s weight (American Association of StateHighway Officials 1961).
economics of extortion 429
Under the usual assumption that the elasticity of demand is increasingin absolute value in the price (e.g., with a linear demand curve), thetotal price to pass through the road is increasing in the number ofcheckpoints, that is, .15 Moreover, if is not too convex,�P/�n 1 0 q(P)the price charged per checkpoint is decreasing in the number of check-points, that is, .16 Thus, the elasticity of the total price paid�p /�n ! 0i
along the route (P) with respect to the number of checkpoints (n) isbetween zero and one, and the elasticity of the average price paid percheckpoint ( ) with respect to n is between minus one and zero.pi
By contrast, if the prices were set by a central authority rather thanby decentralized checkpoint officers, then equation (3) becomes thestandard monopoly result
′q (P)Pp �1. (4)
q(P)
In this case, the total cost of passing through the road does not dependon the number of checkpoints. Since the total price P is constant, theelasticity of the price charged per checkpoint, , with respect top p P/ni
the number of checkpoints is exactly equal to minus one. The differencearises because when prices are decentralized, the person setting theprice at each checkpoint does not internalize the effect of his price onthe revenues at the other checkpoints; whereas when prices are setcentrally, the centralized price setter sets the total price P equal to themonopoly price no matter how many checkpoints there are.17
2. Bargaining and Holdup
The previous model assumed that prices could be fully committed toin advance. If, however, there is some amount of ex post bargainingover bribes, then as in a chain of Leontief production technologies(Blanchard and Kremer 1997), the downstream producers—in our case,the checkpoints at the end of the journey—will be able to extract more
15 The assumption that the elasticity of demand is increasing in absolute value in theprice is required to generate a finite equilibrium price in any monopoly pricing modelwith zero marginal cost, such as the model considered here. Details of this and all sub-sequent proofs are in the working paper version of the paper (Olken and Barron 2007).
16 For example, it is sufficient that , which is clearly satisfied by anyi ′ ′q (P)P/q (P) 1 �1demand function in which , including linear demand.i ′q (P) ≤ 0
17 This simple model, taken literally, implies a high equilibrium elasticity of demand,but this need not hold more generally. Suppose, e.g., that higher bribes increase thepossibility of a political backlash in which all checkpoints are closed. This translates intoprice setters maximizing a weighted sum of consumer surplus and their own profits, lowerbribes, and a lower equilibrium elasticity of demand. Similar comparative statics wouldstill obtain, however, since a centralized officer would internalize the full effect of cor-ruption on political backlash (or consumer surplus) whereas decentralized officers wouldnot.
430 journal of political economy
of the surplus than the upstream producers, the checkpoints at thebeginning of the journey.
To see the intuition, consider the case with two checkpoints and nocommitment over prices. In this case, the driver and the officer Nashbargain over the bribe to be paid to pass the checkpoint. Suppose thatif the driver reaches the final destination, the trip is worth one; if thereis no agreement at a checkpoint, the officer confiscates the cargo andboth the driver and the officer earn zero. We assume that the officerhas relative bargaining power a, which we assume is identical acrossboth checkpoints.
At the second checkpoint, the surplus from agreement is one. Nashbargaining with weight a for the officer implies that the bribe at thesecond checkpoint, , is equal to a. At the first checkpoint, however,b 2
in anticipation of the bribe to be paid at the second checkpoint, thesurplus from agreement is no longer one; the surplus is now , since1 � a
if agreement is reached at checkpoint 1, then the driver will still haveto pay a at the second checkpoint. Given that the surplus from agree-ment is , the bribe at the first checkpoint is . Note1 � a b p a(1 � a)1
that ; more generally, no matter how many checkpoints there are,b ! b1 2
the key prediction of this model is that the bribes are increasing as thedriver gets closer to the end, so that if .18b ! b j ! kj k
Overall, the theory has two sets of predictions that will be exploredin the empirical work below. First, subsection B will explore the degreeto which the overall price level responds endogenously to changes inmarket structure. Then, subsection C will explore the degree to whichprices are set through ex post bargaining and, to the extent that thereis some ex post bargaining over prices, whether this results in higherprices at checkpoints later in the route.
B. Empirical Evidence on the Impact of Changes in Market Structure
To examine how prices respond to changes in market structure, we usethe fact that the staggered withdrawal of military and police from Acehprovince generates plausibly exogenous variation in the number ofcheckpoints. In subsection 1 we present the main results, which examinehow prices on the portion of the roads in North Sumatra provinceresponded to the reduction in checkpoints on the portion of the roadsin Aceh province. In subsection 2 we present results from an alternativeempirical approach that exploits the differential timing of the with-
18 The working paper version (Olken and Barron 2007) demonstrates this claim formally.It also shows formally that if prices contain a fixed component and a component deter-mined by ex post bargaining, then the double marginalization results of Sec. IV.A.1 andthe holdup results in this subsection both hold in a single model.
economics of extortion 431
drawal in different districts in Aceh, which allows us to look at changeswithin Aceh as well.
1. Changes in Bribes Paid in North Sumatra in Response toReductions in Checkpoints in Aceh
We begin by examining how officials in North Sumatra province re-sponded to the reduction in checkpoints in Aceh province. Since themilitary withdrawal was restricted to Aceh, it did not affect the militaryor police environment in North Sumatra. In the absence of other timetrends, changes in prices paid at checkpoints in North Sumatra cantherefore be attributed to the military withdrawal from the portion ofthe route running through Aceh province.
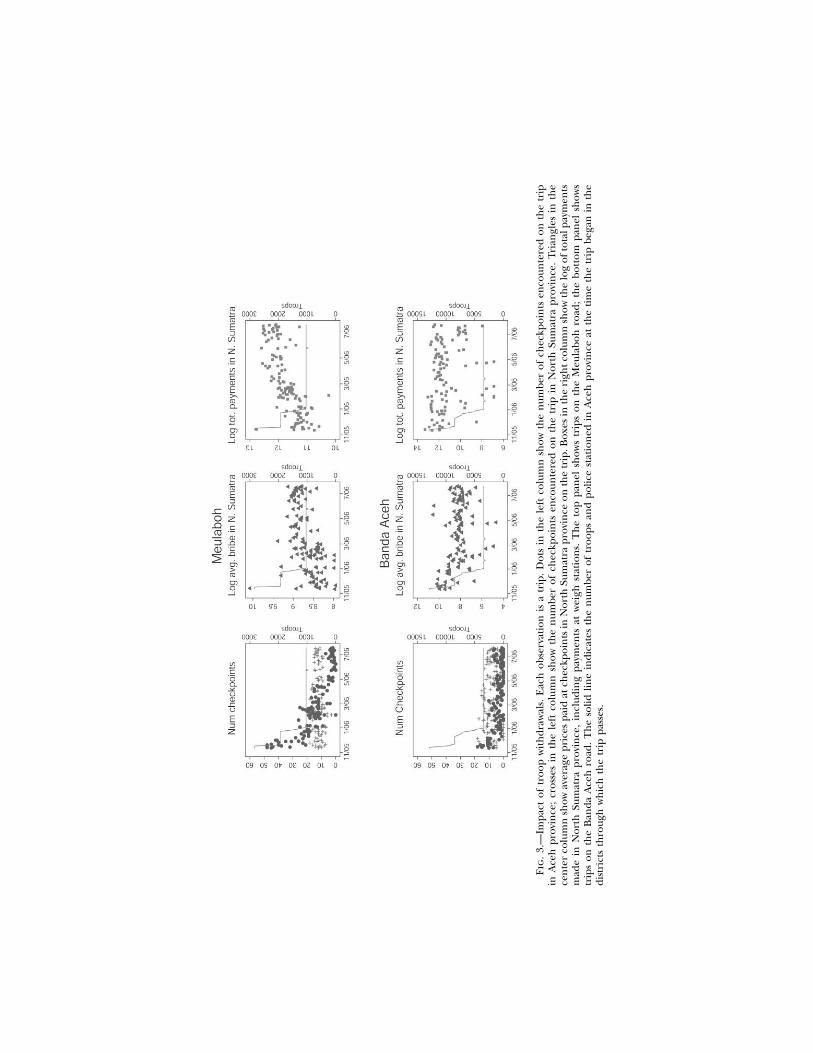
During the period covered by our data collection, the number ofcheckpoints in Aceh province on the Meulaboh route fell from an av-erage of above 30 at the beginning of the sample to just 2.5 at the endof the sample. This is shown in the leftmost graphs of figure 3, whichplot the number of checkpoints over time for both routes (dots indicatecheckpoints in Aceh province; crosses indicate checkpoints in NorthSumatra province, which remain roughly constant over the period). Bycontrast, on the Banda Aceh route, most checkpoints in Aceh provincehad already disappeared before our data collection began, so declineswere more muted.19 We therefore focus our analysis on the Meulabohroute and report additional difference-in-difference specifications thatexploit the difference in the magnitude of the reduction between theMeulaboh and Banda Aceh routes to control for time trends.
The center panel of figure 3 shows changes in average bribes at check-points on both routes. The graphs show an increase in average priceson the Meulaboh route, coincident with the dramatic reduction ofcheckpoints on that route; if anything, there appear to have been de-clines in average prices on the Banda Aceh route. Similarly, the right-most panel shows that total payments in North Sumatra rise on theMeulaboh route, whereas if anything, total payments fall slightly on theBanda Aceh route. These results suggest that prices on the North Su-matra portion of the Meulaboh route increased in response to the re-duction in checkpoints on the Aceh portion of the route, as the modelof endogenous price responses would predict.
19 Specifically, on the Meulaboh road, checkpoints in Aceh province declined from 30.6in the first 2 months to just 2.5 in the last 2 months; checkpoints in North Sumatraprovince increased from 11.9 to 12.5. On the Banda Aceh road, checkpoints in Acehprovince declined from 8.5 to 2.4 over the same period; checkpoints in North Sumatraprovince declined from 7.8 to 6.9.
Fig
.3.
—Im
pact
oftr
oop
wit
hdr
awal
s.E
ach
obse
rvat
ion
isa
trip
.D
ots
inth
ele
ftco
lum
nsh
owth
en
umbe
rof
chec
kpoi
nts
enco
unte
red
onth
etr
ipin
Ace
hpr
ovin
ce;
cros
ses
inth
ele
ftco
lum
nsh
owth
en
umbe
rof
chec
kpoi
nts
enco
unte
red
onth
etr
ipin
Nor
thSu
mat
rapr
ovin
ce.
Tria
ngl
esin
the
cen
ter
colu
mn
show
aver
age
pric
espa
idat
chec
kpoi
nts
inN
orth
Sum
atra
prov
ince
onth
etr
ip.B
oxes
inth
eri
ghtc
olum
nsh
owth
elo
gof
tota
lpay
men
tsm
ade
inN
orth
Sum
atra
prov
ince
,in
clud
ing
paym
ents
atw
eigh
stat
ion
s.T
he
top
pan
elsh
ows
trip
son
the
Meu
labo
hro
ad;
the
bott
ompa
nel
show
str
ips
onth
eB
anda
Ace
hro
ad.
Th
eso
lidlin
ein
dica
tes
the
num
ber
oftr
oops
and
polic
est
atio
ned
inA
ceh
prov
ince
atth
eti
me
the
trip
bega
nin
the
dist
rict
sth
roug
hw
hic
hth
etr
ippa
sses
.
economics of extortion 433
To econometrically estimate this relationship, we estimate the follow-ing regression:
′LogPrice p a � X g � bLogExpectedPosts � e . (5)ci c i i ci
Each observation is a bribe paid at a checkpoint, and only checkpointsin North Sumatra province are included. The key coefficient is b, theelasticity of prices at checkpoints with respect to the number of check-points. The variable is the log bribe paid at checkpoint c onLogPriceci
trip i, and is the log expected number of checkpointsLogExpectedPostsi
encountered on trip i. The expected number of checkpoints is calcu-lated using data from other trips on the route over a 2-week period,with the number of checkpoints in North Sumatra held constant toisolate variation from Aceh province.20
Control variables X include six dummies for the type of cargo, logdriver’s monthly salary, truck age and age squared, and number of tonsthe truck is overweight; the impact of these characteristics will be ex-plored in more detail in Section V.A.21 We include checkpoint#direction of travel fixed effects ( ) to control flexibly for heterogeneityac
in checkpoints and to capture the fact that not all checkpoints operateevery day.22 Following Cameron, Gelbach, and Miller (2006), we clusterstandard errors simultaneously on two dimensions, checkpoint and trip.We estimate versions of equation (5) in which we include only trips onthe Meulaboh route, where the main reductions in checkpoints tookplace. We also estimate versions including Banda Aceh trips plus eithera common cubic time polynomial or common month fixed effects tocontrol for unobserved time trends.
One potential concern with equation (5) is that, because it is esti-mated at the checkpoint level, it might not detect changes due to theentry or exit of checkpoints, as well as changes in the amounts paid atweigh stations. We therefore estimate an alternative specification that
20 Specifically, for each trip we calculate the average number of checkpoints in Acehprovince for all other trips on the route during a 2-week window. We add the averagenumber of checkpoints on the route in North Sumatra province, computed over the entire8-month period. This expectation therefore (a) uses only variation in checkpoints comingfrom the changes in Aceh province and (b) excludes any idiosyncratic factors from theparticular trip in question. Alternatively, using the actual number of checkpoints insteadof the expected number of checkpoints produces very similar results. Instrumenting forthe actual number of checkpoints with the expected number of checkpoints producessimilar results for cols. 1–4 of table 2 below and slightly larger coefficients for cols. 5–6.
21 We have also examined specifications including checkpoint characteristics (the num-ber of officers manning the checkpoint and whether any officers at the checkpoint carrieda gun) to capture potential changes in how checkpoints in North Sumatra operate. In-cluding these controls does not affect the results (available on request).
22 Specifically, we have information on the subdistrict (kecamatan) where each checkpointwas located and the organization (military, police, etc.) manning the checkpoint. Weapproximate a checkpoint fixed effect with a subdistrict#organization fixed effect.
434 journal of political economy
focuses on the total amount paid at checkpoints and weigh stations inNorth Sumatra, that is,
′LogPayments p a � X g � bLogExpectedPosts � e . (6)i i i i
In this specification, each observation is a single trip, and LogPaymentsi is the log of total illegal payments (checkpoints and weighstations) in North Sumatra province on trip i. Newey-West robust stan-dard errors are computed, allowing for serial correlation with up to 10lags. Control variables and specifications are otherwise identical to equa-tion (5).
The mapping between the estimated coefficients b and the alternativepricing structures discussed in the theory section is the same for bothequations. If pricing at checkpoints does not depend on market struc-ture, then . If pricing does depend on market structure and isb p 0fully centralized, the amount charged at each remaining checkpointwould increase enough to fully offset the lost revenues from the check-points that were eliminated, so . If pricing depends on marketb p �1structure and is decentralized, the amount charged at each remainingcheckpoint should increase, though not enough to fully offset the lostrevenues from the checkpoints that were eliminated, so .23�1 ! b ! 0
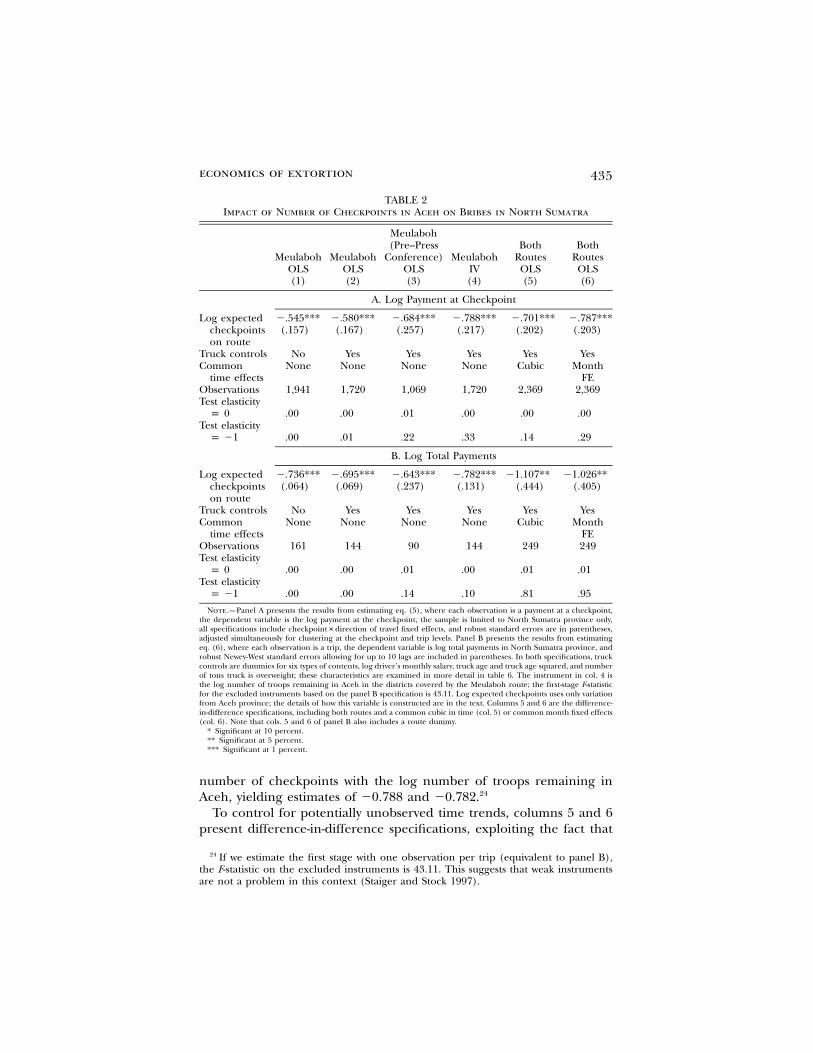
Panel A of table 2 presents the checkpoint-level results from esti-mating equation (5), and panel B presents the aggregate time-seriesresults from estimating equation (6). Column 1 presents ordinary leastsquares (OLS) estimates for the Meulaboh route without controls X.Panel A shows that the elasticity of the average bribe in North Sumatrawith respect to the expected number of checkpoints on the route is�0.545, and panel B shows that the elasticity of the total payments inNorth Sumatra with respect to the expected number of checkpoints onthe route is �0.736. The reason that the latter elasticity is slightly largeris likely that panel A includes only checkpoints, whereas panel B includesweigh stations as well as checkpoints. Column 2 adds controls for thetrip, which do not noticeably affect the results. In column 3, we restrictattention to the period before the press conference, yielding estimatesof �0.684 and �0.643. In column 4, to verify that the results are in factrelated to the military withdrawals, we instrument for the log expected
23 To see that the predictions are the same for both specifications, note that the totalpayments in North Sumatra, , are equal to , where P is the total amount paid,P (P/n)ns s
n is the total number of checkpoints, and is the number of checkpoints in North Sumatra.ns
Since is not changing in response to the military withdrawal,ns
P Plog (P ) p log n p log � c,s s( ) ( )n n
so the predictions for changes in in (6) are the same as for in (5).log (P ) log (P/n)s
economics of extortion 435
TABLE 2Impact of Number of Checkpoints in Aceh on Bribes in North Sumatra
MeulabohOLS(1)
MeulabohOLS(2)
Meulaboh(Pre–Press
Conference)OLS(3)
MeulabohIV(4)
BothRoutesOLS(5)
BothRoutesOLS(6)
A. Log Payment at Checkpoint
Log expectedcheckpointson route
�.545***(.157)
�.580***(.167)
�.684***(.257)
�.788***(.217)
�.701***(.202)
�.787***(.203)
Truck controls No Yes Yes Yes Yes YesCommon
time effectsNone None None None Cubic Month
FEObservations 1,941 1,720 1,069 1,720 2,369 2,369Test elasticity
p 0 .00 .00 .01 .00 .00 .00Test elasticity
p �1 .00 .01 .22 .33 .14 .29
B. Log Total Payments
Log expectedcheckpointson route
�.736***(.064)
�.695***(.069)
�.643***(.237)
�.782***(.131)
�1.107**(.444)
�1.026**(.405)
Truck controls No Yes Yes Yes Yes YesCommon
time effectsNone None None None Cubic Month
FEObservations 161 144 90 144 249 249Test elasticity
p 0 .00 .00 .01 .00 .01 .01Test elasticity
p �1 .00 .00 .14 .10 .81 .95
Note.—Panel A presents the results from estimating eq. (5), where each observation is a payment at a checkpoint,the dependent variable is the log payment at the checkpoint, the sample is limited to North Sumatra province only,all specifications include checkpoint#direction of travel fixed effects, and robust standard errors are in parentheses,adjusted simultaneously for clustering at the checkpoint and trip levels. Panel B presents the results from estimatingeq. (6), where each observation is a trip, the dependent variable is log total payments in North Sumatra province, androbust Newey-West standard errors allowing for up to 10 lags are included in parentheses. In both specifications, truckcontrols are dummies for six types of contents, log driver’s monthly salary, truck age and truck age squared, and numberof tons truck is overweight; these characteristics are examined in more detail in table 6. The instrument in col. 4 isthe log number of troops remaining in Aceh in the districts covered by the Meulaboh route; the first-stage F-statisticfor the excluded instruments based on the panel B specification is 43.11. Log expected checkpoints uses only variationfrom Aceh province; the details of how this variable is constructed are in the text. Columns 5 and 6 are the difference-in-difference specifications, including both routes and a common cubic in time (col. 5) or common month fixed effects(col. 6). Note that cols. 5 and 6 of panel B also includes a route dummy.
* Significant at 10 percent.** Significant at 5 percent.*** Significant at 1 percent.
number of checkpoints with the log number of troops remaining inAceh, yielding estimates of �0.788 and �0.782.24
To control for potentially unobserved time trends, columns 5 and 6present difference-in-difference specifications, exploiting the fact that
24 If we estimate the first stage with one observation per trip (equivalent to panel B),the F-statistic on the excluded instruments is 43.11. This suggests that weak instrumentsare not a problem in this context (Staiger and Stock 1997).
436 journal of political economy
there were larger reductions in checkpoints on the Meulaboh routethan on the Banda Aceh route. Specifically, column 5 includes obser-vations from both routes plus a common cubic polynomial of the tripdate. Column 6 is similar, with common month fixed effects instead ofthe time polynomial.25 The resulting elasticities are �0.701 and �0.787for average payments at checkpoints and �1.107 and �1.026 for totalpayments. This difference-in-difference strategy provides further evi-dence that prices respond endogenously to the withdrawals.
The estimates in all specifications are statistically significantly differentfrom zero, confirming that prices charged in North Sumatra increaseas the number of checkpoints on the route in Aceh declines. Prices thusrespond to changes in market structure in a way consistent with eco-nomic theory. The point estimates are not statistically distinguishablefrom minus one in most specifications, so we cannot determine whetherthe price setting is decentralized or centralized.
The estimates suggest that the magnitude of endogenous price re-sponses is substantial. For example, consider how the impact of themilitary withdrawal would have differed if prices had not respondedendogenously. Preliminary interviews in March 2005 found that truckdrivers stopped at an average of 90 checkpoints along the two routes,whereas in the post-withdrawal period, truck drivers stopped at an av-erage of 18 checkpoints. When we applied the estimate from column1, panel A, of table 2 that the elasticity of the average price at a check-point with respect to the total number of checkpoints is �0.55, the 80percent reduction in the number of checkpoints reduced the cost ofpayments at checkpoints by only 51 percent.26 Had prices been exog-enous, the cost of payments would have fallen by 80 percent. Endoge-nous price responses therefore offset about 36 percent of the potentialreduction in corruption from removing checkpoints.
One potential concern is that this empirical strategy does not ruleout differential time trends across the two routes. For example, althoughwe have no evidence that this is the case, it is possible that the recoveryefforts from the 2004 tsunami proceeded at a different pace in theMeulaboh area than in the Banda Aceh area, creating differential
25 Naturally, in panel B we also include a dummy for which route the trip was on; sucha dummy is not necessary in panel A because it already includes checkpoint fixed effects,which implicitly capture the route fixed effect.
26 To see this, note that we can transform eq. (5) to be
LogTotalPayments p (b � 1)LogTotalCheckpoints .i i
Thus, the relationship between the log of total payments on the route and the log of thetotal number of checkpoints on the route is equal to . This, combined�0.55 � 1 p 0.45with the 80 percent (�1.6 in log units) reduction in checkpoints, yields the estimate inthe text. Since �0.55 is the smallest of all the estimates in table 2, choosing a differentpoint estimate would yield an even smaller reduction in payments and a larger impact ofendogenous price responses.
economics of extortion 437
changes in willingness to pay for transport on the two routes and po-tentially biasing the estimates. Although this empirical strategy cannotdefinitely rule out such a possibility, the analysis in the next subsectionaddresses this concern with an alternative identification strategy thatlooks within Aceh province and relies on changes in the location ofcheckpoints.
2. An Alternative Empirical Approach: Changes within IndividualDistricts
An alternative empirical approach is to examine how the cost of passingthrough each district in Aceh changed as troops were withdrawn, takingadvantage of the fact that the withdrawal of troops occurred at differenttimes in different districts.27 The key advantage of this approach is that,since each trip passes through 10 districts, we can include trip fixedeffects. This allows us to control completely flexibly for separate timetrends on each route, as well as for unobservable characteristics of eachtruck and driver. However, since trip fixed effects absorb the overallgeneral equilibrium changes in the prices estimated above, this analysistells us only how the allocation of bribes within a trip shifted as a resultof the military withdrawal rather than the impact on the overall bribelevel.
To examine this, we estimate the following regression:
LogPayments p a � a � bLogExpectedPosts � e , (7)di d di di
where is the log of the total amount of payments madeLogPaymentsdi
by driver i to pass through district d, is the logLogExpectedPostsdi
expected number of checkpoints in district (kabupaten) d encounteredduring trip i (calculated analogously to in eqq. [5]LogExpectedPostsi
and [6] above), is a trip fixed effect, and is a set of district#a ai d
direction of travel fixed effects. Each observation is now a district#trip, and since each trip passes through 10 districts, there are 10 ob-servations for each trip.28
Since the regression in (7) examines the relationship between totalpayments in a district and the expected number of checkpoints in thatdistrict, the interpretation of the estimated b in (7) differs from that inequations (5) and (6). In this case, price setting that does not dependon market structure translates into , since the total cost of passingb p 1
27 Districts are the key subprovincial administrative units in Indonesia, and both thepolice and the army are organized district by district. District borders are shown as solidblack lines in fig. 1.
28 Note, however, that the log-log form drops district#trip observations with no check-points. We have reestimated this equation in levels and find qualitatively similar effects,suggesting that dropping the zeros does not substantially affect the results.
438 journal of political economy
TABLE 3Impact of Number of Checkpoints on Total Payments in District
MeulabohOLS(1)
MeulabohIV (Troops)
(2)
Both RoutesOLS(3)
Both RoutesIV (Troops)
(4)
Log expected check-points in district .663*** 1.522*** .586*** .786**
(.081) (.390) (.082) (.359)Observations 1,090 1,026 1,435 1,363Test elasticity p 0 .00 .00 .00 .03Test elasticity p 1 .00 .18 .00 .55
Note.—This table presents the results from estimating eq. (7), where there is one observation for each districtencountered on each trip, the dependent variable is the log of total amount paid in bribes in the district, and tripfixed effects and district#direction of travel fixed effects are included. The instrument in cols. 2 and 4 is the lognumber of troops remaining in the district. Robust standard errors are in parentheses, adjusted simultaneously forclustering at the district#quarter and trip levels.
* Significant at 10 percent.** Significant at 5 percent.*** Significant at 1 percent.
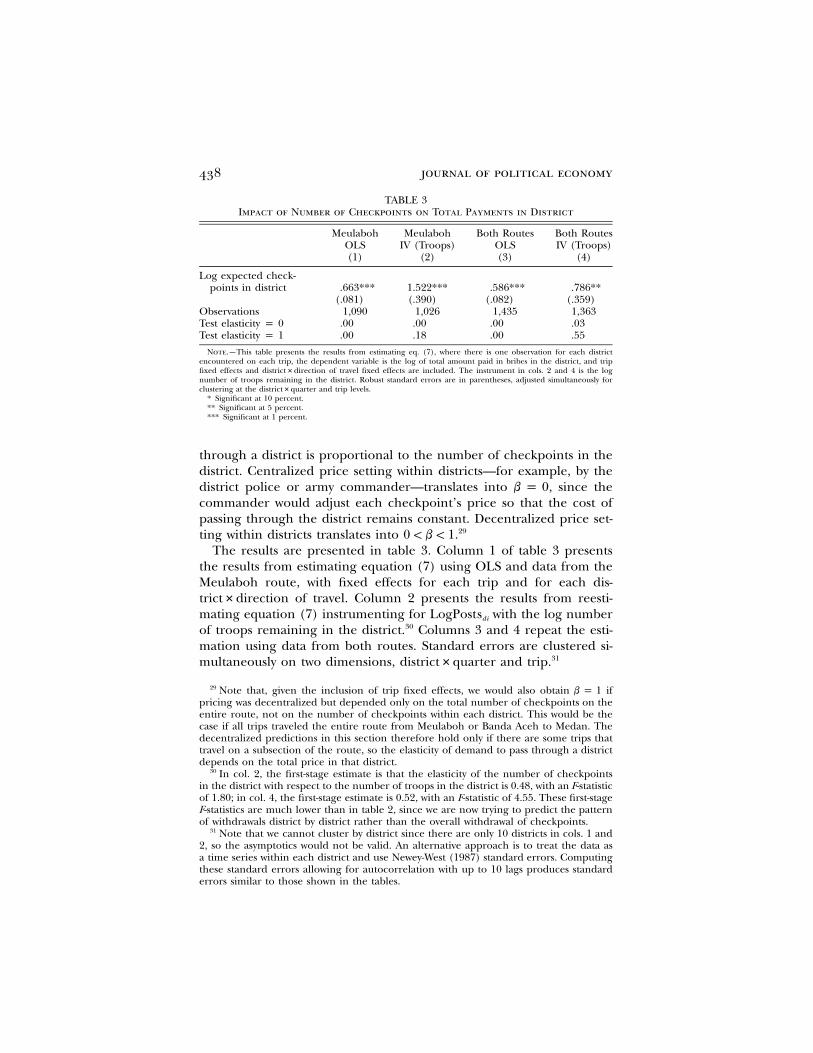
through a district is proportional to the number of checkpoints in thedistrict. Centralized price setting within districts—for example, by thedistrict police or army commander—translates into , since theb p 0commander would adjust each checkpoint’s price so that the cost ofpassing through the district remains constant. Decentralized price set-ting within districts translates into .290 ! b ! 1
The results are presented in table 3. Column 1 of table 3 presentsthe results from estimating equation (7) using OLS and data from theMeulaboh route, with fixed effects for each trip and for each dis-trict#direction of travel. Column 2 presents the results from reesti-mating equation (7) instrumenting for with the log numberLogPostsdi
of troops remaining in the district.30 Columns 3 and 4 repeat the esti-mation using data from both routes. Standard errors are clustered si-multaneously on two dimensions, district#quarter and trip.31
29 Note that, given the inclusion of trip fixed effects, we would also obtain ifb p 1pricing was decentralized but depended only on the total number of checkpoints on theentire route, not on the number of checkpoints within each district. This would be thecase if all trips traveled the entire route from Meulaboh or Banda Aceh to Medan. Thedecentralized predictions in this section therefore hold only if there are some trips thattravel on a subsection of the route, so the elasticity of demand to pass through a districtdepends on the total price in that district.
30 In col. 2, the first-stage estimate is that the elasticity of the number of checkpointsin the district with respect to the number of troops in the district is 0.48, with an F-statisticof 1.80; in col. 4, the first-stage estimate is 0.52, with an F-statistic of 4.55. These first-stageF-statistics are much lower than in table 2, since we are now trying to predict the patternof withdrawals district by district rather than the overall withdrawal of checkpoints.
31 Note that we cannot cluster by district since there are only 10 districts in cols. 1 and2, so the asymptotics would not be valid. An alternative approach is to treat the data asa time series within each district and use Newey-West (1987) standard errors. Computingthese standard errors allowing for autocorrelation with up to 10 lags produces standarderrors similar to those shown in the tables.
economics of extortion 439
Both the OLS and instrumental variable (IV) estimates (0.663 and1.522, respectively, on the Meulaboh route and 0.586 and 0.786, re-spectively, using data for both routes) are statistically distinguishablefrom zero. Moreover, the OLS estimates of 0.663 and 0.586 are signif-icantly different from one. This not only means that prices respondendogenously to the total number of checkpoints on the road, but alsosuggests that they adjust to take into account the number of checkpointsin their particular portion of the road. This provides further evidencerejecting centralized price setting in favor of decentralized price settingand, more generally, further evidence that market structure affects equi-librium price levels.
C. Empirical Evidence on Sequential Bargaining
1. Bargaining versus Fixed Prices
An important theoretical question is whether bribes are fixed in advanceof the trip or are instead determined in part through a bilateral bar-gaining process at the checkpoint. To test for bargaining, we examinewhether the prices paid at the checkpoints vary with two objective factorsthat would presumably increase the bargaining power of the officer atthe checkpoint.
First, we examine the price impact of the officer at the checkpointbrandishing a gun. Holding a gun increases the officer’s bargainingpower for a variety of reasons: it signals his willingness (or, perhaps,taste) to inflict physical punishment, it can be used to beat people, andit could be used to shoot a truck that drove away from the checkpoint.Second, we examine the number of officers visible at the checkpoint.Having more officers allows a given officer to spend time harassing atruck driver without worrying that he will be unable to stop anothertruck in the meantime. Having more officers as backup may also increasethe confidence of the officer bargaining with the truck driver.
To test for bargaining, we estimate the following regression:
LogPrice p a � a � Gun � NumOfficers � e . (8)ci i c ci ci ci
As in equation (5), each observation is a checkpoint on a particulartrip. Note that it includes fixed effects for the trip ( ) and fixed effectsai
for the checkpoint#direction of travel#month ( ), and we includeac
all the data (i.e., data from both routes and both provinces). We adjuststandard errors for clustering at the checkpoint level. We are thus ex-amining whether, with characteristics of the checkpoint, time trends,and the trip held constant, greater bargaining power on the part of theofficer manning the checkpoint leads to higher prices.
The results, presented in table 4, support the idea that increases in
440 journal of political economy
TABLE 4Bargaining versus Fixed Prices
Log Payment Negotiate Dummy
(1) (2) (3) (4)
Gun visible .166** .154** .042** .047***(.066) (.070) (.018) (.018)
Gun visible at subsequent checkpoint .016 .016(.024) (.018)
Number of officers at checkpoint .047*** .050*** .017*** .016***(.010) (.009) (.004) (.005)
Number of officers at subsequentcheckpoint �.003 �.003
(.007) (.004)Observations 5,260 4,968 5,281 4,989Mean dependent variable 8.49 8.50 .13 .13
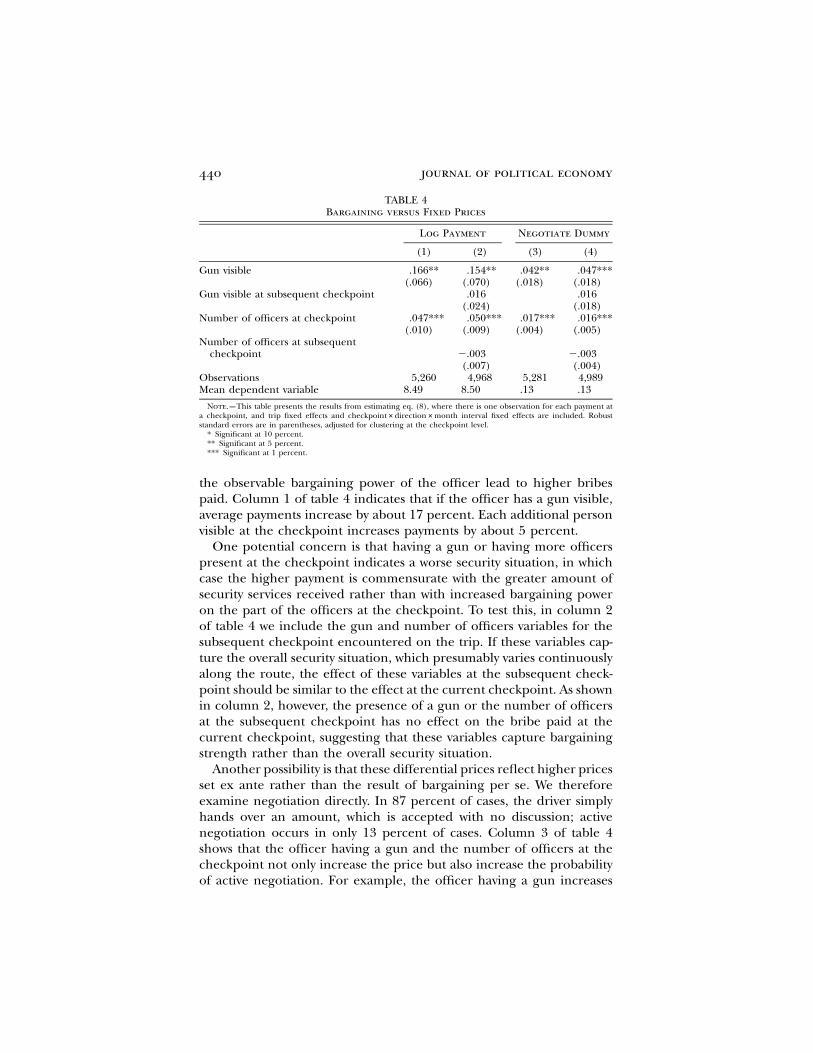
Note.—This table presents the results from estimating eq. (8), where there is one observation for each payment ata checkpoint, and trip fixed effects and checkpoint#direction#month interval fixed effects are included. Robuststandard errors are in parentheses, adjusted for clustering at the checkpoint level.
* Significant at 10 percent.** Significant at 5 percent.*** Significant at 1 percent.
the observable bargaining power of the officer lead to higher bribespaid. Column 1 of table 4 indicates that if the officer has a gun visible,average payments increase by about 17 percent. Each additional personvisible at the checkpoint increases payments by about 5 percent.
One potential concern is that having a gun or having more officerspresent at the checkpoint indicates a worse security situation, in whichcase the higher payment is commensurate with the greater amount ofsecurity services received rather than with increased bargaining poweron the part of the officers at the checkpoint. To test this, in column 2of table 4 we include the gun and number of officers variables for thesubsequent checkpoint encountered on the trip. If these variables cap-ture the overall security situation, which presumably varies continuouslyalong the route, the effect of these variables at the subsequent check-point should be similar to the effect at the current checkpoint. As shownin column 2, however, the presence of a gun or the number of officersat the subsequent checkpoint has no effect on the bribe paid at thecurrent checkpoint, suggesting that these variables capture bargainingstrength rather than the overall security situation.
Another possibility is that these differential prices reflect higher pricesset ex ante rather than the result of bargaining per se. We thereforeexamine negotiation directly. In 87 percent of cases, the driver simplyhands over an amount, which is accepted with no discussion; activenegotiation occurs in only 13 percent of cases. Column 3 of table 4shows that the officer having a gun and the number of officers at thecheckpoint not only increase the price but also increase the probabilityof active negotiation. For example, the officer having a gun increases
economics of extortion 441
the probability of negotiations by 4 percentage points, or 45 percentabove the baseline level. In a full information bargaining model, ofcourse, these characteristics should affect the equilibrium price, but notnecessarily the number of rounds of bargaining. The fact that thesecharacteristics affect negotiation in addition to the equilibrium pricesuggests some uncertainty as to their impact on the officer’s bargainingpower, which is resolved through negotiation. Column 4 of table 4 showsthat the variables at the subsequent checkpoint do not affect negotia-tion, confirming again that these variables are not capturing generaltrends about the security situation. Combined, these results suggest thatbribes are set at least in part through bilateral bargaining.
2. Sequential Bargaining and Increasing Prices
Given the presence of bargaining, we can test the implication of SectionIV.A.2 that prices should increase later in the trip. To do so, we takeadvantage of the fact that we observe trips in both directions on bothroutes. We therefore examine the dynamics of payments along a trip,conditioning out trip fixed effects and checkpoint fixed effects.
Specifically, we assign each checkpoint a percentile score based onthe order in which they are encountered, from 0 (the first checkpoint)to 1 (the last checkpoint). We average across all trips each month toobtain the mean percentile score for each checkpoint—that is, at whatpoint in the trip that checkpoint is usually encountered—for each di-rection of travel. Each checkpoint therefore has two mean percentilescores each given month: one for when the trip is going from point Ato point B and one for when the trip is going from point B to pointA.32
We estimate the following regression at the checkpoint-trip level:
LogPrice p a � a � bMeanPercentile � e , (9)ci i c ci ci
where is a trip fixed effect and is a checkpoint#month fixed effect.a ai C
A positive coefficient b indicates that the price is increasing as the tripprogresses. We estimate equation (9) separately for each route, cluster-ing standard errors at the checkpoint level. We also present the resultsnonparametrically. To do this, we first estimate (9) with LogPrice as thedependent variable and with only the fixed effects and as inde-a ai c
pendent variables. We then perform a nonparametric Fan regression ofthe residuals from that regression on .MeanPercentileci
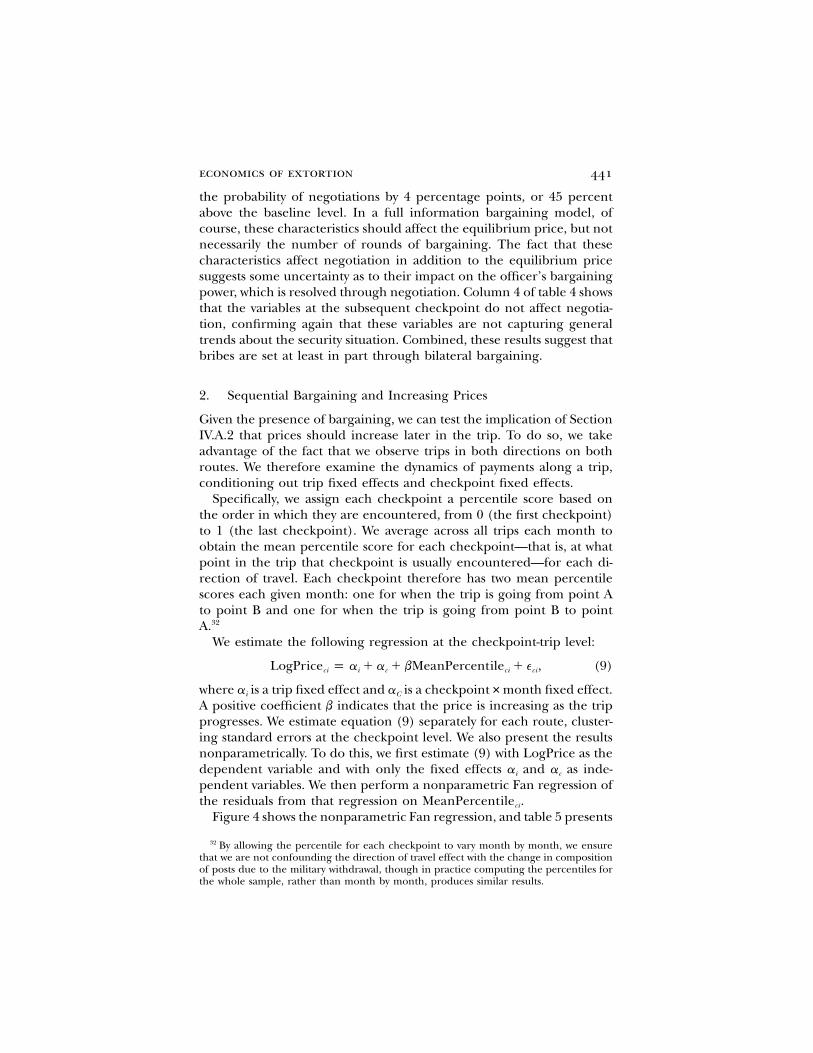
Figure 4 shows the nonparametric Fan regression, and table 5 presents
32 By allowing the percentile for each checkpoint to vary month by month, we ensurethat we are not confounding the direction of travel effect with the change in compositionof posts due to the military withdrawal, though in practice computing the percentiles forthe whole sample, rather than month by month, produces similar results.
442 journal of political economy
Fig. 4.—Payments by percentile of trip. Each graph shows the results of a nonparametricFan (1992) locally weighted regression, where the dependent variable is log payment atcheckpoint, after removing checkpoint#month fixed effects and trip fixed effects, andthe independent variable is the average percentile of the trip at which the checkpoint isencountered. The bandwidth is equal to one-third of the range of the independent var-iable. Dependent variable is log bribe paid at checkpoint. Bootstrapped 95 percent con-fidence intervals are shown in dashes, where bootstrapping is clustered by trip.
the regression results from estimating equation (9). In both sets ofresults, the data from the Meulaboh route show prices clearly increasingalong the route, with prices increasing 16 percent from the beginningto the end of the trip. This is consistent with the model outlined above,in which there is less surplus early in the route for checkpoints to extract.
The evidence from the Banda Aceh route is less conclusive, with noclear pattern emerging: the point estimate in table 5 is negative but theconfidence intervals are wide; the nonparametric regressions in figure4 show a pattern that increases and then decreases. One reason themodel may not apply as well here is that the route from Banda Acehto Medan runs through several other cities (Lhokseumawe and Langsa,both visible on fig. 1), whereas there are no major intermediate desti-nations on the Meulaboh road. If officials cannot determine whether atruck is going all the way from Banda Aceh to Medan or stopping atan intermediate destination, the upward slope prediction may be muchless clear.33
33 Another potential reason is that there are fewer checkpoints on the Banda Aceh
economics of extortion 443
TABLE 5Sequential Bargaining and Increasing Prices
Meulaboh(1)
Banda Aceh(2)
Mean percentile .145*** �.178(.045) (.225)
Observations 4,190 1,089
Note.—This table presents the results from estimating eq. (9), where thereis one observation for each payment at a checkpoint, and trip fixed effects andcheckpoint#month interval fixed effects are included. Robust standard errorsare in parentheses, adjusted for clustering at the checkpoint level.
* Significant at 10 percent.** Significant at 5 percent.*** Significant at 1 percent.
Using the model, we can use the estimated slope on payments alongthe route to back out the implied relative bargaining power of the officerand driver. The model implies that the slope with respect to the per-centile (i.e., what we estimate in [9]) will be equal to ,�N log (1 � a)where N is the number of checkpoints.34 If we take the model seriously,the estimates from the Meulaboh route imply that bargaining power ofthe officers at the checkpoints is extremely low: the implied a is only0.005. This very low bargaining power of officers at checkpoints is con-sistent with the small size of average payments (between US$0.55 andUS$1.10), but why it is so low remains a puzzle.
V. Can Corrupt Officials Price Discriminate?
The analysis above suggests that corrupt officials respond to marketforces in determining the level of bribes. However, this does not nec-essarily imply that corrupt officials are just like firms in the marketplace.In particular, the fact that corruption is illegal means that there maybe very substantial restrictions on the types of contracts that corruptofficials can offer. This section examines whether the fact that bribesare illegal is sufficient to preclude price discrimination.
route. Since N is much smaller, the predicted slope on the percentile of the checkpoint’slocation, equal to , should also be much smaller (see n. 34 below).N log (1 � a)
34 To see this, note that the theory predicts , where n indexes theN�nb p a(1 � a)n
checkpoint number and N indexes the total number of checkpoints. Taking logs, we get
log b p �n log (1 � a) � k,n
which implies that
nlog b p �N log (1 � a) � k,n N
where is the checkpoint’s percentile.n/N
444 journal of political economy
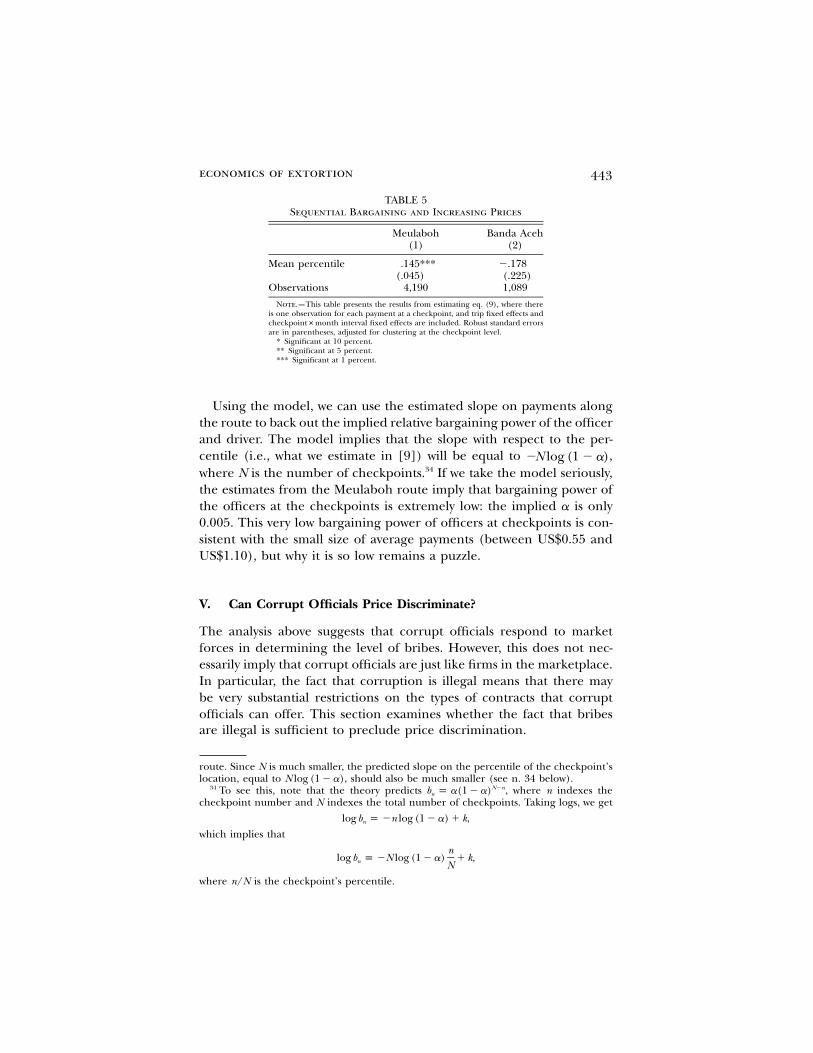
Fig. 5.—Price discrimination on observable characteristics. Each graph shows the resultsof a nonparametric Fan (1992) locally weighted regression, with the bandwidth equal toone-fifth of the range of the independent variable. The dependent variable is the pricepaid at the checkpoint, and the independent variable is shown in the x-axis (truck age inthe left panel and log cargo value per ton in the right panel). Bootstrapped 95 percentconfidence intervals are shown in dashes, where bootstrapping is clustered by trip. Whenthe dashed lines are not shown, it indicates that the 95 percent confidence interval exceedsthe y-axis of the graph.
A. Price Discrimination Based on Observable Characteristics
If there are observable characteristics that are correlated with differ-ential willingness to pay, profit-maximizing officials will charge differentbribes on the basis of those characteristics. To test for this type of third-degree price discrimination, we examine the correlation between bribesand observable characteristics of trucks that we would predict, a priori,to be correlated with differential willingness to pay.
Figure 5 presents the results of nonparametric Fan regressions ofbribes on two such characteristics: the age of the truck and the averagecargo value per ton. Figure 5 reveals that trucks older than about 12years pay substantially lower prices, though this accounts for only about6 percent of the trucks in our data. Trucks with low-value cargo alsopay substantially less; prices fall off precipitously below about Rp.5,500,000 per ton (US$600, or 15.5 on the log scale shown in the figure,which is the 43rd percentile in the value distribution).
To verify the patterns shown in figure 5, we estimate a price discrim-ination equation. We include checkpoint fixed effects interacted with
economics of extortion 445
month fixed effects to take into account the fact that different truckscarrying different cargo may have traveled on different routes or atdifferent times. Specifically, we estimate the following equation:
′LogPrice p a � X b � e , (10)ci c i ci
where each observation is a bribe at a checkpoint, are characteristics′Xi
of truck i, and are checkpoint#direction of travel#month fixedac
effects. We include data from both provinces and both routes. Standarderrors are simultaneously clustered at both checkpoint level and triplevel.
The results are reported in table 6. Since the cargo value was availablefor only a subset of trips, in column 1 we use dummy variables fordifferent cargo types (which were available for all trips), and in column2 we instead include the cargo value (which limits the sample to thosetrips with cargo value data). The results in column 2 confirm that truckswith higher cargo value pay more. The point estimates also suggest aconcave relationship between truck age and payment, with trucks over5 years old paying less, though the quadratic term is not statisticallysignificant. The results for types of cargo indicate higher payments forsteel, which is often of questionable legality, and lower payments formanufactured goods. A joint F-test of all truck characteristics shows thatthese characteristics are jointly significant at the 1 percent level. Theseresults are consistent with those of Svensson (2003), who also foundthat firms with higher ability to pay do in fact pay higher bribes.
The social welfare consequences of price discrimination at check-points depend on whether the total amount of corruption is affectedby the ability to price discriminate. If the total amount of corrupt rev-enue from bribes at checkpoints is fixed (e.g., through some type ofpolitical constraint), allowing third-degree price discrimination unam-biguously reduces the deadweight loss from corruption (Baumol andBradford 1970). This is analogous to the Ramsey tax problem: with third-degree price discrimination, officers can extract a greater share of therevenue from those truckers whose demand is less elastic. If, however,officials are not subject to a revenue constraint, then the welfare effectsof third-degree price discrimination are theoretically ambiguous anddepend on the specific shape of the demand curves (Schmalensee 1981).
Table 6 also includes characteristics of the driver, such as age, edu-cation, years of experience, and so forth. These driver characteristicsare jointly statistically significant, with a p-value of 0.01. Two results inparticular stand out. First, more frequent drivers—that is, those driverswho average more trips per month—pay lower bribes. One explanationis that frequent drivers are willing to invest more in learning the true

TABLE 6Price Discrimination
Log Payment
(1) (2)
Contents of truck:Steel .387***
(.144)Construction materials �.063
(.059)Food .025
(.039)Agricultural produce .106
(.073)Manufactured goods �.210***
(.074)Empty bottles �.037
(.529)Log cargo value per ton .072**
(.036)Truck characteristics:
Truck age .050** .028(.025) (.031)
Truck age squared (years) �.002 �.001(.002) (.002)
Tons overweight �.001 .006**(.003) (.003)
Driver characteristics:Age .006 .001
(.004) (.004)Years of education .002 �.011
(.004) (.007)Speaks Acehnese �.029 .045
(.039) (.045)Years of experience �.003 .003
(.003) (.004)Average trips per month �.049*** �.007
(.015) (.031)Log monthly salary .090** .026
(.042) (.057)Observations 4,510 2,079F-statistic on joint test of all contents/truck
characteristics 24.61 2.90p-value of joint test of all contents/truck
characteristics .00 .41F-statistic on joint test of all driver characteristics 17.70 8.12p-value of joint test of all driver characteristics .01 .23
Note.—This table presents the results from estimating eq. (10), where there is one observation for each paymentat a checkpoint, and checkpoint#direction#month fixed effects and hour of day fixed effects are included. Robuststandard errors are in parentheses, adjusted simultaneously for clustering at both the checkpoint and trip levels.
* Significant at 10 percent.** Significant at 5 percent.*** Significant at 1 percent.
economics of extortion 447
reservation price of each checkpoint.35 Second, drivers with higher sal-aries pay more. One potential explanation is an income effect: driverswith more income are willing to pay more not to spend the time andhassle (and potential risks) to obtain a low price. These factors suggestthat in addition to price discrimination, drivers have some flexibility inthe degree to which they invest in obtaining a lower price.
B. Weigh Stations and Second-Degree Price Discrimination
A second type of price discrimination can occur when there is asym-metric information between firms and customers. In this context, forexample, there may be unobserved heterogeneity in the fixed cost foreach trip and, thus, truck drivers’ willingness to pay to be overweight.In such a situation, officials at weigh stations could potentially introducea nonlinear pricing scheme to extract additional revenue from driverswith a higher willingness to pay to be overweight. These nonlinear pric-ing schemes should feature quantity discounts, so that the marginalbribe required for each additional ton overweight decreases as the num-ber of tons overweight increases (Maskin and Riley 1984).
An example of this type of second-degree price discrimination canbe found at the Gebang weigh station, located in North Sumatra prov-ince on the Banda Aceh–Medan route, where officials have set up thebribe schedule as a menu of two-part tariffs. If trucks simply arrive atthe weigh station, they pay a high marginal cost for being overweight:regressions indicate that they pay approximately Rp. 11,000 (US$1.20)per ton overweight for each ton over 10 tons overweight plus a fixedfee of approximately Rp. 170,000 (US$18.50). However, if before theyleave Medan they purchase a date-stamped coupon from a criminalorganization for about Rp. 150,000 (US$16.30), at the weigh stationthey can turn in the coupon and pay a flat fee of Rp. 50,000 (US$5.50)to the weigh station attendants, regardless of how overweight they are.Facing this schedule, drivers more than 16 tons overweight should preferthe high fixed fee, low marginal cost scheme.
Figure 6 shows nonparametric locally weighted regression estimatesof the bribes truck drivers pay at Gebang (including the price of thecoupon), separately depending on whether they have purchased thecoupon or not. The patterns visible in figure 6 confirm the existenceof two very different pricing schedules with a break-even line around16 tons.
35 The fact that frequent drivers pay less suggests that checkpoints and drivers may beengaged in a repeated game, which might help explain the low level of bribes. If so, pricesshould change right before checkpoints are withdrawn, since in the final period repeatedgames would break down. We found no evidence, however, that prices change systematicallybefore checkpoints are withdrawn.
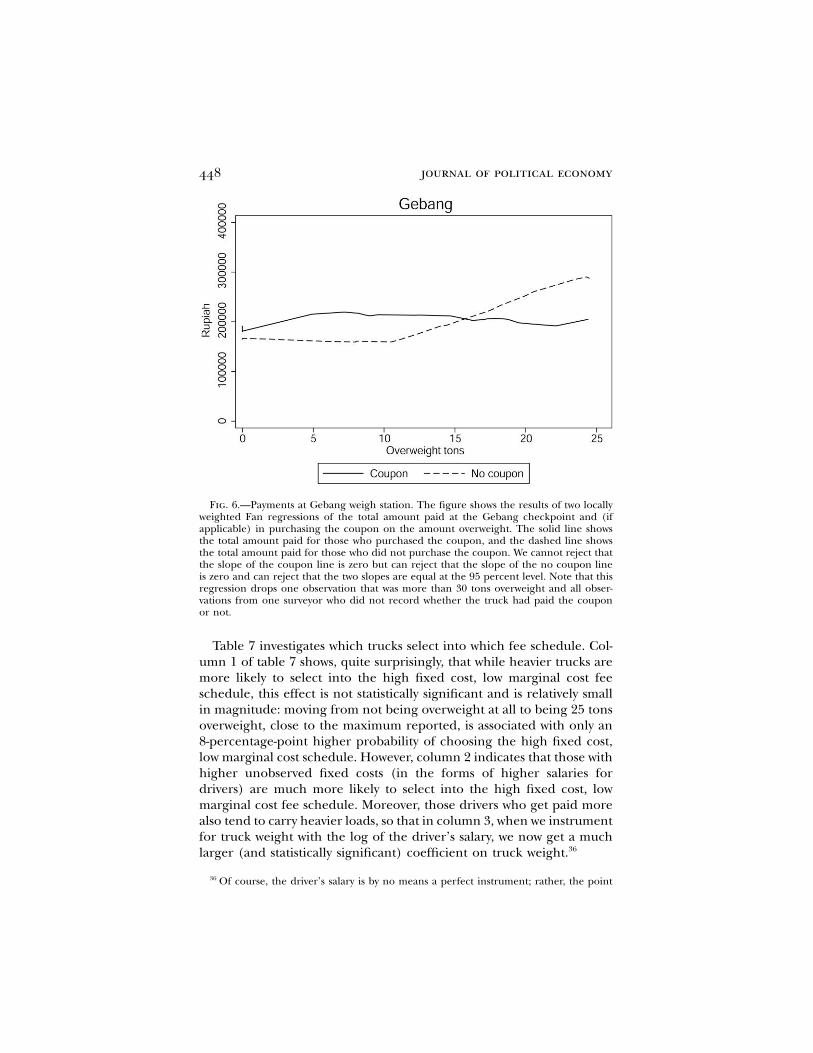
448 journal of political economy
Fig. 6.—Payments at Gebang weigh station. The figure shows the results of two locallyweighted Fan regressions of the total amount paid at the Gebang checkpoint and (ifapplicable) in purchasing the coupon on the amount overweight. The solid line showsthe total amount paid for those who purchased the coupon, and the dashed line showsthe total amount paid for those who did not purchase the coupon. We cannot reject thatthe slope of the coupon line is zero but can reject that the slope of the no coupon lineis zero and can reject that the two slopes are equal at the 95 percent level. Note that thisregression drops one observation that was more than 30 tons overweight and all obser-vations from one surveyor who did not record whether the truck had paid the couponor not.
Table 7 investigates which trucks select into which fee schedule. Col-umn 1 of table 7 shows, quite surprisingly, that while heavier trucks aremore likely to select into the high fixed cost, low marginal cost feeschedule, this effect is not statistically significant and is relatively smallin magnitude: moving from not being overweight at all to being 25 tonsoverweight, close to the maximum reported, is associated with only an8-percentage-point higher probability of choosing the high fixed cost,low marginal cost schedule. However, column 2 indicates that those withhigher unobserved fixed costs (in the forms of higher salaries fordrivers) are much more likely to select into the high fixed cost, lowmarginal cost fee schedule. Moreover, those drivers who get paid morealso tend to carry heavier loads, so that in column 3, when we instrumentfor truck weight with the log of the driver’s salary, we now get a muchlarger (and statistically significant) coefficient on truck weight.36
36 Of course, the driver’s salary is by no means a perfect instrument; rather, the point

economics of extortion 449
TABLE 7Who Selects into a High Fixed Cost Contract?
OLS(1)
OLS(2)
IV(3)
Tons overweight .003 .039**(.010) (.019)
Log driver’s monthly salary .305**(.119)
Constant .495*** �4.018** .074(.138) (1.760) (.210)
Observations 47 47 472R .00 .09
Note.—This table reports the result of a linear probability model that estimates , where′Coupon p a � X b � ei i i
Coupon is a dummy for whether a given trip i purchased the coupon and thus selected into the flat-price system. Eachobservation is a trip, and the sample is restricted to all trips on the Medan–Banda Aceh route headed in the directionof Banda Aceh, since coupons are for sale only on this route and only for this direction of travel. Columns 1 and 2are estimated as linear probability models using OLS; col. 3 is estimated as a linear probability IV model using two-stage least squares, where the instrument is the log driver’s monthly salary. Nonlinear probit and IV probit modelsproduce qualitatively similar results. Robust standard errors are in parentheses. All columns drop two outliers: thehighest observation on weight and the highest observation on salary. Including these observations strengthens thestatistical significance of the results in cols. 2 and 3.
* Significant at 10 percent.** Significant at 5 percent.*** Significant at 1 percent.
One way to reconcile all these results is to assume that drivers havesome uncertainty about the amount their truck weighs. Since they haveto decide whether or not to buy the date-stamped coupon before theydepart, they decide on the basis of whether they are generally over-weight. This would explain why factors that predict whether they areoverweight—such as the driver’s salary—have more predictive powerthan the actual weight of the truck. This uncertainty could also explainwhy there are two two-part tariffs rather than a single nonlinear tariff;in the presence of ex ante uncertainty about the weight of the truckand risk-averse truck drivers, this system of multiple two-part tariffs canproduce more revenue than a single nonlinear tariff (Clay, Sibley, andSrinagesh 1992; Miravete 2005).37
This type of second-degree price discrimination, while it may be rev-enue maximizing for corrupt officials, exacerbates the inefficienciescaused by corruption. In particular, quantity discounts decrease socialefficiency by moving from a linear bribe schedule to a concave bribeschedule—the opposite of the true social costs from driving overweight.
The pricing scheme of the Gebang weigh station is, in a sense, apossibility result: it demonstrates that very sophisticated pricing con-
is that we have demonstrated a characteristic that is related to a fixed cost of a trip andcorrelated with both a driver being overweight on average and his decision to purchasethe coupon.
37 Another possible reason for the geographic separation is that it requires the use ofa physical coupon. This coupon could allow upper-level bureaucrats to obtain data on thenumber of trucks paying bribes, which they could use to extract bribe revenue from weighstation attendants on a per-truck basis rather than a fixed-fee basis.
450 journal of political economy
tracts can emerge for corrupt activity. Just because this type of two-partcontract occurs at Gebang, however, does not mean that it will emergeeverywhere; in fact, an interesting question is why this system occursonly at the Gebang weigh station and only heading toward Aceh.38 Un-derstanding the precise circumstances that enable these complex ar-rangements to evolve is an important direction for future work.
VI. Conclusion
This paper examines the degree to which corrupt officials behave likefirms. We accompanied truck drivers on 304 trips transporting goodsto and from the Indonesian province of Aceh. During these trips, weobserved a total of more than 6,000 bribes and other illegal paymentsto police, military officers, and officials at weigh stations, or about 20such payments per trip. Total illegal payments averaged about 13 percentof the cost of each trip, more than the total wages received for the tripby the truck driver and his assistant.
Using these data, we showed that the patterns of bribes paid conformto predictions of standard models of pricing behavior from industrialorganization. During the period under study, the military staged a stag-gered withdrawal from Aceh province as part of a peace agreement withthe GAM rebel group. We document that this withdrawal led to a dra-matic reduction in the number of checkpoints at which trucks in Acehhad to stop to pay bribes. We show that average bribes paid at check-points on the remainder of the route increased in response.
We also use our direct observation of bribe payments to examine howbribes are negotiated. Although in most cases the truck driver’s initialoffer is accepted without discussion, the equilibrium amount paid nev-ertheless reflects the relative bargaining power of the two parties. Factorsthat increase the bargaining power of the officer manning the check-point, such as whether he is brandishing a gun and the number ofofficers who are visible and could provide backup if trouble arose, in-crease the equilibrium payment. Given the presence of bargaining, wethen show that bribes paid per checkpoint increase as the trip nears itsdestination, consistent with ex post holdup along a chain of monopolies.
Even though corruption is illegal, complex systems can evolve in orderto achieve greater levels of price discrimination. We document the ex-istence of price discrimination on the basis of observable characteristics,
38 One potential reason that it has not emerged at the Seumedam weigh station is that,as discussed above, Seumedam received intense scrutiny as part of a pilot project, sooperating these more complex bribe contracts may not be feasible. Moreover, in all tripsexcept those from Medan to Banda Aceh, most trucks travel as part of an organizedconvoy. As a result, virtually all other trucks have already paid a fixed fee for the journey,which may make offering the type of contracts offered at Gebang more difficult.
economics of extortion 451
such as the age of the truck and the cargo being carried, so that truckswith characteristics that indicate higher willingness to pay are indeedcharged higher bribes. Moreover, we show that at one of the four weighstations on the route, a criminal organization appears to have partneredwith weigh station officials to introduce a menu of two-part tariffs. Thissuggests that the barriers posed by the fact that corruption is illegal arenot sufficient to prevent complex pricing schemes involving multipletransactions.
The results here have several implications for anticorruption policy.First, the endogenous price responses documented here imply that de-centralized corruption can result in higher bribes charged than if cor-ruption was centralized. If that is the case, tackling corruption at thetop of an organization could actually lead to increases in bribes if thenumber of bribe takers on the ground remains the same but theircoordination system is undermined. Second, we show empirically thatendogenous price change responses can substantially offset the gainsfrom reducing the number of corrupt bureaucrats. In cases in whichcorruption was centralized, these gains could be completely offset byendogenous price responses.
Although the economic mechanisms identified in this paper are likelyto be general, the degree of centralization or decentralization of bribeswill clearly vary according to the context. For example, a pilot surveyconducted by the authors in March 2005 on the road between Jakarta,the capital of Indonesia, and Bandung, the capital of nearby West Javaprovince, found that—in contrast to Aceh—the vast majority of extor-tion payments made by truck drivers on the Bandung–Jakarta routewere in the form of routine monthly payments to police officials andaffiliated criminal organizations, with relatively little collected at check-points. One interpretation of this phenomenon is that the corrupt of-ficials in West Java had managed to centralize collection of bribes pre-cisely in order to overcome the double marginalization problemdiscussed in this paper. Understanding the circumstances that allowcorruption to be coordinated in this way is an important direction forfuture research.
References
American Association of State Highway Officials. 1961. “Road Test Report 5:Pavement Research.” Special Report no. 61, Highway Res. Bd., Washington,DC.
Baumol, W. J., and D. F. Bradford. 1970. “Optimal Departures from MarginalCost Pricing.” A.E.R. 60 (3): 265–83.
Blanchard, O., and M. Kremer. 1997. “Disorganization.” Q.J.E. 112 (4): 1091–1126.
452 journal of political economy
Bresnahan, T. F., and P. C. Reiss. 1985. “Dealer and Manufacturer Margins.”Rand J. Econ. 16 (2): 253–68.
Cameron, A. C., J. B. Gelbach, and D. L. Miller. 2006. “Robust Inference withMulti-way Clustering.” Technical Working Paper no. 327, NBER, Cambridge,MA.
Clay, K. B., D. S. Sibley, and P. Srinagesh. 1992. “Ex Post vs. Ex Ante Pricing:Optional Calling Plans and Tapered Tariffs.” J. Regulatory Econ. 4 (2): 115–38.
Di Tella, R., and E. Schargrodsky. 2003. “The Role of Wages and Auditing duringa Crackdown on Corruption in the City of Buenos Aires.” J. Law and Econ. 46(1): 269–92.
Fan, J. 1992. “Design-Adaptive Nonparametric Regression.” J. American Statis.Assoc. 87 (420): 998–1004.
Ferraz, C., and F. Finan. 2008. “Exposing Corrupt Politicians: The Effects ofBrazil’s Publicly Released Audits on Electoral Outcomes.” Q.J.E. 123 (2): 703–45.
Fisman, R., and S.-J. Wei 2004. “Tax Rates and Tax Evasion: Evidence from‘Missing Imports’ in China.” J.P.E. 112 (2): 471–500.
Foster, D. 2005. “Sumatra Region Roads Project: Technical Assistance on RoadTraffic Safety and Vehicle Weights and Dimension, Enforcement Component.”Report, World Bank, Washington, DC.
Grossman, S. J., and O. D. Hart. 1986. “The Costs and Benefits of Ownership:A Theory of Vertical and Lateral Integration.” J.P.E. 94 (4): 691–719.
Hart, O. D., and J. Moore. 1990. “Property Rights and the Nature of the Firm.”J.P.E. 98 (6): 1119–58.
Hsieh, C.-T., and E. Moretti. 2006. “Did Iraq Cheat the United Nations? Un-derpricing, Bribes, and the Oil for Food Program.” Q.J.E. 121 (4): 1211–48.
Maskin, E., and J. Riley. 1984. “Monopoly with Incomplete Information.” RandJ. Econ. 15 (2): 171–96.
McMillan, J., and P. Zoido. 2004. “How to Subvert Democracy: Montesinos inPeru.” J. Econ. Perspectives 18 (4): 69–92.
Miravete, E. J. 2005. “The Welfare Performance of Sequential Pricing Mecha-nisms.” Internat. Econ. Rev. 46 (4): 1321–60.
Newey, W. K., and K. D. West. 1987. “A Simple, Positive Semi-definite, Hetero-skedasticity and Autocorrelation Consistent Covariance Matrix.” Econometrica55 (3): 703–8.
Olken, B. A. 2007. “Monitoring Corruption: Evidence from a Field Experimentin Indonesia.” J.P.E. 115 (2): 200–249.
Olken, B. A., and P. Barron. 2007. “The Simple Economics of Extortion: Evidencefrom Trucking in Aceh.” Working Paper no. 13145, NBER, Cambridge, MA.
Reinnika, R., and J. Svensson. 2004. “Local Capture: Evidence from a CentralGovernment Transfer Program in Uganda.” Q.J.E. 119 (2): 679–705.
Schmalensee, R. 1981. “Output and Welfare Implications of Monopolistic Third-Degree Price Discrimination.” A.E.R. 71 (1): 242–47.
Shleifer, A., and R. W. Vishny. 1993. “Corruption.” Q.J.E. 108 (3): 599–617.Spengler, J. J. 1950. “Vertical Integration and Antitrust Policy.” J.P.E. 58 (4): 347–
52.Staiger, D., and J. H. Stock. 1997. “Instrumental Variables Regression with Weak
Instruments.” Econometrica 65 (3): 557–86.Svensson, J. 2003. “Who Must Pay Bribes and How Much? Evidence from a Cross
Section of Firms.” Q.J.E. 118 (3): 207–23.Yang, D. Forthcoming. “Integrity for Hire: An Analysis of a Widespread Customs
Reform.” J. Law and Econ.
Related Documents