The aim of this paper is to present a methodology where the extent of information sharing among team members is used as an indicator of shared mental mod- els (SMM) and situation awareness (SA). Data collec- tion procedures and probe materials are described for two field experiments performed among emergency management teams in the hydrocarbon industry. Meth- ods are suggested for calculating a “similarity index” by comparing a team member’s responses with the aver- age response in the team or with the responses of the team member assumed to be best informed. It is argued that similarity to team average could be a measure of SMM, whereas similarity to the best-informed team member could be argued to be an indicator of SA. The degree of compliance in responding to the probes is reported, as is the degree to which the extent of shared information differed between the probe questions or according to team positions. Lessons learned from the data collection are summarized, and the applicability of the similarity index as a measure of SA is discussed. Some advantages of the current approach are pre- sented, as are challenges and inherent assumptions in future applications of this approach. Keywords: situation awareness, shared situation awareness, shared mental models, teamwork, field study, crisis response INTRODUCTION Endsley defined situation awareness (SA) as “the perception of the elements in the environ- ment within a volume of time and space, the comprehension of their meaning and the projec- tion of their status in the near future” (Endsley, 1995b, p. 36). According to Endsley, SA forms the basis for decision making in dynamic and complex environments, such as a pilot’s cockpit, a ship’s bridge, or an emergency preparedness team in the hydrocarbon industry. Endsley saw SA as both the cognitive process of gathering and organizing information about the environ- ment and the resulting knowledge states. How- ever, Patrick and Morgan (2010) argued that it is difficult to clearly separate the process from the product, in terms of distinguishing the cognitive operations involved in perception, pattern rec- ognition, and sense making from the knowledge states produced. Bolstad, Cuevas, Gonzalez, and Schneider (2005) argued that the three main components affecting SA formation are the operators’ abilities, their interaction with other operators, and their interaction with the environ- ment. Although different conceptualizations of SA have been proposed, they are all based on the assumption that SA is susceptible to change and is vital to decision making in safety critical organizations. Measurement Approaches for Situation Awareness As the definitions vary, it is not surprising that various approaches to measuring SA have been suggested. A common and convenient approach is to use subjective self-report items, which is done by asking operators to report the extent to which they feel they are suffi- ciently aware of their environment. Given that the cognitive process and products are private experiences, it may be argued that letting the operators express their confidence in their cog- nition is a valid approach. A frequently used self-report approach is the situational awareness rating technique (SART; Taylor, 1989), which asks the operator to rate his or her SA on a scale with separate dimensions indicating demand for attention, availability of attentional resources, and situational understanding. 514585EDM XX X 10.1177/1555343413514585Journal of Cognitive Engineering and Decision MakingSimilarity Index in Field Studies 2013 Address correspondence to Bjørn Sætrevik, Faculty of Psychology, University of Bergen, Christies Gate 12, NO- 5015 Bergen, Norway, [email protected]. The “Similarity Index” as an Indicator of Shared Mental Models and Situation Awareness in Field Studies Bjørn Sætrevik and Jarle Eid, University of Bergen, Bergen, Norway Journal of Cognitive Engineering and Decision Making Volume XX, Number X, Month 2013, pp. 1–18 DOI: 10.1177/1555343413514585 Copyright © 2013, Human Factors and Ergonomics Society.

Welcome message from author
This document is posted to help you gain knowledge. Please leave a comment to let me know what you think about it! Share it to your friends and learn new things together.
Transcript
The aim of this paper is to present a methodology where the extent of information sharing among team members is used as an indicator of shared mental mod-els (SMM) and situation awareness (SA). Data collec-tion procedures and probe materials are described for two field experiments performed among emergency management teams in the hydrocarbon industry. Meth-ods are suggested for calculating a “similarity index” by comparing a team member’s responses with the aver-age response in the team or with the responses of the team member assumed to be best informed. It is argued that similarity to team average could be a measure of SMM, whereas similarity to the best-informed team member could be argued to be an indicator of SA. The degree of compliance in responding to the probes is reported, as is the degree to which the extent of shared information differed between the probe questions or according to team positions. Lessons learned from the data collection are summarized, and the applicability of the similarity index as a measure of SA is discussed. Some advantages of the current approach are pre-sented, as are challenges and inherent assumptions in future applications of this approach.
Keywords: situation awareness, shared situation awareness, shared mental models, teamwork, field study, crisis response
IntroductIonEndsley defined situation awareness (SA) as
“the perception of the elements in the environ-ment within a volume of time and space, the comprehension of their meaning and the projec-tion of their status in the near future” (Endsley, 1995b, p. 36). According to Endsley, SA forms
the basis for decision making in dynamic and complex environments, such as a pilot’s cockpit, a ship’s bridge, or an emergency preparedness team in the hydrocarbon industry. Endsley saw SA as both the cognitive process of gathering and organizing information about the environ-ment and the resulting knowledge states. How-ever, Patrick and Morgan (2010) argued that it is difficult to clearly separate the process from the product, in terms of distinguishing the cognitive operations involved in perception, pattern rec-ognition, and sense making from the knowledge states produced. Bolstad, Cuevas, Gonzalez, and Schneider (2005) argued that the three main components affecting SA formation are the operators’ abilities, their interaction with other operators, and their interaction with the environ-ment. Although different conceptualizations of SA have been proposed, they are all based on the assumption that SA is susceptible to change and is vital to decision making in safety critical organizations.
Measurement Approaches for Situation Awareness
As the definitions vary, it is not surprising that various approaches to measuring SA have been suggested. A common and convenient approach is to use subjective self-report items, which is done by asking operators to report the extent to which they feel they are suffi-ciently aware of their environment. Given that the cognitive process and products are private experiences, it may be argued that letting the operators express their confidence in their cog-nition is a valid approach. A frequently used self-report approach is the situational awareness rating technique (SART; Taylor, 1989), which asks the operator to rate his or her SA on a scale with separate dimensions indicating demand for attention, availability of attentional resources, and situational understanding.
514585 EDMXXX10.1177/1555343413514585Journal of Cognitive Engineering and Decision MakingSimilarity Index in Field Studies2013
Address correspondence to Bjørn Sætrevik, Faculty of Psychology, University of Bergen, Christies Gate 12, NO-5015 Bergen, Norway, [email protected].
The “Similarity Index” as an Indicator of Shared Mental Models and Situation Awareness in Field Studies
Bjørn Sætrevik and Jarle Eid, University of Bergen, Bergen, Norway
Journal of Cognitive Engineering and Decision MakingVolume XX, Number X, Month 2013, pp. 1 –18DOI: 10.1177/1555343413514585Copyright © 2013, Human Factors and Ergonomics Society.
2 Month XXXX - Journal of Cognitive Engineering and Decision Making
A different approach is to compare the opera-tor’s knowledge about the environment against what is considered to be objectively true. To use this approach, the researcher has to establish a known “ground truth,” for example by arranging a closely controlled exercise or by meticulous examination of audiovisual material or event logs in retrospect of an incident. One such objec-tive SA measure is the situation awareness global assessment technique (SAGAT; Endsley, 1995a), where factual probe questions are devel-oped for the specific setting and the operator’s answers express the extent to which the operator has an accurate understanding of the situation. Objective SA measures thus tap the knowledge states produced by the perceptual processes involved in gathering and organizing informa-tion. The quantitative assessment of situation awareness technique (QUASA; Edgar, Smith, Stone, Beetham, & Pritchard, 2000; McGuin-ness, 2004) combines the subjective and objec-tive approaches by asking operators to judge factual knowledge about the situation and to state their confidence in the judgment.
A third approach to measuring SA is to directly measure the cognitive process involved when the operator gathers and organizes information. Operators may for instance be asked to describe their actions and thoughts while performing a task, examine what information is accessed in a control system, analyze the operators’ eye move-ments as an indicator of attention, or record psy-chophysiology as an indicator of emotional or cognitive activation. An approach frequently used in field studies is to have subject matter experts observe the task work and rate the operators’ assumed SA based on their behavior (for more extensive reviews of SA measurement approaches, see Salmon, Stanton, Walker, & Green, 2006; Saner, Bolstad, Gonzalez, & Cuevas, 2009).
challenges for Existing Situation Awareness Measurements
There are various challenges and caveats involved in each of the approaches to mea-suring SA listed above. Several measurement approaches require an individual technique to be tailored to the context in question (e.g., by developing specific probe questions suited to the scenario), which may be a time-consuming
process drawing on resources from experts within the work setting being measured. This applies in particular to objective SA measure-ments, where relevant probes have to be adapted to the operator’s task, to the work setting, and to a specific time point in the exercise scenario, and the correct answer for each probe must be defined. Developing and arranging training exercises for the sole purpose of SA measure-ment may extensively draw on the organiza-tion’s limited resources of personnel, time, and equipment.
Although approaches that require operators to answer standardized subjective SA questions during exercises and simulations may require fewer resources to develop the approach, they constitute interruptions in the task work, and the researcher has to consider whether the SA mea-sured is representative of what the SA would be during natural task work. Subjective SA mea-sures where operators quantify to what extent they have an overview of the situation rely on operators’ access to metacognitive information, their interpretation of it, and their ability and willingness to report it. Several authors have argued that subjective SA actually measures operators’ confidence rather than reflecting the process or product of the cognitive information gathering processes (Endsley, 1994; Rousseau, Tremblay, Banbury, Breton, & Guitouni, 2010). For instance, Matthews, Eid, Johnsen, and Boe (2011) found that self-ratings of SA were inflated and did not correlate with expert ratings of SA in a military training exercise. This raises episte-mological questions about what we consider to be the best source for knowledge of private cog-nitive states, and what we define SA as being. Probe questions asking about factual relation-ships may direct the operator’s attention toward or away from specific aspects of the context, thus influencing the cognitive process. More-over, probe questions that ask what the operator knew at a previous time point in the scenario are subject to the operator’s recall quality.
Objective SA measures need a ground truth to be able to compare the operator’s knowledge of the situation to what can be said to be objec-tively true. Although this may be achievable in tightly controlled scenarios, it is often impossi-ble in real-life incidents or in more realistic
Similarity index in Field StudieS 3
training to determine what the external situation is at a given scenario time point, also when mak-ing a detailed examination of an incident in ret-rospect. Even in training exercises, it may often be difficult to predict the exact details of how a scripted scenario will play out. A true-to-life training scenario will be influenced by a number of unstable factors such as the actions of other team members, variations in information per-spective, idiosyncrasies among actors acting out the scenario, equipment malfunctions, and weather conditions. These threats to experimen-tal control also pose challenges to studies seek-ing to compare SA between different teams or different team members in the same scenario.
Observer ratings of SA are limited by their need to make assumptions based on what is empirically available as observable actions and communication, typically having to assess SA quality based on what information the operator can be shown to have accessed or on the deci-sions the operator has made. Without compari-sons to other SA measures, it is difficult for the researcher to know how accurate the observer ratings are. The observers may for instance be biased to look for what they think is the correct behavior, although this does not necessarily cor-respond to the operator’s SA (Salmon et al., 2006). Process measures for SA may be mis-leading, in that information-gathering actions do not necessarily reflect the knowledge states (Hone, Martin, & Ayres, 2006). Think-aloud protocols and eye-tracking and control system logs may indicate that information has been gathered, yet we do not know whether the infor-mation has been perceived and remembered, how its significance is understood, or to what extent the knowledge influences decision mak-ing (the “looked but failed to see” phenomenon; Brown, 2002). Some level of intrusion into the task work appears to be inevitable in all SA mea-sures, yet the amount of intrusion varies accord-ing to the approach used. Some measures require controlled settings where the objective facts of the task situation can be known with some cer-tainty, whereas others are better suited to eco-logical field studies and can be applied during or after naturalistic task performance. Thus, some approaches require resource-intensive bespoke exercises to be carried out, whereas others can
be combined with exercises that a team would carry out regardless of SA measurement, or can even be collected during actual incidents.
The above overview has outlined a number of methodological challenges in SA measurement. Salmon and colleagues (2008) recommended that studies should combine several of the differ-ent SA approaches to optimize the measurement strategy.
A sense of normativism seems to be funda-mental in most approaches to SA measurements, in the sense that there is an ideal state of knowl-edge that the operator should have, and that the quality of SA is measured in terms of deviation from this ideal. However, as Dekker, Hum-merdal, and Smith (2010) pointed out, it is ques-tionable whether we can confidently define what a “correct” view of a situation is. As mentioned above, the actual relationships may be unknown as a situation develops, or unknowable even in retrospect of the incident. It thereby seems more reasonable to evaluate the operator’s SA in terms of the information he or she has had access to or has been able to access, rather than to a platonic ideal state of knowledge. It should also be noted that some emergency training strategies focus on training operators to assume and prepare for the “worst-case” scenario based on current data (Nudell & Antokol, 1988). Such an approach could result in a state where desired knowledge representations deviate from an SA based on a more sober and realistic assessment of informa-tion. Thus SA, in the sense of similarity to objec-tive reality, may in some cases be difficult to establish, will typically be unavailable in real-life situations, and may not be compatible with the operator’s strategy. Hence, it may be of inter-est to examine other approaches to measuring SA that use validity criteria that may be assumed to correspond to accurate (or at least suitable) beliefs about the situation, but without measur-ing their correspondence to an objective reality.
Situation Awareness in teamsComplex work tasks are often performed by
teams, in which two or more individuals with specialized expertise and responsibility coop-erate to achieve a shared goal (Salas, Dickin-son, Converse, & Tannenbaum, 1992). Endsley (1995a) used the term team SA to describe the
4 Month XXXX - Journal of Cognitive Engineering and Decision Making
extent to which each member of a team has SA of the aspects of the situation that he or she is responsible for. Thus, team SA represents an aggregation of individual SAs, and team per-formance often relies on all team members hav-ing sufficient information about their own task requirements and sharing the information that is relevant to other members. Jones and Endsley (1996) used the term shared SA to describe the extent to which different team members have the same information about an aspect of the task that is relevant to them. Shared SA thus describes an overlap in SA requirements. This distinction emphasizes that knowing what information to share and what not to share is crucial for well-functioning teams. Shared SA is achieved through team processes, such as coor-dinating and prioritizing tasks, sharing informa-tion, and checking each other’s beliefs and basic assumptions. Cooke, Salas, Kiekel, and Bell (2004) used the term team cognition to refer to the kind of processes that allow team members to coordinate their efforts and achieve a shared understanding of the external situation, the task, and the resources of other team members. An important element in establishing shared SA is for the team members to develop shared men-tal models (SMM; Cannon-Bowers, Salas, & Converse, 1993), which enable team members to understand and interpret the situation in the same way, know what the other team members already know, what they need to know, and what they are doing. According to Salas, Rosen, Burke, Nicholson, and Howse (2007), SMM allows for accurate causal explanations and projection of future states, better adaptation to the environment, more reliable communication, mutual assessment of team member workload, and supportive behavior within the team.
Endsley and Jones (2001; Jones & Endsley, 2002) noted that a team member’s beliefs about the situation could be rated both in terms of accuracy and in terms of similarity to other team members’ beliefs, and proceeded to discuss a number of factors that may be involved in devel-oping team SA. Saner and colleagues (2009) suggested an approach for comparing two-and-two team members’ knowledge states in order to measure shared SA. Team members answer fac-tual questions and the researcher scores each
response both according to whether it is objec-tively correct and according to whether the team members give the same or different answers, thus yielding measures for both accuracy and similarity. Woods and Sarter (2010) argued that the focus of SA research should shift from indi-vidual perception to interdependent groups. It would be beneficial to have tools that can mea-sure the SA both of individuals in a team and of the entire team, rather than separate tools for individual SA and for the SA of team member dyads.
research AimsOur motivation for the current study was
to develop and field test a new approach for assessing and comparing beliefs within teams as a measure of SMM and as an indicator of SA in an applied setting. We were particularly inter-ested in approaches that could be used in situ for teams working in safety critical organizations, such as emergency management teams in the hydrocarbon industry. It should also be possible for organizations to apply the approach in their regular training exercises without outside assis-tance (without arranging a resource-intensive scripted scenario).
As mentioned above, in all but the most arti-ficial situations, it is difficult to establish a “ground truth” for SA. In other words, it is dif-ficult to confidently state what the operator can be expected to know about the situation at hand, given that the researcher has limited access to evaluate the actual situation at a given time, and what information the operator and the team has had access to. To get around this, our approach was to ask multiple-choice questions about fac-tual aspects of the situation and the team’s work that all team members were expected to be familiar with, and in evaluating the answers, each team member’s answer was compared to the rest of the team’s answers or to the answers of the team member assumed to be best informed. A “similarity index” is introduced for calculat-ing to what extent a team member’s answers to multiple-choice questions match the answers of others. The degree of similarity between team members is considered a measure of SMM, as it represents the degree of overlap in the team members’ beliefs about the situation and the task
Similarity index in Field StudieS 5
work. Moreover, if one member of the team, for example the team leader, can be assumed to be better informed on average than the rest of the team, we argue that the similarity a team mem-ber has to the best-informed team member can be linked to SA, although this does not assess the accuracy of the cognitions per se. A team’s average similarity index may be seen as a mea-sure of the team’s SMM and an indicator of the team’s average degree of shared SA, where high similarity index scores indicate a well-function-ing team with good information flow that is facilitated by an efficient team leader. To assess the methodology, the level of questionnaire compliance is examined, as team members may be reluctant to answer questions they regard as irrelevant. The similarity score is compared between different team positions and between different fields of expertise to verify that the information requested in the probe questions is relevant to all team positions.
research SettingThe research was conducted within a sec-
ond-line emergency preparedness center in a large hydrocarbon energy company. The center musters the emergency team whenever there is an alarm on an offshore hydrocarbon produc-tion installation. Typical incidents are fire or gas detection, ships on a collision course, and personnel injuries. The center is tasked with gathering and structuring information from other sources, creating a coherent dynamic picture of the ongoing situation, assisting in transfer-ring information and orders, and advising the first-line (tactical) emergency management on the installation and the third-line (strategic) emergency management at the corporate level. The team consists of an emergency commander (the chief of staff) and eight team members with separate areas of responsibility, with the team positions of personnel coordinator, medical advisor, air transport officer, maritime resource officer, maritime communications officer, gov-ernment liaison, communications officer, and strategic line leader. The chief of staff has a key role in managing the team’s work, charged with maintaining an overview of the team’s work domains, knowing the competencies and work-load of all team members, prioritizing among
different goals, and planning the ongoing work. Most team members have regular office jobs in the company and are on call to muster in a control room at an hour’s notice. The company has six emergency teams with a similar structure and responsibilities. They work a rota system of 1 week on and 5 weeks off. Team members are given individual training appropriate to their team position and monthly scenario team train-ing. The team musters in a large room equipped with individual workstations (PC and com-munication systems) positioned in a V shape opening toward multiple large-screen displays. Team members gather information individually from direct contact with external units such as the offshore installation manager, ships’ bridge crew, or hospital staff or consult documentation, procedures, and maps. The majority of the team members’ communication is with third parties outside the room or in conversation with the chief of staff, and there is less communication between the team members. The chief of staff arranges brief (2- to 3-min) status update meet-ings at his or her own discretion, typically every 20 to 30 min. In these meetings, the chief of staff stands in front of the large-screen displays and summarizes to the team how he or she views the current situation, the ongoing emergency man-agement work, and current main team goals. The chief of staff functions as an information hub, in terms of collecting information from team mem-bers and distributing information and commands to individual team members or to the entire team according to perceived needs. It could thus be argued that the chief of staff is expected to be on average the best-informed team member.
Subject matter experts in the organization were interviewed to understand the setting’s function, aims, and challenges. Methodologies, scenarios, and probe questions to be used in the data collection were developed in collaboration with senior researchers and practitioners within the field of operational team processes and team leadership. Particular attention was given to identifying task information that all team mem-bers were expected to know throughout their task work regardless of their team position. Before the Experiment 1 data collection, three pilot runs were conducted, where the team per-formed scheduled training scenarios while
6 Month XXXX - Journal of Cognitive Engineering and Decision Making
responding to pilot versions of the measurement tools in order to develop and adapt materials.
Since the intention of this paper is to describe the methodological approach, results are pre-sented to evaluate whether the data collection was effective and meaningful, whereas analyses for hypothesis testing are reserved for future publications.
ExpErIMEnt 1Method
The intention of Experiment 1 was to measure naturally occurring SA in an ecologically valid setting. Only minimal intrusions were therefore made into the organization’s scheduled training exercises, and the only request was that each team should be tasked with a scenario lasting between 2 and 3 hr and that they have compa-rable workloads. All the scenarios involved inci-dents of fire or gas leaks on a production facil-ity, some with additional personnel injury prob-lems. In handling the scenarios, the emergency center cooperated with the actual personnel who would be involved in a real incident using the real equipment and communication channels. Involved parties (external units) included the emergency organization on offshore hydrocar-bon installations, the bridge crews of nearby ships, the onshore corporate-level emergency organization, hospital staff, helicopter crew, and government agencies. The on-call emergency preparedness team members received the mus-ter call at around 7:00 a.m. on the day of the data collection and began working when they arrived in the emergency center shortly before 8:00 a.m. Whenever the chief of staff announced that it was time for a status update meeting, the emergency center work was “frozen” for 2 min while external units involved in the exercise continued to act out the scenario without inter-ruption. At this time point, a researcher handed out a sheet of paper with probe questions that all team members were asked to answer. Each sheet contained seven probes, some with multiple subquestions. In responding to the probes, the team members indicated their beliefs regarding where the incident was, what type of incident it was, the current personnel status, the likelihood of different scenario outcomes, what the team’s priorities should be, and how long the scenario
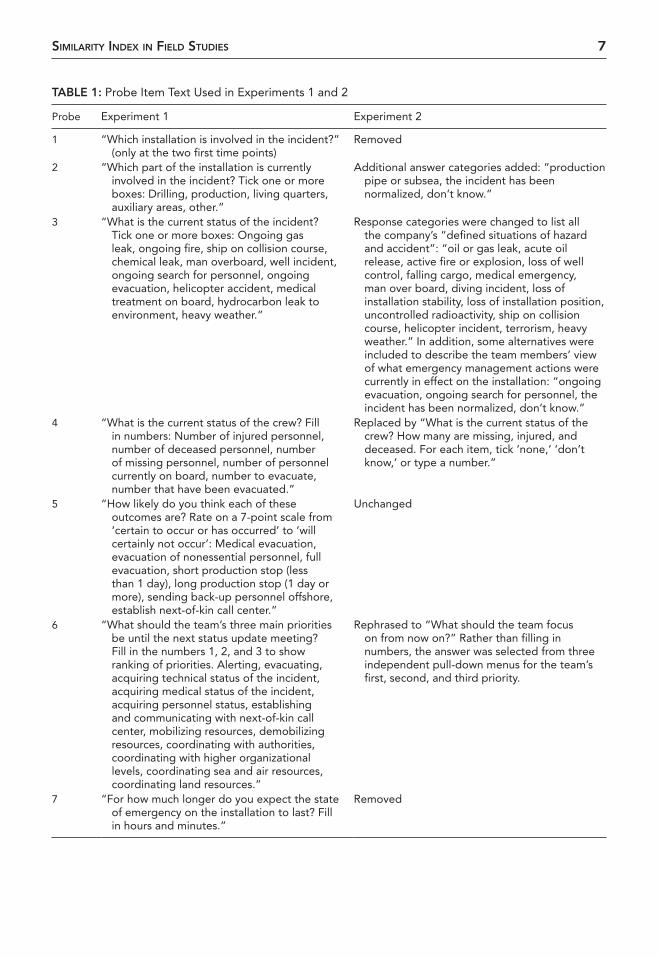
was expected to continue. The probes used in Experiment 1 are listed in the left column of Table 1. As pilot data collections showed that everybody quickly reached consensus in Probe 1, this probe was used only in the first two freeze points. When all team members had completed the probes, the sheets of paper were collected by a researcher and the chief of staff initiated the meeting as planned.
Background variables including personality measures and meta-cognition (Sætrevik, 2013) were collected in advance of the scenario exer-cise but are not included in the current article. Two observers individually monitored and recorded the frequency and duration of the chief of staff’s communication with the team mem-bers. A subject matter expert observed all the scenario exercises and scored team performance and the chief of staff’s performance on an observer scale for decision making under stress (inspired by the TADMUS program; see Can-non-Bowers & Salas, 1998). After scenario completion, team members were asked which other members of the team they had communi-cated most with and whom they relied on most in the scenario. Each of the six teams in the orga-nization was tested once on separate days within the course of a year.
resultsCompliance. When examining the answers
to the probes, it became apparent that all of the probe questions had not been answered (see the Results and Discussion sections), which had consequences for the analyses. If a team mem-ber did not respond to any of the probe questions at a freeze point, that team member was not scored for that freeze point, as we cannot know whether the probes were left blank due to lack of knowledge or not being willing or able to answer the probes. However, if a team member had answered some but not all of the probe items at a freeze point, the unanswered questions were scored as incorrect, based on the assumption that the unanswered probes expressed lack of knowl-edge. If the chief of staff failed to answer a probe, none of the team members could be com-pared to the best-informed team member for that freeze point. This scoring was used for all the following analyses.
Similarity index in Field StudieS 7
TABlE 1: Probe Item Text Used in Experiments 1 and 2
Probe Experiment 1 Experiment 2
1 “Which installation is involved in the incident?” (only at the two first time points)
Removed
2 “Which part of the installation is currently involved in the incident? Tick one or more boxes: Drilling, production, living quarters, auxiliary areas, other.”
Additional answer categories added: “production pipe or subsea, the incident has been normalized, don’t know.”
3 “What is the current status of the incident? Tick one or more boxes: Ongoing gas leak, ongoing fire, ship on collision course, chemical leak, man overboard, well incident, ongoing search for personnel, ongoing evacuation, helicopter accident, medical treatment on board, hydrocarbon leak to environment, heavy weather.”
Response categories were changed to list all the company’s “defined situations of hazard and accident”: “oil or gas leak, acute oil release, active fire or explosion, loss of well control, falling cargo, medical emergency, man over board, diving incident, loss of installation stability, loss of installation position, uncontrolled radioactivity, ship on collision course, helicopter incident, terrorism, heavy weather.” In addition, some alternatives were included to describe the team members’ view of what emergency management actions were currently in effect on the installation: “ongoing evacuation, ongoing search for personnel, the incident has been normalized, don’t know.”
4 “What is the current status of the crew? Fill in numbers: Number of injured personnel, number of deceased personnel, number of missing personnel, number of personnel currently on board, number to evacuate, number that have been evacuated.”
Replaced by “What is the current status of the crew? How many are missing, injured, and deceased. For each item, tick ‘none,’ ‘don’t know,’ or type a number.”
5 “How likely do you think each of these outcomes are? Rate on a 7-point scale from ‘certain to occur or has occurred’ to ‘will certainly not occur’: Medical evacuation, evacuation of nonessential personnel, full evacuation, short production stop (less than 1 day), long production stop (1 day or more), sending back-up personnel offshore, establish next-of-kin call center.”
Unchanged
6 “What should the team’s three main priorities be until the next status update meeting? Fill in the numbers 1, 2, and 3 to show ranking of priorities. Alerting, evacuating, acquiring technical status of the incident, acquiring medical status of the incident, acquiring personnel status, establishing and communicating with next-of-kin call center, mobilizing resources, demobilizing resources, coordinating with authorities, coordinating with higher organizational levels, coordinating sea and air resources, coordinating land resources.”
Rephrased to “What should the team focus on from now on?” Rather than filling in numbers, the answer was selected from three independent pull-down menus for the team’s first, second, and third priority.
7 “For how much longer do you expect the state of emergency on the installation to last? Fill in hours and minutes.”
Removed
8 Month XXXX - Journal of Cognitive Engineering and Decision Making
Data were collected when the chief of staff announced a status meeting, and the number of freeze points was thus determined by the fre-quency of meetings deemed necessary by the chief of staff during the scenario. Two of the teams had four meetings, three teams had five meetings, and one team had six meetings. Over-all compliance in answering the probes through-out the scenario was considered to be acceptable (percentage of questions answered M = 87.08%, SD = 33.55%). Compliance was lowest in Probe 7 (remaining time in exercise, M = 66.14% answered, SD = 47.42%), Probe 6 (the team’s priorities, M = 80.31%, SD = 39.84%), and Probe 3 (incident type, M = 89.37%, SD = 30.88%).
Assessment of data collection. A closer examination of the probe responses indicated that some of the questions appear to have worked better than others. In Probe 4, where the status of crew members was to be expressed in numbers, it appears to have been unclear to some team members how they were to respond when they did not know the exact number, as they left the item blank rather than estimate a number as the instructions had requested. Sev-eral team members misunderstood Probe 6, which asked team members to write the num-bers 1, 2, and 3 to select 3 out of 12 different options for what they thought the team’s current first, second, and third priorities were. The problem persisted despite piloting various phrasings of the probe, and offering guidance during the data collection. In Probe 7, the phrase “how long will the state of emergency last” was interpreted differently by respondents, yielding great variation in responses. Some team mem-bers assumed the probe referred to how long the training exercise would last, whereas others assumed it referred to how long it would take for the offshore installation to return to normal production. Discussing the probe with the orga-nization’s subject matter experts revealed that this probe may not have been meaningful to all team members.
Analytical approach. In line with our expec-tations from previous research, it proved difficult to establish a ground truth in naturalistic exer-cises such as the ones included in Experiment 1. A true-to-life exercise was also arranged among
the other involved parties, most crucially by the emergency organization on the offshore produc-tion installation, and the studied team’s external input could thus not be strictly controlled or monitored. Even for structured bits of informa-tion such as knowing how many personnel were currently injured, the experts were reluctant to say at what point individual team members or the whole team could be expected to have that infor-mation. For example, the chief of staff and the medical advisor are expected to know the injured personnel status at all times and as soon as such information is received, whereas other team members are expected to know about it only after the chief of staff arranges the next status update meeting. Moreover, as not all input into and within the team was recorded and analyzed (which would be a monumental task for a research project, not to mention for a regular training exercise), it was not possible to deter-mine what information had been given to what team members about injured personnel at what time, how clearly it had been expressed and emphasized, how it had been communicated within the team, and what other supporting or contradicting sources of information could exist. Our conclusion was that it would be difficult to arrange an ecologically valid exercise while at the same time controlling the incoming informa-tion to a sufficient extent to be able to conclude which team members had had access to which critical information at what time.
To develop a scoring system for SMM and SA that was able to adapt to a dynamic and often ambiguous information situation, which it would be possible to employ in a variety of contexts at low cost, the team members’ answers to probes were compared to each other. Given also that the chief of staff in this setting has a supervisory role, functioned as a communication and com-mand hub, and was tasked with informing the rest of the team of critical information, it was assumed that the chief of staff would on average be the team member who was best informed about general scenario information.
Comparing team members to team aver-age. One way to analyze the data set could be to calculate the average answer for the team (including the chief of staff) at each time point
Similarity index in Field StudieS 9
and calculate each team member’s deviation from the team average. To achieve this, all response options to probes with multiple choice answers (Probes 1-3, see Table 1) were scored as 1 or 0 according to whether each response option had been ticked. For probe items where a value or a graded answer was entered (Probes 4-7), the analysis used the number of personnel stated as injured, missing, deceased, and cur-rently on board (Probe 4), numbers 0 to 6 for each graded answer category for the likelihood estimates (Probe 5), the number 3 for the high-est team priority, the number 2 for the second priority, the number 1 for the third priority, the number 0 for priorities not selected (Probe 6), and the stated number of minutes estimated to be left in the scenario (Probe 7). At each time point, the average value for all response options was calculated, yielding an “average team answer” for each probe. Then the difference between each team member’s score and the average was calculated, and divided by the highest number given by any team member in any team on this probe on this time point. The algorithm is stated mathematically in Algorithm 1 below. For example, if two team members tick that there is an incident in the living quarters on Probe 2 whereas eight team members do not tick this response option, the similarity index for the members answering yes on this response option is 0.2 [1 – | (1 – 0.2)/1 | ], whereas the eight other team members’ similarity index is 0.8 [1 – | (0 – 0.2)/1 | ]. As another example, if a team consisting of six members answers that the number of people missing (Probe 4) is 5, 5, 6, 6, 6, and 8, the three team members answer-ing 6 would get a similarity index of 1 [1 – | (6 – 6)/8 | ], the two team members answering 5 would get a similarity index of 0.88 [1 – | (5 – 6)/8 | ], and the team member answering 8 would get a similarity index of 0.75 [1 – | (8 – 6)/8 | ]. The similarity index is calculated for each response option and averaged for each probe. If a response option is answered as 0 for all team members, the similarity index for this option is set to 1.
Please note that in the above algorithm, probe items that have been responded to by only one team member are scored as having optimal lev-els of shared beliefs (as the team member’s response corresponds to the team average). Depending on the researcher’s theoretical approach, some may prefer to refrain from scor-ing probes in which only one team member has answered. The researcher should consider removing from the data set extreme outlier val-ues reported by team members, as an increased range reduces the sensitivity of the similarity index for remaining team members.
Comparing team members to team leader. A different way to approach the data set would be to compare each team member’s answers with the answers of a team member who was assumed to be the best-informed member of the team. A scoring algorithm was developed to index the degree of similarity between an individual team member’s answers and the chief of staff’s answers to all questions. As the chief of staff forms the basis for comparison, he or she can-not be scored. The index should increase when a team member gives the same response as the chief of staff, whereas it should decrease when a team member gives a response that the chief of staff did not give, or the team member does not give a response whereas the chief of staff does. For probes in which response options are ticked (Probes 1-3; see Table 1), each response option was scored according to whether it matched (1) or did not match (0) the chief of staff’s response. For probes where a value or a graded response is given (Probes 4-7), responses were converted into numbers in the same way as when calculating team average. For each probe option, the numerical difference between the team member and the team leader was divided by the highest answer given by any of the team members or team leaders across team. This is stated as Algorithm 2 below. For exam-ple, when expressing where he or she thinks the incident is located (Probe 2), a team member may select two of the five response options to state that the incident is in the drilling and pro-duction areas, whereas the chief of staff knows that the incident has been normalized in the drilling areas and selects only the production
Teamaverage similarity index
teammember s answer averageof t
=
−−
1’ eeam sanswers
highest answer
’(1)
10 Month XXXX - Journal of Cognitive Engineering and Decision Making
areas. In this case, the team member’s response that matches is scored as 1 [1 – | (1 – 1)/1 | ], the nonmatching response is scored as 0 [1 – | (0 – 1)/1 | ], whereas the three response options not selected by neither team member or chief of staff are set at 1, yielding an average similarity index of 0.8 [4/5] for this team member on this probe. If another team member reported the drilling area only, this member would receive a similarity index of 0.6 [3/5] for this probe. If two team members rate the likelihood of a full evacuation as 5 (quite unlikely) and 6 (very unlikely) on Probe 5, whereas their chief of staff rates this as 1 (quite likely), the team member that reported 5 is scored as 0.33 [1 – | (5 – 1)/6 | ], whereas the team member that reported 6 is scored as 0.17 [1 – | (6 – 1)/6 | ]. An average of scores from Probes 1 to 7 was calculated for an overall similarity index. A similarity index score of 1 would indicate that all questions were answered the same way as the chief of staff, whereas a score approaching 0 would indicate that all questions were answered differently from the chief of staff.
Although developed independently, the math-ematics of calculating a response’s similarity as a fraction of full similarity is comparable to the approach used by Saner and colleagues (2009) to calculate similarity between dyads of team mem-bers, but note that their calculation and theoretical approach emphasized that responses should be evaluated for accuracy as well as for similarity.
The current approach compares team members’ responses to a single team member who is assumed to be best informed overall in all the queried probes. An alternative approach would be to iden-tify different team positions as best informed for different knowledge domains (different probes). The current data collections are not suitable for such an approach as the probes were designed to query general information that is relevant to all team members (although they may be more or less successful in obtaining that information).
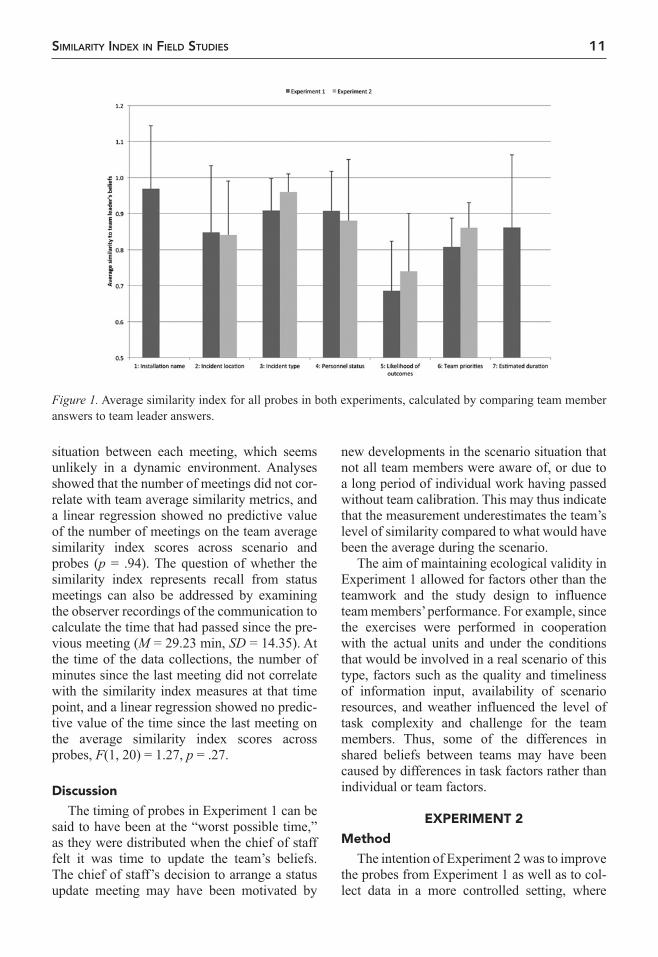
Distribution of shared beliefs. As the chief of staff may be assumed to be the on average
best informed team member in the current set-ting (see the Research Setting section above, and discussed later), we use the calculation from Algorithm 2 to examine the applicability of the current method in Experiments 1 and 2. Examining the scores for similarity to the chief of staff’s responses across scenario (shown in Figure 1) showed that the highest degree of agreement was on the installation name (Probe 1, measured for the first two time points only, M = 0.97, SD = 0.17), for incident type (Probe 3, M = 0.91, SD = 0.09), and for personnel status (Probe 4, M = 0.91, SD = 0.11). Agreement was lower for estimated duration (Probe 7, M = 0.86, SD = 0.20), for incident location (Probe 2, M = 0.85, SD = 0.19), and for the team’s priorities (Probe 6, M = 0.81, SD = 0.08) and lowest for incident outcomes (Probe 5, M = 0.69, SD = 0.14). Correlations were calculated between the team members’ scores for similarity to the chief of staff for the various probe questions at all time points. Probe 2 was correlated at p < .05 to probe 3, 4 and 5 (r = .49, .59 and .49, respec-tively), and probe 3 was correlated to probe 4 (r = .54). The positive correlations indicate that answering the same as the chief of staff in some probes increased the likelihood of also answer-ing the same in other probes. One-way ANOVAs for similarity to chief of staff with team position as an independent factor showed no significant differences (p = .54), indicating that no team position gave advantages over the others in attaining the same beliefs as the chief of staff.
A possible interjection against the use of the similarity index as a measure of SMM or an indicator of SA could be that it does not neces-sarily represent the information a team member has gathered and organized but merely repre-sents how much information the team member recalls from the previous status meeting. Decid-ing when a meeting was needed was left to the discretion of the chief of staff, and two of the teams had four meetings during the scenario, three teams had five meetings, and one team had six meetings. Note that the probes were responded to immediately prior to each meeting. In order for probes to merely measure recall from the previous meeting one must therefore assume that there is little development in the chief’s and the team members’ beliefs about the
Teamleader similarity index
teammember s answer teamleader
=
−−
1’ ’ss answer
highest answer(2)
Similarity index in Field StudieS 11
situation between each meeting, which seems unlikely in a dynamic environment. Analyses showed that the number of meetings did not cor-relate with team average similarity metrics, and a linear regression showed no predictive value of the number of meetings on the team average similarity index scores across scenario and probes (p = .94). The question of whether the similarity index represents recall from status meetings can also be addressed by examining the observer recordings of the communication to calculate the time that had passed since the pre-vious meeting (M = 29.23 min, SD = 14.35). At the time of the data collections, the number of minutes since the last meeting did not correlate with the similarity index measures at that time point, and a linear regression showed no predic-tive value of the time since the last meeting on the average similarity index scores across probes, F(1, 20) = 1.27, p = .27.
discussionThe timing of probes in Experiment 1 can be
said to have been at the “worst possible time,” as they were distributed when the chief of staff felt it was time to update the team’s beliefs. The chief of staff’s decision to arrange a status update meeting may have been motivated by
new developments in the scenario situation that not all team members were aware of, or due to a long period of individual work having passed without team calibration. This may thus indicate that the measurement underestimates the team’s level of similarity compared to what would have been the average during the scenario.
The aim of maintaining ecological validity in Experiment 1 allowed for factors other than the teamwork and the study design to influence team members’ performance. For example, since the exercises were performed in cooperation with the actual units and under the conditions that would be involved in a real scenario of this type, factors such as the quality and timeliness of information input, availability of scenario resources, and weather influenced the level of task complexity and challenge for the team members. Thus, some of the differences in shared beliefs between teams may have been caused by differences in task factors rather than individual or team factors.
ExpErIMEnt 2Method
The intention of Experiment 2 was to improve the probes from Experiment 1 as well as to col-lect data in a more controlled setting, where
Figure 1. Average similarity index for all probes in both experiments, calculated by comparing team member answers to team leader answers.
12 Month XXXX - Journal of Cognitive Engineering and Decision Making
more of the scenario variables were stable across the different teams tested. In contrast to Experiment 1, team members were notified about the times of data collections in advance. Team members were asked to report to the emergency center at 8:30 a.m. on the morning of data collection, and the scenario started at 9:00 a.m. A team of 8 to 10 actors in an adjacent room acted out the roles of the external units that the emergency center interacted with, such as the offshore installation manager, captains of nearby ships, hospital emergency staff, and the police. The scenario was acted out accord-ing to a predetermined script to ensure that the five teams’ performances were comparable. In the scenario, an offshore hydrocarbon produc-tion installation was threatened by a subsea gas leak from an unknown source, which was further complicated by difficult weather condi-tions and injured and missing personnel. The scenario was scripted to last 160 min. Probes were collected by sending an email to each team member’s workstation containing a link to an online questionnaire. Individual team member responses were identifiable in the data file through the workstation the emails had been sent to. In addition to the email notifica-tion, oral reminders were given at the time of distribution to ensure that all team members completed the probes. The probe questionnaires were distributed at predetermined time points, independent of the chief of staff’s status update meetings. The freeze points were scheduled at 5, 20, 40, 60, 80, 120, 140, and 160 min after scenario start, and the scenario was frozen for 3 to 5 min (in the sense that the actors stopped conversations and did not provide information to the team during freezes) to allow all team members to have time to complete the question-naires without falling behind on their workload. The probes were largely the same as those in Experiment 1, but Probes 1 and 7 were removed and others were changed to allow more rapid responses and to ensure more easily quantifiable forced-choice answer categories (listed in the right column of Table 1). The probe items were displayed on three sequential screen displays, with Probes 2 to 4 on Page 1, Probes 5 and 6 on Page 2, and confirmation of receipt and instruc-tions to return to task work on Page 3.
The same background variables were col-lected and observations made as in Experiment 1. In addition, the head of the acting staff answered a similar online form at each freeze time point, containing questions about which team members could be expected to know the aspects of the scenario queried in Probes 2 to 6. The chief of staff was fitted with audio-record-ing equipment to allow offline analysis of con-versations to score communication type and content. All team members were fitted with heart monitoring equipment for offline analysis of heart rate variability. Five teams (with some repeating team members) were tested within the course of 6 weeks.
resultsCompliance. Arranging the freeze points for
data collection required coordination between the team members and the actors running the scripted scenario. In cases where the freeze points would have coincided with the chief of staff’s intention to conduct a status update meet-ing, the freeze points were brought forward or delayed by a few minutes in relation to the planned schedule. In the first team’s data collec-tion, delays forced us to cancel two of the nine freeze points (at 60 min and at 140 min) to ensure the exercise remained meaningful to the team members.
The online questionnaires gave team members feedback if they missed a response, and team members were not allowed to continue to the next page until all the questions had been answered. This increased overall compliance in Experiment 2 compared to Experiment 1. Nevertheless, some team members missed all probes at some time points (scenario compliance M = 93.35%, SD = 21.09%), due to technical difficulties (not receiv-ing or reading the email), being unavailable or too busy at the time, or declining to participate. Some team members (M = 3.52%, SD = 18.46%) answered the first page of the questionnaire (Probes 2-4) but failed to complete the second page of the questionnaire (Probes 5-6).
Assessment of data collection. Probe 1 was not used in the data collection for Experiment 2, as it had shown little variation in Experiment 1. Probe 7, which had proved problematic in
Similarity index in Field StudieS 13
Experiment 1, was removed. It seems the com-plexity of Probes 4 and 6 was hard to express in pen-and-paper data collection, and these probes were better suited to the more structured response modality used in Experiment 2.
Analytical approach. Post hoc discussion with subject matter experts in the organization revealed that establishing a ground truth for validating the accuracy of probe answers was also difficult in Experiment 2. Despite running a scripted scenario, the actors had to adapt the scenario to the team’s requests and other idio-syncrasies of the scenario performance. Some of the information that was queried in the probes (such as the number of personnel reported miss-ing by the production installation) was described in the scenario script, whereas other probes que-ried information that was generated within the team or in the interaction between the team and the actors (such as how to evaluate possible out-comes and how the team prioritized different objectives).
Analysis of the head of the acting staff’s reports of who was expected to know what at each freeze point showed that the chief of staff was the team position expected to be optimally informed about the task and teamwork most of the time (97% of the freeze probes), whereas the rest of the team was expected to be optimally informed slightly later in the scenario (across all team positions, the estimates for the first four freeze probes were 27%, 84%, 94%, and 77%, and then 100% for the final five freeze probes). Note that this does not necessarily correspond to the head of the acting staff expecting the various team members to have accurate information at these times.
Comparing team members to team average and to the best-informed team member. To obtain an index for individual similarity to team average and similarity to the best-informed team member, the same approach as in Experi-ment 1 was used to calculate responses to freeze Probes 2 to 6 according to Algorithms 1 and 2. The following analyses are based on Algorithm 2, comparing responses to the chief of staff.
Distribution of shared beliefs. The similar-ity to chief of staff was highest in the probe
concerning incident type (Probe 3, M = 0.96, SD = 0.05), followed by personnel status (Probe 4, M = 0.86, SD = 0.18), the team’s priorities (Probe 6, M = 0.85, SD = 0.16), and incident location (Probe 2, M = 0.84, SD = 0.18), whereas agreement on incident outcomes was lower (Probe 5, M = 0.72, SD = 0.16). Means and stan-dard deviations for all probes in Experiment 1 and 2 are shown in Figure 1. Correlations across all measurement points showed Probe 2 to be correlated to Probe 7 (r = .13 at p < .05). One-way ANOVAs for scenario average similarity to chief of staff with team position as an indepen-dent factor showed no significant differences (p = .63), indicating that no team position gave advantages over the others in attaining the same beliefs as the chief of staff.
In Experiment 2, the probe questions were distributed at predetermined time points not known to the teams in advance. The difficulty in answering the questions may therefore have var-ied randomly between teams and time points according to how long it had been since the last status update meeting. Analyses were conducted to test whether the degree of similarity was determined by the total number of meetings or the time that had passed since the last meeting. The five teams had four, five, six, seven, and eight meetings. The number of meetings did not correlate with team average similarity metrics, and a linear regression showed no predictive value for the number of meetings on the similar-ity to chief of staff, F(1, 3) = 0.57, p = .51. At the time of the freeze probes, an average of 12.45 min (SD = 9.26) had passed since the last meet-ing. There was no correlation between the time passed since the last meeting and the similarity to chief of staff for each time point, and a linear regression showed no predictive value in the time passed since the last meeting on the simi-larity of probe responses, F(1, 34) = 0.16, p = .7.
discussionOne of the main challenges in both experi-
ments was to make the team members prioritize answering the probes over performing their task work. This was a particular problem in Experi-ment 1, where the external parties continued to act out the scenario while the team froze,
14 Month XXXX - Journal of Cognitive Engineering and Decision Making
but even in Experiment 2, where the exercise was arranged for the sole purpose of data col-lection, some team members were so involved in their task work that probe items were left unanswered. As in other studies with intermit-tent data collection, the multiple-choice probe questions may have steered the team members’ attention and their approach to the task work. In fact, one chief of staff informed us that he had used the probe items as a “checklist” for what he needed to include in the status update meetings. Some team members appeared to be frustrated when they were given factual ques-tions early in the scenario that they could not answer confidently, and when they felt their task work was too frequently interrupted by probe questions. Several team members expressed dismay over having to answer probes only 5 min into the scenario, which was before the first status update meeting for some teams. Our intention in including this freeze point was to measure the team’s baseline beliefs or assump-tions before they were informed by the chief of staff or through their task work. However, given the team’s frustration and their reluctance to estimate uncertain information, using such early freeze points may not be advisable.
A scripted scenario and a staff of actors were used in an attempt to control some of the factors that varied arbitrarily in Experiment 1, but there may still have been differences between the dif-ferent teams, for example, due to changes in the researcher or acting staff’s experience between each scenario run, and adapting the script to sce-nario feedback.
GEnErAl dIScuSSIonThe current study developed and field tested
a novel approach for measuring shared beliefs in teams working in operative settings such as an emergency preparedness organization in the hydrocarbon industry. The motivation for this approach was to develop a reasonable measure-ment of SMM and an indicator of SA that can be applied for teams working in complex and dynamic situations in which it is difficult to establish a ground truth. Based on discussions with professionals and pilot data collections, we developed probes for measuring beliefs about the team’s work and the external situation. Two different experiments were conducted with
somewhat different research goals and thus some differences in methodological approach. Experiment 1 aimed to have minimum intru-sion into a standard training exercise, whereas Experiment 2 aimed to have more experimental control, more data points, and higher compli-ance. Algorithm 1 was developed to index the extent to which individual beliefs coincided with the team’s average belief. Algorithm 2 was developed to obtain a similarity index between the responses of individual team members and the best-informed team member. High similarity index values indicated that an individual team member or the team in general chose response alternatives that had also been chosen by others, and low values indicated that team members chose response alternatives that had not been chosen by others, or had missed response alter-natives that others had chosen. The similarity index scores between probes showed the same pattern for Experiment 1 and 2 (see Figure 1). The probes appear to have been meaningful and relevant to the team members in both experi-ments. There was no indication that any team positions had advantages in answering any of the probes, indicating that the probes described general team aspects. The fact that the similarity index did not vary according to the time passed since last meeting indicated that the similarity index did not simply reflect the team member’s recall from the previous status update meeting.
The study provides a new approach to objec-tively measuring SMM and indicating SA in situations where a ground truth is unavailable. We argue that the similarity to team average or between team members can be used as a mea-sure of SMM, as answering the same as the rest of the team can be said to represent the team converging on the same understanding of the situation, task aspects, and task work. If the measurement is made in a setting where it can be assumed that the person in a given role should on average be better informed than other team members, one may assume that this person’s responses on average are closer to the objective reality, or at least that the person has on average more reliable responses than the other team members. It may thus be argued that the similar-ity between a team member and the best-informed team member can be used as an indica-tor of SA. The similarity index for individual
Similarity index in Field StudieS 15
team members provides an indication of the extent to which that member has the same beliefs about the situation as the rest of the team and a well-informed member of the team. Moreover, the average similarity index for a team indicates the extent to which the team is well coordinated and to what extent important information is dis-tributed among team members.
The measurement approach does not require a carefully controlled exercise or simulation to be arranged, or to carefully examine the events in retrospect, as the researcher makes no assump-tions about what the actual external situation is, but merely compares beliefs within the team. In theory, the approach can also be applied to real-life incidents if the workload allows team mem-bers to simultaneously answer probes.
Further studies may compare a similarity index to other measures of SMM and SA, such as subjective self-rating scales (e.g., SART; Tay-lor, 1990) or to measures of objectively accurate situation knowledge (e.g., SAGAT; Endsley, 1995a). The measurement approach can be used to identify consistencies within teams or within positions, to see the extent to which SMM or SA is determined by team-level characteristics or by having a given position in the team. The current experiments measured team members’ beliefs over the course of the scenario, with four to six measurements in Experiment 1 and nine mea-surements in Experiment 2. By calculating probe responses at different time points as repeated measures, one can examine how SMM or SA develops over time. For example, it is possible to envisage team members’ beliefs catching up with the chief of staff’s beliefs over time, or that higher levels of similarity are achieved as a sce-nario stabilizes. The input of new information into the scenario can also be followed to see if and when changes in the situation are made known to the whole team. In applied settings, differences in similarity index between the vari-ous task aspects can be used to inform the orga-nization about what aspects should be empha-sized in team training or in structural changes to the team’s work environment.
The comparison of beliefs between team members is crucial to the current approach. Saner and colleagues (2009) listed five different relationships that could exist between two team members A and B and the objective reality R: (a)
both A and B could have the same accurate beliefs (A = B = R), (b) A could have accurate beliefs, whereas B has inaccurate beliefs (A = R ≠ B), or (c) the other way around (A ≠ R = B), (d) both A and B could have inaccurate but dif-ferent beliefs (R ≠ A ≠ B ≠ R) or (e) they could both have inaccurate but similar beliefs (A = B ≠ R). The same relationships could exist in the current study, although we are restricted to knowing whether Persons A and B (or a larger team) have the same understanding of the situa-tion, as the current approach is naïve with regard to what is objectively true (R), instead compar-ing only the information overlap between A and B. Conditions a and e would thus be rated as high similarity, whereas b, c, and d would be rated as low similarity. Instead of comparing responses to “reality,” the current approach compares responses to the team average, as described in Algorithm 1 in the Results section, which presents given assumptions for and restrictions on the conclusions. Alternatively, if it can reasonably be assumed that one team member on average has better access to informa-tion or a better overview than the rest of the team, the other team members’ similarity to the best-informed team member can be calculated, as described in Algorithm 2 in the Results sec-tion. This would serve the same function as comparisons to reality for Saner and colleagues (2009), but with different inherent assumptions (see below).
Algorithm 2 in the current approach calcu-lated similarity between the team leader and the individual team members in a manner similar to the calculation used by Saner and colleagues (2009) to compare dyads of team members. However, Saner and colleagues emphasized the distinction between the concepts of similarity and accuracy in a team’s SA, and argued the need to measure both. Although we agree that such an approach may be preferable in situations that allow for it, in contexts where it is not pos-sible to assess the accuracy of beliefs, we may need to rely on similarity both as a measure in itself and as a proxy for the accuracy of the team members’ beliefs. Our attempts to measure accuracy objectively in the current study proved futile, even with a scripted scenario and exami-nation of audio recordings and event logs. A similarity index may easily be measured and
16 Month XXXX - Journal of Cognitive Engineering and Decision Making
calculated in ordinary training scenarios, whereas measuring accuracy requires consider-ably more resources to develop and analyze the scenario, which may be difficult to achieve for practitioners in most settings.
The underlying assumption of the current research approach is that shared cognitive states are beneficial to team processes. Higher degrees of shared information between team members were thus considered to reflect higher degrees of SMM and SA and lead to improved team perfor-mance. However, situations can also be envis-aged where a uniform view of the situation within the team is unfortunate. In situations where there is high group cohesion among a homogenous group, high stakes, an external threat, and recent failures, team processes known as groupthink may emerge (Janis, 1972). Under such conditions, the decision process is adversely affected, leading to effects such as rationalizing warning signals, overestimating the group’s abilities, and pressure for conformity. One should therefore be wary not only of teams with low similarity indices, but also of teams show-ing uniformly high degrees of similarity in spite of uncertain and dynamic situations with distrib-uted access to information. In operative settings, this can have the effect of a team being overly confident and focused on a certain understand-ing of an incident and acting accordingly, while ignoring indications that it may be heading in the wrong direction.
Moreover, when evaluating a team or individ-ual’s beliefs, a high level of correspondence between team member beliefs and the objectively true situation may intuitively be considered to be optimal. In emergency management work, how-ever, organizations and individuals often undergo “proactive leadership” training (Nudell & Anto-kol, 1988), which fosters a strategy based not on establishing an objectively true view of the situa-tion but rather on envisioning and preparing for a worst-case scenario on the basis of the available information. Thus, the focus may be not on know-ing facts such as the current extent of a fire and when it can be expected to be put out, but rather on how extensive the fire may become if initial firefighting efforts fail and what additional resources or actions will then be needed. Given such training, comparing an emergency prepared-ness team’s representation of an incident to the
objective reality of the incident (as would be done in objective SA measures) may indicate that the team overestimates the severity of the incident, whereas this is in fact a function of the team oper-ating in accordance with its training. Thus, if a team follows such a strategy, it may result in lower scores for objective measures of SA. On the other hand, the approaches suggested in the current study compare the beliefs within the team, so a team working on the basis of proactive lead-ership will be measured for the extent to which it envisages the same worst-case scenario, and the similarity index approach will thus be well suited to settings where such strategies are used.
Parts of the analysis in the current approach assume that one team member (in our case the chief of staff) can be considered to be the best-informed member of the team. This assumption should perhaps be rephrased to read that the chief of staff will be the best-informed member in a well-functioning team with an effective leader. However, a misinformed leader or a well-informed leader who has failed to communicate his or her understanding with the team will nega-tively affect the team members’ similarity index scores. There are likely to be cases where an indi-vidual team member has an accurate understand-ing of the situation, whereas the team leader does not. In such cases, the team member’s beliefs will have the effect of lowering the estimates of the team members’ SMM or SA. This may seem unfair to the individual team member whose beliefs are discredited despite an objectively accurate answer, yet the adjustment does reflect poor team processes. In the scenarios run in our two experiments, we suspect that in some cases an aspect of the incident had been normalized, but the chief of staff only informed the most directly involved team members about this while the rest of the team still believed the aspect to be in an alarm state. Nevertheless, if it can reason-ably be assumed that a specific team member should on average be better informed than the others, the suggested method could be used for measuring the accuracy of the team’s beliefs and thus predict SA, although there will be excep-tions contributing to measurement noise.
In the emergency preparedness center studied in the current experiments, the team consists of nine specialized experts responsible for han-dling different aspects of emergency. It can thus
Similarity index in Field StudieS 17
be assumed that some aspects of emergency management would be better known to some team members than to others (as argued by Jones & Endsley, 2002). In designing the probes, we took steps to ensure that the questions described knowledge that was not considered to be limited to only some of the team positions, but addressed aspects that all team members were expected to know about at all times. Our feedback to the organization’s management after data analysis confirmed that in an optimally functioning team, all team members would be expected to agree on the information measured by the probes at all time points. As described in the Introduction, an alternative approach for future studies could be to design probes that cover different aspects of technical expertise more familiar to certain team positions than others, and the analysis could use different team positions as the best-informed team member for different probes.
In addition to comparing answers to the chief of staff’s answers, the Results sections also pres-ent an alternative analysis approach, namely, to calculate the team’s average response to each question and calculate the extent to which the indi-vidual team member’s response deviated from the average answer. This would avoid some of the caveats discussed above (e.g., that an objectively correct answer may be scored as incorrect since the chief of staff’s answer is incorrect), but would introduce different caveats (e.g., that a recent change in the situation may be known only to a few, well-informed team members who would deviate from the team average). If a team member can be assumed to be closer to the objective truth than the others, it may make sense to follow our example and use this member’s answers as a basis for comparison, while keeping the inherent assumptions mentioned above in mind.
The current paper describes the development of tools for measuring SMM and SA by compar-ing individual team members’ beliefs to the team’s average beliefs or to the best-informed team member’s beliefs. The current examples are from contexts involving hydrocarbon indus-try emergency preparedness teams, but similar approaches may be useful in other situations where objective truth is unknown or unknow-able, although the assumptions inherent in the approach should be considered.
AcknowlEdGMEntSWe acknowledge the assistance of Evelyn-Rose
Saus (PhD), Sigurd William Hystad (PhD), Gry D. Tys-sebotn, Annette Marie Kollenborg, Astrid Lovise West-vik, and Daniel Hosøy in the data collection, and the assistance of Elisabeth Iren Dale (PhD) in developing the calculations. The second line emergency response organization of Statoil’s Development and Produc-tion Norway, Logistics and Emergency Preparedness served as our industry partner, and contributed to designing the probe items and running the scenarios. This research was funded by the Research Council of Norway’s PETROMAKS Program (Grant 189521).
rEfErEncESBolstad, C. A., Cuevas, H., Gonzalez, C., & Schneider, M. (2005,
May). Modeling shared situation awareness. Paper presented at the 14th Conference on Behavior Representation in Model-ing and Simulation, Los Angeles, CA.
Brown, I. D. (2002, March). A review of the “looked but failed to see” accident causation factor. Paper presented at Behavioural Research in Road Safety: Eleventh Seminar, London, UK.
Cannon-Bowers, J. A., & Salas, E. (1998). Individual and team decision making under stress: Theoretical underpinnings. In Making decisions under stress: Implications for individual and team training (pp. 17-38). Washington, DC: American Psycho-logical Association.
Cannon-Bowers, J. A., Salas, E., & Converse, S. (1993). Shared mental models. In J. N. Castellan (Ed.), Individual and group decision making (pp. 221-246). Hillsdale, NJ: Lawrence Erl-baum.
Cooke, N. J., Salas, E., Kiekel, P. A., & Bell, B. (2004). Team cognition: Understanding the factors that drive process and performance. Washington, DC: American Psychological Asso-ciation.
Dekker, S. W. A., Hummerdal, D. H., & Smith, K. (2010). Situa-tion awareness: Some remaining questions. Theoretical Issues in Ergonomics Science, 11, 131-135.
Edgar, G. K., Smith, A. J., Stone, H. E., Beetham, D. L., & Pritchard, C. (2000, December). QUASA: Quantifying and analyzing situational awareness. Paper presented at the IMCD People in Digitized Command and Control Symposium, Shrivenham, UK.
Endsley, M. R. (1994). Situation awareness in dynamic human decision making: Measurement. In R. D. Gilson, D. J. Garland, & J. M. Koonce (Eds.), Situational awareness in complex sys-tems (pp. 79-97). Daytona Beach, FL: Embry-Riddle Aeronau-tical University Press.
Endsley, M. R. (1995a). Measurement of situation awareness in dynamic systems. Human Factors, 37, 65-84.
Endsley, M. R. (1995b). Toward a theory of situation awareness in dynamic systems. Human Factors, 37, 32-64.
Endsley, M. R., & Jones, W. M. (2001). A model of inter-and intrateam situation awareness: Implications for design, training and measurement. In M. McNeese, E. Salas, & M. R. Endsley (Eds.), New trends in cooperative activities: Understanding system dynamics in complex environments (pp. 46-67). Santa Monica, CA: Human Factors and Ergonomics Society.
18 Month XXXX - Journal of Cognitive Engineering and Decision Making
Hone, G., Martin, L., & Ayres, R. (2006, September). Awareness—does the acronym “SA” still have a practical value? Paper presented at the 11th International Command and Control Research and Technology Symposium, Cambridge, UK.
Janis, I. (1972). Victims of groupthink: A psychological study of foreign policy decisions and fiascos. Boston, MA: Houghton Mifflin.
Jones, D. G., & Endsley, M. R. (1996). Sources of situation aware-ness errors in aviation. Aviation, Space, and Environmental Medicine, 67, 507-512.
Jones, D. G., & Endsley, M. R. (2002). Measurement of shared SA in teams: Initial investigation (SATech-02-05). Marietta, GA: SA Technologies.
Matthews, M. D., Eid, J., Johnsen, B. H., & Boe, O. C. (2011). A comparison of expert ratings and self-assessments of situation awareness during a combat fatigue course. Military Psychol-ogy, 23, 125-136.
McGuinness, B. (2004, June). Quantitative analysis of situational awareness (QUASA): Applying signal detection theory to true/false probes and self-ratings. Paper presented at the Command and Control Research and Technology Symposium, San Diego, CA.
Nudell, M., & Antokol, N. (1988). Handbook of effective emer-gency and crisis management. Lexington, MA: Lexington Books.
Patrick, J., & Morgan, P. L. (2010). Approaches to understanding, analysing and developing situation awareness. Theoretical Issues in Ergonomics Science, 11, 41-57.
Rousseau, R., Tremblay, S., Banbury, S., Breton, R., & Guitouni, A. (2010). The role of metacognition in the relationship between objective and subjective measures of situation aware-ness. Theoretical Issues in Ergonomics Science, 11, 119-130.
Sætrevik, B. (2013). Developing a context-general self-report approach to measure three-level situation awareness. Interna-tional Maritime Health, 64, 66-71.
Salas, E., Dickinson, D. L., Converse, S., & Tannenbaum, S. I. (1992). Toward an understanding of team performance and training. In R. W. Swezay & E. Salas (Eds.), Teams: Their training and performance (pp. 3-29). Norwood, NJ: Ablex.
Salas, E., Rosen, M. A., Burke, C. S., Nicholson, D., & Howse, W. R. (2007). Markers for enhancing team cognition in complex envi-ronments: The power of team performance diagnosis. Aviation, Space, and Environmental Medicine, 78(Suppl. 1), B77-B85.
Salmon, P. M., Stanton, N. A., Walker, G. H., Baber, C., Jenkins, D. P., McMaster, R., & Young, M. S. (2008). What really is going on? Review of situation awareness models for individuals and teams. Theoretical Issues in Ergonomics Science, 9, 297-323.
Salmon, P. M., Stanton, N. A., Walker, G., & Green, D. (2006). Situ-ation awareness measurement: A review of applicability for C4i environments. Applied Ergonomics, 37, 225-238. doi:S0003-6870(05)00055-4[pii]10.1016/j.apergo.2005.02.001
Saner, L. D., Bolstad, C. A., Gonzalez, C., & Cuevas, H. M. (2009). Measuring and predicting shared situation awareness in teams. Journal of Cognitive Engineering and Decision Making, 3, 280-308.
Taylor, R. M. (1989, October). The development of a tool for air-crew systems design. Paper presented at the AGARD AMP Symposium on Situational Awareness in Aerospace Opera-tions, Neuilly-sur-Seine, France.
Taylor, R. M. (1990, October). Situational awareness rating tech-nique (SART): The development of a tool for aircrew systems design. Paper presented at the Situational Awareness in Aero-space Operations conference, Copenhagen, Denmark.
Woods, D. D., & Sarter, N. B. (2010). Capturing the dynamics of attention control from individual to distributed systems: The shape of models to come. Theoretical Issues in Ergonomics Science, 11, 7-28.
Bjørn Sætrevik is a clinical psychologist with a PhD in cognitive neuroscience and has consulted on the design of safety critical work environments. He is a researcher at the University of Bergen, where he examines the impact of leadership, communication, and teamwork on cognition in operative teams and develops experimental models for risk behavior.
Jarle Eid is a professor in work and organizational psychology at the University of Bergen and has extensive experience from positions in the Norwe-gian Armed Forces and the Royal Norwegian Naval Academy. His research and professional experience includes personnel selection, training, human factors and safety, and intervention following critical inci-dents spanning 200 publications and presentations. He is dean of the Faculty of Psychology, University of Bergen and is a senior member of the Operational Psychology Research Group.
Related Documents