Trinity University Trinity University Digital Commons @ Trinity Digital Commons @ Trinity School of Business Faculty Research School of Business 2020 The Sentinel Effect and Financial Reporting Aggressiveness in the The Sentinel Effect and Financial Reporting Aggressiveness in the Healthcare Industry Healthcare Industry Jared Koreff Trinity University, [email protected] S. W. G. Robb G. Trompeter Follow this and additional works at: https://digitalcommons.trinity.edu/busadmin_faculty Part of the Business Administration, Management, and Operations Commons Repository Citation Repository Citation Koreff, J., Robb, S. W. G., & Trompeter, G. (2020). The sentinel effect and financial reporting aggressiveness in the healthcare industry. Accounting Horizons, 34(1), 131-149. http://doi.org/10.2308/ acch-52636 This Pre-Print is brought to you for free and open access by the School of Business at Digital Commons @ Trinity. It has been accepted for inclusion in School of Business Faculty Research by an authorized administrator of Digital Commons @ Trinity. For more information, please contact [email protected].

Welcome message from author
This document is posted to help you gain knowledge. Please leave a comment to let me know what you think about it! Share it to your friends and learn new things together.
Transcript
Trinity University Trinity University
Digital Commons @ Trinity Digital Commons @ Trinity
School of Business Faculty Research School of Business
2020
The Sentinel Effect and Financial Reporting Aggressiveness in the The Sentinel Effect and Financial Reporting Aggressiveness in the
Healthcare Industry Healthcare Industry
Jared Koreff Trinity University, [email protected]
S. W. G. Robb
G. Trompeter
Follow this and additional works at: https://digitalcommons.trinity.edu/busadmin_faculty
Part of the Business Administration, Management, and Operations Commons
Repository Citation Repository Citation Koreff, J., Robb, S. W. G., & Trompeter, G. (2020). The sentinel effect and financial reporting aggressiveness in the healthcare industry. Accounting Horizons, 34(1), 131-149. http://doi.org/10.2308/acch-52636
This Pre-Print is brought to you for free and open access by the School of Business at Digital Commons @ Trinity. It has been accepted for inclusion in School of Business Faculty Research by an authorized administrator of Digital Commons @ Trinity. For more information, please contact [email protected].

1
The Sentinel Effect and Financial Reporting Aggressiveness in the Healthcare Industry
Jared Koreff Assistant Professor School of Business Trinity University
1 Trinity Place San Antonio, Texas 78212
Phone: (210) 999-7347 [email protected]
Sean Robb* Associate Dean of Undergraduate Programs
College of Business University of Central Florida
12744 Pegasus Drive Orlando, Florida 32816 Phone: (407) 823-4414
Greg Trompeter C.G. Avery Professor of Accounting
Kenneth G. Dixon School of Accounting University of Central Florida
4000 Central Florida Blvd., P.O. Box 161991 Orlando, Florida 32816-1991
Phone: (407) 823-2871 [email protected]
September 2019
*Contact author
Acknowledgements: The authors would like to thank Kazeem Akinyele, Bonnie Brown, Mauro Oliveira, Seth Wilson, Bharat Sarath and workshop participants at the University of Central Florida, the University of Rhode Island, the 2016 CAAA Annual Meeting, the 2016 AAA Annual Meeting and the 2017 AAA Audit Midyear Meeting for helpful comments and suggestions. The authors would like to thank Ryan Firestone, Michael Mendonca and Andrew Thompson for assistance with data collection.

2
The Sentinel Effect and Financial Reporting Aggressiveness in the Healthcare Industry
Abstract The sentinel effect posits that the perception of increased oversight is associated with improved behavior. We consider the association between enhanced government oversight and financial reporting aggressiveness in the healthcare industry. Specifically, we examine the association between criminal cases (pending cases and successful cases) against healthcare providers and the quality of subjective accounts that require significant judgment and have been shown to be linked to healthcare earnings management – revenue accruals and the allowance for doubtful accounts. We find that heightened government oversight is associated with lower financial reporting aggressiveness.
Key words: Sentinel Effect, Financial Reporting Aggressiveness, Healthcare, Government Oversight

3
Introduction
The sentinel effect posits that increased perceived oversight improves the behavior of
those being observed. Prior work on the sentinel effect has examined the association between
increased government oversight and improved outcomes such as increased compliance (Howard
1998; Lindley et al. 2014) and reduced fraud in the healthcare industry (Thornton 1999). We
expand the area of inquiry to consider the effect of perceived oversight on financial reporting
aggressiveness for publicly traded entities in an industry subject to significant governmental
regulation: the healthcare industry (Vermeer et al. 2009). Specifically, we investigate the
relationship between prior year levels of government oversight as reported by the Office of the
Inspector General (OIG), and current year financial reporting aggressiveness. Oversight causes
individuals to be accountable to others, and accountability has been shown to influence decision
making in general as individuals may be expected to justify their beliefs, feelings or actions to
others (Lerner and Tetlock 1999). Oversight has also been shown to influence auditor decision
making (Koonce et al. 1995; Buchman et al. 1996; Cohen and Trompeter 1998), specifically
effort (Tan et al. 1997; Turner 2001), evidence evaluation and testing strategies (Asare et al.
2000).
We focus our analysis on financial reporting aggressiveness in the healthcare industry on
discretionary revenue and the allowance for uncollectible accounts (hereafter “the allowance”).
Due to the relative size of the revenue cycle and the high level of activity flowing through it,
government auditors view revenue as a prime account to test for error and/or intentional abuse
(DHHS 1998; Piper 2013; Center for Medicare and Medicaid Services (CMS) 2015). As a
result, government fraud oversight initiatives invariably target the revenue cycle, and any
management error/abuse would be reflected in discretionary revenue and the estimate of the
allowance.
4
Much prior research on discretionary accruals has centered on the use of total
discretionary accruals (Guay et al. 1996; DeFond and Zhang 2014), however, a limitation of
using total discretionary accruals is that these models provide biased and noisy estimates
(Bernard and Skinner 1996; Stubben 2010). Francis (2011) argues that environmental
characteristics may present opportunities where specific accrual accounts provide less biased and
less noisy measures. In the healthcare industry, the best example of such an accrual is the
allowance. While determining the allowance always requires estimation (Knechel et al. 2013;
McNichols and Wilson 1988), it is particularly difficult among healthcare entities where the
estimation is complicated by contractual allowances that have been negotiated between
healthcare providers and third parties that provide for reimbursement. For example, one must
adjust the allowance for changes in payor mix, estimates of revenue that will not be reimbursed
due to lack of payment from uninsured patients and contractual agreements between the
healthcare provider and various HMOs, for-profit insurance companies, Medicare, and
potentially multiple state Medicaid programs. Such complexity, combined with the potential for
disagreement among multiple parties about primary responsibility, can exacerbate the
complexity involved in determining a proper estimate for collectible amounts. Such complexity
can lead to disagreement among experts regarding proper account balances. It can also contribute
to errors and potentially be associated with fraud (as it may be easier to conceal asset
misappropriation or financial statement misstatement when it is difficult to determine an agreed
upon, accurate account balance).
With respect to fraud, the Office of Inspector General (OIG) is tasked with coordinating
federal, state and local law enforcement activities, including auditors from all these sources, to
combat healthcare fraud (DHHS and The DOJ 2015). Contractors may also be used to aid the
5
OIG in fraud investigations (DHHS 2012). Health care fraud investigations may be initiated by
various triggers including tips from whistleblowers or the identification of outliers. Given the
high inherent risk of revenue manipulation and the level of difficulty in estimating/verifying the
allowance account, there is potential for management manipulation in the revenue cycle
(McNichols and Wilson 1988; Leone and Van Horn 2005; Knechel et al. 2013). Coupled with
the high likelihood of government inspection of the revenue cycle, this makes discretionary
revenue and the allowance ideal settings to study the sentinel effect by examining the association
between perceived government oversight and financial reporting aggressiveness.
We consider the impact of prior year government oversight on the financial reporting
aggressiveness of domestic publicly traded healthcare providers from 1996 to 2012.
Specifically, we compare the sum of pending criminal cases and successful criminal cases
against healthcare providers (scaled by the number of Medicare beneficiaries in the USA) and
two variables: (1) the ratio of the allowance for doubtful accounts to total receivables (204
unique providers with 1,245 firm years), and (2) discretionary revenue (193 unique providers
with 1,214 firm years). The sum of pending criminal cases and successful cases was chosen as
the most appropriate measure of government oversight since it is the closest proxy for the
sentinel effect. The sum of pending and successful criminal investigations are not limited to only
successful fraud investigations, and as such, are a more effective measure of perceived
government oversight than focusing solely on successful investigations. The criminal
investigations include litigation for all types of healthcare providers (i.e., nursing homes, medical
laboratories, hospitals). Criminal investigations were chosen as the primary independent
variable, because criminal punishment may include imprisonment or payment of substantial fines
(United States Courts 2014a), whereas civil cases are less severe since they do not include the
6
possibility of imprisonment (United States Courts 2014b). Fines from criminal investigations
may include substantial amounts. For example, total fines from the notorious HealthSouth
criminal fraud case amounted to $1.7 billion (DOJ 2003).
Consistent with the sentinel effect, our results indicate that heightened oversight is
associated with lower financial reporting aggressiveness. These results have implications for
lawmakers and researchers. Our findings support claims that the sentinel effect has important
accountability and compliance effects that lawmakers should understand when contemplating
and/or creating new legislation. Additionally, this study builds upon the discussion of the
sentinel effect in the accounting literature (although not explicitly referring to it as the sentinel
effect) (Lamoreaux 2016). Although the healthcare literature cites the sentinel effect as having
an impact (Howard 1998; Thornton 1999), there has not yet been an empirical study explicitly
referring to the sentinel effect and examining its impact related to financial reporting
aggressiveness in conjunction with governmental oversight.
The remainder of this paper is organized as follows. The next section discusses prior
research and develops our hypothesis. This is followed by a description of the research design
and our sample selection. Results and additional analysis are provided and then we conclude and
offer implications of our findings.
Prior Research and Hypothesis Development
The Sentinel Effect
Accountability is based upon the expectation that one may be called upon to justify one’s
beliefs and behavior to others (Lerner and Tetlock 1999). When individuals are accountable to
an evaluator, they will select a course of action most likely to please their evaluator, and thus,
7
knowledge of the evaluator’s preferences can tilt one’s behavior in favor of the evaluator’s
preferences (Tetlock 1992, see also Antle 1982, Cohen and Trompeter 1998). Consistent with the
accountability literature, the sentinel effect suggests that perceived oversight is associated with
improved behavior.
Within the healthcare industry, Brown (1998), examined a sample of audits from the
Office of the Inspector General. Referencing the sentinel effect, she estimated that total improper
payments from the Department of Health and Human Services (DHHS), which includes CMS,
decreased from $23 billion to $12.6 billion between 1996 and 1998. Yet in Brown’s
memorandum to the administrator of the Health Care Financing Administration (now CMS), she
explicitly states “…we do not have empirical evidence supporting a specific causal relationship
between the error rate decline and corrective actions…” Improper payments identified as a
percentage of total program expenditures decreased from 14% in 1996 to 7% in 1998. Although
this demonstrates a decrease in improper and potentially fraudulent payments subsequent to
increased oversight, it may be attributable to other factors such as differences in resources
dedicated to oversight or simply identifying a greater number of less complex frauds in earlier
sample years (see also Thornton 1999).
Van De Bunt (2010) notes that the mere existence of a reviewer is likely insufficient to
cause a change in behavior. To be effective, those being supervised must be concerned that
supervision will target them (Van De Bunt 2010). For example, government oversight of
healthcare providers will only cause a change in providers’ behavior if providers believe there is
a reasonable possibility of receiving additional scrutiny. Related to this “reasonable possibility
of additional scrutiny”, and calling into question the impact of the sentinel effect, several
publicly traded healthcare providers financial statements include in their footnotes a statement

8
that such government oversight initiatives are seen as part of the ordinary course of business.
Specifically, one of the footnotes states “… Management cannot predict the outcome of such
matters. Although management does not anticipate that the ultimate outcome of such matters
will have a material adverse effect on the Company’s financial condition…”1 Thus, while the
sentinel effect predicts increased supervision is associated with increased enforcement and
penalties, this will only impact behavior when oversight is perceived as effective.2
Discretionary Revenue, the Allowance and the Healthcare Industry
In general, the revenue cycle and the allowance have been identified as areas where fraud
occurs (Brazel et al. 2009).3 There is considerable evidence suggesting that these accounts are
highly scrutinized (Schelleman and Knechel 2010; PCAOB 2012). Many healthcare fraud
schemes have been related to improper billing and the revenue cycle (Thornton 1999; Piper
2013), including two thirds of schemes identified by CMS in a recent report (CMS 2015a). As a
result, healthcare fraud prevention and detection initiatives have been designed to reduce
incidences of fraud associated with the revenue cycle (DHHS 2012, 2014, 2015 and OIG annual
reports on healthcare fraud publisehd since 1997). All of these items relate to the revenue cycle
1 See Quest Diagnostics 2011 Commitments and Contingencies footnote. The 10-K from the 10 largest providers in the sample were examined, and the footnotes revealed that 8 of them specifically reference government oversight/litigation as part of the ordinary course of business. 2 In related work, an increase in IRS audit activity has been found to be associated with improved taxpayer compliance (Hoopes et al. 2012; Atwood et al. 2012) and improved reporting quality (Hanlon et al. 2014). Additionally, tax reporting aggressiveness is associated with financial reporting aggressiveness (Frank et al. 2009). Although these studies were focused on tax behavior, their findings may be analogous to financial reporting aggressiveness implications in the revenue cycle. While the sentinel effect has been shown empirically to improve physician start times (Lindley et al. 2014) and decrease utilization of potentially wasteful healthcare services (Howard 1998), there is a lack of empirical evidence in an accounting setting to support this phenomenon - particularly with respect to deterring financial reporting aggressiveness. 3 Consistent with this claim, PCAOB inspections devote considerable resources to examining the revenue cycle (Glover et al. 2015). Such PCAOB inspections improve audit quality (Krishnan et al. 2017).

9
and thus the risk of recoupment of improper funds received would be reflected through
discretionary revenue, receivables and related allowances.
Revenue, receivables and allowances are particularly difficult to account for in the
healthcare industry. Healthcare providers (e.g., hospitals, nursing homes, doctor’s offices)
generate revenue by providing services and then submitting reimbursement requests to various
payers (e.g., government agencies such as Medicare or Medicaid, or private insurance companies
such as UnitedHealthcare or BlueCross Blue Shield).4 Providers’ requests for reimbursement of
services are subject to scrutiny from all of these payers. Furthermore, in the ordinary course of
business, requests are not reimbursed due to a variety of reasons including insufficient
documentation, lack of coverage, services being provided outside of the policy period, services
being provided by a non-network provider, or disagreement over which provider bears primary
responsibility. This scrutiny over reimbursement requests and the potential rejection of requests
is reflected in the amount of revenue recorded and the healthcare provider’s allowance.
Accrual accounts such as the allowance generally require subjective judgments and
estimates, increasing the likelihood of errors, biases and manipulation in reporting (Francis and
Krishnan 1999; Leone and Van Horn 2005; Knechel et al. 2013). Thus, it is not surprising that
the allowance account is subject to particular scrutiny in the healthcare industry. The complexity
arising from these collectability issues increases the professional judgment required to accurately
determine this estimate (Leone and Van Horn 2005). This issue has received considerable
attention in the academic literature (McNichols and Wilson 1988; Teoh et al. 1998; Jackson and
Liu 2010). As an example, in 2003 the HealthSouth fraud - the largest Healthcare fraud case up
to that time (DOJ 2003; Jones et al. 2008; Chung et al. 2008; Brazel et al. 2009; Glover et al.
4 The total dollar amount submitted for reimbursement is calculated by charge codes. Charge codes are made up of unique billable activities, and the dollar amount for each charge code is impacted by services provided (i.e., time in operating room (Balakrishnan et al. 2018)).

10
2015; Free and Murphy 2015) - began with the manipulation of the allowance (Beam 2015;
Smith 2016). While previous accounting research demonstrates that healthcare providers
respond to changes in government regulation (Blanchard et al. 1986; Eldenburg and Soderstrom
1996; Eldenburg and Kallapur 1997; Kallapur and Eldenburg 2005; Hao and Nwaeze 2015;
Holzhacker et al. 2015; Bai 2016), none of them do so in the context of changes to accruals,
discretionary revenue or financial reporting aggressiveness.
Financial Reporting Aggressiveness
Financial reporting decisions may be within GAAP or violate GAAP. Reporting within
GAAP may range from income decreasing “conservative accounting” to income increasing
“aggressive accounting”, whereas GAAP violations are fraudulent (Dechow and Skinner 2000).
While income decreasing earnings management is prevalent, it is less common than income
increasing earnings management (Dichev et al. 2013). Financial reporting aggressiveness entails
upward earnings management that may or may not be within the confines of GAAP (Frank et al.
2009). An example of aggressive accounting is intentionally understating the provision for bad
debts (Dechow and Skinner 2000). Perceived oversight could impact managers’ willingness to
report aggressively as well as auditors’ tolerance of aggressive reporting. Although the financial
statements are the responsibility of management, audits can lead to less misapplication of GAAP
and constrain aggressive reporting within GAAP. We do not attempt to separate these effects, as
our variable of interest could impact both managers and auditors in the same direction.
Thus, the sentinel effect suggests that as perceived government oversight increases
financial reporting aggressiveness will decrease. However, as previously discussed, several large
publicly traded healthcare providers consider government oversight to be part of the ordinary
11
course of business, suggesting there may not be a change to financial reporting aggressiveness in
response to changes in government oversight. Furthermore, as government reimbursement
accounts for less than 40% of industry-wide revenue (CMS 2015b), changes in governmental
oversight may not be associated with substantial enough dollar amounts to warrant a change in
financial reporting aggressiveness. Since the sentinel effect predicts improved behavior when
there is perceived oversight, if government oversight is not perceived as effective it would not
cause a change in financial reporting aggressiveness. We expect that the proxies for government
oversight described below in the method section will be effective at increasing perceived
oversight and ultimately curtail financial reporting aggressiveness. Thus, to test this financial
reporting aggressiveness expectation we offer the following hypothesis:
H1: Heightened government oversight is associated with less aggressive financial reporting.
Research Methodology
Variable and Sample Selection
Industry wide data relating to government oversight was collected from the annual
“Health Care Fraud and Abuse Control Program” reports published by government agencies and
financial statement data was collected from COMPUSTAT. As part of the Health Insurance
Portability and Accountability Act of 1996 (HIPAA), the OIG is required to create annual public
reports related to fraud prevention. Starting in 1997, the OIG, DHHS and the Department of
Justice (DOJ) began to jointly publish detailed annual reports entitled “Health Care Fraud and
Abuse Control Program”. These reports include the sum of criminal cases of all healthcare
providers that are currently being investigated and have been convicted by the previously

12
mentioned governmental agencies.5 These criminal cases include industry-wide metrics for
healthcare providers that are public, private and governmental and consist of various provider
types such as hospitals, home health agencies, physicians’ offices and nursing homes.7F
6 Thus,
industry-wide metrics are not limited to the publicly traded firms that comprise our sample.
A review of some of our sample’s larger providers’ 10-K disclosures (see footnote 1)
regarding pending litigation, reveals that such disclosures (including criminal matters) are not
specific, and thus it is not possible to identify which providers were facing pending litigation
during our sample period. As companies do not disclose specific pending litigation in their
financial statements, and the DOJ/OIG only report on the most egregious cases, data on firm-
specific pending litigation does not appear to be publicly available. Providers may become
aware of government oversight initiatives through trade associations (including conferences),
informal networking groups, news outlets (i.e., DOJ press releases), and consultants (i.e.,
attorneys, CPAs).8F
7
The sum of open and convicted criminal healthcare cases was scaled by the number of
individuals (in thousands) enrolled in Medicare in the USA (as a proxy for the size of the
healthcare industry) to ensure that changes in criminal cases were not attributable to changes in
5 An informal conversation with a DOJ employee revealed that several healthcare criminal investigations are referred to other governmental agencies, such as the SEC, depending on the nature of the fraud. Thus, there are other governmental agencies pursuing healthcare fraud investigations concurrently, and the DOJ only oversees the most egregious cases. An Annual Health Care Fraud and Abuse Control Program described pending cases as “Each time a criminal case is referred to a USAO from the FBI, HHS/OIG, or other enforcement agency, it is opened as a matter pending the district. A case remains a matter until an indictment or information is filed or the case is declined for prosecution” (DHHS and DOJ 1997, 22). The convicted measure includes guilty pleas and guilty verdicts (DHHS and DOJ 1997). 6 Although the healthcare industry consists of many not-for-profit providers, we limit our sample to firms available in COMPUSTAT. 7 Anecdotal evidence from discussions with two healthcare audit partners and one manager from regional and national firms averaging 13 years of experience, confirmed that this is often how providers typically become aware of changing government oversight. The auditors confirmed that changing government regulation is an integral part of planning the audit, especially when a client is under investigation.
13
the size of the healthcare industry. Information for the number of individuals enrolled in
Medicare in the USA was obtained from the CMS website.8
Government oversight could be evaluated through several measures. We selected the
sum of pending criminal cases plus the number of criminal convictions, by year, as the most
appropriate proxy for government oversight as we believe it is theoretically the closest proxy to
the sentinel effect. This proxy for government oversight has the advantage of being an objective
measure of government oversight activity and is not limited to successful fraud investigations.9
See Table 1 for a summary of the market wide sum of pending and convicted criminal cases,
scaled by the total number of Medicare beneficiaries in the USA in each sample year (as reported
by CMS).
[Insert Table 1 here]
F Other metrics beyond sum of pending and convicted criminal cases were also considered.
For example, one could evaluate government oversight with reference to civil investigations.
However, civil penalties are often less severe than criminal penalties and lack the threat of
imprisonment (United States Courts 2014b). 11F
10 1Since criminal metrics are more severe than civil
ones, we opted to use criminal metrics in our analysis.11 We could have employed the total
amount of government resources (funds) dedicated to enforcement, but we felt that if the funds
are not used efficiently, then they may not have an effect on the industry. The problem with
using the amount of resources (funds) recovered in successful prosecutions is that a fraud case 8 Data was obtained from CMS’ website from the “Historical Enrollment data” file under the “Medicare Enrollment Reports” option in the “Research, Statistics, Data & Systems” tab. https://www.cms.gov/Research-Statistics-Data-and-Systems/Statistics-Trends-and-Reports/CMSProgramStatistics/Dashboard.html. Although data for the total number of Medicare providers would be a preferred scaling variable, this data is not publicly available from CMS for nearly 2/3 of the sample period. 9 Anecdotal evidence from three healthcare audit partners averaging 30 years of experience from regional to international accounting firms suggest that criminal investigations can last from six months to more than five years. 10 The “Healthcare Fraud and Abuse Control Programs” reports discussed above provide examples of individuals being fined and facing jail time as a result of committing healthcare fraud. 11 Given the prevalence of directors’ and officers’ insurance, the effect of civil measures is unclear.
14
may impact multiple years—thus it is difficult to attribute specific funds recovered to a given
fraud in a given year.12
Healthcare provider financial data was obtained from COMPUSTAT. Although the
initial OIG report was in 1997, this report included criminal oversight metrics dating back to
1995. Since we employ change measures for some variables, the initial year for our analysis is
1996. Our sample period ends at the end of 2012 since healthcare legislation required adults to
have insurance beginning in 2013 (decreasing the number of uninsured adults and eliminating
this payor category). Consistent with previous research, we use SIC codes between 8000 and
8099 to identify healthcare providers (Guenther and Rosman 1994; Fama and French 1997;
Hogan and Jeter 1999). Firms with missing data were excluded from the analysis (see Table 2).
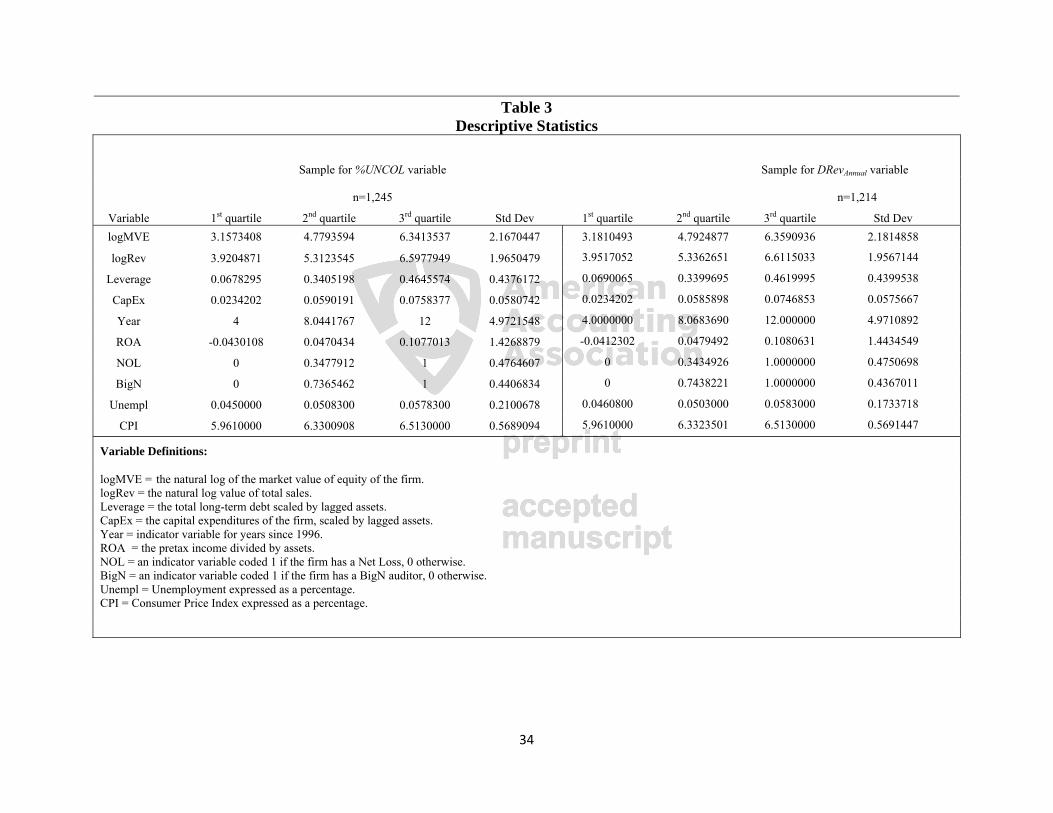
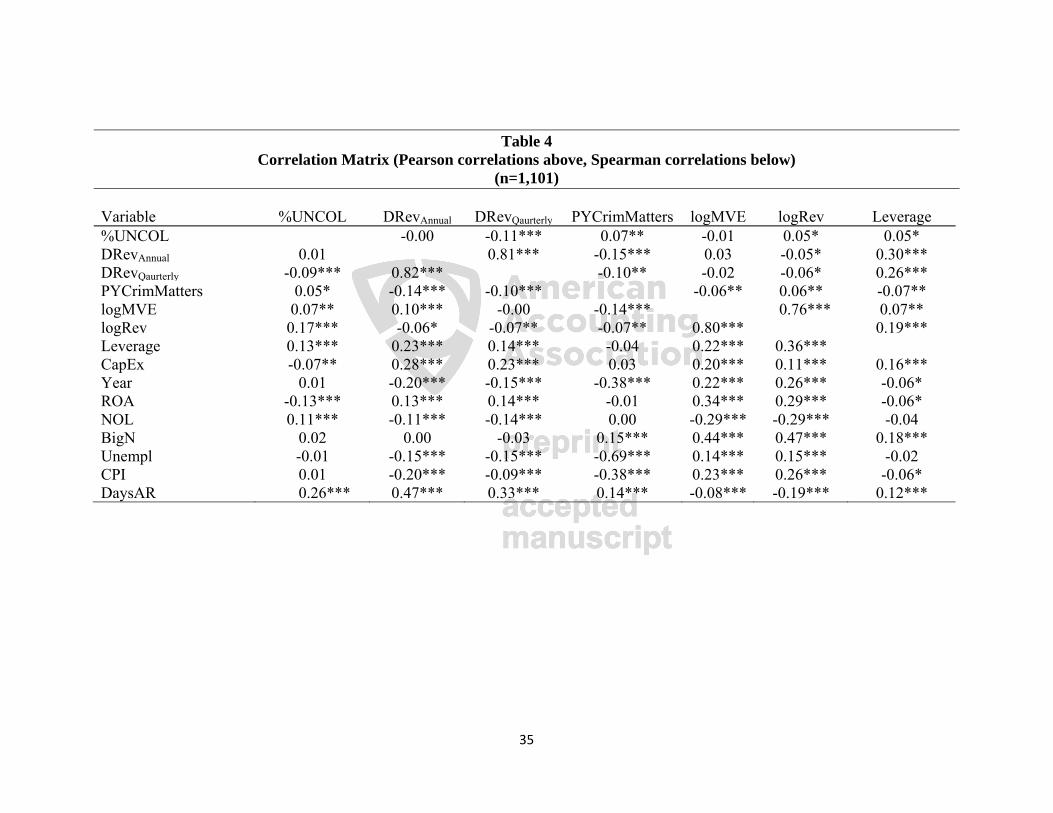
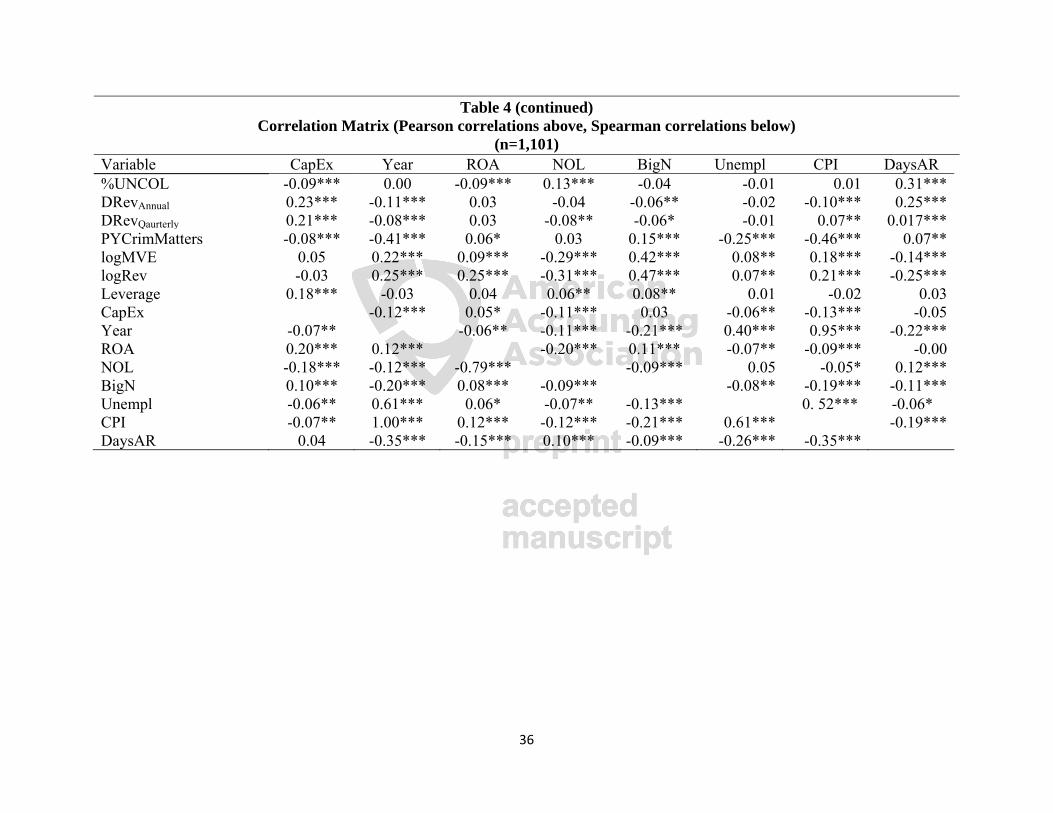
Table 3 reports descriptive statistics for our sample and Table 4 provides the correlation matrix
for the variables that we employ. In Table 4 the Pearson (above the diagonal) and Spearman
(below the diagonal) correlations are presented. Our sample selection procedure yielded 204
healthcare organizations and 1,245 useable firm-year observations for our first dependent
variable (ratio of allowance to total receivables) and 193 healthcare organizations and 1,128
useable firm-year observations for our second dependent variable (discretionary revenue), across
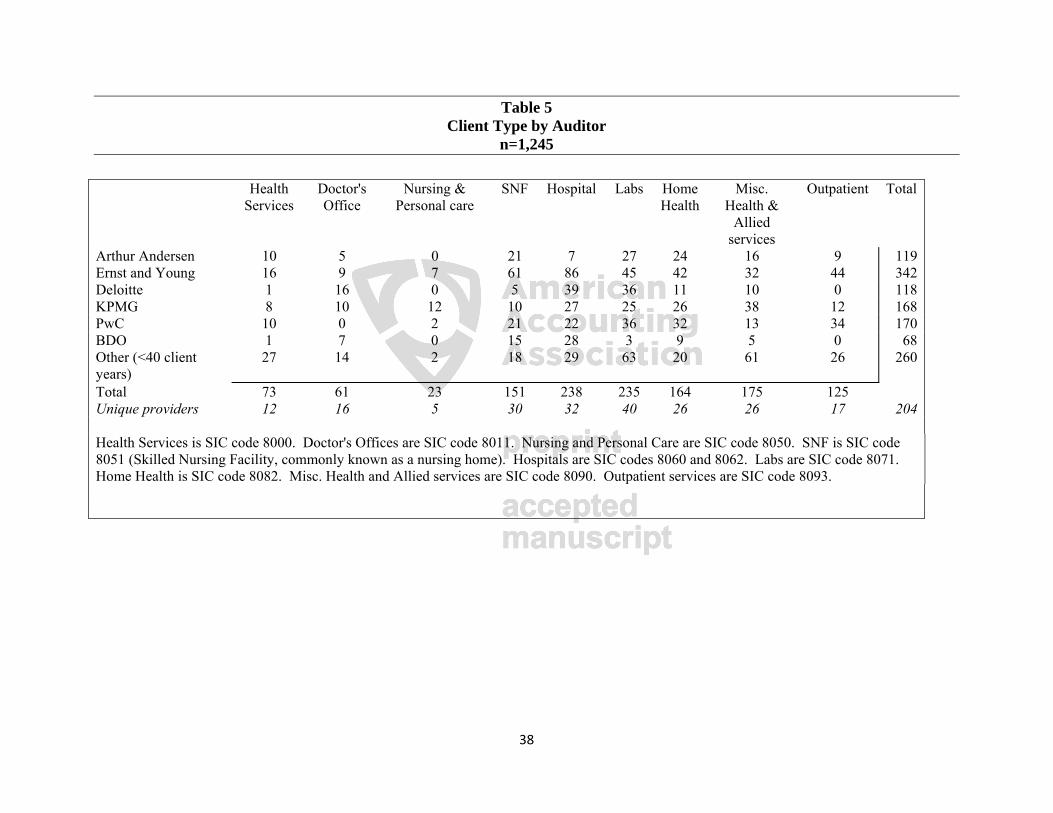
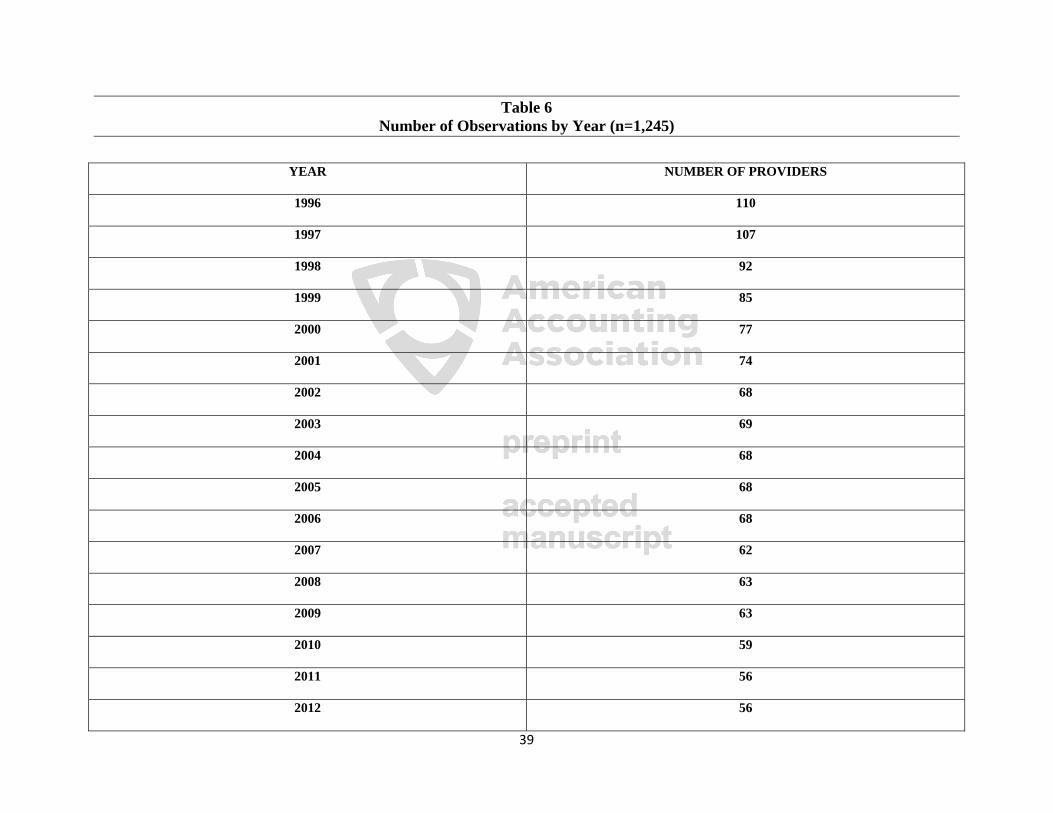
nine subindustries. Table 5 presents a breakdown of the subindustry years by auditor in the final
sample and Table 6 presents a distribution of observations by year.
[Insert Tables 2 through 6 here]
12 For example, a 2003 DOJ press release indicated that HealthSouth engaged in fraudulent activity and agreed to a $1.7 billion settlement (DOJ 2003). However, CMS only collected (approximately) $1 billion dollars from all fraudulent activity penalties in that year. This was followed by a spike in collections during the next year of (approximately) $725 million. This suggests that the HealthSouth penalties were not paid in a single period and is consistent with the claim that funds recovered from successful prosecutions may affect multiple years. The alternative weaker proxies for government oversight were examined for additional analysis, however the primary results are not robust to these weaker variables for the reasons discussed in this section and the hypothesis development.

15
Multivariate Analysis
We examine financial reporting aggressiveness by using two proxies: the allowance and
discretionary revenues. Discretionary accruals such as the allowance, have been used to measure
financial reporting aggressiveness in the past (Kothari et al. 2005; Frank et al. 2009).
4FEnvironmental factors of the audit engagement may impact which discretionary accrual model is
most appropriate for a given setting (Knechel et al. 2013) or present opportunities for variations
of these proxies (Francis 2011). This study addresses a concern from previous research that
accrual models provide biased and noisy estimates (Bernard and Skinner 1996; Stubben 2010) by
instead examining one accrual account (the allowance). Since our goal is to draw upon the
sentinel effect to examine financial reporting aggressiveness in the presence of government
oversight (an external factor), we believe that focusing on one discretionary account (the
allowance) best captures the nuanced interaction of these features in our healthcare setting as this
is the financial statement account where a response to perceived government oversight activity
would most likely be reflected. We do not believe that the coarser, alternative approach of using
a total discretionary accrual model would provide as good a proxy for financial reporting
aggressiveness in the healthcare industry. Thus, while much of the previous accounting research
has generally focused on total discretionary accruals (Guay et al. 1996; DeFond and Zhang
2014), the characteristics noted above present a unique opportunity to examine the effect of one
specific external factor, government oversight (the impact of the sentinel effect), on one specific
discretionary account, the allowance. This direct link decreases the potential impact of
confounding factors and measurement error that can arise when using broader discretionary
accruals measures (Francis 2011).5F
13
13 High measurement error has been a criticism of previous discretionary accrual research (DeFond and Zhang 2014).

16
The second dependent variable measures discretionary revenue (annually and quarterly),
as the difference between the actual change in receivables and the predicted change in
receivables (Stubben 2010). While discretionary accrual models have received significant
attention in the accounting literature (DeFond and Zhang 2014), discretionary revenue models
are less biased, better specified and more powerful than commonly used accrual models (Stubben
2010). Modeling discretionary revenue can identify earnings management (McNichols and
Stubben 2008; Stubben 2010; Call et al. 2014).
To test the prediction that financial reporting aggressiveness increases during periods of
heightened government oversight we estimate the following ordinary least squares regression
model (modified from Hoopes et al. 2012):
%UNCOLit= β0 + β1PYCrimMatterst-1 + β2logMVEit + β3logRevit + β4Leverageit +
β5CapExit + β6ROAit + β7NOLit + β8BigNit + β9Year + β10Unemplit + β11CPIit + β12DaysAR
+ Σ firm fixed effects + eit (1)
Where:
%UNCOL = the allowance for doubtful accounts scaled by total receivables;
PYCrimMatters = the sum of pending and convicted criminal cases scaled by the number of Medicare beneficiaries in the USA in year t-1;
logMVE = log of the market value of equity;
logRev = log of total sales;
Leverage = total long-term debt scaled by lagged total assets;
CapEx = capital expenditures scaled by lagged total assets;
ROA = return on assets calculated as pretax income scaled by total assets;

17
NOL = net loss indicator variable coded 1 if the firm reports a net loss, 0 otherwise;
BigN = indicator variable coded 1 if the firm has a BigN auditor in year t, 0 otherwise;
Year = control variable for year;
Unempl = Unemployment rate;
CPI = Consumer Price Index for medical care;
DaysAR = 365 / (sales / receivables);
Σ firm fixed effects = firm fixed effects (to account for unobserved time invariant heterogeneity across different providers); and,
e = error term.
Dependent Variables
The dependent variable %UNCOL is the proportion of the allowance for doubtful accounts
to total accounts receivable. In addition to the %UNCOL variable we also examine an annual
measure of discretionary revenue (DRevAnnual) as a dependent variable. Consistent with prior
research (see McNichols and Stubben 2008; Stubben 2010; Hope et al. 2013), we calculate
annual discretionary revenue as the residual of:
ΔARit = β0 + β1ΔSit + eit (2)
Where:
ΔAR = the change in accounts receivable;
ΔS = the change in annual revenues
e = error term (i.e., DRevAnnual).

18
To ensure the robustness of the findings for discretionary revenue, Stubben (2010) provides
a model to estimate revenues uncollected at year end. A limitation of equation (2) is that revenue
manipulation in early quarters reversed by the end of the year would not be captured. Thus, to
ensure the robustness of our findings for discretionary revenue we also examine the residual
(DRevQuarterly) of the following model:
ΔARit = β0 + β1ΔR1_3it + β2ΔR4it + eit (3)
Where:
ΔAR = the change in accounts receivable;
ΔR1_3 = the change in revenues from the first three quarters
ΔR4 = the change in revenues from the fourth quarter
e = error term (i.e., DRevQuarterly).
The DRevAnnual and DRevQuarterly variable calculated in equations (2) and (3) respectively are
used in place of the %UNCOL dependent variable in equation (1) as an additional test of our
hypothesis. Consistent with Stubben (2010) we deflate all variables in the discretionary revenue
calculations by average total assets. For additional analysis, we hand collected the write-offs of
accounts receivable from Schedule II of our sample firms’ 10-K reports. Although Schedule II is
required, some firms omit this disclosure, which is consistent with prior research (Jackson and
Liu 2010). If firms did not present this information in Schedule II, and the information could not
be obtained from alternative sources, they were excluded from the sample examining this
dependent variable.
19
Independent Variables
The primary variable of interest is PYCrimMatters which indicates government oversight
activity. Client size has been shown to be associated with audit quality (Carson et al. 2013;
DeFond and Zhang 2014) and compliance (Atwood et al. 2012; Hoopes et al. 2012). Consistent
with previous literature (Hoopes et al. 2012), we control for firm size with the natural logarithms
of revenue (logRev) and the market value of equity (logMVE) in year t. Leverage (Leverage) and
return on assets (ROA) have been shown to impact compliance (Hoopes et al. 2012; Atwood et
al. 2012) and audit quality (DeFond and Zhang 2014). Capital expenditures (CapEx) have been
shown to influence compliance (Hoopes et al. 2012). The presence of a net loss (NOL) and
auditor size (BigN) have also been shown to impact audit quality (Becker et al. 1998; Francis et
al. 1999; Kim et al. 2003). Additionally, a Year variable was included to control for annual
abnormalities and firm fixed effects are included to control for unobserved time invariant
heterogeneity across providers.
We also controlled for additional healthcare industry-specific factors. To control for
macroeconomic effects that could impact trends in uninsured patients, the level of
unemployment in the United States was hand collected from the Bureau of Labor Statistics. The
Consumer Price Index (CPI) of Medical Care services from the Bureau of Labor Statistics was
also hand collected and included in the analysis. Prior healthcare research has focused on
hospitals and employed control variables such as patient days (Eldenburg and Kallapur 1997;
Brickley and Van Horn 2002), number of beds (Eldenburg and Kallapur 1997; Brickley and Van
Horn 2002; Pizzini 2006), revenue per admission and changes in occupancy rates (Eldenburg and
Soderstrom 1996). Although such control variables would be appropriate for certain provider
subindustries within our sample (i.e., hospitals, nursing homes), they would not be relevant or

20
appropriate for other providers (i.e., labs, physician’s offices, etc.). Thus, these variables were
not included in the primary analysis since including these variables in our model would require
excluding entire subindustries from the analysis and limit the inferences to be drawn from this
study. Instead, we provide a hospital subindustry analysis as part of our additional analysis.
Results
The primary model includes several control variables that are expected to impact
financial reporting aggressiveness. The control variables significant for all three measures of
financial reporting aggressiveness were Leverage, NOL and DaysAR. Specifically, firms with a
higher leverage ratio report a lower %UNCOL (p<0.001), and greater discretionary revenue
(p<0.001 for DRevAnnual, and DRevQuarterly). Firms with a Net Loss report a higher %UNCOL
(p<0.001), and lower discretionary revenue (p=0.003 for DRevAnnual, and p<0.001 for
DRevQuarterly). Finally, firms reporting greater days of accounts receivable outstanding report a
greater %UNCOL (p<0.001), and greater discretionary revenue (p<0.001 for DRevAnnual, and
DRevQuarterly).
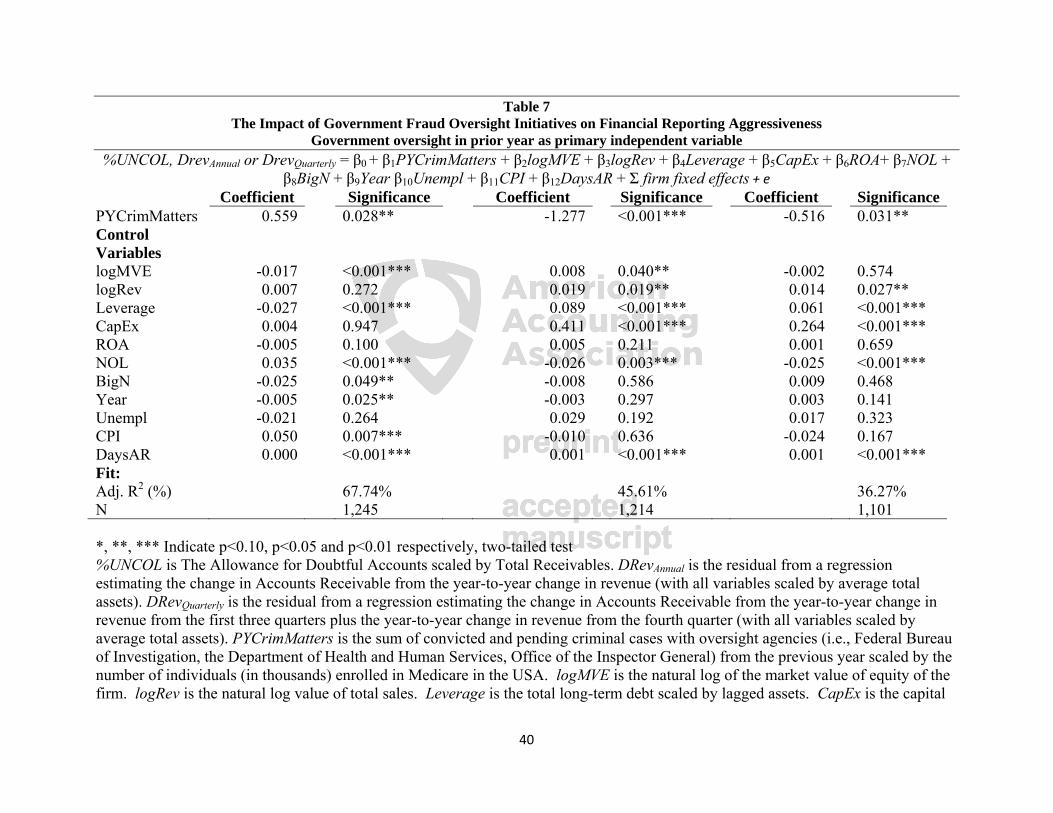
Table 7 reports results from the estimation of equation (1) for the dependent variables.
The primary independent variable of interest, PYCrimMatters, is significant and positive
(p=0.028) in the %UNCOL variable model. Results demonstrate that a 1 percentage point
increase in government oversight is associated with a more than half percentage point increase in
the allowance as a percentage of total receivables. Thus, a relatively small increase in
government oversight results in a large increase in the allowance. Similarly, PYCrimMatters is
significant and negative in the discretionary revenue models (p<0.001 for DRevAnnual and
p=0.031 for DRevQuarterly). These results suggest that a 1 percentage point increase in

21
government oversight is associated with a 1.277 percentage point (over a half a percentage point)
decrease in annual (quarterly) discretionary revenue. These results demonstrate that a relatively
small increase in perceived government oversight is associated with decreased levels of
discretionary revenue. Overall these results demonstrate that, consistent with the sentinel effect
(H1), an increase in government oversight is associated with lower financial reporting
aggressiveness.
[Insert Table 7 here]
Additional Analysis19F
14
Write-offs
To test the robustness of our results, we use hand collected write-off data to construct an
additional measure of financial reporting aggressiveness, as this measure impacts the change in
the allowance (McNichols and Wilson 1988). We re-estimate our primary model using write-
offs scaled by total receivables as the dependent variable. We find that our government
oversight results are consistent for write-offs (see Table 8 for complete results). Thus, when
government oversight activity increases, firms increase the write-offs of uncollectable accounts
(p=0.075), suggesting lower financial reporting aggressiveness.
[Insert Table 8 here]
Portfolios
To further examine the robustness of our results, we split our sample into portfolios in a
manner consistent with McNichols and Wilson (1988). We create 17 portfolios based upon the
14 We considered using the ratio of market to book value as the dependent variable, however due to missing data this would result in excluding nearly 70% of the sample from the analysis.
22
amount of government oversight, by using the primary independent variable PYCrimMatters as
the criteria for forming the portfolios. Consistent with McNichols and Wilson (1988), we use a
Wilcoxon test to compare the lowest ranked portfolio to the rest of the sample. Our results
(untabulated) demonstrate that when government oversight is lowest, financial reporting
aggressiveness is higher, as highlighted by the allowance and write offs being lower (Z=-1.517,
p=0.065 and Z=-1.768, p=0.039 respectively), and discretionary revenues being higher (Z=5.453,
p<0.001 and Z=3.828, p<0.001 for DRevAnnual and DRevQuarterly respectively). Additional
analysis was performed comparing the lowest two portfolios to the remainder of the sample, and
the results remain robust for write offs (Z=-2.354, p=0.009) and discretionary revenue (Z=8.366,
p<0.001 and Z=5.798, p<0.001 for DRevAnnual and DRevQuarterly respectively). Thus, financial
reporting aggressiveness is higher when government oversight is lowest.
Hospital Subindustry Analysis
As much of the prior healthcare research focuses exclusively on hospitals (Blanchard et
al. 1986; Eldenburg and Soderstrom 1996; Eldenburg and Kallapur 1997; Kallapur and
Eldenburg 2005; Pizzini 2006; Bai 2016), and hospitals make up the largest subindustry of our
sample (comprising approximately 19% of the total sample), we conducted a subindustry
analysis using only the hospitals in our sample. Analysis of this subindustry requires hand
collection of subindustry specific data from the Medicare cost reports publicly available on
CMS’ website - specifically the total number of Medicare days and total bed days. We included
the percentage of Medicare days scaled by the total number of bed days in our model. Although
our primary results are not robust for all of the dependent variables (which is likely attributable
23
to inherent limitations in the cost report data15), the results are robust for the DRevAnnual variable
(see Table 9 for results). These results demonstrate that hospitals report lower levels of
discretionary revenue when the hospital delivers a greater portion of Medicare services and
government oversight increases (p=0.064 and p=0.066 respectively).
[Insert Table 9 here]
Other Governmental Regulation
Prior work suggests that earnings management via accruals increased up until the passage
of SOX in 2002, followed by a significant decline (Cohen et al. 2008). To examine the impact of
SOX on the allowance account, sensitivity analysis was conducted after controlling for the
passage of SOX, as well as controlling for the year 2008. In 2008, the Affordable Care Act was
passed and the financial crisis occurred, resulting in layoffs which caused many people to lose
their insurance coverage, thus increasing the number of private pay customers. Our primary
analysis was re-estimated after controlling for these variables both individually and jointly.
Overall, when these variables are significant, the results (untabulated) are consistent with our
main results in Table 7, suggesting that changes in other government regulations and changes in
the economic environment during our sample period do not impact the inferences drawn from
this study.
15 Prior research has identified several limitations in the cost report data including incomplete data (Lamboy-Ruiz et al. 2018) and inaccurate data (Kane and Magnus 2001; Chen et al. 2004; Ozmeral et al. 2012). Complete data was only available for 125 hospitals in the sample. Given these data limitations and the labor intensive nature of hand collecting this subindustry data, we limit our subindustry analysis to hospitals.

24
Conclusion
We demonstrate that consistent with the sentinel effect, heightened government oversight
is associated with lower financial reporting aggressiveness in the healthcare industry.
Specifically, increased government oversight of healthcare fraud is associated with lower
financial reporting aggressiveness among healthcare providers. This is consistent with prior
research showing that weaker government oversight adversely impacts financial reporting
(Burgstahler et al. 2006; Holthausen 2009). This study contributes to the academic accounting
literature by explicitly using the sentinel effect to provide theoretical support for findings related
to government oversight. These findings have implications for regulators and lawmakers who
may want to consider including sentinel effect benefits in their cost-benefit analysis when
formulating public policy.
Our additional analyses demonstrate that our main results are robust with respect to
write-offs. Generally, prior literature has examined all discretionary accounts together, resulting
in biased and noisy estimates (Bernard and Skinner 1996; Stubben 2010). In contrast, our study
focuses on discretionary revenue and a specific discretionary account that is targeted by external
investigators. We believe that our findings from examining a specific measure of financial
reporting aggressiveness are less likely to be influenced by extraneous factors. Future research
may seek to examine additional proxies for financial reporting aggressiveness and examine how
other factors such as audit fees and non-audit services are impacted by government oversight.
We note that the data employed in this study is limited to for-profit public healthcare
firms. In a study of US hospitals, Pizzini (2006) reported that private not-for-profit hospitals
make up approximately 60% of the hospitals in the United States, while the remaining portion is
comprised of for-profit hospitals (18%) and government hospitals (22%). Although this
25
distinction relates to only the hospital subindustry group in our sample, it demonstrates that a
large portion of healthcare providers were excluded from our analysis due to the lack of publicly
available information.
The differences between not-for-profit and for-profit hospitals manifests in a variety of
ways; for example, receiving donations (Krishnan and Schauer 2000; Leone and Van Horn
2005), and stakeholders being more concerned about resources going towards the organization’s
mission (and thus not-for-profit hospitals are required to disclose program expenses (Quosigk
and Forgione 2018)). Further, only not-for-profit hospitals are subject to the scrutiny of
providing sufficient charity care to maintain tax-exempt status (Bain et al. 2001), particularly
when reporting high profits (Jervis Wilkicki 2001; Leone and Van Horn 2005). For-profit
healthcare provider’s executives can be paid bonuses based solely on financial performance,
while not-for-profit executives cannot (Brickley and Van Horn 2002). While for-profit firms
seek to a show a steady increase in earnings (Burgstahler and Dichev 1997; Barth et al. 1999),
not-for-profit organizations are must adhere to the zero profit constraint (Leone and Van Horn
2005) and seek to minimize variance in reported earnings (Hoerger 1991). Thus, we
acknowledge that there are many key strategic and operational differences between for-profit and
not-for-profit hospitals.
We are however comforted by the findings of previous research that demonstrates that
for-profit and not-for-profit hospitals share numerous similarities (Brickley and Van Horn 2002;
Leone and Van Horn 2005). Along with for-profit hospital managers, not-for-profit hospital
managers focus on financial performance, as financial resources are still needed for cushioning
future shortages (Brickley and Van Horn 2002). Not-for-profit and for-profit hospitals seek to
avoid losses and use the same accounts/activities to do so (Leone and Van Horn 2005). Thus, it

26
is not implausible that private healthcare providers exhibit a similar change in financial reporting
aggressiveness, consistent with the results we document for our sample of public firms.

27
References
Asare, S. K., A. M. Wright, and G. M. Trompeter. 2000. The effect of accountability and time budgets on auditors’ testing strategies. Contemporary Accounting Research 17 (4): 539–560.
Atwood, T. J., M. S. Drake, J. N. Myers, and L. A. Myers. 2012. Home country tax system characteristics and corporate tax avoidance: International evidence. The Accounting Review 87 (6): 1831–1860.
Bai, G. 2016. Applying Variance Analysis to Understand California hospitals’ expense recovery status by patient groups. Accounting Horizons 30 (2): 211–223.
Bain, C. E., A. I. Blankley, and D. Forgione. 2001. The Methodist Hospital System: Tax exemption and charitable responsibilities of not-for-profit hospitals. Issues in Accounting Education 16 (1): 67–97.
Balakrishnan, R., D. Koehler, and A. Shah. 2018. TDABC: Lessons from an application in healthcare. Accounting Horizons 32 (4): 31–47.
Barth, M. E., J. A. Elliott, and M. W. Finn. 1999. Market rewards associated with patterns of increasing earnings. Journal of Accounting Research 37 (2): 387–413.
Beam, A. 2015. Fraud, Lies & Hermes Ties. Las Vegas, NV: AICPA Health Care Industry Conference.
Becker, C. L., M. L. Defond, J. Jiambalvo, and K. R. Subramanyam. 1998. The effect of audit quality on earnings management. Contemporary Accounting Research 15 (1): 1–24.
Bernard, V. L., and D. J. Skinner. 1996. What motivates managers’ choice of discretionary accruals? Journal of Accounting and Economics 22: 313–325.
Blanchard, G., C. Chow, and E. Noreen. 1986. Information asymmetry, incentive schemes, and information biasing: The case of hospital budgeting under rate regulation. The Accounting Review 61 (1): 1–15.
Brazel, J. F., K. L. Jones, and M. F. Zimbelman. 2009. Using nonfinancial measures to assess fraud risk. Journal of Accounting Research 47 (5): 1135–1166.
Brickley, J. A., and R. L. Van Horn. 2002. Managerial incentives in nonprofit organizations: Evidence from hospitals. The Journal of Law and Economics 45 (1): 227–249.
Brown, J. G. 1998. Improper Fiscal Year 1998 Medicare Fee-for-Service Payments (A-17-99-00099).
Buchman, T., P. Tetlock, and R. Reed. 1996. Accountability and auditors’ judgments about contingent events. Journal of Business Finance and Accounting 23 (3): 379–399.
Van De Bunt, H. 2010. Walls of secrecy and silence. Crimology & Public Policy 9 (3): 435–453. Burgstahler, D. C., and I. D. Dichev. 1997. Earnings management to avoid earnings decreases
and losses. Journal of Accounting and Economics 24 (1): 99–126. Burgstahler, D. C., L. Hail, and C. Leuz. 2006. The importance of reporting incentives: Earnings
management in european private and public firms. The Accounting Review 81 (5): 983–1016.
Call, A. C., S. Chen, B. Miao, and Y. H. Tong. 2014. Short-term earnings guidance and accrual-based earnings management. Review of Accounting Studies 19 (2): 955–987.
Carson, E., N. L. Fargher, M. A. Geiger, C. S. Lennox, K. Raghunandan, and M. Willekens. 2013. Audit reporting for going-concern uncertainty: A research synthesis. Auditing: A Journal of Practice and Theory 32 (1): 353–384.
Centers for Medicare and Medicaid Services. 2015a. Common Types of Health Care Fraud.

28
———. 2015b. National Health Expenditures 2015 Highlights. Chen, L.-W., J. Stoner, C. Makhanu, K. Minikus, and K. Mueller. 2004. An analysis of the
agreement of financial data between the medicare cost report and the audited hospital financial statement. Rural Policy Brief 9 (4): 1–8.
Chung, J., J. R. Cohen, and G. S. Monroe. 2008. The effect of moods on auditors’ inventory valuation decisions. Auditing: A Journal of Practice and Theory 27 (2): 137–159.
Cohen, D. A., A. Dey, and T. Z. Lys. 2008. Real and accrual-based earnings management in the pre- and post-Sarbanes-Oxley periods. The Accounting Review 83 (3): 757–787.
Cohen, J. R., and G. M. Trompeter. 1998. An examination of factors affecting audit practice development. Contemporary Accounting Research 15 (4): 481–504.
Dechow, P. M., and D. J. Skinner. 2000. Earnings management: Reconciling the views of accounting academics, practitioners, and regulators. Accounting Horizons 14 (2): 235–250.
DeFond, M., and J. Zhang. 2014. A review of archival auditing research. Journal of Accounting and Economics 58 (2–3): 275–326.
Department of Health and Human Services. 2012. Report to Congress Fraud Prevention System First Implementation Year.
———. 2014. Report to Congress Fraud Prevention System Second Implementation Year. ———. 2015. Report to Congress Fraud Prevention System Third Implementation Year. Department of Health and Human Services, and Department of Justice. 1997. Health Care Fraud
and Abuse Control Program Annual Report for FY 1997. Department of Health and Human Services, and The Department of Justice. 1998. Health Care
Fraud and Abuse Control Program Annual Report For FY 1998. ———. 2015. Health Care Fraud and Abuse Control Program Annual Report. Vol. 19. Department of Justice. 2003. Largest Health Care Fraud Case in U.S. History Settled: HCA
Investigation Nets Record Total of $1.7 Billion. http://www.justice.gov/archive/opa/pr/2003/June/03_civ_386.htm.
Dichev, I. D., J. R. Graham, C. R. Harvey, and S. Rajgopal. 2013. Earnings quality: Evidence from the field. Journal of Accounting and Economics 56 (2-3): 1–33.
Eldenburg, L., and S. Kallapur. 1997. Changes in hospital service mix and cost allocations in response to changes in Medicare reimbursement schemes. Journal of Accounting and Economics 23 (1): 31–51.
Eldenburg, L., and N. Soderstrom. 1996. Accounting system management by hospitals operating in a changing regulatory environment. The Accounting Review 71 (1): 23–42.
Fama, E., and K. French. 1997. Industry costs of equity. Journal of Financial Economics 43 (2): 153–193.
Francis, J. R. 2011. A framework for understanding and researching audit quality. Auditing: A Journal of Practice & Theory 30 (2): 125–152.
Francis, J. R., and J. Krishnan. 1999. Accounting accruals and auditor reporting conservatism. Contemporary Accounting Research 16 (1): 135–165.
Francis, J. R., E. L. Maydew, and C. H. Sparks. 1999. The role of big 6 auditors in the credible reporting of accruals. Auditing: A Journal of Practice and Theory 18 (2): 17–34.
Frank, M. M., L. Lynch, and S. O. Rego. 2009. Tax reporting aggressiveness and its relation to aggressive financial reporting. The Accounting Review 84 (2): 467–496.
Free, C., and P. Murphy. 2015. The ties that bind: The decision to co-offend in fraud. Contemporary Accounting Research 32 (1): 18–54.
Glover, S. M., D. F. Prawitt, and M. S. Drake. 2015. Between a rock and a hard place: A path
29
forward for using substantive analytical procedures in auditing large P&L accounts: Commentary and analysis. AUDITING: A Journal of Practice & Theory 34 (3): 161–179.
Guay, W. R., S. P. Kothari, and R. L. Watts. 1996. A market-based evaluation of discretionary accrual models. Journal of Accounting Research 34 (3): 83–105.
Guenther, D. A., and J. Rosman. 1994. Differences between compustat and crsp sic codes and related effects on research. Journal of Accounting and Economics 18 (1): 115–128.
Hanlon, M., J. L. Hoopes, and N. Shroff. 2014. The effect of tax authority monitoring and enforcement on financial reporting quality. Journal of the American Taxation Association 36 (2): 137–170.
Hao, M., and E. T. Nwaeze. 2015. Healthcare reform proposal and the behavior of pharmaceutical companies: The role of political costs. Accounting Horizons 29 (1): 171–198.
Hoerger, T. J. 1991. “Profit” variability in for-profit and not-for-profit hospitals. Journal of Health Economics 10 (3): 259–289.
Hogan, C. E., and D. C. Jeter. 1999. Industry specialization by auditors. Auditing: A Journal of Practice & Theory 18 (1): 1-17.
Holthausen, R. W. 2009. Accounting standards, financial reporting outcomes, and enforcement. Journal of Accounting Research 47 (2): 447–458.
Holzhacker, M., R. Krishnan, and M. D. Mahlendorf. 2015. The impact of changes in regulation on cost behavior. Contemporary Accounting Research 32 (2): 534–566.
Hoopes, J. L., D. Mescall, and J. A. Pittman. 2012. Do IRS audits deter corporate tax avoidance? The Accounting Review 87 (5): 1603–1639.
Hope, O.-K., W. B. Thomas, and D. Vyas. 2013. Financial reporting quality of U.S. private and public firms. The Accounting Review 88 (5): 1715–1742.
Howard, R. C. 1998. The sentinel effect in an outpatient managed care setting. Professional Psychology: Research and Practice 29 (3): 262–268.
Jackson, S. B., and X. K. Liu. 2010. The allowance for uncollectible accounts, conservatism, and earnings management. Journal of Accounting Research 48 (3): 565–601.
Jervis Wilkicki, K. J. 2001. The effects of not-for-profit hospital reported profits and charitable care on perceptions of tax-exempt status. Journal of the American Taxation Association 23 (2): 50–58.
Jones, K. L., G. V. Krishnan, and K. D. Melendrez. 2008. Do models of discretionary accruals detect actual cases of fraudulent and restated earnings? An empirical analysis. Contemporary Accounting Research 25 (2): 499–531.
Kallapur, S., and L. Eldenburg. 2005. Uncertainty, real options, and cost behavior: Evidence from Washington state hospitals. Journal of Accounting Research 43 (5): 735–752.
Kane, N. M., and S. A. Magnus. 2001. The medicare cost report and the limits of hospital accountability: Improving financial accounting data. Journal of Health Politics, Policy and Law 26 (1): 81–105.
Kim, J., R. Chung, and M. Firth. 2003. Auditor conservatism, asymmetric monitoring, and earnings management. Contemporary Accounting Research 20 (2): 323–359.
Knechel, R., G. V. Krishnan, M. Pevzner, L. B. Shefchik, and U. K. Velury. 2013. Audit quality: Insights from the academic literature. Auditing: A Journal of Practice & Theory 32 (Supplement 1): 385–421.
Koonce, L., U. Anderson, and G. Marchant. 1995. Justification of decisions in auditing. Journal of Accounting Research 33 (2): 369–384.
30
Kothari, S. P., A. J. Leone, and C. E. Wasley. 2005. Performance matched discretionary accrual measures. Journal of Accounting and Economics 39 (1): 163–197.
Krishnan, J., and P. C. Schauer. 2000. The differentiation of quality among auditors: Evidence from the not-for-profit sector. Auditing: A Journal of Practice and Theory 19 (2): 9–25.
Krishnan, Jagan, Jayanthi Krishnan, and H. Song. 2017. PCAOB international inspections and audit quality. The Accounting Review 92 (5): 143–166.
Lamboy-Ruiz, M. A., W. G. No, and O. V. Watanabe. 2018. Discrepancies in hospital financial information: Comparison of financial data in state data repositories and healthcare cost reporting information system. Journal of Information Systems (Forthcoming).
Lamoreaux, P. T. 2016. Does PCAOB inspection access improve audit quality? An examination of foreign firms listed in the United States. Journal of Accounting and Economics 61 (2-3): 313–337.
Leone, A. J., and R. L. Van Horn. 2005. How do nonprofit hospitals manage earnings? Journal of Health Economics 24 (January): 815–837.
Lerner, J., and P. Tetlock. 1999. Accounting for the effects of accountability. Psychological Bulletin 125 (2): 255–275.
Lindley, S., D. Martinez, and R. Sumter. 2014. Sentinel effect in OR and IR. International Journal of Business, Humanities and Technology 4 (2): 51–55.
McNichols, M. F., and S. R. Stubben. 2008. Does earnings management affect firms’ investment decisions? The Accounting Review 83 (6): 1571–1603.
McNichols, M., and G. P. Wilson. 1988. Evidence of earnings management from the provision for bad debts. Journal of Accounting Research 26 (3): 1–31.
Ozmeral, A. B., K. L. Reiter, G. M. Holmes, and G. H. Pink. 2012. A comparative study of financial data sources for critical access hospitals: Audited financial statements, the medicare cost report, and the internal revenue service form 990. The Journal of Rural Health 28 (4): 416–424.
Piper, C. E. 2013. 10 popular health care provider fraud schemes. Fraud Magazine 28 (1): 30–35.
Pizzini, M. J. 2006. The relation between cost-system design, managers’ evaluations of the relevance and usefulness of cost data, and financial performance: an empirical study of US hospitals. Accounting, Organizations and Society 31 (2): 179–210.
Public Company Accounting Oversight Board. 2012. Auditing Standard no. 16 - Communications with Audit Committees. Washington, DC.
Quosigk, B., and D. Forgione. 2018. The association of program ratios and consolidation choices: Evidence from nonprofit hospitals. Accounting Horizons (Forthcoming).
Schelleman, C., and W. R. Knechel. 2010. Short-term accruals and the pricing and production of audit services. Auditing: A Journal of Practice and Theory 29 (1): 221–250.
Smith, W. 2016. The HealthSouth fraud: A case of ethical malpractice. Charlotte, NC: AAA Forensic Accounting Section Midyear Research Conference.
Stubben, S. R. 2010. Discretionary revenues as a measure of earnings management. The Accounting Review 85 (2): 695–717.
Tan, C., C. Jubb, and K. A. Houghton. 1997. Auditor judgments: The effects of the partner’s views on decision outcomes and cognitive effort. Behavioral Research in Accounting 9: 157–175.
Teoh, S. H., T. J. Wong, and G. Rao. 1998. Are accruals during initial public offerings opportunistic? Review of Accounting Studies 3 (1-2): 175–208.

31
Tetlock, P. 1992. The impact of accountability on judgement and choice: Toward a social contingency model. Advances in Experimental Social Psychology 25 (Issue C): 331–376.
Thornton, D. M. 1999. “Sentinel Effect” shows fraud control effort works. Journal of Health Law 32 (4): 493-502.
Turner, C. W. 2001. Accountability demands and the auditor’s evidence search strategy: The influence of reviewer preferences and the nature of the response (belief vs. action). Journal of Accounting Research 39 (3): 683–706.
United States Courts. 2014a. Criminal Cases. ———. 2014b. Civil Cases. Vermeer, T., K. Raghunandan, and D. Forgione. 2009. Audit fees at U.S. non-profit
organizations. Auditing: A Journal of Practice and Theory 28 (2): 289–303.

32
Table 1
Industry wide convicted and pending criminal cases by year (from “Health Care Fraud and Abuse Control Program” jointly published by OIG, DHHS and DOJ scaled by the
number of Medicare beneficiaries, in thousands, in the USA)
Note: These numbers include the sum of criminal cases convicted and pending for the entire healthcare industry (public and private providers such as hospitals, nursing homes, labs, etc.), not only the sample in this study.
Year Sum of prior year number of criminal cases pending and
convicted scaled by the total number of
Medicare beneficiaries in the
USA
Allowance for doubtful accounts / total receivables
Discretionary revenue (annual)
Discretionary revenue
(quarterly)
1996 7.215% 15.24% 0.0555 0.0175 1997 7.698% 16.36% 0.0446 0.0356 1998 8.639% 17.23% 0.0328 0.0178 1999 10.680% 19.18% -0.0439 -0.0345 2000 11.447% 18.84% -0.0189 0.0031 2001 11.210% 17.95% -0.0093 0.0042 2002 10.337% 17.48% -0.0240 -0.0167 2003 9.325% 16.88% -0.0418 -0.0215 2004 8.924% 14.77% -0.0063 0.0014 2005 9.099% 14.34% 0.0091 0.0030 2006 9.392% 14.67% 0.0218 0.0149 2007 9.210% 15.91% 0.0114 0.0030 2008 8.747% 15.00% -0.0147 -0.0148 2009 8.534% 18.08% -0.0352 -0.0291 2010 8.413% 17.51% -0.0193 -0.0035 2011 9.230% 17.02% -0.0046 -0.0008 2012 9.403% 18.20% -0.0103 0.0018
Minimum 7.215% .02% -1.5028 -0.6511
Q1 8.534% 6.97% -0.0386 -0.0272 Mean 9.189% 16.73% 0.0004 0.0005
Q3 9.403% 21.54% 0.0303 0.0249 Maximum 11.447% 91.01% 1.2699 0.8929
St dev 1.188% 14.11% 0.1267 0.0865

33
Table 2
Final Sample Selection
Initial search results from COMPUSTAT (SIC Codes 8000 to 8099 from 1995 to 2012)
2,783
delete firms that are not based in the USA delete firm years with zero total assets
-189 -14
delete firm years with missing financial statement accounts:
Long Term Debt -118
Capital Expenditures -34
Allowance -364
Receivables -1
%UNCOL undefined (zero receivables) -126
Market Value of Equity calculation -457
Revenue -1
Leverage -220
Capital Expenditures ratio -2
delete remaining firm years without a prior year observation -12
Final sample for %UNCOL 1,245
Delete firms with missing change data for discretionary revenue
-31
Final sample for DRevAnnual 1,214
Delete firms with missing quarterly data
-87
Final sample for DRevQuarterly 1,127
Note: The final sample for %UNCOL contains 204 unique providers.
34
Table 3 Descriptive Statistics
Sample for %UNCOL variable
Sample for DRevAnnual variable
n=1,245
n=1,214
Variable 1st quartile 2nd quartile 3rd quartile Std Dev 1st quartile 2nd quartile 3rd quartile Std Dev logMVE 3.1573408 4.7793594 6.3413537 2.1670447 3.1810493 4.7924877 6.3590936 2.1814858
logRev 3.9204871 5.3123545 6.5977949 1.9650479 3.9517052 5.3362651 6.6115033 1.9567144
Leverage 0.0678295 0.3405198 0.4645574 0.4376172 0.0690065 0.3399695 0.4619995 0.4399538
CapEx 0.0234202 0.0590191 0.0758377 0.0580742 0.0234202 0.0585898 0.0746853 0.0575667
Year 4 8.0441767 12 4.9721548 4.0000000 8.0683690 12.000000 4.9710892
ROA -0.0430108 0.0470434 0.1077013 1.4268879 -0.0412302 0.0479492 0.1080631 1.4434549
NOL 0 0.3477912 1 0.4764607 0 0.3434926 1.0000000 0.4750698
BigN 0 0.7365462 1 0.4406834 0 0.7438221 1.0000000 0.4367011
Unempl 0.0450000 0.0508300 0.0578300 0.2100678 0.0460800 0.0503000 0.0583000 0.1733718
CPI 5.9610000 6.3300908 6.5130000 0.5689094 5.9610000 6.3323501 6.5130000 0.5691447
Variable Definitions:
logMVE = the natural log of the market value of equity of the firm. logRev = the natural log value of total sales. Leverage = the total long-term debt scaled by lagged assets. CapEx = the capital expenditures of the firm, scaled by lagged assets. Year = indicator variable for years since 1996. ROA = the pretax income divided by assets. NOL = an indicator variable coded 1 if the firm has a Net Loss, 0 otherwise. BigN = an indicator variable coded 1 if the firm has a BigN auditor, 0 otherwise. Unempl = Unemployment expressed as a percentage. CPI = Consumer Price Index expressed as a percentage.
35
Table 4 Correlation Matrix (Pearson correlations above, Spearman correlations below)
(n=1,101) Variable %UNCOL DRevAnnual DRevQaurterly PYCrimMatters logMVE logRev Leverage %UNCOL -0.00 -0.11*** 0.07** -0.01 0.05* 0.05* DRevAnnual 0.01 0.81*** -0.15*** 0.03 -0.05* 0.30*** DRevQaurterly -0.09*** 0.82*** -0.10** -0.02 -0.06* 0.26*** PYCrimMatters 0.05* -0.14*** -0.10*** -0.06** 0.06** -0.07** logMVE 0.07** 0.10*** -0.00 -0.14*** 0.76*** 0.07** logRev 0.17*** -0.06* -0.07** -0.07** 0.80*** 0.19*** Leverage 0.13*** 0.23*** 0.14*** -0.04 0.22*** 0.36*** CapEx -0.07** 0.28*** 0.23*** 0.03 0.20*** 0.11*** 0.16*** Year 0.01 -0.20*** -0.15*** -0.38*** 0.22*** 0.26*** -0.06* ROA -0.13*** 0.13*** 0.14*** -0.01 0.34*** 0.29*** -0.06* NOL 0.11*** -0.11*** -0.14*** 0.00 -0.29*** -0.29*** -0.04 BigN 0.02 0.00 -0.03 0.15*** 0.44*** 0.47*** 0.18*** Unempl -0.01 -0.15*** -0.15*** -0.69*** 0.14*** 0.15*** -0.02 CPI 0.01 -0.20*** -0.09*** -0.38*** 0.23*** 0.26*** -0.06* DaysAR 0.26*** 0.47*** 0.33*** 0.14*** -0.08*** -0.19*** 0.12***
36
Table 4 (continued) Correlation Matrix (Pearson correlations above, Spearman correlations below)
(n=1,101) Variable CapEx Year ROA NOL BigN Unempl CPI DaysAR %UNCOL -0.09*** 0.00 -0.09*** 0.13*** -0.04 -0.01 0.01 0.31***DRevAnnual 0.23*** -0.11*** 0.03 -0.04 -0.06** -0.02 -0.10*** 0.25***DRevQaurterly 0.21*** -0.08*** 0.03 -0.08** -0.06* -0.01 0.07** 0.017***PYCrimMatters -0.08*** -0.41*** 0.06* 0.03 0.15*** -0.25*** -0.46*** 0.07**logMVE 0.05 0.22*** 0.09*** -0.29*** 0.42*** 0.08** 0.18*** -0.14***logRev -0.03 0.25*** 0.25*** -0.31*** 0.47*** 0.07** 0.21*** -0.25***Leverage 0.18*** -0.03 0.04 0.06** 0.08** 0.01 -0.02 0.03CapEx -0.12*** 0.05* -0.11*** 0.03 -0.06** -0.13*** -0.05Year -0.07** -0.06** -0.11*** -0.21*** 0.40*** 0.95*** -0.22***ROA 0.20*** 0.12*** -0.20*** 0.11*** -0.07** -0.09*** -0.00NOL -0.18*** -0.12*** -0.79*** -0.09*** 0.05 -0.05* 0.12***BigN 0.10*** -0.20*** 0.08*** -0.09*** -0.08** -0.19*** -0.11***Unempl -0.06** 0.61*** 0.06* -0.07** -0.13*** 0. 52*** -0.06* CPI -0.07** 1.00*** 0.12*** -0.12*** -0.21*** 0.61*** -0.19***DaysAR 0.04 -0.35*** -0.15*** 0.10*** -0.09*** -0.26*** -0.35***

37
Table 4 (continued) Correlation Matrix (Pearson correlations above, Spearman correlations below)
(n=1,101) Note: *, **, *** Indicate p<0.10, p<0.05, and p<0.01 respectively, two-tailed test.
%UNCOL is The Allowance for Doubtful Accounts scaled by Total Receivables. DRevAnnual is the residual from a regression estimating the change in Accounts Receivable from the year-to-year change in revenue (with all variables scaled by average total assets). DRevQuarterly is the residual from a regression estimating the change in Accounts Receivable from the year-to-year change in revenue from the first three quarters plus the year-to-year change in revenue from the fourth quarter (with all variables scaled by average total assets). PYCrimMatters is the sum of convicted and pending criminal cases with oversight agencies (i.e., Federal Bureau of Investigation, the Department of Health and Human Services, and Office of the Inspector General) from the previous year. logMVE is the natural log of the market value of equity of the firm. logRev is the natural log value of total sales. Leverage is the total long-term debt scaled by lagged assets. CapEx is the capital expenditures of the firm, scaled by lagged assets. Year represents dummy variables for years since 1995. ROA is the pretax income divided by assets. NOL is an indicator variable coded 1 if the firm has a Net Loss, 0 otherwise. BigN is an indicator variable coded 1 if the firm has a BigN auditor, 0 otherwise. Unempl is the percentage of unemployment in the United Stated from the Bureau of Labor Statistics website. CPI is the Consumer Price Index of Medical Care services from the Bureau of Labor Statistics Website.
38
Table 5 Client Type by Auditor
n=1,245
Health Services
Doctor's Office
Nursing & Personal care
SNF Hospital Labs Home Health
Misc. Health &
Allied services
Outpatient Total
Arthur Andersen 10 5 0 21 7 27 24 16 9 119Ernst and Young 16 9 7 61 86 45 42 32 44 342Deloitte 1 16 0 5 39 36 11 10 0 118KPMG 8 10 12 10 27 25 26 38 12 168PwC 10 0 2 21 22 36 32 13 34 170BDO Other (<40 client years)
1 27
7 14
0 2
15 18
28 29
3 63
9 20
5 61
0 26
68 260
Total 73 61 23 151 238 235 164 175 125 Unique providers 12 16 5 30 32 40 26 26 17 204
Health Services is SIC code 8000. Doctor's Offices are SIC code 8011. Nursing and Personal Care are SIC code 8050. SNF is SIC code 8051 (Skilled Nursing Facility, commonly known as a nursing home). Hospitals are SIC codes 8060 and 8062. Labs are SIC code 8071. Home Health is SIC code 8082. Misc. Health and Allied services are SIC code 8090. Outpatient services are SIC code 8093.
39
Table 6 Number of Observations by Year (n=1,245)
YEAR NUMBER OF PROVIDERS
1996 110
1997 107
1998 92
1999 85
2000 77
2001 74
2002 68
2003 69
2004 68
2005 68
2006 68
2007 62
2008 63
2009 63
2010 59
2011 56
2012 56
40
Table 7 The Impact of Government Fraud Oversight Initiatives on Financial Reporting Aggressiveness
Government oversight in prior year as primary independent variable %UNCOL, DrevAnnual or DrevQuarterly = β0 + β1PYCrimMatters + β2logMVE + β3logRev + β4Leverage + β5CapEx + β6ROA+ β7NOL +
β8BigN + β9Year β10Unempl + β11CPI + β12DaysAR + Σ firm fixed effects + e Coefficient Significance Coefficient Significance Coefficient Significance
PYCrimMatters 0.559 0.028** -1.277 <0.001*** -0.516 0.031** Control Variables
logMVE -0.017 <0.001*** 0.008 0.040** -0.002 0.574 logRev 0.007 0.272 0.019 0.019** 0.014 0.027** Leverage -0.027 <0.001*** 0.089 <0.001*** 0.061 <0.001*** CapEx 0.004 0.947 0.411 <0.001*** 0.264 <0.001*** ROA -0.005 0.100 0.005 0.211 0.001 0.659 NOL 0.035 <0.001*** -0.026 0.003*** -0.025 <0.001*** BigN -0.025 0.049** -0.008 0.586 0.009 0.468 Year -0.005 0.025** -0.003 0.297 0.003 0.141 Unempl -0.021 0.264 0.029 0.192 0.017 0.323 CPI 0.050 0.007*** -0.010 0.636 -0.024 0.167 DaysAR 0.000 <0.001*** 0.001 <0.001*** 0.001 <0.001*** Fit: Adj. R2 (%) N
67.74% 1,245
45.61% 1,214
36.27% 1,101
*, **, *** Indicate p<0.10, p<0.05 and p<0.01 respectively, two-tailed test %UNCOL is The Allowance for Doubtful Accounts scaled by Total Receivables. DRevAnnual is the residual from a regression estimating the change in Accounts Receivable from the year-to-year change in revenue (with all variables scaled by average total assets). DRevQuarterly is the residual from a regression estimating the change in Accounts Receivable from the year-to-year change in revenue from the first three quarters plus the year-to-year change in revenue from the fourth quarter (with all variables scaled by average total assets). PYCrimMatters is the sum of convicted and pending criminal cases with oversight agencies (i.e., Federal Bureau of Investigation, the Department of Health and Human Services, Office of the Inspector General) from the previous year scaled by the number of individuals (in thousands) enrolled in Medicare in the USA. logMVE is the natural log of the market value of equity of the firm. logRev is the natural log value of total sales. Leverage is the total long-term debt scaled by lagged assets. CapEx is the capital

41
expenditures of the firm, scaled by lagged assets. Year represents dummy variables for years since 1995. ROA is the pretax income divided by assets. NOL is an indicator variable coded 1 if the firm has a Net Loss, 0 otherwise. BigN is an indicator variable coded 1 if the firm has a BigN auditor, 0 otherwise. Unempl is the percentage of unemployment in the United Stated from the Bureau of Labor Statistics website. CPI is the Consumer Price Index of Medical Care services from the Bureau of Labor Statistics Website. All specifications are estimated with firm fixed effects.

42
Table 8
The Impact of Government Fraud Oversight Initiatives on Financial Reporting Aggressiveness (Write-offs as Measure of Financial Reporting Aggressiveness)
Write-offs= β0 + β1PYCrimMatters + β2logMVE + β3logRev + β4Leverage + β5CapEx + β6ROA+ β7NOL + β8BigN + β9Year + β10Unempl + β11CPI + β12DaysAR + Σ firm fixed effects + e
Coefficient Significance PYCrimMatters 12.218 0.075* Control Variables logMVE 0.041 0.622 logRev 0.047 0.817 Leverage -0.082 0.671 CapEx 0.092 0.957 ROA 0.085 0.833 NOL 0.477 0.016** BigN 1.550 <0.001*** Year -0.025 0.668 Unempl -0.280 0.547 CPI 0.134 0.778 DaysAR 0.004 0.194 Fit: Adj. R2 (%) N
28.585% 827
*,**,*** Indicate p<0.10, p<0.05 and p<0.01, respectively two-tailed test Write-offs is the amount of write offs scaled by Total Receivables. PYCrimMatters is the amount of convicted and open criminal cases with oversight agencies (i.e., Federal Bureau of Investigation, the Department of Health and Human Services, Office of the Inspector General) from the previous year scaled by the number of individuals (in thousands) enrolled in Medicare in the USA. logMVE is the natural log of the market value of equity of the firm. logRev is the natural log value of total sales. Leverage is the total long-term debt scaled by lagged assets. CapEx is the capital expenditures of the firm, scaled by lagged assets. Year represents dummy variables for years since 1997. ROA is the pretax income divided by assets. NOL is an indicator variable coded 1 if the firm has a Net Loss, 0 otherwise. BigN is an indicator variable coded 1 if the firm has a BigN auditor, 0 otherwise. Unempl is the percentage of unemployment in the United Stated from the Bureau of Labor Statistics website. CPI is the Consumer Price Index of Medical Care services from the Bureau of Labor Statistics Website. The specification is estimated with firm fixed effects.

43
Table 9 The Impact of Government Fraud Oversight Initiatives on Hospital Discretionary Revenue
DRevAnnual= β0 + β1PYCrimMatters + β2logMVE + β3logRev + β4Leverage + β5CapEx + β6ROA + β7NOL + β8BigN + β9Year + β10Unempl + β11CPI + β12DaysAR + β13MCRDaysPct + Σ firm fixed effects +e
Coefficient Significance PYCrimMatters -1.618 0.066* Control Variables logMVE 0.079 <0.001*** logRev -0.095 0.003** Leverage 0.071 <0.001*** CapEx 0.198 0.403 ROA -0.469 0.016** NOL -0.102 0.029** BigN 0.068 0.206 Year -0.009 0.246 Unempl -0.027 0.623 CPI 0.064 0.256 DaysAR 0.002 0.014 MCRDaysPct -0.490 0.064* Fit: Adj. R2 (%) N
68.29% 125
*, **, *** Indicate p<0.10, p<0.05 and p<0.01, respectively two-tailed test. DRevAnnual is the residual from a regression estimating the change in Accounts Receivable from the year-to-year change in revenue (with all variables scaled by average total assets). PYCrimMatters is the sum of pending and convicted criminal cases with oversight agencies (i.e., Federal Bureau of Investigation, the Department of Health and Human Services, Office of the Inspector General) from the previous year scaled by the number of individuals (in thousands) enrolled in Medicare in the USA. logMVE is the natural log of the market value of equity of the firm. logRev is the natural log value of total sales. Leverage is the total long-term debt scaled by lagged assets. CapEx is the capital expenditures of the firm, scaled by lagged assets. Year represents dummy variables for years since 1997. ROA is the pretax income divided by assets. NOL is an indicator variable coded 1 if the firm has a Net Loss, 0 otherwise. BigN is an indicator variable coded 1 if the firm has a BigN auditor, 0 otherwise. Unempl is the percentage of unemployment in the United Stated from the Bureau of Labor Statistics website. CPI is the Consumer Price Index of Medical Care services from the Bureau of Labor Statistics Website. MCRDaysPct is the total number of Medicare Days scaled by the total number of bed days reported in cost report data from CMS. The specification is estimated with firm fixed effects.
Related Documents