The sentence production test for aphasia AQ1 Carolyn E. Wilshire, Carolina C. Lukkien, and Bridget R. Burmester School of Psychology, Victoria University of Wellington, Wellington, New Zealand 5 Background: Researchers and clinicians have long known that in aphasia, the ability to produce connected speech is poorly predicted by tests of single-word production. Connected speech is most commonly assessed using rating scales, in which the examiner rates the speech on various fluency-rated and grammatical well-formedness measures. However, with this method, interrater and test–retest reliability can be poor, and since 10 the intended utterance is not known, accuracy and appropriate of the speech content is difficult to measure. Aims: The aim of the present study was to develop and investigate the validity and usefulness of a new, freely accessible sentence production test (SPT) based on simple pictured event description. 15 Methods & Procedures: The SPT involves describing simple pictured events. The test pictures represent a range of sentence constructions and lexical items, which elicited high response agreement in healthy controls. The simple automatised scoring procedure generates both general and specific accuracy measures. This article describes the test construction and norming procedure and reports test data from 24 participants with 20 aphasia. Outcomes & Results: Interrater reliability for the scoring protocol was excellent. The overall sentence score was found to measure unique variance not accounted for by single-picture naming. It was unrelated to fluency measures such as speech rate. Specific scores, such as the closed-class score, measure partially overlapping, but quali- 25 tatively distinct constructs from other speech assessments. Conclusions: The SPT is quick to administer, easy to score and can be used even when a person’s speech is very limited. It provides a range of measures of sentence production that may prove informative for both clinical and research purposes. Keywords: Aphasia; Sentence production; Assessment. Address correspondence to: Carolyn Wilshire, School of Psychology, Victoria University of Wellington, P.O. Box 600, Wellington, New Zealand. E-mail: [email protected] The authors would like to thank Richard Moore for creating the beautiful pictures used in our test materials (for further information, see http://www.artbyrichardmoore.com). Thanks also to Dr Nadine Martin from the Temple University School of Speech and Hearing Sciences, for allowing us to include test data for participants FS, XX, DD, EC and TB. Thanks also to Alana Oakly for her help with the interrater reliability analysis. Finally, we are grateful for all those who helped to collect test data for us, particularly Christina Cameron Jones and Corinne Bareham, who tested and transcribed data for many participants on our behalf. The first and third authors were supported in part during this work by a grant from the Marsden fund of New Zealand [VUW0505; C Wilshire Principal Investigator]. The second author’s work was supported by a Victoria University of Wellington PhD Scholarship (2002–2005) and a Victoria University Doctoral Completion Scholarship (2005–2006). Aphasiology, 2014 Vol. 00, No. 00, 1–34, http://dx.doi.org/10.1080/02687038.2014.893555 © 2014 Taylor & Francis C/e: QS C/e QA: RV

Welcome message from author
This document is posted to help you gain knowledge. Please leave a comment to let me know what you think about it! Share it to your friends and learn new things together.
Transcript
The sentence production test for aphasia
AQ1
Carolyn E. Wilshire, Carolina C. Lukkien, and Bridget R. Burmester
School of Psychology, Victoria University of Wellington, Wellington,New Zealand
5Background: Researchers and clinicians have long known that in aphasia, the ability toproduce connected speech is poorly predicted by tests of single-word production.Connected speech is most commonly assessed using rating scales, in which the examinerrates the speech on various fluency-rated and grammatical well-formedness measures.However, with this method, interrater and test–retest reliability can be poor, and since
10the intended utterance is not known, accuracy and appropriate of the speech content isdifficult to measure.Aims: The aim of the present study was to develop and investigate the validity andusefulness of a new, freely accessible sentence production test (SPT) based on simplepictured event description.
15Methods & Procedures: The SPT involves describing simple pictured events. The testpictures represent a range of sentence constructions and lexical items, which elicited highresponse agreement in healthy controls. The simple automatised scoring proceduregenerates both general and specific accuracy measures. This article describes the testconstruction and norming procedure and reports test data from 24 participants with
20aphasia.Outcomes & Results: Interrater reliability for the scoring protocol was excellent. Theoverall sentence score was found to measure unique variance not accounted for bysingle-picture naming. It was unrelated to fluency measures such as speech rate.Specific scores, such as the closed-class score, measure partially overlapping, but quali-
25tatively distinct constructs from other speech assessments.Conclusions: The SPT is quick to administer, easy to score and can be used even when aperson’s speech is very limited. It provides a range of measures of sentence productionthat may prove informative for both clinical and research purposes.
Keywords: Aphasia; Sentence production; Assessment.
Address correspondence to: Carolyn Wilshire, School of Psychology, Victoria University of Wellington,P.O. Box 600, Wellington, New Zealand. E-mail: [email protected]
The authors would like to thank Richard Moore for creating the beautiful pictures used in our testmaterials (for further information, see http://www.artbyrichardmoore.com). Thanks also to Dr NadineMartin from the Temple University School of Speech and Hearing Sciences, for allowing us to include testdata for participants FS, XX, DD, EC and TB. Thanks also to Alana Oakly for her help with the interraterreliability analysis. Finally, we are grateful for all those who helped to collect test data for us, particularlyChristina Cameron Jones and Corinne Bareham, who tested and transcribed data for many participants onour behalf. The first and third authors were supported in part during this work by a grant from theMarsden fund of New Zealand [VUW0505; C Wilshire Principal Investigator]. The second author’s workwas supported by a Victoria University of Wellington PhD Scholarship (2002–2005) and a VictoriaUniversity Doctoral Completion Scholarship (2005–2006).
Aphasiology, 2014Vol. 00, No. 00, 1–34, http://dx.doi.org/10.1080/02687038.2014.893555
© 2014 Taylor & Francis
C/e: QS C/e QA: RV
30Many people with aphasia have particular difficulty producing sentences. However,assessing this difficulty can be challenging. Unlike single-word production, wherepictures can be used to elicit specific words, it is much harder to constrain a person’sspeech output in order to examine specific kinds of sentences or utterances. Even intasks where there are clear expectations about the propositions to be expressed (such
35as recounting a story or describing a pictured scene), there are almost always variousways of expressing them. Consequently, it is not always easy to establish whatconstitutes “normal” behaviour, let alone define what is impaired. A second difficultyis that connected speech in aphasia may be abnormal across a number of differentdimensions, which include not only its informational content, but also its syntactic
40complexity, grammatical and morphological well-formedness and rate of production.This article presents a new test, which uses a simple picture description task to assessaspects of sentence well-formedness and lexical content. However, before describingthe test and its most important precursors, we will briefly consider some of themethods that are currently used to assess connected speech in aphasia.
45Currently, the most widely used assessments of aphasic connected speech arebased on subjective rating scales. For example, in the Boston Diagnostic AphasiaExamination (BDAE) (Goodglass, Kaplan, & Barresi, 2001) and the WesternAphasia Battery (Kertesz, 2006; Shewan & Kertesz, 1980), a speech sample is elicitedusing open-ended questioning and picture description tasks. It is then rated on
50various dimensions, which may include articulatory agility, phrase length, gramma-tical form, melodic line, incidence of paraphasias, information content and complete-ness of utterances. In both assessments, the rated dimensions are primarily selectedfor their effectiveness in discriminating fluent from nonfluent aphasia. However,since these methods rely heavily on subjective judgements, they demand a consider-
55able amount of skill and training on the part of the examiner. Also, even trainedexaminers may vary widely in their ratings of the same speech sample, so interraterreliability may be poor (Gordon, 1998).
In response to these concerns, several more stringent, free speech scoring protocolshave been developed, which enable the examiner to derive numerical scores for
60aspects of the speech. Some focus primarily on the form of the person’s utterances;one such example is the quantitative production analysis or QPA (Berndt, Wayland,Rochon, Saffran, & Schwartz, 2000; Rochon, Saffran, Berndt, Schwartz, &Schwartz, 2000; Saffran, Berndt, & Schwartz, 1989; for other examples, seeEdwards, 1995; Shewan, 1988; Thompson, Shapiro, Tait, Jacobs, Schneider &
65Ballard, 1995; Vermeulen, Bastiaanse, & Van Wageningen, 1989; Wagenaar, Snow,& Prins, 1975). In the QPA, the examinee is asked to retell a well-known story suchas Cinderella. First, the speech rate, or number of words produced per minute, iscalculated. Then, the speech is stripped of fillers, repetitions and other extraneousmaterial, and several other scores are generated. These include the total number of
70narrative words, numbers of open- and closed-class words, nouns, verbs, pronounsand determiners. There are also protocols for segmenting the speech into sentences,enabling the examiner to derive measures such as the proportion of well-formedsentences and the mean length of utterances. The QPA is capable of quantifyingcertain specific speech patterns, such as agrammatic speech, a pattern characterised
75by disproportionate omission of function words and/or other closed-class elements,which is often observed in individuals with Broca’s aphasia (e.g., ‘Mum…Dad…shopping…Friday’).
2 WILSHIRE, LUKKIEN, BURMESTER
Other quantitative scoring protocols focus on speech informativeness or content/communicative effectiveness. One example, developed by Brookshire and Nicholas
80(1994), involves eliciting a sample of relatively open-ended speech, and then identify-ing each correct information unit (or CIU) (e.g., Nicholas & Brookshire, 1993, 1995).A CIU is defined as any word that is informative, accurate and relevant to thepresent speech context (for applications of this procedure, see Gordon, 2008; seealso Fink, Bartlett, Lowery, Linebarger, & Schwartz, 2008; Jacobs, 2001AQ2 ; Yorkston
85& Beukelman, 1980). The more recent story retell procedure takes a similar approach(Doyle et al., 1998, 2000; Doyle, Tsironas, Goda, & Kalinyak, 1996; Hula, McNeil,Doyle, Rubinsky, & Fossett, 2003; McNeil, Doyle, Fossett, Park, & Goda, 2001;McNeil, Doyle, Park, Fossett, & Brodsky, 2002; McNeil et al., 2007). Participantshear a number of short stories, which they have to subsequently retell. The examiner
90then rates the content of the person’s speech against an inventory of the totalpropositions in each of the stories. (For other similar approaches, see Menn,Ramsberger, & Estabrooks, 1994; Yorkston & Beukelman, 1980 and Menn et al.,1994.)
Despite wide differences in their aims and scope, these protocols share one95important strength: the scoring criteria for each measure are transparent, and conse-
quently, interrater reliability is much higher than on more subjective rating scales.However, the protocols also have some significant limitations. First, the uncon-strained elicitation procedures mean that some individuals may be very effective atavoiding structures or lexical content that is difficult for them. Second, since the
100appropriateness of lexical elements is not scored (only their incidence), some types ofabnormalities, such as paragrammatic substitutions of closed-class elements, may bedifficult to detect. Third, although the scoring systems themselves are reliable,estimates of test–retest reliability are less: for example, on the various measuresfrom the QPA, Rochon et al. obtained test–retest intraclass correlations ranging
105from 0.53 to 0.92 (2000). This lack of reliability is likely to reflect the unconstrainednature of the speech samples used, which allow for enormous variability in speakeroutput from session to session (see also Cameron, Wambaugh, & Mauszycki, 2010,for a recent evaluation of Nicholas and Brookshire’s protocol). And finally, thescoring is often complex and extremely time consuming. Finally, and perhaps most
110importantly, many of the procedures cannot be used with severely impaired indivi-duals who are unable to produce the minimum speech sample required for scoring.
Ideally, then, these protocols might be complemented by more constrained meth-ods, which assess speech accuracy against a clear expectation of what a nonaphasicperson would say. One paradigm that has been used effectively for this purpose is
115pictured event description, where the participant describes a single pictured event inone sentence. The use of this kind of task has a long history in aphasia research (see e.g., Gleason, Goodglass, Obler, Hyde, & Weintraub, 1980; Helm-Estabrooks &Ramsberger, 1986; Helm-Estabrooks, Fitzpatrick, & Barresi, 1981; Saffran,Schwartz, & Marin, 1980). However, it is only more recently that researchers have
120begun to develop more rigorous tests, selecting pictures for which clear ‘norms’ havebeen established in healthy control participants, and adopting detailed, reliablescoring systems. In the last decade or so, several such protocols have been developed,mostly with the aim of assessing aspects of syntactic competence (see e.g., Bastiaanse,Edwards, & Rispens, 2002; Bastiaanse, Edwards, Mass, & Rispens, 2003; Caplan &
125Hanna, 1998; Cho-Reyes & Thompson, 2012; Faroqi-Shah & Thompson, 2003;Thompson, Lange, Schneider, & Shapiro, 1997; but see also Whitworth, 1995,
THE SENTENCE PRODUCTION TEST FOR APHASIA 3
which focuses on thematic role assignment). Many of these tests provide comparativemeasures of performance across different types of syntactic structures, for example,by varying the verb argument structure of the sentence or its surface form (e.g., active
130vs. passive voice). Although this is not our aim in the current study, a brief review ofthis research can provide information about the strengths and limitations of thismethod, and the most important design and scoring considerations.
In Caplan and Hanna’s (1998) task, participants had to use a single sentence todescribe a pictured event. The target sentences included five exemplars of each of the
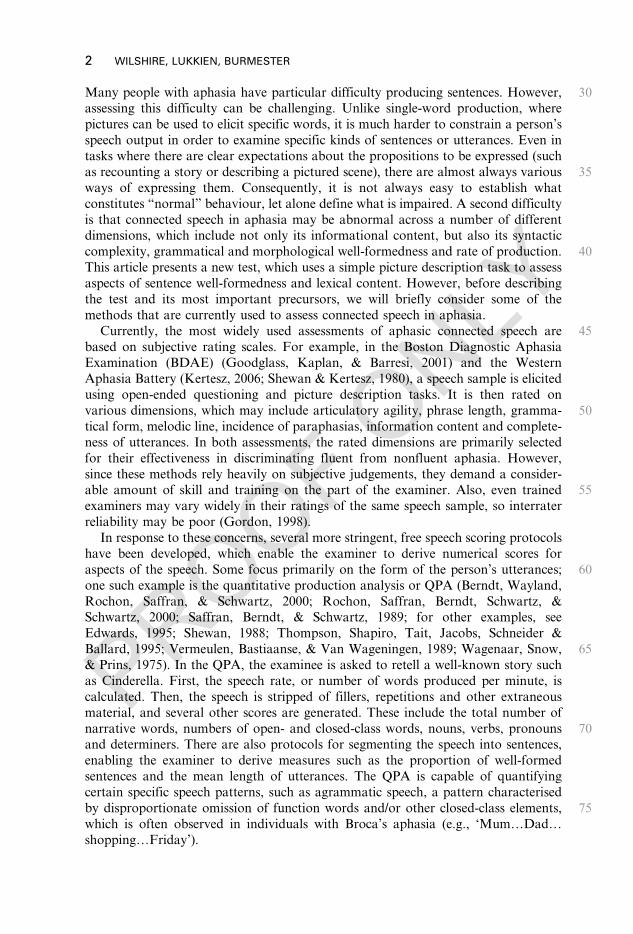
135following sentence constructions: actives, passives, datives (The woman is giving therattle to the baby) and dative passives (The ball was thrown to the boy by the man).1
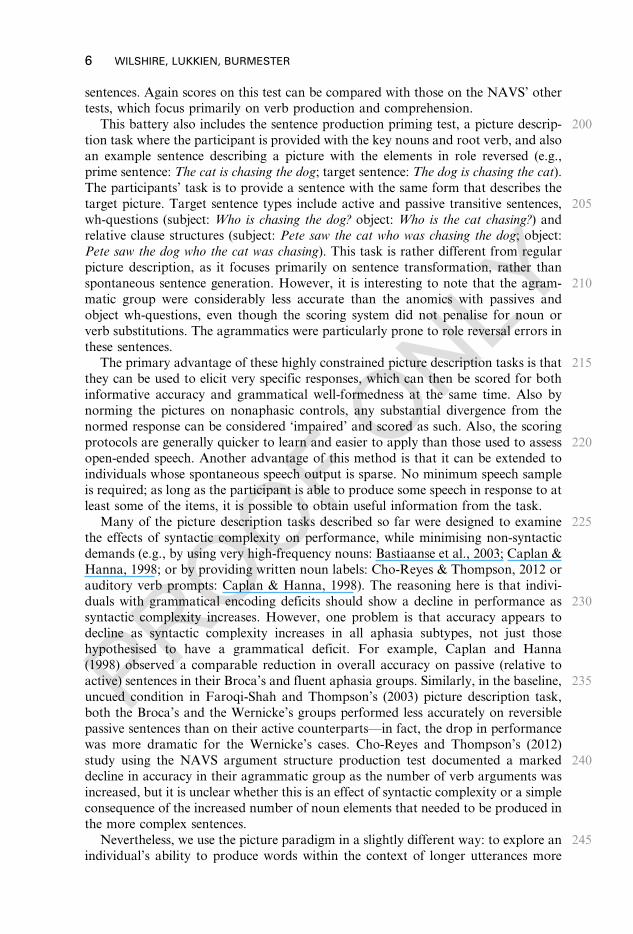
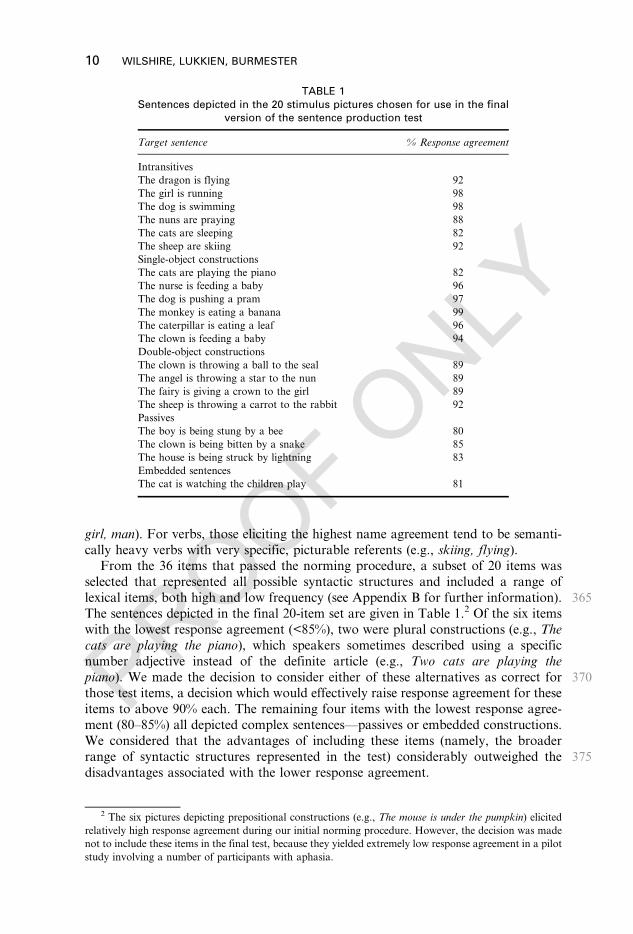
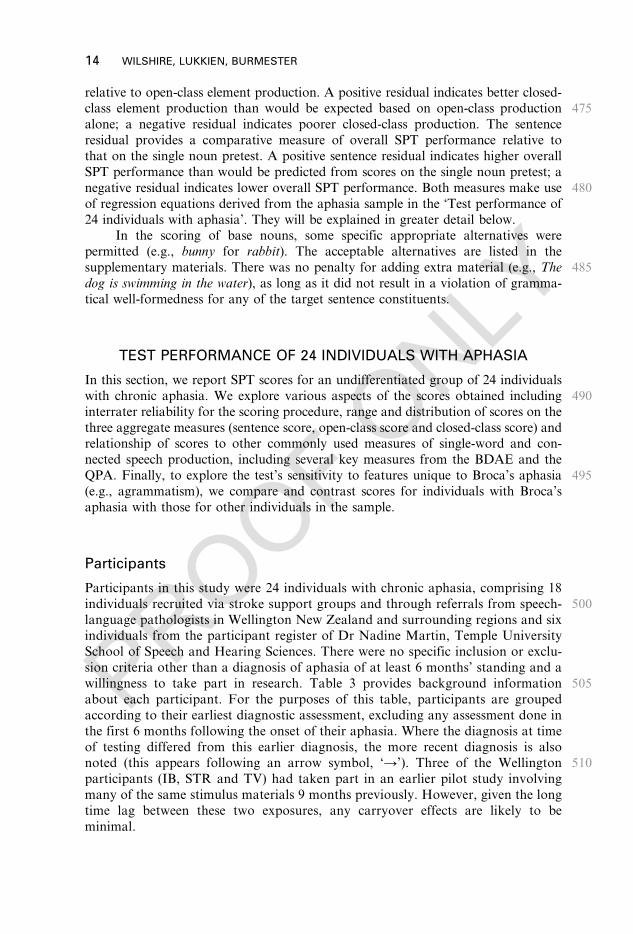
Arrows were used to identify the items to be included in the sentence, with a dotindicating the one to be produced first. An example is shown in panel (a) of Figure 1.Also, the target verb was provided orally by the experimenter. In a group of 55
140nonaphasic controls, all but one picture yielded near-ceiling levels of response agree-ment. The scoring protocol specified: (a) how responses should be divided intoindividual utterances; (b) in cases where multiple attempts were given, how the‘best effort’ should be identified for scoring and (c) how each constituent grammaticalelement and lexical item should be scored (e.g., subject determiner, subject noun,
145object determiner, indirect object noun, auxiliary, root verb, inflectional affix orpreposition). Caplan and Hanna (1998) reported test data from 20 individuals withaphasia—12 with Broca’s aphasia and 8 with fluent aphasia. Both groups performedmore poorly as grammatical complexity was increased; the Broca’s group showed a
Figure 1. Example of stimulus pictures from previous picture description tasks. Panel (a) shows an examplefrom Caplan and Hanna (1998). The picture shown here was designed to elicit the sentence The ball wasthrown to the boy by the man. Panel (b) shows an example from the NAVS argument structure productiontests (Cho-Reyes & Thompson, 2012). This picture is designed to elicit the sentence The man is washing theclothes.
1 A further five pictures were included in the original test to elicit subject–object relative sentences.These were subsequently excluded from the analysis, as they failed to reliably elicit the target construction.
4 WILSHIRE, LUKKIEN, BURMESTER
particularly steep drop in content word scores as complexity increased. However,150many of these trends were not statistically significant, which may be due to hetero-
geneity within the participant subgroups themselves.More recently, Faroqi-Shah and Thompson (2003) developed a picture description
task to explore whether lexical cues improved sentence production accuracy indifferent aphasia subgroups. There were 60 stimulus pictures, each depicting a
155single-object transitive sentence, with equal numbers of reversible and nonreversiblesentences (e.g., The runner lifted the skier). Similar to Caplan and Hanna (1998), anarrow was placed next to the item to be mentioned first. Participants were furtherprompted with the question, ‘What is he/she doing?’ (for actives), or, ‘What ishappening to her’? (for passives). All picture stimuli yielded 100% response agree-
160ment when normed on a group of 10 control participants. Several key aspects of thescoring system are worth noting here. First, the best effort response was identified,using criteria similar to those of Caplan and Hanna (1998), and this was then scoredas correct or incorrect overall (allowing for appropriate alternatives and phonemicerrors). Then the errors themselves were categorised. Error categories included role
165reversal (agent → patient, or vice versa), grammatical morpheme errors (and whethersubstitution or omission), preposition errors and non-sentences. Interrater agreementwas also reported, which was 92% for the identification of the best effort, 92% foroverall accuracy scoring and 100% for error categorisation.
Several recently published aphasia assessments also include carefully constructed170picture description tasks. The sentence construction test in the verb and sentence test
battery (VAST) comprises 20 pictures depicting 10 transitive and 10 intransitivesentences (Bastiaanse et al., 2002, 2003). A group of older controls scored close toceiling on the English version of this test. The scoring system is simple: sentences arescored on a correct/incorrect basis, and various finer aspects of the utterances can
175then be examined informally (e.g., syntactic well-formedness, lexical content, inci-dence of nouns/verbs). Scores on this test can then be compared on other VASTsubtests that examine specific various of verb production and comprehensionAQ3 ,enabling the research to build up a profile of each person’s difficulties, especiallywith respect to verbs. The recent Northwestern Assessment of Verbs and Sentences
180(NAVS) includes the argument structure production test, which uses picture descrip-tion to elicit sentences that vary in verb argument structure (e.g., one argument: Thedog is barking; two: The man is washing the car; three: The postman is delivering thepackage to the man; Cho-Reyes & Thompson, 2012). In some sentences, all argu-ments are obligatory, and in others, at least one was optional. The target nouns are
185labelled on the picture; an example is shown in panel (b) of Figure 1. All tests in theassessment were carefully normed, with control participants scoring at or near ceilingon all stimuli, and interrater agreement was also reported to be high. Data is alsoreported were administeredAQ4 to 35 individuals with agrammatic aphasia, and 24 withanomic aphasia, diagnosed using the Western Aphasia Battery. On the verb argu-
190ment structure test, responses were scored as correct if they contained the target verband the correct number of arguments in the right order; substitutions of similar nouns(e.g., man → boy) were not penalised. The agrammatic group produced moreincorrect responses overall. Sentence accuracy in both groups declined as the numberof verb arguments increased; however, this decline was steeper for the agrammatic
195group. Preposition errors (e.g., The woman is giving the gift for the boy) were the mostcommon error in both groups, although the agrammatics did produce disproportio-nately more argument errors (mostly argument omissions), role reversals and non-
THE SENTENCE PRODUCTION TEST FOR APHASIA 5
sentences. Again scores on this test can be compared with those on the NAVS’ othertests, which focus primarily on verb production and comprehension.
200This battery also includes the sentence production priming test, a picture descrip-tion task where the participant is provided with the key nouns and root verb, and alsoan example sentence describing a picture with the elements in role reversed (e.g.,prime sentence: The cat is chasing the dog; target sentence: The dog is chasing the cat).The participants’ task is to provide a sentence with the same form that describes the
205target picture. Target sentence types include active and passive transitive sentences,wh-questions (subject: Who is chasing the dog? object: Who is the cat chasing?) andrelative clause structures (subject: Pete saw the cat who was chasing the dog; object:Pete saw the dog who the cat was chasing). This task is rather different from regularpicture description, as it focuses primarily on sentence transformation, rather than
210spontaneous sentence generation. However, it is interesting to note that the agram-matic group were considerably less accurate than the anomics with passives andobject wh-questions, even though the scoring system did not penalise for noun orverb substitutions. The agrammatics were particularly prone to role reversal errors inthese sentences.
215The primary advantage of these highly constrained picture description tasks is thatthey can be used to elicit very specific responses, which can then be scored for bothinformative accuracy and grammatical well-formedness at the same time. Also bynorming the pictures on nonaphasic controls, any substantial divergence from thenormed response can be considered ‘impaired’ and scored as such. Also, the scoring
220protocols are generally quicker to learn and easier to apply than those used to assessopen-ended speech. Another advantage of this method is that it can be extended toindividuals whose spontaneous speech output is sparse. No minimum speech sampleis required; as long as the participant is able to produce some speech in response to atleast some of the items, it is possible to obtain useful information from the task.
225Many of the picture description tasks described so far were designed to examinethe effects of syntactic complexity on performance, while minimising non-syntacticdemands (e.g., by using very high-frequency nouns: Bastiaanse et al., 2003; Caplan &Hanna, 1998; or by providing written noun labels: Cho-Reyes & Thompson, 2012 orauditory verb prompts: Caplan & Hanna, 1998). The reasoning here is that indivi-
230duals with grammatical encoding deficits should show a decline in performance assyntactic complexity increases. However, one problem is that accuracy appears todecline as syntactic complexity increases in all aphasia subtypes, not just thosehypothesised to have a grammatical deficit. For example, Caplan and Hanna(1998) observed a comparable reduction in overall accuracy on passive (relative to
235active) sentences in their Broca’s and fluent aphasia groups. Similarly, in the baseline,uncued condition in Faroqi-Shah and Thompson’s (2003) picture description task,both the Broca’s and the Wernicke’s groups performed less accurately on reversiblepassive sentences than on their active counterparts—in fact, the drop in performancewas more dramatic for the Wernicke’s cases. Cho-Reyes and Thompson’s (2012)
240study using the NAVS argument structure production test documented a markeddecline in accuracy in their agrammatic group as the number of verb arguments wasincreased, but it is unclear whether this is an effect of syntactic complexity or a simpleconsequence of the increased number of noun elements that needed to be produced inthe more complex sentences.
245Nevertheless, we use the picture paradigm in a slightly different way: to explore anindividual’s ability to produce words within the context of longer utterances more
6 WILSHIRE, LUKKIEN, BURMESTER
generally, irrespective of their particular syntactic form. This approach takes itsinspiration from theories of normal sentence production that postulate a close inter-play between the process of content word retrieval and syntactic structure generation
250(e.g., Chang, Dell, & Bock, 2006; Stemberger, 1985AQ5 ). It has long been known thatindividuals with aphasia, particularly nonfluent aphasia, are more accurate at produ-cing words in isolation than within sentences (Schwartz & Hodgson, 2002; Speer &Wilshire, in press; Williams & Canter, 1982). Other individuals, particularly thosewith Wernicke’s aphasia, may actually show the opposite pattern (Williams &
255Canter, 1982). Further, several recent studies suggest that the retrieval of anyparticular lexical content item may be influenced by the other content items in theutterance (e.g., Freedman, Martin, & Biegler, 2004; Martin & Freedman, 2001; Scott& Wilshire, 2010; Speer & Wilshire, in press). There is a need for measures that canquantify phenomena of this kind, and which can be obtained easily in the course of a
260more general assessment. The test we have developed provides aggregate measures ofoverall sentence production accuracy (considering both informational content andsyntactic well-formedness), as well as scores for the accurate use of specific elements,such as nouns, verbs and closed-class elements. These various measures can then becompared and contrasted with those from other types of language tasks to gain a
265richer picture of the person’s cognitive profile. Indeed, the test is intended to be usednot just with individuals with agrammatic/Broca’s aphasia, but rather across a rangeof different aphasic syndromes.
Structured pictured event description tasks provide information that is to someextent complementary to that obtainable from more open-ended assessments. In
270picture description tasks, the emphasis is on accuracy of production, rather than ontiming, so the information the test generates is largely orthogonal to that obtainedfrom fluency ratings and other measures of speech rate. Indeed, comparisons betweenthese two sets of measures may themselves help us to tease apart some of the factorsthat influence connected speech in aphasia, including the possible role of speech rate
275limitations. In this respect, it is interesting to note that a number of recent studieshave suggested that the grammatical well-formedness of aphasic utterances may varysignificantly depending upon the elicitation context. For example, some individualswith Broca’s aphasia tend to produce more grammatically well-formed utterances inconstrained tasks (such as action or picture description) than they do in ‘freer’ more
280conversational speech tasks (Beeke, Maxim, & Wilkinson, 2007AQ6 ; Beeke, Wilkinson, &Maxim, 2003; Hofstede & Kolk, 1994; Sahraoui & Nespoulous, 2010). It is possiblethat in these freer tasks, the speaker trades grammatical accuracy for speed, so as tomaintain the listener’s interest. If this is the case, then assessments of open-endedspeech may underestimate the actual grammatical capabilities of the speaker, and
285more constrained tasks may be a better way to assess them. Indeed, a comparison ofscores in picture description and more open-ended tasks may provide importanttheoretical insights into the ways in which grammatical form may vary dependingon the sociolinguistic context and the speaker’s communicative intent.
The materials for our test were designed with the following five considerations in290mind. First, since our aim was to examine sentence production in the broadest sense,
including both syntactic well-formedness and lexical retrieval in context, we wishedto include as many types of syntactic structures as possible and also to incorporate avariety of different lexical content items. Second, the stimulus items needed to besufficiently constrained and well-normed that each person’s response could be eval-
295uated against an expectation of ‘normal’ performance. Third, the assessment needed
THE SENTENCE PRODUCTION TEST FOR APHASIA 7
to be quick to administer, and the scoring procedures simple and reliable, requiringlittle or no special training. Fourth, the test should include a sufficient range ofmaterials that can be used to evaluate individuals with very limited output, as well asthose with milder speech difficulties, and the stimuli should be available throughout
300each attempt to minimise the demands on short-term memory. Fifth, since theassessment was intended to measure accuracy rather than fluency, it should beuntimed. One further stipulation we made was that the test should not require theuse of additional metalinguistic prompts, such as arrows or cues, to constrain theform of the utterance. Such cues constitute an additional task instruction, which must
305be maintained in working memory and actively utilised to modulate output, skillsthat may be particularly challenging for those with damage to anterior languageregions (see, e.g., Kimberg & Farah, 1993). Also, according to one prominent theory,the order of elements within a planned sentence is determined by their relativesalience in the mind of the speaker at the time of initiation (Chang et al., 2006); if
310so, then any attempt to override this salience gradient through the use of externalcues may lead to increased competition for production of the first phrase, andincreased likelihood of failure. Our aim was to design the stimulus pictures in sucha way that they elicit a single dominant sentence structure without the use ofadditional cues.
315The remainder of this article is organised into three sections. In the ‘Developmentof the SPT’ section, we describe the development of the sentence production test(SPT). In the ‘Administration and scoring of the final test’ section, we summarise thescoring procedures used in the test, and the justifications for them. And finally, in the‘Test performance of 24 individuals with aphasia’ section, we report preliminary test
320data from a sample of 24 individuals with chronic aphasia. Using these data, weexamine interrater reliability for our scoring procedure and also explore relationshipsbetween our measures and those from several other widely used assessments.
DEVELOPMENT OF THE SPT
The first phase in the development of the SPT involved testing a sample of partici-325pants without aphasia on a large cohort of potentially suitable pictures, chosen with
our five primary considerations in mind (see above). Because our aim was to examinelexical as well as grammatical aspects of sentence production, agreement aboutlexical content was as important as agreement about sentence structure.
Starting with an initial cohort of 48 pictures that met these criteria, we then330collected response agreement data from a 150 nonaphasic individuals: 50 were aged
between 18 and 30 years (M = 21.24, SD = 3.94); a further 50 were aged between 31and 50 years (M = 39.8, SD = 6.62) and the remaining 50 were aged between 50 and81 years (M = 58.32, SD = 7.16). Each of these participants was asked if they hadany history of neurological illness or injury, and only those who responded ‘no’ were
335selected into the study. Each participant was given a booklet containing 48 black andwhite line drawings of scenes (10 cm by 10 cm), which were specifically drawn for thestudy by New Zealand artist Richard Moore. Participants were instructed to describethe picture using a single complete sentence. The target sentences were designed torepresent as wide a range of target structures as possible, including intransitives (e.g.,
340The dragon is flying), single-object transitives (e.g., The dog is pushing the pram),double-object/indirect object constructions (e.g., The clown is throwing a ball to theseal), passives (e.g., The boy is being stung by a bee) and embedded sentences (e.g.,
8 WILSHIRE, LUKKIEN, BURMESTER
The cat is watching the children play). The scenes were selected on the basis of resultsof an earlier pilot study that utilised a different set of drawings (see Lukkien, 2006,
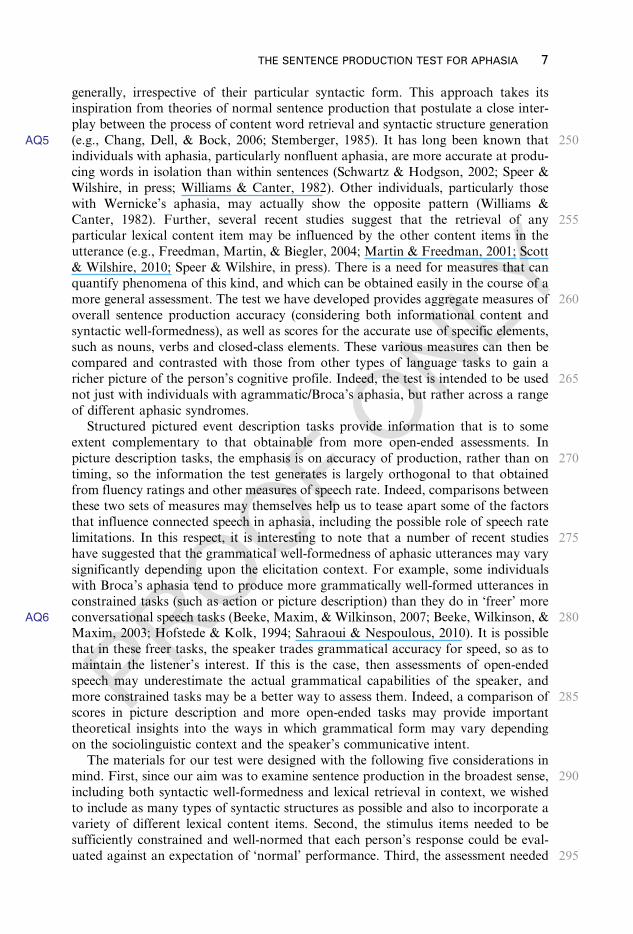
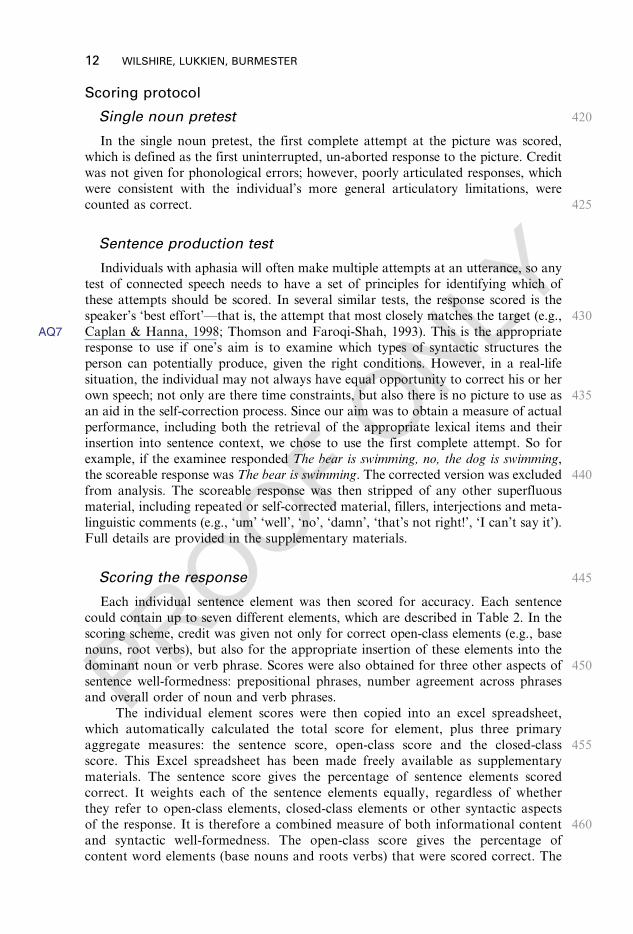
345for further details). Appendix A contains a complete list of the target sentencescorresponding to each of the pictures that underwent norming, and Figure 2 showssome examples of the pictures.
For the analysis of response agreement, the data were collapsed across all threeage groups. A total of 36 scenes elicited at least 80% response agreement across all
350participants (i.e., at least 80% of all participants described the scene using exactly thesame sentence). For many of the picture stimuli, response agreement exceeded 90%,and in many just below this level, the alternative responses given were usually a veryclose variant of the target. Nevertheless, levels of agreement were lower for sometypes of structures than others. Generally, as syntactic complexity increased, response
355agreement decreased. For example, pictures depicting passive sentences tended toproduce lower agreement levels than those depicting active sentences. Nevertheless,three passive sentences successfully met the agreement criterion and one embeddedsentence (The cat is watching the children play). Turning to the lexical content items,response agreement tended to be higher for medium- to low-frequency words with
360very specific referents (e.g., clown, nurse) than for broader more common terms (e.g.,
Figure 2. Examples of stimulus scenes piloted in Part 1. Panel (a) depicts The dog is swimming and panel(b) depicts The cat is watching the children play.
THE SENTENCE PRODUCTION TEST FOR APHASIA 9
girl, man). For verbs, those eliciting the highest name agreement tend to be semanti-cally heavy verbs with very specific, picturable referents (e.g., skiing, flying).
From the 36 items that passed the norming procedure, a subset of 20 items wasselected that represented all possible syntactic structures and included a range of
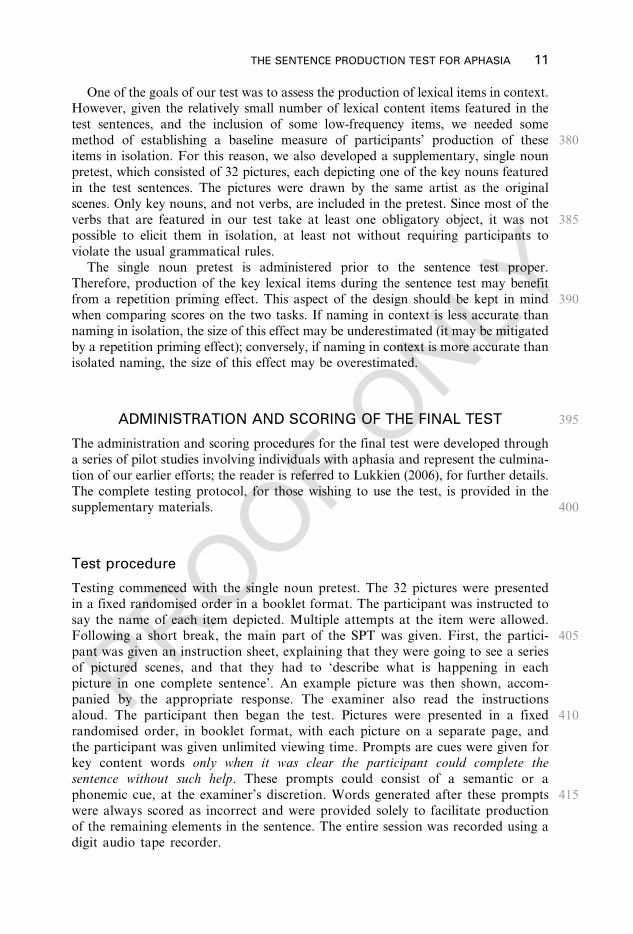
365lexical items, both high and low frequency (see Appendix B for further information).The sentences depicted in the final 20-item set are given in Table 1.2 Of the six itemswith the lowest response agreement (<85%), two were plural constructions (e.g., Thecats are playing the piano), which speakers sometimes described using a specificnumber adjective instead of the definite article (e.g., Two cats are playing the
370piano). We made the decision to consider either of these alternatives as correct forthose test items, a decision which would effectively raise response agreement for theseitems to above 90% each. The remaining four items with the lowest response agree-ment (80–85%) all depicted complex sentences—passives or embedded constructions.We considered that the advantages of including these items (namely, the broader
375range of syntactic structures represented in the test) considerably outweighed thedisadvantages associated with the lower response agreement.
2 The six pictures depicting prepositional constructions (e.g., The mouse is under the pumpkin) elicitedrelatively high response agreement during our initial norming procedure. However, the decision was madenot to include these items in the final test, because they yielded extremely low response agreement in a pilotstudy involving a number of participants with aphasia.
TABLE 1Sentences depicted in the 20 stimulus pictures chosen for use in the final
version of the sentence production test
Target sentence % Response agreement
IntransitivesThe dragon is flying 92The girl is running 98The dog is swimming 98The nuns are praying 88The cats are sleeping 82The sheep are skiing 92Single-object constructionsThe cats are playing the piano 82The nurse is feeding a baby 96The dog is pushing a pram 97The monkey is eating a banana 99The caterpillar is eating a leaf 96The clown is feeding a baby 94Double-object constructionsThe clown is throwing a ball to the seal 89The angel is throwing a star to the nun 89The fairy is giving a crown to the girl 89The sheep is throwing a carrot to the rabbit 92PassivesThe boy is being stung by a bee 80The clown is being bitten by a snake 85The house is being struck by lightning 83Embedded sentencesThe cat is watching the children play 81
10 WILSHIRE, LUKKIEN, BURMESTER
One of the goals of our test was to assess the production of lexical items in context.However, given the relatively small number of lexical content items featured in thetest sentences, and the inclusion of some low-frequency items, we needed some
380method of establishing a baseline measure of participants’ production of theseitems in isolation. For this reason, we also developed a supplementary, single nounpretest, which consisted of 32 pictures, each depicting one of the key nouns featuredin the test sentences. The pictures were drawn by the same artist as the originalscenes. Only key nouns, and not verbs, are included in the pretest. Since most of the
385verbs that are featured in our test take at least one obligatory object, it was notpossible to elicit them in isolation, at least not without requiring participants toviolate the usual grammatical rules.
The single noun pretest is administered prior to the sentence test proper.Therefore, production of the key lexical items during the sentence test may benefit
390from a repetition priming effect. This aspect of the design should be kept in mindwhen comparing scores on the two tasks. If naming in context is less accurate thannaming in isolation, the size of this effect may be underestimated (it may be mitigatedby a repetition priming effect); conversely, if naming in context is more accurate thanisolated naming, the size of this effect may be overestimated.
395ADMINISTRATION AND SCORING OF THE FINAL TEST
The administration and scoring procedures for the final test were developed througha series of pilot studies involving individuals with aphasia and represent the culmina-tion of our earlier efforts; the reader is referred to Lukkien (2006), for further details.The complete testing protocol, for those wishing to use the test, is provided in the
400supplementary materials.
Test procedure
Testing commenced with the single noun pretest. The 32 pictures were presentedin a fixed randomised order in a booklet format. The participant was instructed tosay the name of each item depicted. Multiple attempts at the item were allowed.
405Following a short break, the main part of the SPT was given. First, the partici-pant was given an instruction sheet, explaining that they were going to see a seriesof pictured scenes, and that they had to ‘describe what is happening in eachpicture in one complete sentence’. An example picture was then shown, accom-panied by the appropriate response. The examiner also read the instructions
410aloud. The participant then began the test. Pictures were presented in a fixedrandomised order, in booklet format, with each picture on a separate page, andthe participant was given unlimited viewing time. Prompts are cues were given forkey content words only when it was clear the participant could complete thesentence without such help. These prompts could consist of a semantic or a
415phonemic cue, at the examiner’s discretion. Words generated after these promptswere always scored as incorrect and were provided solely to facilitate productionof the remaining elements in the sentence. The entire session was recorded using adigit audio tape recorder.
THE SENTENCE PRODUCTION TEST FOR APHASIA 11
Scoring protocol
420Single noun pretest
In the single noun pretest, the first complete attempt at the picture was scored,which is defined as the first uninterrupted, un-aborted response to the picture. Creditwas not given for phonological errors; however, poorly articulated responses, whichwere consistent with the individual’s more general articulatory limitations, were
425counted as correct.
Sentence production test
Individuals with aphasia will often make multiple attempts at an utterance, so anytest of connected speech needs to have a set of principles for identifying which ofthese attempts should be scored. In several similar tests, the response scored is the
430speaker’s ‘best effort’—that is, the attempt that most closely matches the target (e.g.,Caplan & Hanna, 1998; Thomson and Faroqi-Shah, 1993AQ7 ). This is the appropriateresponse to use if one’s aim is to examine which types of syntactic structures theperson can potentially produce, given the right conditions. However, in a real-lifesituation, the individual may not always have equal opportunity to correct his or her
435own speech; not only are there time constraints, but also there is no picture to use asan aid in the self-correction process. Since our aim was to obtain a measure of actualperformance, including both the retrieval of the appropriate lexical items and theirinsertion into sentence context, we chose to use the first complete attempt. So forexample, if the examinee responded The bear is swimming, no, the dog is swimming,
440the scoreable response was The bear is swimming. The corrected version was excludedfrom analysis. The scoreable response was then stripped of any other superfluousmaterial, including repeated or self-corrected material, fillers, interjections and meta-linguistic comments (e.g., ‘um’ ‘well’, ‘no’, ‘damn’, ‘that’s not right!’, ‘I can’t say it’).Full details are provided in the supplementary materials.
445Scoring the response
Each individual sentence element was then scored for accuracy. Each sentencecould contain up to seven different elements, which are described in Table 2. In thescoring scheme, credit was given not only for correct open-class elements (e.g., basenouns, root verbs), but also for the appropriate insertion of these elements into the
450dominant noun or verb phrase. Scores were also obtained for three other aspects ofsentence well-formedness: prepositional phrases, number agreement across phrasesand overall order of noun and verb phrases.
The individual element scores were then copied into an excel spreadsheet,which automatically calculated the total score for element, plus three primary
455aggregate measures: the sentence score, open-class score and the closed-classscore. This Excel spreadsheet has been made freely available as supplementarymaterials. The sentence score gives the percentage of sentence elements scoredcorrect. It weights each of the sentence elements equally, regardless of whetherthey refer to open-class elements, closed-class elements or other syntactic aspects
460of the response. It is therefore a combined measure of both informational contentand syntactic well-formedness. The open-class score gives the percentage ofcontent word elements (base nouns and roots verbs) that were scored correct. The
12 WILSHIRE, LUKKIEN, BURMESTER
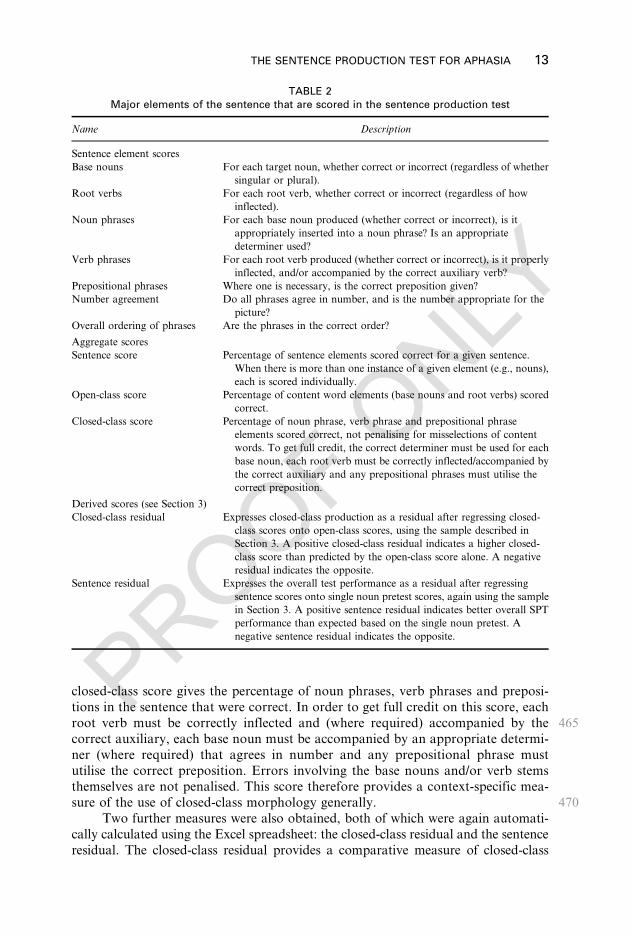
closed-class score gives the percentage of noun phrases, verb phrases and preposi-tions in the sentence that were correct. In order to get full credit on this score, each
465root verb must be correctly inflected and (where required) accompanied by thecorrect auxiliary, each base noun must be accompanied by an appropriate determi-ner (where required) that agrees in number and any prepositional phrase mustutilise the correct preposition. Errors involving the base nouns and/or verb stemsthemselves are not penalised. This score therefore provides a context-specific mea-
470sure of the use of closed-class morphology generally.Two further measures were also obtained, both of which were again automati-
cally calculated using the Excel spreadsheet: the closed-class residual and the sentenceresidual. The closed-class residual provides a comparative measure of closed-class
TABLE 2Major elements of the sentence that are scored in the sentence production test
Name Description
Sentence element scoresBase nouns For each target noun, whether correct or incorrect (regardless of whether
singular or plural).Root verbs For each root verb, whether correct or incorrect (regardless of how
inflected).Noun phrases For each base noun produced (whether correct or incorrect), is it
appropriately inserted into a noun phrase? Is an appropriatedeterminer used?
Verb phrases For each root verb produced (whether correct or incorrect), is it properlyinflected, and/or accompanied by the correct auxiliary verb?
Prepositional phrases Where one is necessary, is the correct preposition given?Number agreement Do all phrases agree in number, and is the number appropriate for the
picture?Overall ordering of phrases Are the phrases in the correct order?
Aggregate scoresSentence score Percentage of sentence elements scored correct for a given sentence.
When there is more than one instance of a given element (e.g., nouns),each is scored individually.
Open-class score Percentage of content word elements (base nouns and root verbs) scoredcorrect.
Closed-class score Percentage of noun phrase, verb phrase and prepositional phraseelements scored correct, not penalising for misselections of contentwords. To get full credit, the correct determiner must be used for eachbase noun, each root verb must be correctly inflected/accompanied bythe correct auxiliary and any prepositional phrases must utilise thecorrect preposition.
Derived scores (see Section 3)Closed-class residual Expresses closed-class production as a residual after regressing closed-
class scores onto open-class scores, using the sample described inSection 3. A positive closed-class residual indicates a higher closed-class score than predicted by the open-class score alone. A negativeresidual indicates the opposite.
Sentence residual Expresses the overall test performance as a residual after regressingsentence scores onto single noun pretest scores, again using the samplein Section 3. A positive sentence residual indicates better overall SPTperformance than expected based on the single noun pretest. Anegative sentence residual indicates the opposite.
THE SENTENCE PRODUCTION TEST FOR APHASIA 13
relative to open-class element production. A positive residual indicates better closed-475class element production than would be expected based on open-class production
alone; a negative residual indicates poorer closed-class production. The sentenceresidual provides a comparative measure of overall SPT performance relative tothat on the single noun pretest. A positive sentence residual indicates higher overallSPT performance than would be predicted from scores on the single noun pretest; a
480negative residual indicates lower overall SPT performance. Both measures make useof regression equations derived from the aphasia sample in the ‘Test performance of24 individuals with aphasia’. They will be explained in greater detail below.
In the scoring of base nouns, some specific appropriate alternatives werepermitted (e.g., bunny for rabbit). The acceptable alternatives are listed in the
485supplementary materials. There was no penalty for adding extra material (e.g., Thedog is swimming in the water), as long as it did not result in a violation of gramma-tical well-formedness for any of the target sentence constituents.
TEST PERFORMANCE OF 24 INDIVIDUALS WITH APHASIA
In this section, we report SPT scores for an undifferentiated group of 24 individuals490with chronic aphasia. We explore various aspects of the scores obtained including
interrater reliability for the scoring procedure, range and distribution of scores on thethree aggregate measures (sentence score, open-class score and closed-class score) andrelationship of scores to other commonly used measures of single-word and con-nected speech production, including several key measures from the BDAE and the
495QPA. Finally, to explore the test’s sensitivity to features unique to Broca’s aphasia(e.g., agrammatism), we compare and contrast scores for individuals with Broca’saphasia with those for other individuals in the sample.
Participants
Participants in this study were 24 individuals with chronic aphasia, comprising 18500individuals recruited via stroke support groups and through referrals from speech-
language pathologists in Wellington New Zealand and surrounding regions and sixindividuals from the participant register of Dr Nadine Martin, Temple UniversitySchool of Speech and Hearing Sciences. There were no specific inclusion or exclu-sion criteria other than a diagnosis of aphasia of at least 6 months’ standing and a
505willingness to take part in research. Table 3 provides background informationabout each participant. For the purposes of this table, participants are groupedaccording to their earliest diagnostic assessment, excluding any assessment done inthe first 6 months following the onset of their aphasia. Where the diagnosis at timeof testing differed from this earlier diagnosis, the more recent diagnosis is also
510noted (this appears following an arrow symbol, ‘→’). Three of the Wellingtonparticipants (IB, STR and TV) had taken part in an earlier pilot study involvingmany of the same stimulus materials 9 months previously. However, given the longtime lag between these two exposures, any carryover effects are likely to beminimal.
14 WILSHIRE, LUKKIEN, BURMESTER
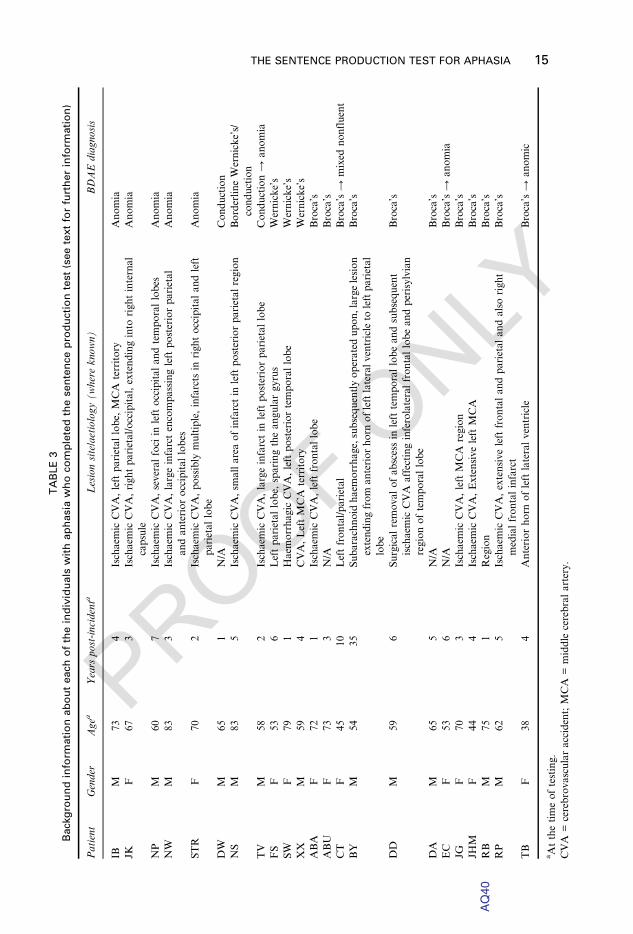
TABLE3
Back
groundinform
ationabouteach
oftheindividuals
withaphasiawhoco
mpletedthese
ntence
productiontest
(seetextforfurtherinform
ation)
Patient
Gender
Age
aYears
post-in
cident
aLesionsite/aetiology
(where
know
n)BDAEdiagnosis
IBM
734
Ischaemic
CVA,leftpa
rietal
lobe,M
CA
territo
ryAno
mia
JKF
673
Ischaemic
CVA,right
parietal/occipita
l,extend
inginto
righ
tinternal
capsule
Ano
mia
NP
M60
7Ischaemic
CVA,several
foci
inleftoccipitala
ndtempo
rallob
esAno
mia
NW
M83
3Ischaemic
CVA,large
infarctencompa
ssingleftpo
steriorpa
rietal
andan
terior
occipitallobes
Ano
mia
STR
F70
2Ischaemic
CVA,p
ossiblymultip
le,infarctsin
righ
toccipitala
ndleft
parietal
lobe
Ano
mia
DW
M65
1N/A
Con
duction
NS
M83
5Ischaemic
CVA,smalla
reaof
infarctin
leftpo
steriorpa
rietal
region
BorderlineWernicke’s/
cond
uctio
nTV
M58
2Ischaemic
CVA,large
infarctin
leftpo
steriorpa
rietal
lobe
Con
duction→
anom
iaFS
F53
6Leftpa
rietal
lobe,spa
ring
thean
gulargyrus
Wernicke’s
SWF
791
Haemorrhagic
CVA,leftpo
steriortempo
rallob
eWernicke’s
XX
M59
4CVA,L
eftMCA
territo
ryWernicke’s
ABA
F72
1Ischaemic
CVA,leftfron
tallob
eBroca’s
ABU
F73
3N/A
Broca’s
CT
F45
10Leftfron
tal/p
arietal
Broca’s→
mixed
nonfluent
BY
M54
35Su
barachno
idha
emorrhag
e,subsequently
operated
upon
,large
lesion
extend
ingfrom
anterior
horn
ofleftlateralv
entricleto
leftpa
rietal
lobe
Broca’s
DD
M59
6Su
rgical
remov
alof
abscessin
lefttempo
rallob
ean
dsubsequent
ischaemic
CVA
affectinginferolateralfrontal
lobe
andperisylvian
region
oftempo
rallob
e
Broca’s
DA
M65
5N/A
Broca’s
EC
F53
6N/A
Broca’s→
anom
iaJG
F70
3Ischaemic
CVA,leftMCA
region
Broca’s
JHM
F44
4Ischaemic
CVA,E
xtensive
leftMCA
Broca’s
RB
M75
1Region
AQ40
Broca’s
RP
M62
5Ischaemic
CVA,e
xtensive
leftfron
talan
dpa
rietal
andalso
righ
tmedialfrontal
infarct
Broca’s
TB
F38
4Anteriorho
rnof
leftlateralv
entricle
Broca’s→
anom
ic
a Atthetim
eof
testing.
CVA
=cerebrov
ascularaccident;M
CA
=middlecerebral
artery.
THE SENTENCE PRODUCTION TEST FOR APHASIA 15
515Method
Procedure
The participants were tested individually, either at the University or in their ownhome. The single noun pretest was administered first, followed by the SPT proper inthe same testing session, according to the test procedures set out in the
520‘Administration and scoring of the final test’ section. All stimulus pictures werepresented in hard copy format (booklets, with one stimulus picture per page).Sessions were tape recorded and later transcribed and scored according to theprotocols set out in the ‘Administration and scoring of the final test’ section. Someparticipants completed a larger version of the test, which included some items later
525removed from the final version of the test to reduce testing time. However, here wereport only data for the 20 items included in the final version of the test. The QPAwas also administered to all participants capable of completing it, usually during aseparate testing session. Finally, all participants had completed the BDAE and theBNT prior to their participation in this study.
530Results
Interrater reliability
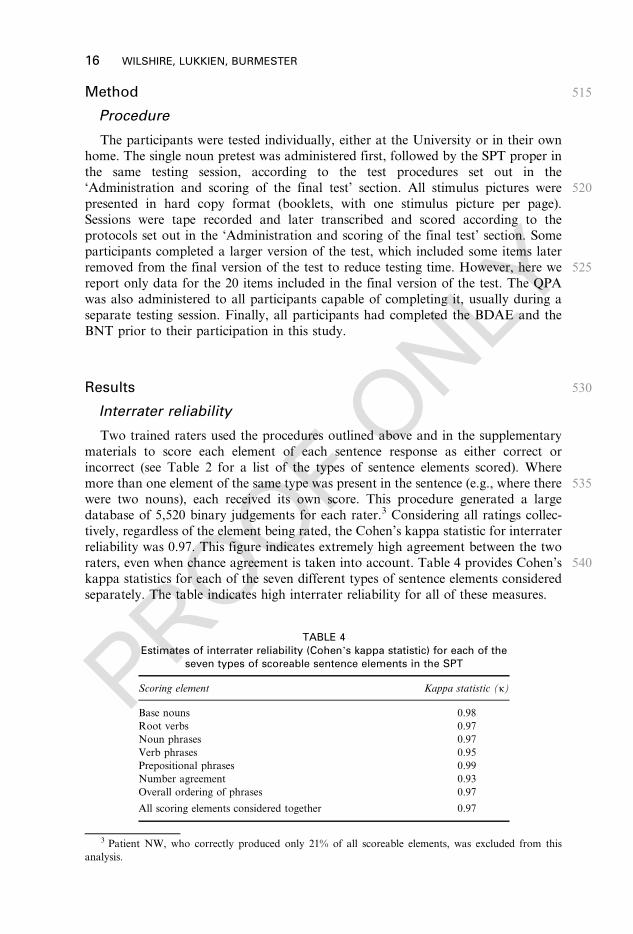
Two trained raters used the procedures outlined above and in the supplementarymaterials to score each element of each sentence response as either correct orincorrect (see Table 2 for a list of the types of sentence elements scored). Where
535more than one element of the same type was present in the sentence (e.g., where therewere two nouns), each received its own score. This procedure generated a largedatabase of 5,520 binary judgements for each rater.3 Considering all ratings collec-tively, regardless of the element being rated, the Cohen’s kappa statistic for interraterreliability was 0.97. This figure indicates extremely high agreement between the two
540raters, even when chance agreement is taken into account. Table 4 provides Cohen’skappa statistics for each of the seven different types of sentence elements consideredseparately. The table indicates high interrater reliability for all of these measures.
TABLE 4Estimates of interrater reliability (Cohen’s kappa statistic) for each of the
seven types of scoreable sentence elements in the SPT
Scoring element Kappa statistic (κ)
Base nouns 0.98Root verbs 0.97Noun phrases 0.97Verb phrases 0.95Prepositional phrases 0.99Number agreement 0.93Overall ordering of phrases 0.97
All scoring elements considered together 0.97
3 Patient NW, who correctly produced only 21% of all scoreable elements, was excluded from thisanalysis.
16 WILSHIRE, LUKKIEN, BURMESTER
Internal consistency
Cronbach’s alpha for the entire 20-item test was 0.90, indicating a high level of545internal consistency amongst items. Cronbach’s alpha was also calculated separately
for each type of sentence construction (except embedded constructions, of whichthere was only one exemplar). Double-object constructions yielded the highest value(α = 0.80), followed by intransitive and single-object constructions (α = 0.71 and 0.75,respectively), with passive constructions yielding the lowest value (α = 0.54). When
550interpreting these values, it is important to bear in mind that the SPT is designed tomeasure multiple capacities simultaneously, including the ability to produce open-class items in context, to construct syntactically well-formed sentence frames and toinsert both open- and closed-class items into appropriate positions in the frame. So,internal consistency would be expected to be lower than in a scale designed to
555measure only a single construct.
Aggregate scores and their interrelationships
Table 5 shows participants’ scores on the single noun pretest and on the keyaggregate measures from the SPT (the closed-class residual and sentence residualmeasures will be explained further below). Also shown are scores for several mea-
560sures from the BDAE (Goodglass et al., 2001) and the QPA (Saffran et al., 1989). Onthe SPT, participants’ sentence scores ranged from 19% to 94%. However, this rangeincluded one participant (NW), who scored an exceedingly low 19%. He onlyattempted 8 out of the 20 sentence items, responding ‘I don’t know’ to the remainder.Excluding this participant, scores ranged from 55% to 94% (mean = 76.4, SD = 11.0).
565Overall, the spread of scores is quite restricted, despite the fact that the participantsample represented a range of different severity levels, including several cases whocould not complete the QPA (see Table 5). The restricted spread is likely to reflect theaggregated nature of the sentence score measure, in which any partially correctattempt receives at least some credit. Open-class scores had a similar range, from
57047% to 97%, excluding NW (mean = 73.1, SD = 12.8), while closed-class scores weremore spread, ranging from 34% to 93%, excluding NW (mean = 73.1, SD = 15.4).Because NW’s scores were exceedingly low on all measures, there was a danger thatthey may inflate any correlation or regression statistics examining the relationshipsamongst SPT scores on a sample of this size. For this reason, his data are excluded
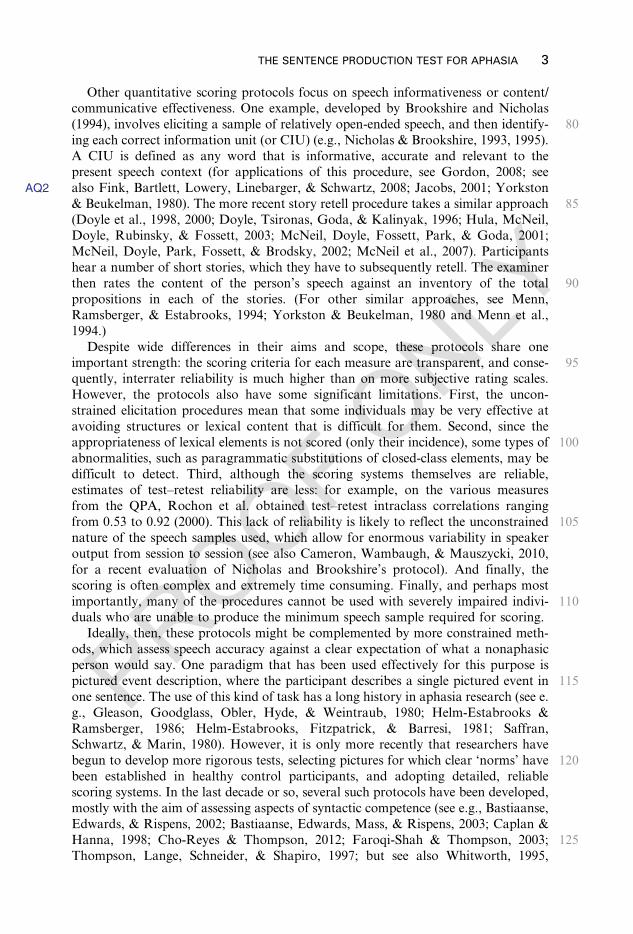
575from all subsequent figures and analyses.Figure 3 shows the distribution of sentence scores across participants, broken
down according to fluency category (nonfluent aphasia: N = 13; fluent aphasia:N = 10). In general, there is a great deal of overlap in the scores for fluent andnonfluent individuals. This observation is perhaps not surprising, since any test of
580connected speech requires a number of different linguistic skills, including the selec-tion of appropriate lexical items, as well as the organisation of these items into a well-formed sentence, so it is likely to pose difficulties for all individuals with aphasia. Inaddition, our participant sample represented a wide range of different levels ofoverall aphasia severity, and the more severe the impairment, the more likely it is
585to impact upon performance on a complex task of this type. We return to the issue ofseverity below, when we consider the relationship of SPT scores to other commonlyused measures of spoken language production in aphasia.
THE SENTENCE PRODUCTION TEST FOR APHASIA 17
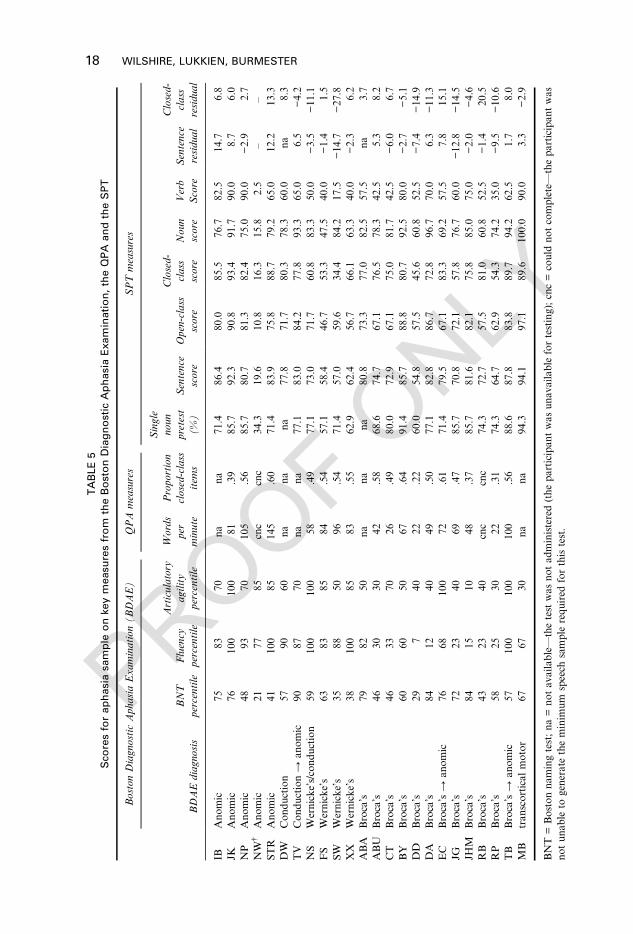
TABLE5
Sco
resforaphasiasa
mple
onke
ymeasu
resfrom
theBostonDiagnostic
AphasiaExamination,theQPA
andtheSPT
BostonDiagn
ostic
Aph
asia
Exa
mination(B
DAE)
QPA
measures
SPTmeasures
BDAEdiag
nosis
BNT
percentile
Fluency
percentile
Articulatory
agility
percentile
Words
per
minute
Proportion
closed-class
items
Single
noun
pretest
(%)
Sentence
score
Open-class
score
Closed-
class
score
Nou
nscore
Verb
Score
Sentence
residu
al
Closed-
class
residu
al
IBAno
mic
7583
70na
na71
.486
.480
.085
.576
.782
.514
.76.8
JKAno
mic
7610
010
081
.39
85.7
92.3
90.8
93.4
91.7
90.0
8.7
6.0
NP
Ano
mic
4893
7010
5.56
85.7
80.7
81.3
82.4
75.0
90.0
−2.9
2.7
NW
†Ano
mic
2177
85cnc
cnc
34.3
19.6
10.8
16.3
15.8
2.5
––
STR
Ano
mic
4110
085
145
.60
71.4
83.9
75.8
88.7
79.2
65.0
12.2
13.3
DW
Con
duction
5790
60na
nana
77.8
71.7
80.3
78.3
60.0
na8.3
TV
Con
duction→
anom
ic90
8770
nana
77.1
83.0
84.2
77.8
93.3
65.0
6.5
−4.2
NS
Wernicke’s/cond
uctio
n59
100
100
58.49
77.1
73.0
71.7
60.8
83.3
50.0
−3.5
−11
.1FS
Wernicke’s
6383
8584
.54
57.1
58.4
46.7
53.3
47.5
40.0
−1.4
1.5
SWWernicke’s
3588
5096
.54
71.4
57.0
59.6
34.4
84.2
17.5
−14
.7−27
.8XX
Wernicke’s
3810
085
83.55
62.9
62.4
56.7
66.1
63.3
40.0
−2.3
6.2
ABA
Broca’s
7982
50na
nana
80.8
73.3
77.0
82.5
57.5
na3.7
ABU
Broca’s
4630
3042
.58
68.6
74.7
67.1
76.5
78.3
42.5
5.3
8.2
CT
Broca’s
4633
7026
.49
80.0
72.9
67.1
75.0
81.7
42.5
−6.0
6.7
BY
Broca’s
6060
5067
.64
91.4
85.7
88.8
80.7
92.5
80.0
−2.7
−5.1
DD
Broca’s
297
4022
.22
60.0
54.8
57.5
45.6
60.8
52.5
−7.4
−14
.9DA
Broca’s
8412
4049
.50
77.1
82.8
86.7
72.8
96.7
70.0
6.3
−11
.3EC
Broca’s→
anom
ic76
6810
072
.61
71.4
79.5
67.1
83.3
69.2
57.5
7.8
15.1
JGBroca’s
7223
4069
.47
85.7
70.8
72.1
57.8
76.7
60.0
−12
.8−14
.5JH
MBroca’s
8415
1048
.37
85.7
81.6
82.1
75.8
85.0
75.0
−2.0
−4.6
RB
Broca’s
4323
40cnc
cnc
74.3
72.7
57.5
81.0
60.8
52.5
−1.4
20.5
RP
Broca’s
5825
3022
.31
74.3
64.7
62.9
54.3
74.2
35.0
−9.5
−10
.6TB
Broca’s→
anom
ic57
100
100
100
.56
88.6
87.8
83.8
89.7
94.2
62.5
1.7
8.0
MB
tran
scortic
almotor
6767
30na
na94
.394
.197
.189
.610
0.0
90.0
3.3
−2.9
BNT=Bostonna
mingtest;n
a=no
tav
ailable—
thetest
was
notad
ministered(the
participan
twas
unav
ailablefortesting);c
nc=couldno
tcomplete—
thepa
rticipan
twas
notun
able
togenerate
theminim
umspeech
samplerequ
ired
forthistest.
18 WILSHIRE, LUKKIEN, BURMESTER
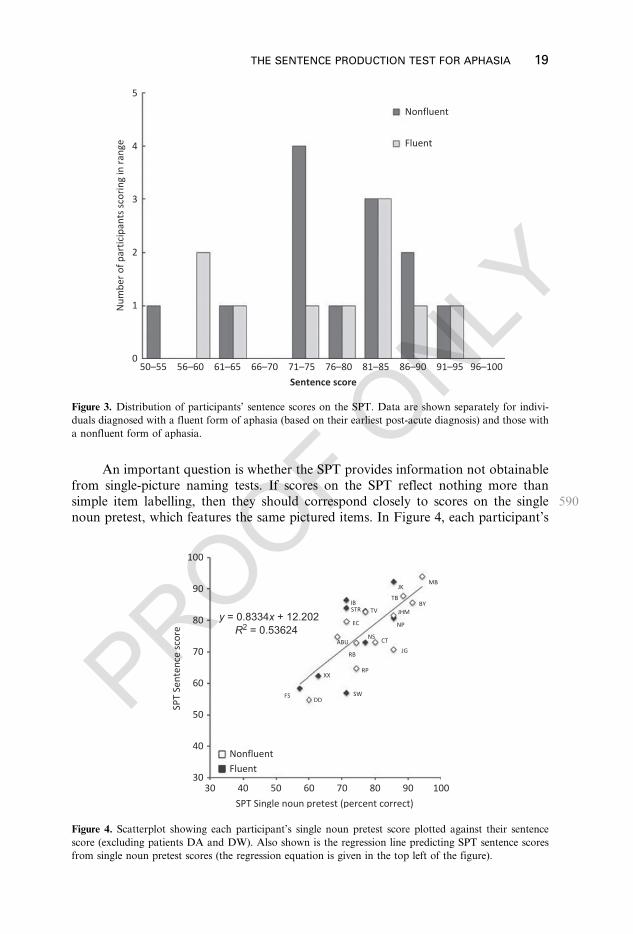
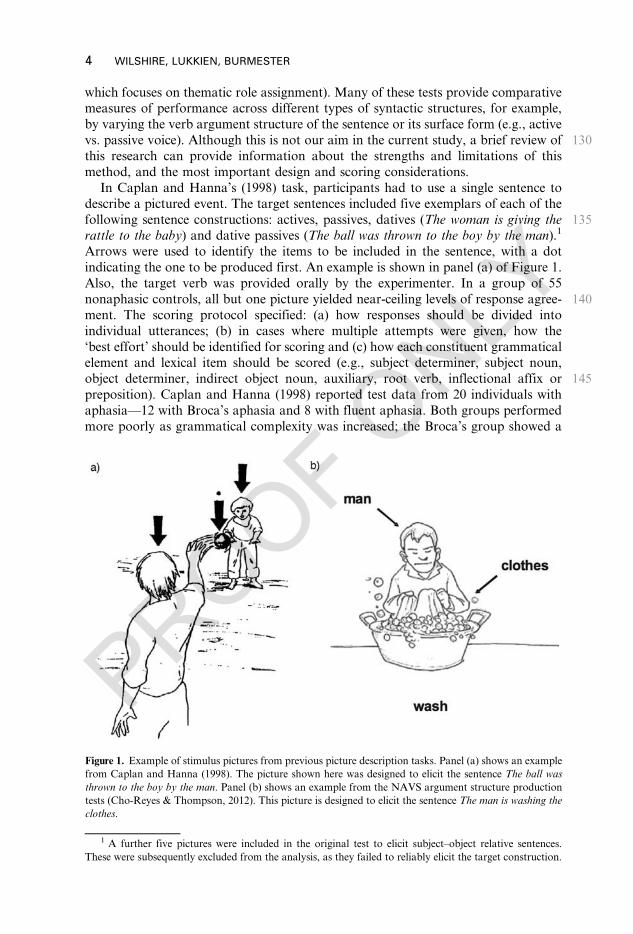
An important question is whether the SPT provides information not obtainablefrom single-picture naming tests. If scores on the SPT reflect nothing more than
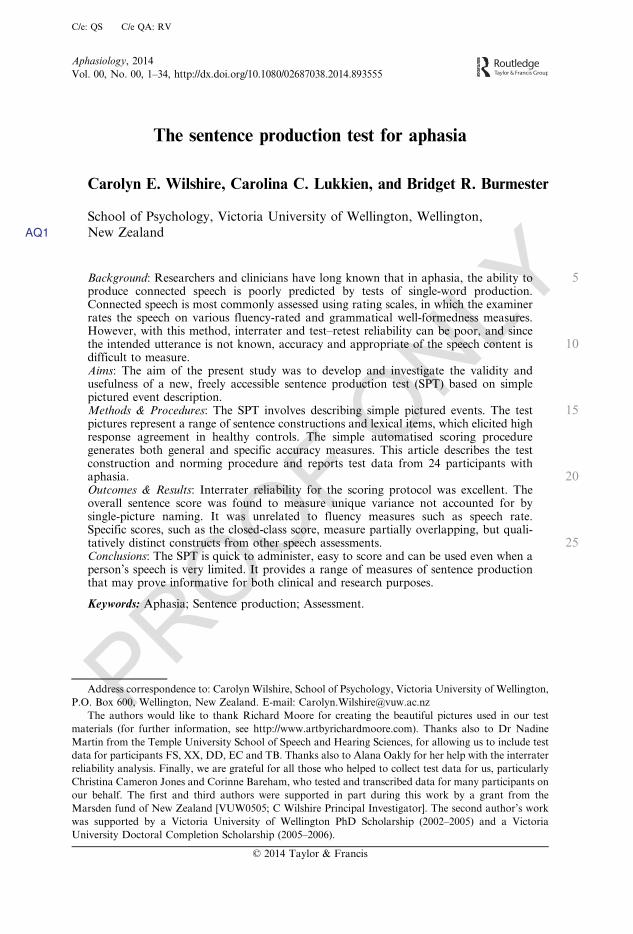
590simple item labelling, then they should correspond closely to scores on the singlenoun pretest, which features the same pictured items. In Figure 4, each participant’s
5
4
3
2
1
0
50–55
Nu
mb
er o
f p
artic
ipa
nts s
co
rin
g i
n r
an
ge
56–60 61–65 66–70 71–75
Fluent
Nonfluent
81–85 96–100
Sentence score
91–9586–9076–80
Figure 3. Distribution of participants’ sentence scores on the SPT. Data are shown separately for indivi-duals diagnosed with a fluent form of aphasia (based on their earliest post-acute diagnosis) and those witha nonfluent form of aphasia.
100
90
80
70
60
50
Fluent
Nonfluent40
30
30 40
R2 = 0.53624y = 0.8334x + 12.202
50 60
FS
NP
JHM
BY
MBJK
TB
TVSTR
IB
EC
ABU
NSCT
JGRB
SW
RP
XX
DD
70 80 90 100
SPT Single noun pretest (percent correct)
SP
T S
en
te
nce
sco
re
Figure 4. Scatterplot showing each participant’s single noun pretest score plotted against their sentencescore (excluding patients DA and DW). Also shown is the regression line predicting SPT sentence scoresfrom single noun pretest scores (the regression equation is given in the top left of the figure).
THE SENTENCE PRODUCTION TEST FOR APHASIA 19
sentence score is plotted against their score on the single noun pretest (DA and DWare not shown in the figure, because single noun pretest scores were not available forthese participants). There was a significant positive correlation between these two
595scores, r = 0.546, p < .05, and a simple linear regression analysis revealed that thesingle noun pretest score was a significant predictor of the SPT sentence score,R2 = 0.536, F(1,19) = 21.97, p < .01. Of course, even if these two scores measurepartially non-overlapping constructs, they are highly likely to be correlated, becausethe overall severity of the aphasic impairment is likely to influence scores on both
600tests, regardless of aphasia diagnosis. Also, since the same pictured items are featuredin both tests, the ability to retrieve their names in isolation is likely to increase aperson’s chances of successfully retrieving them in context. Importantly however,there was also considerable individual variability as to how effectively the single nounpretest score predicted SPT sentence scores: our regression analysis indicates that the
605single noun pretest score alone was able to account for only 50% of the variance inSPT scores. When we consider the similarities in the content of the two tests and thevery similar mode of administration (in most cases, the same examiner administeredboth tests within the same session), this figure appears to be quite low.
The precise relationship between each individual’s sentence and single noun610pretest scores does not appear to map on to the fluent/nonfluent distinction in any
systematic way. While the majority of nonfluent individuals performed more poorlyon the SPT than would be expected from their single noun pretest scores alone, someperformed at, or even slightly above, the expected level. For fluent individuals, thevariation was even wider, with some individuals performing considerably better on
615the SPT than what would be expected from their single noun pretest scores (e.g., IB,STR), while others performing considerably more poorly (e.g., SW). The columnlabelled sentence residual in Table 5 expresses each person’s SPT sentence score as aresidual after regressing sentence scores onto single noun pretest scores. Essentially, itexpresses the signed vertical distance of each data point from the regression line
620depicted in Figure 4, with positive values indicating better performance than expectedand negative values poorer performance than expected. It is automatically calculatedby the Excel scoresheet. This measure is a useful way of quantifying the extent towhich each person under- or over-performs on the SPT, given our expectation basedon their single noun pretest score.
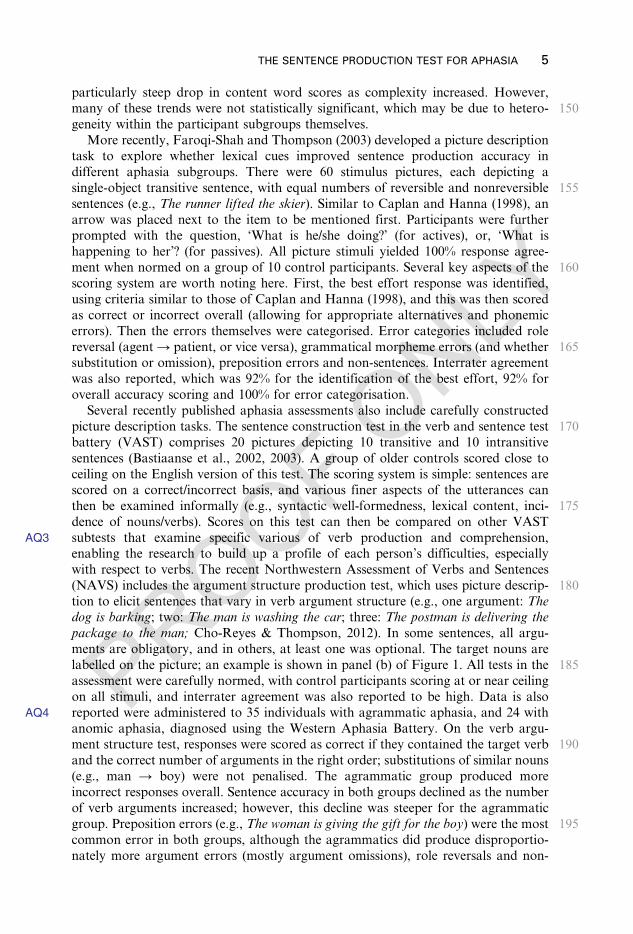
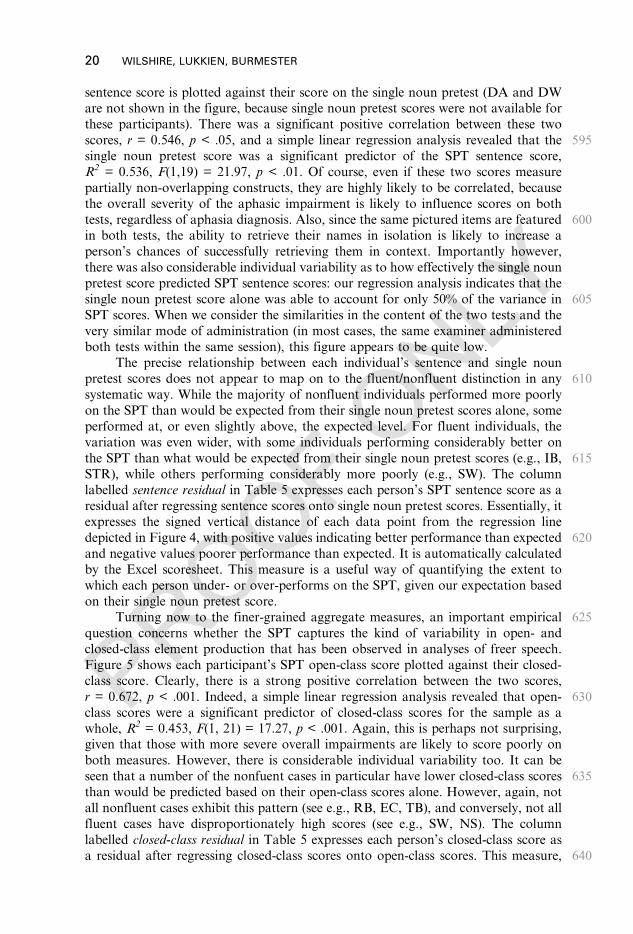
625Turning now to the finer-grained aggregate measures, an important empiricalquestion concerns whether the SPT captures the kind of variability in open- andclosed-class element production that has been observed in analyses of freer speech.Figure 5 shows each participant’s SPT open-class score plotted against their closed-class score. Clearly, there is a strong positive correlation between the two scores,
630r = 0.672, p < .001. Indeed, a simple linear regression analysis revealed that open-class scores were a significant predictor of closed-class scores for the sample as awhole, R2 = 0.453, F(1, 21) = 17.27, p < .001. Again, this is perhaps not surprising,given that those with more severe overall impairments are likely to score poorly onboth measures. However, there is considerable individual variability too. It can be
635seen that a number of the nonfuent cases in particular have lower closed-class scoresthan would be predicted based on their open-class scores alone. However, again, notall nonfluent cases exhibit this pattern (see e.g., RB, EC, TB), and conversely, not allfluent cases have disproportionately high scores (see e.g., SW, NS). The columnlabelled closed-class residual in Table 5 expresses each person’s closed-class score as
640a residual after regressing closed-class scores onto open-class scores. This measure,
20 WILSHIRE, LUKKIEN, BURMESTER
which describes how far each person’s closed-class score exceeds or falls short of theexpectation based on their open-class score, is also automatically calculated by theExcel scoresheet. It is a useful relative measure of closed-class production, perhapsmore akin to the types of ratio measures used in more open-ended speech assessments
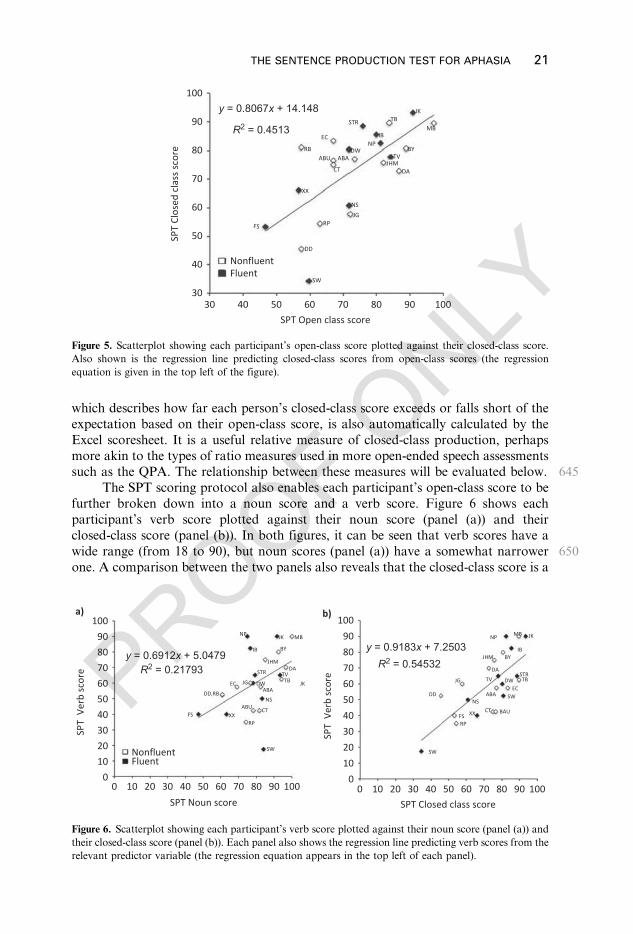
645such as the QPA. The relationship between these measures will be evaluated below.The SPT scoring protocol also enables each participant’s open-class score to be
further broken down into a noun score and a verb score. Figure 6 shows eachparticipant’s verb score plotted against their noun score (panel (a)) and theirclosed-class score (panel (b)). In both figures, it can be seen that verb scores have a
650wide range (from 18 to 90), but noun scores (panel (a)) have a somewhat narrowerone. A comparison between the two panels also reveals that the closed-class score is a
100
90
80
70
60
50
40
30
30 40 50 60 70 80 90 100
SPT Open class score
SP
T C
lose
d c
lass s
co
re
R2 = 0.4513
y = 0.8067x + 14.148
Fluent
Nonfluent
FS
SW
JG
DA
JHM
TV
BY
CT
ABU
RB
EC
ABA
DW
STR
NP
MB
JK
TB
IB
NS
DD
RP
XX
Figure 5. Scatterplot showing each participant’s open-class score plotted against their closed-class score.Also shown is the regression line predicting closed-class scores from open-class scores (the regressionequation is given in the top left of the figure).
SPT Closed class score
100b)
90
80
70
60
50
40
30
20
10
0
1009080706050403020100
SP
T V
erb
sco
re
R2 = 0.54532
y = 0.9183x + 7.2503NP
MB
DA
JG
DD
RP
FSXX
NS
BAUCT
SW
SW
EC
TV DW TB
STR
ABA
JHM BY
IB
JK
100
100
SPT Noun score
90
90
80
80
70
70
60
60
50
50
40
40
30
30
20
20
10
10
0
a)
0
SP
T V
erb
sco
re R2 = 0.21793
y = 0.6912x + 5.0479
Fluent
Nonfluent
FS
DD,RB
EC
CT
RP
SW
JK
JKNP
NS
ABA
JHM
IB BY
MB
DA
TV
TB
STR
JG DW
XX
ABU
Figure 6. Scatterplot showing each participant’s verb score plotted against their noun score (panel (a)) andtheir closed-class score (panel (b)). Each panel also shows the regression line predicting verb scores from therelevant predictor variable (the regression equation appears in the top left of each panel).
THE SENTENCE PRODUCTION TEST FOR APHASIA 21
much better predictor of the verb score than the noun score is. The correlationbetween verb and noun scores was moderate (r = 0.467, p < .05), and the proportionof variance accounted for by the noun score is a relatively low 22% (R2 = 0.218, F(1,
65521) = 5.85, p < .05). In contrast, the correlation between closed-class scores and verbscores is strong (r = 0.738, p < .05), and closed-class scores are a powerful predictorof verb scores, R2 = 0.544, F(1, 21) = 25.18, p < .0001. Indeed, an inspection of panel(b) suggests that knowing a person’s fluent/nonfluent diagnosis adds very little;closed-class scores are an equally strong predictor of verb scores for both groups.
660Breakdowns by sentence type
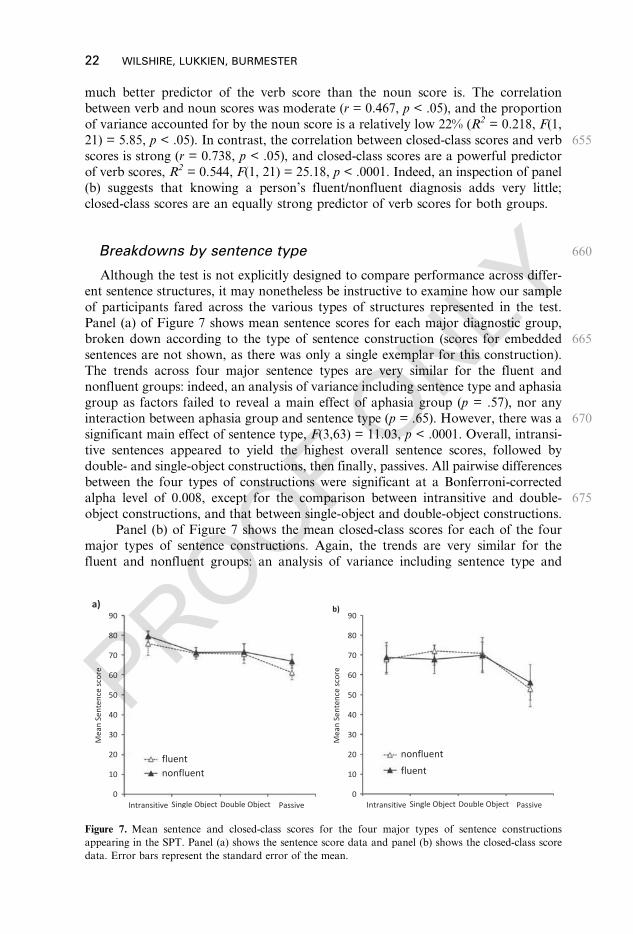
Although the test is not explicitly designed to compare performance across differ-ent sentence structures, it may nonetheless be instructive to examine how our sampleof participants fared across the various types of structures represented in the test.Panel (a) of Figure 7 shows mean sentence scores for each major diagnostic group,
665broken down according to the type of sentence construction (scores for embeddedsentences are not shown, as there was only a single exemplar for this construction).The trends across four major sentence types are very similar for the fluent andnonfluent groups: indeed, an analysis of variance including sentence type and aphasiagroup as factors failed to reveal a main effect of aphasia group (p = .57), nor any
670interaction between aphasia group and sentence type (p = .65). However, there was asignificant main effect of sentence type, F(3,63) = 11.03, p < .0001. Overall, intransi-tive sentences appeared to yield the highest overall sentence scores, followed bydouble- and single-object constructions, then finally, passives. All pairwise differencesbetween the four types of constructions were significant at a Bonferroni-corrected
675alpha level of 0.008, except for the comparison between intransitive and double-object constructions, and that between single-object and double-object constructions.
Panel (b) of Figure 7 shows the mean closed-class scores for each of the fourmajor types of sentence constructions. Again, the trends are very similar for thefluent and nonfluent groups: an analysis of variance including sentence type and
90
80
70
60
50
40
30
20
10
0
Intransitive PassiveDouble ObjectSingle Object Intransitive PassiveDouble ObjectSingle Object
a)
Me
an
Se
nte
nce
sco
re
90
80
70
60
50
40
30
20
10
0
b)
Me
an
Se
nte
nce
sco
re
fluent
nonfluent fluent
nonfluent
Figure 7. Mean sentence and closed-class scores for the four major types of sentence constructionsappearing in the SPT. Panel (a) shows the sentence score data and panel (b) shows the closed-class scoredata. Error bars represent the standard error of the mean.
22 WILSHIRE, LUKKIEN, BURMESTER
680aphasia group as factors failed to reveal a main effect of aphasia group (p = .79) norany interaction between aphasia group and sentence type (p = .18). However, therewas a significant main effect of sentence type, F(3,63) = 10.98, p < .0001. Passiveconstructions appeared to elicit considerably lower closed-class scores than othertypes of constructions. This trend is statistically reliable: all pairwise comparisons
685between passive constructions and the other sentence types were significant at aBonferroni-corrected alpha level of 0.008; no other comparisons were significant.
Relationship between SPT scores and key QPA measures
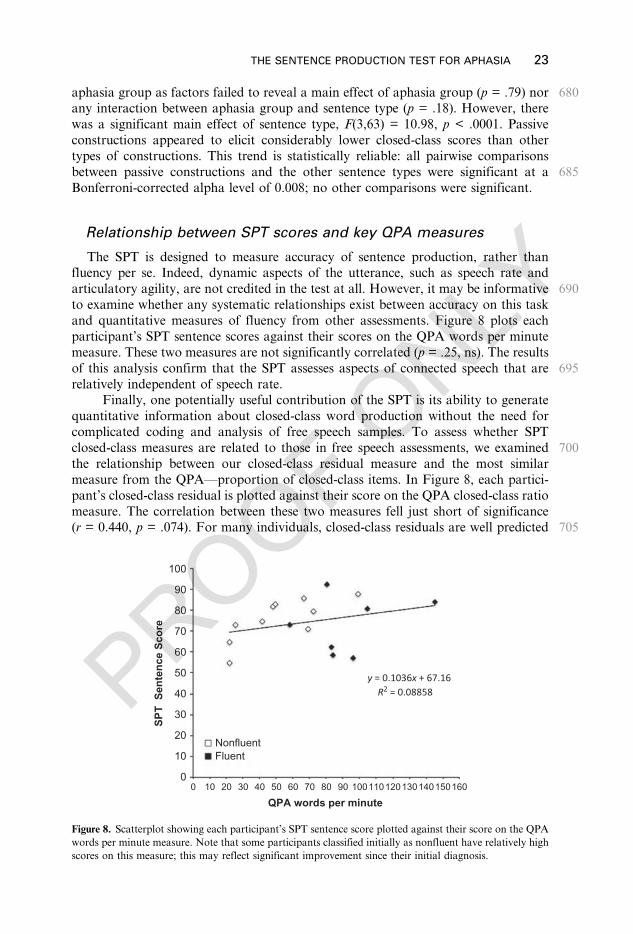
The SPT is designed to measure accuracy of sentence production, rather thanfluency per se. Indeed, dynamic aspects of the utterance, such as speech rate and
690articulatory agility, are not credited in the test at all. However, it may be informativeto examine whether any systematic relationships exist between accuracy on this taskand quantitative measures of fluency from other assessments. Figure 8 plots eachparticipant’s SPT sentence scores against their scores on the QPA words per minutemeasure. These two measures are not significantly correlated (p = .25, ns). The results
695of this analysis confirm that the SPT assesses aspects of connected speech that arerelatively independent of speech rate.
Finally, one potentially useful contribution of the SPT is its ability to generatequantitative information about closed-class word production without the need forcomplicated coding and analysis of free speech samples. To assess whether SPT
700closed-class measures are related to those in free speech assessments, we examinedthe relationship between our closed-class residual measure and the most similarmeasure from the QPA—proportion of closed-class items. In Figure 8, each partici-pant’s closed-class residual is plotted against their score on the QPA closed-class ratiomeasure. The correlation between these two measures fell just short of significance
705(r = 0.440, p = .074). For many individuals, closed-class residuals are well predicted
100
100110120130140150160
90
90
80
80
70
70
60
60
50
50
QPA words per minute
40
40
30
3020
20
10
100
0
SP
T S
ente
nce
Sco
re
FluentNonfluent
R2 = 0.08858
y = 0.1036x + 67.16
Figure 8. Scatterplot showing each participant’s SPT sentence score plotted against their score on the QPAwords per minute measure. Note that some participants classified initially as nonfluent have relatively highscores on this measure; this may reflect significant improvement since their initial diagnosis.
THE SENTENCE PRODUCTION TEST FOR APHASIA 23
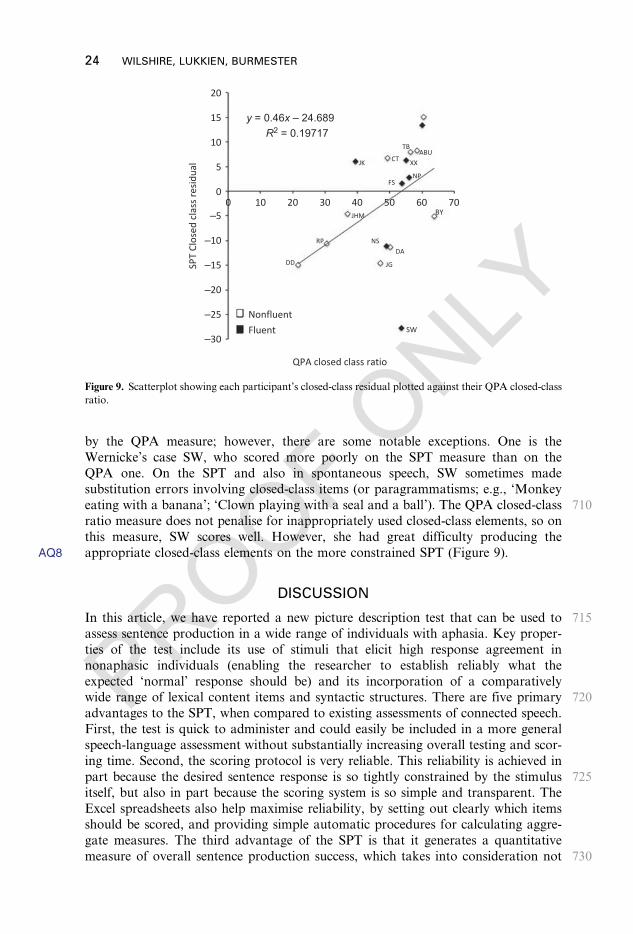
by the QPA measure; however, there are some notable exceptions. One is theWernicke’s case SW, who scored more poorly on the SPT measure than on theQPA one. On the SPT and also in spontaneous speech, SW sometimes madesubstitution errors involving closed-class items (or paragrammatisms; e.g., ‘Monkey
710eating with a banana’; ‘Clown playing with a seal and a ball’). The QPA closed-classratio measure does not penalise for inappropriately used closed-class elements, so onthis measure, SW scores well. However, she had great difficulty producing theappropriate closed-class elements on the more constrained SPT (AQ8 Figure 9).
DISCUSSION
715In this article, we have reported a new picture description test that can be used toassess sentence production in a wide range of individuals with aphasia. Key proper-ties of the test include its use of stimuli that elicit high response agreement innonaphasic individuals (enabling the researcher to establish reliably what theexpected ‘normal’ response should be) and its incorporation of a comparatively
720wide range of lexical content items and syntactic structures. There are five primaryadvantages to the SPT, when compared to existing assessments of connected speech.First, the test is quick to administer and could easily be included in a more generalspeech-language assessment without substantially increasing overall testing and scor-ing time. Second, the scoring protocol is very reliable. This reliability is achieved in
725part because the desired sentence response is so tightly constrained by the stimulusitself, but also in part because the scoring system is so simple and transparent. TheExcel spreadsheets also help maximise reliability, by setting out clearly which itemsshould be scored, and providing simple automatic procedures for calculating aggre-gate measures. The third advantage of the SPT is that it generates a quantitative
730measure of overall sentence production success, which takes into consideration not
20
15
10
5
0
0 10 20 30 40 50 60 70
BY
DA
NS
JG
SW
DD
RP
JHM
FS
JK XX
NP
ABU
TB
CT
–5
–10
–15
–20
–25
–30
SP
T C
lose
d c
lass r
esid
ua
l
QPA closed class ratio
R2 = 0.19717y = 0.46x – 24.689
Fluent
Nonfluent
Figure 9. Scatterplot showing each participant’s closed-class residual plotted against their QPA closed-classratio.
24 WILSHIRE, LUKKIEN, BURMESTER
just sentence form, but also lexical content. This measure may be used for comparingacross individuals, or within the same individual across different points in time—forexample, to measure improvement as a result of treatment and/or recovery. It canalso be compared directly with scores on other quantitative tests, such as single-
735picture naming and sentence repetition. Several other quantitative measures can alsobe easily obtained, which focus on specific types of constituents, and can be used toexplore more qualitative aspects of the speech produced. The fourth major advantageof the SPT is its wide applicability across a range of aphasia severity levels. Manyindividuals with severe aphasia have difficulty producing a sufficiently large sample
740of connected speech to be evaluated on some open-ended speech protocols. Incontrast, the SPT requires only that the individual is able to produce a least someof the target words on some items. And finally, the SPT is freely available, and as thisarticle attests, accompanied by reliable documentation of its properties—includinginterrater reliability, the distribution of the various measures across different indivi-
745duals with different aphasia diagnoses and their relationship to measures derivedfrom another widely used aphasia assessments, such as the QPA. It is hoped that itsfree availability will encourage other researchers to use the test and report theirfindings, thereby further contributing to the information that is available on it.
We have seen that the SPT provides several easily obtainable measures of specific750aspects of the individual’s connected speech. These include the sentence residual,
which gives a measure of the extent to which SPT performance exceeded or fell belowsingle-picture naming performance, and the closed-class residual, which gives ameasure of closed-class relative to open-class element production. Other usefulmeasures include the noun score and the verb score. The noun score can also be
755compared against the single noun pretest score to obtain information about how aperson’s noun retrieval in context compares with that of the same items in isolation.Some of these measures may be particularly useful for research purposes. Forexample, several recent studies suggest that some individuals with nonfluent aphasiamay exhibit powerful lexical context effects in single-word production—for example,
760in some cases, picture naming accuracy declines dramatically if the items to be namedare semantically grouped, and then repeatedly presented (e.g., Schnur, Schwartz,Brecher, & Hodgson, 2006). Importantly, individuals exhibiting this pattern oftenpresent with very nonfluent, fragmented connected speech, but relatively well-pre-served single-picture naming (see e.g., Ilshire & McCarthy, 2002; Scott & Wilshire,
7652010). The SPT may offer a means of quantifying this profile, thereby enablingresearchers to test whether it is indeed closely associated with these kinds of lexicalcontext effects.
Analysis of the relationship between SPT scores and key QPA measures high-lighted two important properties of the SPT. First, our test captures aspects of
770connected speech production that are largely independent of speed and/or fluency.This finding is perhaps not unexpected, given the SPT’s emphasis on accuracy, ratherthan on timing. We consider this to be a strength of the test, since speech well-formedness and speech rate/fluency are often confounded in more open-endedspeech. Indeed, our finding that sentence production accuracy is not closely related
775to fluency measures such as rate of speech is of considerable interest in its own right.It is consistent with some recent proposals suggesting that features such as agram-matism may reflect a compensatory strategy to speed up speech production, ratherthan an inability to generate a syntactically well-formed sentence plan. (see e.g., DeRoo, Kolk, & Hofstede, 2003; Kolk, 1995). Second, the SPT’s closed-class residual
THE SENTENCE PRODUCTION TEST FOR APHASIA 25
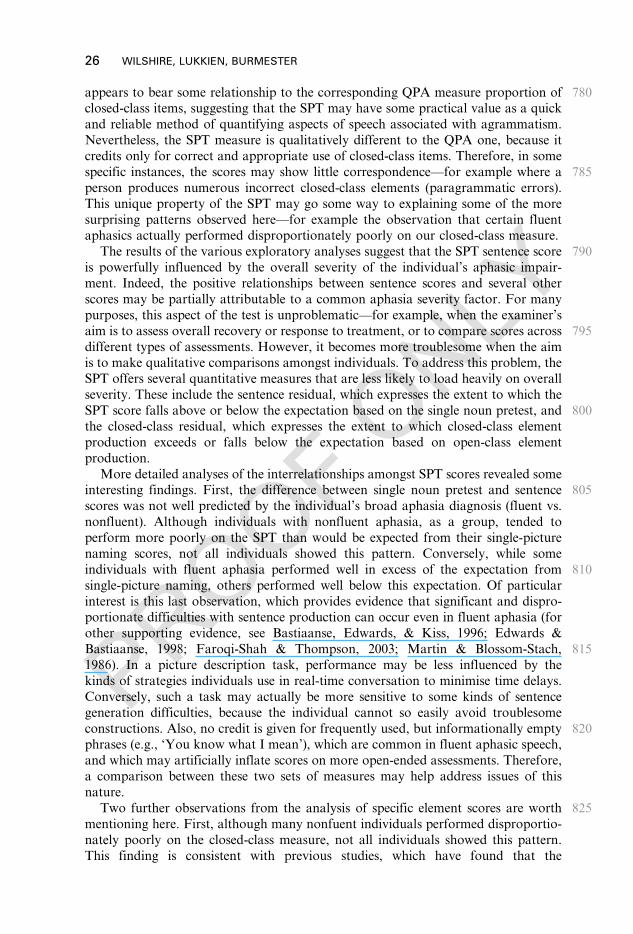
780appears to bear some relationship to the corresponding QPA measure proportion ofclosed-class items, suggesting that the SPT may have some practical value as a quickand reliable method of quantifying aspects of speech associated with agrammatism.Nevertheless, the SPT measure is qualitatively different to the QPA one, because itcredits only for correct and appropriate use of closed-class items. Therefore, in some
785specific instances, the scores may show little correspondence—for example where aperson produces numerous incorrect closed-class elements (paragrammatic errors).This unique property of the SPT may go some way to explaining some of the moresurprising patterns observed here—for example the observation that certain fluentaphasics actually performed disproportionately poorly on our closed-class measure.
790The results of the various exploratory analyses suggest that the SPT sentence scoreis powerfully influenced by the overall severity of the individual’s aphasic impair-ment. Indeed, the positive relationships between sentence scores and several otherscores may be partially attributable to a common aphasia severity factor. For manypurposes, this aspect of the test is unproblematic—for example, when the examiner’s
795aim is to assess overall recovery or response to treatment, or to compare scores acrossdifferent types of assessments. However, it becomes more troublesome when the aimis to make qualitative comparisons amongst individuals. To address this problem, theSPT offers several quantitative measures that are less likely to load heavily on overallseverity. These include the sentence residual, which expresses the extent to which the
800SPT score falls above or below the expectation based on the single noun pretest, andthe closed-class residual, which expresses the extent to which closed-class elementproduction exceeds or falls below the expectation based on open-class elementproduction.
More detailed analyses of the interrelationships amongst SPT scores revealed some805interesting findings. First, the difference between single noun pretest and sentence
scores was not well predicted by the individual’s broad aphasia diagnosis (fluent vs.nonfluent). Although individuals with nonfluent aphasia, as a group, tended toperform more poorly on the SPT than would be expected from their single-picturenaming scores, not all individuals showed this pattern. Conversely, while some
810individuals with fluent aphasia performed well in excess of the expectation fromsingle-picture naming, others performed well below this expectation. Of particularinterest is this last observation, which provides evidence that significant and dispro-portionate difficulties with sentence production can occur even in fluent aphasia (forother supporting evidence, see Bastiaanse, Edwards, & Kiss, 1996; Edwards &
815Bastiaanse, 1998; Faroqi-Shah & Thompson, 2003; Martin & Blossom-Stach,1986). In a picture description task, performance may be less influenced by thekinds of strategies individuals use in real-time conversation to minimise time delays.Conversely, such a task may actually be more sensitive to some kinds of sentencegeneration difficulties, because the individual cannot so easily avoid troublesome
820constructions. Also, no credit is given for frequently used, but informationally emptyphrases (e.g., ‘You know what I mean’), which are common in fluent aphasic speech,and which may artificially inflate scores on more open-ended assessments. Therefore,a comparison between these two sets of measures may help address issues of thisnature.
825Two further observations from the analysis of specific element scores are worthmentioning here. First, although many nonfuent individuals performed disproportio-nately poorly on the closed-class measure, not all individuals showed this pattern.This finding is consistent with previous studies, which have found that the
26 WILSHIRE, LUKKIEN, BURMESTER
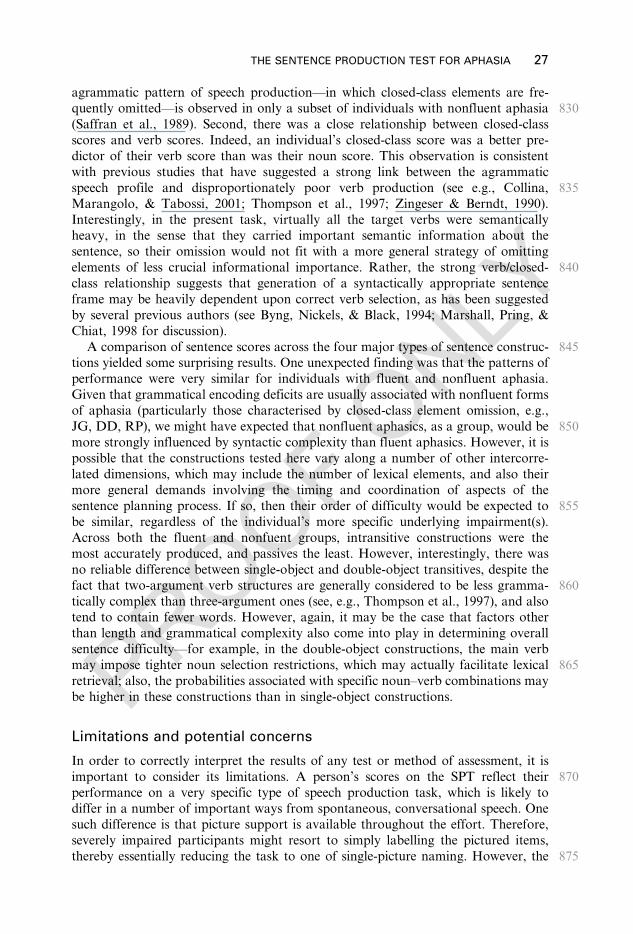
agrammatic pattern of speech production—in which closed-class elements are fre-830quently omitted—is observed in only a subset of individuals with nonfluent aphasia
(Saffran et al., 1989). Second, there was a close relationship between closed-classscores and verb scores. Indeed, an individual’s closed-class score was a better pre-dictor of their verb score than was their noun score. This observation is consistentwith previous studies that have suggested a strong link between the agrammatic
835speech profile and disproportionately poor verb production (see e.g., Collina,Marangolo, & Tabossi, 2001; Thompson et al., 1997; Zingeser & Berndt, 1990).Interestingly, in the present task, virtually all the target verbs were semanticallyheavy, in the sense that they carried important semantic information about thesentence, so their omission would not fit with a more general strategy of omitting
840elements of less crucial informational importance. Rather, the strong verb/closed-class relationship suggests that generation of a syntactically appropriate sentenceframe may be heavily dependent upon correct verb selection, as has been suggestedby several previous authors (see Byng, Nickels, & Black, 1994; Marshall, Pring, &Chiat, 1998 for discussion).
845A comparison of sentence scores across the four major types of sentence construc-tions yielded some surprising results. One unexpected finding was that the patterns ofperformance were very similar for individuals with fluent and nonfluent aphasia.Given that grammatical encoding deficits are usually associated with nonfluent formsof aphasia (particularly those characterised by closed-class element omission, e.g.,
850JG, DD, RP), we might have expected that nonfluent aphasics, as a group, would bemore strongly influenced by syntactic complexity than fluent aphasics. However, it ispossible that the constructions tested here vary along a number of other intercorre-lated dimensions, which may include the number of lexical elements, and also theirmore general demands involving the timing and coordination of aspects of the
855sentence planning process. If so, then their order of difficulty would be expected tobe similar, regardless of the individual’s more specific underlying impairment(s).Across both the fluent and nonfuent groups, intransitive constructions were themost accurately produced, and passives the least. However, interestingly, there wasno reliable difference between single-object and double-object transitives, despite the
860fact that two-argument verb structures are generally considered to be less gramma-tically complex than three-argument ones (see, e.g., Thompson et al., 1997), and alsotend to contain fewer words. However, again, it may be the case that factors otherthan length and grammatical complexity also come into play in determining overallsentence difficulty—for example, in the double-object constructions, the main verb
865may impose tighter noun selection restrictions, which may actually facilitate lexicalretrieval; also, the probabilities associated with specific noun–verb combinations maybe higher in these constructions than in single-object constructions.
Limitations and potential concerns
In order to correctly interpret the results of any test or method of assessment, it is870important to consider its limitations. A person’s scores on the SPT reflect their
performance on a very specific type of speech production task, which is likely todiffer in a number of important ways from spontaneous, conversational speech. Onesuch difference is that picture support is available throughout the effort. Therefore,severely impaired participants might resort to simply labelling the pictured items,
875thereby essentially reducing the task to one of single-picture naming. However, the
THE SENTENCE PRODUCTION TEST FOR APHASIA 27
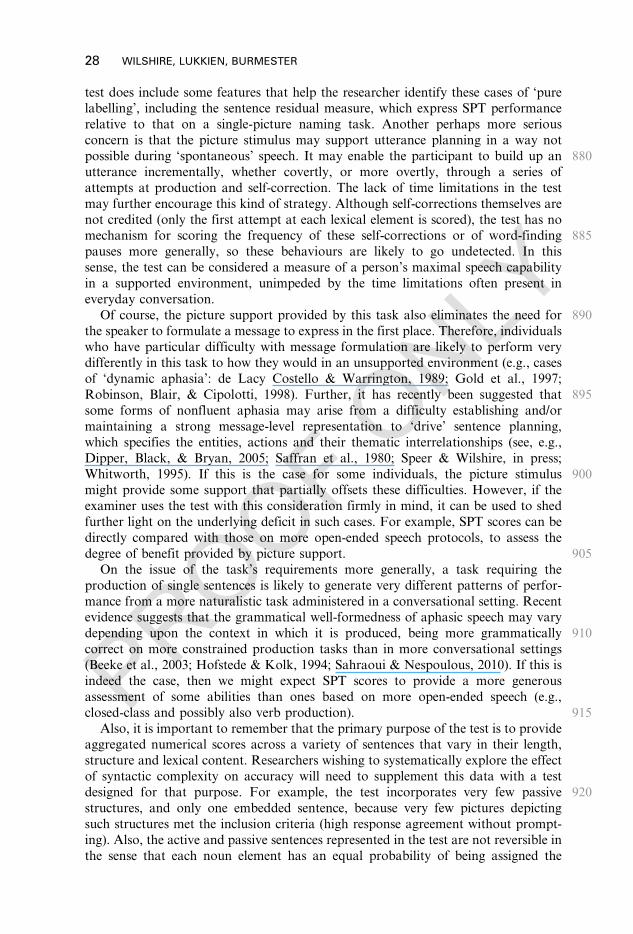
test does include some features that help the researcher identify these cases of ‘purelabelling’, including the sentence residual measure, which express SPT performancerelative to that on a single-picture naming task. Another perhaps more seriousconcern is that the picture stimulus may support utterance planning in a way not
880possible during ‘spontaneous’ speech. It may enable the participant to build up anutterance incrementally, whether covertly, or more overtly, through a series ofattempts at production and self-correction. The lack of time limitations in the testmay further encourage this kind of strategy. Although self-corrections themselves arenot credited (only the first attempt at each lexical element is scored), the test has no
885mechanism for scoring the frequency of these self-corrections or of word-findingpauses more generally, so these behaviours are likely to go undetected. In thissense, the test can be considered a measure of a person’s maximal speech capabilityin a supported environment, unimpeded by the time limitations often present ineveryday conversation.
890Of course, the picture support provided by this task also eliminates the need forthe speaker to formulate a message to express in the first place. Therefore, individualswho have particular difficulty with message formulation are likely to perform verydifferently in this task to how they would in an unsupported environment (e.g., casesof ‘dynamic aphasia’: de Lacy Costello & Warrington, 1989; Gold et al., 1997;
895Robinson, Blair, & Cipolotti, 1998). Further, it has recently been suggested thatsome forms of nonfluent aphasia may arise from a difficulty establishing and/ormaintaining a strong message-level representation to ‘drive’ sentence planning,which specifies the entities, actions and their thematic interrelationships (see, e.g.,Dipper, Black, & Bryan, 2005; Saffran et al., 1980; Speer & Wilshire, in press;
900Whitworth, 1995). If this is the case for some individuals, the picture stimulusmight provide some support that partially offsets these difficulties. However, if theexaminer uses the test with this consideration firmly in mind, it can be used to shedfurther light on the underlying deficit in such cases. For example, SPT scores can bedirectly compared with those on more open-ended speech protocols, to assess the
905degree of benefit provided by picture support.On the issue of the task’s requirements more generally, a task requiring the
production of single sentences is likely to generate very different patterns of perfor-mance from a more naturalistic task administered in a conversational setting. Recentevidence suggests that the grammatical well-formedness of aphasic speech may vary
910depending upon the context in which it is produced, being more grammaticallycorrect on more constrained production tasks than in more conversational settings(Beeke et al., 2003; Hofstede & Kolk, 1994; Sahraoui & Nespoulous, 2010). If this isindeed the case, then we might expect SPT scores to provide a more generousassessment of some abilities than ones based on more open-ended speech (e.g.,
915closed-class and possibly also verb production).Also, it is important to remember that the primary purpose of the test is to provide
aggregated numerical scores across a variety of sentences that vary in their length,structure and lexical content. Researchers wishing to systematically explore the effectof syntactic complexity on accuracy will need to supplement this data with a test
920designed for that purpose. For example, the test incorporates very few passivestructures, and only one embedded sentence, because very few pictures depictingsuch structures met the inclusion criteria (high response agreement without prompt-ing). Also, the active and passive sentences represented in the test are not reversible inthe sense that each noun element has an equal probability of being assigned the
28 WILSHIRE, LUKKIEN, BURMESTER
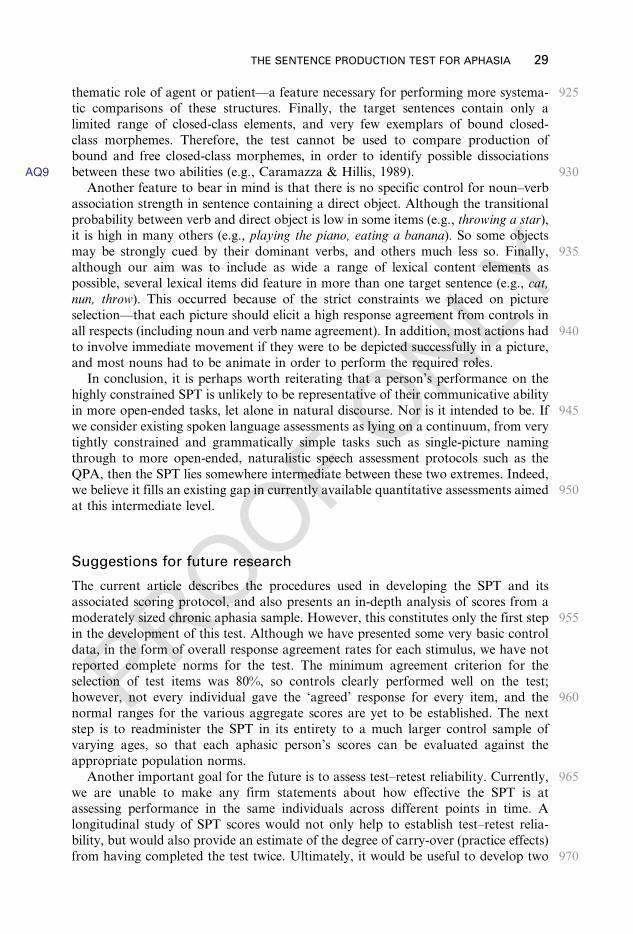
925thematic role of agent or patient—a feature necessary for performing more systema-tic comparisons of these structures. Finally, the target sentences contain only alimited range of closed-class elements, and very few exemplars of bound closed-class morphemes. Therefore, the test cannot be used to compare production ofbound and free closed-class morphemes, in order to identify possible dissociations
930between these two abilities (e.g., Caramazza & Hillis, 1989AQ9 ).Another feature to bear in mind is that there is no specific control for noun–verb
association strength in sentence containing a direct object. Although the transitionalprobability between verb and direct object is low in some items (e.g., throwing a star),it is high in many others (e.g., playing the piano, eating a banana). So some objects
935may be strongly cued by their dominant verbs, and others much less so. Finally,although our aim was to include as wide a range of lexical content elements aspossible, several lexical items did feature in more than one target sentence (e.g., cat,nun, throw). This occurred because of the strict constraints we placed on pictureselection—that each picture should elicit a high response agreement from controls in
940all respects (including noun and verb name agreement). In addition, most actions hadto involve immediate movement if they were to be depicted successfully in a picture,and most nouns had to be animate in order to perform the required roles.
In conclusion, it is perhaps worth reiterating that a person’s performance on thehighly constrained SPT is unlikely to be representative of their communicative ability
945in more open-ended tasks, let alone in natural discourse. Nor is it intended to be. Ifwe consider existing spoken language assessments as lying on a continuum, from verytightly constrained and grammatically simple tasks such as single-picture namingthrough to more open-ended, naturalistic speech assessment protocols such as theQPA, then the SPT lies somewhere intermediate between these two extremes. Indeed,
950we believe it fills an existing gap in currently available quantitative assessments aimedat this intermediate level.
Suggestions for future research
The current article describes the procedures used in developing the SPT and itsassociated scoring protocol, and also presents an in-depth analysis of scores from a
955moderately sized chronic aphasia sample. However, this constitutes only the first stepin the development of this test. Although we have presented some very basic controldata, in the form of overall response agreement rates for each stimulus, we have notreported complete norms for the test. The minimum agreement criterion for theselection of test items was 80%, so controls clearly performed well on the test;
960however, not every individual gave the ‘agreed’ response for every item, and thenormal ranges for the various aggregate scores are yet to be established. The nextstep is to readminister the SPT in its entirety to a much larger control sample ofvarying ages, so that each aphasic person’s scores can be evaluated against theappropriate population norms.
965Another important goal for the future is to assess test–retest reliability. Currently,we are unable to make any firm statements about how effective the SPT is atassessing performance in the same individuals across different points in time. Alongitudinal study of SPT scores would not only help to establish test–retest relia-bility, but would also provide an estimate of the degree of carry-over (practice effects)
970from having completed the test twice. Ultimately, it would be useful to develop two
THE SENTENCE PRODUCTION TEST FOR APHASIA 29
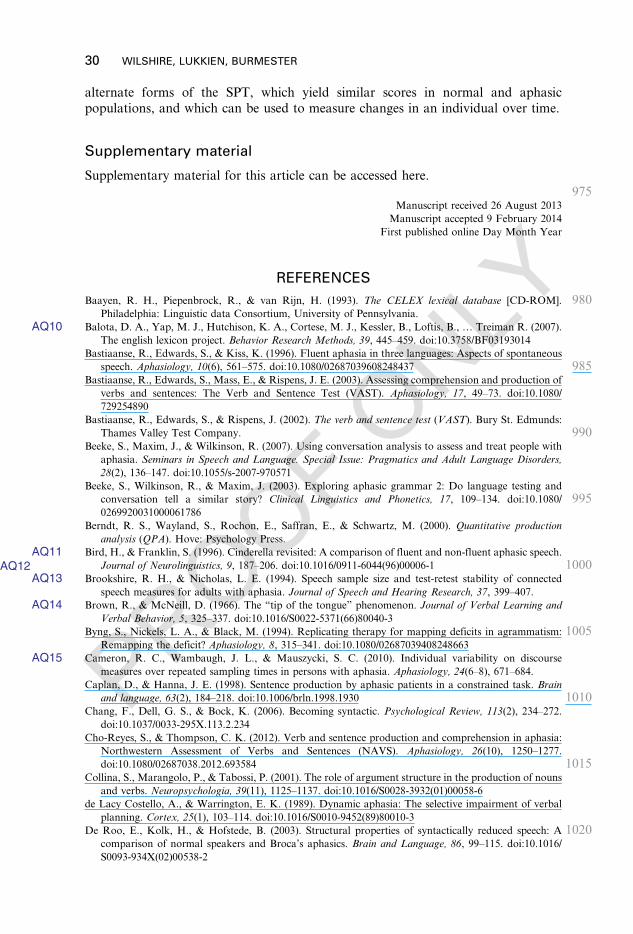
alternate forms of the SPT, which yield similar scores in normal and aphasicpopulations, and which can be used to measure changes in an individual over time.
Supplementary material
Supplementary material for this article can be accessed here.975
Manuscript received 26 August 2013Manuscript accepted 9 February 2014
First published online Day Month Year
REFERENCES
980Baayen, R. H., Piepenbrock, R., & van Rijn, H. (1993). The CELEX lexical database [CD-ROM].Philadelphia: Linguistic data Consortium, University of Pennsylvania.
Balota, D. A., Yap, M. J., Hutchison, K. A., Cortese, M. J., Kessler, B., Loftis, B., … Treiman R. (2007AQ10 ).The english lexicon project. Behavior Research Methods, 39, 445–459. doi:10.3758/BF03193014
Bastiaanse, R., Edwards, S., & Kiss, K. (1996). Fluent aphasia in three languages: Aspects of spontaneous985speech. Aphasiology, 10(6), 561–575. doi:10.1080/02687039608248437
Bastiaanse, R., Edwards, S., Mass, E., & Rispens, J. E. (2003). Assessing comprehension and production ofverbs and sentences: The Verb and Sentence Test (VAST). Aphasiology, 17, 49–73. doi:10.1080/729254890
Bastiaanse, R., Edwards, S., & Rispens, J. (2002). The verb and sentence test (VAST). Bury St. Edmunds:990Thames Valley Test Company.
Beeke, S., Maxim, J., & Wilkinson, R. (2007). Using conversation analysis to assess and treat people withaphasia. Seminars in Speech and Language. Special Issue: Pragmatics and Adult Language Disorders,28(2), 136–147. doi:10.1055/s-2007-970571
Beeke, S., Wilkinson, R., & Maxim, J. (2003). Exploring aphasic grammar 2: Do language testing and995conversation tell a similar story? Clinical Linguistics and Phonetics, 17, 109–134. doi:10.1080/
0269920031000061786Berndt, R. S., Wayland, S., Rochon, E., Saffran, E., & Schwartz, M. (2000). Quantitative production
analysis (QPA). Hove: Psychology Press.Bird, H., & Franklin, S. (1996AQ11
AQ12). Cinderella revisited: A comparison of fluent and non-fluent aphasic speech.
1000Journal of Neurolinguistics, 9, 187–206. doi:10.1016/0911-6044(96)00006-1Brookshire, R. H., & Nicholas, L. E. (1994AQ13 ). Speech sample size and test-retest stability of connected
speech measures for adults with aphasia. Journal of Speech and Hearing Research, 37, 399–407.Brown, R., & McNeill, D. (1966AQ14 ). The “tip of the tongue” phenomenon. Journal of Verbal Learning and
Verbal Behavior, 5, 325–337. doi:10.1016/S0022-5371(66)80040-31005Byng, S., Nickels, L. A., & Black, M. (1994). Replicating therapy for mapping deficits in agrammatism:
Remapping the deficit? Aphasiology, 8, 315–341. doi:10.1080/02687039408248663Cameron, R. C., Wambaugh, J. L., & Mauszycki, S. C. (2010AQ15 ). Individual variability on discourse
measures over repeated sampling times in persons with aphasia. Aphasiology, 24(6–8), 671–684.Caplan, D., & Hanna, J. E. (1998). Sentence production by aphasic patients in a constrained task. Brain
1010and language, 63(2), 184–218. doi:10.1006/brln.1998.1930Chang, F., Dell, G. S., & Bock, K. (2006). Becoming syntactic. Psychological Review, 113(2), 234–272.
doi:10.1037/0033-295X.113.2.234Cho-Reyes, S., & Thompson, C. K. (2012). Verb and sentence production and comprehension in aphasia:
Northwestern Assessment of Verbs and Sentences (NAVS). Aphasiology, 26(10), 1250–1277.1015doi:10.1080/02687038.2012.693584
Collina, S., Marangolo, P., & Tabossi, P. (2001). The role of argument structure in the production of nounsand verbs. Neuropsychologia, 39(11), 1125–1137. doi:10.1016/S0028-3932(01)00058-6
de Lacy Costello, A., & Warrington, E. K. (1989). Dynamic aphasia: The selective impairment of verbalplanning. Cortex, 25(1), 103–114. doi:10.1016/S0010-9452(89)80010-3
1020De Roo, E., Kolk, H., & Hofstede, B. (2003). Structural properties of syntactically reduced speech: Acomparison of normal speakers and Broca’s aphasics. Brain and Language, 86, 99–115. doi:10.1016/S0093-934X(02)00538-2
30 WILSHIRE, LUKKIEN, BURMESTER
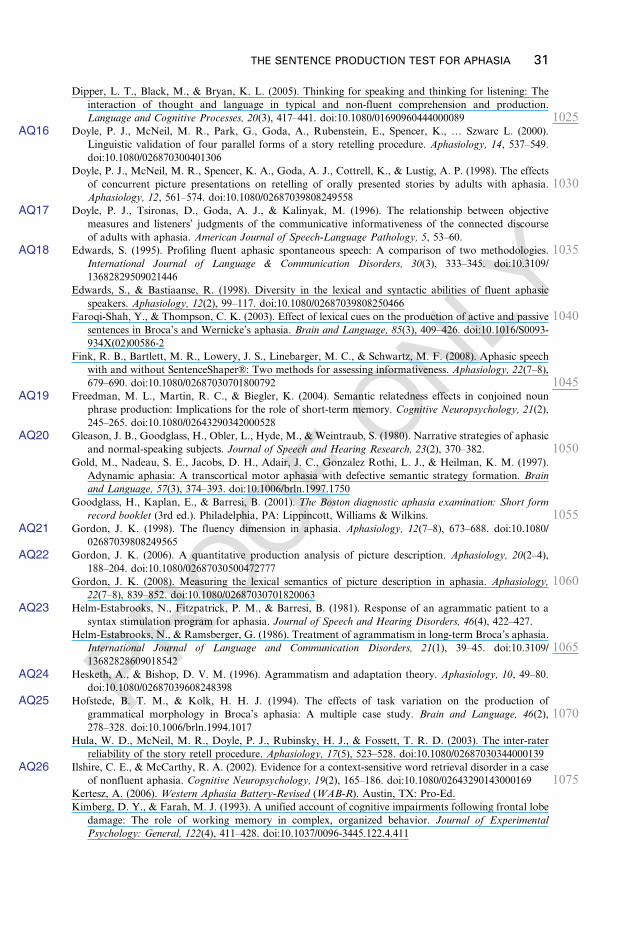
Dipper, L. T., Black, M., & Bryan, K. L. (2005). Thinking for speaking and thinking for listening: Theinteraction of thought and language in typical and non-fluent comprehension and production.
1025Language and Cognitive Processes, 20(3), 417–441. doi:10.1080/01690960444000089Doyle, P. J., McNeil, M. R., Park, G., Goda, A., Rubenstein, E., Spencer, K., … Szwarc L. (2000AQ16 ).
Linguistic validation of four parallel forms of a story retelling procedure. Aphasiology, 14, 537–549.doi:10.1080/026870300401306
Doyle, P. J., McNeil, M. R., Spencer, K. A., Goda, A. J., Cottrell, K., & Lustig, A. P. (1998). The effects1030of concurrent picture presentations on retelling of orally presented stories by adults with aphasia.
Aphasiology, 12, 561–574. doi:10.1080/02687039808249558Doyle, P. J., Tsironas, D., Goda, A. J., & Kalinyak, M. (1996AQ17 ). The relationship between objective
measures and listeners’ judgments of the communicative informativeness of the connected discourseof adults with aphasia. American Journal of Speech-Language Pathology, 5, 53–60.
1035Edwards, S. (1995AQ18 ). Profiling fluent aphasic spontaneous speech: A comparison of two methodologies.International Journal of Language & Communication Disorders, 30(3), 333–345. doi:10.3109/13682829509021446
Edwards, S., & Bastiaanse, R. (1998). Diversity in the lexical and syntactic abilities of fluent aphasicspeakers. Aphasiology, 12(2), 99–117. doi:10.1080/02687039808250466
1040Faroqi-Shah, Y., & Thompson, C. K. (2003). Effect of lexical cues on the production of active and passivesentences in Broca’s and Wernicke’s aphasia. Brain and Language, 85(3), 409–426. doi:10.1016/S0093-934X(02)00586-2
Fink, R. B., Bartlett, M. R., Lowery, J. S., Linebarger, M. C., & Schwartz, M. F. (2008). Aphasic speechwith and without SentenceShaper®: Two methods for assessing informativeness. Aphasiology, 22(7–8),
1045679–690. doi:10.1080/02687030701800792Freedman, M. L., Martin, R. C., & Biegler, K. (2004AQ19 ). Semantic relatedness effects in conjoined noun
phrase production: Implications for the role of short-term memory. Cognitive Neuropsychology, 21(2),245–265. doi:10.1080/02643290342000528
Gleason, J. B., Goodglass, H., Obler, L., Hyde, M., & Weintraub, S. (1980AQ20 ). Narrative strategies of aphasic1050and normal-speaking subjects. Journal of Speech and Hearing Research, 23(2), 370–382.
Gold, M., Nadeau, S. E., Jacobs, D. H., Adair, J. C., Gonzalez Rothi, L. J., & Heilman, K. M. (1997).Adynamic aphasia: A transcortical motor aphasia with defective semantic strategy formation. Brainand Language, 57(3), 374–393. doi:10.1006/brln.1997.1750
Goodglass, H., Kaplan, E., & Barresi, B. (2001). The Boston diagnostic aphasia examination: Short form1055record booklet (3rd ed.). Philadelphia, PA: Lippincott, Williams & Wilkins.
Gordon, J. K. (1998AQ21 ). The fluency dimension in aphasia. Aphasiology, 12(7–8), 673–688. doi:10.1080/02687039808249565
Gordon, J. K. (2006AQ22 ). A quantitative production analysis of picture description. Aphasiology, 20(2–4),188–204. doi:10.1080/02687030500472777
1060Gordon, J. K. (2008). Measuring the lexical semantics of picture description in aphasia. Aphasiology,22(7–8), 839–852. doi:10.1080/02687030701820063
Helm-Estabrooks, N., Fitzpatrick, P. M., & Barresi, B. (1981AQ23 ). Response of an agrammatic patient to asyntax stimulation program for aphasia. Journal of Speech and Hearing Disorders, 46(4), 422–427.
Helm-Estabrooks, N., & Ramsberger, G. (1986). Treatment of agrammatism in long-term Broca’s aphasia.1065International Journal of Language and Communication Disorders, 21(1), 39–45. doi:10.3109/
13682828609018542Hesketh, A., & Bishop, D. V. M. (1996AQ24 ). Agrammatism and adaptation theory. Aphasiology, 10, 49–80.
doi:10.1080/02687039608248398Hofstede, B. T. M., & Kolk, H. H. J. (1994AQ25 ). The effects of task variation on the production of
1070grammatical morphology in Broca’s aphasia: A multiple case study. Brain and Language, 46(2),278–328. doi:10.1006/brln.1994.1017
Hula, W. D., McNeil, M. R., Doyle, P. J., Rubinsky, H. J., & Fossett, T. R. D. (2003). The inter-raterreliability of the story retell procedure. Aphasiology, 17(5), 523–528. doi:10.1080/02687030344000139
Ilshire, C. E., & McCarthy, R. A. (2002AQ26 ). Evidence for a context-sensitive word retrieval disorder in a case1075of nonfluent aphasia. Cognitive Neuropsychology, 19(2), 165–186. doi:10.1080/02643290143000169
Kertesz, A. (2006). Western Aphasia Battery-Revised (WAB-R). Austin, TX: Pro-Ed.Kimberg, D. Y., & Farah, M. J. (1993). A unified account of cognitive impairments following frontal lobe
damage: The role of working memory in complex, organized behavior. Journal of ExperimentalPsychology: General, 122(4), 411–428. doi:10.1037/0096-3445.122.4.411
THE SENTENCE PRODUCTION TEST FOR APHASIA 31
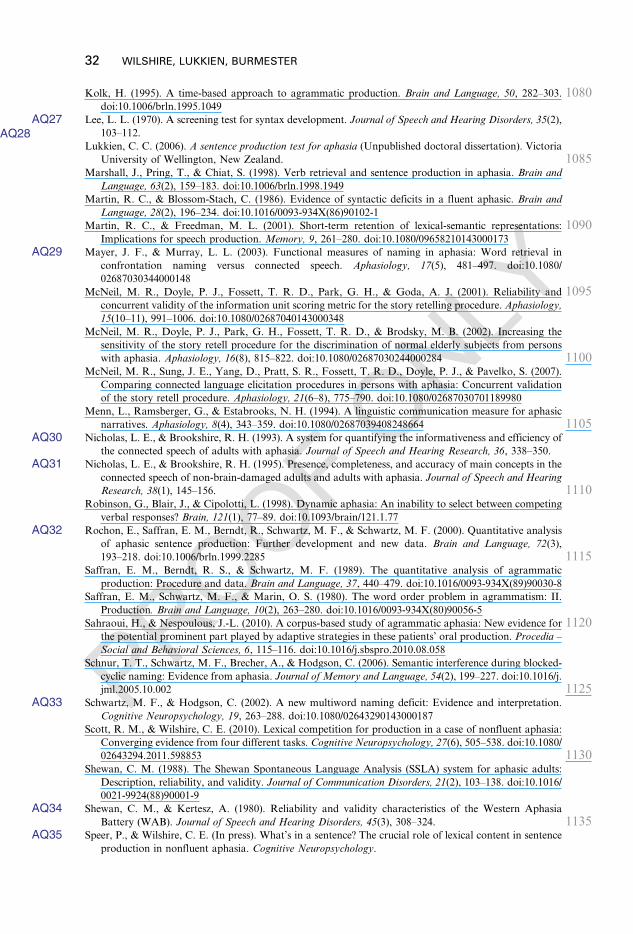
1080Kolk, H. (1995). A time-based approach to agrammatic production. Brain and Language, 50, 282–303.doi:10.1006/brln.1995.1049
Lee, L. L. (1970AQ27AQ28
). A screening test for syntax development. Journal of Speech and Hearing Disorders, 35(2),103–112.
Lukkien, C. C. (2006). A sentence production test for aphasia (Unpublished doctoral dissertation). Victoria1085University of Wellington, New Zealand.
Marshall, J., Pring, T., & Chiat, S. (1998). Verb retrieval and sentence production in aphasia. Brain andLanguage, 63(2), 159–183. doi:10.1006/brln.1998.1949
Martin, R. C., & Blossom-Stach, C. (1986). Evidence of syntactic deficits in a fluent aphasic. Brain andLanguage, 28(2), 196–234. doi:10.1016/0093-934X(86)90102-1
1090Martin, R. C., & Freedman, M. L. (2001). Short-term retention of lexical-semantic representations:Implications for speech production. Memory, 9, 261–280. doi:10.1080/09658210143000173
Mayer, J. F., & Murray, L. L. (2003AQ29 ). Functional measures of naming in aphasia: Word retrieval inconfrontation naming versus connected speech. Aphasiology, 17(5), 481–497. doi:10.1080/02687030344000148
1095McNeil, M. R., Doyle, P. J., Fossett, T. R. D., Park, G. H., & Goda, A. J. (2001). Reliability andconcurrent validity of the information unit scoring metric for the story retelling procedure. Aphasiology,15(10–11), 991–1006. doi:10.1080/02687040143000348
McNeil, M. R., Doyle, P. J., Park, G. H., Fossett, T. R. D., & Brodsky, M. B. (2002). Increasing thesensitivity of the story retell procedure for the discrimination of normal elderly subjects from persons
1100with aphasia. Aphasiology, 16(8), 815–822. doi:10.1080/02687030244000284McNeil, M. R., Sung, J. E., Yang, D., Pratt, S. R., Fossett, T. R. D., Doyle, P. J., & Pavelko, S. (2007).
Comparing connected language elicitation procedures in persons with aphasia: Concurrent validationof the story retell procedure. Aphasiology, 21(6–8), 775–790. doi:10.1080/02687030701189980
Menn, L., Ramsberger, G., & Estabrooks, N. H. (1994). A linguistic communication measure for aphasic1105narratives. Aphasiology, 8(4), 343–359. doi:10.1080/02687039408248664
Nicholas, L. E., & Brookshire, R. H. (1993AQ30 ). A system for quantifying the informativeness and efficiency ofthe connected speech of adults with aphasia. Journal of Speech and Hearing Research, 36, 338–350.
Nicholas, L. E., & Brookshire, R. H. (1995AQ31 ). Presence, completeness, and accuracy of main concepts in theconnected speech of non-brain-damaged adults and adults with aphasia. Journal of Speech and Hearing
1110Research, 38(1), 145–156.Robinson, G., Blair, J., & Cipolotti, L. (1998). Dynamic aphasia: An inability to select between competing
verbal responses? Brain, 121(1), 77–89. doi:10.1093/brain/121.1.77Rochon, E., Saffran, E. M., Berndt, R., Schwartz, M. F., & Schwartz, M. F. (2000AQ32 ). Quantitative analysis
of aphasic sentence production: Further development and new data. Brain and Language, 72(3),1115193–218. doi:10.1006/brln.1999.2285
Saffran, E. M., Berndt, R. S., & Schwartz, M. F. (1989). The quantitative analysis of agrammaticproduction: Procedure and data. Brain and Language, 37, 440–479. doi:10.1016/0093-934X(89)90030-8
Saffran, E. M., Schwartz, M. F., & Marin, O. S. (1980). The word order problem in agrammatism: II.Production. Brain and Language, 10(2), 263–280. doi:10.1016/0093-934X(80)90056-5
1120Sahraoui, H., & Nespoulous, J.-L. (2010). A corpus-based study of agrammatic aphasia: New evidence forthe potential prominent part played by adaptive strategies in these patients’ oral production. Procedia –
Social and Behavioral Sciences, 6, 115–116. doi:10.1016/j.sbspro.2010.08.058Schnur, T. T., Schwartz, M. F., Brecher, A., & Hodgson, C. (2006). Semantic interference during blocked-
cyclic naming: Evidence from aphasia. Journal of Memory and Language, 54(2), 199–227. doi:10.1016/j.1125jml.2005.10.002
Schwartz, M. F., & Hodgson, C. (2002AQ33 ). A new multiword naming deficit: Evidence and interpretation.Cognitive Neuropsychology, 19, 263–288. doi:10.1080/02643290143000187
Scott, R. M., & Wilshire, C. E. (2010). Lexical competition for production in a case of nonfluent aphasia:Converging evidence from four different tasks. Cognitive Neuropsychology, 27(6), 505–538. doi:10.1080/
113002643294.2011.598853Shewan, C. M. (1988). The Shewan Spontaneous Language Analysis (SSLA) system for aphasic adults:
Description, reliability, and validity. Journal of Communication Disorders, 21(2), 103–138. doi:10.1016/0021-9924(88)90001-9
Shewan, C. M., & Kertesz, A. (1980AQ34 ). Reliability and validity characteristics of the Western Aphasia1135Battery (WAB). Journal of Speech and Hearing Disorders, 45(3), 308–324.
Speer, P., & Wilshire, C. E. (In pressAQ35 ). What’s in a sentence? The crucial role of lexical content in sentenceproduction in nonfluent aphasia. Cognitive Neuropsychology.
32 WILSHIRE, LUKKIEN, BURMESTER
Thompson, C. K., Lange, K. L., Schneider, S. L., & Shapiro, L. P. (1997AQ36 ). Agrammatic and non-brain-damaged subjects’ verb and verb argument structure production. Aphasiology, 11(4–5), 473–490.
1140Thompson, C. K., Shapiro, L. P., Tait, M. E., Jacobs, B. J., Schneider, S. L., & Ballard, K. (1995AQ37 ). Asystem for systematic analysis of agrammatic language production. Brain and Language, 51, 124–129.
Vermeulen, J., Bastiaanse, R., & Van Wageningen, B. (1989). Spontaneous speech in aphasia: A correla-tional study. Brain and Language, 36, 252–274. doi:10.1016/0093-934X(89)90064-3
Wagenaar, E., Snow, C., & Prins, R. S. (1975). Spontaneous speech of aphasic patients: A psycholinguistic1145analysis. Brain and Language, 2, 281–303. doi:10.1016/S0093-934X(75)80071-X
Whitworth, A. (1995). Characterising thematic role assignment in aphasic sentence production: Proceduresfor elicited and spontaneous output. International Journal of Language & Communication Disorders,30(3), 384–399. doi:10.3109/13682829509021450
Williams, S. E., & Canter, G. J. (1982). The influence of situational context on naming performance in1150aphasic syndromes. Brain and Language, 17(1), 92–106. doi:10.1016/0093-934X(82)90007-4
Wilshire, C., Lukkien, C., & Cameron Jones, C. (2010AQ38 ). The sentence production test: Description andpreliminary findings. Procedia – Social and Behavioral Sciences, 6, 195–196. doi:10.1016/j.sbspro.2010.08.097
Yorkston, K. M., & Beukelman, D. R. (1980AQ39 ). An analysis of connected speech samples of aphasic and1155normal speakers. Journal of Speech and Hearing Disorders, 45, 27–36.
Zingeser, L. B., & Berndt, R. S. (1990). Retrieval of nouns and verbs in agrammatism and anomia. Brainand Language, 39(1), 14–32. doi:10.1016/0093-934X(90)90002-X
APPENDIX A
Target sentences used in the initial norming study
The cats are sleeping The sailor is giving a flower to the nurseThe babies are crawling The nurse is giving a sandwich to the boyThe dragon is flying The fairy is giving a crown to the girlThe penguin is fishing The sheep is throwing a carrot to the rabbitThe girl is running The fat fairy is cryingThe dog is swimming The old man is readingThe sheep are skiing The postman posts the letter in the letter boxThe volcano is erupting The round castle is on fireThe mermaid is knitting The big cat is washing itselfThe clowns are praying The dog is in front of the churchThe nuns are praying The dog is on top of the houseThe cats are playing the piano The dog is beside the houseThe monkeys are building a sandcastle The dog is in front of the houseThe nurse is feeding the baby The mouse is beside the pumpkinThe mermaid is riding a horse The mouse is on top of the pumpkinThe penguin is reading the newspaper The mouse is in front of the pumpkinThe dog is pushing the pram The mouse is underneath the pumpkinThe monkey is eating a banana The boy is being stung by a beeThe caterpillar is eating a leaf The clown is being bitten by a snakeThe penguin is playing the violin The boat is being destroyed by a waveThe clown is milking a cow The house is being struck by lightningThe clown is feeding the baby The cat is watching the children playThe clown is throwing the ball to the seal The nun is watching the boys juggleThe angels is throwing a star to the nun The policeman is telling the boys to be quiet
THE SENTENCE PRODUCTION TEST FOR APHASIA 33
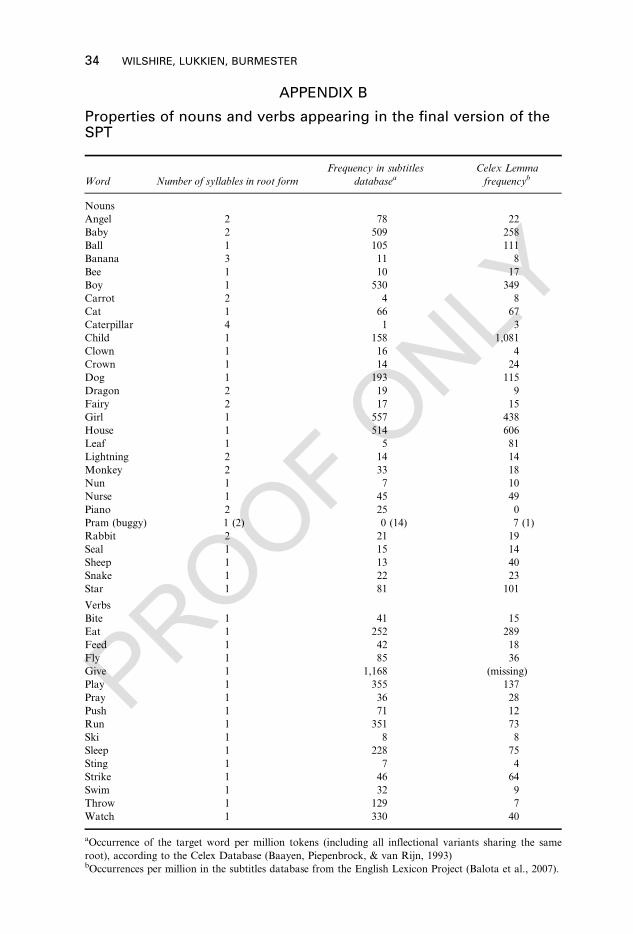
APPENDIX B
Properties of nouns and verbs appearing in the final version of theSPT
Word Number of syllables in root formFrequency in subtitles
databaseaCelex Lemmafrequencyb
NounsAngel 2 78 22Baby 2 509 258Ball 1 105 111Banana 3 11 8Bee 1 10 17Boy 1 530 349Carrot 2 4 8Cat 1 66 67Caterpillar 4 1 3Child 1 158 1,081Clown 1 16 4Crown 1 14 24Dog 1 193 115Dragon 2 19 9Fairy 2 17 15Girl 1 557 438House 1 514 606Leaf 1 5 81Lightning 2 14 14Monkey 2 33 18Nun 1 7 10Nurse 1 45 49Piano 2 25 0Pram (buggy) 1 (2) 0 (14) 7 (1)Rabbit 2 21 19Seal 1 15 14Sheep 1 13 40Snake 1 22 23Star 1 81 101
VerbsBite 1 41 15Eat 1 252 289Feed 1 42 18Fly 1 85 36Give 1 1,168 (missing)Play 1 355 137Pray 1 36 28Push 1 71 12Run 1 351 73Ski 1 8 8Sleep 1 228 75Sting 1 7 4Strike 1 46 64Swim 1 32 9Throw 1 129 7Watch 1 330 40
aOccurrence of the target word per million tokens (including all inflectional variants sharing the sameroot), according to the Celex Database (Baayen, Piepenbrock, & van Rijn, 1993)bOccurrences per million in the subtitles database from the English Lexicon Project (Balota et al., 2007).
34 WILSHIRE, LUKKIEN, BURMESTER
Related Documents