J. Exp. Mar. Biol. Ecol., 164 (1992) 221-232 © 1992 Elsevier Science Publishers BV. All rights reserved 0022-0981/92/$05.00 221 JEMBE 01869 The sensitivity of several ordination methods to sample replication in benthic surveys Sofia Gamito a and David Raffaelli b ~' Unidade de Ciencias e Teorologias dos Recursos Aquaticos, Universidade do Aigarve, Faro, Portugal; b Culterty FieM Station, Newburgh, Ellon, Aberdeenshire, UK (Received 25 February 1991; revision received 6 August 1992; accepted 6 August 1992) Abstract: Benthic data sets derived from different numbers of grab samples from the Ria Formosa, Portu- gal, are analysed using a range of ordination methods currently used by benthic ecologists. Those are: principal components analysis (PCA), correspondence analysis (CA), detrended correspondence analysis (DCA), multidimensional scaling (MDS) and semihybrid multidimensional scaling (HMDS). Most tech- niques allowed the identification of the main underlying gradients, but the visual appearance of the plots differed between methods. For all methods, Axis 1 scores of samples were relatively insensitive tc~ sample replication but some applications of DCA, MDS and HMDS appeared sensitive with respect to Axis 2 scores. CA performed best overall. The significance of those apparent sensitivities to the interpretation of benthic data set,~; is discussed. Key words: tlel,.thic survey; Detrended correspondence analy::is; Environmental stress; Multidimensional scaling; Principal components analysis; Sample size INTRODUCTION The faunal data set from a benthic, survey usually takes the form of numbers of in- dividuals of different species at many locations. The species list can be extensive with most having low or zero abundance at a large proportion of sampling stations. Find- ing ecologically meaningful patterns and trends in such a complex data set requires its reduction to a summarised and simplified form which can be more readily interpreted by the ecologist. The most appropriate procedure for doing this is some kind of multivariate analysis, where the major trends in all the species can be approximately represented in two dimensions. Many techniques are now available and different techniques are used by different workers. A technique may be selected because it has a sotmd theoretical base, but perhaps more often because a particular package is easier !.o use and more available than others., Faced with the dec;sion of whether to invest 0oth time and money in a ditti~rent technique, those benthic ecologists wiao ar,.: routinely involved with monitoring Correspondence address: S. Gamito, Un~dade de Ciencias c Tecnologias dos Recursos Aquaticos, Uni- versidade do Algarve, 8000 Faro, Portugal.

Welcome message from author
This document is posted to help you gain knowledge. Please leave a comment to let me know what you think about it! Share it to your friends and learn new things together.
Transcript

J. Exp. Mar. Biol. Ecol., 164 (1992) 221-232 © 1992 Elsevier Science Publishers BV. All rights reserved 0022-0981/92/$05.00
221
JEMBE 01869
The sensitivity of several ordination methods to sample replication in benthic surveys
Sofia G a m i t o a and David Raffaelli b
~' Unidade de Ciencias e Teorologias dos Recursos Aquaticos, Universidade do Aigarve, Faro, Portugal; b Culterty FieM Station, Newburgh, Ellon, Aberdeenshire, UK
(Received 25 February 1991; revision received 6 August 1992; accepted 6 August 1992)
Abstract: Benthic data sets derived from different numbers of grab samples from the Ria Formosa, Portu- gal, are analysed using a range of ordination methods currently used by benthic ecologists. Those are: principal components analysis (PCA), correspondence analysis (CA), detrended correspondence analysis (DCA), multidimensional scaling (MDS) and semihybrid multidimensional scaling (HMDS). Most tech- niques allowed the identification of the main underlying gradients, but the visual appearance of the plots differed between methods. For all methods, Axis 1 scores of samples were relatively insensitive tc~ sample replication but some applications of DCA, MDS and HMDS appeared sensitive with respect to Axis 2 scores. CA performed best overall. The significance of those apparent sensitivities to the interpretation of benthic data set,~; is discussed.
Key words: tlel,.thic survey; Detrended correspondence analy::is; Environmental stress; Multidimensional scaling; Principal components analysis; Sample size
INTRODUCTION
The faunal data set from a benthic, survey usually takes the form of numbers of in- dividuals of different species at many locations. The species list can be extensive with most having low or zero abundance at a large proportion of sampling stations. Find- ing ecologically meaningful patterns and trends in such a complex data set requires its reduction to a summarised and simplified form which can be more readily interpreted by the ecologist. The most appropriate procedure for doing this is some kind of multivariate analysis, where the major trends in all the species can be approximately
represented in two dimensions. Many techniques are now available and different techniques are used by different
workers. A technique may be selected because it has a sotmd theoretical base, but perhaps more often because a particular package is easier !.o use and more available than others., Faced with the dec;sion of whether to invest 0oth time and money in a ditti~rent technique, those benthic ecologists wiao ar,.: routinely involved with monitoring
Correspondence address: S. Gamito, Un~dade de Ciencias c Tecnologias dos Recursos Aquaticos, Uni- versidade do Algarve, 8000 Faro, Portugal.

222 S. GAMITO AND D. RAFFAELLi
and environmental impact assessment require guidance and advice. Neither of these are in short supply, but each technique has its own champions. Field et al. (1987) provide useful guidance, but their review is probably too broad in its coverage for most benthic ecologists and the merits and deficiences of the various techniques are not discussed in any detail. Several comparative studies have applied different techniques to the same data set (e.g., Kenkel ~ Orloci, 1986; Gray et al., 1988; Warwick, 1988; Raffaelli et al., 1991), but the range of techniques covered is limited.
Rees et al.'s (1990) publication marks a significant advance in many aspects of methodology for benthic surveys, including data analysis. They recommend detrended correspondence analysis and multidimensional scaling as ordination techniques and suggest that replicate samples be taken for faunal analysis at each station. Benthic surveys are expensive in manpower so that sample replication should be kept to the minimum needed to detect any trends present. It would therefore be useful to know whether the different multivariate techniques available are sensitive to the degree of sample replication. In particular, how the appearance of the final ordination plot - invariably presented in two dimensions by benthic ecologists - is affected by the number of replicate samples taken per station. In the present paper, we employ five commonly used multivariate t~chniques to analyse a benthic data ~et from the Ria Formosa in Portugal, and assess their sensitivity to the number of replicate samples used to construct the species-station matrix.
M E T H O D S
The Ria Formosa lies along the south coast of Portugal and is a complex of shal- low lagoons, channels and small islands. The physical characteristics of some salt-pan reservoirs fi'om the area and the benthos have been de~,cribed in detail by Gamito (1989). The data set used in the present study comes from 60 sampling stations dis- persed between four sites: three shallow salt-pans, Sites A (n-- 18), C (n= 12) and D (n = 12) and a lagoon, Site B (n = 18). Site A is inactive and water is renewed only on
EFG B A
D C
EFG
Fig. 1, Example of ordinations which convey similar informauon but whose Axis 2 scores would be poorly correlated.
SENSITIVITY OF SEVERAL ORDINATION METHODS 223
PCA
p r
agm
b ni e j
f
C
PCA
19
10
O 2t 7
24 20
11 17 18
16
1315
B 12 22
23 N E C F P 6
M G D 14 o L A 5
14
3 2
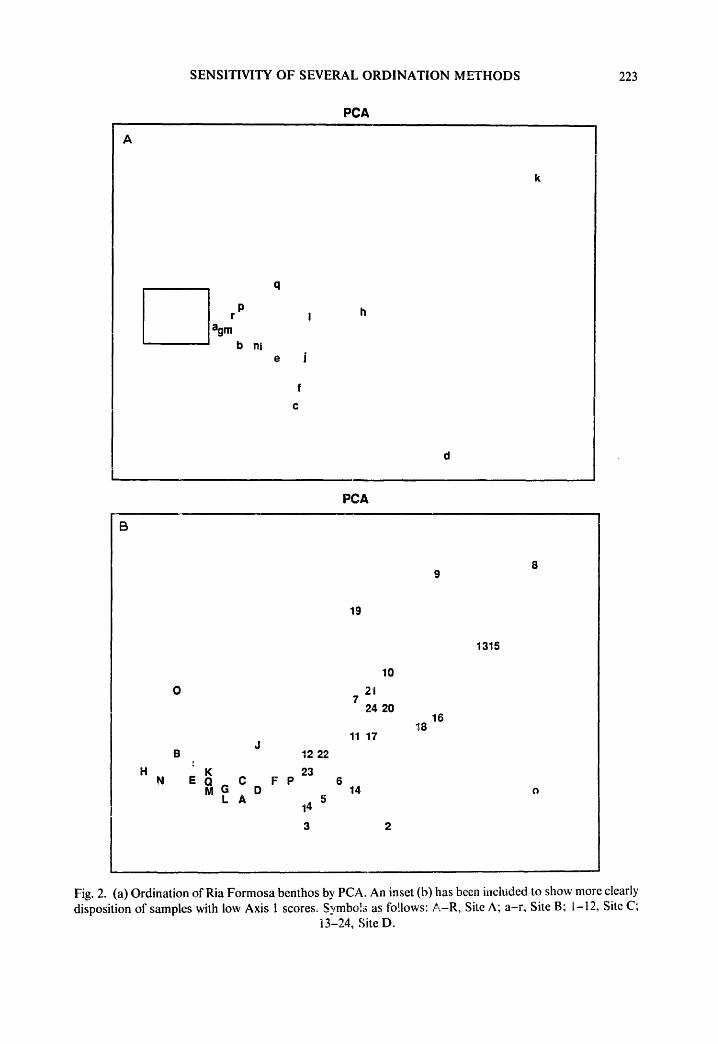
Fig. 2. (a) Ordination of Ria Formosa benthos by PCA. An inset (b) has been included to show more clearly disposition of samples with low Axis 1 scores. Symbo!s as follows: A-R, Site A; a-r, Site B; i-12, Site C;
13-24, Site D.
224 S. GAMITO AND D. RAFFAELLI
spring tides creating a pronounced stress gradient in the data set, with Site A most stressed, Site B least stressed and Sites C and D of intermediate stress (Gamito, 1989).
At each of the 60 stations, five replicate samples were taken with a 120-mm diam- eter corer and the fauna retained on a 1-mm mesh identified to species. Using these data we have derived four data sets based on two, three, four and five sample repli- cates. Each of these data sets was analyzed using the following techniques:
Principal components analysis (PCA), using the package CANOCO, Version 2.1 (Ter Braak, 1986), with the species standardization option.
Correspondence analysis (CA) and detrended correspondence analysis (DCA)using the package CANOCO (Ter Braak, 1986).
Nonmetric multidimensional scaling (NMDS) using the package NTSYS, Ver- sion 1.6 (Rohlf, 1990), on a Bray-Curtis dissimilarity matrix.
Hybrid multidimensional scaling (HMDS) using the package PATN (Faith et al., 1987) on the above matrix.
The variability in the appearance of the final ordination plot to variations in sam- ple replication was assessed for each of these techniques as follows. If an ordination model is insensitive to sample replication then the relative positions of the stations in the ordination space defined by Axes 1 and 2 should be similar for ordinations based on two, three, four or five replicates. In other words, the rank order of stations on these
CA
C e
m n ib
N 5 34 6 14 2 17 16 rq h 3
131518 .p g
2o 19
7 10 21
22 24
9 238
1211
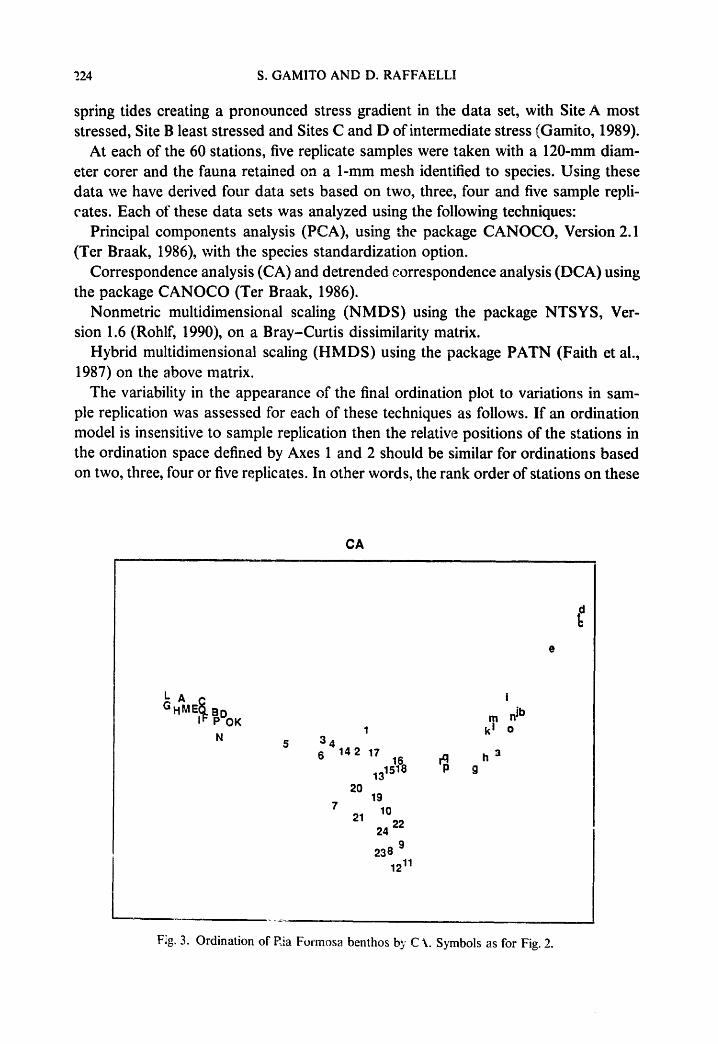
F:g. 3. Ordination of P.ia Formosa benthos b~,' C k. Symbols as for Fig. 2.
SENSITIVITY OF SEVERAL ORDINATION METHODS 29.5
axes should be similar whether two, three, four or five replicates are used. The rank order of stations on Axes 1 and 2 for data sets based on two, three and four replicates were compared with those based on five replicates, using Spearman's rank correlations. This analysis was done for all 60 stations and for each of the four sites separately. For NMDS and HMDS, the plots were first rotated using principal coordinates analysis, so that the first and second dimensions ran in the same direction as the main axes of variation in the data set.
This approach provides an objective expression of the difference in appearance of ordination plots as perceived by the investigator, and the results should not be taken as a measure of how the ecologi~ al information conveyed by the plot varies with sam- ple size. For instance, in Fig. I the relative positions of stations in the ordination space is sufficiently different to produce a low correlation on Axis 2, although the ecological information contained in the two plots is identical. A better measure of agreement between the plots, in terms of the actual information conveyed, would be the magni- tude of correlations carried out on the different distance matrices rather than the axes. This provides an estimate of how similar are the relative distances bctween stations. We are indebted to Bob Clarke for this suggestion.
These two approaches are complementary in that the first aims to quantify similar- ities in the visual appearance of ordination plots, whilst the second assesses how similar is the information conveved by different ordinations.
DCAH
H 7
M O
C F ERDP K
J A Q
5 6
4
3
812
23 11 9
21 22
2410 20 P g h
a r
9 I oi b 1"~71618. q m n J
14 131 5
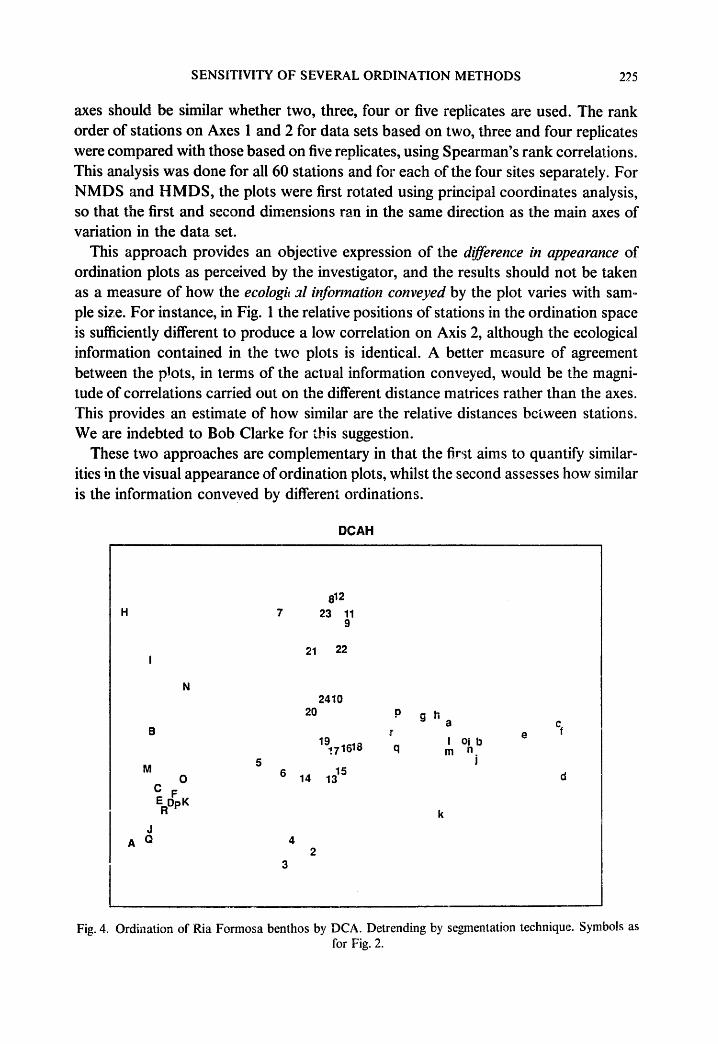
Fig. 4. Ordillation of Ria Formosa benthos by DCA. Detrending by segmentation technique. Symbols as for Fig. 2.

226 S. GAMITO AND D. RAFFAELLI
DCAa
A
M
O E I
K O 5 6
4 3 2
14 13 17 1518
16 20 19
i0 21 24
22
7 231~11
rq I lb p g h a c
e
Fig. 5. Ordination of Ria Formosa benthos by DCA. Detrending by polynomials method. Symbols as for Fig. 2.
NMDS
5 H n 24 N G
c 14 Orn IC17 I
f d b e j ihqgpr 1~151320 6 p~) KQ E O C M B a L k 19 21 RJ
10 A 22 7
9
Fig. 6. Ordination of Ria Formo a benthos by NMDS. Symbols as for Fig. 2.

SENSITIVITY OF SEVERAL ORDINATION METHODS 227
RESULTS
For the data set based on five replicates, there were marked differences between the ordination techniques in the overall appearance of the plots (Figs. 2-7). PCA com- pressed all of the Site A stations and most of those in Sites C and D into a tight grouping towards the left side of the plot (Fig. 2). This made visual interpretation of the plot difficult. A far clearer ordination of the main sites was made by CA (Fig. 3), although there was a pronounced horseshoe or arch-effect, characteristic of data sets with a strong underlying gradient and nonmonotonic species responses (Pielou, 1984). The arch-effect is eliminated by DCA, which also rescales the axes to avoid compres- sion of station distances at the extremes of axes. The method originally devised by Hill (1979) for detrendiag the arch divides Axis 1 into many segments (default option = 24 segments) and adjusts the scores of stations on Axis 2 so that similar mean scores are established for each segment. An alternative method of detrending is based on polynomials (Ter Braak, 1986), with higher order polynomials recommended for data sets where there is a strong primary gradient. Both detrending methods removed the arch effect seen in CA although the positions of the stations diffe~ slightly in the two resulting ordinat ~ as (Figs. 4, 5). NMDS and HMDS clearly separated the sites
b
HMDS
cd
1124 q 12
hi p r 19
i 132010 7 I j 18
a n rn 1517 D ~ R O j g 21 6 P EN
e o 16 F M L B b 22 14 C G
23 A 5
4
2 3
Fig. 7. Ordination of Ria Formosa benthos by HMDS. Symbols as for Fig. 2.

228 s. GAMITO AND D. RAFFAELLI
and suggested the same major gradient running through the data as in other ordina- titans (Figs. 6, 7). There was no obvious arch-effect in either the NMDS or H M D S plots.
The rank order of all 60 station scores on Axis 1 was relatively insensitive to sam- pie replication for all of the ordination methods (Fig. 8). However, for the station scores on Axis 2, there were major differences between the methods. CA was the least sen- sitive to sample replication in this respect, followed by DCA carried out using second- and third-order polynomials (Fig. 8). When the fourth-order polynomial optioa was selected, ~.s recommended by Ter Braak (i986), the resulting DCA plot was extremely sensitive to sample replication, as was DCA using the original segmentation detrending method and PCA (Fig. 8). Some sensitivity was also shown by HMDS and NMDS with respect to Axis 2 scores.
When the same analysis was carried out on a site-by-site basis, the correlation co- efficients were on average lower, as might be expected. Nevertheless, the general pic- ture remained broadly similar to that described above: the CA plots appeared the least sensitive with respect to both axes and the two MDS techniques were the most sen- sitive with respect to Axis 29 especially the ranking of stations within Sites A and D (Table I).
Correlation analysis on the distance matrices rather than the axes yielded much higher correlation coefficients, almost all ~ 0.9 or higher (Fig. 9). This strongly suggests that although the visual appearance of some plots varied markedly with sample rep-
t - O
L.
o u
PCA CA DCA OCA3 DCA4 MDS HMDS I o o o ® ~ o ® ® o o ® , o e e • o o • "
o
DCA2 e • •
o
o o o o
o o o o
0 0
2 3 4 2 3 4 23 4 2 3 4 ~ 3 4 2:3 4 2 3 4 2""3
number of repl icates
Fig. 8. Sensitivity of multivariate techniques to sample replication: correlations on axes. Q, Axis 1; ©, Axis 2; DCA 2-4, second-, third- and fourth-order polynomials.
S E N S I T I V I T Y O F S E V E R A L O R D I N A T I O N M E T H O D S 229
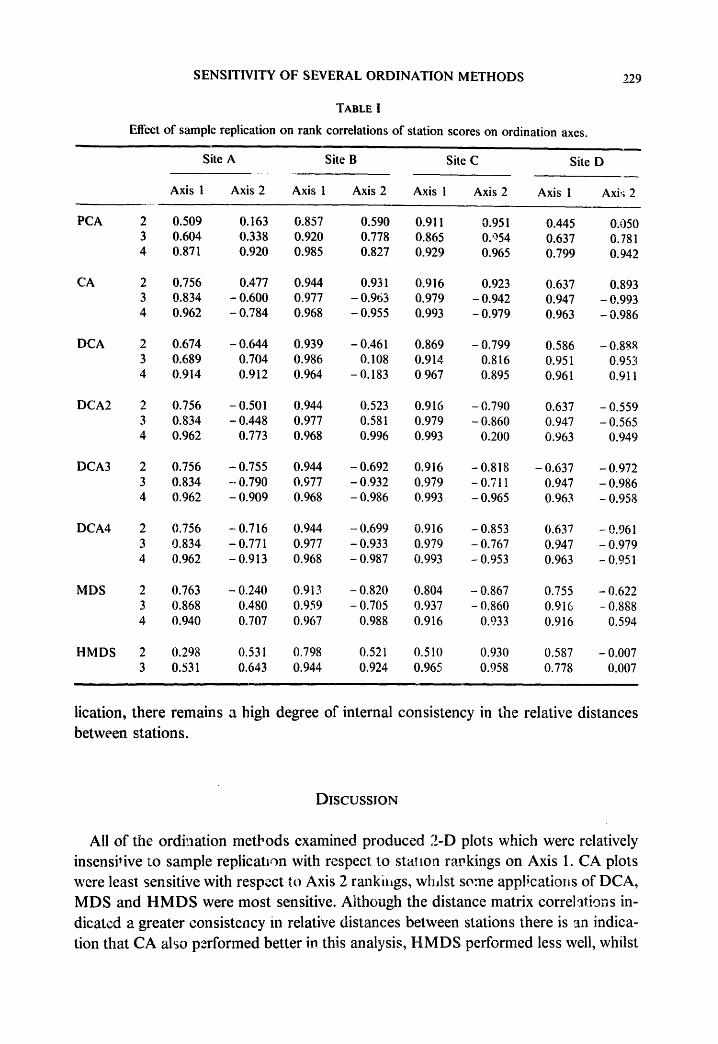
TABLE I
Effect o f sample repl icat ion on r ank corre la t ions o f s ta t ion scores on o rd ina t ion axes.
Site A Site B Site C Site D
Axis 1 Axis 2 Axis 1 Axis 2 Axis 1 Axis 2 Axis 1 Axir; 2
P C A
CA
D C A
D C A 2
D C A 3
D C A 4
MI)S
2 0.509 0.163 0.857 0.590 0.911 0.951 0.445 0.050
3 0.604 0.338 0.920 0.778 0.865 0.'~54 0.637 0.781
4 0.871 0.920 0.985 0.827 0.929 0.965 0.799 0.942
2 0.756 0.477 0.944 0.931 0.916 0.923 0.637 0.893
3 0.834 - 0.600 0.977 - 0.963 0.979 - 0.942 0.947 - 0.993
4 0.962 - 0.784 0.968 - 0.955 0.993 - 0.979 0.963 - 0.986
2 0.674 - 0.644 0.939 - 0.461 0.869 - 0.799 0.586 - 0.88R
3 0.689 0.704 0.986 0.108 0.914 0.816 0.951 0.953
4 0.914 0.912 0.964 - 0.183 0 9 6 7 0.895 0.961 0.911
2 0.756 - 0.501 0.944 0.523 0.916 - 0.790 0.637 - 0.559
3 0.834 - 0.448 0.977 0.581 0.979 - 6.860 0.947 - 0.565
4 0.962 0.773 0.968 0.996 0.993 0.200 0.963 0.949
2 0.756 - 0.755 0.944 - 0.692 0.916 - 0.818 - 0.637 - 0.972
3 0.834 - 0.790 0.977 - 0.932 0.979 - 0.711 0.947 - 0.986
4 0.962 - 0.909 0.968 - 0.986 0.993 - 0.965 0.963 - 0.958
2 0.756 - 0.716 0.944 - 0.699 0.916 - 0.853 0.637 - 9.961
3 0.834 - 0.771 0.977 - 0.933 0.979 - 0.767 0.947 - 0.979
4 0.962 - 0.913 0.968 - 0.987 0.993 - 0.953 0.963 - 0.951
2 0.763 - 0.240 0.913 - 0.820 0.804 - 0.867 0.755 - 0.622
3 0.868 0.480 0.959 - 0.705 0.937 - 0.860 0.916 - 0.888
4 0.940 0.707 0.967 0.988 0.916 0.933 0.916 0.594
H M D S 2 0.298 0.531 0.798 0.521 0.510 0.930 0.587 - 0.007
3 0.531 0.643 0.944 0.924 0.965 0.958 0.778 0.007
lieation, there remains a high degree of internal consistency in the relative distances between stations.
D I S C U S S I O N
All of the ordination methods examined produced 2-D plots which were relatively insensitive to sample replication with respect to station ravkings on Axis 1. CA plots were least sensitive with respect to Axis 2 rankn,gs, whdst some applications of DCA, MDS and HMDS were most sensitive. Although the distance matrix correlations in- dicated a greater consistency in relative distances between stations there is an indica- tion that CA also performed better in this analysis, HMDS performed less well, whilst

230 S. GAMITO AND D. RAFFAELLI
.95 c- o
° ~
. e . , , .
O
k _
L - -
O s,I
PCA CA DCA DCA2 DCA3 DCAZ, MDS HMDS I I •
O
O •
4'
O
O
O
O
O
2 3 4 2 i i 2 a 4 2 a 4 2 2 a number of repl icates
Fig. 9. Sensitivity of multivariate techniques to sample replication: correlations on distance matrices. DCA 2-4, second-, third- and fourth-order polynomials.
DCA using the second-order polynomial option was sensitive to low sample size (Fig. 9). Whether these effects would be sufficie~t to lead to misinterpretation of the major patterns in the data is debatable, but one should at least be mindful of the ef- fects.
The main advant?ge of detrending is the removal of any interdependence of the first two axes which may allow the identification of secondary environmental gradients otherwise represented in higher dimensions. This advantage clearly needs to be bal- anced against DCA's apparent sensitivity under some conditions to sample replication (also demonstrated by Oksanen (1988)) and attention should be paid to the selection of an appropriate detrending algorithm.
Neither of the MDS methods displayed the arch-effect apparent in the CA ordina- tions (although this is not always the case; Raffaelii et al., 1991) but both showed a high sensitivity with respect to Axis 2 scores. This sensitivity was also noted in the version of MDS contained in the programme ALSCAL within the SPSSX package (SPSS, 1987) for a related data set. Closer inspection of tiic MDS plots revealed that several of the low correlations obtained were due to differences in ranking of one or two stations. For instance, at Site D in the HMDS ordinations, Station 24 had the low- est Axis 2 score for two and three replicate samples, but the highest for five replicates, whilst the majority of the remaining stations at this site did not c!iange their position on Axis 2.
One explanation for this may be the problem MDS has in placing points which bear no strong relation to others in the 2-D plot. In a 2-D plot such points will bc located

SENSITIVITY OF SEVERAL ORDINATION METHODS 231
towards the boundaries of the plot, more or less at random and probably at different boundaries on different iterations within the same analysis (Bob Clarke, pers. comm.). This might have produced the large changes in the relative positions of the stations noted above and the low correlations shown in Fig. 8 and Table I. The effects would be less obvious in the analyses based on distance matrices. In contrast, in PCA, CA and DCA techniques such points will be projected onto a plot of the first two axes even if they are then located on top of stations with which they have no affinity. As a consequence, the appearance of ordination plots based on different sample sizes will seem more consistent than for MDS methods. Yet the variation seen in the MDS plots may actually be more informative with regard to affinities of these "odd" stations.
An obvious solution to this problem would be to produce plots incorporating higher dimensions. However, the literature suggests that benthic ecologists, unlike plant ecol- ogists, rarely do this. Just how well a 2-D ordination plot represents the higher di- mensional data is reflected in the stress values in the case of MDS and in the eigen- values for the other methods discussed here. In the present study, stress values were generally ~0.2 and eigenvalues for Axes 1 ar.d 2 combined ranged from 0.2 for the PCAs to 0.65 for the CAs. These values, even those for CA, are indicative of the need to consider higher dimensions (Bob Clarke, pers. comm.) and this might well have contributed to some of the low correlations obtained.
Of all the techniques used here, CA performed consistently better with respect to sample replication. As indicated above, this consistency does not necessarily imply a
°
more accurate representation of the data, because projection techniques like C.~ are also liable to consistently misrepresent station affinities in a 2-D plot. However, CA can also be helpful in avoiding potential misinterpretations of DCA plots where a single, strong underlying gradient is present in the data (Raffaelli et al., 1991) and we suggest that CA be included along with DCA and NMDS in the anrlysis of benthic data sets (Rees et al., 1990). This would involve no extra cost in effoi't ,'r .,~,ftw~re since CA is usually an alternative option in packages supporting DCA (e.g., '[er Braak, 1986) or NMDS (Rohlf, 1990).
ACKNOWLEDGEMENTS
We wish to thank Trevor Telfour, Institute of Offshore Engineering, Heriot-Watt University, for providing access to PATN. The manuscript was completely trans- formed by Bob Clarke, Plymouth Marine Laboratory, to whom we are greatly indebted.
REFERENCES
Faith, D.P., P.R. Minchin & L. Belbin, 1987. Compositional dissimilarity as a robust measure of ecolog-
ical distance. Vegetatio, Vol. 69, pp. 89-107. Field, J.G., K.R. Clarke & R.M. Warwick, 1982. A practical strategy for analysing multispecies distribu-
tion patterns. Mar. Ecol. Prog. Ser., Vol. 8, pp. 37-52.
232 S. GAMITO AND D. RAFFAELLI
Field, J.G., R.H. Green, F.A. de L. Andrede, E. Fresi, P. Gros, B.H. McArdle, M. Scardi & D. ~ ten- berg, 1987. Numerical ecology: developments for studying the benthos. In, Developments in numerical ecology, edited by P. Legendre & L. Legendre, Springer-Verlag, Berlin.
Gamito, S., 1989. The benthic mzcrofauna and some water reservoirs of salt-pans from Ria Formosa (Portugal). Sci. Mar., Vol. 53, pp. 639-644.
Gray, J.S., M. Aschan, M.R. C:~r, K.R. Clarke, R.H. Green, T.H. Pearson, R. Rosenberg & R.M. Warwick, 1988. Analysis of community attributes of the macrofauna of Frierjord/Langesundfjord and in a mesocosm experiment. Mar. Ecol. Prog. Ser., Vol. 46, pp. 151-165.
Hill, M.O., 1979. DECORANA - A FORTRAN programme for detrended correspondence analysis and recip- rocal averaging. Cornell University, Ithaca.
Kenkel, N.C. & L. Orloci, 1986. Applying metric and nonmetric multidimensional scaling to ecological studies: some new results. Ecology, Vol. 67, pp. 919-928.
Oksanen, J., 1988. A note on the occasional instability of detrending in correspondence analysis. Vegetatio, Vol. 74, pp. 29-32.
Pielou, E.C., 1984. The #lterpretation of ecological data: a primer on classification and ordination. John Wiley & Sons, New York.
Raffaelli, D., I. Karakassis & A. Galloway, 1991. Zonation schemes on sandy shores: a multivariate approach. J. Exp. Mar. Biol. Ecol., Vol. 148, pp. 241-253.
Rees, H.L., D.C. Moore, R.H. Pearson, M. Elliott, M. Service, J. Pomfret & D. Johnson, 1990. Proce- dures for the monitoring of marine benthic communities at U.K. sewage sludge disposal sites. Scot. Fish. bform. Pamphlet, No. 18, 79 pp.
Rohlf, F.J., 1990. NTS YS - PC. Numerical taxomony amt multivariate analysis system. Exeter Software, New York.
Ter Braak, C.J.F., 1986. Canonical correspondence analysis: a new eigenvector technique for multivariate direct gradient analysis. Ecology, Vol. 67, pp. 1167-1179.
Warwick, R.M., 1988. Effects on community structure of a pollution gradient - summary. Mar. Ecol. Prog. Ser., Vol. 46, pp. 207-211.
Related Documents