Data Exploration in the Ecology Classroom: The Science-Pipes Approach Kenneth Klemow (Wilkes University)* Paul Allen (Cornell Lab of Ornithology) Teresa Mourad (Ecological Society of America) Andrea McMillen (Ecological Society of America)

Welcome message from author
This document is posted to help you gain knowledge. Please leave a comment to let me know what you think about it! Share it to your friends and learn new things together.
Transcript
Data Exploration in the Ecology
Classroom: The Science-Pipes
Approach
Kenneth Klemow (Wilkes University)*
Paul Allen (Cornell Lab of Ornithology)
Teresa Mourad (Ecological Society of America)
Andrea McMillen (Ecological Society of America)
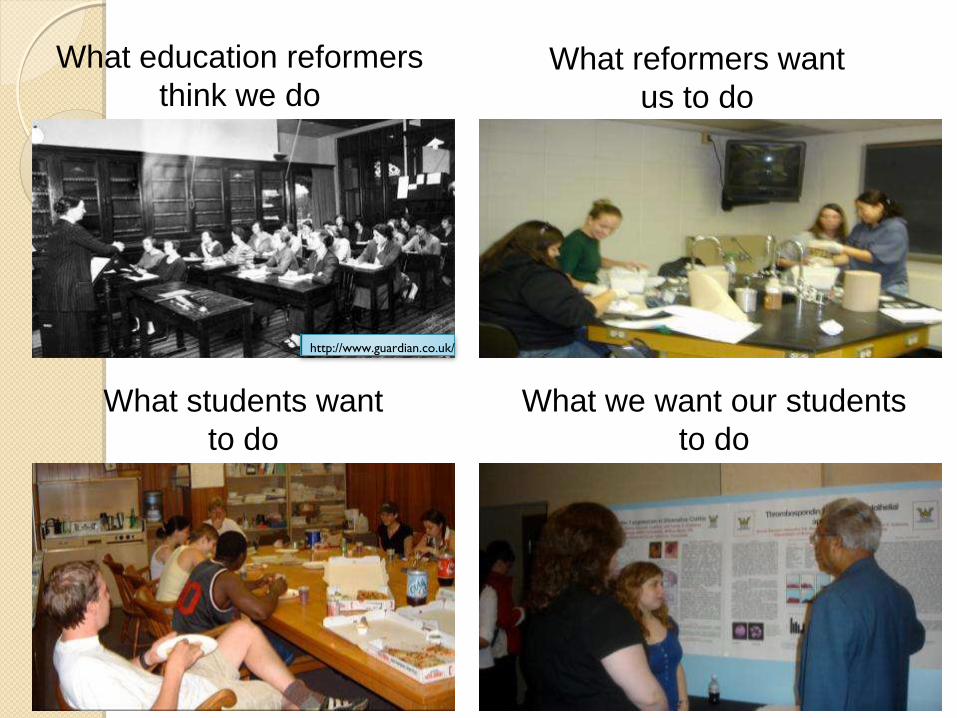
What reformers want
us to do
http://www.guardian.co.uk/
What education reformers
think we do
What we want our students
to do
What students want
to do
Science education is becoming more
student-centered
Recommendations of national panels
◦ Less emphasis on lecturing
◦ More on student active data gathering,
analysis, reporting, critical thinking
Goal to have students master
competencies, rather than rote
knowledge
Student-active learning involves data
collecting and analysis
Students behave as scientists to construct
knowledge
Feasible when examining phenomena of limited
spatial and temporal scale
◦ Cell / Molecular biology
◦ Physiology
Less feasible for phenomena of longer temporal
scale or broader spatial scale
◦ Ecology
◦ Evolution
Still, want to teach ecological /
evolutionary principles with data
Use data from individual studies
◦ Limited in terms of extent
Use data multiple studies (data mining)
◦ Access, compatibility an issue
Statistics / data visualization software often
challenging for students
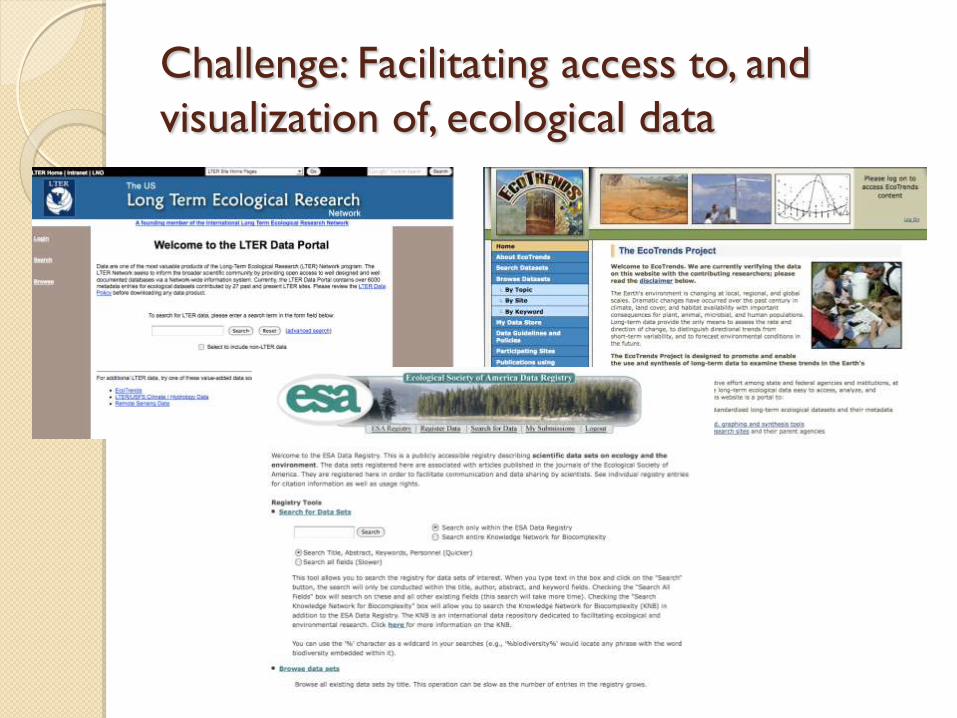
Challenge: Facilitating access to, and
visualization of, ecological data
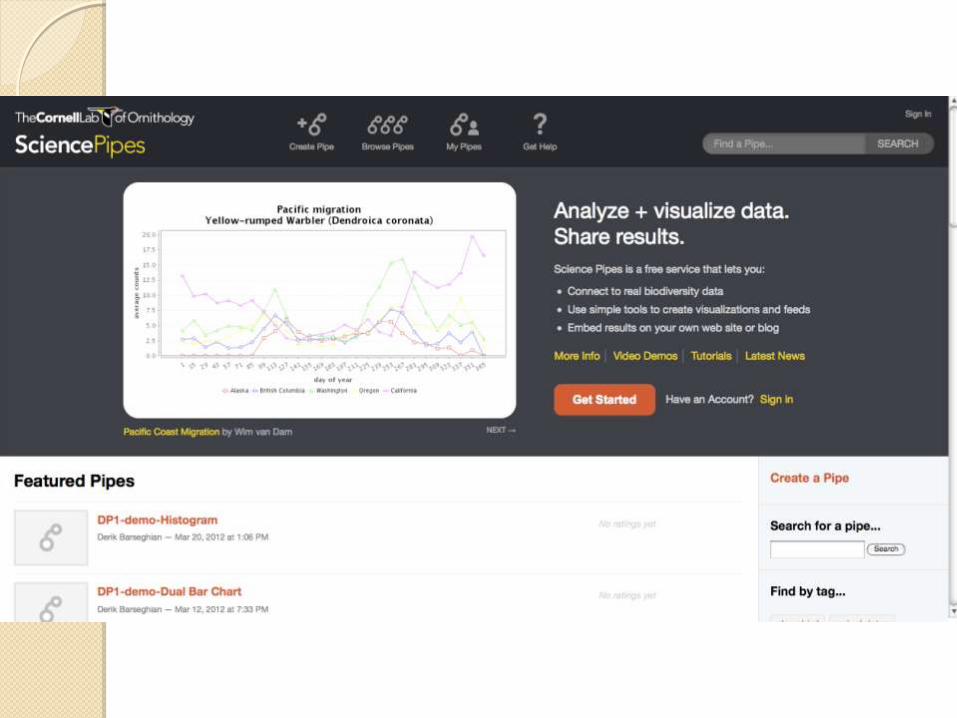
One Solution: Science Pipes
Workflow system developed by Cornell Lab of Ornithology
Allows students to analyze and visualize complex datasets.
Uses an object-oriented interface.
Found at http://www.sciencepipes.org
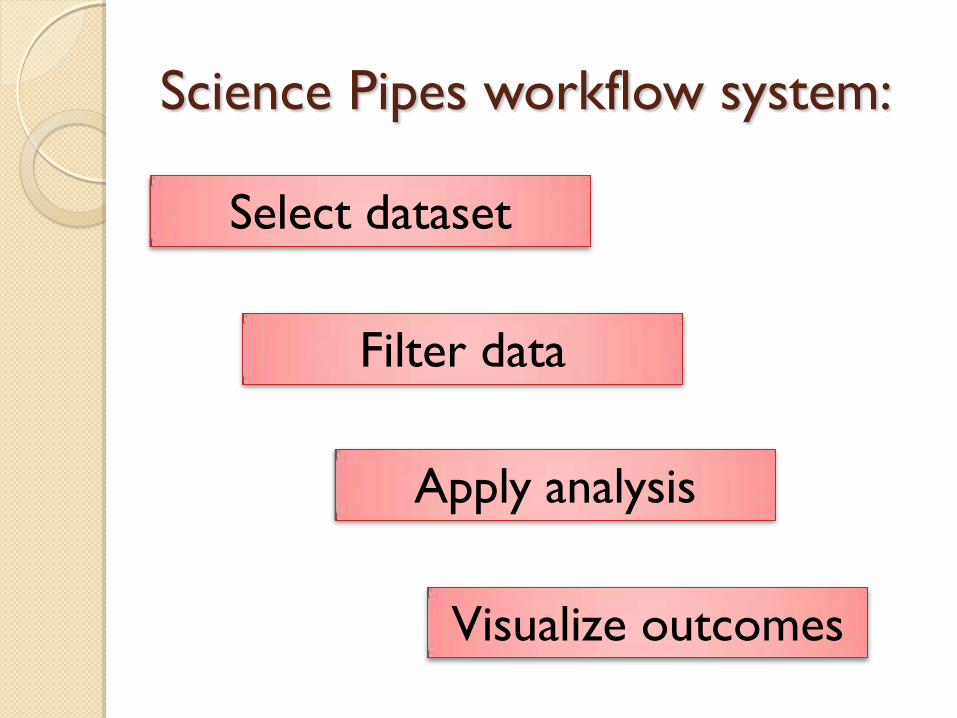
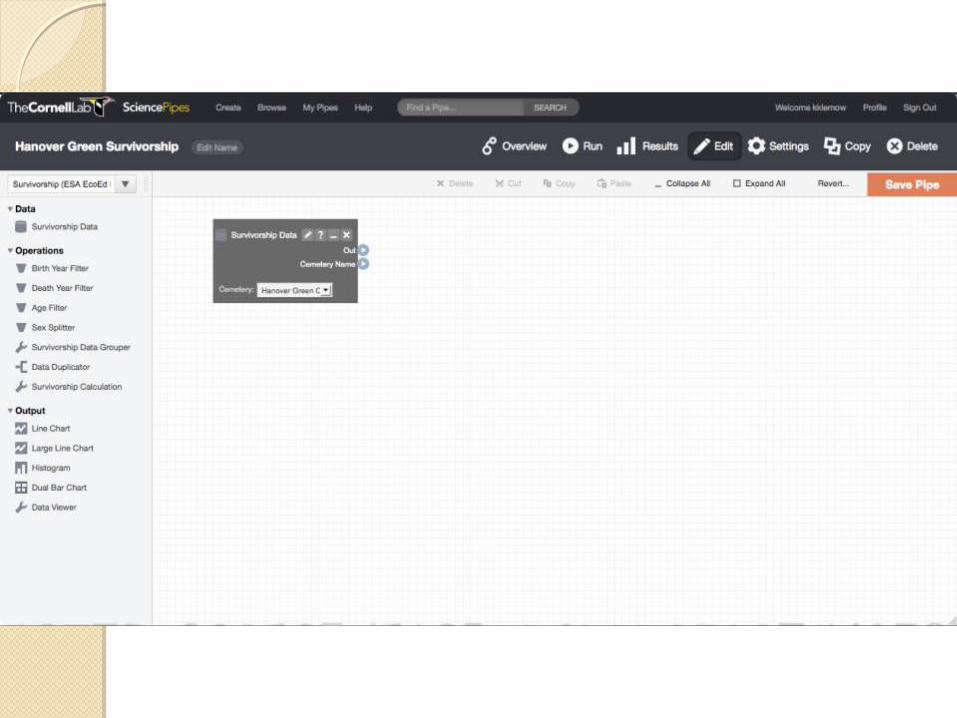
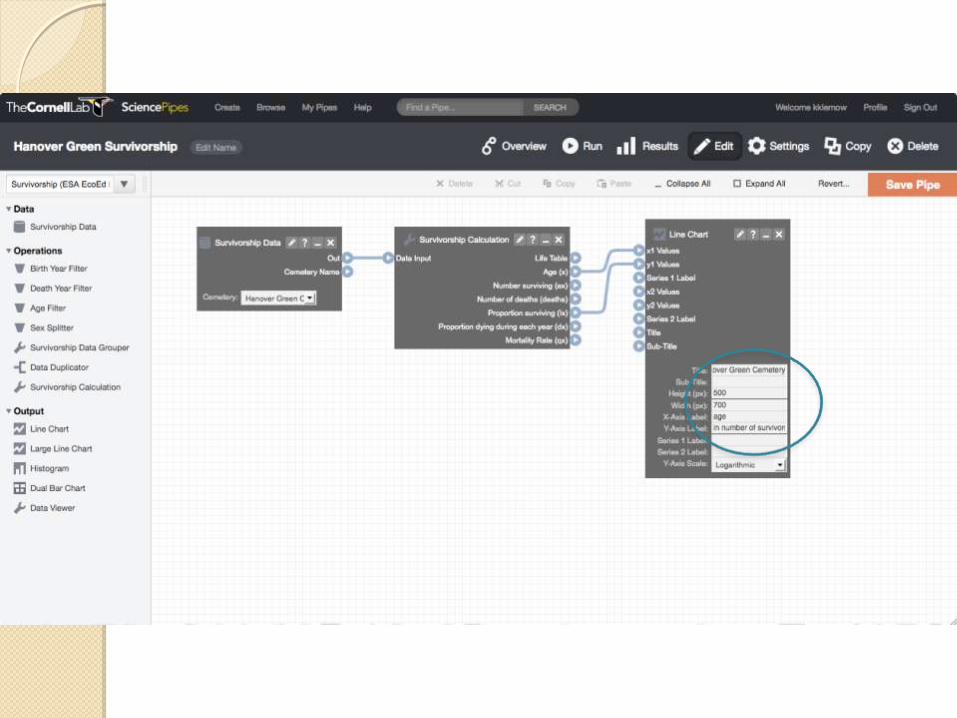
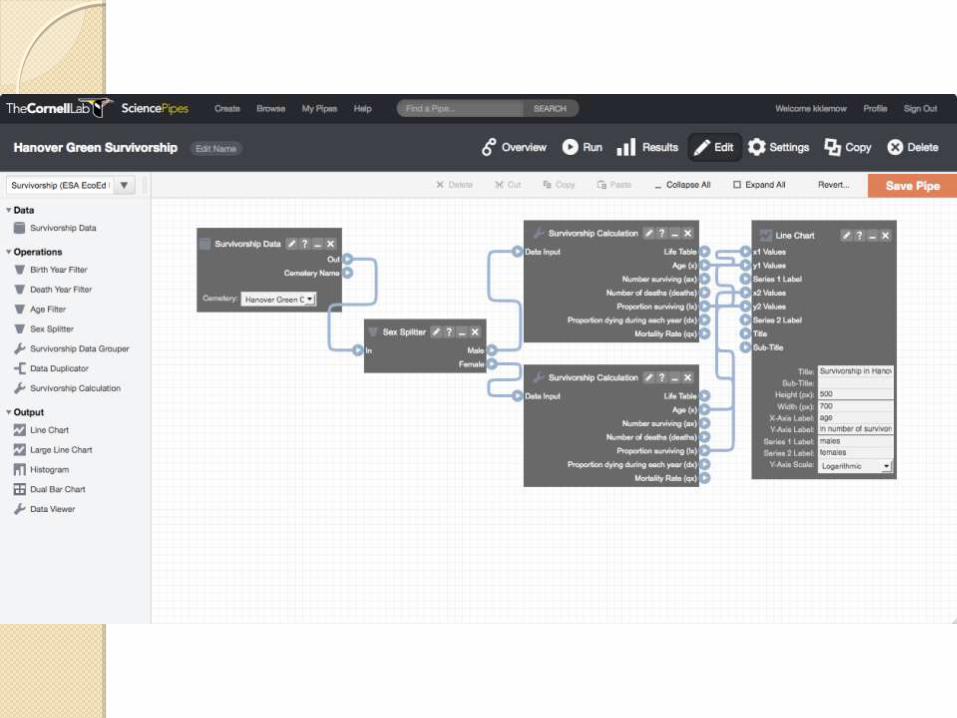
Science Pipes workflow system:
Select dataset
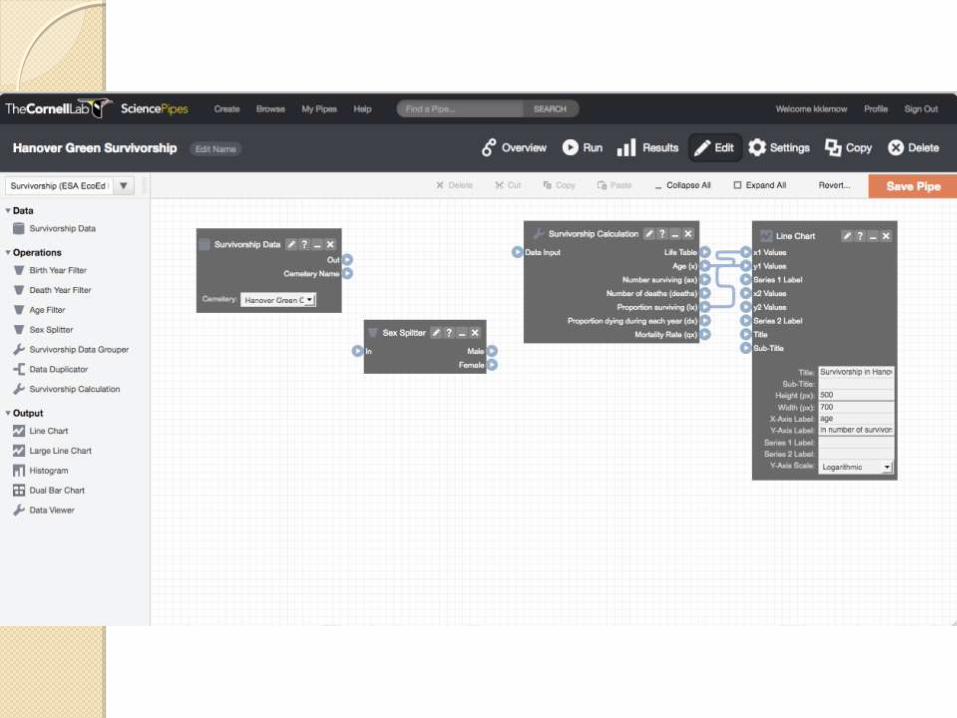
Filter data
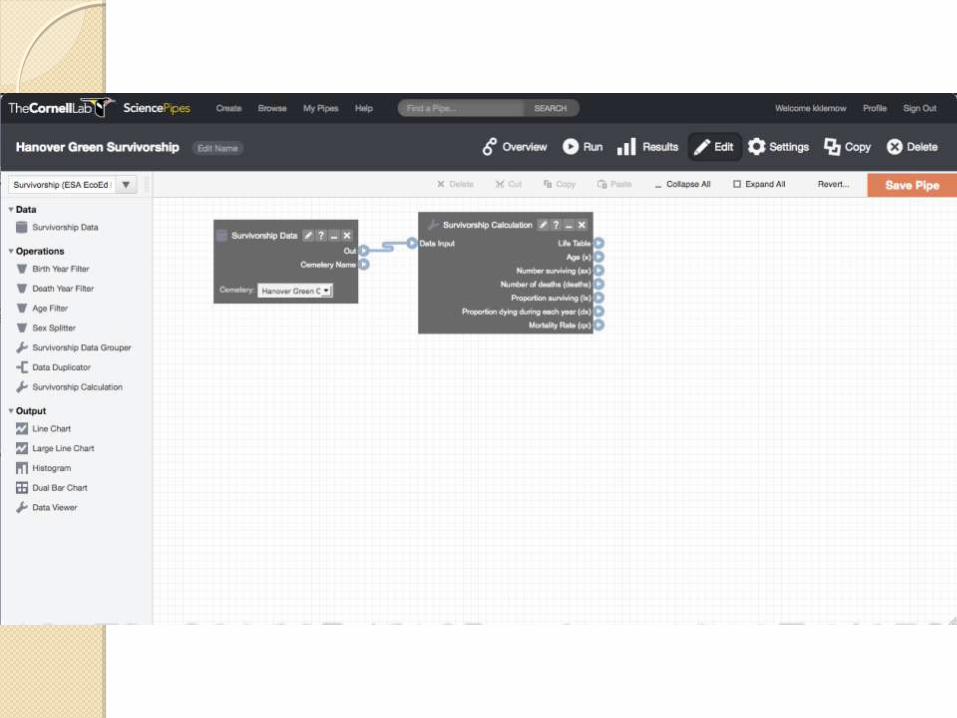
Apply analysis
Visualize outcomes
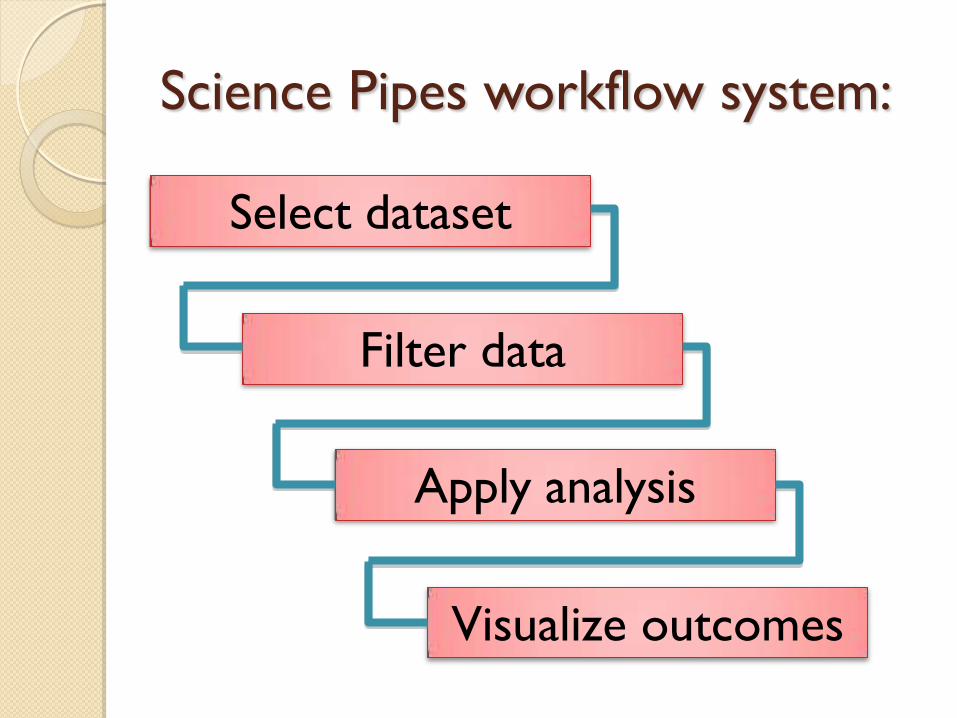
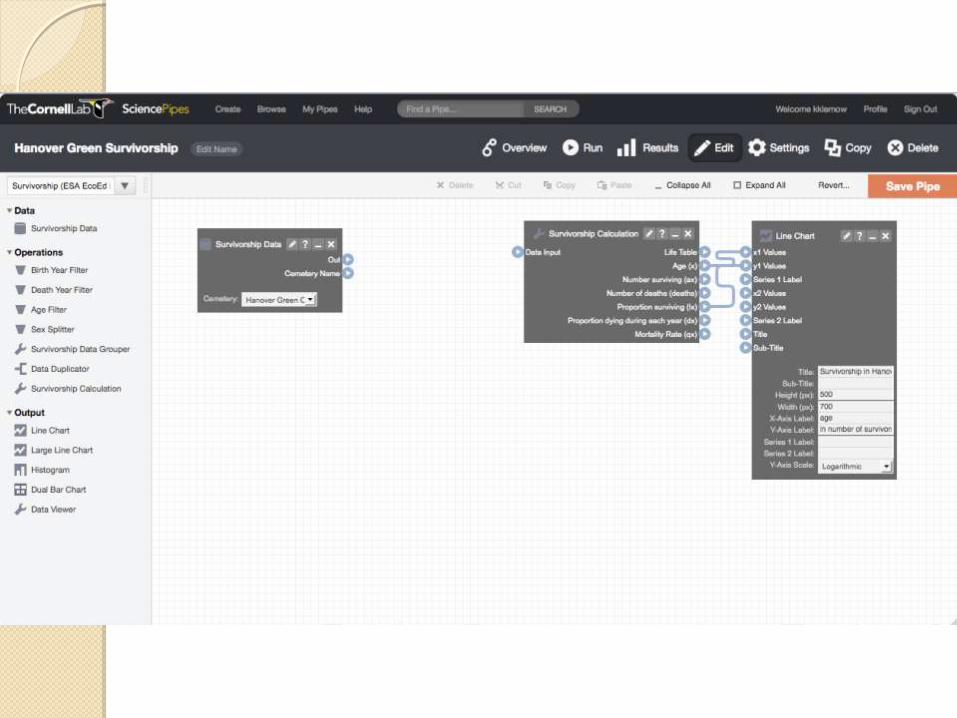
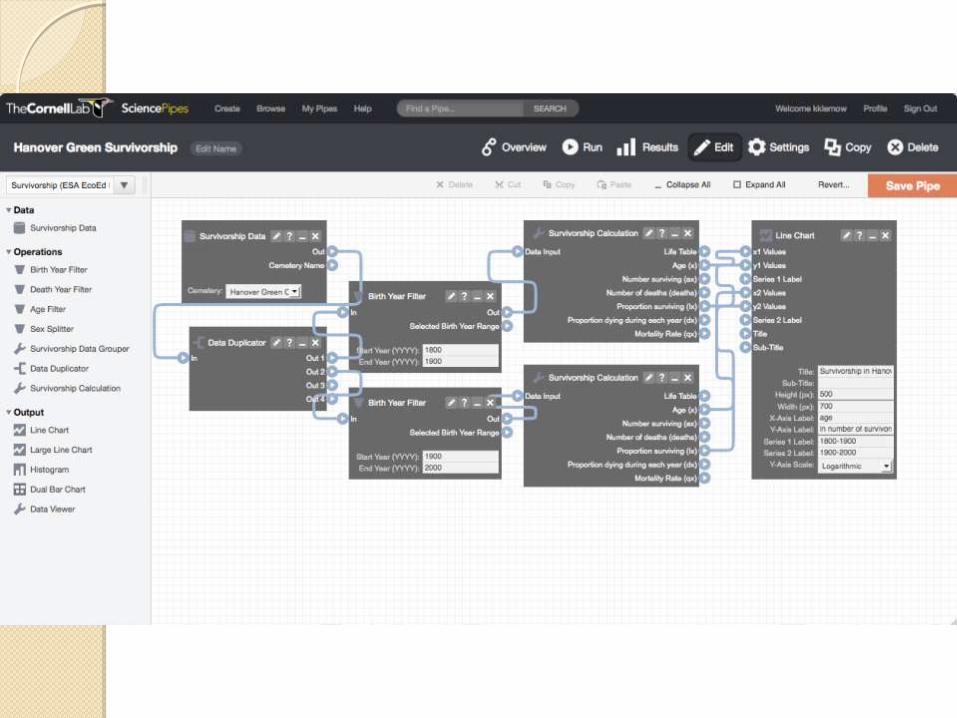
Science Pipes workflow system:
Select dataset
Filter data
Apply analysis
Visualize outcomes
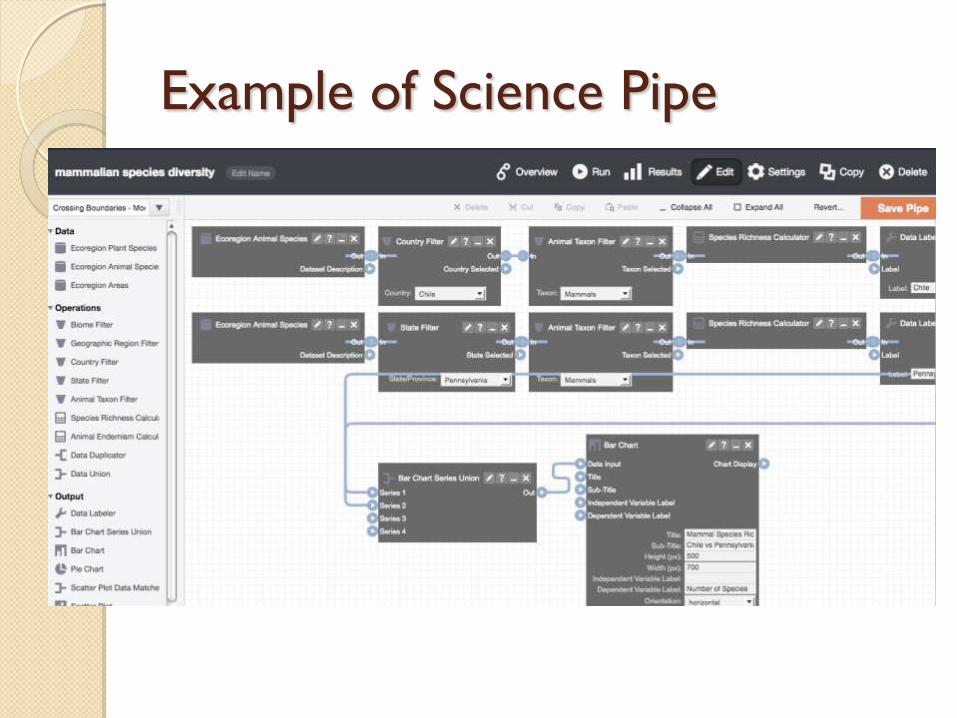
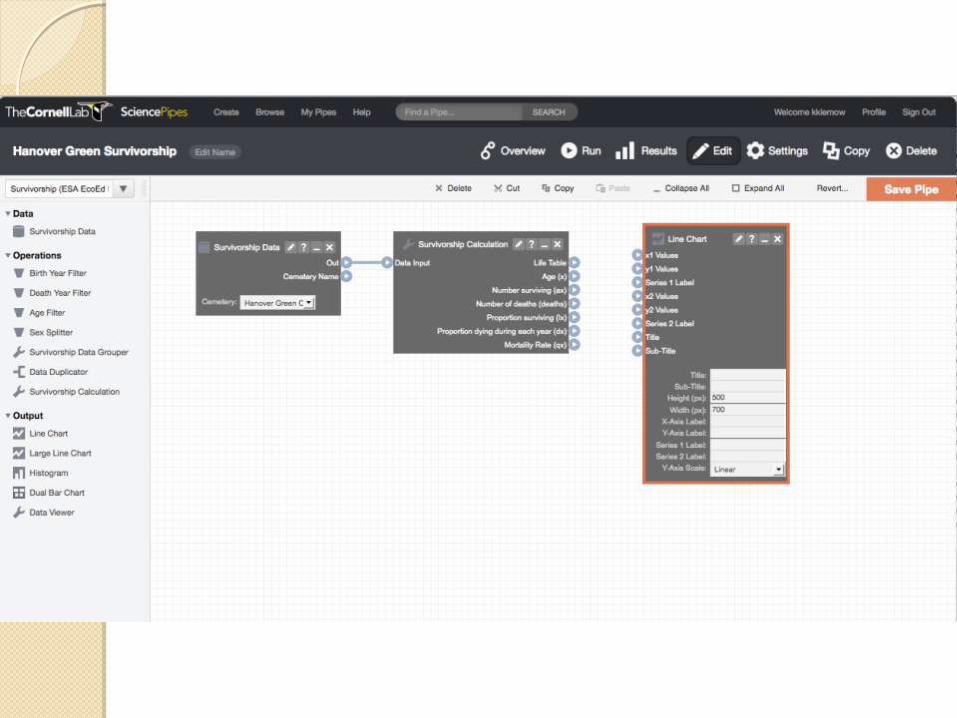
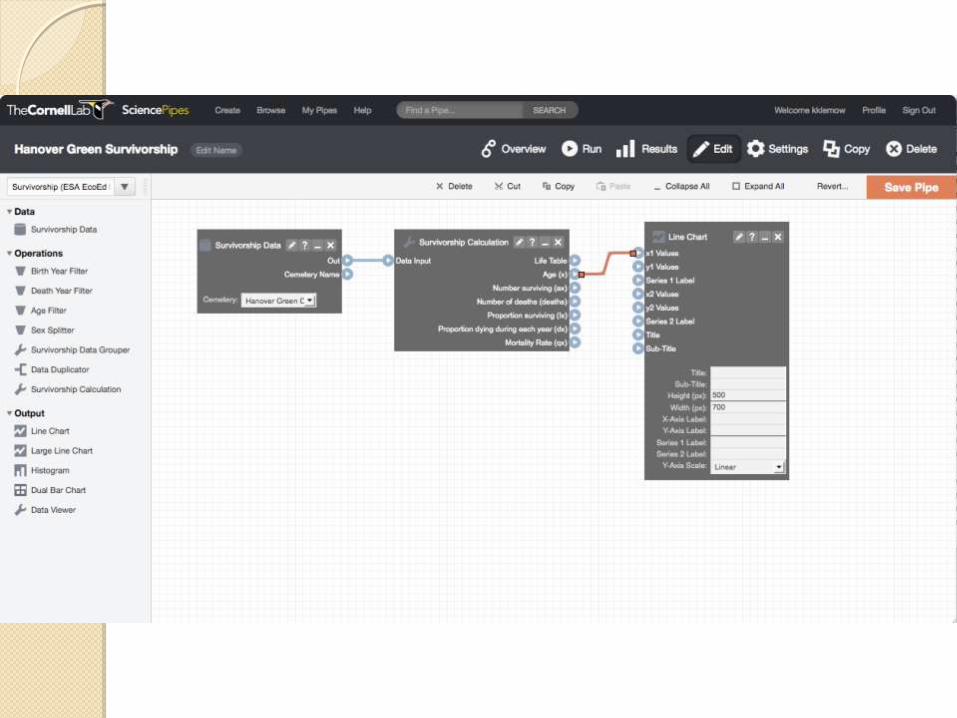
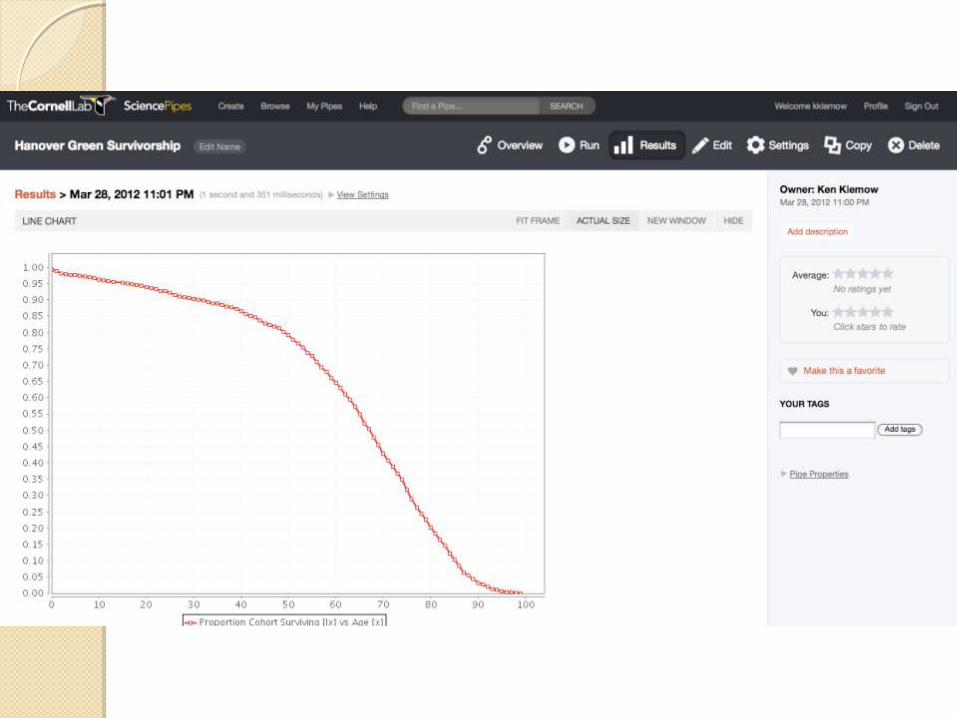
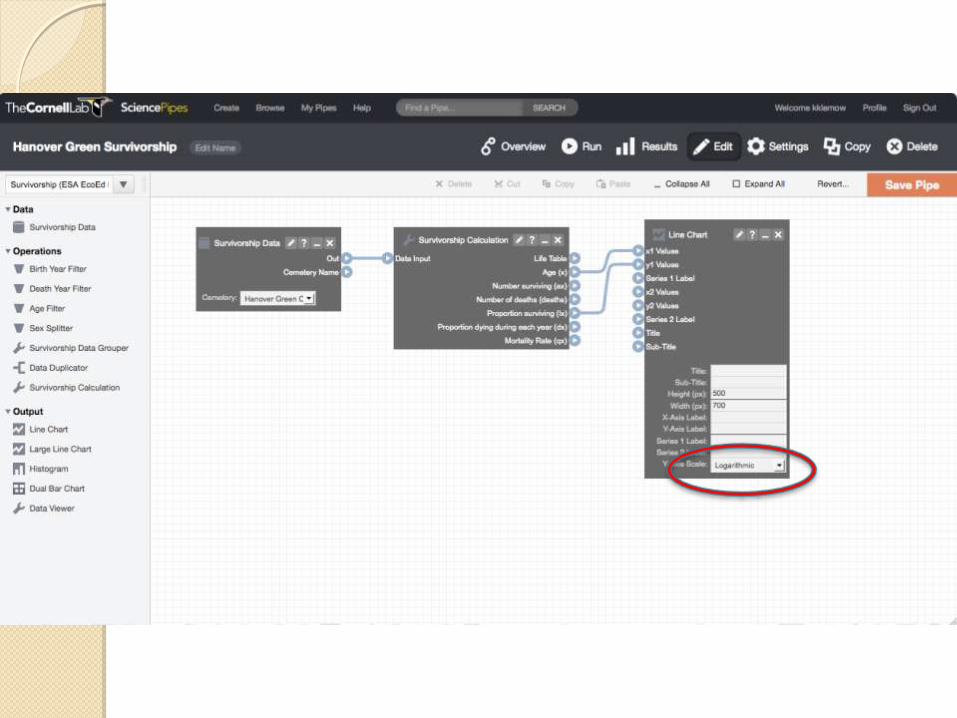
Example of Science Pipe
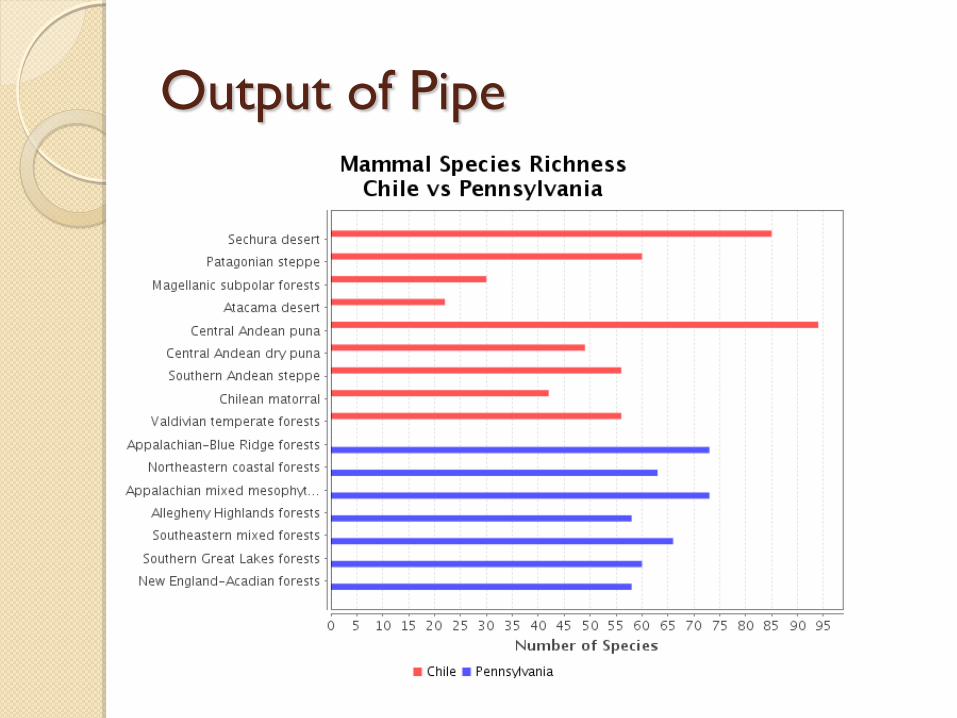
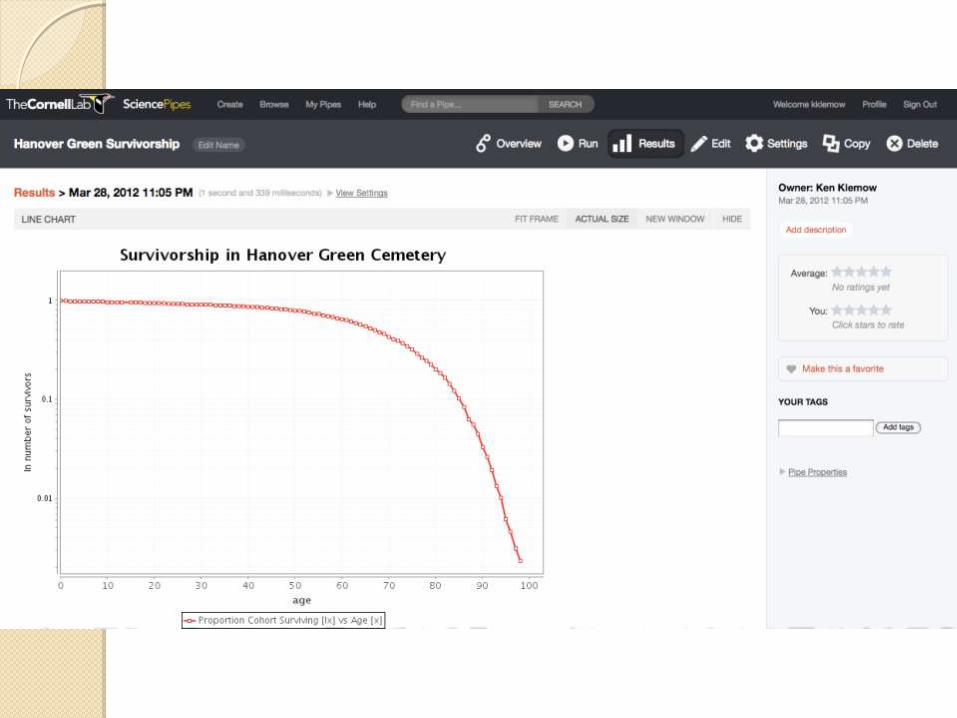
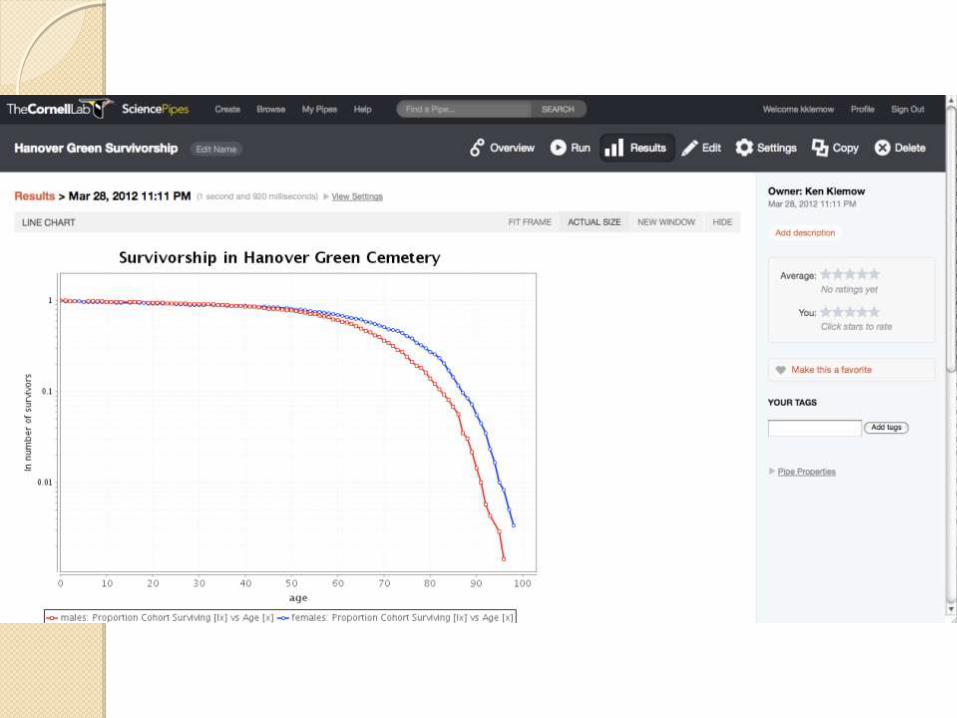
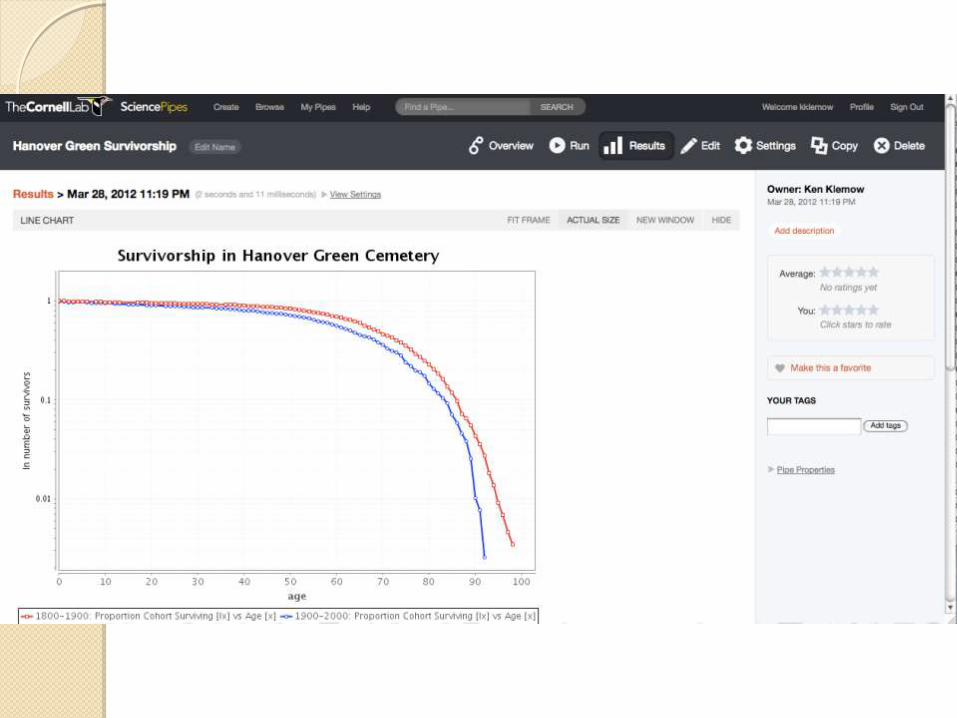
Output of Pipe
Datasets in Science Pipes
From Cornell Lab of Ornithology Avian Knowledge Network (eBird, Project Feeder
Watch)
◦ WWF WildFinder (Crossing Boundaries)
◦ From Ecological Society of America ◦ Cemetery Demography
◦ Adaptive radiation
◦ Pollen data
◦ Forest Inventory & Analysis
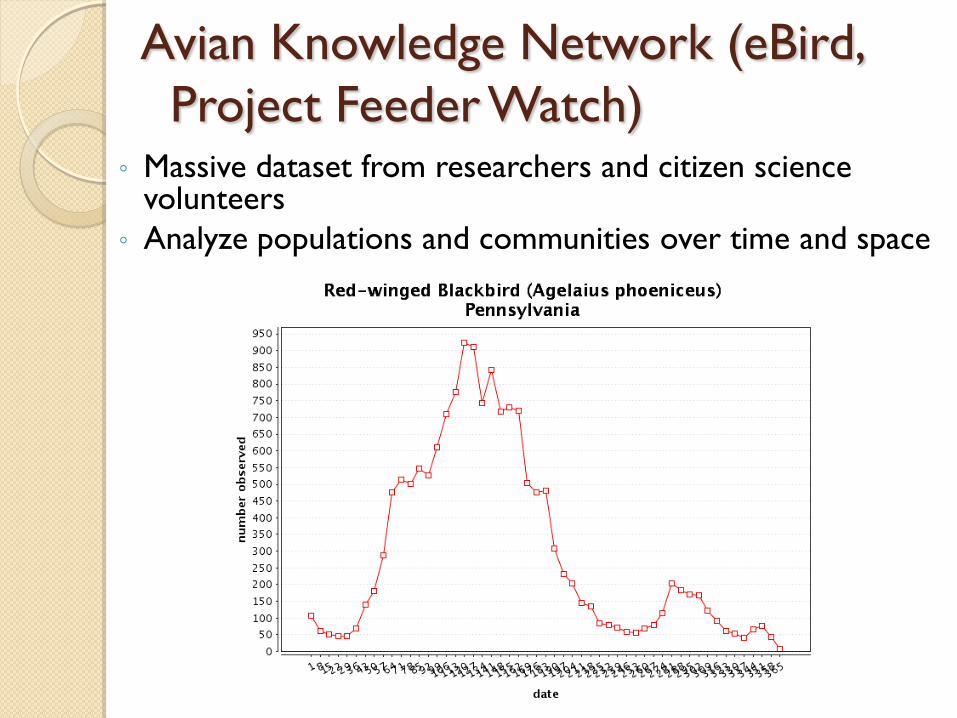
Avian Knowledge Network (eBird,
Project Feeder Watch) ◦ Massive dataset from researchers and citizen science
volunteers
◦ Analyze populations and communities over time and space
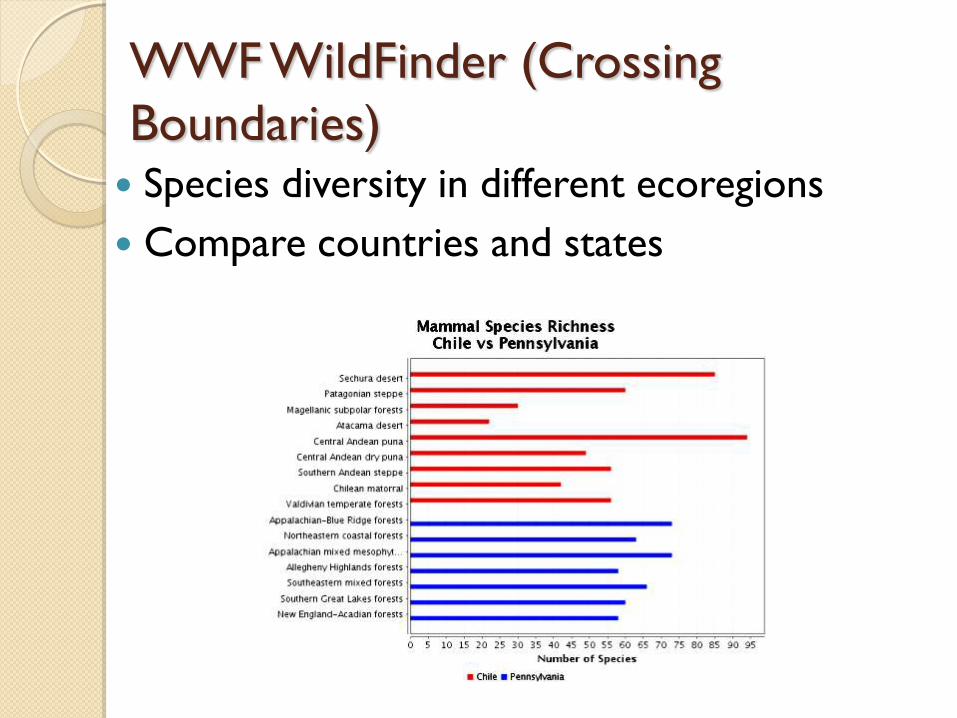
WWF WildFinder (Crossing
Boundaries) Species diversity in different ecoregions
Compare countries and states
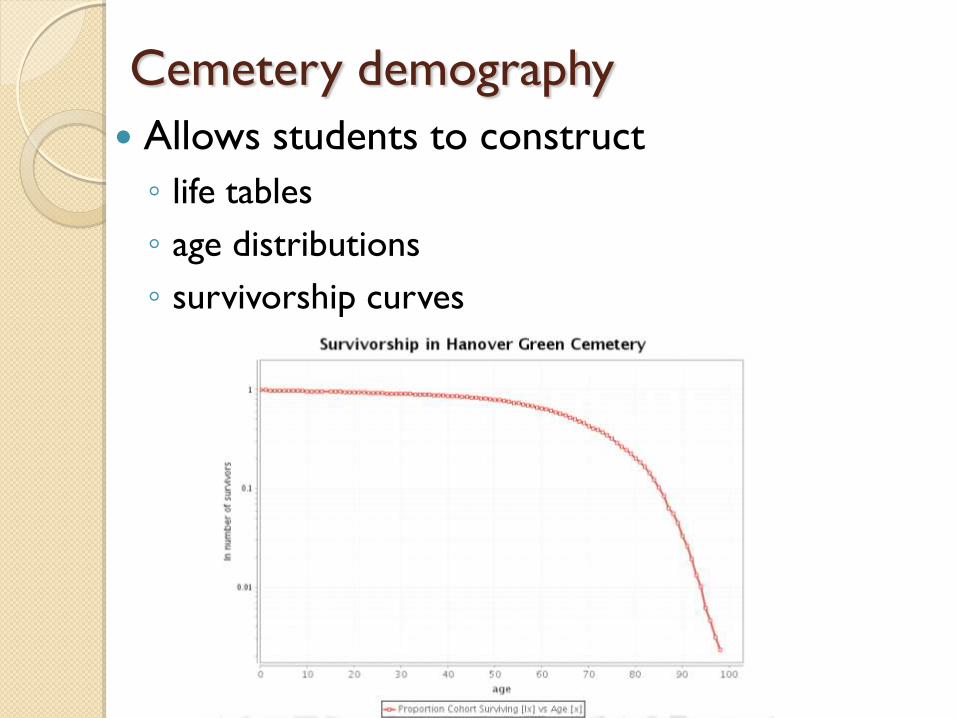
Cemetery demography
Allows students to construct
◦ life tables
◦ age distributions
◦ survivorship curves
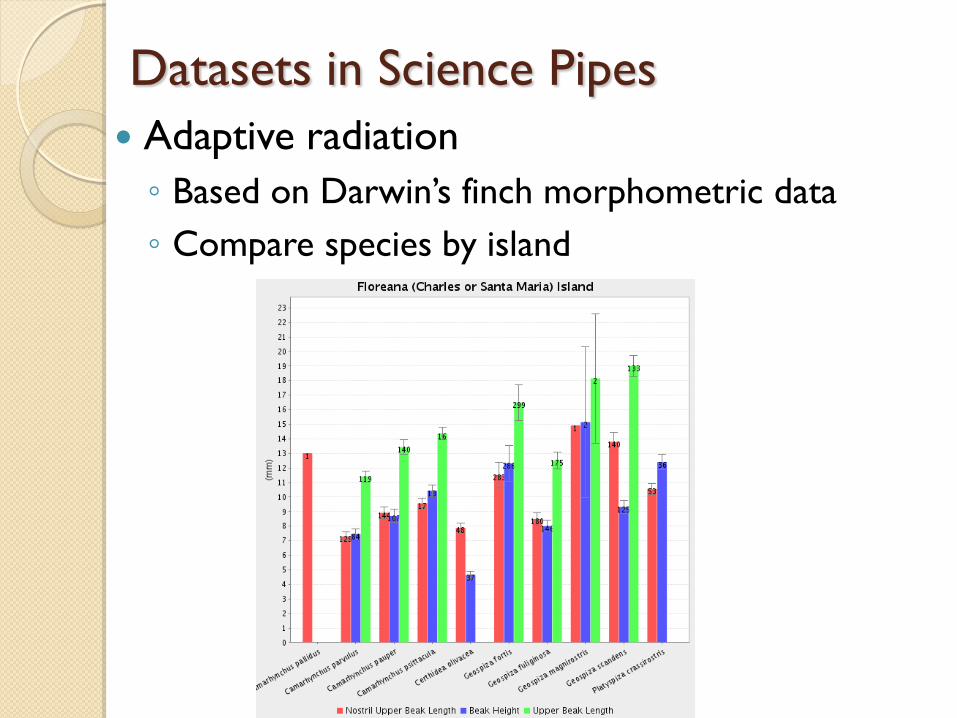
Datasets in Science Pipes
Adaptive radiation
◦ Based on Darwin’s finch morphometric data
◦ Compare species by island
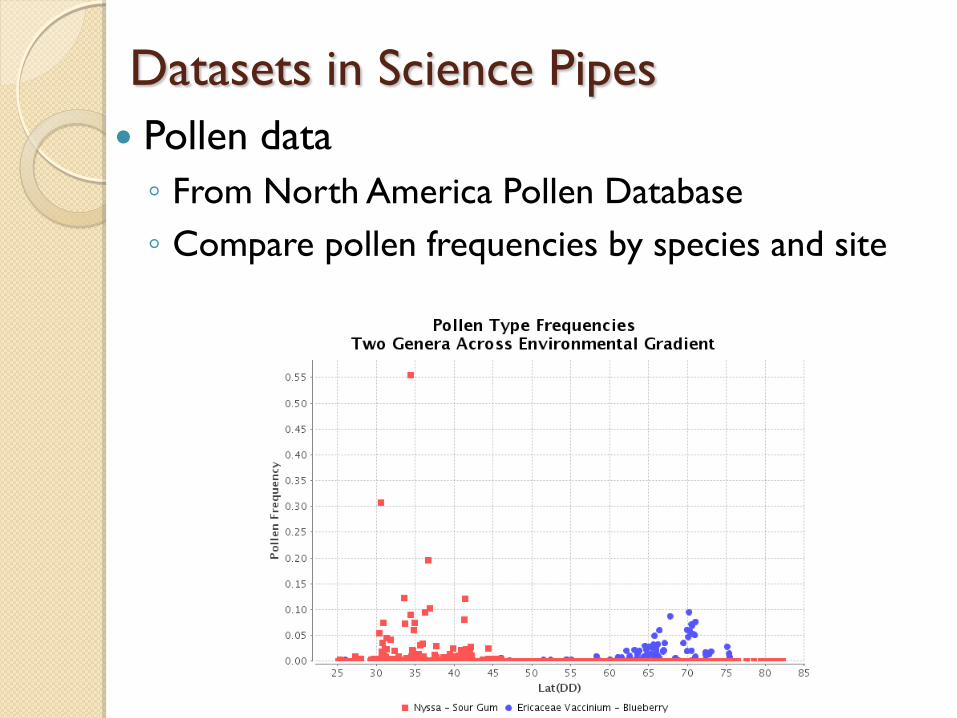
Datasets in Science Pipes
Pollen data
◦ From North America Pollen Database
◦ Compare pollen frequencies by species and site
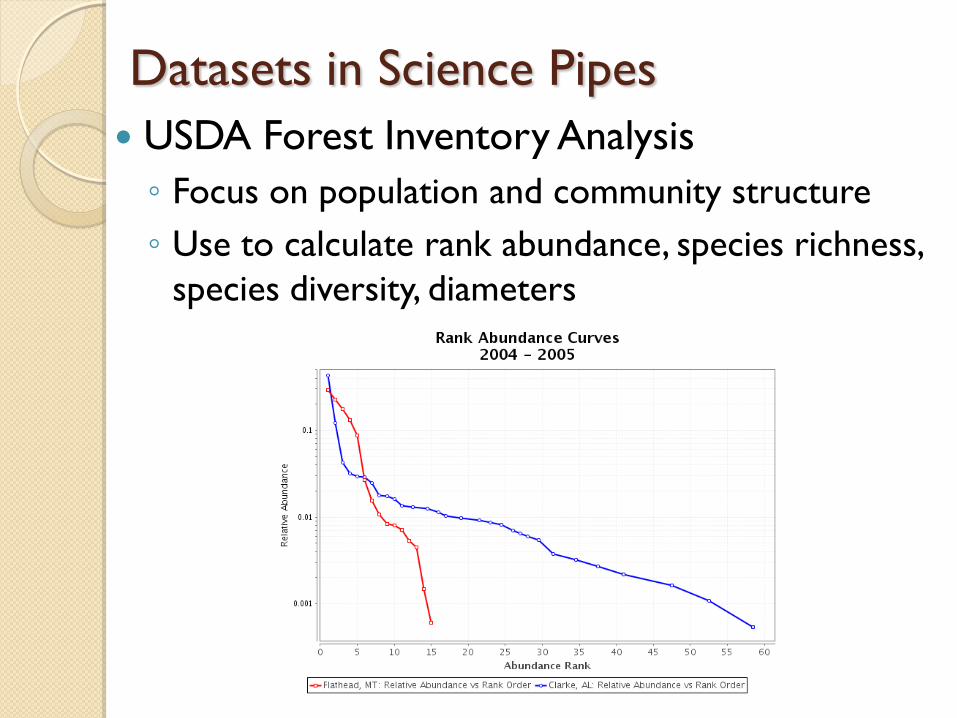
Datasets in Science Pipes
USDA Forest Inventory Analysis
◦ Focus on population and community structure
◦ Use to calculate rank abundance, species richness,
species diversity, diameters


Ideas for future datasets?
http://www.sciencepipes.org
Kenneth M. Klemow, Ph.D.
Chair, ESA Data in Ecology Classroom (DECA) Panel
This project was developed with funding provided by the National
Science Foundation Award, Digital Resource Discovery and
Dynamic Learning Communities for a Changing Biology (DRD) (#
DUE-1044359). We gratefully acknowledge the work of the DECA
Advisory Committee, including Dr. Barbara Abraham, Dr.
Sunshine Brosi, Dr. Beverly J. Brown,Dr. Sam Donovan,Dr.
Shana Ederer, Dr. Denny S. Fernández, Dr. Tom Langen, Dr.
Colleen McLinn, Dr. Bibit Traut, and Dr. Paul Weihe.
Related Documents