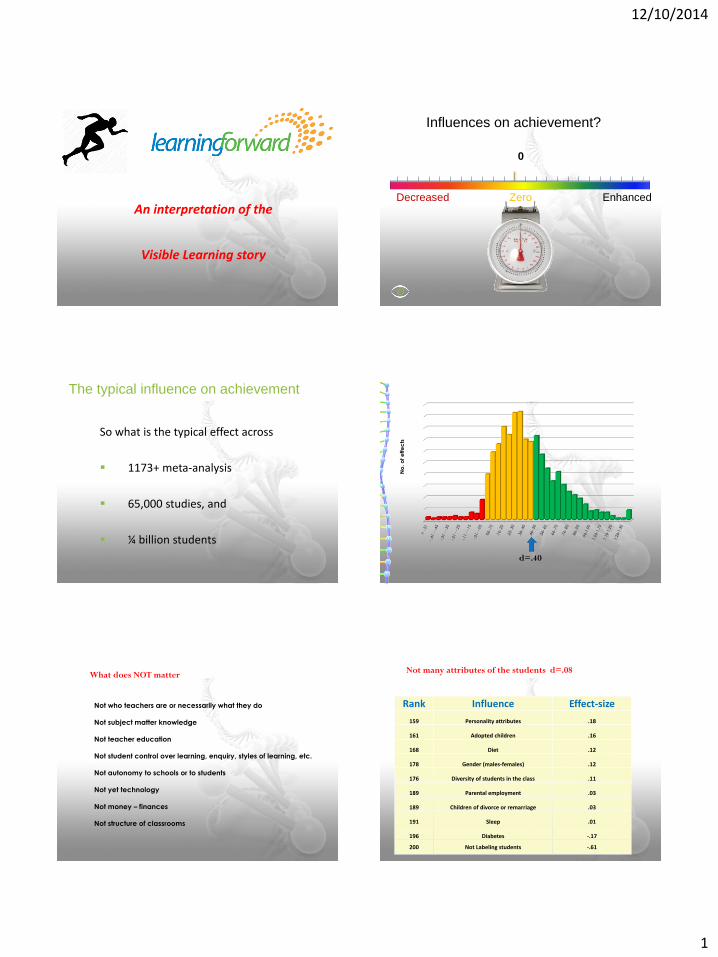
12/10/2014 1 An interpretation of the Visible Learning story 0 Influences on achievement? Decreased Enhanced Zero So what is the typical effect across 1173+ meta-analysis 65,000 studies, and ¼ billion students The typical influence on achievement No. of effects d=.40 Not who teachers are or necessarily what they do Not subject matter knowledge Not teacher education Not student control over learning, enquiry, styles of learning, etc. Not autonomy to schools or to students Not yet technology Not money – finances Not structure of classrooms What does NOT matter Rank Influence Effect-size 159 Personality attributes .18 161 Adopted children .16 168 Diet .12 178 Gender (males-females) .12 176 Diversity of students in the class .11 189 Parental employment .03 189 Children of divorce or remarriage .03 191 Sleep .01 196 Diabetes -.17 200 Not Labeling students -.61 Not many attributes of the students d=.08

Welcome message from author
This document is posted to help you gain knowledge. Please leave a comment to let me know what you think about it! Share it to your friends and learn new things together.
Transcript
12/10/2014
1
An interpretation of the
Visible Learning story
0
Influences on achievement?
Decreased Enhanced Zero
So what is the typical effect across
1173+ meta-analysis
65,000 studies, and
¼ billion students
The typical influence on achievement N
o.
of e
ffe
cts
d=.40
Not who teachers are or necessarily what they do
Not subject matter knowledge
Not teacher education
Not student control over learning, enquiry, styles of learning, etc.
Not autonomy to schools or to students
Not yet technology
Not money – finances
Not structure of classrooms
What does NOT matter
Rank Influence Effect-size
159 Personality attributes .18
161 Adopted children .16
168 Diet .12
178 Gender (males-females) .12
176 Diversity of students in the class .11
189 Parental employment .03
189 Children of divorce or remarriage .03
191 Sleep .01
196 Diabetes -.17
200 Not Labeling students -.61
Not many attributes of the students d=.08

12/10/2014
2
Rank Influence Effect-size 140 Summer school .23
141 Finances .23
142 Religious Schools .23
147 Class size .21
159 Within class grouping .18
171 Ability grouping .12
177 Distance Education .11
179 Changing timetables .09
180 DeTracking .09
183 Charter Schools .07
185 Diversity of students .05
187 Multi-grade/age classes .04
192 Open vs. Traditional .01
194 Welfare Policies -.12
195 Retention (hold back a year) -.13
Not the structure of schools or classes d=.10
Rank Influence Effect-size
146 Teacher verbal ability .22
156 Co-/ Team teaching .19
170 Mentoring .15
175 Teacher education .12
178 Teacher subject matter
knowledge .09
189 Volunteers/Teacher Aides .03
Not who the teachers are d=.13
Rank Influence Effect-size 91 Inquiry based methods .31
136 Values/Moral Education Programs .24
139 Programmed instruction .23
143 Individualized instruction .22
144 Visual/Audio-visual methods .22
164 Matching style of learning .17
168 Problem based learning .15
169 Sentence Combining programs .15
182 Perceptual-Motor programs .08
184 Whole language .06
188 Homework in primary classes .05
Not some programs d=.16
Rank Influence Effect-size
117 CAI in mathematics .30
119 Mobile phones .29
128 Use of PowerPoint .26
138 CAI in Science .23
148 CAI in small groups .21
158 Web based learning .18
186 CAI in distance education .01
163 Web based learning .18
Not the technology (yet) d=.22
0.00
0.10
0.20
0.30
0.40
0.50
0.60
19
77
19
79
19
80
19
81
19
82
19
83
19
84
19
85
19
86
19
87
19
88
19
89
19
90
19
91
19
92
19
93
19
94
19
95
19
96
19
97
19
99
20
00
20
01
20
02
20
03
20
04
20
05
20
06
20
07
20
08
20
09
20
10
20
11
20
12
20
13
Computer related effect-size by year of publication
• When teachers SEE learning through the eyes of the
student
& when students SEE themselves as their own teachers
12/10/2014
3
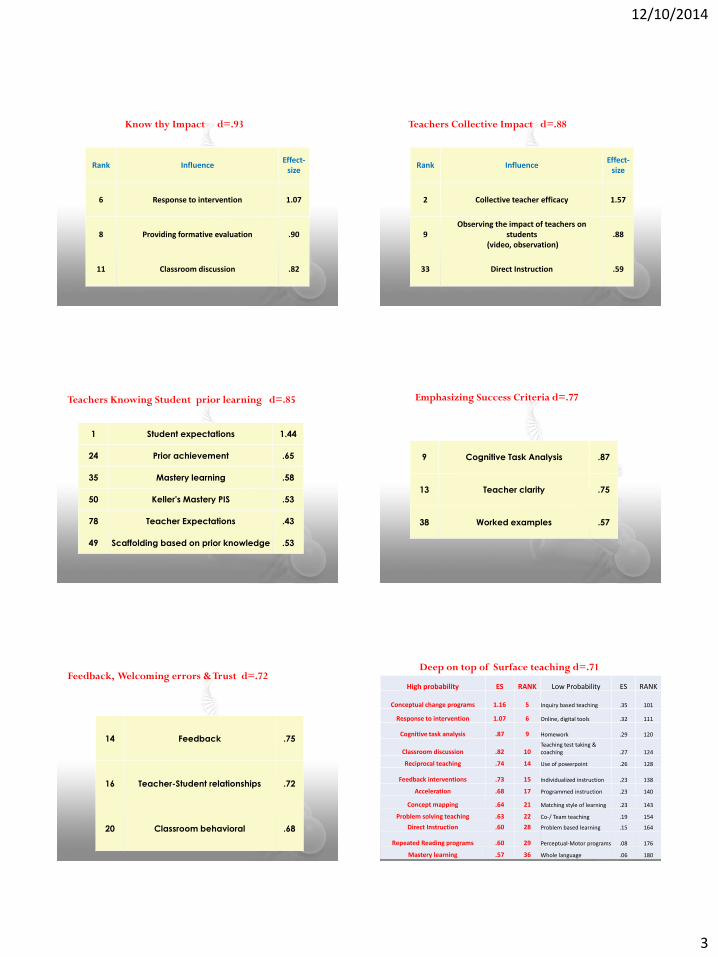
Rank Influence Effect-
size
6 Response to intervention 1.07
8 Providing formative evaluation .90
11 Classroom discussion .82
Know thy Impact d=.93
Rank Influence Effect-
size
2 Collective teacher efficacy 1.57
9 Observing the impact of teachers on
students (video, observation)
.88
33 Direct Instruction .59
Teachers Collective Impact d=.88
Teachers Knowing Student prior learning d=.85
1 Student expectations 1.44
24 Prior achievement .65
35 Mastery learning .58
50 Keller's Mastery PIS .53
78 Teacher Expectations .43
49 Scaffolding based on prior knowledge .53
10 Cognitive Task Analysis 0.87
7 Teacher credibility 0.90
13 Teacher clarity 0.75
38 Worked examples 0.57
9 Cognitive Task Analysis .87
13 Teacher clarity .75
38 Worked examples .57
Emphasizing Success Criteria d=.77
14 Feedback .75
16 Teacher-Student relationships .72
20 Classroom behavioral .68
Feedback, Welcoming errors & Trust d=.72 High probability ES RANK Low Probability ES RANK
Conceptual change programs 1.16 5 Inquiry based teaching .35 101
Response to intervention 1.07 6 Online, digital tools .32 111
Cognitive task analysis .87 9 Homework .29 120
Classroom discussion .82 10 Teaching test taking & coaching .27 124
Reciprocal teaching .74 14 Use of powerpoint .26 128
Feedback interventions .73 15 Individualized instruction .23 138
Acceleration .68 17 Programmed instruction .23 140
Concept mapping .64 21 Matching style of learning .23 143
Problem solving teaching .63 22 Co-/ Team teaching .19 154
Direct Instruction .60 28 Problem based learning .15 164
Repeated Reading programs .60 29 Perceptual-Motor programs .08 176
Mastery learning .57 36 Whole language .06 180
Deep on top of Surface teaching d=.71

12/10/2014
4
17 Spaced vs. Mass Practice .71
22 Repeated Reading programs .67
64 Concentration/Persistence/Engagement .48
Teaching deliberate practice d=.62
19 Acceleration .68
53 Outdoor/ Adventure Programs .52
58 Goals (High challenge vs. Do your best) .50
High levels of challenge d=.57
The narrative of passion, teaching, and promoting the
language of learning
1. Teachers, working together, as evaluators of their impact .93
2. The power of moving from what students know now
towards explicit success criteria .77
3. Errors and trust are welcomed as opportunities to learn .72
4. Maximize feedback to teachers about their impact .72
5. Getting the proportion of surface to deep correct .71
6. The Goldilocks principles of challenge, and deliberate practice to
attain these challenges .60
Do you know your impact?
Learning strategies 90+% are surface
Teacher questions 90+% are surface
Lesson observations 90+% are surface
Test analyses 90+% are surface
Visible Learning 90+% are surface
We privilege a grammar
of surface learning
The three IMPACT questions
1. What is impact? What is the l
of your schools’ main message
Growth and Achievement
12/10/2014
5
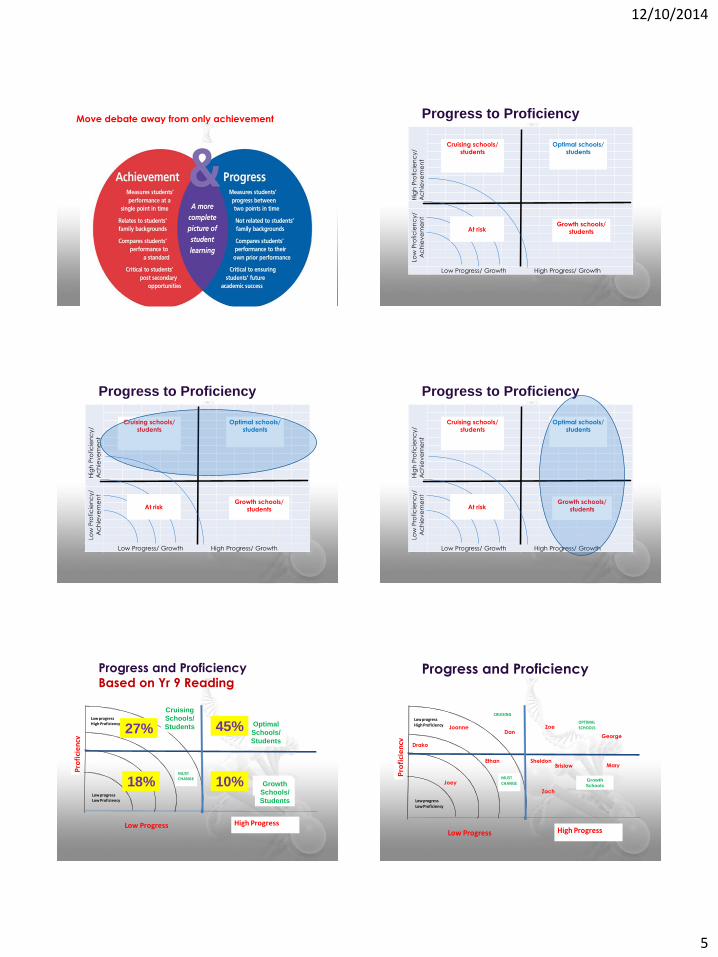
Move debate away from only achievement
Hig
h P
rofic
ien
cy/
Ac
hie
ve
me
nt
Low
Pro
fic
ien
cy/
Ac
hie
ve
me
nt
Low Progress/ Growth High Progress/ Growth
Cruising schools/
students
Optimal schools/
students
Growth schools/
students
Progress to Proficiency
At risk
Hig
h P
rofic
ien
cy/
Ac
hie
ve
me
nt
Low
Pro
fic
ien
cy/
Ac
hie
ve
me
nt
Low Progress/ Growth High Progress/ Growth
Cruising schools/
students
Optimal schools/
students
Growth schools/
students At risk
Progress to Proficiency
Hig
h P
rofic
ien
cy/
Ac
hie
ve
me
nt
Low
Pro
fic
ien
cy/
Ac
hie
ve
me
nt
Low Progress/ Growth High Progress/ Growth
Cruising schools/
students
Optimal schools/
students
Growth schools/
students At risk
Progress to Proficiency
Progress and Proficiency
Based on Yr 9 Reading
Low Progress High Progress
Pro
fici
en
cy
Low progressLow Proficiency
Low progressHigh Proficiency
CRUISING
MUST CHANGE
OPTIMALSCHOOLS
HIGH PROGRESSNOW ATTAINMENTGrowth
Schools Growth
Schools/
Students
Optimal
Schools/
Students
Cruising
Schools/
Students 27% 45%
18% 10%
Progress and Proficiency
Low Progress High Progress
Pro
fici
en
cy
Low progressLow Proficiency
Low progressHigh Proficiency
CRUISING
MUST CHANGE
OPTIMALSCHOOLS
HIGH PROGRESSNOW ATTAINMENT
Growth
Schools
Zoe
Brislow
Drako
Ethan Sheldon
George Dan
Mary
Joanne
Zach
Joey

12/10/2014
6
A new grammar of schooling - Surface to Deep 2. What is magnitude of impact?
No
. o
f e
ffe
cts
d=.40
3. What is pervasiveness of impact?
Mind frame for Impact
I am an evaluator
Thanks
Related Documents