THE SCIENCE OF FEELING GOOD & FEELING BAD WITH ALCOHOL Professor David W. Craig Department of Chemistry Hobart and William Smith Colleges 7:30 – 8:30 pm Tuesday, October 17, 2006 Geneva Room Alcohol Awareness Week Lecture Series

Welcome message from author
This document is posted to help you gain knowledge. Please leave a comment to let me know what you think about it! Share it to your friends and learn new things together.
Transcript
THE SCIENCE OFFEELING GOOD & FEELING BAD
WITH ALCOHOLProfessor David W. CraigDepartment of Chemistry
Hobart and William Smith Colleges
7:30 – 8:30 pmTuesday, October 17, 2006
Geneva Room
Alcohol Awareness WeekLecture Series
Behavioral and Sensation Manifestations of Alcohol Ingestion
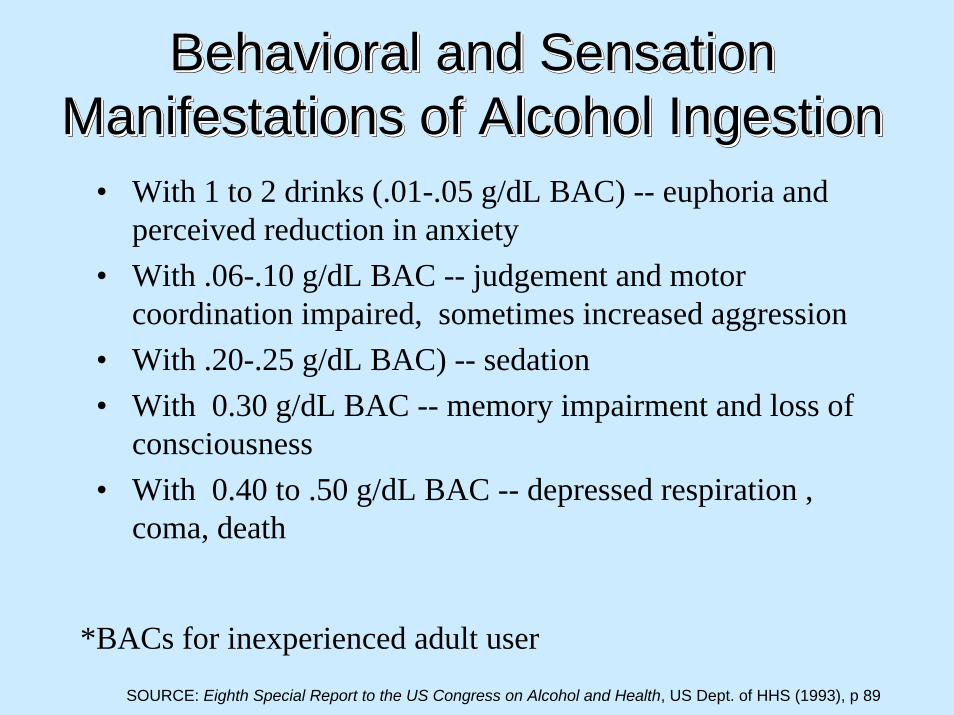
Behavioral and Sensation Behavioral and Sensation Manifestations of Alcohol IngestionManifestations of Alcohol Ingestion
• With 1 to 2 drinks (.01-.05 g/dL BAC) -- euphoria and perceived reduction in anxiety
• With .06-.10 g/dL BAC -- judgement and motor coordination impaired, sometimes increased aggression
• With .20-.25 g/dL BAC) -- sedation• With 0.30 g/dL BAC -- memory impairment and loss of
consciousness• With 0.40 to .50 g/dL BAC -- depressed respiration ,
coma, death
*BACs for inexperienced adult userSOURCE: Eighth Special Report to the US Congress on Alcohol and Health, US Dept. of HHS (1993), p 89
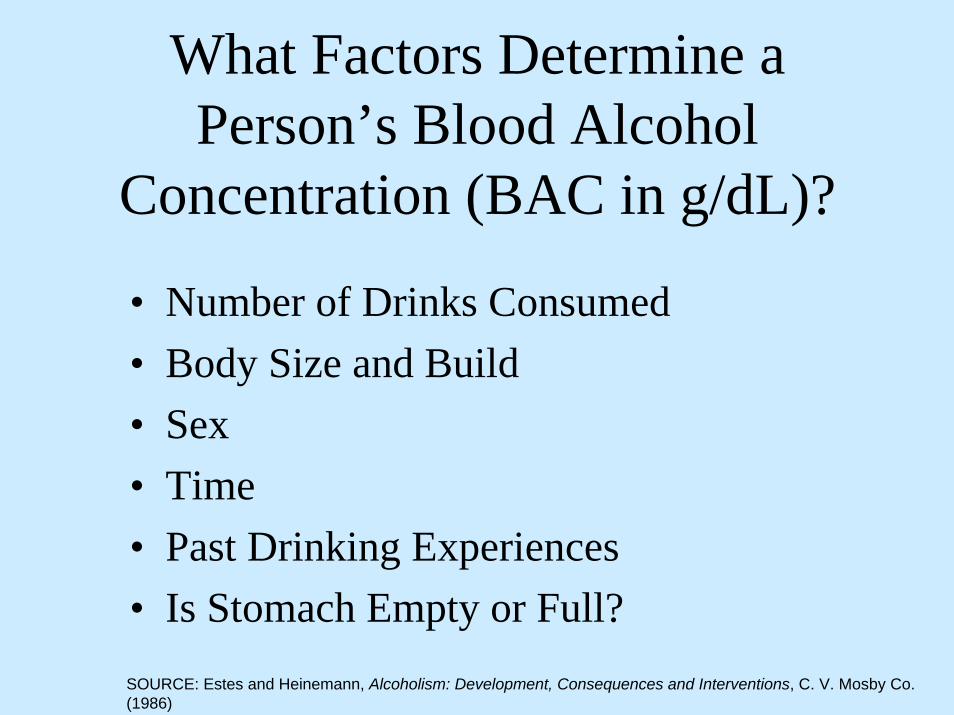
What Factors Determine a Person’s Blood Alcohol
Concentration (BAC in g/dL)?
• Number of Drinks Consumed• Body Size and Build• Sex• Time• Past Drinking Experiences• Is Stomach Empty or Full?SOURCE: Estes and Heinemann, Alcoholism: Development, Consequences and Interventions, C. V. Mosby Co. (1986)
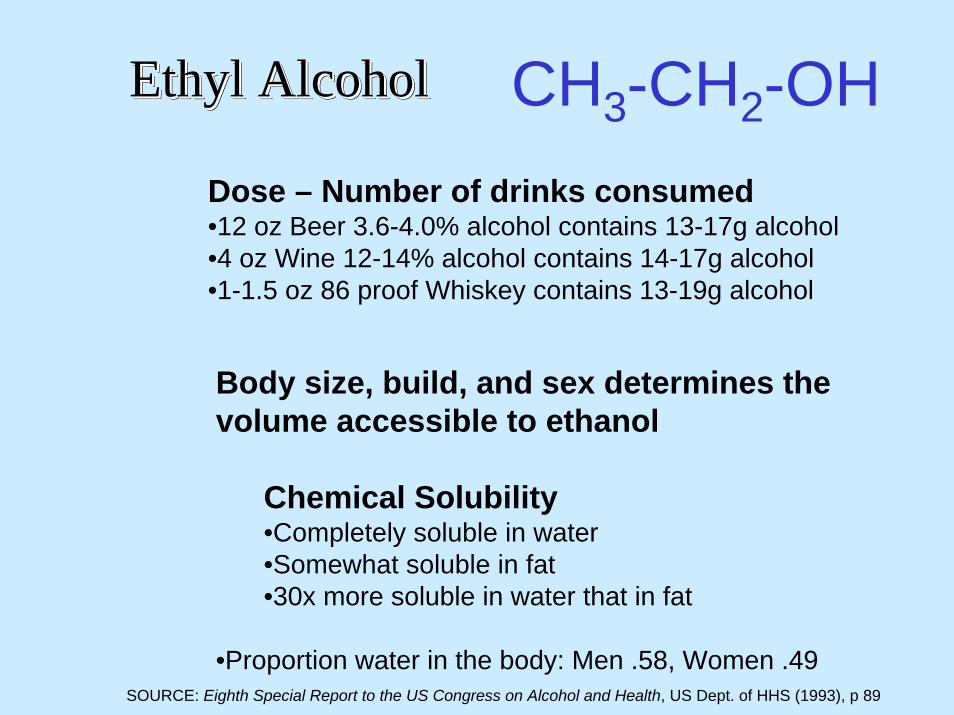
Ethyl AlcoholEthyl AlcoholEthyl Alcohol CH3-CH2-OHDose – Number of drinks consumed•12 oz Beer 3.6-4.0% alcohol contains 13-17g alcohol•4 oz Wine 12-14% alcohol contains 14-17g alcohol•1-1.5 oz 86 proof Whiskey contains 13-19g alcohol
Body size, build, and sex determines the volume accessible to ethanol
Chemical Solubility•Completely soluble in water•Somewhat soluble in fat•30x more soluble in water that in fat
•Proportion water in the body: Men .58, Women .49SOURCE: Eighth Special Report to the US Congress on Alcohol and Health, US Dept. of HHS (1993), p 89

Time – How rapidly can ethanol be absorbed?
• Rate of absorption is dependent on:– concentration gradient between gut and blood– surface area of contact– degree of vascularization
• Effect of Food on Absorption– food dilutes alcohol in the digestive system– fatty foods are slow to digest and slow to move
from the stomach to the small intestine
SOURCE: Estes and Heinemann, Alcoholism: Development, Consequences and Interventions, C. V. Mosby Co. (1986)
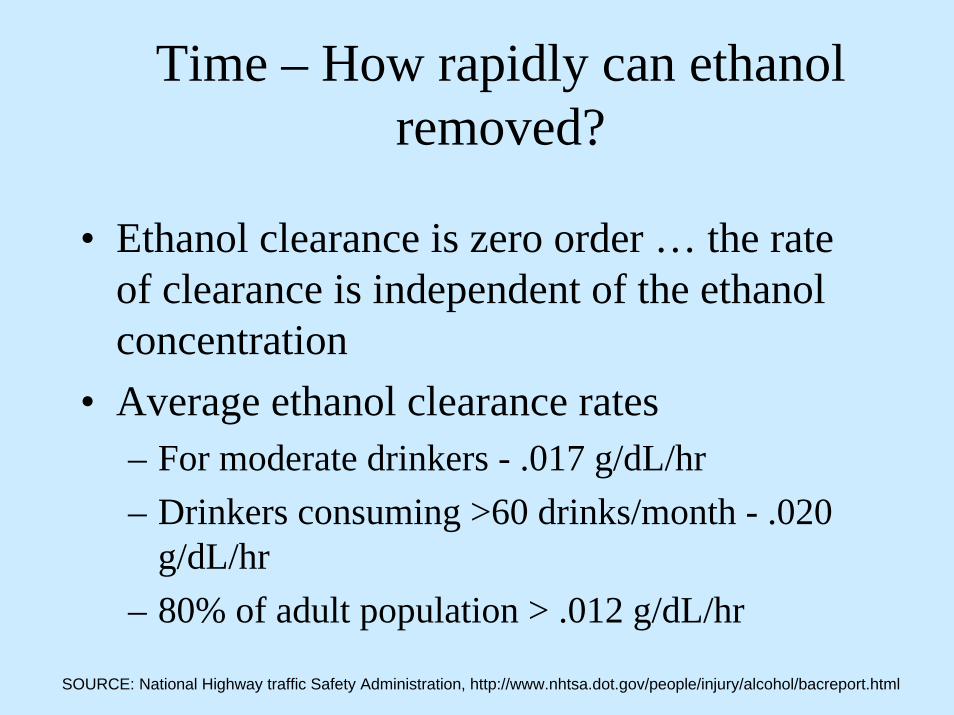
Time – How rapidly can ethanol removed?
• Ethanol clearance is zero order … the rate of clearance is independent of the ethanol concentration
• Average ethanol clearance rates– For moderate drinkers - .017 g/dL/hr– Drinkers consuming >60 drinks/month - .020
g/dL/hr– 80% of adult population > .012 g/dL/hr
SOURCE: National Highway traffic Safety Administration, http://www.nhtsa.dot.gov/people/injury/alcohol/bacreport.html
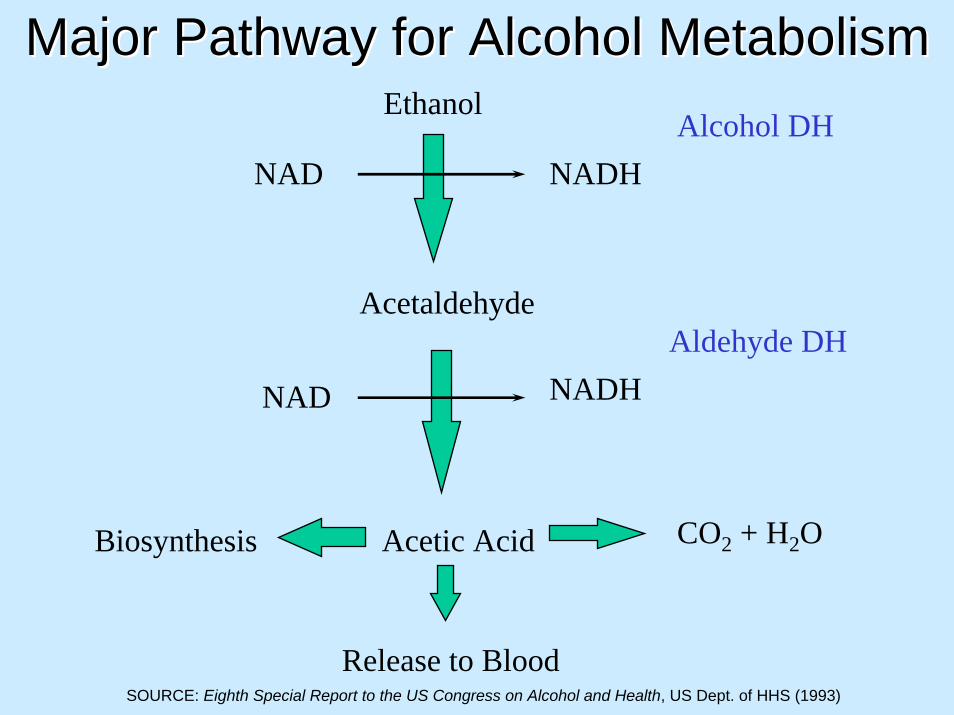
Acetaldehyde
Acetic Acid CO2 + H2OBiosynthesis
Release to Blood
Ethanol
NAD NADHAlcohol DH
NAD NADHAldehyde DH
Major Pathway for Alcohol MetabolismMajor Pathway for Alcohol Metabolism
SOURCE: Eighth Special Report to the US Congress on Alcohol and Health, US Dept. of HHS (1993)
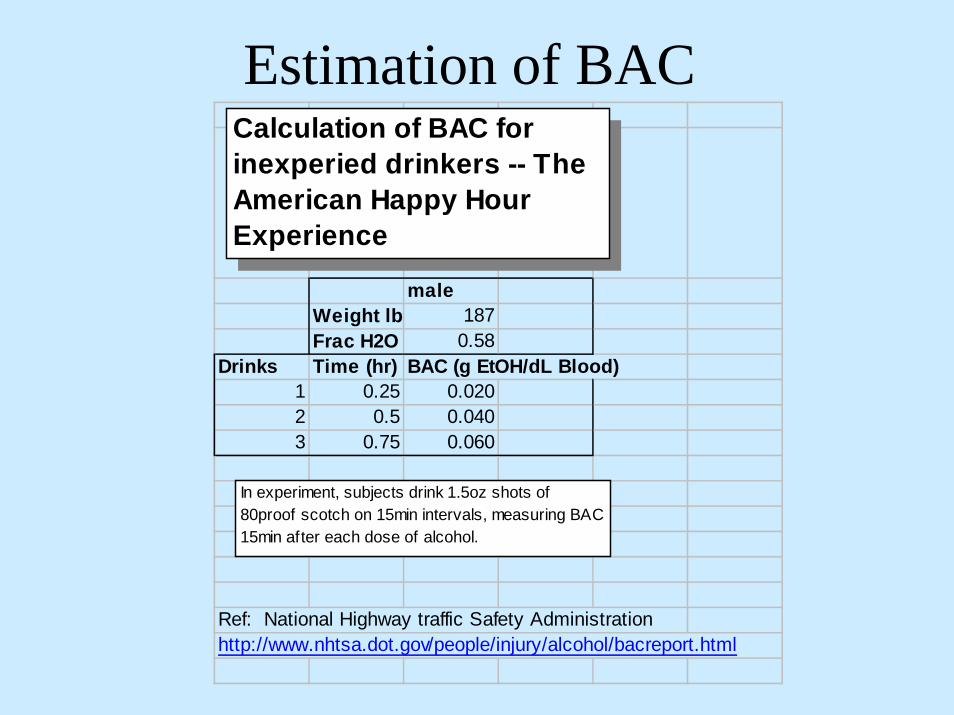
Estimation of BAC
maleWeight lb 187Frac H2O 0.58
Drinks Time (hr) BAC (g EtOH/dL Blood)1 0.25 0.0202 0.5 0.0403 0.75 0.060
Ref: National Highway traffic Safety Administrationhttp://www.nhtsa.dot.gov/people/injury/alcohol/bacreport.html
Calculation of BAC for inexperied drinkers -- The American Happy Hour Experience
In experiment, subjects drink 1.5oz shots of 80proof scotch on 15min intervals, measuring BAC 15min after each dose of alcohol.
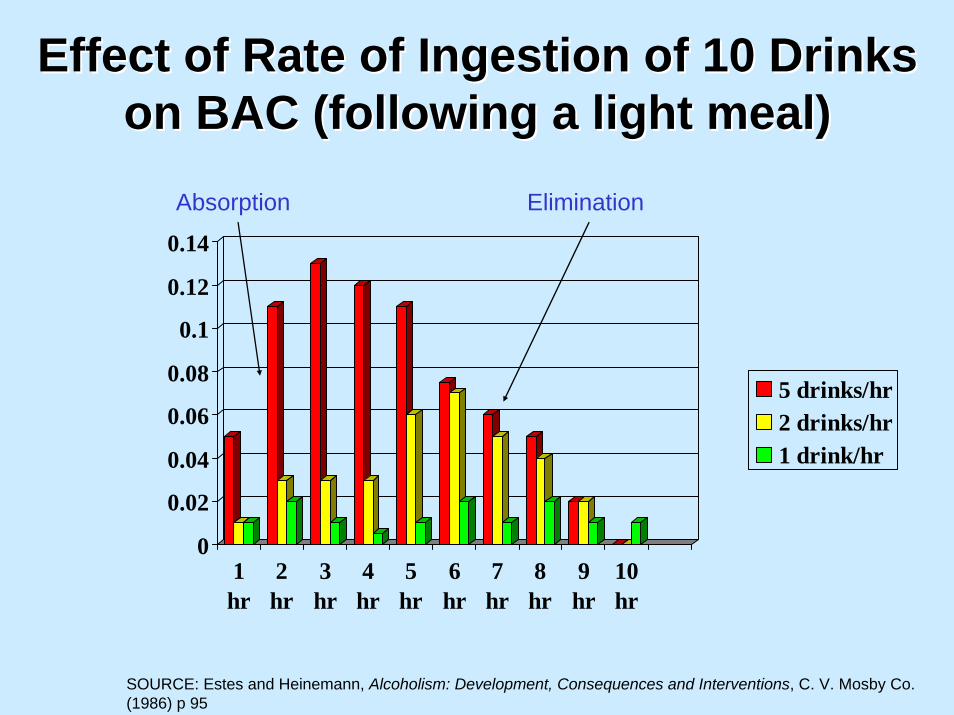
Effect of Rate of Ingestion of 10 Drinks Effect of Rate of Ingestion of 10 Drinks on BAC (following a light meal)on BAC (following a light meal)
0
0.02
0.04
0.06
0.08
0.1
0.12
0.14
1hr
2hr
3hr
4hr
5hr
6hr
7hr
8hr
9hr
10hr
5 drinks/hr2 drinks/hr1 drink/hr
Absorption Elimination
SOURCE: Estes and Heinemann, Alcoholism: Development, Consequences and Interventions, C. V. Mosby Co. (1986) p 95
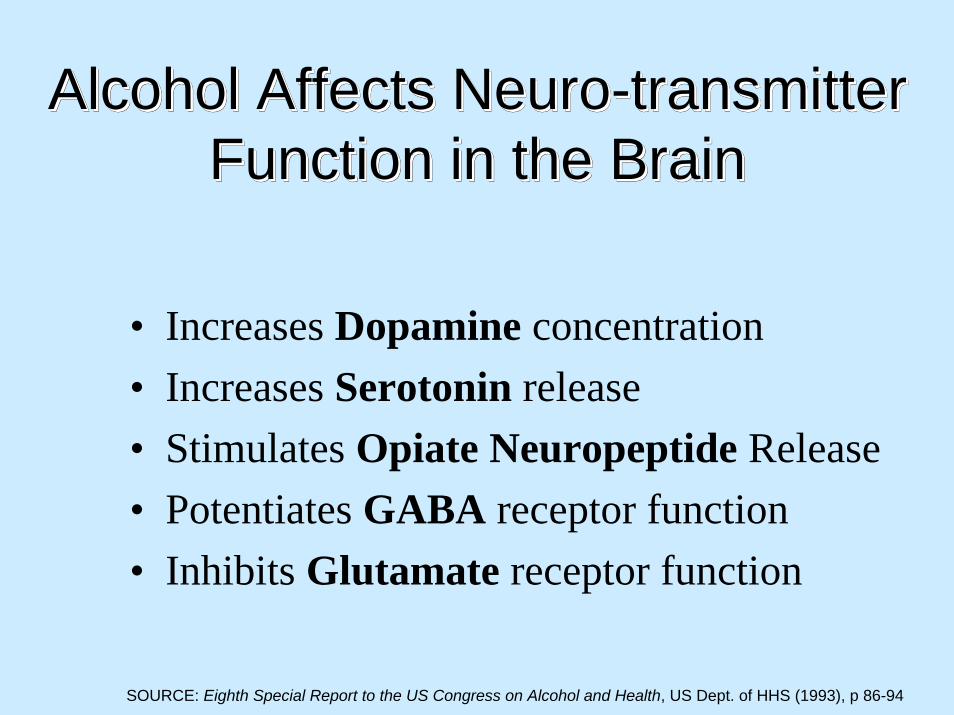
Alcohol Affects Neuro-transmitter Function in the Brain
Alcohol Affects Alcohol Affects NeuroNeuro--transmitter transmitter Function in the BrainFunction in the Brain
• Increases Dopamine concentration• Increases Serotonin release• Stimulates Opiate Neuropeptide Release• Potentiates GABA receptor function• Inhibits Glutamate receptor function
SOURCE: Eighth Special Report to the US Congress on Alcohol and Health, US Dept. of HHS (1993), p 86-94
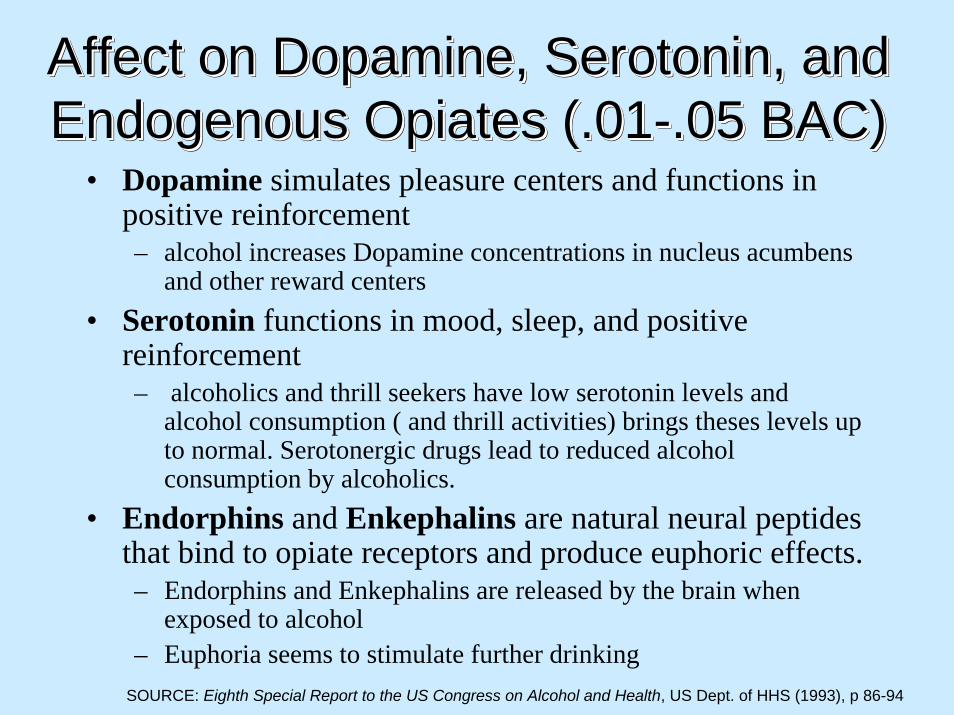
Affect on Dopamine, Serotonin, and Endogenous Opiates (.01-.05 BAC)Affect on Dopamine, Serotonin, and Affect on Dopamine, Serotonin, and Endogenous Opiates (.01Endogenous Opiates (.01--.05 BAC).05 BAC)
• Dopamine simulates pleasure centers and functions in positive reinforcement– alcohol increases Dopamine concentrations in nucleus acumbens
and other reward centers• Serotonin functions in mood, sleep, and positive
reinforcement– alcoholics and thrill seekers have low serotonin levels and
alcohol consumption ( and thrill activities) brings theses levels up to normal. Serotonergic drugs lead to reduced alcohol consumption by alcoholics.
• Endorphins and Enkephalins are natural neural peptides that bind to opiate receptors and produce euphoric effects.– Endorphins and Enkephalins are released by the brain when
exposed to alcohol– Euphoria seems to stimulate further drinking
SOURCE: Eighth Special Report to the US Congress on Alcohol and Health, US Dept. of HHS (1993), p 86-94
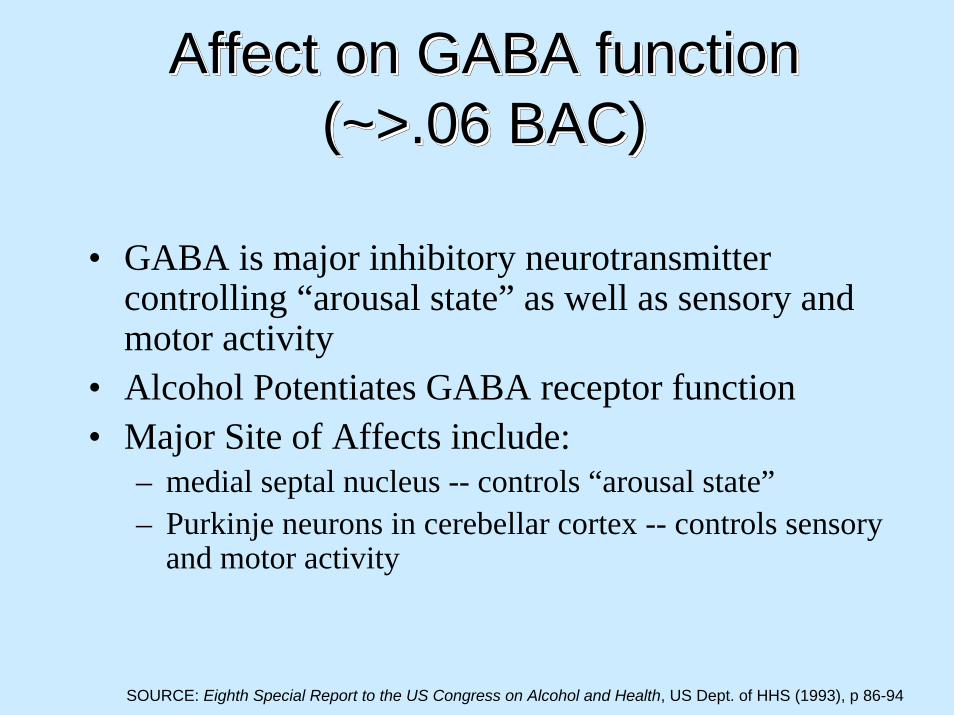
Affect on GABA function(~>.06 BAC)
Affect on GABA functionAffect on GABA function(~>.06 BAC)(~>.06 BAC)
• GABA is major inhibitory neurotransmitter controlling “arousal state” as well as sensory and motor activity
• Alcohol Potentiates GABA receptor function• Major Site of Affects include:
– medial septal nucleus -- controls “arousal state”– Purkinje neurons in cerebellar cortex -- controls sensory
and motor activity
SOURCE: Eighth Special Report to the US Congress on Alcohol and Health, US Dept. of HHS (1993), p 86-94
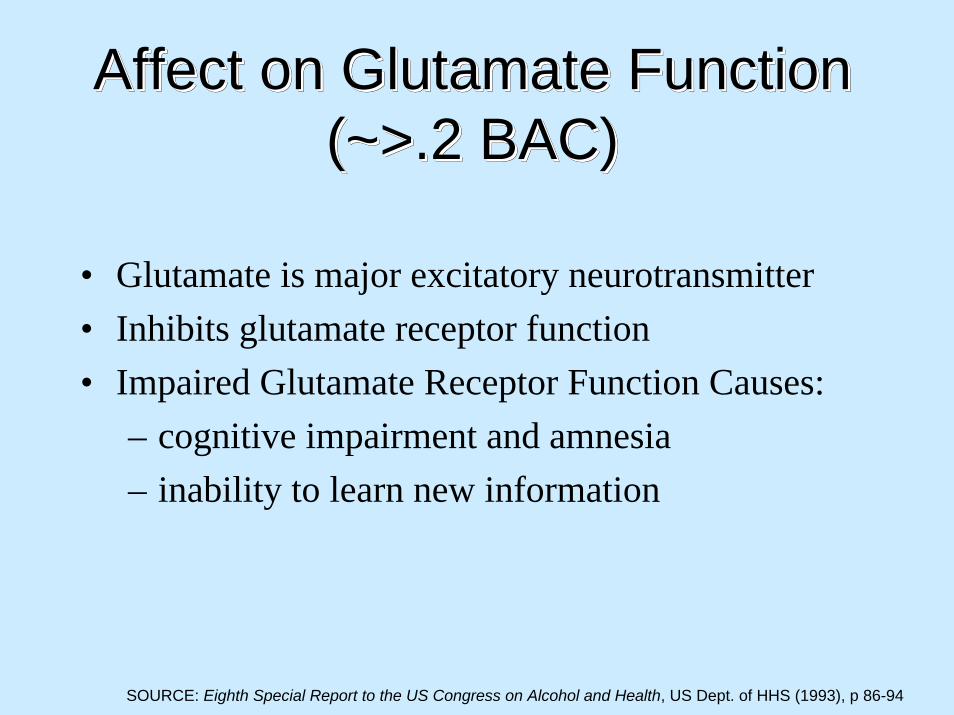
Affect on Glutamate Function (~>.2 BAC)
Affect on Glutamate Function Affect on Glutamate Function (~>.2 BAC)(~>.2 BAC)
• Glutamate is major excitatory neurotransmitter• Inhibits glutamate receptor function• Impaired Glutamate Receptor Function Causes:
– cognitive impairment and amnesia– inability to learn new information
SOURCE: Eighth Special Report to the US Congress on Alcohol and Health, US Dept. of HHS (1993), p 86-94

Alcohol and Sex• Physiological responses
– Erections slower to rise and quicker to fall– Reduction in vaginal lubrication
• Psychological Perceptions– 45% of men and 68% of women say alcohol enhances
sexual enjoyment
• Rutgers study (2-3 standard drinks)– Subjects who thought they drank alcohol were most
highly aroused (those that did not actually get alcohol were slightly less aroused)
– Subjects who expected tonic but actually got alcohol were less aroused than those that expected alcohol but did not.
SOURCE: Braun, Stephen, Buzz: The Science and Lore of Alcohol and Caffeine, Penguin Books, 1996.

Effect of Chronic UseEffect of Chronic UseEffect of Chronic Use• Tolerance
– Functional Tolerance -- changes in number and type GABA and Glutamate receptors
– Acute Tolerance -- occurs within a drinking session– Metabolic Tolerance
• Withdrawal– increased Anxiety within hours -- GABA– seizures -- Glutamate
• Dependence– changes in Dopamine and Serotonin function appear to
be long lasting
SOURCE: Eighth Special Report to the US Congress on Alcohol and Health, US Dept. of HHS (1993), p 94-100Alcohol Alert, 28, National Institute on Alcohol Abuse and Alcoholism, (1995)

What Causes a Hangover?• Pounding Headache
– Caused by reduced blood pressure in cranial vessels• General Lethargy
– Caused by buildup of lactic acid and acidosis by release of acetic acid
• Hypersensitivity to Light and Sound– Alcohol withdrawal leads to increased excitability,
depressed mood, and sensitivity to stimuli• Queasy Stomach
– Empty stomach, overly acidic– Also due to withdrawal
• What about taking a drink to relieve hangover symptoms?SOURCE: Braun, Stephen, Buzz: The Science and Lore of Alcohol and Caffeine, Penguin Books, 1996.
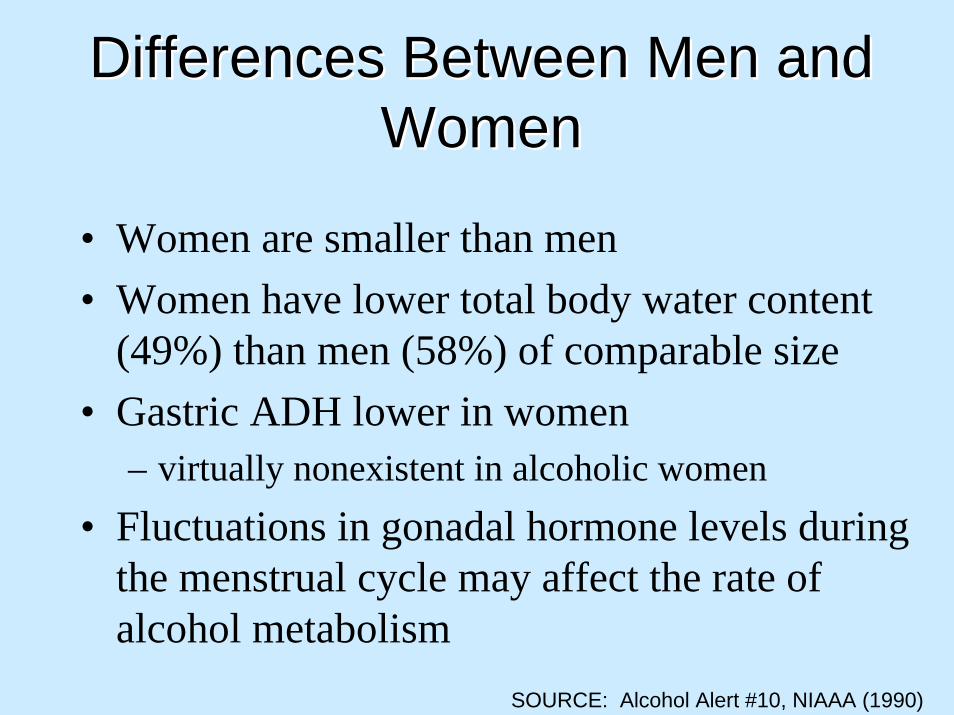
• Women are smaller than men• Women have lower total body water content
(49%) than men (58%) of comparable size• Gastric ADH lower in women
– virtually nonexistent in alcoholic women• Fluctuations in gonadal hormone levels during
the menstrual cycle may affect the rate of alcohol metabolism
SOURCE: Alcohol Alert #10, NIAAA (1990)
Differences Between Men and Differences Between Men and WomenWomen
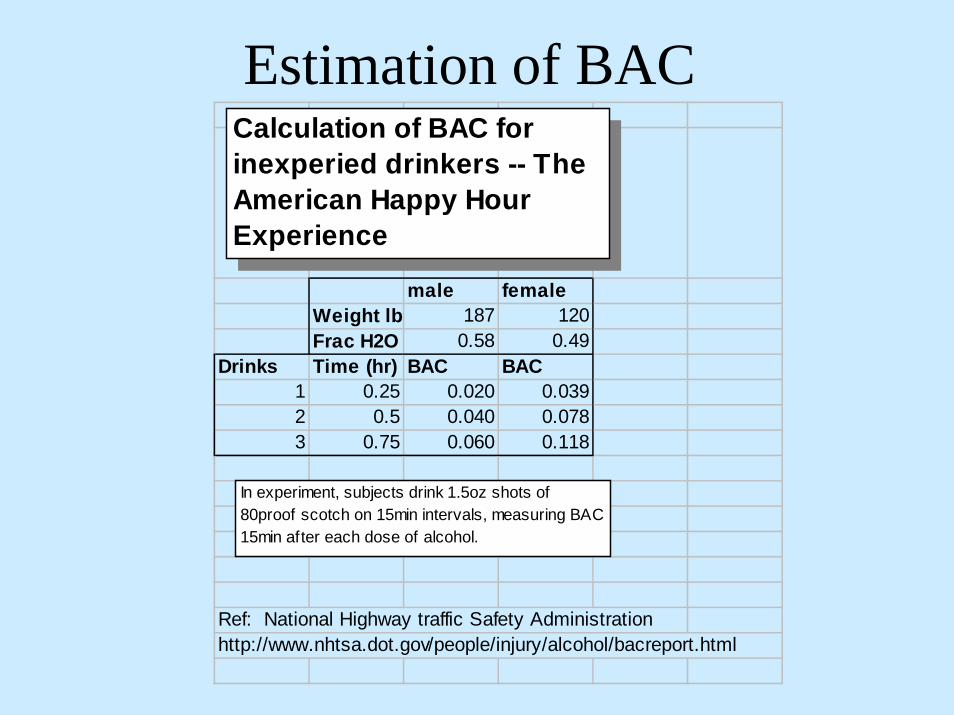
Estimation of BAC
male femaleWeight lb 187 120Frac H2O 0.58 0.49
Drinks Time (hr) BAC BAC1 0.25 0.020 0.0392 0.5 0.040 0.0783 0.75 0.060 0.118
Ref: National Highway traffic Safety Administrationhttp://www.nhtsa.dot.gov/people/injury/alcohol/bacreport.html
Calculation of BAC for inexperied drinkers -- The American Happy Hour Experience
In experiment, subjects drink 1.5oz shots of 80proof scotch on 15min intervals, measuring BAC 15min after each dose of alcohol.
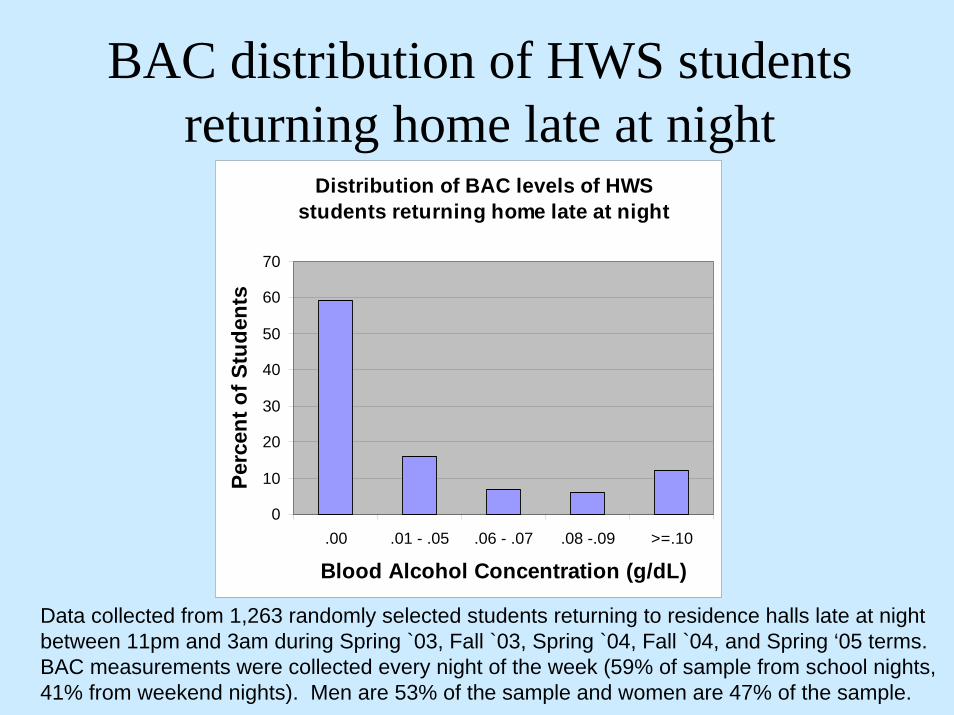
BAC distribution of HWS students returning home late at night
Distribution of BAC levels of HWS students returning home late at night
0
10
20
30
40
50
60
70
.00 .01 - .05 .06 - .07 .08 -.09 >=.10
Blood Alcohol Concentration (g/dL)
Perc
ent o
f Stu
dent
s
Data collected from 1,263 randomly selected students returning to residence halls late at night between 11pm and 3am during Spring `03, Fall `03, Spring `04, Fall `04, and Spring ‘05 terms. BAC measurements were collected every night of the week (59% of sample from school nights, 41% from weekend nights). Men are 53% of the sample and women are 47% of the sample.
BAC distribution of HWS students returning home late at night
Distribution of BAC levels of HWS students returning home late at night
0
10
20
30
40
50
60
70
80
90
.00 .01 - .05 .06 - .07 .08 -.09 >=.10
Blood Alcohol Concentration (g/dL)
Perc
ent o
f Stu
dent
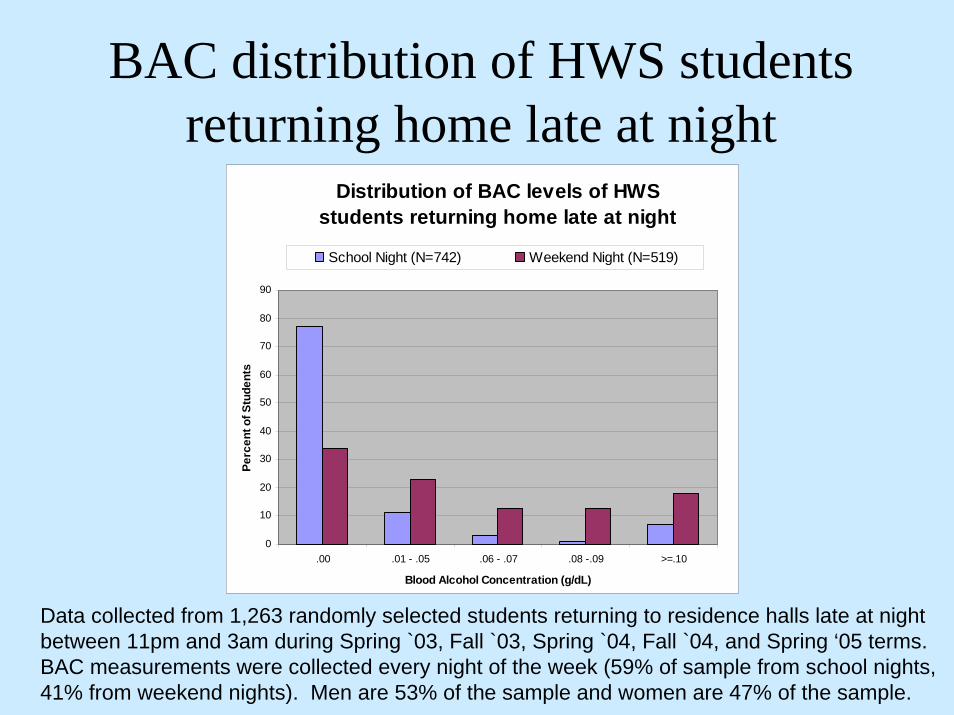
sSchool Night (N=742) Weekend Night (N=519)
Data collected from 1,263 randomly selected students returning to residence halls late at night between 11pm and 3am during Spring `03, Fall `03, Spring `04, Fall `04, and Spring ‘05 terms. BAC measurements were collected every night of the week (59% of sample from school nights, 41% from weekend nights). Men are 53% of the sample and women are 47% of the sample.

BAC distribution of HWS students returning home late at night
Data collected from 1,263 randomly selected students returning to residence halls late at night between 11pm and 3am during Spring `03, Fall `03, Spring `04, Fall `04, and Spring ‘05 terms. BAC measurements were collected every night of the week (59% of sample from school nights, 41% from weekend nights). Men are 53% of the sample and women are 47% of the sample.
Distribution of BAC levels of HWS students returning home late at night
0
10
20
30
40
50
60
70
.00 .01 - .05 .06 - .07 .08 -.09 >=.10
Blood Alcohol Concentration (g/dL)
Perc
ent o
f Stu
dent
sMales (N=665) Females (N=583)
Related Documents