Geophys. J. Int. (2011) 187, 1076–1088 doi: 10.1111/j.1365-246X.2011.05198.x GJI Geodynamics and tectonics The S˜ ao Vicente earthquake of 2008 April and seismicity in the continental shelf off SE Brazil: further evidence for flexural stresses M. Assumpc ¸˜ ao, 1 J. C. Dourado, 2 L. C. Ribotta, 3 W. U. Mohriak, 4, * F´ abio L. Dias 1 and J. R. Barbosa 1 1 IAG, University of S˜ ao Paulo, Rua do Mat˜ ao 1226,S˜ ao Paulo, SP, 05508–090, Brazil. E-mail: [email protected] 2 IGCE- UNESP, State University of S˜ ao Paulo, Av. 24-A 1515,Rio Claro, SP, 13506-900, Brazil 3 IPT, Technological Research Institute, S˜ ao Paulo, SP, 05508-901, Brazil 4 Petrobras, Rio de Janeiro, RJ, Brazil Accepted 2011 August 21. Received 2011 August 14; in original form 2011 March 30 SUMMARY The continental margin and shelf of most stable intraplate regions tend to be relatively more seismically active than the continental interior. In the southeast continental margin of Brazil, a seismic zone extends from Rio Grande do Sul to Esp´ ırito Santo, with seismic activity occurring mainly along the continental slope and suggesting a close relationship with flexural stresses caused by the weight of the sediments. In this region, earthquakes with magnitudes larger than 5 m b occur every 20–25 yr, on average. The focal mechanism solutions of previous earthquakes in this zone indicated reverse faulting on planes dipping approximately 45 ◦ with horizontal P-axes. The recent 5.2 m b earthquake of 2008 April 23 occurred 125 km south of S˜ ao Vicente and was well recorded by many stations in SE Brazil, as well as at teleseismic distances in North America and Africa. Its focal depth was 17 km, locating the hypocentre in the lower crust. A well-determined focal mechanism solution shows one vertical nodal plane and one subhorizontal nodal plane. The P- and T -axes exhibit large dips, which were confirmed by a regional moment tensor inversion. This unusual orientation of the fault mechanism can be attributed to a rotation of the principal stress directions in the lower crust caused by flexural effects due to the load of recent sedimentation. Key words: Earthquake source observations; Seismicity and tectonics; Intra-plate processes; Lithospheric flexure; South America. 1 INTRODUCTION Passive margin earthquakes are an important type of intraplate seis- micity, not only because continental shelf and coastal earthquakes account for one-third to one-quarter of all seismicity in stable con- tinental crust (Johnston 1989; Schulte & Mooney 2005), but also because of the increasing seismic risk in many oil-rich continental shelves. Increased population in coastal areas also makes continen- tal shelf seismicity an important issue in seismic hazard evaluation. Since Sykes (1978) suggested a relationship between intraplate earthquakes and crustal ‘zones of weakness’, much progress has been made in understanding the seismicity of stable plate interi- ors. Johnston (1989) and Johnston & Kanter (1990) showed that 70 per cent of all large intraplate earthquakes (magnitudes > 6 M s ) occurred in extended (and presumably weak) crust such as passive margins and Mesozoic rifts. A more recent catalogue of intraplate earthquakes (Schulte & Mooney 2005) confirmed these findings and showed that 50 per cent of all events larger than magnitude 4.5 are associated with extended crust (interior rift and rifted continental * Now at: Rio de Janeiro State University, Geology Dept., Rio de Janeiro, RJ, 20550-900, Brazil. margins). Rupture in pre-existing, and therefore weak, faults likely explain most intraplate earthquakes, as demonstrated by Zoback (1992) for North America by analysing the focal mechanisms in relation to the crustal stresses. Stein et al. (1989) emphasized that most mechanisms that have been proposed to explain passive margin seismicity (stresses from continent/ocean density contrasts; flexure due to sediment loading; ridge-push stresses) should produce seis- micity in all passive margins, but this does not appear to be the case. Some passive margins are more active than others, especially those undergoing rebound from the unloading of the last ice age, such as the Canadian Atlantic coast. In the Norwegian continental margin, besides flexural stresses from glacial rebound, stresses from erosion/sedimentation also seem to contribute significantly to the seismicity (Bungum et al. 2010). Fig. 1(a) shows the seismicity in SE Brazil. To evaluate better the geographical distribution of this seismicity, we filtered the Brazilian Earthquake Catalogue according to magnitude thresholds that vary with time. We used similar thresholds of Assumpc ¸˜ ao (1998a), that is, included all events with magnitude larger than 5.5 since approxi- mately 1920 (which would be felt in large areas of the coast), larger than 5.0 since 1962 (well covered by the worldwide seismographic network), larger than 4.5 since 1970 (due to the installation of the 1076 C 2011 The Authors Geophysical Journal International C 2011 RAS Geophysical Journal International

Welcome message from author
This document is posted to help you gain knowledge. Please leave a comment to let me know what you think about it! Share it to your friends and learn new things together.
Transcript
Geophys. J. Int. (2011) 187, 1076–1088 doi: 10.1111/j.1365-246X.2011.05198.x
GJI
Geo
dyna
mic
san
dte
cton
ics
The Sao Vicente earthquake of 2008 April and seismicity in thecontinental shelf off SE Brazil: further evidence for flexural stresses
M. Assumpcao,1 J. C. Dourado,2 L. C. Ribotta,3 W. U. Mohriak,4,! Fabio L. Dias1
and J. R. Barbosa1
1IAG, University of Sao Paulo, Rua do Matao 1226, Sao Paulo, SP, 05508–090, Brazil. E-mail: [email protected] UNESP, State University of Sao Paulo, Av. 24-A 1515, Rio Claro, SP, 13506-900, Brazil3IPT, Technological Research Institute, Sao Paulo, SP, 05508-901, Brazil4Petrobras, Rio de Janeiro, RJ, Brazil
Accepted 2011 August 21. Received 2011 August 14; in original form 2011 March 30
S U M M A R YThe continental margin and shelf of most stable intraplate regions tend to be relatively moreseismically active than the continental interior. In the southeast continental margin of Brazil, aseismic zone extends from Rio Grande do Sul to Espırito Santo, with seismic activity occurringmainly along the continental slope and suggesting a close relationship with flexural stressescaused by the weight of the sediments. In this region, earthquakes with magnitudes larger than5 mb occur every 20–25 yr, on average. The focal mechanism solutions of previous earthquakesin this zone indicated reverse faulting on planes dipping approximately 45" with horizontalP-axes. The recent 5.2 mb earthquake of 2008 April 23 occurred 125 km south of Sao Vicenteand was well recorded by many stations in SE Brazil, as well as at teleseismic distances inNorth America and Africa. Its focal depth was 17 km, locating the hypocentre in the lowercrust. A well-determined focal mechanism solution shows one vertical nodal plane and onesubhorizontal nodal plane. The P- and T-axes exhibit large dips, which were confirmed bya regional moment tensor inversion. This unusual orientation of the fault mechanism can beattributed to a rotation of the principal stress directions in the lower crust caused by flexuraleffects due to the load of recent sedimentation.
Key words: Earthquake source observations; Seismicity and tectonics; Intra-plate processes;Lithospheric flexure; South America.
1 I N T RO D U C T I O N
Passive margin earthquakes are an important type of intraplate seis-micity, not only because continental shelf and coastal earthquakesaccount for one-third to one-quarter of all seismicity in stable con-tinental crust (Johnston 1989; Schulte & Mooney 2005), but alsobecause of the increasing seismic risk in many oil-rich continentalshelves. Increased population in coastal areas also makes continen-tal shelf seismicity an important issue in seismic hazard evaluation.
Since Sykes (1978) suggested a relationship between intraplateearthquakes and crustal ‘zones of weakness’, much progress hasbeen made in understanding the seismicity of stable plate interi-ors. Johnston (1989) and Johnston & Kanter (1990) showed that 70per cent of all large intraplate earthquakes (magnitudes > 6 M s)occurred in extended (and presumably weak) crust such as passivemargins and Mesozoic rifts. A more recent catalogue of intraplateearthquakes (Schulte & Mooney 2005) confirmed these findings andshowed that 50 per cent of all events larger than magnitude 4.5 areassociated with extended crust (interior rift and rifted continental
!Now at: Rio de Janeiro State University, Geology Dept., Rio de Janeiro,RJ, 20550-900, Brazil.
margins). Rupture in pre-existing, and therefore weak, faults likelyexplain most intraplate earthquakes, as demonstrated by Zoback(1992) for North America by analysing the focal mechanisms inrelation to the crustal stresses. Stein et al. (1989) emphasized thatmost mechanisms that have been proposed to explain passive marginseismicity (stresses from continent/ocean density contrasts; flexuredue to sediment loading; ridge-push stresses) should produce seis-micity in all passive margins, but this does not appear to be thecase. Some passive margins are more active than others, especiallythose undergoing rebound from the unloading of the last ice age,such as the Canadian Atlantic coast. In the Norwegian continentalmargin, besides flexural stresses from glacial rebound, stresses fromerosion/sedimentation also seem to contribute significantly to theseismicity (Bungum et al. 2010).
Fig. 1(a) shows the seismicity in SE Brazil. To evaluate better thegeographical distribution of this seismicity, we filtered the BrazilianEarthquake Catalogue according to magnitude thresholds that varywith time. We used similar thresholds of Assumpcao (1998a), thatis, included all events with magnitude larger than 5.5 since approxi-mately 1920 (which would be felt in large areas of the coast), largerthan 5.0 since 1962 (well covered by the worldwide seismographicnetwork), larger than 4.5 since 1970 (due to the installation of the
1076 C# 2011 The AuthorsGeophysical Journal International C# 2011 RAS
Geophysical Journal International
The Sao Vicente earthquake of April 2008 1077
Figure 1. (a) Seismicity in SE Brazil. Solid white lines in the ocean are depth contours of 200 and 2000 m roughly defining the continental slope. The dashedwhite line indicates the limit of the continental extended crust, according to Leplac project (Gomes 1992). Open circles are epicentres of the uniform catalogue(see text). Note seismic activity trend along the continental slope (approximately between the 200 and 2000 m isodepths), where total sediment thickness tendsto be larger. Focal mechanisms are from Mendiguren & Richter (1978) and Assumpcao (1998a). Solid black lines in the continent are limits of the Paranabasin (PB) and the Sao Francisco craton (SFC). SPP is the Sao Paulo plateau, FFZ is the Florianopolis fracture zone. Blue bars and yellow arrows indicateShmax and Shmin stresses, respectively (Assumpcao 1998b). (b) Main structural features of the Santos basin. Dented blue lines denote the basin border faultsat the hinge zone; CF is the Cabo Frio fault; SPP is the Sao Paulo plateau; the red line (VCL) is the volcanic crustal limit (Mohriak et al. 2010) defined bythe presence of SDRs; the solid blue line is the proposed continental/oceanic crustal limit based on LEPLAC seismics and gravity data (Gomes 1992). Thehachured brown area (P) is the rift propagator around the Abimael ridge, the probable termination of the northward propagating Atlantic opening, before theridge jump to the east roughly along the Florianopolis fracture zone (FFZ), interpreted as a wedge of oceanic crust (Mohriak et al. 2010). Open circles areepicentres of the ‘whole’ catalogue (including old events with uneven geographical coverage). Thick grey line CL is the Capricornio Lineament. The whiteline NW–SE shows the location of the geoseismic transect of Fig. 7.
C# 2011 The Authors, GJI, 187, 1076–1088Geophysical Journal International C# 2011 RAS

1078 M. Assumpcao et al.
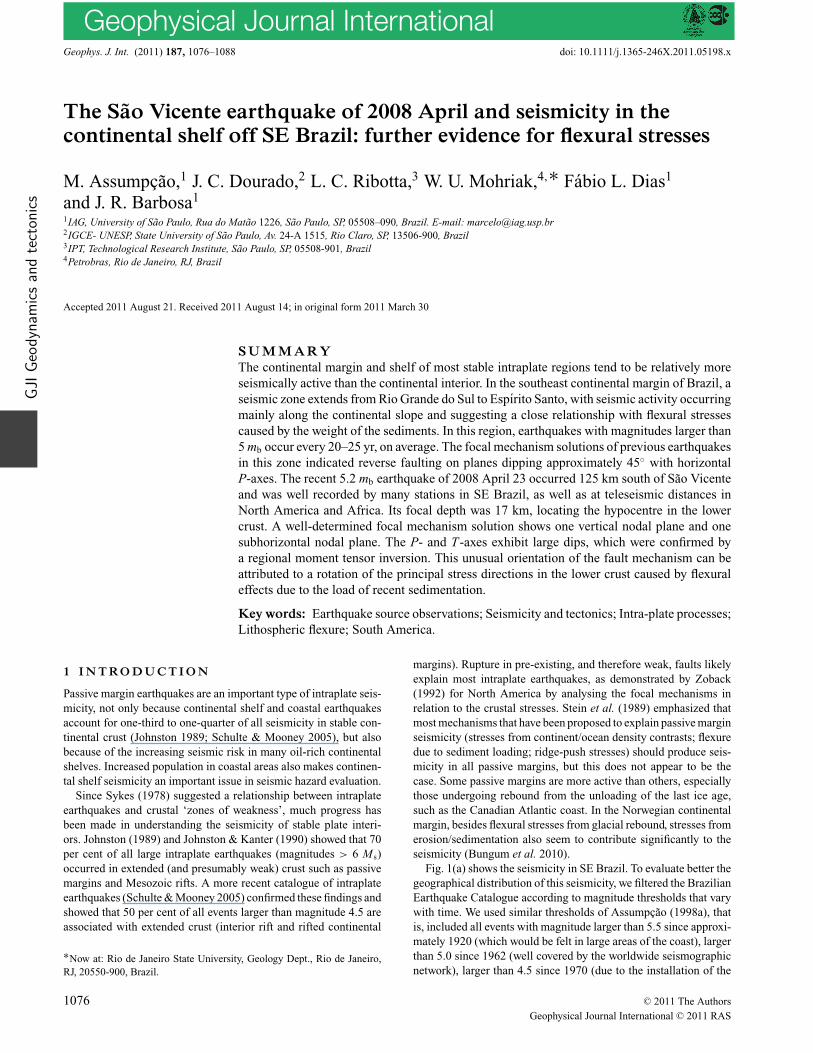
Figure 2. Schematic geoseismic transect from the continental platform of central Santos Basin towards the deep-water region, showing simplified stratigraphyof the rift, transitional and drift sequences. The location of the 2008 earthquake hypocentre in the lower crust is shown by a star near the shelf break, close tothe Merluza graben. Interpretation based on Mohriak et al. 2010 (after Chang 2003; Dourado & Assumpcao 2010, 2011).
Brasilia array station) and larger than 3.5 since 1980 (covered by theregional stations in SE Brazil). Such time-variable thresholds avoidoversampling more populated areas in the continent (locations withmore records of old earthquakes felt by the population) as well asthe continental shelf closer to Sao Paulo and Rio de Janeiro states,where seismographic stations have been operating since the early1970s. This filtered catalogue (the ‘uniform catalogue’), seen inFig. 1(a), better shows which areas are more or less seismically ac-tive. Epicentral accuracy varies from approximately ±100 km, forsmall events located only by the regional stations in the continent(Assumpcao 1998a) to approximately ±20 km for magnitude $5earthquakes that have been identified by international agencies.
Fig. 1(a) shows a clear concentration of epicentres roughly alongthe continental slope (i.e. the seafloor area with the steepest slope,roughly between 200 and 2000 m bathymetry) where the largestsediment thicknesses are expected. The seismicity in the continentis separated from that of the continental margin, indicating differentseismic zones with different sources of stress. A strike-slip stressregime (i.e. the intermediate principal stress is vertical) with E–Wcompression and N–S extension characterize the seismic zone inthe southern part of the Sao Francisco craton and the surroundingBrasilia foldbelt (Assumpcao 1998b). Earthquakes in the continen-tal shelf and slope are predominantly due to reverse faulting, butthe orientation of the compressional direction (Shmax) is not wellknown because the azimuths of the nodal planes are not well con-strained (Assumpcao 1998a). Note also that the extended and sub-merged continental crust, as defined by the dashed line in Fig. 1(a)(Chang et al. 1992; Gomes 1992), contains the small events inthe oceanic part. Interestingly, the Serra do Mar coastal ranges arepresently quite aseismic, despite clear evidence of neotectonism inthe Pleistocene (Riccomini & Assumpcao 1999).
The main structural features of the Santos basin are shown inFig. 1(b), together with all known offshore epicentres of the ‘whole’,unfiltered catalogue. Most of the epicentres are located near thepre-Aptian limit of the continental margin basins marked by theproximal rift border faults and along the Cabo Frio Fault Zone inthe Santos Basin (dented blue line and solid black line, respectively,in Fig. 1b). The Florianopolis Fracture Zone (FFZ) is marked byan E–W lineament. It has been associated with volcanic basement
(Mohriak 2001, 2004) or with exhumed mantle (Gomes et al. 2008;Zalan et al. 2009). The limit of the submerged, extended continentalcrust is still under debate. Chang et al. (1992) and Gomes (1992)analysed seismic and gravity data and traced the limit of the conti-nental/oceanic transition as shown by the Leplac line in Fig. 1(b).Mohriak et al. (2010) mapped the occurrence of SDRs (seaward-dipping reflectors) and proposed a different ‘volcanic crustal limit’(VCL in Fig. 1b). The Abimael Ridge (in the brown hatched areaof Fig. 1b) has been interpreted as an oceanic propagator, whichadvanced from the Pelotas Basin in the south towards the southernSantos Basin (Mohriak 2001; Carminatti et al. 2008; Mohriak et al.2008), but failed to advance further northwards and was aborted inthe Late Aptian. This caused a ridge jump roughly along the Flo-rianopolis fracture zone and around the Sao Paulo plateau (Bueno2004; Mohriak et al. 2010). Thus, the area between the volcaniclimit and the Leplac line is probably continental crust, and the pre-vious observation that offshore seismicity occurs predominantly inthe extended, submerged continental crust is confirmed.
A regional geoseismic transect extending from the pre-Aptianlimit of the basin towards the deep-water region is shown in Fig. 2(transect location shown in Fig. 1b) based on data from Mohriaket al. 2010 (after Chang 2003; Dourado & Assumpcao 2010, 2011).It illustrates the rift architecture and the salt tectonics styles in themargin, which are characterized by basinward sliding of post-saltblocks and by large diapirs affected by compression in the deep-water region (Cobbold et al. 1995; Mohriak et al. 1995). The oceanicpropagator (Abimael ridge) separated two salt provinces, the largerone corresponding to the main salt province in the Santos Basin,and the smaller one ruptured by igneous intrusions and possibly byincipient seafloor spreading.
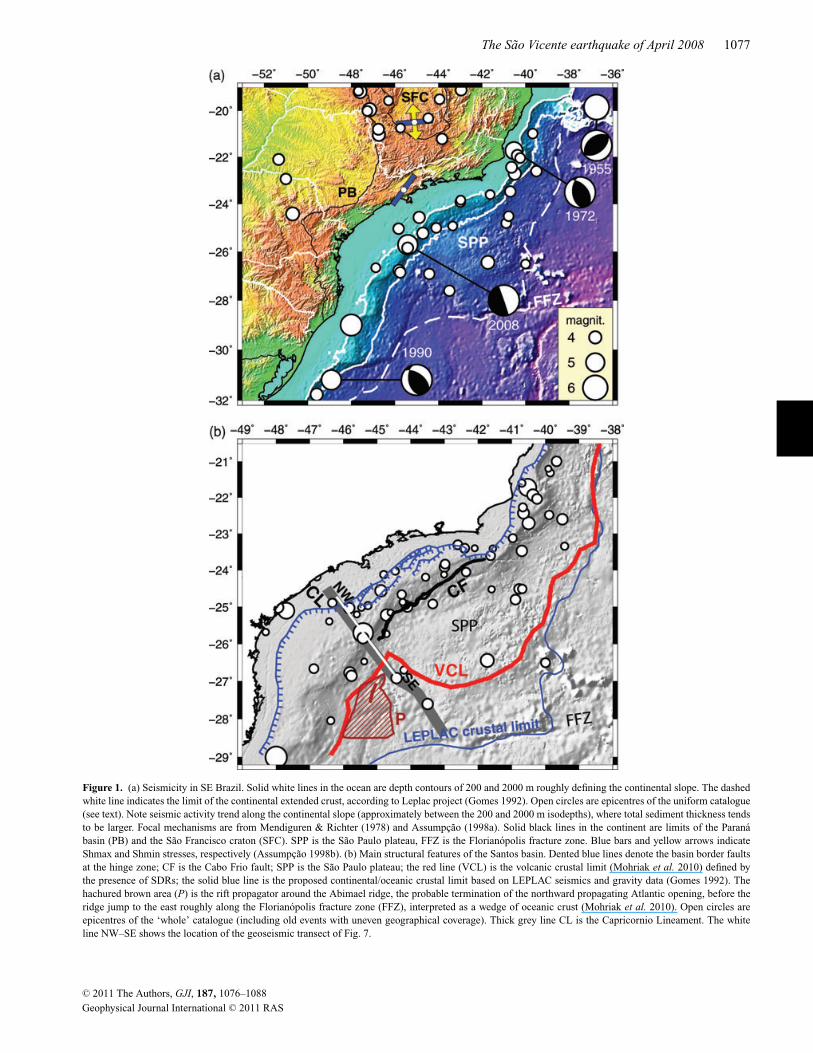
Magnitude statistics in the SE continental shelf (Fig. 3) indicatethat earthquakes with magnitude 5 or larger occur every 20–25 yr,on average. The previous large events shown in Fig. 1 occurred in1939 (Sta. Catarina, 5.5 mb), 1955 (Espirito Santo, 6.1 mb), 1972(Rio de Janeiro, 4.8 mb) and 1990 (Rio Grande do Sul, 5.2 mb ). The2008 Sao Vicente earthquake with 5.2 mb was not an unexpectedevent.
Assumpcao (1998a) showed that the seismicity in the SE conti-nental shelf could be explained by the superposition of a regional
C# 2011 The Authors, GJI, 187, 1076–1088Geophysical Journal International C# 2011 RAS
The Sao Vicente earthquake of April 2008 1079
Figure 3. Magnitude statistics for the seismic zone of the SE continentalshelf. (a) Polygon defining the limits of the seismic zone. Fine dashed lineis the continental slope; long-dashed line is the continental/oceanic crustaltransition. (b) Cumulative number of events (Nc) normalized for a periodof 100 yr, according to the time-variable magnitude thresholds defined inthe ‘Introduction’ section. Earthquakes larger than 5 mb occur once every20–25 yr, on average.
plate-wide stress, caused by ridge-push and plate collisional forces,with local sources of stress, which are caused by (1) gravitationalspreading stresses from continental/oceanic crustal transition and(2) flexure from sediment load. In addition, the extended crustfrom the Atlantic Mesozoic rifting processes could be weaker andmore prone to failure under the present stresses. Here we study thehypocentral depth and the faulting mechanism of the recent 2008Sao Vicente earthquake to contribute to a better characterization ofthe seismicity pattern in the SE continental shelf and the importanceof flexural stresses.
2 L O C AT I O N A N D M A G N I T U D E O FT H E S A O V I C E N T E E A RT H Q UA K E
2.1 Epicentre
Table 1 and Fig. 4 show the epicentre of the earthquake according todifferent international agencies (ISC 2011). The epicentral determi-nations of the U.S. Geological Survey (USGS) and the InternationalSeismological Centre (ISC) have uncertainties of approximately±5 km. These values, however, underestimate true uncertainty be-cause they only indicate the scatter of the reading errors and assumea 1-D model of the Earth. Systematic errors due to lateral variationsin the Earth’s velocity structure can make the epicentral error some-what larger, by approximately 20 km or more. The USGS and ISCepicentres were determined with a fixed depth of 10 km. Using thecorrect depth (17 km, as shown below) would not affect the epi-central location but only add $1.0 s in the earthquake origin time.Given the large number of stations and good azimuthal coverageof the reporting stations, the true accuracy of the ISC epicentre isexpected to be less than 25 km at the 90 per cent confidence level, asindicated by the analysis of all ISC routine determinations carriedout by Bondar et al. (2003).
The earthquake was well recorded by several stations in SE Brazil.We calculated an epicentre using the closest stations (Fig. 4) withvery clear P wave first motions (upper-mantle refracted Pn phase).Some of these stations also recorded clear S-wave arrivals in thetransverse component (SH waves). Fig. 5(a) shows that the SHonset is consistently negative (i.e. the polarity of the first motion isto the left, as indicated by the arrows in Fig. 4a). Using these Snand Pn arrivals, a regional Vp/Vs ratio of 1.71 ± 0.04 was estimated(Fig. 5b). We tried two velocity models: (1) the BR model (Kwitko& Assumpcao 1990) generally used to locate earthquakes in Brazil,with a Vp/Vs ratio of 1.74, and (2) a modification of the BR modelwith Vp/Vs of 1.71, and a crustal thickness of 31 km (the averagebetween the $42 km crustal thickness beneath the stations and the$20 km crust at the epicentre). In addition, the Pn (upper-mantle Pwave) velocity was reduced from 8.2 (BR model) to 8.0 because ofknown low-velocity anomalies in this area of SE Brazil (Feng et al.2007; Rocha et al. 2011). These two epicentral solutions (BR74and A71) were calculated with the HYPO71 code and are shownin Fig. 4(b) and Table 1. Again, the epicentral error bounds onlyreflect the traveltime residuals in relation to the 1-D model and donot take into account effects from 3-D structural variations. Theepicentre obtained from these regional stations is little affected bythe P-wave velocities of the 1-D model (whether BR or A) and aremore affected by the Vp/Vs ratio. A change of ±0.04 in the Vp/Vsratio moves the epicentre ±10 km north or south, respectively. TheWadati diagram (Fig. 5b) gives some indication of lateral variationsin the Vp/Vs ratio. If corrections for this difference were taken intoaccount, the local epicentre A71 would move eastwards, furtheraway from the ISC epicentre.
Given the uncertainties in the velocity model, it is clear thatthe epicentre cannot be determined with an accuracy better than±20–25 km. However, it is clear that the earthquake occurred veryclose to the continental slope, similar to the other events with mag-nitude $5 seen in Fig. 1. Its approximate location (25o 40% S, 45o
25% W) indicates that the epicentre lies within the bathymetric rangeof 200–600 m.
2.2 Magnitude
Two teleseismic magnitudes are commonly determined by inter-national agencies: mb using teleseismic P waves with periods at
C# 2011 The Authors, GJI, 187, 1076–1088Geophysical Journal International C# 2011 RAS

1080 M. Assumpcao et al.
Table 1. Epicentral determinations of the Sao Vicente Earthquake of 2008 April 23.Sources: ISC (International Seismological Centre, UK); NEIC (National Earthquake In-formation Center, US Geol. Survey). See text for BR74 and A71. Depth is fixed for everysolution. RMS is the rms traveltime residual. N is the number of arrivals used in thedeterminations.
Source Latitude Longitude Error Depth RMS N Origin Time (UT)(o) (o) (km) (km) (s) (hh:min:sec)
ISC 25.6496 45.4744 4.8 10 0.78 595 00:00:48.6NEIC 25.7600 45.4690 6.2 10 0.91 218 00:00:47.8BR74 25.5983 45.3205 5.5 17 0.78 13 00:00:48.0A71 25.7045 45.2738 4.5 17 0.47 13 00:00:47.7
Figure 4. (a) Stations used for the regional epicentre determination. Solid triangles are stations with compressional (push) first P-wave motion; opentriangles are dilatational (pull) first P-wave motion. Grey arrows indicate directions of the first SH motion shown in Fig. 4. Stars are epicentres of Table 1.(b) Detail of the various epicentral solutions shown in Table 1. Ellipses correspond to 90 per cent confidence limits for international agencies (NEIC and ISC),and standard error for the regional BR74 and A71 locations. Ellipse for A71 solution includes uncertainty of ±0.04 in the Vp/Vs ratio.
approximately 1 s, and MS with Rayleigh waves with periods closeto 20 s. The USGS and ISC values were mb = 5.2 and 5.0, andMS = 4.4 and 4.2, respectively. The apparently large difference be-tween mb and MS is common in intraplate areas and typical of other
earthquakes in Brazil (e.g. Assumpcao & Suarez 1988). It is usuallyinterpreted as being due to relatively larger stress drops and smallerrupture areas, compared to interplate earthquakes, which cause rel-atively higher radiated energy in the short-period band where the mb
C# 2011 The Authors, GJI, 187, 1076–1088Geophysical Journal International C# 2011 RAS

The Sao Vicente earthquake of April 2008 1081
Figure 5. (a) Arrival of the SH wave (Sn-wave in the horizontal transverse component) at the best regional stations shown in Figure 2). Seismograms wereconverted to displacement and aligned according to the expected S-wave arrival time (10 s in the window). Note consistent negative first motion at all stations(i.e. first SH motion to the left). Amplitudes not to scale. (b) Wadati diagram with the SH arrivals from Fig. 5a. Size of circles are approximate reading errorsof ±0.2 to 0.3 s. Thick solid line is the best-fitting Vp/Vs ratio of 1.714. Thin lines show Vp/Vs ratios of 1.70 and 1.73 for reference. Positive residuals arefrom stations to the North and NE (DAES, ESAR and ESSR), negative residuals are from NW stations (SPB, VABB, RCLB), indicating lateral variation in theregional structure.
is measured. However, as will be seen later, the stress drop for theSao Vicente event is not particularly high. The regional magnitude(mR) determined with 11 Brazilian stations was 5.05 ± 0.09 (SD).The Brazilian regional magnitude (Assumpcao 1983) is equivalentto the teleseismic mb magnitude, on average. However, Barceloset al. (2010) showed that mR tends to be lower than mb for dip-slipearthquakes (reverse or normal faulting with $45" dipping nodalplanes) and mR > mb for strike-slip earthquakes (near vertical nullaxis). For the Sao Vicente earthquake mR & mb, which is consistentwith the uncommon focal mechanism shown below.
2.3 Focal depth
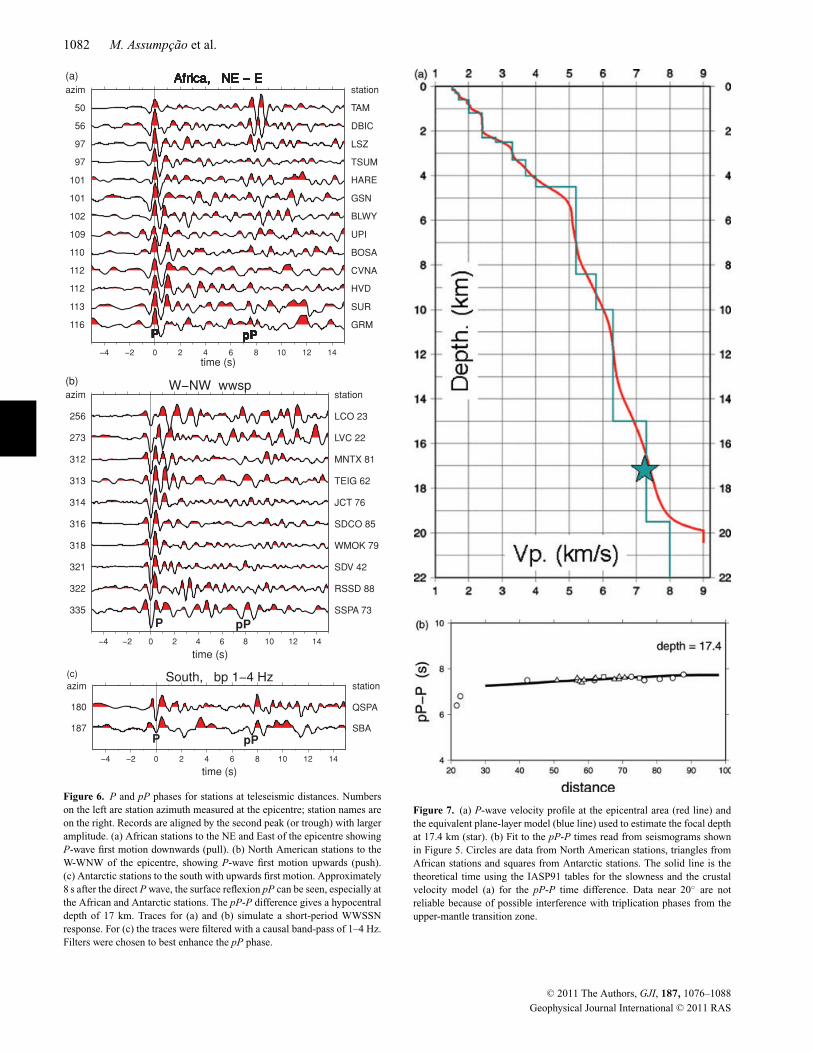
The Sao Vicente earthquake was also recorded by the best stationsin North America and Africa. Fig. 6a shows records of the Africanstations where the wave first motion is clearly downwards (pull).Also, another clear phase can be seen at approximately 7.8 s afterthe direct P, which is the surface reflection pP. Stations in NorthAmerica, on the other hand, had a consistent upwards P wave firstmotion (push), but very weak pP reflection (Fig. 6b). The time dif-ference pP–P (from African, Antarctica and some North Americanstations), together with the P-wave velocity profile in the epicentralarea (Fig. 7a), places the hypocentre at a depth of 17 km, that isin the lower crust well below the sedimentary pack. This depth iswell constrained by these pP phases (Fig. 7b) and must be takeninto account when correlating the earthquake with faults mapped inthe sedimentary layers. The geological transect (Fig. 2) shows thehypocentre in the lower crust.
3 F O C A L M E C H A N I S M
3.1 P-wave polarities
P-wave polarities of all regional (SE Brazil) and teleseismic stations(Fig. 8) show a clear nodal plane approximately oriented N–S. Theother nodal plane (with approximately E–W orientation, dippingsouth was obtained by fitting the amplitude ratios of pP/P phases
using the grid-search method of Assumpcao & Suarez (1988). Whilethe direction of the vertical, NNW–SSE trending plane is well con-strained by the P-wave polarities, the orientation of the other sub-horizontal plane is not well constrained and could vary by approxi-mately 10"–20". The left-lateral first motion of the SH wave at theregional stations (Fig. 5) is consistent with the nodal plane solutionof Fig. 8.
Another confirmation of the focal mechanism solution can beseen with a more detailed analysis of the pP phase at the Africanstations. We stacked all records from the African stations (Fig. 8)after correcting the trace for the slight normal moveout between pPand P due to different epicentral distances (as seen in Fig. 7b). Thestacked trace is in the middle of Fig. 9. To better identify the arrivalof the pP wave, we removed the source signature by deconvolvingthe first P arrival from the whole trace. The pP phase exhibits asharp positive peak, with the same polarity of the direct P wave.This is what would be expected for a dip-slip focal mechanismwith a vertical nodal plane. The pP phase recorded at the Africanstations leaves the source as a compressional pulse upwards butchanges polarity in the surface reflection and reaches the stationswith the same polarity as the direct P wave.
3.2 Moment tensor inversion
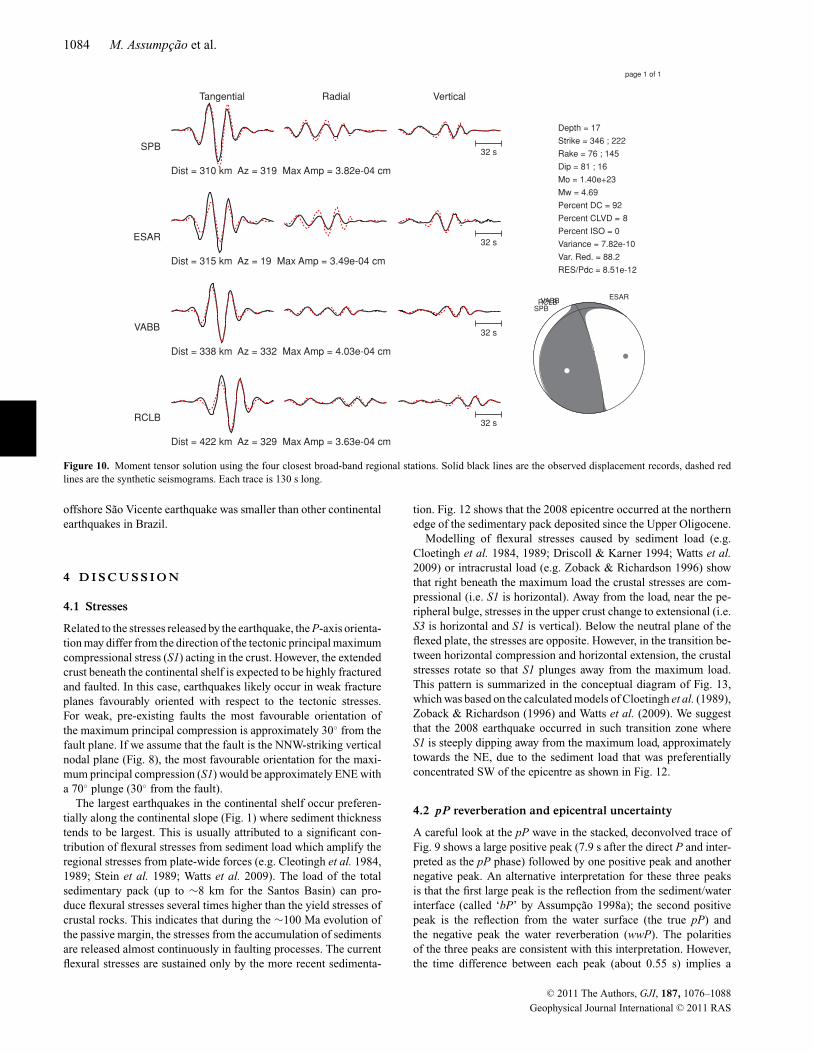
The four closest broad-band stations, at distances between 310 and420 km (SPB, ESAR, VABB and RCLB, shown in Fig. 3), wereused to determine a moment tensor solution. We used the inver-sion program TDMT_INV (Dreger 2003; Minson & Dreger 2008)which calculates the complete Green’s functions for a point source(no source time function is inverted for). The displacement seis-mograms were filtered in the range 20–50 s, much longer thanthe expected duration of the source time function of a magni-tude 5 mb event (about 1 s). For each of the four stations a sep-arate 1-D average velocity model was used based on the Rayleigh-and Love-wave group velocities. No isotropic component was al-lowed in the moment tensor inversion, only double-couple andCLVD components. The earthquake depth was fixed at 17 km.
C# 2011 The Authors, GJI, 187, 1076–1088Geophysical Journal International C# 2011 RAS
1082 M. Assumpcao et al.
0 2 4 6 8 10 12 14
50 TAM
E
P pP
56 DBIC
E
P pP
97 LSZ
E
P pP
97 TSUM
E
P pP
101 HARE
E
P pP
101 GSN
E
P pP
102 BLWY
E
P pP
109 UPI
E
P pP
110 BOSA
E
P pP
112 CVNA
E
P pP
112 HVD
E
P pP
113 SUR
E
P pP116 GRM
E
P pP
E
P pP
E
time (s)
azim station
P pP
0 2 4 6 8 10 12 14
256 LCO 23
273 LVC 22
312 MNTX 81
313 TEIG 62
314 JCT 76
316 SDCO 85
318 WMOK 79
321 SDV 42
322 RSSD 88
335 SSPA 73
time (s)
azim station
P pP
(a)
(b)
0 2 4 6 8 10 12 14
187 SBA
180 QSPA
time (s)
azim(c)
station
P pP
Figure 6. P and pP phases for stations at teleseismic distances. Numberson the left are station azimuth measured at the epicentre; station names areon the right. Records are aligned by the second peak (or trough) with largeramplitude. (a) African stations to the NE and East of the epicentre showingP-wave first motion downwards (pull). (b) North American stations to theW-WNW of the epicentre, showing P-wave first motion upwards (push).(c) Antarctic stations to the south with upwards first motion. Approximately8 s after the direct P wave, the surface reflexion pP can be seen, especially atthe African and Antarctic stations. The pP-P difference gives a hypocentraldepth of 17 km. Traces for (a) and (b) simulate a short-period WWSSNresponse. For (c) the traces were filtered with a causal band-pass of 1–4 Hz.Filters were chosen to best enhance the pP phase.
Figure 7. (a) P-wave velocity profile at the epicentral area (red line) andthe equivalent plane-layer model (blue line) used to estimate the focal depthat 17.4 km (star). (b) Fit to the pP-P times read from seismograms shownin Figure 5. Circles are data from North American stations, triangles fromAfrican stations and squares from Antarctic stations. The solid line is thetheoretical time using the IASP91 tables for the slowness and the crustalvelocity model (a) for the pP-P time difference. Data near 20" are notreliable because of possible interference with triplication phases from theupper-mantle transition zone.
C# 2011 The Authors, GJI, 187, 1076–1088Geophysical Journal International C# 2011 RAS
The Sao Vicente earthquake of April 2008 1083
Figure 8. Focal mechanism solution of the 2008 Sao Vicente earthquake.Crosses and circles indicate upwards (push) and downwards (pull) P-wavefirst motions, respectively. Large and small symbols indicate more and lessclear polarities. ‘P’ and ‘T’ indicate the orientation of the stresses releasedby the event. The fault plane can be the vertical, NNW-striking plane, or the(almost horizontal) South dipping plane.
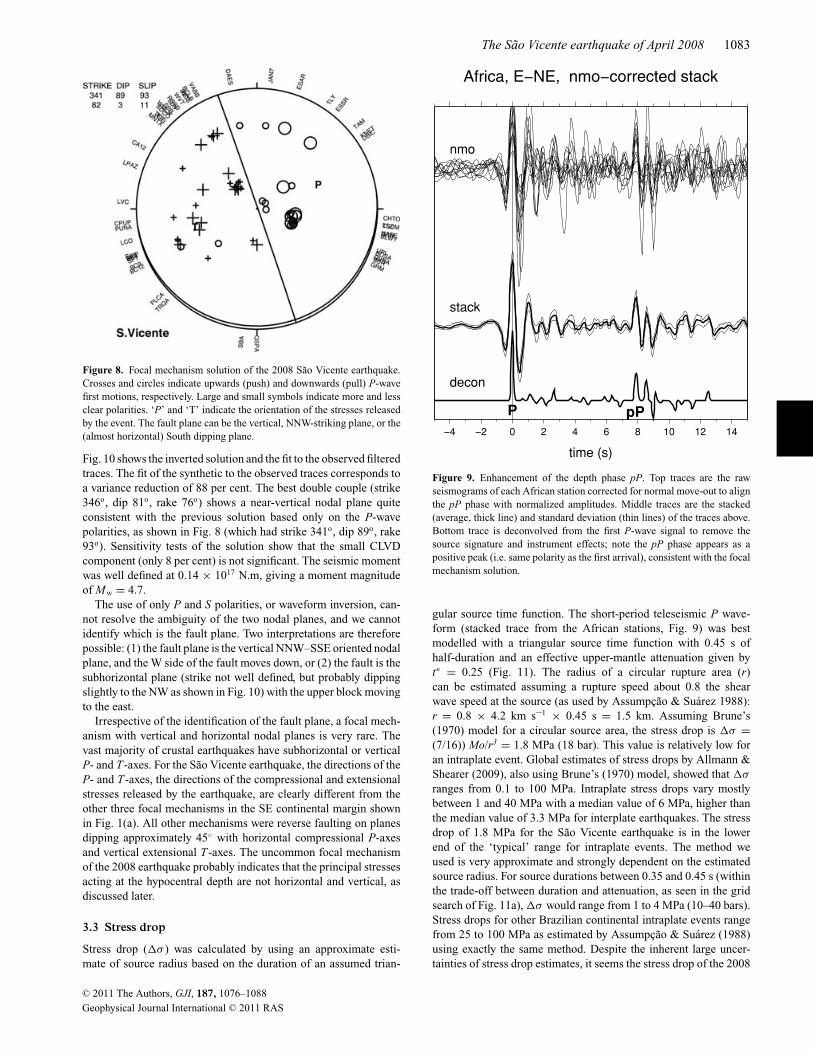
Fig. 10 shows the inverted solution and the fit to the observed filteredtraces. The fit of the synthetic to the observed traces corresponds toa variance reduction of 88 per cent. The best double couple (strike346o, dip 81o, rake 76o) shows a near-vertical nodal plane quiteconsistent with the previous solution based only on the P-wavepolarities, as shown in Fig. 8 (which had strike 341o, dip 89o, rake93o). Sensitivity tests of the solution show that the small CLVDcomponent (only 8 per cent) is not significant. The seismic momentwas well defined at 0.14 ' 1017 N.m, giving a moment magnitudeof Mw = 4.7.
The use of only P and S polarities, or waveform inversion, can-not resolve the ambiguity of the two nodal planes, and we cannotidentify which is the fault plane. Two interpretations are thereforepossible: (1) the fault plane is the vertical NNW–SSE oriented nodalplane, and the W side of the fault moves down, or (2) the fault is thesubhorizontal plane (strike not well defined, but probably dippingslightly to the NW as shown in Fig. 10) with the upper block movingto the east.
Irrespective of the identification of the fault plane, a focal mech-anism with vertical and horizontal nodal planes is very rare. Thevast majority of crustal earthquakes have subhorizontal or verticalP- and T-axes. For the Sao Vicente earthquake, the directions of theP- and T-axes, the directions of the compressional and extensionalstresses released by the earthquake, are clearly different from theother three focal mechanisms in the SE continental margin shownin Fig. 1(a). All other mechanisms were reverse faulting on planesdipping approximately 45" with horizontal compressional P-axesand vertical extensional T-axes. The uncommon focal mechanismof the 2008 earthquake probably indicates that the principal stressesacting at the hypocentral depth are not horizontal and vertical, asdiscussed later.
3.3 Stress drop
Stress drop (!" ) was calculated by using an approximate esti-mate of source radius based on the duration of an assumed trian-
0 2 4 6 8 10 12 14
time (s)
nmo
stack
decon
P pP
Figure 9. Enhancement of the depth phase pP. Top traces are the rawseismograms of each African station corrected for normal move-out to alignthe pP phase with normalized amplitudes. Middle traces are the stacked(average, thick line) and standard deviation (thin lines) of the traces above.Bottom trace is deconvolved from the first P-wave signal to remove thesource signature and instrument effects; note the pP phase appears as apositive peak (i.e. same polarity as the first arrival), consistent with the focalmechanism solution.
gular source time function. The short-period teleseismic P wave-form (stacked trace from the African stations, Fig. 9) was bestmodelled with a triangular source time function with 0.45 s ofhalf-duration and an effective upper-mantle attenuation given byt! = 0.25 (Fig. 11). The radius of a circular rupture area (r)can be estimated assuming a rupture speed about 0.8 the shearwave speed at the source (as used by Assumpcao & Suarez 1988):r = 0.8 ' 4.2 km s–1 ' 0.45 s = 1.5 km. Assuming Brune’s(1970) model for a circular source area, the stress drop is !" =(7/16)) Mo/r3 = 1.8 MPa (18 bar). This value is relatively low foran intraplate event. Global estimates of stress drops by Allmann &Shearer (2009), also using Brune’s (1970) model, showed that !"
ranges from 0.1 to 100 MPa. Intraplate stress drops vary mostlybetween 1 and 40 MPa with a median value of 6 MPa, higher thanthe median value of 3.3 MPa for interplate earthquakes. The stressdrop of 1.8 MPa for the Sao Vicente earthquake is in the lowerend of the ‘typical’ range for intraplate events. The method weused is very approximate and strongly dependent on the estimatedsource radius. For source durations between 0.35 and 0.45 s (withinthe trade-off between duration and attenuation, as seen in the gridsearch of Fig. 11a), !" would range from 1 to 4 MPa (10–40 bars).Stress drops for other Brazilian continental intraplate events rangefrom 25 to 100 MPa as estimated by Assumpcao & Suarez (1988)using exactly the same method. Despite the inherent large uncer-tainties of stress drop estimates, it seems the stress drop of the 2008
C# 2011 The Authors, GJI, 187, 1076–1088Geophysical Journal International C# 2011 RAS
1084 M. Assumpcao et al.
Tangential Radial Vertical
SPB
Dist = 310 km Az = 319 Max Amp = 3.82e-04 cm
32 s
ESAR
Dist = 315 km Az = 19 Max Amp = 3.49e-04 cm
32 s
VABB
Dist = 338 km Az = 332 Max Amp = 4.03e-04 cm
32 s
RCLB
Dist = 422 km Az = 329 Max Amp = 3.63e-04 cm
32 s
SPB
ESARVABBRCLB
Depth = 17Strike = 346 ; 222Rake = 76 ; 145Dip = 81 ; 16Mo = 1.40e+23Mw = 4.69Percent DC = 92Percent CLVD = 8Percent ISO = 0Variance = 7.82e-10Var. Red. = 88.2RES/Pdc = 8.51e-12
page 1 of 1
Figure 10. Moment tensor solution using the four closest broad-band regional stations. Solid black lines are the observed displacement records, dashed redlines are the synthetic seismograms. Each trace is 130 s long.
offshore Sao Vicente earthquake was smaller than other continentalearthquakes in Brazil.
4 D I S C U S S I O N
4.1 Stresses
Related to the stresses released by the earthquake, the P-axis orienta-tion may differ from the direction of the tectonic principal maximumcompressional stress (S1) acting in the crust. However, the extendedcrust beneath the continental shelf is expected to be highly fracturedand faulted. In this case, earthquakes likely occur in weak fractureplanes favourably oriented with respect to the tectonic stresses.For weak, pre-existing faults the most favourable orientation ofthe maximum principal compression is approximately 30" from thefault plane. If we assume that the fault is the NNW-striking verticalnodal plane (Fig. 8), the most favourable orientation for the maxi-mum principal compression (S1) would be approximately ENE witha 70" plunge (30" from the fault).
The largest earthquakes in the continental shelf occur preferen-tially along the continental slope (Fig. 1) where sediment thicknesstends to be largest. This is usually attributed to a significant con-tribution of flexural stresses from sediment load which amplify theregional stresses from plate-wide forces (e.g. Cleotingh et al. 1984,1989; Stein et al. 1989; Watts et al. 2009). The load of the totalsedimentary pack (up to $8 km for the Santos Basin) can pro-duce flexural stresses several times higher than the yield stresses ofcrustal rocks. This indicates that during the $100 Ma evolution ofthe passive margin, the stresses from the accumulation of sedimentsare released almost continuously in faulting processes. The currentflexural stresses are sustained only by the more recent sedimenta-
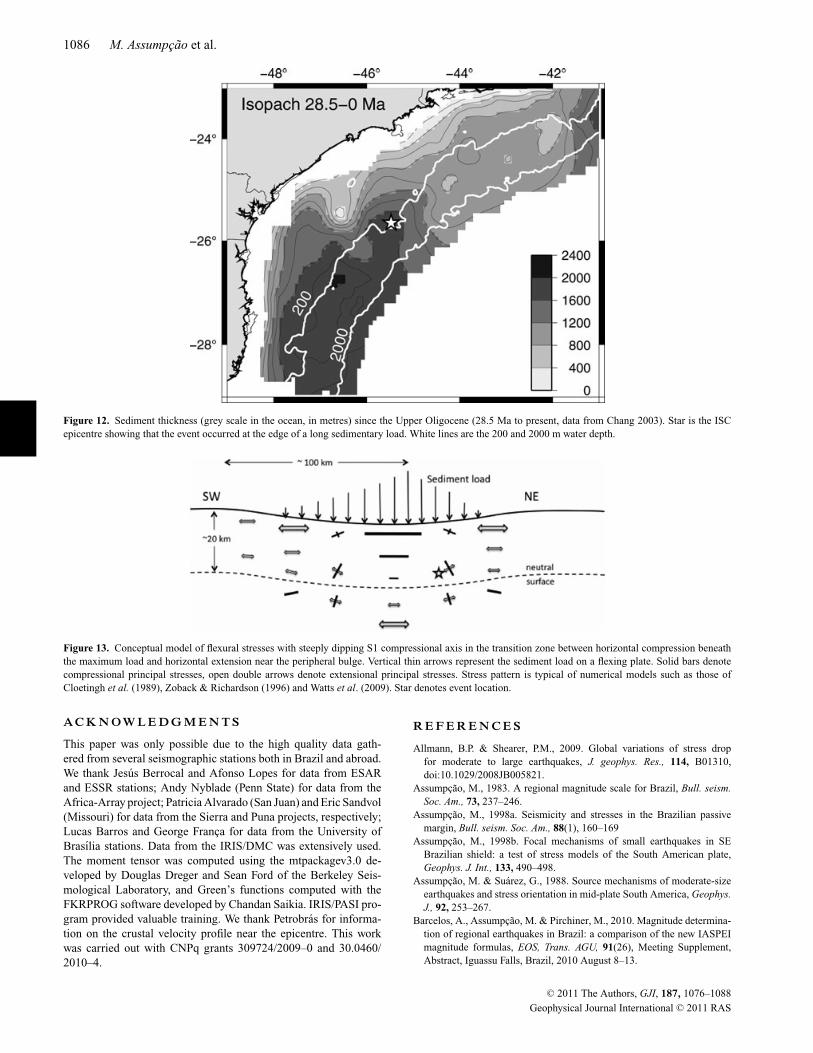
tion. Fig. 12 shows that the 2008 epicentre occurred at the northernedge of the sedimentary pack deposited since the Upper Oligocene.
Modelling of flexural stresses caused by sediment load (e.g.Cloetingh et al. 1984, 1989; Driscoll & Karner 1994; Watts et al.2009) or intracrustal load (e.g. Zoback & Richardson 1996) showthat right beneath the maximum load the crustal stresses are com-pressional (i.e. S1 is horizontal). Away from the load, near the pe-ripheral bulge, stresses in the upper crust change to extensional (i.e.S3 is horizontal and S1 is vertical). Below the neutral plane of theflexed plate, the stresses are opposite. However, in the transition be-tween horizontal compression and horizontal extension, the crustalstresses rotate so that S1 plunges away from the maximum load.This pattern is summarized in the conceptual diagram of Fig. 13,which was based on the calculated models of Cloetingh et al. (1989),Zoback & Richardson (1996) and Watts et al. (2009). We suggestthat the 2008 earthquake occurred in such transition zone whereS1 is steeply dipping away from the maximum load, approximatelytowards the NE, due to the sediment load that was preferentiallyconcentrated SW of the epicentre as shown in Fig. 12.
4.2 pP reverberation and epicentral uncertainty
A careful look at the pP wave in the stacked, deconvolved trace ofFig. 9 shows a large positive peak (7.9 s after the direct P and inter-preted as the pP phase) followed by one positive peak and anothernegative peak. An alternative interpretation for these three peaksis that the first large peak is the reflection from the sediment/waterinterface (called ‘bP’ by Assumpcao 1998a); the second positivepeak is the reflection from the water surface (the true pP) andthe negative peak the water reverberation (wwP). The polaritiesof the three peaks are consistent with this interpretation. However,the time difference between each peak (about 0.55 s) implies a
C# 2011 The Authors, GJI, 187, 1076–1088Geophysical Journal International C# 2011 RAS

The Sao Vicente earthquake of April 2008 1085
0.0
0.2
0.4
0.6
0.8
1.0
0.0 0.2 0.4 0.6 0.8 1.0
0.1
0.1
0.1
0.1
0.1
0.2
0.2
(a)
(b)
Atte
nuat
ion
, t*
Figure 11. Modelling of the teleseismic short-period P waveform. (a) Gridsearch for the best-fitting parameters: half-duration of a triangular sourcetime function and upper-mantle effective attenuation t!; contours show rmsmisfit; solid square shows the minimum misfit. Note the trade-off between at-tenuation and source duration. (b) Comparison between the observed Africanstacked trace with WWSSN response (solid line) and the synthetic trace with0.45 s half-duration and t! = 0.25 (dashed line).
water depth of approximately 400 m. This requires the ISC epi-centre (Fig. 4b) to be more than 20 km off from the true location,but remains consistent with the National Earthquake InformationCenter (NEIC) epicentre or the regional A71 solution. One problemof this interpretation is that the bP phase usually has lower ampli-tude than the true pP reflected from the water surface because of alower impedance contrast. This issue will require more work in thefuture.
4.3 Earthquake versus slump
Some large events occurring near the continental slope have beeninterpreted as huge slumps instead of tectonic earthquakes, such asthe magnitude 7.2 Grand Banks event of 1929 off the eastern coast
of Canada. The Grand Banks seismic event was interpreted as theslump itself (Hasegawa & Kanamori 1987; Hasegawa & Herrmann1989) or as a deep crustal, complex earthquake, which caused thesediment slumping (Bent 1995). Berrocal et al. (1996) suggestedthat the 1990 Rio Grande do Sul (Fig. 1a) event could have been amarine landslide. The 2008 Sao Vicente earthquake occurred near amajor canyon in the continental slope, with geological evidence ofpast slumps. For this reason some authors have suggested that theSao Vicente event could have been a slump and not an earthquake.Clearly, these hypotheses have important implications for seismicrisk estimates along the continental shelf. However, the focal mech-anisms and hypocentral depths of the 1988 event in Uruguay, the1990 event in Rio Grande do Sul (Assumpcao 1998a) and the 2008Sao Vicente event clearly show that, thus far, no large earthquakein the SE Brazilian continental shelf can be attributed to a slump.Instead, these events were earthquakes caused by failure of deepfaults under the present tectonic stresses affecting weak zones ofthe crust. In addition, both the P-wave polarity data (Fig. 8) and themoment tensor solution (Fig. 10) show that a pure double couplemechanism can completely explain all the observations. Any seis-mic contribution from a slump component would be very small andprobably not resolvable with the present data.
4.4 The 2008 earthquake and geological faults
Correlation of earthquakes with geological/geophysical structuralfeatures is known to be a difficult task, especially in intraplate areaswhere the number of earthquakes is few and statistical variabilitymakes it difficult to reach robust conclusions. For this reason we re-frain from trying to associate the 2008 earthquake with any specificfault or structures, especially in view of the epicentre uncertainty.However, it is interesting to note that the 2008 Sao Vicente earth-quake occurred near major structures of the Santos basin, such as theNW–SE Capricornio Lineament (Bueno 2004; Bueno et al. 2004)shown in Fig. 1(b), as well as the Merluza graben (Fig. 2) a N–Sfeature in southern to central Santos Basin marked by extensionalfaults affecting the base of the salt. Although the NNW–SSE orien-tation of the vertical nodal plane could favour structures such as theMerluza graben, many listric faults mapped in the upper crust tendto a horizontal orientation in the lower crust, so that the horizontalnodal plane cannot be ruled out as a possible fault plane purely ongeometrical grounds.
5 C O N C LU S I O N S
The 2008 Sao Vicente earthquake had a hypocentre in the lowercrust (17 km focal depth) approximately 12 km below the sedimen-tary layers. The focal mechanism indicates two possibilities for theorientation of the fault plane: a vertical NNW–SSE striking planewith vertical dip-slip motion, or a subhorizontal plane with lateralmotion. Both the focal mechanism and the hypocentral depth ruleout the interpretation of a slump in the continental slope as themajor cause of the observed seismic waves.
Flexural stresses due to sediment load along the continental shelfprobably play a major role in causing the Sao Vicente earthquakeas well as most of the seismicity along the SE continental shelf.We suggest that a rotation of the flexural stresses in the transitionzone between the compressional field right beneath the maximumload and the extensional stresses near the peripheral bulge causesthe unusual orientation of the nodal planes.
C# 2011 The Authors, GJI, 187, 1076–1088Geophysical Journal International C# 2011 RAS
1086 M. Assumpcao et al.
Figure 12. Sediment thickness (grey scale in the ocean, in metres) since the Upper Oligocene (28.5 Ma to present, data from Chang 2003). Star is the ISCepicentre showing that the event occurred at the edge of a long sedimentary load. White lines are the 200 and 2000 m water depth.
Figure 13. Conceptual model of flexural stresses with steeply dipping S1 compressional axis in the transition zone between horizontal compression beneaththe maximum load and horizontal extension near the peripheral bulge. Vertical thin arrows represent the sediment load on a flexing plate. Solid bars denotecompressional principal stresses, open double arrows denote extensional principal stresses. Stress pattern is typical of numerical models such as those ofCloetingh et al. (1989), Zoback & Richardson (1996) and Watts et al. (2009). Star denotes event location.
A C K N OW L E D G M E N T S
This paper was only possible due to the high quality data gath-ered from several seismographic stations both in Brazil and abroad.We thank Jesus Berrocal and Afonso Lopes for data from ESARand ESSR stations; Andy Nyblade (Penn State) for data from theAfrica-Array project; Patricia Alvarado (San Juan) and Eric Sandvol(Missouri) for data from the Sierra and Puna projects, respectively;Lucas Barros and George Franca for data from the University ofBrasılia stations. Data from the IRIS/DMC was extensively used.The moment tensor was computed using the mtpackagev3.0 de-veloped by Douglas Dreger and Sean Ford of the Berkeley Seis-mological Laboratory, and Green’s functions computed with theFKRPROG software developed by Chandan Saikia. IRIS/PASI pro-gram provided valuable training. We thank Petrobras for informa-tion on the crustal velocity profile near the epicentre. This workwas carried out with CNPq grants 309724/2009–0 and 30.0460/2010–4.
R E F E R E N C E S
Allmann, B.P. & Shearer, P.M., 2009. Global variations of stress dropfor moderate to large earthquakes, J. geophys. Res., 114, B01310,doi:10.1029/2008JB005821.
Assumpcao, M., 1983. A regional magnitude scale for Brazil, Bull. seism.Soc. Am., 73, 237–246.
Assumpcao, M., 1998a. Seismicity and stresses in the Brazilian passivemargin, Bull. seism. Soc. Am., 88(1), 160–169
Assumpcao, M., 1998b. Focal mechanisms of small earthquakes in SEBrazilian shield: a test of stress models of the South American plate,Geophys. J. Int., 133, 490–498.
Assumpcao, M. & Suarez, G., 1988. Source mechanisms of moderate-sizeearthquakes and stress orientation in mid-plate South America, Geophys.J., 92, 253–267.
Barcelos, A., Assumpcao, M. & Pirchiner, M., 2010. Magnitude determina-tion of regional earthquakes in Brazil: a comparison of the new IASPEImagnitude formulas, EOS, Trans. AGU, 91(26), Meeting Supplement,Abstract, Iguassu Falls, Brazil, 2010 August 8–13.
C# 2011 The Authors, GJI, 187, 1076–1088Geophysical Journal International C# 2011 RAS

The Sao Vicente earthquake of April 2008 1087
Bent, A.L., 1995. A complex double-couple source mechanism for the Ms7.2 1929 Grand Banks earthquake, Bull. seism. Soc. Am., 85, 1003–1020.
Berrocal, J., Fernandes, C., Bassini, A. & Barbosa, J.R., 1996. Earthquakehazard assessment in southeastern Brazil, Geofıs. Int., 35, 257–272.
Bondar, I., Myers, S.C., Engdahl, E.R. & Bergman, E.A., 2003. Epicen-tre accuracy based on seismic network criteria, Geophys. J. Int., 156,483–496.
Brune, J., 1970. Tectonic stress and spectra of seismic shear waves fromearthquakes, J. geophys. Res., 75, 4997–5009. [Correction, 1971 J. geo-phys. Res., 76, 5002].
Bueno, G.V., 2004. Diacronismo de eventos no rifte Sul-Atlantico, Bol.Geoc. Petrobras, Rio de Janeiro, 12(2), 203–229.
Bueno, G.V., Machado, D.L., Jr, Oliveira, J.A.B. & Marques, E.J.J., 2004. Ainfluencia do Lineamento de Capricornio na evolucao tectono-sedimentarda bacia de Santos. Abstracts, 42nd Brazilian Geological Congress,Araxa, MG, Brazil.
Bungum, H., Olesen, O., Pascal, C., Gibbons, S., Lindholm, C. & Vestøl,O., 2010. To what extent is the present seismicity of Norway driven bypostglacial rebound? J. Geol. Soc. Lond., 167, 373–384.
Carminatti, M., Wolff, B. & Gamboa, L.A.P., 2008. New exploratory fron-tiers in Brazil, in Proceedings of the 19th World Petroleum Congress,Madrid, Spain, Abstracts CD, 11 pp.
Chang, H.K., 2003. Mapeamento e Interpretacao dos Sistemas Petrolıferosda Bacia de Santos, http://www.anp.gov.br/brnd/round5/round5/Apres_SemTec/R5_Santos.pdf (accessed in 2011 February 16).
Chang, H.K., Kowsman, R., Figueiredo, A.M.F. & Bender, A.A., 1992.Tectonics and stratigraphy of the east Brazil rift system: an overview,Tectonophysics, 213, 97–138.
Cloetingh, S.A.P.L., Wortel, M.J.R. & Vlaar, N.J., 1984. Passive marginevolution, initiation of subduction and the Wilson cycle, Tectonophysics,109, 147–163.
Cloetingh, S.A.P.L., Wortel, M.J.R. & Vlaar, N.J., 1989. On the initiation ofsubduction zones. Pageoph, 129, 7–25.
Cobbold, P.R., Szatmari, P., Demercian, L.S., Coelho, D. & Rossello, E.A.,1995. Seismic experimental evidence for thin-skinned horizontal shorten-ing by convergent radial gliding on evaporites, deep-water Santos Basin,AAPG Memoir, 65, 305–321.
Dourado, J.C. & Assumpcao, M., 2010. The 5.2 mb Sao Vicente earthquakeof 2008 in the continental shelf off SE Brazil: using reflection seismic sec-tions to constrain the fault plane, AGU Meeting of the Americas, IguassuFalls, Brazil, 2010 August 8–13, Abstract.
Dourado, J.C., & Assumpcao, M., 2011. The 5.2 mb Sao Vicente earthquakeof 2008 in the continental shelf off SE Brazil: using reflection seismicsections to constrain the fault plane, Rev. Bras. Geofısica, submitted (inPortuguese).
Dreger, D.S., 2003. TDMT_INV: time domain seismic moment tensor in-version, in International Handbook of Earthquake and Engineering Seis-mology, Vol. 81B, p. 1627, Academic Press, London.
Driscoll, N.W. & Karner, G.D., 1994. Flexural deformation due toAmazon Fan loading: a feedback mechanism affecting sedimentdelivery to margins, Geology, 22, 1015–1018, doi:10.1130/0091-7613(1994)022<1015:FDDTAF>2.3.CO;2
Feng, M., Van der Lee, S. & Assumpcao, M., 2007. Upper mantle structureof South America from joint inversion of waveforms and fundamental-mode group velocities of Rayleigh waves, J. geophys. Res., 112, B04312,doi:10.1029/2006JB004449.
Gomes, B.S., 1992. Preliminary integration of marine gravimetric data ofPetrobras and Leplac project: Campos, Santos and Pelotas basins, inProceedings of the 37th Brazilian Geological Congress, 1, 559–560, SaoPaulo, SP, Brazil (in Portuguese).
Gomes, P.O., Kilsdonk, B., Minken, J., Grow, T. & Barragan, R., 2008.The outer high of the Santos Basin, Southern Sao Paulo Plateau, Brazil:pre-salt exploration outbreak, palaeogeographic setting, and evolution ofthe syn-rift structures, AAPG International Conference and Exhibition,Cape Town, South Africa, 2008 October 26–29, Abstracts CD, http://www.searchanddiscovery.net/documents/2009/10193gomes/images/gomes.pdf (last accessed 2011 September 17).
Hasegawa, H.S. & Herrmann, R.B., 1989. A comparison of the source mech-
anism of the 1975 Laurentian Channel earthquake and the tsunamigenic1929 Grand Banks event, in Earthquakes at North-Atlantic Passive Mar-gins: Neotectonics and Postglacial Rebound, pp. 547–562, eds Gregersen,S. & Basham, P.W., Kluwer Academic, Boston, MA.
Hasegawa, H.S & Kanamori, H., 1987. Source mechanism of the magni-tude 7.2 Grand Banks earthquake of November 1929: double couple orsubmarine landslide? Bull. seism. Soc. Am., 77, 1984–2004.
ISC, 2011. International Seismological Centre, On-line Bulletin,http://www.isc.ac.uk (last accessed 2011 September 17).
Johnston, A.C., 1989. The seismicity of stable continental interiors, in Earth-quakes at North-Atlantic Passive Margins: Neotectonics and PostglacialRebound, pp. 299–327, eds Gregersen, S. & Basham, P.W., Kluwer Aca-demic, Boston, MA.
Johnston, A.C. & Kanter, L.R., 1990. Earthquakes in stable continentalcrust, Sci. Am., 262, 68–75.
Kwitko, R. & Assumpcao, M., 1990. Modelo de velocidades para omanto superior no Brasil e determinacao de epicentros regionais, inProceedingsof the 36th Congr. Bras. Geol., Natal, RN, 5, pp. 2464–2469.
Mendiguren, J.A. & Richter, F.M., 1978. On the origin of compressionalintraplate stresses in South America, Phys. Earth planet. Inter., 16, 318–326.
Minson, S.E. & Dreger, D.S., 2008. Stable inversions for completemoment tensors, Geophys. J. Int., 174, 585–592, doi:10.1111/j.1365-246X.2008.03797.x.
Mohriak, W.U., 2001. Salt tectonics, volcanic centers, fracture zones andtheir relationship with the origin and evolution of the South AtlanticOcean: geophysical evidence in the Brazilian and West African margins, inProceedings of the 7th Internaional Congress of the Brazilian GeophysicalSociety, Salvador, Bahia, Brazil, 2001 October 28–31, Expanded Abstract,pp. 1594–1597.
Mohriak, W.U., 2004. Recursos energeticos associados a ativacao tectonicamesozoico-cenozoica da America do Sul, in Geologia do ContinenteSul-Americano: Evolucao da Obra de Fernando Flavio Marques deAlmeida, Vol. XVIII, pp. 293–318, eds Mantesso–Neto, V. Bartorelli, A.,Carneiro, C.D.R. & Brito-Neves, B.B., Beca Producoes Culturais Ltd., SaoPaulo.
Mohriak, W.U. et al., 1995. Salt tectonics and structural styles in the deep-water province of the Cabo Frio region, Rio de Janeiro, Brazil, AAPGMemoir, 65, 273–304.
Mohriak, W.U., Nemcok, M. & Enciso, G. 2008. South Atlantic divergentmargin evolution: rift-border uplift and salt tectonics in the basins of SEBrazil, Geol. Soc. Lond. Spec. Pub., 294, 365–398.
Mohriak, W.U., Nobrega, M. Odegard, M.E., Gomes, B.S. & Dickson, W.G.,2010. Geological and geophysical interpretation of the Rio Grande Rise,south-eastern Brazilian margin: extensional tectonics and rifting of con-tinental and oceanic crusts, Pet. Geosci., 16, 231–245. doi:10.1144/1354-079309-910.
Rocha, M.P. Schimmel, M. & Assumpcao, M., 2011, Upper-mantle seismicstructure beneath SE and Central Brazil from P- and S-wave regional trav-eltime tomography, Geophys. J. Int., 184, 268–286, doi:10.1111/j.1365-246X.2010.04831.x.
Riccomini, C. & Assumpcao, M., 1999. Quaternary tectonics in Brazil.Episodes, 22(3), 221–225.
Schulte, S.M. & Mooney, W.D., 2005. An updated global earthquake cat-alogue for stable continental regions: reassessing the correlation withancient rifts. Geophys. J. Int., 161, 707–721.
Stein, S., Cloetingh, S., Sleep, N.H. & Wortel, R., 1989. Passive marginearthquakes, stresses and rheology, in Earthquakes at North-Atlantic Pas-sive Margins: Neotectonics and Postglacial Rebound, pp. 231–259, edsGregersen, S. and Basham, P.W., Kluwer Academic, Boston, MA.
Sykes, L., 1978. Intraplate seismicity, reactivation of pre-existing zones ofweakness, alkaline magmatism, and other tectonism postdating continen-tal fragmentation, Rev. geophys. Space Phys., 16, 621–688.
Watts, A.B., Rodger, M., Peirce, C., Greenroyd, C.J. & Hobbs, R.W.,2009. Seismic structure, gravity anomalies, and flexure of the Ama-zon continental margin, NE Brazil, J. geophys. Res., 114, B07103,doi:10.1029/2008JB006259.
C# 2011 The Authors, GJI, 187, 1076–1088Geophysical Journal International C# 2011 RAS

1088 M. Assumpcao et al.
Zalan, P.V., Severino, M.C.G., Oliveira, J.A.B., Magnavita, L.P., Mohriak,W.U., Gontijo, R.G., Viana, A.R. & Szatmari, P., 2009. Stretching andthinning of the upper lithosphere and continental-oceanic crustal tran-sition, AAPG International Conference & Exhibition, 2009 November15–18, Abstracts Volume, 653274.
Zoback, M.L, 1992. Stress field constraints on intraplate seismicity in East-ern North America, J. geophys. Res., 97, 11761–11782.
Zoback, M.L. & Richardson, R.M., 1996. Stress perturbation associatedwith the Amazonas and other ancient continental rifts, J. geophys. Res.,101, 5459–5475.
C# 2011 The Authors, GJI, 187, 1076–1088Geophysical Journal International C# 2011 RAS
Related Documents