THE SAMPLE EXPERIENCE: THE DEVELOPMENT OF A RICH MEDIA ONLINE MATHEMATICS LEARNING ENVIRONMENT by Jen Chang B.A. (Cognitive Science), Simon Fraser University, 1995 a project submitted in partial fulfillment of the requirements for the degree of Master of Publishing in the Faculty of Arts and Social Sciences c Jen Chang 2006 SIMON FRASER UNIVERSITY Summer 2006 All rights reserved. This work may not be reproduced in whole or in part, by photocopy or other means, without permission of the author.

Welcome message from author
This document is posted to help you gain knowledge. Please leave a comment to let me know what you think about it! Share it to your friends and learn new things together.
Transcript

THE SAMPLE EXPERIENCE:
THE DEVELOPMENT OF A RICH MEDIA ONLINE
MATHEMATICS LEARNING ENVIRONMENT
by
Jen Chang
B.A. (Cognitive Science), Simon Fraser University, 1995
a project submitted in partial fulfillment
of the requirements for the degree of
Master of Publishing
in the Faculty
of
Arts and Social Sciences
c© Jen Chang 2006
SIMON FRASER UNIVERSITY
Summer 2006
All rights reserved. This work may not be
reproduced in whole or in part, by photocopy
or other means, without permission of the author.
APPROVAL
Name: Jen Chang
Degree: Master of Publishing
Title of Project: The SAMPLE Experience: The Development of a Rich Media
Online Mathematics Learning Environment
Supervisory Committee:
Dr. Rowland M. Lorimer
Senior Supervisor
Director, Canadian Centre for Studies in Publishing
Simon Fraser University
Dr. Jonathan M. Borwein, FRSC
Supervisor
Professor, Computer Science and Mathematics
Canada Research Chair in
Distributed and Collaborative Research
Dalhousie University
John W. Maxwell
Supervisor
Instructor, Master of Publishing Program
Simon Fraser University
Date Approved:
ii
Abstract
This report documents the development of Sample Architecture for Mathematically Product-
ive Learning Experiences (SAMPLE), a rich media, online, mathematics learning environ-
ment created to meet the needs of middle school educators. It explores some of the current
pedagogical challenges in mathematics education, and their amplified impacts when coupled
with under-prepared teachers, a decidedly wide-spread phenomenon. The SAMPLE publish-
ing experience is discussed in terms of its instructional design, multidisciplinary workflow,
and technical framework. Considerations for like ventures in the future are analyzed.
iii

To my best friend, Dennis, for his encouragement, trust, and good humour;
and to my parents for their support, sacrifice and love.
iv

“Please don’t take it amiss, good sirs, if there are more mistakes in this little book than
there are grey hairs on my old head. What can I do? I’ve never had much to do with
book-learning and the like before. May the fellow who dreamed it all up choke on his
porridge! As you stare at those letters they start to look the same. Your eyes cloud over,
just like someone had scattered grain all over the page. See how many misprints I’ve
found! All I ask, if you find any of them, is that you pay no attention, and read them as if
they were spelt correctly.”
Village Evenings near Dikanka — Nikolai Gogol, 1993
v

Acknowledgments
I am grateful to Dr. Rowland Lorimer for his thoughtful guidance and invaluable support
during my graduate studies and throughout the preparation of this project report. My sin-
cere thanks go to Dr. Jonathan Borwein and Mr. John Maxwell for their mentorship and
for serving on my supervisory committee.
I would also like to extend my humble appreciation to the following individuals for their
contributions and encouragement that made this work possible:
Mr. Rob Ballantyne, Dr. Tom Brown, Ms. Rebecca DeCamillis, Ms. Astrid Geck, Dr.
David Kaufman, Dr. June Lester, Ms. Jo-Anne Ray, Dr. Rob Scharein, and Dr. Alexa van
der Waall.
The SAMPLE project was partly funded by the Canada Research Chairs Program, the
Natural Sciences and Engineering Research Council of Canada, the Social Sciences and
Humanities Research Council and MathResources Inc. My graduate work was partly sup-
ported by the Southam Inc. Graduate Entrance Scholarship in Publishing Studies and
research assistantships from the Centre for Experimental and Constructive Mathematics
and the Canadian Centre for Studies in Publishing.
Finally, I would like to thank Dr. Kevin Hare for sharing with me a wonderful quotation.
vi

Contents
Approval ii
Abstract iii
Dedication iv
Quotation v
Acknowledgments vi
Contents vii
List of Figures ix
1 Introduction 1
1.1 Mathematics Education Reform and SAMPLE . . . . . . . . . . . . . . . . . 1
1.2 Some Challenges and Trends in Mathematics Education . . . . . . . . . . . . 2
1.3 The Use of Computer Technologies and SAMPLE . . . . . . . . . . . . . . . . 3
1.4 About SAMPLE . . . . . . . . . . . . . . . . . . . . . . . . . . . . . . . . . . 3
1.5 About This Report . . . . . . . . . . . . . . . . . . . . . . . . . . . . . . . . . 4
2 Rationale for SAMPLE 6
2.1 The Growing Importance of Numeracy . . . . . . . . . . . . . . . . . . . . . . 7
2.2 The Current State of Student Performance in Mathematics . . . . . . . . . . 8
2.3 Findings and Shifts in Pedagogical Models in Mathematics . . . . . . . . . . 12
2.3.1 Instructivist vs. Constructivist Learning Models . . . . . . . . . . . . 12
2.4 Factors that Affect Learning Outcomes . . . . . . . . . . . . . . . . . . . . . . 13
vii
2.4.1 Mathematics Anxiety . . . . . . . . . . . . . . . . . . . . . . . . . . . 14
2.4.2 Enrollment, Disengagement and Attrition . . . . . . . . . . . . . . . . 15
2.4.3 Teachers’ Qualifications . . . . . . . . . . . . . . . . . . . . . . . . . . 18
2.4.4 Cumulative Effect . . . . . . . . . . . . . . . . . . . . . . . . . . . . . 20
3 Project Description 22
3.1 Part I: Instructional Design . . . . . . . . . . . . . . . . . . . . . . . . . . . . 22
3.1.1 Target Audience . . . . . . . . . . . . . . . . . . . . . . . . . . . . . . 23
3.1.2 Project Workflow . . . . . . . . . . . . . . . . . . . . . . . . . . . . . . 24
3.1.3 Content Design . . . . . . . . . . . . . . . . . . . . . . . . . . . . . . . 28
3.1.4 The General Structure of SAMPLE . . . . . . . . . . . . . . . . . . . 28
3.2 Part II: Technical Aspects of SAMPLE . . . . . . . . . . . . . . . . . . . . . . 41
3.2.1 Authoring of Rich Media Mathematical Learning Objects . . . . . . . 41
3.2.2 Design of a Learning Content Management System . . . . . . . . . . . 55
3.2.3 Summary of the Technical Aspects of SAMPLE . . . . . . . . . . . . . 57
3.2.4 A Brief Case Study of ISM and SAMPLE . . . . . . . . . . . . . . . . 60
4 Conclusion 61
4.1 The SAMPLE Experience . . . . . . . . . . . . . . . . . . . . . . . . . . . . . 62
4.2 Outcomes of SAMPLE . . . . . . . . . . . . . . . . . . . . . . . . . . . . . . . 63
4.3 Future Research . . . . . . . . . . . . . . . . . . . . . . . . . . . . . . . . . . 64
4.3.1 Constructing a Better Learning Content Management System . . . . . 65
4.4 Some Final Comments About the Audience of SAMPLE . . . . . . . . . . . . 65
References 66
viii

List of Figures
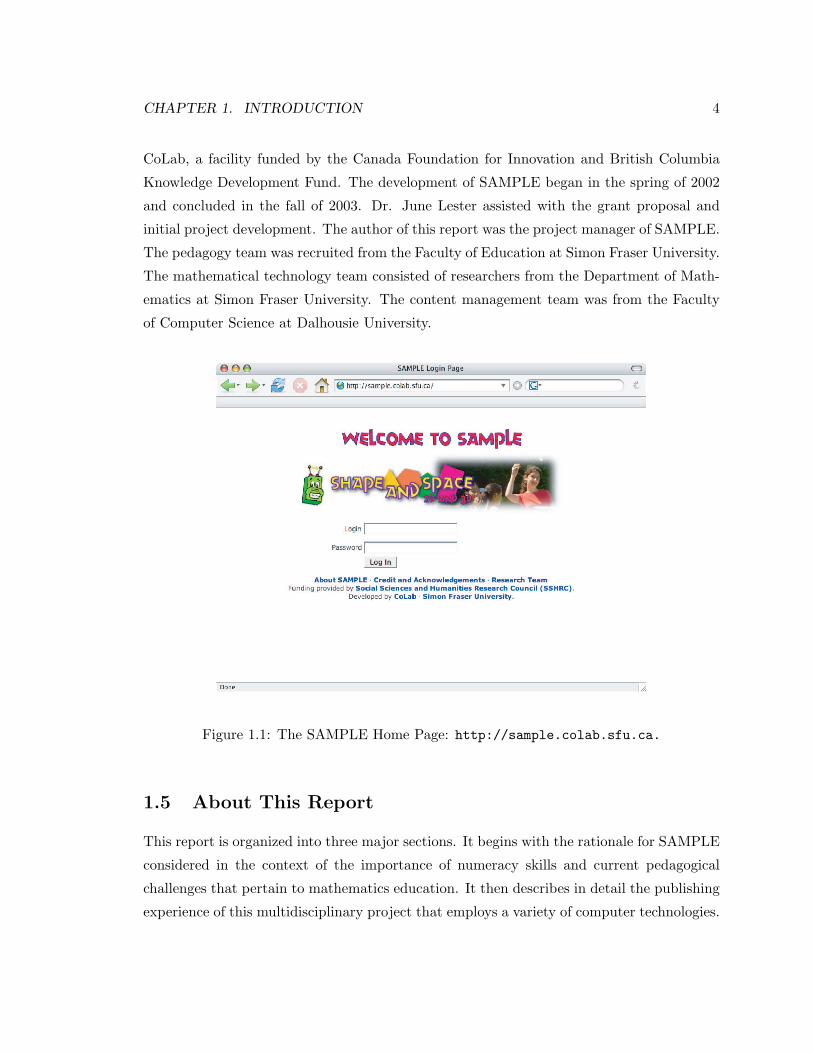
1.1 The SAMPLE Home Page: http://sample.colab.sfu.ca. . . . . . . . . . . 4
3.1 An Applet on Triangle Inequality. . . . . . . . . . . . . . . . . . . . . . . . . . 29
3.2 The D3 Play Applet with the Challenge Section. . . . . . . . . . . . . . . . . 30
3.3 The E6 Learn Section. . . . . . . . . . . . . . . . . . . . . . . . . . . . . . . . 32
3.4 The E2 Talk Through Section. . . . . . . . . . . . . . . . . . . . . . . . . . . . 33
3.5 The E4 Self Check. . . . . . . . . . . . . . . . . . . . . . . . . . . . . . . . . . 34
3.6 The E3 Parents’ Notes. . . . . . . . . . . . . . . . . . . . . . . . . . . . . . . 35
3.7 The D6 Teachers’ Notes. . . . . . . . . . . . . . . . . . . . . . . . . . . . . . . 36
3.8 The E5 Question Bank. . . . . . . . . . . . . . . . . . . . . . . . . . . . . . . 37
3.9 The Chat Log. . . . . . . . . . . . . . . . . . . . . . . . . . . . . . . . . . . . . 38
3.10 The Chat-N-Time Section. . . . . . . . . . . . . . . . . . . . . . . . . . . . . . 39
3.11 The WWW Board Section. . . . . . . . . . . . . . . . . . . . . . . . . . . . . . 40
3.12 The Customized Site Search Provided by Google’s Public Service Search. . . 42
3.13 Pedagogy Team’s Specification of the Play Section in Lesson D3, Naming and
Classifying Polygons. . . . . . . . . . . . . . . . . . . . . . . . . . . . . . . . . 43
3.14 The Actual Play Section Built for Lesson D3. . . . . . . . . . . . . . . . . . . 44
3.15 Pedagogy Team’s Specification for the Play Section in Lesson D5, Precise
Description of Shapes. . . . . . . . . . . . . . . . . . . . . . . . . . . . . . . . 45
3.16 The Actual Play Section Built for Lesson D5. . . . . . . . . . . . . . . . . . . 45
3.17 Pedagogy Team’s Specification of the Play Section in Lesson E3, Approxim-
ation of the Circumference of a Circle. . . . . . . . . . . . . . . . . . . . . . . 46
3.18 The Actual Play Section for Lesson E3. . . . . . . . . . . . . . . . . . . . . . 46
3.19 Pedagogy Team’s Specification for the Play Section for Lesson D6, 3D Shapes
with Specific Faces. . . . . . . . . . . . . . . . . . . . . . . . . . . . . . . . . . 47
ix

3.20 The Actual Play Section Built for Lesson D6, 3D Shapes with Specific Faces. 48
3.21 The Specification Provided by the Pedagogy Team on the Scalene Triangle
Applet for the Learn Section of Lesson D1, Constructing Triangles. . . . . . . 49
3.22 Cinderella’s User Interface with its Many Features for Geometry Constructions. 49
3.23 The Resulting Scalene Triangle Applet as Exported from Cinderella. . . . . . 49
3.24 The User Interface of The Geometer’s Sketchpad. Source: Dr. June Lester,
by permission. . . . . . . . . . . . . . . . . . . . . . . . . . . . . . . . . . . . 50
3.25 Exported from The Geometer’s Sketchpad, the Play Section for Lesson D1,
Constructing Triangles. . . . . . . . . . . . . . . . . . . . . . . . . . . . . . . 50
3.26 The Play Applet Specification for Lesson E6. . . . . . . . . . . . . . . . . . . 51
3.27 The Modified Version of the Unfolding Polyhedra. . . . . . . . . . . . . . . . 52
3.28 Francois Labelle’s Applet Web Page. . . . . . . . . . . . . . . . . . . . . . . . 52
3.29 Pattern Blocks Applet by Arcytech. . . . . . . . . . . . . . . . . . . . . . . . 54
3.30 Tangram Applet by MathResources Inc. . . . . . . . . . . . . . . . . . . . . . 54
3.31 Interface of Prototype Database. Source: The SAMPLE project, by permission. 56
3.32 The Pull-down Menu of the Types of Components. Source: The SAMPLE
project, by permission. . . . . . . . . . . . . . . . . . . . . . . . . . . . . . . . 57
3.33 The Pull-down Menu of the Component list. Source: The SAMPLE project,
by permission. . . . . . . . . . . . . . . . . . . . . . . . . . . . . . . . . . . . 58
3.34 Confirmation Window for Component Submission. Source: The SAMPLE
project, by permission. . . . . . . . . . . . . . . . . . . . . . . . . . . . . . . . 58
3.35 Textual Component Entered with HTML Mark-up Tags. Source: The SAMPLE
project, by permission. . . . . . . . . . . . . . . . . . . . . . . . . . . . . . . . 59
x

Chapter 1
Introduction
The Sample Architecture for Mathematically Productive Learning Experiences (SAMPLE)
project was a teacher-focused research initiative designed to develop stand-alone learning
materials for a middle school curriculum. It entailed the development of a prototype that
harnessed “rich media”1 and communication technologies to provide educators, new and
experienced alike, with more tools to cope with the demands in today’s classrooms. The
long-term goal was to build on the knowledge gained from this experience and apply it in a
larger setting to enhance learning in high school and post-secondary mathematics classes.
1.1 Mathematics Education Reform and SAMPLE
SAMPLE was conceived in the midst of mass reforms in mathematics education. The
impetus for this project was influenced by three factors: 1) the growing importance of
numeracy in society, 2) the current state of mathematics learning, and 3) the benefits
emergent technologies can offer in the classroom. Around the world, the definition of literacy
has expanded to include a quantitative aspect. Numeracy is being recognized by UNESCO
and other agencies as an indispensible skill in everyday life, one that is intimately tied
to an individual’s economic survival (Wagner, 2001). With the latest large-scale study,
the International Adult Literacy and Skills Survey (IALSS)2, showing that 55.1% of the
1The term “rich media” was first coined by Suzanne Brisendine of Intel in 1998 to refer to “technologiesthat created a richer surfing experience” (McCloskey, 2000) which included interactive digital technologies.
2The International Adult Literacy and Skills Survey 2003, released in 2005 by Statistics Canada, is thesecond round of the International Adult Literacy Survey (IALS). Internationally, the IALSS is known as
1

CHAPTER 1. INTRODUCTION 2
population aged 16 and above in Canada lacks basic numeracy skills, there is an urgency
to make mathematics education more accessible and accommodating to the current crop of
students. In fact, as numeracy becomes a priority and equity a guiding principle, major
changes to pedagogical practices are needed.
1.2 Some Challenges and Trends in Mathematics Education
Measures put in place by policy makers to address some of the challenges in mathematics
education include fundamental changes to pedagogy and school curriculum. These initiatives
often entail curriculum renewal and more mandatory courses. However, these approaches
are not without serious consequences to the integrity of the educational system as a whole.
For example, more topics3 are being included by curriculum designers. These extra re-
quirements are problematic because they increase the load for both teachers and students,
especially for those using the “spiral curriculum”4. Another consequence of such mathem-
atics reforms is that, as a means to raise student participation and attainment in high level
mathematics, mathematics education has become mandatory for more students for a longer
period of time in school with a shift from a focus on excellence to one on the basics. Some
researchers have attributed the gradual decline in student performance on national math-
ematics competitions to a cut in enrichment support5. Concomitantly, there is an increased
emphasis on developing students’ problem-solving skills. Yet, teachers are already struggling
with an over-reaching curriculum that is too large (W. H. Schmidt, McKnight, & Raizen,
1997, pp. 4) to deliver without sacrificing mentorship and individual student attention. To
take into account factors, such as growing class sizes or under-prepared teachers, it becomes
a daunting task for any educational system to implement such a broad mandate.
the Adult Literacy and Lifeskills Survey (ALL). The IALS was conducted between 1994 and 1998 with 22participating countries. The ALL survey had six countries participating in the first phase in 2003 and fivecountries in the second phase in 2005. These surveys are designed to measure adult literacy skills, such asprose, document, and quantitative literacies. Problem solving literacy was added to the ALL survey.
3Topics that are seen as vital for all to function in the technological society such as statistics and prob-ability were added to the British Columbia curriculum.
4There are two prevalent curricula in use in the educational system: spiral and mastery. A spiral cur-riculum is one that covers a multitude of topics each school year and then builds on them in the subsequentyears. A mastery curriculum covers a small number of topics in depth in the year they are taught and mayor may not be built upon in subsequent years. Students are expected to master each topic before advancingto the next. British Columbia subscribes to a spiral curriculum.
5According to Professor George Bluman, BC students have been performing more poorly than theirOntario counterparts on the Euclid Mathematics Contest since 2001. (R. Schmidt, 2005)

CHAPTER 1. INTRODUCTION 3
1.3 The Use of Computer Technologies and SAMPLE
To mitigate some of the above challenges, there is a movement to incorporate technologies
into the classroom. One of the advantages of using computer technologies is the ability
to customize the learning environment for both educators and students. Lessons can be
designed to take into account individual learning style, aptitude and performance. An-
other benefit of technologies is the capability to assist students in visualizing mathematical
concepts through a series of interactive simulations and experiments. In fact, one of the
outcomes of the mass reforms in mathematics education is to engage students in explorat-
ory activities with manipulatives (both concrete and virtual) in order to ameliorate their
problem-solving skills. Computer programs that employ rich media offer students modes
of mathematical visualization that are often not feasible using traditional methods. As
an added bonus, teachers can easily conduct and manage concurrent virtual mathematics
experiments and visualization exercises in a classroom setting.
SAMPLE’s role was to harness the capabilities of computer technologies to deliver a
discovery-based learning environment that was tailored to, first and foremost, teachers in
addition to students and parents. It was intended to address the needs of elementary and
middle-school mathematics educators, who were often under-prepared, by providing easy-
to-use lesson plans, interactive content and remedial resources in a scalable system.
1.4 About SAMPLE
The SAMPLE project6 (see Figure 1.1) was supported by an Initiative on the New Economy
grant from the Social Sciences and Humanities Research Council of Canada. SAMPLE’s
principal investigator was Dr. David M. Kaufman from the Learning and Instructional
Development Centre at Simon Fraser University. Dr. Jonathan M. Borwein7 and Dr. Car-
olyn R. Watters from the Faculty of Computer Science at Dalhousie University were the
co-investigators. MathResources Inc. was a partner of the SAMPLE project. Research
personnel were partly funded by the Natural Sciences and Engineering Research Council of
Canada and the Canada Research Chairs program. Much of the research took place in the
6To visit the SAMPLE site, use the login and password pairs: student/studentpass for student-levelaccess; parent/parentpass for parent-level access; and teacher/teacherpass for teacher-level access.
7Dr. Borwein was in the Department of Mathematics at Simon Fraser University until the conclusion ofthe SAMPLE project.
CHAPTER 1. INTRODUCTION 4
CoLab, a facility funded by the Canada Foundation for Innovation and British Columbia
Knowledge Development Fund. The development of SAMPLE began in the spring of 2002
and concluded in the fall of 2003. Dr. June Lester assisted with the grant proposal and
initial project development. The author of this report was the project manager of SAMPLE.
The pedagogy team was recruited from the Faculty of Education at Simon Fraser University.
The mathematical technology team consisted of researchers from the Department of Math-
ematics at Simon Fraser University. The content management team was from the Faculty
of Computer Science at Dalhousie University.
Figure 1.1: The SAMPLE Home Page: http://sample.colab.sfu.ca.
1.5 About This Report
This report is organized into three major sections. It begins with the rationale for SAMPLE
considered in the context of the importance of numeracy skills and current pedagogical
challenges that pertain to mathematics education. It then describes in detail the publishing
experience of this multidisciplinary project that employs a variety of computer technologies.
CHAPTER 1. INTRODUCTION 5
SAMPLE’s instructional design is discussed in terms of its target audience, project workflow,
content design, and the organization of lessons in the SAMPLE portal. The technical
aspects of SAMPLE are then considered in two parts: 1) the authoring of rich media
mathematical learning objects8, and 2) the design of a learning management system. It
concludes with a reflection and assessment of developing technology-based mathematics
learning environments.
8Learning objects are small self-contained software modules that are designed to be reusable in differentlearning environments.

Chapter 2
Rationale for SAMPLE: Reasons
for Creating an Online Curriculum
One of SAMPLE’s goals was to augment classroom activities by building an online learning
community that allowed for the sharing of ideas and learning objects by both the teachers
and students.
The strategy of SAMPLE was not to transfer traditional teaching materials into digital
formats but to combine traditional teaching wisdom with the use of information and com-
munications technologies (ICT). SAMPLE endeavoured to render the use of technologies
as intuitive and seamless as possible so as to free the students and teachers from getting
distracted from the actual content at hand.
In fact, SAMPLE equipped instructors with the necessary tools to incorporate their own
materials into the lesson plans and combined technology training, curriculum integration,
and student performance assessment in a cohesive manner. This approach was particularly
useful because it empowered instructors with an easy-to-use system that they could quickly
learn and build on to prepare lesson plans.
“In our experience supporting academics in making effective use of the Web for
teaching and learning is best achieved by placing the academic in the role of
a learner who develops technical skills on a need-to-know basis by discussing
potential improvements in their own pedagogical practice.” (Littlejohn, Stefani,
& Sclater, 1999, p. 30)
6

CHAPTER 2. RATIONALE FOR SAMPLE 7
A rich media-based initiative also fits in with the prevailing pedagogy by using a con-
structivist approach, that is, one that creates a discovery-based environment for learning,
and serves to teach literacy and numeracy in addition to engaging in technology diffusion.
Technological advances allow for more innovative ways (e.g. graphics, applets, etc.) to bring
mathematics to the classroom which in turn allow students to experiment more easily and
develop intuitions at the same time.
2.1 The Growing Importance of Numeracy
“Citizens who cannot reason mathematically are cut off from whole realms of
human endeavor. Innumeracy deprives them not only of opportunity but also of
competence in everyday tasks.” (Kilpatrick, Swafford, & Findell, 2001, p. 16)
Mathematics is the language of science and technology1. It is well established in the
literature that many-faceted digital divides2 are developing and that upskilling the general
population in numeracy may help improve a region’s competitiveness3 (Ontario Task Force
on Competitiveness, Productivity and Economic Progress, 2002) and preserve the standard
of living of its people (Betcherman, 1997). The International Adult Literacy Survey (IALS)
(Statistics Canada, 1995), for example, has found a strong linkage between numeracy and
an individual’s economic security. In fact, mathematical understanding has become an
increasingly important skill both in the workplace and in everyday life. Yet, in Canada,
55.1% of adults between 16 and 65 years of age have less than the desired level of numeracy
(Statistics Canada, 2005, p. 27). Furthermore, according to a report by the US National
Academy of Sciences, “three of every four Americans stop studying mathematics before
completing career or job prerequisites.” ((US) National Research Council, 1989, pp. 1–2)
1A report by the National Research Council examined the relationship between mathematical sciencesand modern industries in the United States and made a strong case for strengthening mathematics edu-cation “from kindergarten through graduate school” (Glimm, 1991, p. v) as a means to ensure economiccompetitiveness.
2Leslie Regan Shade, currently at Concordia University, prepared an in-depth review (Shade, 2002) ofthe wide-ranging literature on the subject.
3According to the World Knowledge Competitiveness Index 2005, six Canadian regions were consideredand all were ranked among the bottom half of the 125 knowledge-based regional economies in the study(Huggins, Izushi, & Davies, 2005). Canada is ranked seventh out of 61 nations in the IMD World Compet-itiveness Yearbook 2006 (IMD, 2006, p. 7) [cited by permission] and ranked 14th out of 117 nations on theWorld Economic Forum’s Growth Competitiveness Index 2005 (Porter, Schwab, & Lopez-Claros, 2005, p.7).
CHAPTER 2. RATIONALE FOR SAMPLE 8
A Statistics Canada study (Bordt, Broucker, Read, Harris, & Zhang, 2001, p. 12) shows
that only 18.6% of all Canadian upper secondary students surveyed in the Third Interna-
tional Mathematics and Science Study (TIMSS) were enrolled in mathematics in 1995. Of
all reporting countries, Canada has the lowest participation rate in mathematics. A dwind-
ling interest in mathematics is also evident in the findings of that study. While 89% of Grade
4 students sampled were keen about mathematics, that enthusiasm diminished to 74% for
Grade 8 students. For students in their final year of secondary school, only 61% remained
interested in the subject. Of those who stopped studying mathematics, 72% reported the
subject was too difficult and 48% found mathematics boring.
2.2 The Current State of Student Performance in Mathem-
atics
Results from domestic and international surveys have been relied upon as indicators of
student performance and they suggest that there is much room for improvement in our
educational system.
According to Human Resources and Skills Development Canada, 47% of all employ-
ment between 1987 and 2003 required at least post-secondary education (Bergeron, Dunn,
Lapointe, Roth, & Tremblay-Cote, 2004, p. 7) and that “six out of 10 jobs created during
that period were in highly skilled occupations4,” many of which required advanced numeracy
skills. In fact, it projects that, between 2004 and 2008, 66% of “new non-student jobs5 are
expected to require a post-secondary education or to be in the management group6” (Ber-
geron et al., 2004, p. 19). In British Columbia, the job forecast predicts that by 2013, 70%
of all employment openings will require some form of post-secondary education (Ministry
of Advanced Education, 2005, p. 6). Unfortunately, many youths are not even completing
their secondary education. In 2002–2003, the pan-Canadian secondary school graduation
4These include professional occupations in “natural and applied sciences (particularly computer andinformation systems professionals), in business and finance, and in social science, education and governmentservices.” (Bergeron et al., 2004, p. 6)
5Non-student jobs accounted for 92.8% of all employment in 2003. Temporary student employment isexcluded from this analysis of the permanent job market. (Bergeron et al., 2004, p. 16)
6The projection “assumed that most management positions require a high skill level.” (Bergeron et al.,2004, p. 19)

CHAPTER 2. RATIONALE FOR SAMPLE 9
rate was only 74%7 (Canadian Education Statistics Council, 2006, p. 215), far below some
of the OECD countries8 whose graduation rates are 90% or higher (OECD, 2005, p. 10). In
fact, the graduation rate of 74% already takes into account after-typical-age students. The
graduation rate drops to only 64% (Canadian Education Statistics Council, 2006, p. 237) if
only typical-age students are reported.
How do academic abilities and student attitudes correlate with student performance in
mathematics? International and domestic indicators are revealing a complex problem. In
the Canadian National Longitudinal Survey of Children and Youth (NLSCY)9, research-
ers have identified mathematics achievement as one of several valid indicators of academic
engagement (Norris, Pignal, & Lipps, 2003, p. 30). Other recent studies suggest that “en-
gaged” learners are more likely to succeed in class and complete secondary school.
At first glance, the waning interest in mathematics in Canada does not seem to dampen
mathematics achievement in middle school when mathematics performance of Canadian
students is compared to the performance of students from other countries in an international
context. Canadian students are above average in middle-school mathematics when compared
to their international counterparts. For example, a recent study10 placed 15-year-old British
Columbia students’ mathematical performance around the Canadian average, in the top
performing group among 41 surveyed countries, where Canada as a whole was part of an
eight-nation cluster outperformed by only two other countries (Bussiere, Cartwright, &
Knighton, 2004). However, other results and findings are not as encouraging.
While some research has shown that Canadian (and in fact North American) students’
mathematics proficiency has seen a modest improvement over the last decade, educators
are confronted with students having less-than-satisfactory performance and high attrition
rates in mathematics at both the secondary and post-secondary levels. For example, in the
2004–2005 school year, 69% of the Nova Scotia students did not pass the Math 12 provincial
exam (with an average of 41%) and 43% did not pass the Advanced Math 12 exam (with
7This rate does not include Quebec and Ontario in the 2002–2003 reporting partly due to Ontario’s doublegraduating cohorts as a result of the elimination of Grade 13 in 2003. Quebec’s reporting included those inadult programs. For comparison purposes, the 2000–2001 pan-Canadian overall graduation rate was 75%.
8The countries with graduation rates at 90% or higher include Germany, Greece, Ireland, Japan, Norwayand Switzerland.
9This joint project of Human Resources Development Canada (HRDC) and Statistics Canada was initiatedin 1994 – 1995.
10The Programme for International Student Assessment (PISA) is a study conducted by the Organisationfor Economic Co-operation and Development (OECD) of its member countries.
CHAPTER 2. RATIONALE FOR SAMPLE 10
an average of 54%) (Province of Nova Scotia, Department of Education, 2005, pp. 7-8).
In Ontario, only 27% of Grade 9 applied math students met the province’s standards in
2005 (Education Quality and Accountability Office, 2005, p. 45). In fact, the PISA report
confirms that a very troubling trend is emerging:
“PISA 2003 divides students according to the highest of the six proficiency levels
at which they can usually perform tasks correctly. . . . The small minority who
can perform the most complex and demanding tasks are ranked at Level 6; those
who can only perform very simple tasks are at Level 1. Students unable even
to complete these tasks are said to be “below Level 1”. . . . Only 4 per cent of
students in the combined OECD area . . . can perform the highly complex tasks
required to reach Level 6. . . . About a third of OECD students can perform
relatively difficult tasks at Levels 4, 5 or 6. . . . About three-quarters of OECD
students can perform at least mathematical tasks at Level 2. . . . Eleven per cent
of students in OECD countries are not capable even of Level 1 tasks. These
students may still be able to perform basic mathematical operations, but were
unable to utilize mathematical skills in a given situation, as required by the
easiest PISA tasks.” (OECD, 2004, p. 8).
The report reveals that 10% of Canadian students are at Level 1 or below. For Prince
Edward Island, our worst performing province, 18% of the students are in this category.
However, our North American counterparts fared even worse. More than one-quarter of the
students tested in the United States and two-thirds in Mexico are performing at Level 1 or
below (Bussiere et al., 2004, pp. 25–26).
At the post-secondary level, educators are noticing a competency gap despite the ex-
tremely high admission standards. Among those students who are admitted into post-
secondary institutions, many lack the basic skills to perform satisfactorily in their first-year
mathematics courses and are required to take remedial courses at universities all across
Canada. Many universities and colleges have been, or are in the process of, implementing
mathematics placement tests and remedial support for students. For example, at Univer-
sity of Manitoba, first-year students are required to take two semesters of remedial math
courses (“Failing our students: Dumbed down curriculum needs an overhaul”, 2004). In
fact, the problem of under-prepared freshmen has become so widespread that various forms
of mathematics placement tests and remedial support are being tried and implemented by

CHAPTER 2. RATIONALE FOR SAMPLE 11
institutions such as University of Victoria, Simon Fraser University, University of Ottawa,
Carleton University, and Ryerson University (S. Schmidt, 2005).
Some educators have attributed the inadequate preparation of incoming high school
students partly to the stringent admission requirements for post-secondary institutions.
These critics contend that taking a rigorous mathematics course could potentially lower the
students’ grade average, thus affecting their chances of admission. Others reported that
“grade inflation” was another factor.
Some might argue that perhaps these students would not have been accepted into uni-
versities had they taken their mathematics courses in high school. On the other hand,
perhaps a better high school curriculum could have provided the needed support for the
students to perform satisfactorily in mathematics both at high school and at the universit-
ies, in turn alleviating some of the fear students have about these courses. Others suggest
that the current curriculum and admission system may simply delay the remedial help stu-
dents needed to succeed. Whichever the case may be, secondary schools are graduating a
significant number of students who lack the basic mathematics foundation to undertake and
succeed in mathematics courses at the post-secondary level and this problem is too serious
to be ignored. One possible solution may point to early intervention at the secondary level.
The Council of Ministers of Education, Canada has been conducting the School Achieve-
ment Indicators Program (SAIP) to evaluate student achievement since 1993.
According to the SAIP 2001 Mathematics Assessment, the achievement of both the 13-
year-old and 16-year-old students failed to meet the expectations of a pan-Canadian panel
of educators and non-educators (Council of Ministers of Education, Canada, 2002, pp. 30–
32). For example, less than half (Canadian Education Statistics Council, 2003, p. 90) of the
16-year-old students demonstrated math problem solving skills at the desired Level 3. In
essence, the percentage of Canadian students expected to achieve at or above each of the
five performance levels as set out by the framework and criteria and by the questions asked
in the assessment did not materialize.
Similar studies and reports have prompted calls to reform mathematics instruction.
The US National Council of Teachers of Mathematics (NCTM) recommended five major
shifts to combat these weaknesses in the education system, all of which point towards a
cohesive discovery-based learning strategy that is aimed at increasing students’ problem
solving skills (National Council of Teachers of Mathematics, 1991, p. 3). Mathematics
education is seriously in need of revitalization.
CHAPTER 2. RATIONALE FOR SAMPLE 12
2.3 Findings and Shifts in Pedagogical Models in Mathem-
atics
“In reality, no one can teach mathematics. Effective teachers are those who can
stimulate students to learn mathematics. Educational research offers compelling
evidence that students learn mathematics well only when they construct their
own mathematical understanding.” ((US) National Research Council, 1989, p.
58)
Recent efforts to improve the educational system have produced new understanding in
learning models and the many factors that affect learning outcomes. For example, there
is a shift in pedagogical practices, from an instructivist learning model to a constructivist
one. Many factors, such as disengagement, that affect student learning have been identified.
While some of these factors apply to most school subject areas, many other factors, such
as mathematics anxiety and under-qualified teachers, are specific to mathematical learning
and contribute to diminished learning outcomes. Each of these topics is discussed in more
detail below.
2.3.1 Instructivist vs. Constructivist Learning Models
Many educators hold the opinion that “most students do not learn what teachers teach.
Instead they retain explanations personally constructed to account for phenomena in the
rational universe.” (Yager, 2000, p. 19) In fact, this perception is so widespread that some
(Connell, 1999; Corless, 1995) say that “mathematics is not taught, it is learned.”
There are two popular schools of thought on how mathematics education should be
conducted. The traditional approach is frequently referred to as an “instructivist” learning
model. An instructivist environment provides unidirectional communication and is often
characterized by rote-learning or direct instruction. In this setting, students are asked to
learn by memorizing procedures through mechanical repetitions as practice. Critics claim
that the instructivist approach often leads to passive learning styles where students are to
absorb knowledge via reading, seeing and listening.
The standards, issued by the NCTM, advocate a constructivist approach and have served
to mobilize a modal change in knowledge dissemination in the classroom. According to the
NCTM, instruction must focus on assisting students to develop thinking strategies. Some
CHAPTER 2. RATIONALE FOR SAMPLE 13
research has shown that a constructivist environment encourages reciprocal communication.
This means a change from a teacher-centred “instructivist” model to a student-centred “con-
structivist” regime (Diaz & Bontenbal, 2000). A concrete example of reciprocal communic-
ation could be that students, through the use of visualization and chat tools, discovered
and communicated alternative solutions that were equivalent and equally valid to those
presented by the teacher. The teacher would then be in a position to provide guidance that
would take into account the particular knowledge the students had gained in the discovery
process. In a constructivist setting, students are exposed to a multitude of contexts during
the learning process. They are encouraged to first explore the relationship between newly
presented information and their own prior knowledge, and then to construct new knowledge
and understanding. The students’ individual learning styles are also taken into account.
Proponents of this theory claim that a constructivist classroom not only contributes to act-
ive learning on the students’ part and builds critical thinking skills, but also the nature of
this model fosters collaboration and cooperation (Anderson, 1997). To build a constructiv-
ist learning environment requires a serious pedagogical shift, and even more importantly, a
commitment to fundamental cultural change.
2.4 Factors that Affect Learning Outcomes
How does one reconcile outstanding performance demonstrated by Canadian students on
international assessments with poor scholastic examination results and high attrition rate
in secondary mathematics enrollment? Critics have charged that curricular design may be
at the root of the problem which may explain the rising number of under-prepared freshmen
requiring, often mandatory, remedial assistance at the post-secondary level.
“Other education experts, however, said the main reason high school students
lose interest in math and science because of weak teachers and dry curriculum.”
(Sokoloff, 2002b)
From working with mathematics educators, SAMPLE researchers have learned that, in
the everyday classroom, mathematics anxiety and disengagement are two prevalent problems
that affect student learning outcomes and enrollment. Furthermore, low enrollment and
scholastic achievement in mathematics courses are often traced back to curricular deficiencies
(W. H. Schmidt et al., 1997), and a lack of qualified teachers or mentorship. There is ample

CHAPTER 2. RATIONALE FOR SAMPLE 14
evidence that mathematics anxiety affects learning and contributes to disengagement and
attrition as outlined in the following section.
2.4.1 Mathematics Anxiety
Mathematics anxiety is a common phenomenon11 and a serious problem afflicting many
students, parents12 and teachers alike (Zaslavsky, 1994; Tobias, 1978). In the Dreyfus
Gender Investment Comparison Study13 conducted in 1996 on 1287 adults between the ages
of 18 and 80, only 32% of the respondents were comfortable with high school mathematics
(Welsh, 1997).
A survey conducted in 1992 on 9,093 students by researchers at University of Florida
found that more than one-quarter of the respondents reported needing help to cope with
math anxiety (Probert & Vernon, 1997). Countless post-secondary lecturers of mathematics
education, at home (Cohen & Leung, 2004; Seaman, 1998) and abroad (Milgram, 2005;
Alderson, 1999; Cornell, 1999), can attest to the high-level of mathematics anxiety reported
by pre-service teachers14. It has been documented that 52% of primary teachers in Australia
had “negative feelings about teaching mathematics.” (Carroll, 1999) This phenomenon is
familiar to Canadian educators as well.
“At a recent orientation assembly [at University of Western Ontario], we asked
our in-coming group of 440 elementary preservice teachers how they felt about
mathematics. When asked to raise their hands if they loved mathematics, 15–20
hands went up. When asked to raise their hands if they hated mathematics, a
sea of hands filled the auditorium.” (Gadanidis & Namukasa, 2005)
In a large-scale review of 151 studies on the subject, it was found that among college
students of different majors, “the highest [mathematics] anxiety levels occurred for students
11Marilyn Burns, a prominent U.S. mathematics educator, claimed that “more than two-thirds of Americanadults fear and loathe mathematics” (Burns, 1998).
12A recent study randomly surveyed 500 adults each in Massachusetts and Washington States and foundthat while only 14% admitted to having mathematics anxiety, about 40% of respondents with childrenreported that it was more difficult to help their children with mathematics than with other subjects. Morethan half of the parents who did not help their children with mathematics cited personal incompetence orcomplex curriculum as the reason (Mass Insight Education and Research Institute, 2004).
13This study was conducted by Dr. Christopher L. Hayes of the National Center for Women and RetirementResearch (NCWRR) at the Long Island University.
14The impact of under-prepared and math anxious pre-service and in-service teachers is discussed in moredetails in the Teachers’ Qualifications section.
CHAPTER 2. RATIONALE FOR SAMPLE 15
preparing to teach in elementary school” (Hembree, 1990, p. 42). The same research also
found that “there is no compelling evidence that poor performance causes mathematics
anxiety,” and in fact that “higher achievement consistently accompanies reduction in math-
ematics anxiety . . . treatment can restore the performance of formerly high-anxious students
to the performance level associated with low mathematics anxiety.”
Mathematics anxiety impairs learning and can be debilitating for learners (Shore, 2005)
with devastating consequences. Research has found that “low-anxious students tend to
perform better on standardized achievement tests than high-anxious students” (Heinrich
& Spielberger, 1982, p. 155) and that “attitudes, including math anxiety, affect one’s op-
portunities to gain math competence, and an individual’s overall competence is one of two
major influences on performance.” (Ashcraft & Kirk, 2001, p. 236). In fact, the same
research has shown that “math anxiety disrupts the on-going, task-relevant activities of
working memory, slowing down performance and degrading its accuracy.” As a matter of
fact, poor performance and mathematics avoidance in the classroom have been attributed to
mathematics anxiety. Fortunately, researchers have found that intervention such as math-
ematics confidence workshops can help students of varying aptitude achieve “significant,
long-lasting, self-reported improvement in math performance and in the ability to learn and
use mathematics, as well as a reduction in math and test anxiety.” (Probert & Vernon,
1997, p. 6)
2.4.2 Enrollment, Disengagement and Attrition
In light of the changing work-place demands of a knowledge-based and information-rich
society, labour force readiness has become a major concern of Canadian policy makers. Hu-
man Resources Development Canada and Statistics Canada jointly developed the Youth in
Transition Survey (YITS), a longitudinal survey designed to investigate the relative success
of youths as they progressed from school to training and to work. One of the determining
factors of whether one stays in school is inextricably linked to school engagement.
Statistics Canada defines engagement, both academic and social, in terms of a student’s
identification with and participation in the respective context and measures engagement on
a scale based on responses to a series of questions, such as “I complete my assignments” or
“People at school are interested in what I had to say” (Bushnik, Barr-Telford, & Bussiere,
2004, p. 37). The survey showed a correlation between disengagement and attrition.
CHAPTER 2. RATIONALE FOR SAMPLE 16
“Relative to high school graduates, dropouts revealed attitudes and behaviours
indicative of less academic engagement in school.” (Bowlby & McMullen, 2002)
Many factors affect school engagement, including students’ social and economic back-
ground (Bowlby & McMullen, 2002). The YITS (Bushnik et al., 2004, p. 13) has found that
35% of dropouts were disengaged by age 15 and 19.9% of all dropouts reported being bored
at school. The same survey revealed that most high school dropouts left school because of
school-related reasons with being “bored or not interested” ranked highest on the list. Find-
ings from the National Longitudinal Survey of Children and Youth (NLSCY) underscores
the relationship between academic engagement and achievement.
“The academic engagement measure had a reasonable degree of predictive and
concurrent validity, correlating moderately with the measures of academic achieve-
ment15 and social engagement. . . . Academic and social engagement each com-
prise participation and identification.” (Norris et al., 2003, p. 30, 33)
According to the 2005 British Columbia Graduate Transition Survey (Ministry of Edu-
cation, 2005), teachers’ “moral support, motivation/discipline, and practical help” were
collectively ranked by respondents as the single most important school factor (at 59%) in
aiding students to reach graduation. Courses, on the other hand, were cited (at 28%) as
the main hindrance. Students claimed that courses were “too advanced or demanding” and
made it difficult to reach graduation.
At schools, educators are reporting a high number of “school leavers” and declining
interests in mathematics courses. According to Statistics Canada, only 18.6% of all upper
secondary students surveyed in the TIMSS were enrolled in mathematics in 1995, “the lowest
participation rate in mathematics of all the countries reporting.”16 The same study shows
that students in lower grades tend to have a more positive attitude towards mathematics
than those in upper grades. For example, 89% of grade 4 students reported “liking or
enjoying” mathematics compared to 74% in grade 8 and 61% in the last year of high school.
15Three measures of academic achievement were used: the mathematics computation scale score, theteacher’s rating of academic achievement, and the parent’s rating of academic achievement. (Norris et al.,2003, p. 30)
16Twenty countries reported their students’ mathematics participation rate (in order of student math-ematics participation): Russian Federation, Hungary, France, Cyprus, Slovenia, Czech Republic, Lithuania,Italy, Australia, Denmark, Austria, New Zealand, Sweden, South Africa, Norway, United States, Iceland,Switzerland, Netherlands, and Canada (Bordt et al., 2001, p. 12).
CHAPTER 2. RATIONALE FOR SAMPLE 17
Of the upper secondary students who dropped mathematics courses, more than 70% found
mathematics difficult.
“The most common reason for not taking mathematics courses was that stu-
dents found mathematics difficult. Nearly two-thirds of all the students sur-
veyed (63.6%) thought that mathematics was not an easy subject. For those not
currently taking mathematics, this figure rose to 72.1%” (Bordt et al., 2001, p.
6)
Perhaps the most troubling finding is that 59.9% of those who perceived themselves to
have good aptitudes in the subject dropped mathematics before grade 12. In fact, 55.5%
of all upper secondary students surveyed indicated that they would not like a job involving
mathematics. This rate jumps to 69.7% for those who are no longer taking mathematics
courses. Disengagement and attrition have some far-reaching consequences especially when
students become disengaged and withdraw from mathematics courses. Many students are
dissuaded from pursuing their careers as professionals after poor performance in mathem-
atics.
“Youth who had dropped out by the age of 17 were much less engaged in school
when they were 15 – both socially and academically – than were those who had
either continued in school or had already graduated.” (Bushnik et al., 2004, p.
13)
It must be said that not all “at risk” students can be re-engaged. However, for those
students whose interest in learning has not totally diminished, support from mentors is
essential. Research by Meece et al. suggests that “performance expectancies predict sub-
sequent math grades, whereas the perceived importance of mathematics predicts course
enrollment intentions”. The study also found that mathematics anxiety has “indirect ef-
fects on subsequent performance and enrollment intentions.” In fact, it was determined
that “students who assigned more importance to achievement in mathematics reported less
math anxiety,” and the researchers concluded that “teachers can help enhance students’
valuing of math in several ways, including explicitly relating the value of math to students’
everyday lives, making math personally meaningful, and counseling students about the im-
portance of mathematics for various careers.” (Meece et al., 1990, p. 69) Authors of the
CHAPTER 2. RATIONALE FOR SAMPLE 18
SAIP 2001 report further underline the critical role attitudes play in one’s success, noting
the importance of perseverance in mathematical learning:
“Student attitudes toward mathematics show a pattern of relationships with
achievement. Negative associations are found for perceived difficulty of math-
ematics and attribution of low mathematics marks to bad luck. The strong
pattern of positive associations for persistence at a difficult mathematics prob-
lem until it is solved suggests an element of internal motivation on the part of
higher-achieving students. More generally, the results for other similar items
reveal a pattern that might be interpreted as fatalism or external motivation
on the part of low-achieving students and internal motivation on the part of
higher-achieving students.” (Council of Ministers of Education, Canada, 2002,
p. 80)
Mentorship therefore plays an important role in engaging and retaining students and
such early intervention requires well-supported teachers.
2.4.3 Teachers’ Qualifications
“Too often, elementary teachers take only one course in mathematics, approach-
ing it with trepidation and leaving it with relief. Such experiences leave many
elementary teachers totally unprepared to inspire children with confidence in
their own mathematical abilities. What is worse, experienced elementary teach-
ers often move up to middle grades (because of imbalance in enrollments) without
learning any more mathematics.” ((US) National Research Council, 1989, p. 64)
Teachers of mathematics often have no special training in the subject matter. According
to TIMSS 2003, of the Grade 4 mathematics teachers surveyed in Ontario, 63% reported
to have primary/elementary education majors with no specialization in mathematics. In
fact, only 6% reported to have a primary education major and a major or specialization
in mathematics; 5% reported to have a mathematics or science major without a major in
primary education. For Grade 8 mathematics teachers surveyed in Ontario, 15% reported
to have a major in mathematics education and 12% reported to have a mathematics major.
Mathematics teachers in Ontario elementary schools are not required to be certified specialist
in the subject.
CHAPTER 2. RATIONALE FOR SAMPLE 19
According to a report in the Ottawa Citizen, “it’s possible to become a teacher in the
province of Ontario with no high school math credits past the compulsory Grade 10 (Laucius,
2004). The same teacher could be teaching mathematics at the elementary level. The
Ontario College of Teachers stipulates that “every Ontario teacher must be qualified in at
least two consecutive divisions,” (e.g., Primary/Junior) and that there are four divisions,
namely, “Primary (Grades K–3), Junior (Grades 4–6), Intermediate (Grades 7–10) and
Senior (Grades 11–12)” (Ontario College of Teachers, 2006, p. 27). In order to teach either
the Primary or Junior Division, a teacher must receive the Basic Qualification certification
which entails knowing the Ontario curriculum for the respective division. For example, a
teacher certified for the Junior Division is expected to know “the Ontario curriculum which
includes Grades 4–6, in all subject areas” for “program development, planning, implement-
ation and assessment and evaluation” (Ontario College of Teachers, 2001, p. 4). In other
words, teachers certified for the Primary/Junior Divisions are allowed and “may be asked
to teach everything” (including mathematics) (Ontario College of Teachers, 2005, p. 4).
An anecdotal account reported in the National Post echoes the concern about teacher
qualifications in British Columbia by a mathematics professor:
“I am at the moment teaching a class of 100 students who will be elementary
school teachers in 18 months and I would guess that no more than a half of
the students in the class are beyond the level that the test makers say most
13-year-olds should be at.” (Sokoloff, 2002a)
The said course was Math 190, Principles of Mathematics for Teachers, at Simon Fraser
University. According to the BC College of Teachers, the teacher education program pre-
scribes one compulsory university mathematics course17 in addition to a methodology course.
In British Columbia, teaching assignments are made at the discretion of the individual school
board where a certified elementary school teacher is usually hired as the primary teacher for
a given class and can be expected to teach all but specialty subjects (e.g., French immer-
sion, band/music or English as a Second Language) (British Columbia College of Teachers,
2006b, 2006a).
Unfortunately, these findings are not isolated instances and are actually supported by
other reports. In the Ontario Education Quality and Accountability Office (EQAO) Pro-
vincial Report on Achievement (1996-97), it was found that most Grade 6 teachers have no
17e.g., Math 335 at University of British Columbia or Math 190 at Simon Fraser University.

CHAPTER 2. RATIONALE FOR SAMPLE 20
formal training in “teaching or assessing mathematics” and many Grade 3 and 6 teachers
expressed discomfort teaching or assessing mathematics (Education Quality and Accountab-
ility Office, 1997, pp. 21, 39). It was noted in the SAIP 2001 that 13-year-old students who
were taught by subject teachers performed better in the problem solving component of the
mathematics assessment than those who were instructed by homeroom teachers (Council of
Ministers of Education, Canada, 2002, p. 86). It is no wonder that about one in five 13- and
16-year-olds students is receiving supplementary assistance such as tutoring in mathematics
(Council of Ministers of Education, Canada, 2002, p. 56).
Various studies (Cohen & Leung, 2004; Uusimaki & Kidman, 2004; Levine, 1996) and
support groups such as the Math Empowerment Workshops (Cohen, 2003; Cohen & Green,
2002) at University of Toronto have shown that appropriate intervention can reduce math-
ematics anxiety in the participants.
Another teacher qualification that is sometimes lacking in the classroom is computer
training. Since the use of ICT has become an integral part of the mathematics curriculum,
teachers who lack computer training further hinder learning in the classroom. While all
levels of government are committed to the use of ICT in the classroom, the implementation
of ICT in everyday instructions can be problematic and it varies across jurisdictions. In
fact, teachers are reporting that they are lacking preparation time for computer-based lesson
planning and “in most provinces, teachers’ lack of knowledge or skills in using computers
for instructional purposes was cited as a major obstacle in schools representing more than
50% of enrolments.” (Canadian Education Statistics Council, 2003, p. 73)
2.4.4 Cumulative Effect
“In the long run, it is not the memorization of mathematical skills that is partic-
ularly important – without constant use, skills fade rapidly – but the confidence
that one knows how to find and use mathematical tools whenever they become
necessary. There is no way to build this confidence except through the process of
creating, constructing, and discovering mathematics.” ((US) National Research
Council, 1989, p. 80)
Student outcomes are affected by teacher-specific characteristics, including mentorship.
It is said that “proficiency in most of mathematics is not an innate characteristic; it is
achieved through persistence, effort, and practice on the part of students and rigorous and

CHAPTER 2. RATIONALE FOR SAMPLE 21
effective instruction on the part of teachers.” (California State Board of Education, 1999,
p. v) Proper mentorship requires qualified teachers and holds the key to student retention.
Mathematically anxious teachers with few resources are less likely to be in a position
to provide mentorship for their students, especially those who require more support. To
counter this problem, it is important to change attitudes. It is also important to adjust
instructional styles to effect a change of culture. Some researchers (Burris, Heubert, &
Levin, 2004) have suggested that what disadvantaged “at risk” students need is not only
remedial help but also enrichment support as these students must learn at an accelerated
pace to catch up to their peers. This seemingly counter-intuitive strategy was demonstrated
to be quite fruitful by Henry M. Levin, an education and economics professor at Columbia
University, in his Accelerated Schools Project (Burris et al., 2004; Levin, 1995).
There are many structural issues inherent in mathematics education that warrant atten-
tion and a coordinated response from all involved. In order to re-engage at-risk students,
adequate guidance and mentorship must be made available from educators who are not
preoccupied with anxiety or an over-reaching curriculum. Mathematics educators who are
anxious or under-prepared need to seek intervention, such as mathematics empowerment
workshops, or to upgrade their professional qualifications in ICT and mathematics. Clearly,
some of these issues are beyond the scope of SAMPLE.
The role of the SAMPLE project, however, was to facilitate mathematical learning in this
context. In order to improve learning outcomes, SAMPLE tackled some of the issues outlined
above by specifically targeting several crucial areas in the educational system. By using
SAMPLE, educators had at their disposal all the necessary resources in the form of prepared
lesson plans and online remedial assistance specifically tailored for those who may be under-
prepared or needing a refresher course on the subject matter. (These features are explained
in the Project Description of this report.) SAMPLE applied principles of the constructivist
learning model in its designs by creating a discovery-based learning environment, one that
would allow students to develop intuition in problem solving. SAMPLE was also designed
with the capacity to embrace both remedial and enrichment approaches. The customized
environment was conducive to learning. In essence, SAMPLE allowed students to work at
their own pace and respected their individual learning styles. Better learning contributes to
an increase in engagement and a drop in attrition. Through the use of SAMPLE, teachers
may be able to find more time to provide mentorship and successful instructions in class.

Chapter 3
Project Description
The SAMPLE prototype website was an interdisciplinary collaborative publishing project
that brought together researchers from three domains: mathematics, education and com-
puter science. The goal of SAMPLE was to build a framework that would foster mathem-
atical learning in the classroom through the use of innovative technologies. In doing so, this
project allowed researchers to gain experience with design structure and to use SAMPLE as
a test bed to investigate how to integrate technology with mathematical learning as opposed
to how to develop more technology for mathematics education.
This project was mainly concerned with harnessing the dynamic nature of rich media,
such as interactivity, for the delivery of learning resources. The prototype was intended to
be a complete sample unit with limited scope. A geometry topic, Shape and Space, was
selected from a senior elementary school level mathematics curriculum and served as the
central focus of this project. The pedagogy team was responsible for devising a unit plan
of 14 lessons. The mathematical technology team, comprising mathematics researchers,
assisted with the creation of learning objects, as directed by the pedagogy team, to meet
the objectives of each lesson plan. The content management team, made up of computer
scientists, provided input on the theoretical architecture of the web portal structure.
3.1 Part I: Instructional Design
SAMPLE’s web-based learning environment was developed with the NCTM standards in
mind. The SAMPLE web portal, informed by the mathematics education reform to move
towards constructivist instruction, employs a student-centred approach.
22
CHAPTER 3. PROJECT DESCRIPTION 23
Many students who discontinue their mathematics education attribute anxiety to be their
chief obstacle. This is particularly true when materials are delivered in a passive fashion
where students try to learn by rote and drill without achieving real comprehension (Cornell,
1999; Levine, 1996; Williams, 1988; Stodolsky, 1985). Contemporary learning theories
suggest that knowledge is not transmitted from an authority to a learner but that active
construction takes place for the acquisition of knowledge and reconstruction for the recall of
information. The constructive process is enhanced when multimodal input are used in the
learning context (Anderson, 1997). Rich media make it possible for SAMPLE to present
learning materials in a variety of contexts, such as independent, collaborative or teacher-
directed, to suit different learning styles, such as textual, aural or visual. Interactive content
offers an opportunity to add another dimension to learning and allows students to acquire
mathematical concepts through experimentation and visualization. By using interactive
content, students are then able to conjecture and construct their own understanding before
internalizing the knowledge. For many, learning through discovery solidifies understanding
and, in turn, increases confidence and reduces mathematics anxiety.
3.1.1 Target Audience
SAMPLE provides support for three groups of users: teachers, students, and parents. As
such, the SAMPLE portal offers content via three streams to reflect a varying degree of
utility by each respective user group. The content provided to each group differs in terms
of function, access level and content sophistication.
3.1.1.1 Teacher Users
Educators are the primary users envisioned for the SAMPLE web portal. It is intended
to support instruction in several ways. One of the three main areas of support SAMPLE
provides is remediation of concepts. For those who lack the background or are otherwise
unfamiliar with a particular topic, SAMPLE acts as a training tool and offers teachers the
opportunity to learn or re-acquaint themselves with the concepts prior to devising a lesson
plan. Another major support SAMPLE provides is to facilitate the lesson planning process
itself. SAMPLE acts as a knowledge base with a repertoire of learning objects (e.g., applets,
sound bites, or video clips) that teachers can readily incorporate into their lesson plan. These
learning objects can be used independently or jointly with other resources the teachers may

CHAPTER 3. PROJECT DESCRIPTION 24
have compiled. The option to print some of the content assists the teachers with class
presentation. The third support SAMPLE offers is the ability to add learning objects to the
repository via the use of a web-based interface to a database. That is, SAMPLE acts as a
learning management system by giving teachers the flexibility to organize learning objects
and other resources developed in-house or contributed by others and to build new lesson
plans. In addition, SAMPLE also offers student assessment and monitoring tools as a part
of a comprehensive system. Teacher users have access to all sections in SAMPLE.
3.1.1.2 Student Users
SAMPLE offers students three levels of learning resources – remedial, curriculum, and en-
richment – for each lesson. For each of these levels, there are functionalities that enable
both independent and collaborative learning. For example, the descriptive content (akin to
lecture notes with diagrams and definitions) is tailored for independent learners. Self checks
such as pre-tests in the Are You Ready? section and post-tests in the How Did You Do?
section are designed to assess a student’s level of knowledge. Based on the results of the
tests, the teacher can guide a student to follow the links to lessons of a prerequisite unit for
remedial support or a more advanced unit for enrichment on the same topic. Enrichment
materials are also found in the form of challenge questions and problems in lessons where
appropriate. Student users do not have access to teacher- or parent-specific sections.
3.1.1.3 Parent Users
The SAMPLE project has invested some of its effort to encourage parental participation in
the students’ learning process. This goal is mainly accomplished by repurposing some of the
content in a form appropriate for parents to teach or refresh themselves with some of the
main mathematical concepts in each of the lessons. Parent users have access to all student
content in addition to Parents’ Notes.
3.1.2 Project Workflow
The lessons in SAMPLE were based on the provincial standards as set out in the British
Columbia Integrated Resource Package (Province of British Columbia, Ministry of Educa-
tion, Skills and Training, 1996). Project staff consulted the IRP for prescribed learning
outcomes, suggested instructional strategies, suggested assessment strategies and learning
CHAPTER 3. PROJECT DESCRIPTION 25
resources. While the project was guided by IRP’s Math 7, Shape and Space in its scope,
the content may be suitable for use by students between grades 5 and 7 outside of British
Columbia depending on the jurisdiction. In addition, the NCTM standards were used as
guiding principles for much of the pedagogical approach. The division of labour is described
in the workflow below.
3.1.2.1 The Pedagogy Team
The pedagogy team was made up of experienced mathematics school teachers and research-
ers recruited by the Faculty of Education at Simon Fraser University. The team reviewed
literature and available mathematics software, conducted content selection and authoring
of lesson plans.
The members of this team had several key responsibilities in the authoring process.
As education experts of the subject matter, they assumed the roles of designers, teachers,
writers, editors, and users of SAMPLE. They were instrumental in determining the overall
conceptual organization of the content.
The pedagogy team selected Shape and Space as the major topic that formed the basis
for the geometry unit. Each lesson covered a subtopic and was built with its target audience
in mind: teachers, students and parents. In fact, three user modes were offered and the
level of access was determined at the time the users logged into the system. For students,
every lesson revolved around four major sections: Play, Explore, Challenge and Learn, with
assessment and collaborative sections: Self-Check and Share Ideas. Parents had access to the
students’ section in addition to the Parents’ Notes section which provided supplementary
resources to those who wished to assist the students in a non-classroom setting and to gain
an understanding of the learning materials. Teachers had access to all sections including the
Teachers’ Den. The Teachers’ Den section was a collection of tools that enabled teachers
to review concepts, produce lesson plans and presentations, and develop new lessons. It
comprised several subsections: Teachers’ Notes, Question Bank, Chat Log and Math Links.
In all, 14 lessons were planned and produced in several stages.
As instructional designers, the team defined the feature and functionality requirements
of the sections. For example, a unit overview map was included for all lessons. As each unit
was intended for non-linear traversals, the map showed how one lesson related to another
and served as a breadcrumb for navigation purposes. The team also provided input on
how the user environment should be implemented. For instance, each lesson was set up
CHAPTER 3. PROJECT DESCRIPTION 26
to always default to the Play section to encourage discovery-based learning. The pedagogy
team requested the inclusion of assessment tools to gauge student progress and collaborative
tools to facilitate and monitor the actual learning process.
As teachers, the team researched and consulted various resources to build a comprehens-
ive constructivist strategy, like a blueprint, before drafting lesson plans. The team produced
a wish list of mathematical learning objects to be used in the Play and Learn sections by
providing detailed specifications of how these objects should behave and how they were
supposed to meet the learning objectives.
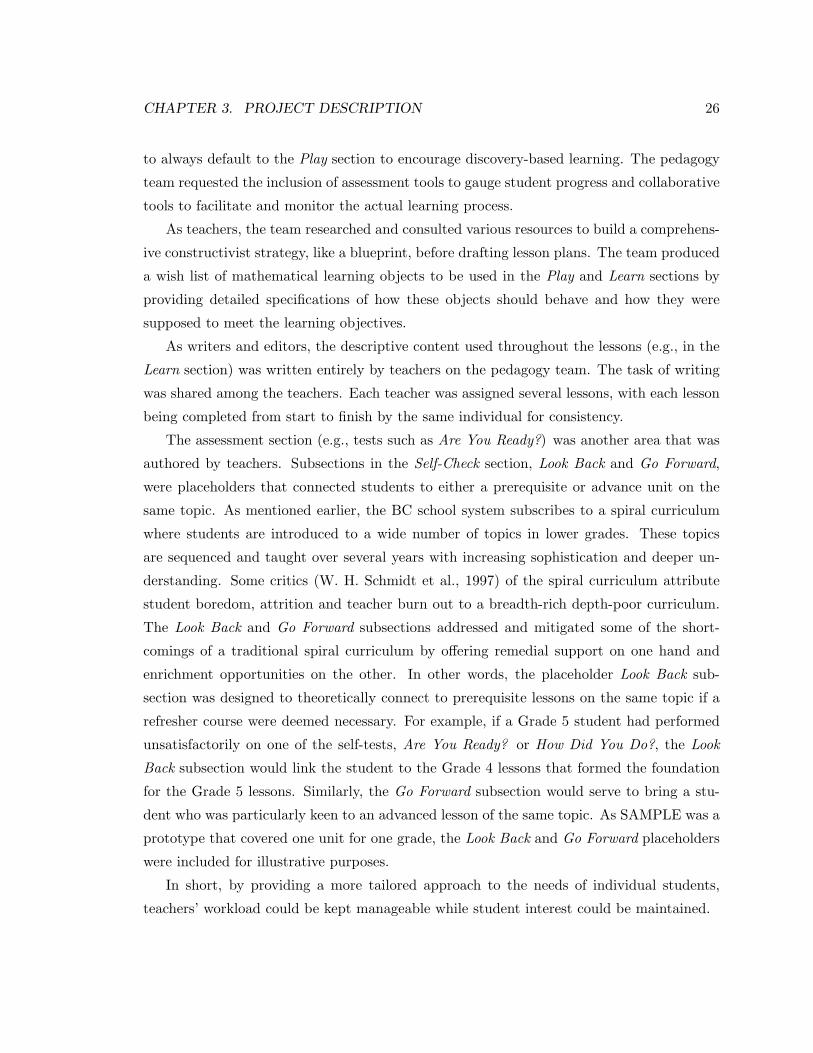
As writers and editors, the descriptive content used throughout the lessons (e.g., in the
Learn section) was written entirely by teachers on the pedagogy team. The task of writing
was shared among the teachers. Each teacher was assigned several lessons, with each lesson
being completed from start to finish by the same individual for consistency.
The assessment section (e.g., tests such as Are You Ready?) was another area that was
authored by teachers. Subsections in the Self-Check section, Look Back and Go Forward,
were placeholders that connected students to either a prerequisite or advance unit on the
same topic. As mentioned earlier, the BC school system subscribes to a spiral curriculum
where students are introduced to a wide number of topics in lower grades. These topics
are sequenced and taught over several years with increasing sophistication and deeper un-
derstanding. Some critics (W. H. Schmidt et al., 1997) of the spiral curriculum attribute
student boredom, attrition and teacher burn out to a breadth-rich depth-poor curriculum.
The Look Back and Go Forward subsections addressed and mitigated some of the short-
comings of a traditional spiral curriculum by offering remedial support on one hand and
enrichment opportunities on the other. In other words, the placeholder Look Back sub-
section was designed to theoretically connect to prerequisite lessons on the same topic if a
refresher course were deemed necessary. For example, if a Grade 5 student had performed
unsatisfactorily on one of the self-tests, Are You Ready? or How Did You Do?, the Look
Back subsection would link the student to the Grade 4 lessons that formed the foundation
for the Grade 5 lessons. Similarly, the Go Forward subsection would serve to bring a stu-
dent who was particularly keen to an advanced lesson of the same topic. As SAMPLE was a
prototype that covered one unit for one grade, the Look Back and Go Forward placeholders
were included for illustrative purposes.
In short, by providing a more tailored approach to the needs of individual students,
teachers’ workload could be kept manageable while student interest could be maintained.
CHAPTER 3. PROJECT DESCRIPTION 27
As editors and users, the pedagogy team also proofread the marked up content, evaluated
the rich media learning objects, provided feedback on usability issues, and conducted field
tests. (They were not familiar with the web-publishing process.)
3.1.2.2 The Mathematical Technology Team
Before any of the lesson plan was ready, the mathematical technology team began the work
of producing an infrastructure that met with the navigation requirements of the pedagogy
team. This included programming the basic elements of the SAMPLE site, such as the
log-in screen, the unit overview map, the side menus, the header graphics, and the user
interface. As the lesson plans gradually became available, the mathematical technology
team commenced the laborious process of marking up the descriptive content. At the same
time, the team was also responsible for generating high-quality mathematical illustrations
and graphics for use in worksheets. As these worksheets were meant to be usable both on
screen and in print, they were laid out and made available as pdf files for accessibility.
At the core of SAMPLE was the rich media content. While some of the media objects
(e.g., video clips, sound files, communication tools, etc.) were readily sourced under the
direction of the pedagogy team, suitable interactive learning objects were much harder to
come by in general. In fact, the development of learning objects according to specifications
was by far the most interesting and challenging aspect of the entire project. It provided
the mathematics technology team the opportunity to turn some very imaginative ideas into
actual stimulating instructional tools. Visualization played a key role in getting geometry
concepts across to students. To illustrate the rotation or translation of shapes in 2D or 3D
using computers required programmers with sophistication and ingenuity in both mathem-
atics and computer science. It became an even more daunting endeavour when one needed
to add interactivity to the equation.
3.1.2.3 The Content Management Team
In parallel development with the prototype website was a proof-of-concept script-based (i.e.,
Perl/CGI/DBI) application (see Figure 3.31) to aggregate content and generate web pages
from a Microsoft Access database (Kellar et al., 2003). The content management team,
based at Dalhousie University, was focused on ensuring content in the database could be
added or modified online. Through an applet interface, web-savvy teachers could administer

CHAPTER 3. PROJECT DESCRIPTION 28
the content. This aspect of the project is further discussed in the Design of a Learning Man-
agement System section with examples provided in Part II: Technical Aspects of SAMPLE.
3.1.3 Content Design
SAMPLE’s main contribution was the creation of a constructivist environment for instruc-
tion. This approach entailed the provision of a channel for discovery in the learning process
that goes beyond what a typical textbook would offer. It was not merely a matter of
replicating a textbook in digital format.
Mathematical concepts are often best explained by actual demonstrations. For example,
a popular exercise used in the traditional classroom by teachers to illustrate the property of
triangle inequality is to give students pieces of dry spaghetti of varying lengths and ask the
students to note which combinations of these pieces cannot form a triangle. Students are
then guided to recognize the pattern and to arrive at the conclusion that the length of the
longest side of the triangle must be less than the sum of the lengths of the other two sides.
To perform this exercise in a classroom is often messy and requires students to have good
manual dexterity and coordination. In SAMPLE, an applet has been designed to model
concepts like the triangle inequality. By allowing students to vary the length of each side
of a triangle, the applet simulates onscreen the shortening or lengthening of each side and
shows how the triangle would collapse when the total length of two shorter sides approach
the length of the longer side. The same concept is then reinforced in the textual content
in the Learn section. Not only are the students then in a position to articulate the new
principle, both parents and teachers are empowered with an easy-to-use tool that can be
repurposed in guiding students through similar questions in assignments (see Figure 3.1).
New interactive content must be carefully crafted to achieve the learning objectives and
yet leverage the technologies available. One of the challenging aspects of online content
design is building relevant and effective interactive learning objects that reinforce the math-
ematical concept displayed on screen. SAMPLE is intended to fill a gap in the learning
spectrum by providing alternatives to illustrate concepts with visualization activities.
3.1.4 The General Structure of SAMPLE
SAMPLE organized its learning materials by units. Each unit was centred around a math-
ematical topic that was developed through a series of lessons. Each lesson contained some of
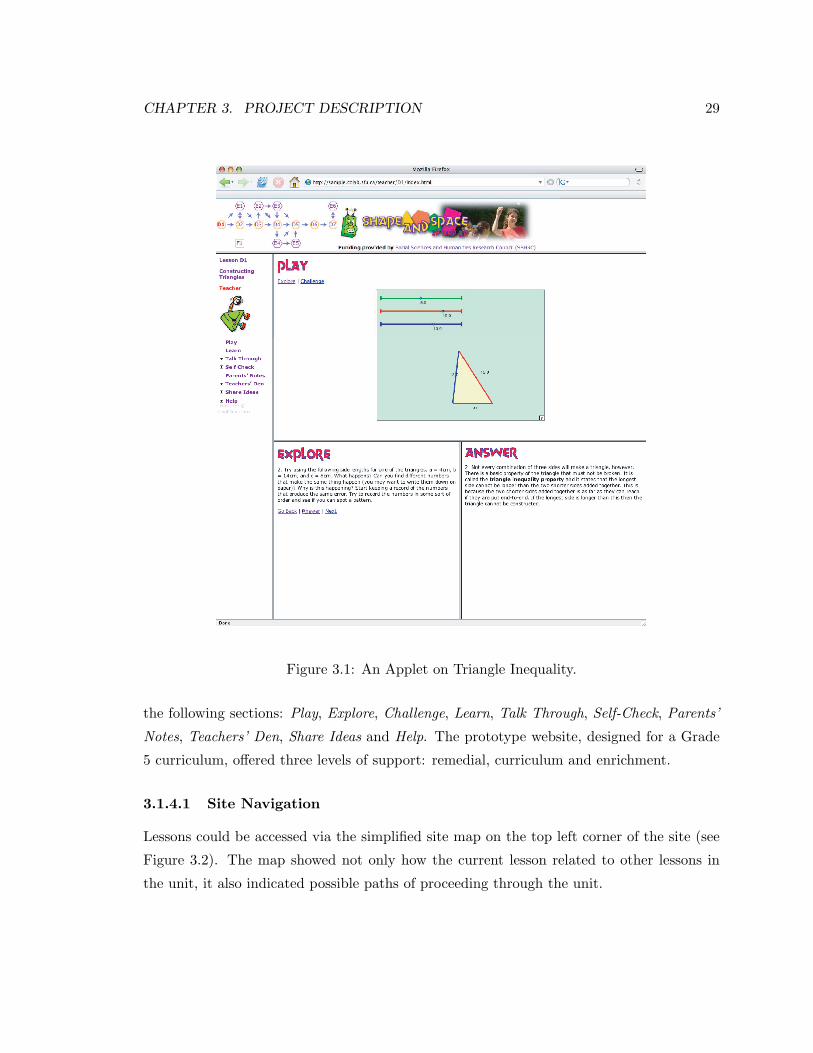
CHAPTER 3. PROJECT DESCRIPTION 29
Figure 3.1: An Applet on Triangle Inequality.
the following sections: Play, Explore, Challenge, Learn, Talk Through, Self-Check, Parents’
Notes, Teachers’ Den, Share Ideas and Help. The prototype website, designed for a Grade
5 curriculum, offered three levels of support: remedial, curriculum and enrichment.
3.1.4.1 Site Navigation
Lessons could be accessed via the simplified site map on the top left corner of the site (see
Figure 3.2). The map showed not only how the current lesson related to other lessons in
the unit, it also indicated possible paths of proceeding through the unit.

CHAPTER 3. PROJECT DESCRIPTION 30
Figure 3.2: The D3 Play Applet with the Challenge Section.
3.1.4.2 The Play Section
In a typical lesson, students would first encounter the Play section. This section was central
to the discovery-based curriculum. The Play section contained an interactive applet and
students were encouraged to experiment with it and to formulate some generalizations from
working with it. For example, in Figure 3.2, students were given the opportunity to in-
vestigate the relationship between vertices and sides of polygons. Visually, students were
introduced to concave and convex polygons simply by working with this applet. (See Fig-
ure 3.13 for the pedagogy team’s specification and objectives for this learning object.) Once
the students were ready to continue, they were directed to venture into the Explore and the
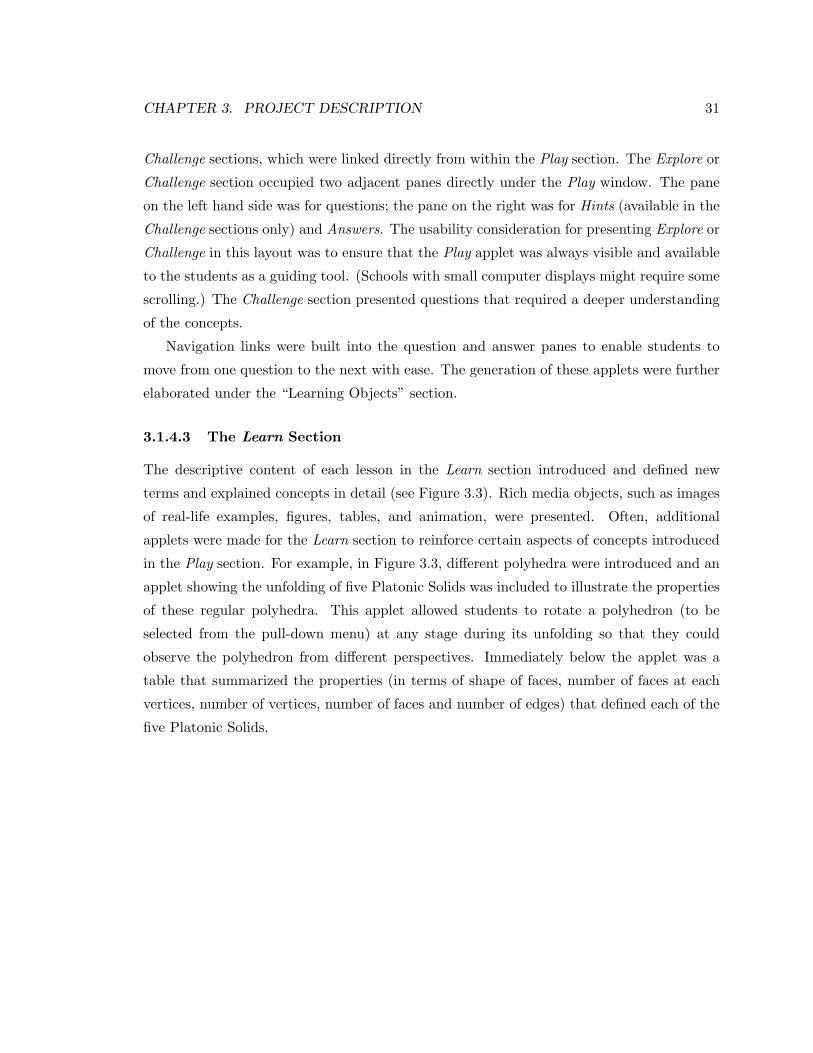
CHAPTER 3. PROJECT DESCRIPTION 31
Challenge sections, which were linked directly from within the Play section. The Explore or
Challenge section occupied two adjacent panes directly under the Play window. The pane
on the left hand side was for questions; the pane on the right was for Hints (available in the
Challenge sections only) and Answers. The usability consideration for presenting Explore or
Challenge in this layout was to ensure that the Play applet was always visible and available
to the students as a guiding tool. (Schools with small computer displays might require some
scrolling.) The Challenge section presented questions that required a deeper understanding
of the concepts.
Navigation links were built into the question and answer panes to enable students to
move from one question to the next with ease. The generation of these applets were further
elaborated under the “Learning Objects” section.
3.1.4.3 The Learn Section
The descriptive content of each lesson in the Learn section introduced and defined new
terms and explained concepts in detail (see Figure 3.3). Rich media objects, such as images
of real-life examples, figures, tables, and animation, were presented. Often, additional
applets were made for the Learn section to reinforce certain aspects of concepts introduced
in the Play section. For example, in Figure 3.3, different polyhedra were introduced and an
applet showing the unfolding of five Platonic Solids was included to illustrate the properties
of these regular polyhedra. This applet allowed students to rotate a polyhedron (to be
selected from the pull-down menu) at any stage during its unfolding so that they could
observe the polyhedron from different perspectives. Immediately below the applet was a
table that summarized the properties (in terms of shape of faces, number of faces at each
vertices, number of vertices, number of faces and number of edges) that defined each of the
five Platonic Solids.

CHAPTER 3. PROJECT DESCRIPTION 32
Figure 3.3: The E6 Learn Section.
3.1.4.4 The Talk Through Section
A placeholder was made in the Talk Through section (see Figure 3.4) to accommodate
students with an aural learning style. As a proof-of-concept, a recording of two scripts, a
full-script version and an interactive version, was made only for lesson E2. The full-script
version was based on the Learn section and was included with the prototype. The full-script
recording was configured to launch once the Talk Through section finished loading so that
students could follow along with the content on screen. The small control panel on the

CHAPTER 3. PROJECT DESCRIPTION 33
Figure 3.4: The E2 Talk Through Section.
top of the full-script version allowed students to adjust the volume, pause or resume the
recording. The interactive version required well-timed and coordinated on-screen activity
(which would be a rich media project in itself) and it was beyond the scope of this project.
The interactive version was reserved for the next stage of the development process.
3.1.4.5 The Self-Check Section
The Self-Check section comprised four sub-sections. The Are You Ready? (see Figure 3.5)
and How Did You Do? sections provided web-based testing for students to gauge their
understanding and progress. Figure 3.5 showed questions that students were expected to be
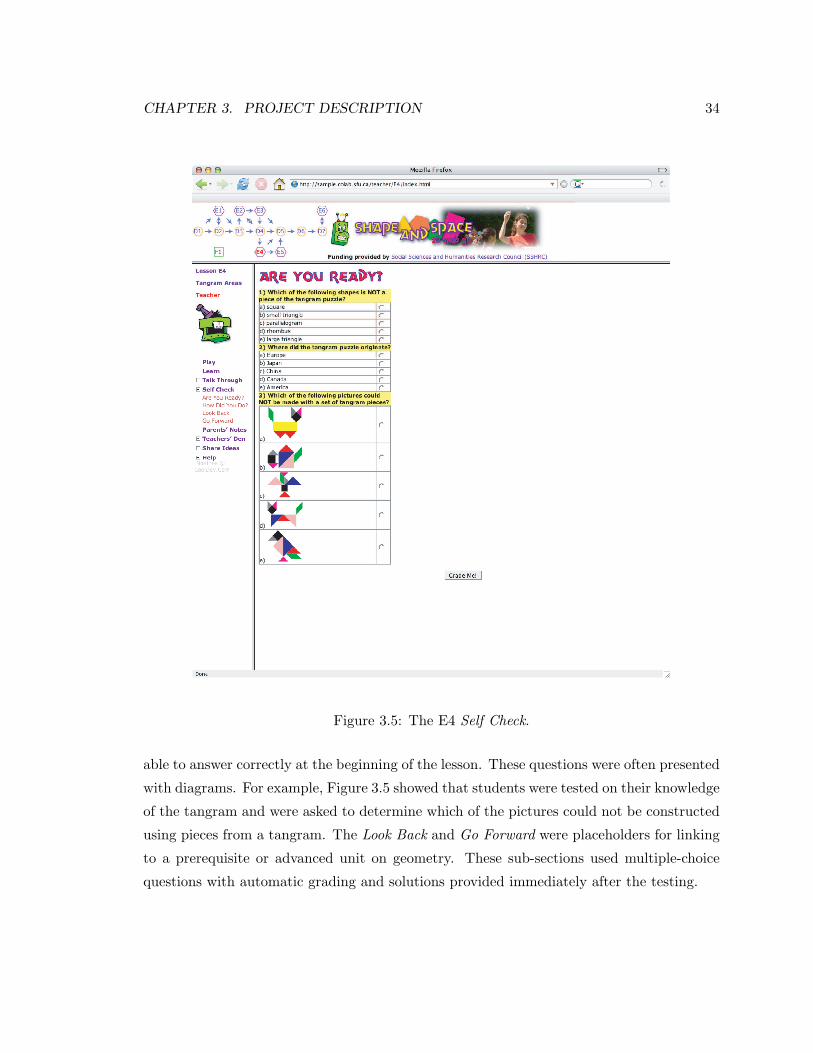
CHAPTER 3. PROJECT DESCRIPTION 34
Figure 3.5: The E4 Self Check.
able to answer correctly at the beginning of the lesson. These questions were often presented
with diagrams. For example, Figure 3.5 showed that students were tested on their knowledge
of the tangram and were asked to determine which of the pictures could not be constructed
using pieces from a tangram. The Look Back and Go Forward were placeholders for linking
to a prerequisite or advanced unit on geometry. These sub-sections used multiple-choice
questions with automatic grading and solutions provided immediately after the testing.
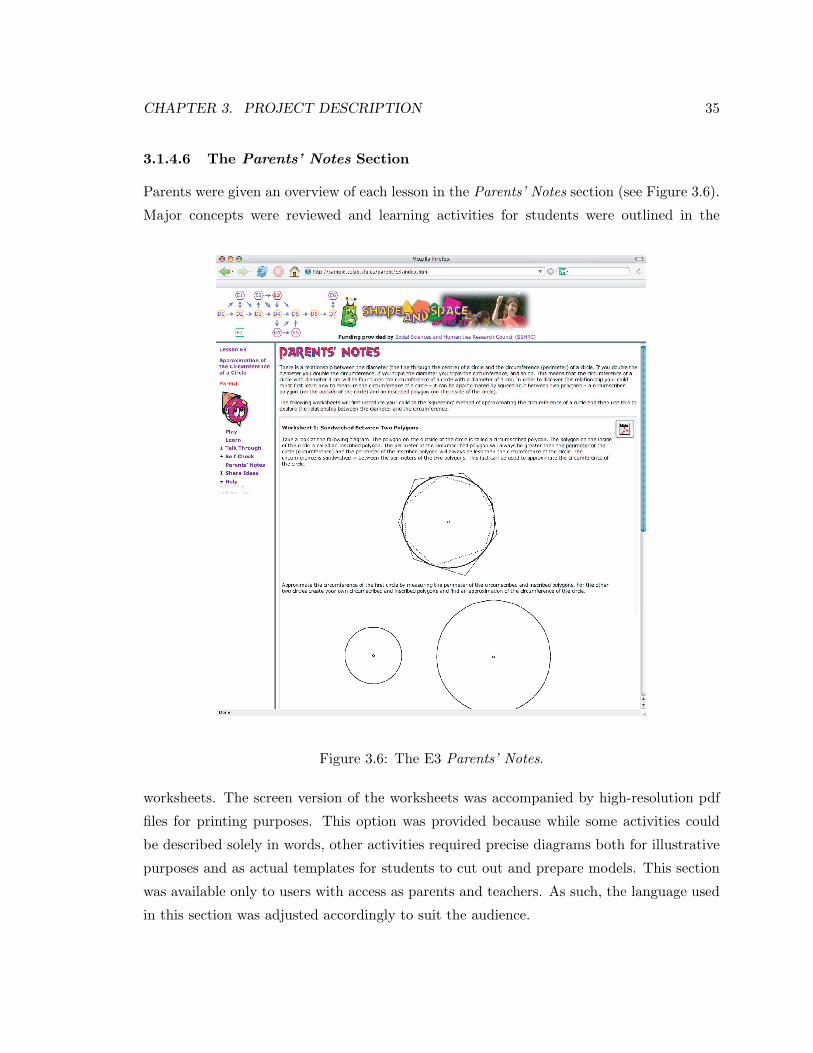
CHAPTER 3. PROJECT DESCRIPTION 35
3.1.4.6 The Parents’ Notes Section
Parents were given an overview of each lesson in the Parents’ Notes section (see Figure 3.6).
Major concepts were reviewed and learning activities for students were outlined in the
Figure 3.6: The E3 Parents’ Notes.
worksheets. The screen version of the worksheets was accompanied by high-resolution pdf
files for printing purposes. This option was provided because while some activities could
be described solely in words, other activities required precise diagrams both for illustrative
purposes and as actual templates for students to cut out and prepare models. This section
was available only to users with access as parents and teachers. As such, the language used
in this section was adjusted accordingly to suit the audience.

CHAPTER 3. PROJECT DESCRIPTION 36
3.1.4.7 The Teachers’ Den Section
The Teachers’ Den section consisted of four sub-sections to provide teachers with a solid
set of resources and support: Teachers’ Notes, Question Bank, Chat Log, and Math Links.
In the Teachers’ Notes (see Figure 3.7), a complete set of notes was included for the lesson
Figure 3.7: The D6 Teachers’ Notes.
plan. In addition, the activities for the computer-based environment and the non-computer-
based environment were fully explained. The major concepts of the lesson were described
in detail with the Explore and Challenge questions placed appropriately within the context
of the explanation. Worksheets that were available in the Parents’ Notes were included in
this sub-section.

CHAPTER 3. PROJECT DESCRIPTION 37
Question Bank, the second sub-section of the Teachers’ Den, was a compilation of sup-
plementary questions, activities and additional resources for use in the classroom by the
teachers. The solutions of each question were also included with definitions, diagrams,
tables and explanation as appropriate (see Figure 3.8).
Figure 3.8: The E5 Question Bank.
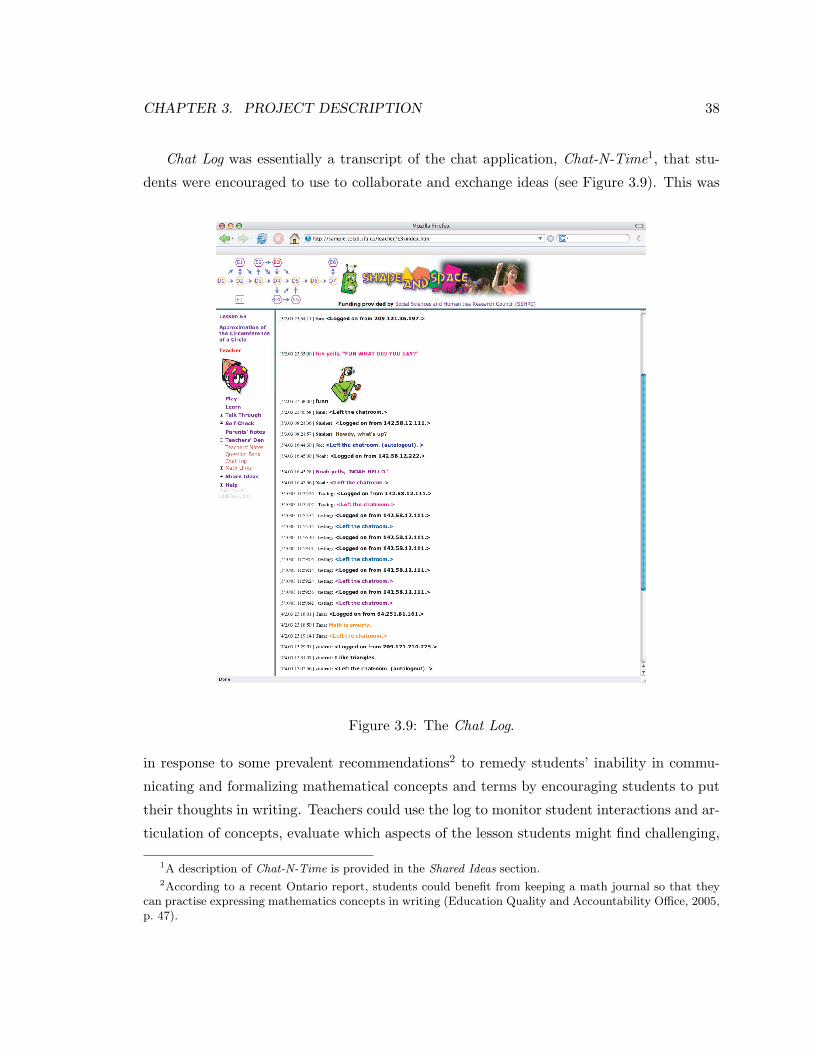
CHAPTER 3. PROJECT DESCRIPTION 38
Chat Log was essentially a transcript of the chat application, Chat-N-Time1, that stu-
dents were encouraged to use to collaborate and exchange ideas (see Figure 3.9). This was
Figure 3.9: The Chat Log.
in response to some prevalent recommendations2 to remedy students’ inability in commu-
nicating and formalizing mathematical concepts and terms by encouraging students to put
their thoughts in writing. Teachers could use the log to monitor student interactions and ar-
ticulation of concepts, evaluate which aspects of the lesson students might find challenging,
1A description of Chat-N-Time is provided in the Shared Ideas section.2According to a recent Ontario report, students could benefit from keeping a math journal so that they
can practise expressing mathematics concepts in writing (Education Quality and Accountability Office, 2005,p. 47).
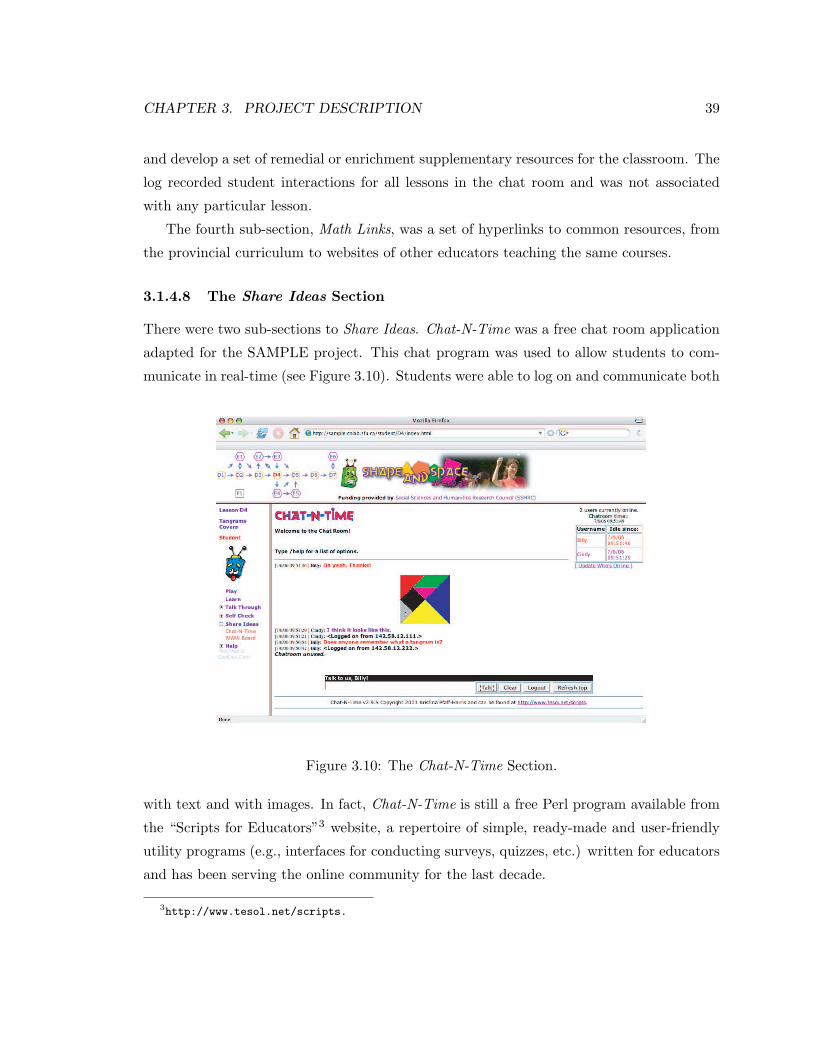
CHAPTER 3. PROJECT DESCRIPTION 39
and develop a set of remedial or enrichment supplementary resources for the classroom. The
log recorded student interactions for all lessons in the chat room and was not associated
with any particular lesson.
The fourth sub-section, Math Links, was a set of hyperlinks to common resources, from
the provincial curriculum to websites of other educators teaching the same courses.
3.1.4.8 The Share Ideas Section
There were two sub-sections to Share Ideas. Chat-N-Time was a free chat room application
adapted for the SAMPLE project. This chat program was used to allow students to com-
municate in real-time (see Figure 3.10). Students were able to log on and communicate both
Figure 3.10: The Chat-N-Time Section.
with text and with images. In fact, Chat-N-Time is still a free Perl program available from
the “Scripts for Educators”3 website, a repertoire of simple, ready-made and user-friendly
utility programs (e.g., interfaces for conducting surveys, quizzes, etc.) written for educators
and has been serving the online community for the last decade.
3http://www.tesol.net/scripts.
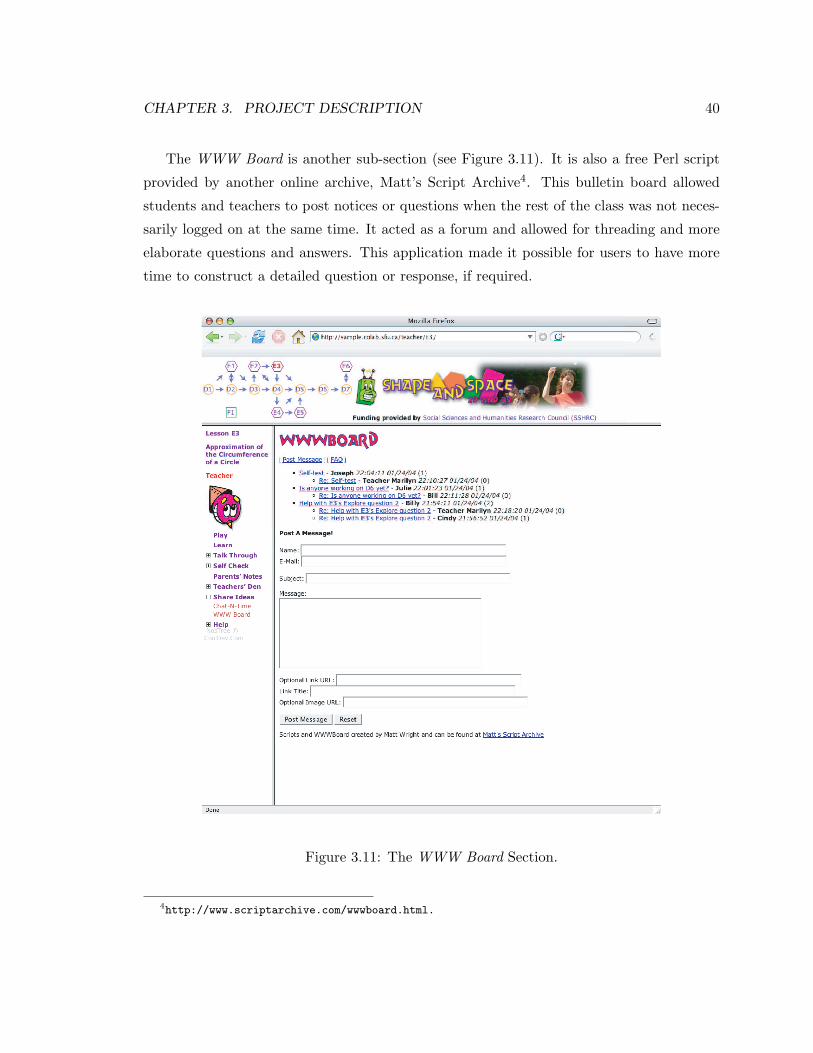
CHAPTER 3. PROJECT DESCRIPTION 40
The WWW Board is another sub-section (see Figure 3.11). It is also a free Perl script
provided by another online archive, Matt’s Script Archive4. This bulletin board allowed
students and teachers to post notices or questions when the rest of the class was not neces-
sarily logged on at the same time. It acted as a forum and allowed for threading and more
elaborate questions and answers. This application made it possible for users to have more
time to construct a detailed question or response, if required.
Figure 3.11: The WWW Board Section.
4http://www.scriptarchive.com/wwwboard.html.

CHAPTER 3. PROJECT DESCRIPTION 41
3.1.4.9 The Help Section
There were mainly two sub-sections in Help. The FAQ sub-section was a placeholder. The
Search sub-section was driven by Google (see Figure 3.12). The search could be limited to
just the SAMPLE site or expanded to the entire world wide web.
3.2 Part II: Technical Aspects of SAMPLE
3.2.1 Authoring of Rich Media Mathematical Learning Objects
Two main sources of learning objects were employed in this project. The first kind was
applets generated through proprietary geometry software, Cinderella5, MathResources6,
JavaView7, and Geometer’s Sketchpad8. The second kind, free or open-source programs,
was generated in-house or borrowed with permission (sometimes with modifications) from
other educators because not all tools demanded by the educators were available through
off-the-shelf software. This infrastructure gave the flexibility of mixing and matching of
resources. Teachers with different software preferences could build the requisite learning
objects using a variety of tools. The rich media platform allowed for a heterogeneous mix of
repurposable and interoperable resources to be used on the website. Unlike books, SAMPLE
was non-linear in nature.
3.2.1.1 Permissions and Usage of Learning Objects
As SAMPLE is a non-profit educational research project, permissions to use the various
learning objects were relatively easy to obtain. For proprietary software that have an ap-
plet export feature, users are usually allowed to share their work with other teachers and
students. In fact, geometry software companies routinely grant users permission to publish
applets created by the users on the web for non-commercial use. As for the custom-designed
applets, they were all programmed by salaried researchers involved with SAMPLE and the
university’s copyright policy R30.01 governs such arrangements and provides for joint copy-
right ownership.
5http://www.cinderella.de.6http://www.mathresources.com.7http://www.javaview.de.8http://www.keypress.com/sketchpad.
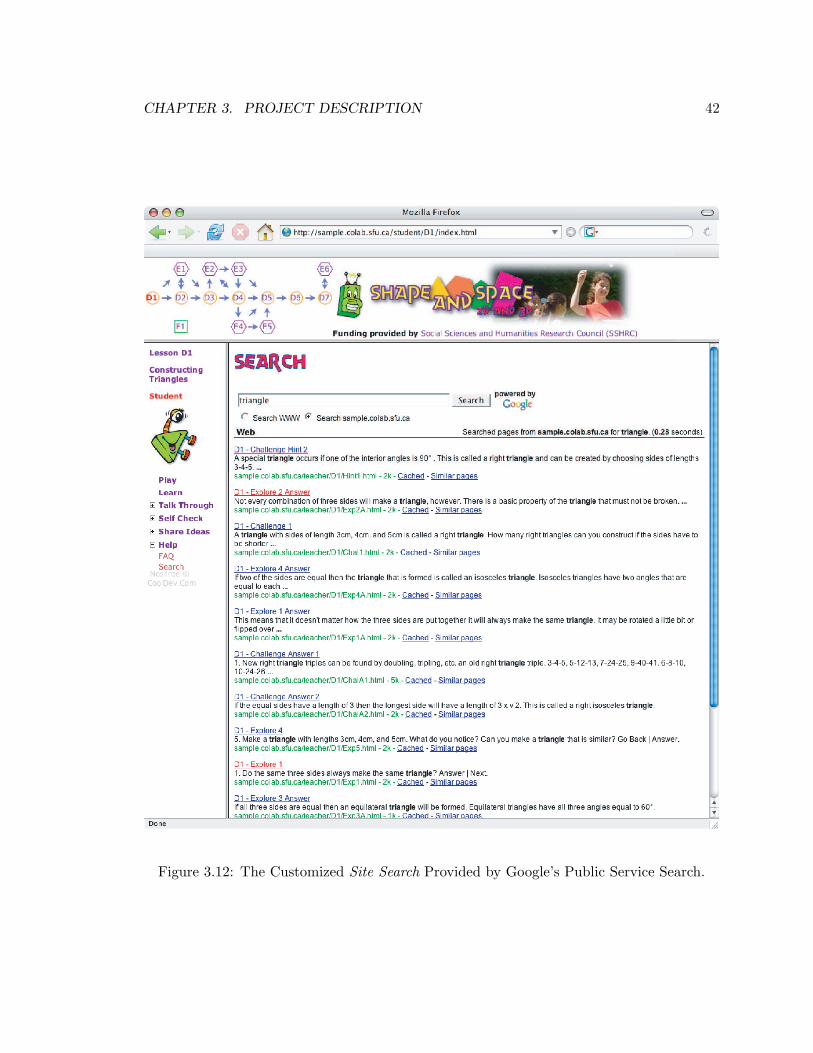
CHAPTER 3. PROJECT DESCRIPTION 42
Figure 3.12: The Customized Site Search Provided by Google’s Public Service Search.
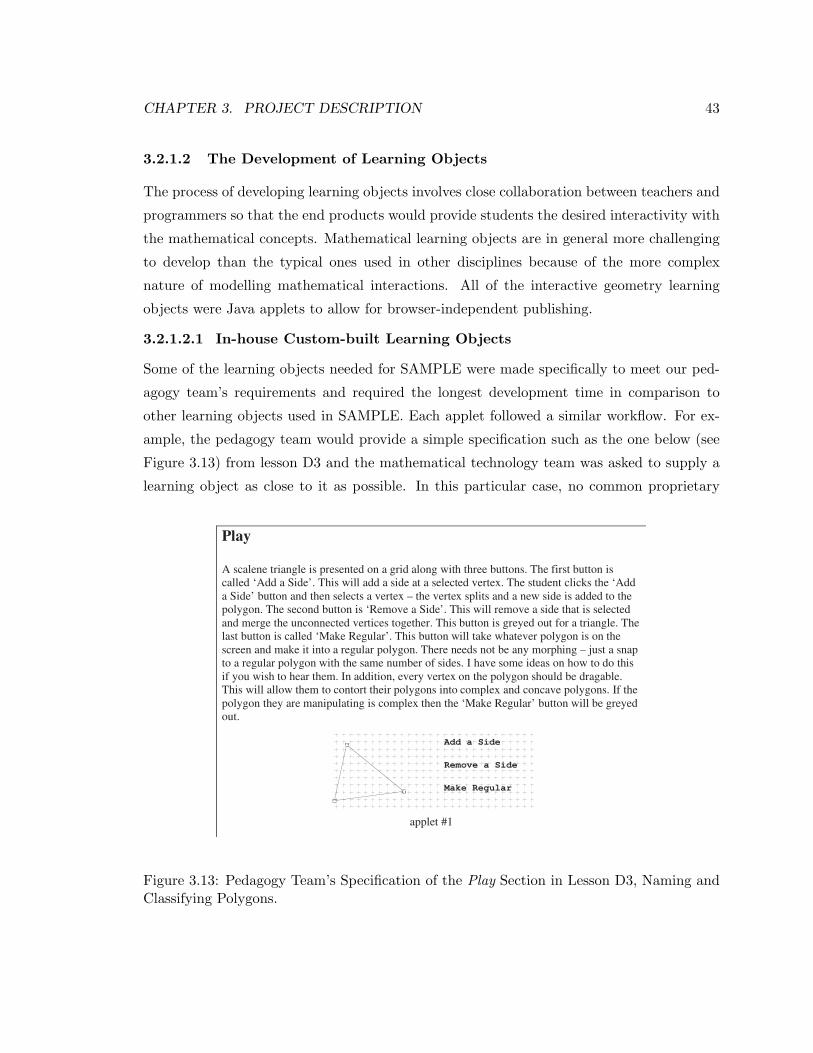
CHAPTER 3. PROJECT DESCRIPTION 43
3.2.1.2 The Development of Learning Objects
The process of developing learning objects involves close collaboration between teachers and
programmers so that the end products would provide students the desired interactivity with
the mathematical concepts. Mathematical learning objects are in general more challenging
to develop than the typical ones used in other disciplines because of the more complex
nature of modelling mathematical interactions. All of the interactive geometry learning
objects were Java applets to allow for browser-independent publishing.
3.2.1.2.1 In-house Custom-built Learning Objects
Some of the learning objects needed for SAMPLE were made specifically to meet our ped-
agogy team’s requirements and required the longest development time in comparison to
other learning objects used in SAMPLE. Each applet followed a similar workflow. For ex-
ample, the pedagogy team would provide a simple specification such as the one below (see
Figure 3.13) from lesson D3 and the mathematical technology team was asked to supply a
learning object as close to it as possible. In this particular case, no common proprietary
Play
A scalene triangle is presented on a grid along with three buttons. The first button is
called ‘Add a Side’. This will add a side at a selected vertex. The student clicks the ‘Add
a Side’ button and then selects a vertex – the vertex splits and a new side is added to the
polygon. The second button is ‘Remove a Side’. This will remove a side that is selected
and merge the unconnected vertices together. This button is greyed out for a triangle. The
last button is called ‘Make Regular’. This button will take whatever polygon is on the
screen and make it into a regular polygon. There needs not be any morphing – just a snap
to a regular polygon with the same number of sides. I have some ideas on how to do this
if you wish to hear them. In addition, every vertex on the polygon should be dragable.
This will allow them to contort their polygons into complex and concave polygons. If the
polygon they are manipulating is complex then the ‘Make Regular’ button will be greyed
out.
Add a Side
Remove a Side
Make Regular
applet #1
Figure 3.13: Pedagogy Team’s Specification of the Play Section in Lesson D3, Naming andClassifying Polygons.
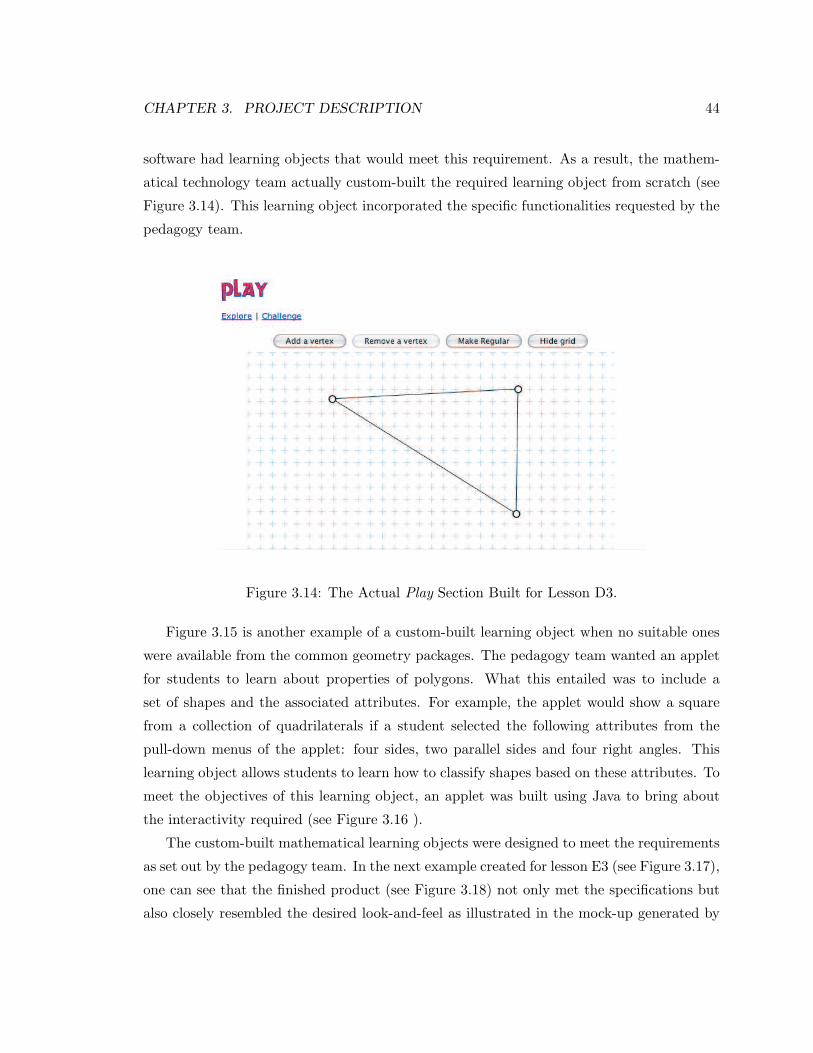
CHAPTER 3. PROJECT DESCRIPTION 44
software had learning objects that would meet this requirement. As a result, the mathem-
atical technology team actually custom-built the required learning object from scratch (see
Figure 3.14). This learning object incorporated the specific functionalities requested by the
pedagogy team.
Figure 3.14: The Actual Play Section Built for Lesson D3.
Figure 3.15 is another example of a custom-built learning object when no suitable ones
were available from the common geometry packages. The pedagogy team wanted an applet
for students to learn about properties of polygons. What this entailed was to include a
set of shapes and the associated attributes. For example, the applet would show a square
from a collection of quadrilaterals if a student selected the following attributes from the
pull-down menus of the applet: four sides, two parallel sides and four right angles. This
learning object allows students to learn how to classify shapes based on these attributes. To
meet the objectives of this learning object, an applet was built using Java to bring about
the interactivity required (see Figure 3.16 ).
The custom-built mathematical learning objects were designed to meet the requirements
as set out by the pedagogy team. In the next example created for lesson E3 (see Figure 3.17),
one can see that the finished product (see Figure 3.18) not only met the specifications but
also closely resembled the desired look-and-feel as illustrated in the mock-up generated by
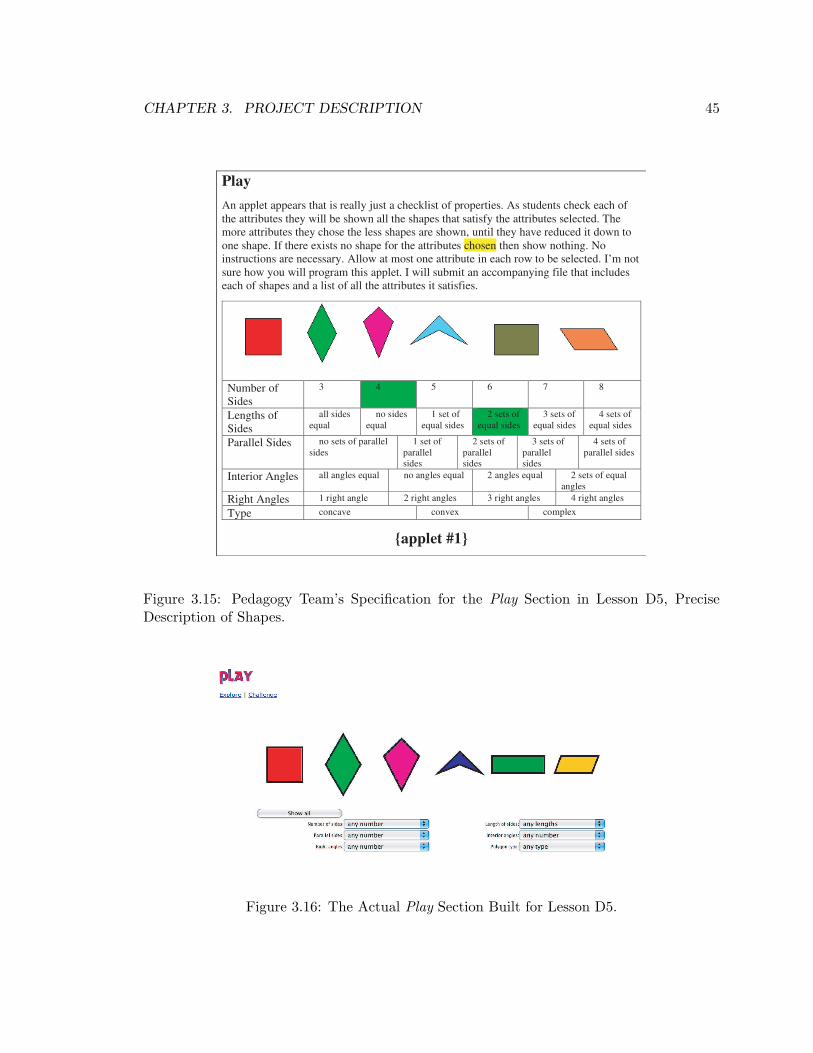
CHAPTER 3. PROJECT DESCRIPTION 45
Play
An applet appears that is really just a checklist of properties. As students check each of
the attributes they will be shown all the shapes that satisfy the attributes selected. The
more attributes they chose the less shapes are shown, until they have reduced it down to
one shape. If there exists no shape for the attributes chosen then show nothing. No
instructions are necessary. Allow at most one attribute in each row to be selected. I’m not
sure how you will program this applet. I will submit an accompanying file that includes
each of shapes and a list of all the attributes it satisfies.
Number of
Sides
3 4 5 6 7 8
Lengths of
Sides
all sides
equal no sides
equal 1 set of
equal sides 2 sets of
equal sides 3 sets of
equal sides 4 sets of
equal sides
Parallel Sides no sets of parallel
sides 1 set of
parallel
sides
2 sets of
parallel
sides
3 sets of
parallel
sides
4 sets of
parallel sides
Interior Angles all angles equal no angles equal 2 angles equal 2 sets of equal
angles
Right Angles 1 right angle 2 right angles 3 right angles 4 right angles
Type concave convex complex
{applet #1}
Figure 3.15: Pedagogy Team’s Specification for the Play Section in Lesson D5, PreciseDescription of Shapes.
Figure 3.16: The Actual Play Section Built for Lesson D5.
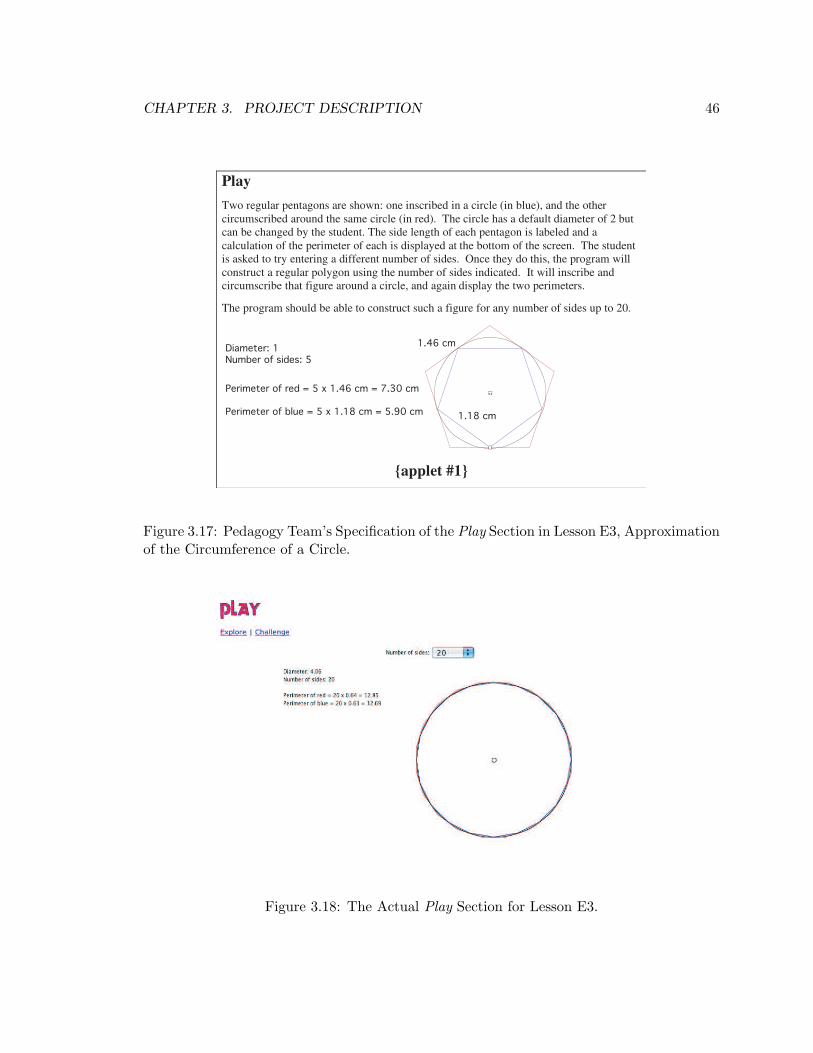
CHAPTER 3. PROJECT DESCRIPTION 46
Play
Two regular pentagons are shown: one inscribed in a circle (in blue), and the other
circumscribed around the same circle (in red). The circle has a default diameter of 2 but
can be changed by the student. The side length of each pentagon is labeled and a
calculation of the perimeter of each is displayed at the bottom of the screen. The student
is asked to try entering a different number of sides. Once they do this, the program will
construct a regular polygon using the number of sides indicated. It will inscribe and
circumscribe that figure around a circle, and again display the two perimeters.
The program should be able to construct such a figure for any number of sides up to 20.
{applet #1}
Figure 3.17: Pedagogy Team’s Specification of the Play Section in Lesson E3, Approximationof the Circumference of a Circle.
Figure 3.18: The Actual Play Section for Lesson E3.

CHAPTER 3. PROJECT DESCRIPTION 47
the pedagogy team. Sometimes, the mathematical team was able to produce applets that not
only met the requirements of the pedagogy team but also included significant enhancements
in usability and functionality.
3.2.1.2.2 Third-Party Software-assisted Generation of Learning Objects
Some of the 3D learning objects (e.g., D6), were developed by taking advantage of existing
geometry libraries. While the complexity of building these applets was simplified signific-
antly, the process still required extensive development time.
The vision (see Figure 3.19) of the pedagogy team was realized in the following learning
Play
Two pull-down menus are presented. The student chooses one option from each menu
and a polyhedron is created. The polyhedron will appear in the window and the student
will be able to rotate it to see it at various angles. The student will also be able to remove
any of the faces of the polyhedron by clicking on them. The faces will reappear at the top
of the screen. Dotted lines will replace the removed faces on the solid.
-------Polyhedron goes here-------
Use the menu above to create a
polyhedron. Click and drag to rotate the
object. Double click on any face to
remove it.
Triangular ! Prism !
Rectangular Pyramid
Pentagonal
Hexagonal
Octagonal
Decagonal
Dodecagonal
Figure 3.19: Pedagogy Team’s Specification for the Play Section for Lesson D6, 3D Shapeswith Specific Faces.
object (see Figure 3.20). The 3D geometry models needed to be viewed from different
perspectives with the corresponding 2D models provided to indicate the relative location
of the faces of the models. The development of this customized applet required research
into suitable resources, e.g., the JavaView libraries, to bring the final product to fruition.
JavaView is a 3D geometry viewer that allows dynamic viewing of mathematical models
in online browsers. The interactive learning object was created in Java and used a subset
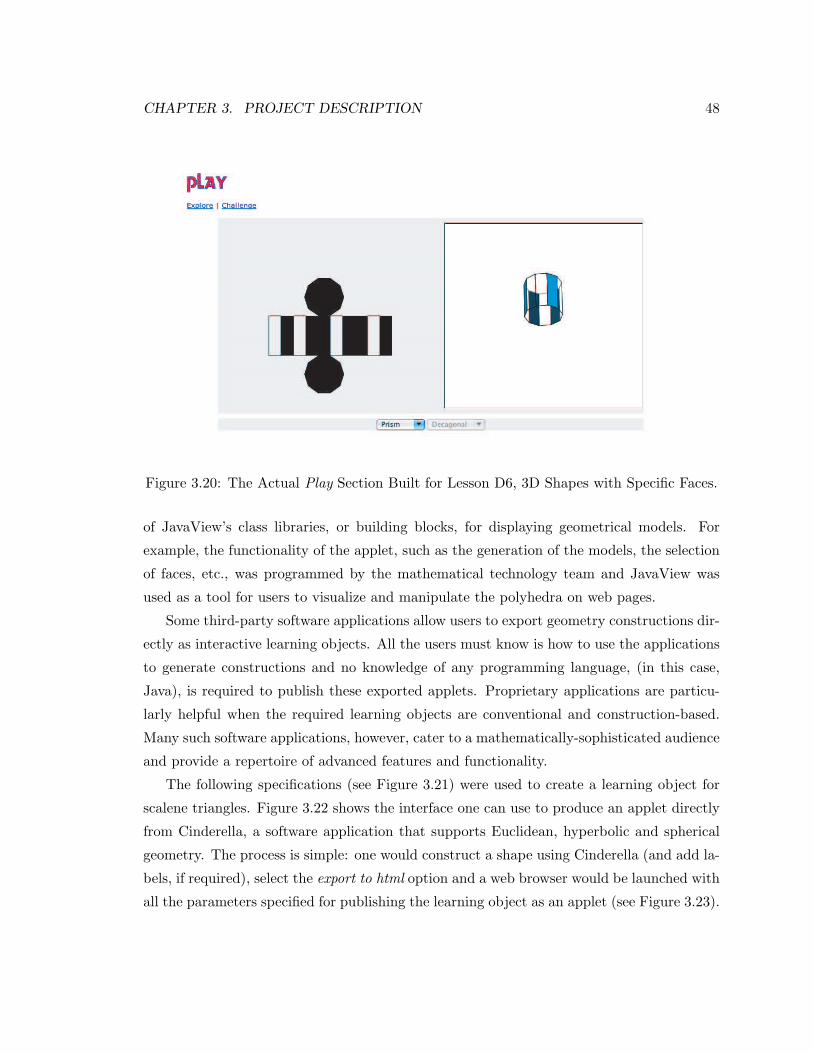
CHAPTER 3. PROJECT DESCRIPTION 48
Figure 3.20: The Actual Play Section Built for Lesson D6, 3D Shapes with Specific Faces.
of JavaView’s class libraries, or building blocks, for displaying geometrical models. For
example, the functionality of the applet, such as the generation of the models, the selection
of faces, etc., was programmed by the mathematical technology team and JavaView was
used as a tool for users to visualize and manipulate the polyhedra on web pages.
Some third-party software applications allow users to export geometry constructions dir-
ectly as interactive learning objects. All the users must know is how to use the applications
to generate constructions and no knowledge of any programming language, (in this case,
Java), is required to publish these exported applets. Proprietary applications are particu-
larly helpful when the required learning objects are conventional and construction-based.
Many such software applications, however, cater to a mathematically-sophisticated audience
and provide a repertoire of advanced features and functionality.
The following specifications (see Figure 3.21) were used to create a learning object for
scalene triangles. Figure 3.22 shows the interface one can use to produce an applet directly
from Cinderella, a software application that supports Euclidean, hyperbolic and spherical
geometry. The process is simple: one would construct a shape using Cinderella (and add la-
bels, if required), select the export to html option and a web browser would be launched with
all the parameters specified for publishing the learning object as an applet (see Figure 3.23).
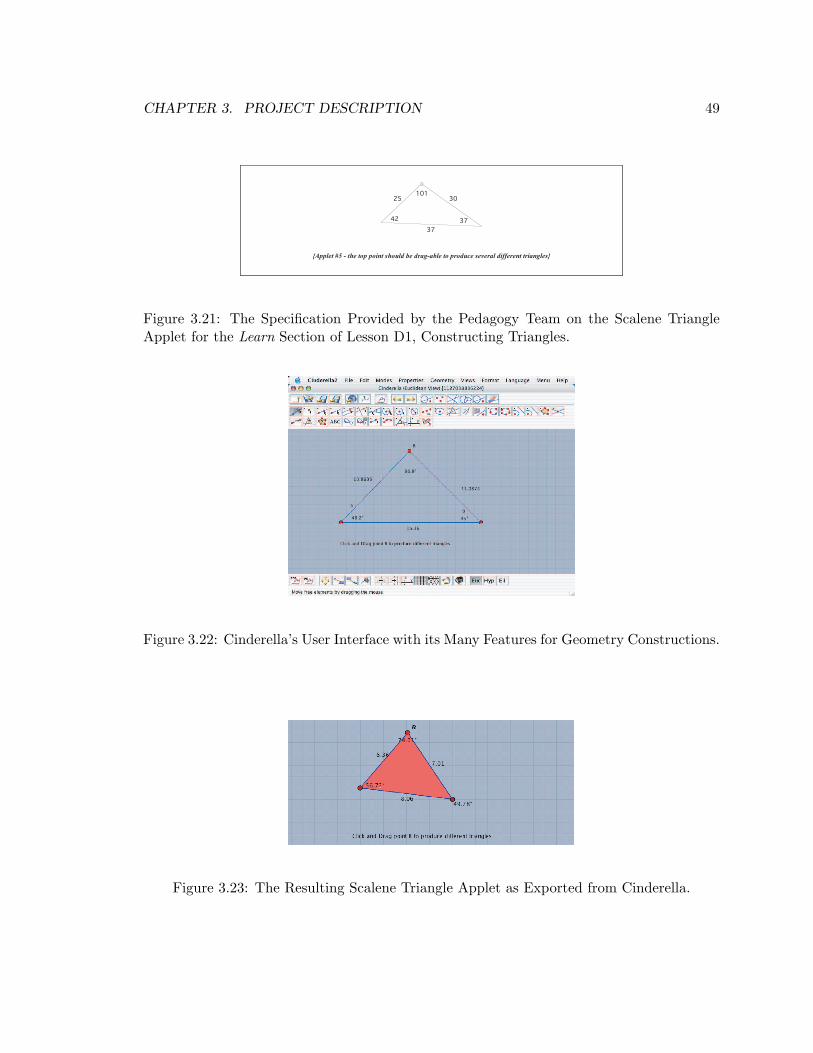
CHAPTER 3. PROJECT DESCRIPTION 49
25 30
37
37
101
42
{Applet #5 - the top point should be drag-able to produce several different triangles}
Figure 3.21: The Specification Provided by the Pedagogy Team on the Scalene TriangleApplet for the Learn Section of Lesson D1, Constructing Triangles.
Figure 3.22: Cinderella’s User Interface with its Many Features for Geometry Constructions.
Figure 3.23: The Resulting Scalene Triangle Applet as Exported from Cinderella.

CHAPTER 3. PROJECT DESCRIPTION 50
Another proprietary software application that offers the option of exporting applets is
The Geometer’s Sketchpad (see Figure 3.24). The pedagogy team was quite comfortable
Figure 3.24: The User Interface of The Geometer’s Sketchpad. Source: Dr. June Lester, bypermission.
with this software and used it to draw and construct sketches which were published both as
a part of the specification of the desired learning objects and as static images in the actual
lessons. One interactive applet (see Figure 3.25) was generated using JavaSketchpad, the
web companion to The Geometer’s Sketchpad for generating dynamic activities online.
Figure 3.25: Exported from The Geometer’s Sketchpad, the Play Section for Lesson D1,Constructing Triangles.

CHAPTER 3. PROJECT DESCRIPTION 51
3.2.1.2.3 Modification and Adaptation of Existing Learning Objects
Often, some applets available had many of the qualities desired by the pedagogy team but
did not completely address all of the objectives of the lesson plan. In these cases, the
mathematical technology team would seek the permission from the applet authors for the
use and modification of their programs.
The next applet, the Unfolding Polyhedra, (see Figure 3.26 for the specification and
Figure 3.27 for the actual applet) is an example of such an arrangement. In this case,
Play
Two pull-down menus are presented. The student chooses one option from each menu
and a regular polyhedron or its net is created. The polyhedron/net will appear in the
window and the student will be able to rotate it to see it at various angles. Double
clicking on the object will start an animation either of the object unfolding into its net, or
of the net folding into the corresponding object.
-------Platonic solid or net goes here-------
Make one selection from each of the
above menus to create a regular
polyhedron or its net. Click and drag
to rotate the object. Double click on the
object to see it unfold into its net,
or to see the net turn into the
corresponding 3D object.
Tetrahedron ! Solid !
Hexahedron (Cube) Net
Octahedron
Icosahedron
Dodecahedron
Figure 3.26: The Play Applet Specification for Lesson E6.
the customization was relatively trivial because the learning object being modified not only
contained most of what was needed for the applet, it also supported more complex solids.
The main concern was to ensure that the program could be configured properly on the server
and that only the solids needed for the lesson were included in the applet.
Francois Labelle, the creator of the Unfolding Polyhedra, provided more advanced and
interesting interactive applets on his website9. The following screenshot (see Figure 3.28)
9http://www.cs.mcgill.ca/∼sqrt/unfold/unfolding.html.

CHAPTER 3. PROJECT DESCRIPTION 52
Figure 3.27: The Modified Version of the Unfolding Polyhedra.
shows Labelle’s website with an example of an unfolding torus and options to other polyhedra
that are more complex and are beyond the scope of a middle school curriculum.
Figure 3.28: Francois Labelle’s Applet Web Page.
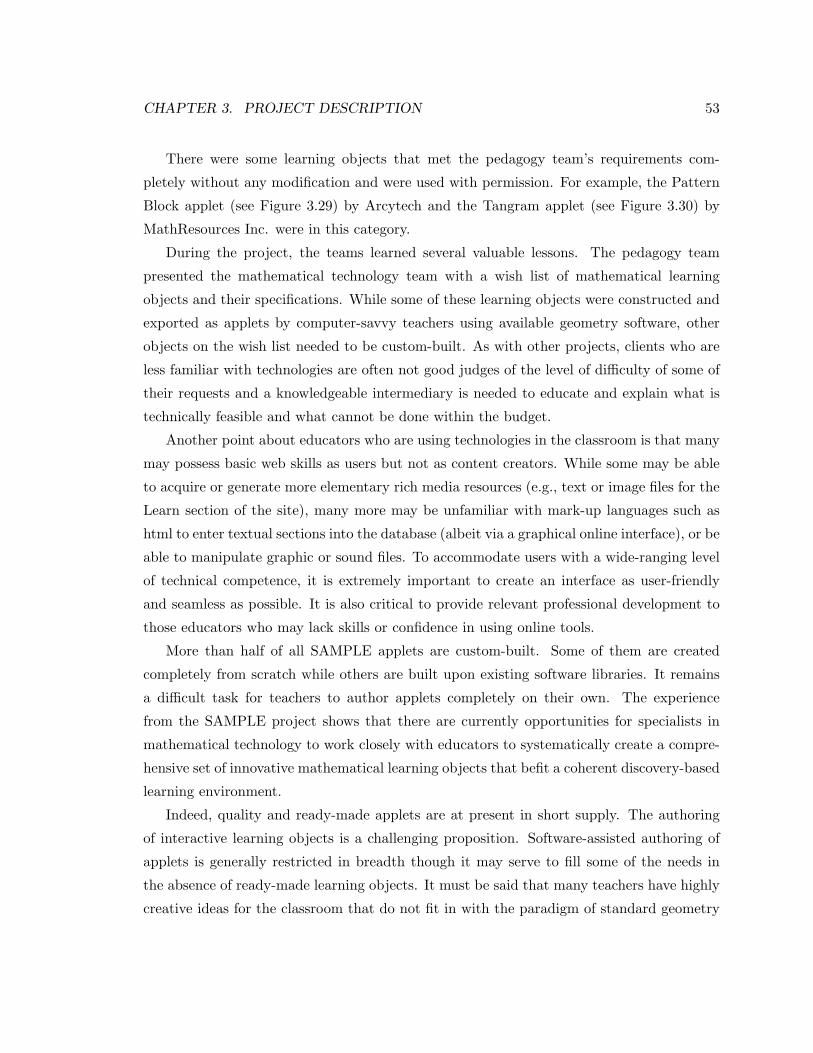
CHAPTER 3. PROJECT DESCRIPTION 53
There were some learning objects that met the pedagogy team’s requirements com-
pletely without any modification and were used with permission. For example, the Pattern
Block applet (see Figure 3.29) by Arcytech and the Tangram applet (see Figure 3.30) by
MathResources Inc. were in this category.
During the project, the teams learned several valuable lessons. The pedagogy team
presented the mathematical technology team with a wish list of mathematical learning
objects and their specifications. While some of these learning objects were constructed and
exported as applets by computer-savvy teachers using available geometry software, other
objects on the wish list needed to be custom-built. As with other projects, clients who are
less familiar with technologies are often not good judges of the level of difficulty of some of
their requests and a knowledgeable intermediary is needed to educate and explain what is
technically feasible and what cannot be done within the budget.
Another point about educators who are using technologies in the classroom is that many
may possess basic web skills as users but not as content creators. While some may be able
to acquire or generate more elementary rich media resources (e.g., text or image files for the
Learn section of the site), many more may be unfamiliar with mark-up languages such as
html to enter textual sections into the database (albeit via a graphical online interface), or be
able to manipulate graphic or sound files. To accommodate users with a wide-ranging level
of technical competence, it is extremely important to create an interface as user-friendly
and seamless as possible. It is also critical to provide relevant professional development to
those educators who may lack skills or confidence in using online tools.
More than half of all SAMPLE applets are custom-built. Some of them are created
completely from scratch while others are built upon existing software libraries. It remains
a difficult task for teachers to author applets completely on their own. The experience
from the SAMPLE project shows that there are currently opportunities for specialists in
mathematical technology to work closely with educators to systematically create a compre-
hensive set of innovative mathematical learning objects that befit a coherent discovery-based
learning environment.
Indeed, quality and ready-made applets are at present in short supply. The authoring
of interactive learning objects is a challenging proposition. Software-assisted authoring of
applets is generally restricted in breadth though it may serve to fill some of the needs in
the absence of ready-made learning objects. It must be said that many teachers have highly
creative ideas for the classroom that do not fit in with the paradigm of standard geometry
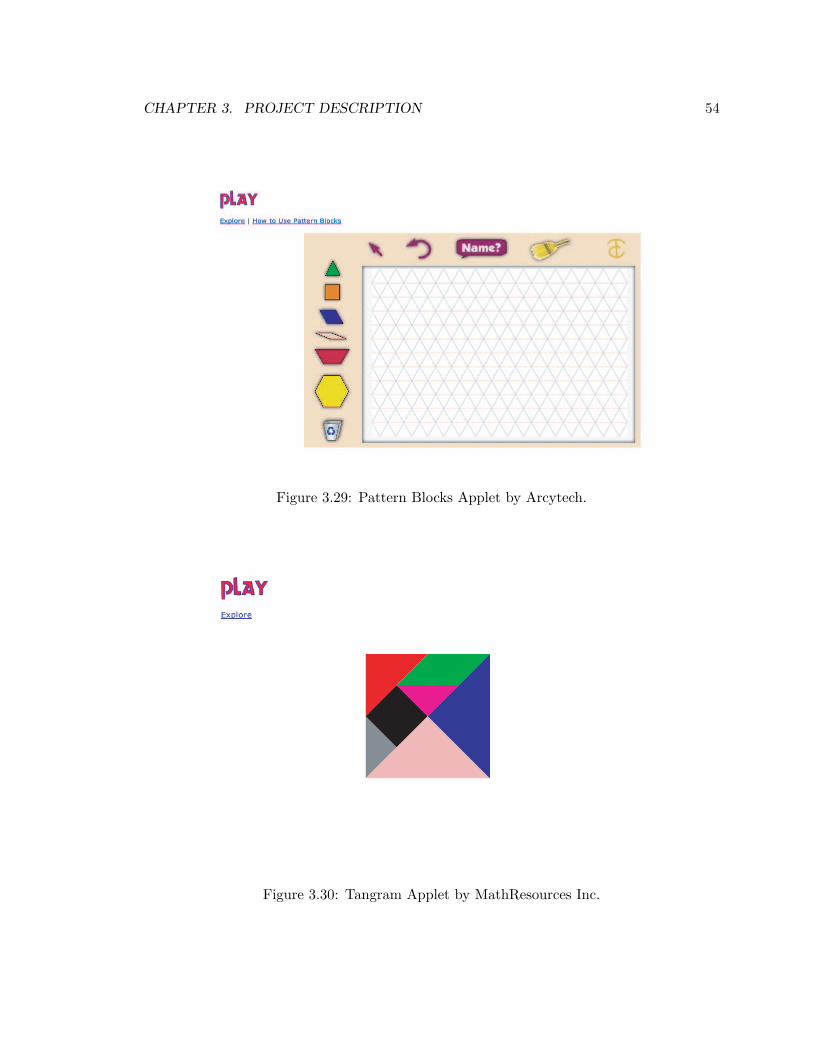
CHAPTER 3. PROJECT DESCRIPTION 54
Figure 3.29: Pattern Blocks Applet by Arcytech.
Figure 3.30: Tangram Applet by MathResources Inc.
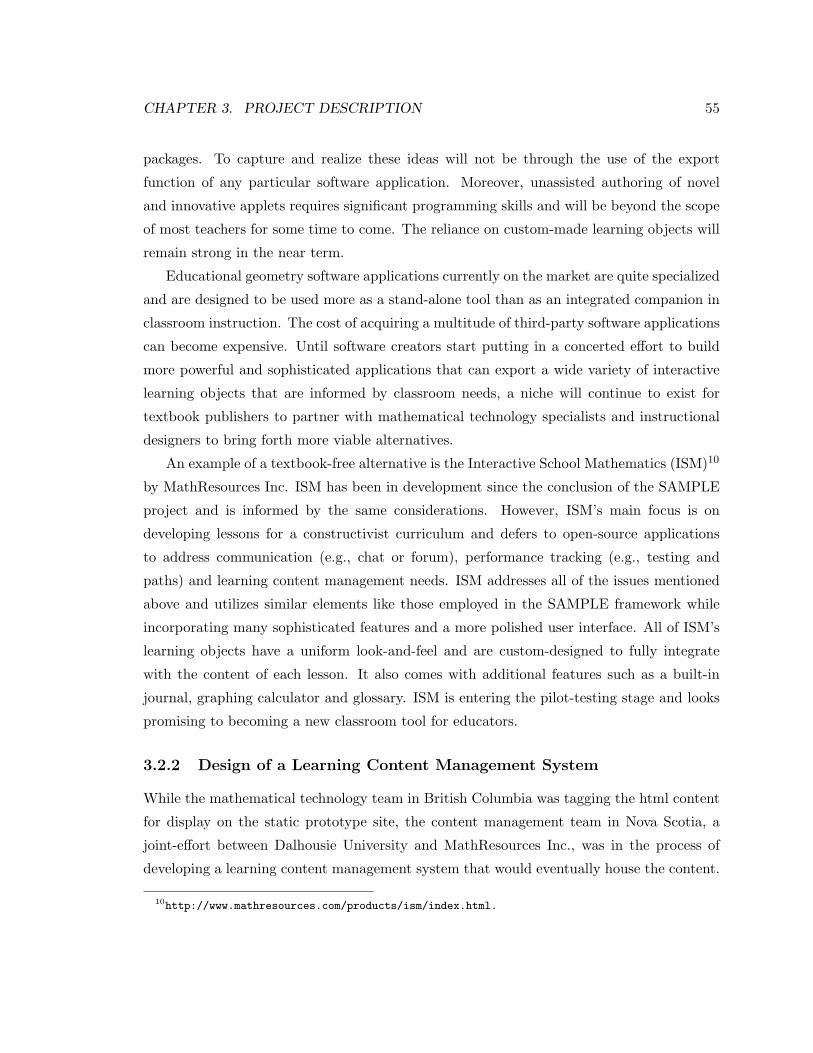
CHAPTER 3. PROJECT DESCRIPTION 55
packages. To capture and realize these ideas will not be through the use of the export
function of any particular software application. Moreover, unassisted authoring of novel
and innovative applets requires significant programming skills and will be beyond the scope
of most teachers for some time to come. The reliance on custom-made learning objects will
remain strong in the near term.
Educational geometry software applications currently on the market are quite specialized
and are designed to be used more as a stand-alone tool than as an integrated companion in
classroom instruction. The cost of acquiring a multitude of third-party software applications
can become expensive. Until software creators start putting in a concerted effort to build
more powerful and sophisticated applications that can export a wide variety of interactive
learning objects that are informed by classroom needs, a niche will continue to exist for
textbook publishers to partner with mathematical technology specialists and instructional
designers to bring forth more viable alternatives.
An example of a textbook-free alternative is the Interactive School Mathematics (ISM)10
by MathResources Inc. ISM has been in development since the conclusion of the SAMPLE
project and is informed by the same considerations. However, ISM’s main focus is on
developing lessons for a constructivist curriculum and defers to open-source applications
to address communication (e.g., chat or forum), performance tracking (e.g., testing and
paths) and learning content management needs. ISM addresses all of the issues mentioned
above and utilizes similar elements like those employed in the SAMPLE framework while
incorporating many sophisticated features and a more polished user interface. All of ISM’s
learning objects have a uniform look-and-feel and are custom-designed to fully integrate
with the content of each lesson. It also comes with additional features such as a built-in
journal, graphing calculator and glossary. ISM is entering the pilot-testing stage and looks
promising to becoming a new classroom tool for educators.
3.2.2 Design of a Learning Content Management System
While the mathematical technology team in British Columbia was tagging the html content
for display on the static prototype site, the content management team in Nova Scotia, a
joint-effort between Dalhousie University and MathResources Inc., was in the process of
developing a learning content management system that would eventually house the content.
10http://www.mathresources.com/products/ism/index.html.

CHAPTER 3. PROJECT DESCRIPTION 56
Figure 3.31: Interface of Prototype Database. Source: The SAMPLE project, by permission.
The content management team developed a script-based application that would dy-
namically generate web pages from a database. This content management system allowed
teachers to input and modify content using a Java-based web interface. The content man-
agement team was responsible for developing a meta-tagging system that would effectively
parse static web pages and separate rich media content from text-based content before de-
positing the content into the database as separate components. Once content was deposited
into the database, a component identification number was assigned and could be repurposed
as needed.
The following screen captures illustrate how users can input content into the prototype
database using a custom-built web interface. Users, such as instructional technologists or
teachers, must select the appropriate unit and lesson from the pull-down menus, and then
the section (also known as “Role”) of the lesson in order to enter content into the database
(see Figure 3.31). In other words, once the users have selected the particular unit and lesson,
they must input the content and specify the associated role (e.g., the Play section), the type
of content (e.g., text), the page number, and component number.
Figure 3.32 shows a list of file formats that the database can accommodate. Users can
choose from text to many rich media file types (e.g., audio, video, applets, etc.) to include
as a component.

CHAPTER 3. PROJECT DESCRIPTION 57
Figure 3.32: The Pull-down Menu of the Types of Components. Source: The SAMPLEproject, by permission.
As with most sections, there are many components to each section and each component
is treated as a small module. The object-oriented nature of the database structure requires
the assignment of a component number to order each individual component, allowing for
fine-grained identification, storage and retrieval (see Figure 3.33). When a component is
added to the database, it is assigned a component identification number. Figure 3.34 shows
a brand new component being entered into the database and Figure 3.35 shows a textual
component entered with HTML mark-up tags.
Through the use of this interface, the content management team was able to demonstrate
how this database can be deployed to serve up the mathematical content of SAMPLE. A
detailed description of this aspect of the project has been published (Kellar et al., 2003).
3.2.3 Summary of the Technical Aspects of SAMPLE
SAMPLE’s incorporation of communication tools, such as chat room and discussion board,
allowed students to work collaboratively. In addition, access to the chat room’s log and
discussion board’s postings allowed teachers to gauge the students’ learning process and
to determine which concepts may need to be reinforced in class. Standards, such as those

CHAPTER 3. PROJECT DESCRIPTION 58
Figure 3.33: The Pull-down Menu of the Component list. Source: The SAMPLE project,by permission.
Figure 3.34: Confirmation Window for Component Submission. Source: The SAMPLEproject, by permission.
developed by IMS Global Learning Consortium, Inc.11, for specifying learning objects are
gradually being adopted.
11http://www.imsglobal.org. IMS Global Learning Consortium is a non-profit body that is dedicated todeveloping common protocols and standards for learning technology.
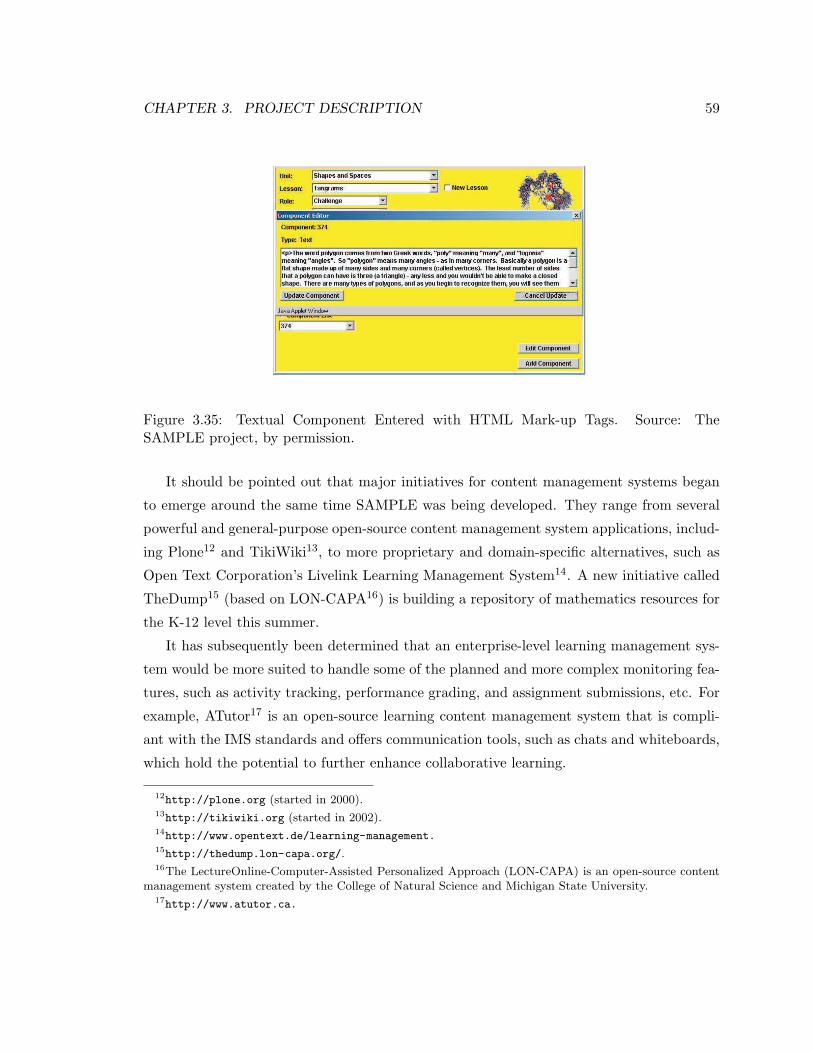
CHAPTER 3. PROJECT DESCRIPTION 59
Figure 3.35: Textual Component Entered with HTML Mark-up Tags. Source: TheSAMPLE project, by permission.
It should be pointed out that major initiatives for content management systems began
to emerge around the same time SAMPLE was being developed. They range from several
powerful and general-purpose open-source content management system applications, includ-
ing Plone12 and TikiWiki13, to more proprietary and domain-specific alternatives, such as
Open Text Corporation’s Livelink Learning Management System14. A new initiative called
TheDump15 (based on LON-CAPA16) is building a repository of mathematics resources for
the K-12 level this summer.
It has subsequently been determined that an enterprise-level learning management sys-
tem would be more suited to handle some of the planned and more complex monitoring fea-
tures, such as activity tracking, performance grading, and assignment submissions, etc. For
example, ATutor17 is an open-source learning content management system that is compli-
ant with the IMS standards and offers communication tools, such as chats and whiteboards,
which hold the potential to further enhance collaborative learning.
12http://plone.org (started in 2000).13http://tikiwiki.org (started in 2002).14http://www.opentext.de/learning-management.15http://thedump.lon-capa.org/.16The LectureOnline-Computer-Assisted Personalized Approach (LON-CAPA) is an open-source content
management system created by the College of Natural Science and Michigan State University.17http://www.atutor.ca.

CHAPTER 3. PROJECT DESCRIPTION 60
3.2.4 A Brief Case Study of ISM and SAMPLE
ISM and SAMPLE started simultaneously and were examining in parallel different aspects of
integrating technology with mathematical learning. MathResources Inc., whose expertise is
in the development of mathematical software for schools, received a $2 million (conditionally
repayable) contribution from the Atlantic Innovation Fund in July 2002. The developers of
ISM were chiefly concerned with issues around building standards-compliant instructional
content and learning objects so that educators may easily manage the instructional process
via the use of an online repository, such as a learning content management system.
SAMPLE’s focus was in understanding how to build a framework to support mathem-
atics learning in the classroom. Specifically, researchers were interested in exploring which
elements would facilitate the learning process and how these elements could work together.
The outcomes of both projects have led to similar conclusions. Firstly, both projects are
in support of a constructivist learning environment and have determined that the interactiv-
ity of ICT is an excellent avenue to promote the acquisition of mathematical knowledge.
Secondly, researchers from both projects recognize the importance of mathematics education
and the needs of educators to have access to a repository of mathematical tools.
Where the two projects differ is in how the learning objects were compiled and how such
content was managed. SAMPLE used a heterogeneous mixture of learning objects and built
its own repository. It was more concerned with exploring the nature of online learning than
with standards compliance issues. MathResources Inc., on the other hand, has both the
human resources and financial backing to streamline the design of learning materials. The
result is a product with a unified feel and attention to emerging standards. It was certainly a
wise move to focus on content development and leave content management issues to others.
By being cognizant of standards for LCMS, MathResources Inc. is able to take advantage
of ATutor and make the adoption of ISM a more convenient and attractive proposition. In
summary, the two projects provide an interesting snapshot of an academic research project
and a commercial software product.

Chapter 4
Conclusion
Middle school mathematics teachers are in need of support in the classroom to cope with high
demands for numeracy from many fronts. Curriculum requirements must meet demanding
numeracy standards needed to function in a knowledge-based society. Possessing knowledge
of only basic arithmetic no longer suffices. As a result, students of varying abilities and
motivation levels are expected to persist in mathematics courses to a more advanced level
so that they can develop the understanding and problem-solving skills needed to make sound
decisions in everyday life scenarios, from making financial investments to determining how
much hardwood flooring is required for a home-renovation project1. This effort is premised
on a successful outcome in early mathematics education. Mathematics educators, who
must bear the brunt of these new demands and shifts in pedagogical models, are reliant on
practical and innovative support.
SAMPLE was built to assist teachers in accessing the help they need in meeting the
growing demands. It provided complete lesson plans for each of the topics in the unit
with the option for advanced users to add or modify content. SAMPLE also incorporated
remedial materials for under-prepared teachers needing a refresher course. Learner’s char-
acteristics, including aptitude, were taken into account and addressed through a customized
environment so that students could catch up or skip ahead at their own pace depending
on their grasp of the course materials. One salient feature of SAMPLE was the use of
interactive learning objects. These applets were designed to model complex interactions
1It was reported that one in three adults in England “cannot calculate the area of a room that is 21 by14 feet, even with the aid of a calculator.” (Department for Education and Employment, 1999, Chapter 1)
61

CHAPTER 4. CONCLUSION 62
and concepts that were best explained visually. To maintain the students’ interest in the
content, innovative approaches were taken, including the use of rich media learning objects,
to create a discovery-based learning environment. Such learning objects made it possible to
realize creative ideas that may otherwise be too difficult to implement in the classroom.
4.1 The SAMPLE Experience
The realization of the SAMPLE prototype as a stand-alone and self-contained middle-school
geometry unit was a fulfilling and rewarding experience. The multidisciplinary initiative
not only had all the elements of traditional publishing, such as editing and proofreading,
the authoring process entailed a significant use of technologies, much more so than would
be common in the digital publishing of online journals and the like. This was largely a
result of the technical nature of publishing interactive mathematical content. Indeed, it
was very much a collaborative effort with room for creativity for all those involved. The
SAMPLE project began with both the educators and programmers working jointly and
in parallel right from the start. After the initial consultation of how the framework of
SAMPLE should be, the educators went immediately to work on content authoring while
the programmers worked laboriously to provide the structure to host the content. This
collaborative process continued with frequent meetings and exchange of ideas in order to fine
tune the many aspects of the prototype, including usability, navigation, additional features,
etc. Once the first batch of instructional content became ready and the web framework
was in place, the pedagogy team and the mathematical technology team began the work
of compiling and developing the needed interactive learning objects. Simultaneously, the
mathematical technology team also began marking up the content for inclusion on the
website while the pedagogy team continued the preparation of lessons. The opportunity for
the mathematical technology team to peer inside the process of instructional design and for
the pedagogy team to be immersed in the culture of software design was invaluable and the
result was a rare and mutually beneficial learning experience. The requirements specified by
the pedagogy team were mostly satisfied by the mathematical technology team, sometimes
with minor modifications, as motivated by enhanced usability or functionality, or as dictated
by budgetary constraints and feasibility considerations. The content management team
was busy preparing a database that would allow for the dynamic generation of lessons by
repurposing content materials on the fly.
CHAPTER 4. CONCLUSION 63
4.2 Outcomes of SAMPLE
SAMPLE was completed in the spring of 2003 and field tests involving more than three
dozen pre-service and practising teachers, and parents were conducted in the summer of
2003 by the pedagogy team. The responses from teachers and parents were very positive
and encouraging. Below is a summary of the responses.
“We asked 32 pre-service elementary teachers to review an earlier version of the
program over a 2–3 hour period, and to complete an evaluation questionnaire.
The results were summarized as follows: on the criteria of accessibility, respons-
iveness, visual appeal, readability and navigation, mean ratings on a four-point
scale (from unsatisfactory to excellent) ranged from 3.0 to 3.5. On the criteria
of interest, enjoyment and usefulness, mean ratings were 3.8, 3.7 and 3.7 re-
spectively. User comments were extremely positive, with typical comments such
as:
‘Interesting and makes you think.’
‘I think that it is going to be very helpful because they can actually play around
with different concepts.’
‘I liked the teachers’ notes and parents’ notes as well as the flexibility to play
with the shapes and seeing the results.’
We also asked three practicing teachers to review the prototype and to provide
feedback. All were extremely positive, provided useful suggestions for improve-
ment, and offered to participate in the next phase of the project. One senior
secondary school teacher (and Mathematics Department head) wrote that:
“In a period which, as math teachers, we are increasingly challenged to
provide ‘situated’ learning experiences which not only emulate genuine
approaches to discovery but also allow the learner to progress at his
own pace, Web-based activities such as those provided by this portal
may provide the only economically feasible response. As a high school
mathematics teacher whose assignment includes Calculus 12, I fre-
quently encounter students who would benefit from both the potential
for self-pacing and the emphasis on experimentation and visualization
that characterize this software. Please include me (and my students)
CHAPTER 4. CONCLUSION 64
as participants in research designed to test this approach at the senior
high school or first year undergraduate levels (Stanway, 2003)”
Similarly, we asked three parents to try out the prototype with their children.
Comments received were very encouraging, thus opening up a new avenue for
teacher-parent collaboration in supporting students’ learning of mathematics.”
(Kaufman, 2003, p. 20)
The SAMPLE project concluded with the field tests and the project’s objectives were
met. Both the static prototype developed at Simon Fraser University and the database de-
veloped at Dalhousie University performed as intended. While full integration was demon-
strated to be possible, the project stopped short of populating the content into the database
and the two systems remained two separate, successful proofs-of-concept. This decision was
made partly due to the availability of more advanced content management systems on the
market and partly due to time constraints. In the fall of 2003, one of the co-investigators
of SAMPLE transferred to Dalhousie University and the leadership for potential develop-
ment of SAMPLE followed as well. In fact, SAMPLE was proposed as a suitable platform
to continue further research investigation and many like-minded researchers in Atlantic
Canada who are devoted to improving middle-school mathematics education, including the
co-investigators of SAMPLE, have recently formed the Atlantic Community Math Network2.
4.3 Future Research
From the field tests, it was clear that there was much support for a constructivist learning
environment and that SAMPLE was definitely a viable and an innovative proof-of-concept.
Future research can build upon the work of SAMPLE by furthering the use of learning
objects and discovery-based computer-driven environments in upper secondary and even
post-secondary settings. As a next step to empower teachers as facilitators in the classroom,
one can move toward a more mature and sophisticated learning management system that
incorporates a web-based tracking system which can comprehensively capture students’
activities and present teachers with an understanding of how and when learning does or
does not take place. To recap, a learning management system that delivers rich media-
based learning objects can serve two major purposes: 1. to engage students in mathematics
2http://www.aarms.math.ca/outreach.

CHAPTER 4. CONCLUSION 65
using a multitude of settings that suit individual styles and hence help them gain numeracy
skills; and 2. to familiarize students with basic computer technologies in a practical manner
at an early stage in their lives.
4.3.1 Constructing a Better Learning Content Management System
Researchers must be cognizant of the existing limitations in the current education system
and try to effect change. More research is needed to look into the relationship between
different teaching styles and the usage of online resources. As learning content management
systems are still in their infancy for the elementary and secondary school market, there is
room for consultation and identification of best practices. In so doing, more insight can be
gained as to how the efficacy of a learning content management system can be optimized.
4.4 Some Final Comments About the Audience of SAMPLE
From the literature review, there was much compelling evidence that a lack of literacy and
numeracy skills may hamper one’s life chances. A multi-disciplinary publishing endeavour
that involves rich media will not solve problems on its own. It does, however, create a
new reality that is conducive for all those concerned to explore more avenues to educate
and engage the population with an important life-skill, numeracy, especially in the age of
computer technologies. Allowing mathematics to be learned in such an environment would
provide students not only with numeracy skills but also the necessary training to utilize the
tools needed at work and at home.
The fact that some teachers have math anxiety and other teachers are not computer lit-
erate enough is evidence that there still exist hurdles in some regions to introduce computer-
based learning environments into mathematics education. There is no question that middle
school mathematics teachers need more professional development and support. This suggests
that a more coordinated approach is needed to integrate numeracy, literacy and technology
learning in the classroom.
SAMPLE was intended to be a supportive tool for teachers who may be under-prepared
or apprehensive about mathematics. In the face of strong numeracy requirements, un-
satisfactory assessment results of student performance, and educational reforms, a unified
educational strategy is needed and SAMPLE can be only one part of the solution.
References
Alderson, B. (1999, October 21). Teachers lower math anxiety [California State University,Chico Newsletter]. Inside Chico State, 30 (6). Retrieved on May 14, 2006 from http:
//www.csuchico.edu/pub/inside/archive/99 10 21/s3.mathanxiety.html.Anderson, O. R. (1997). A neurocognitive perspective on current learning theory and science
instructional strategies. Science Education, 81 (1), 67–89.Ashcraft, M. H., & Kirk, E. P. (2001). The relationships among working memory, math
anxiety, and performance. Journal of Experimental Psychology: General, 130 (2), 224–237.
Bergeron, L.-P., Dunn, K., Lapointe, M., Roth, W., & Tremblay-Cote, N. (2004, October).Looking ahead: A ten-year outlook for the Canadian labour market, 2004–2013: Finalreport (Tech. Rep.). Gatineau, Quebec: Human Resources and Skills DevelopmentCanada, Policy Research and Coordination Directorate, Labour Market and SkillsForecasting and Analysis Unit. (HRSDC Catalogue Number HS28-23/2005E)
Betcherman, G. (1997). Changing workplace strategies: Achieving better outcomes for enter-prises, workers, and society. Ottawa; Paris: Human Resources Development Canada,Applied Research Branch; Organisation for Economic Co-operation and Development.
Bordt, M., Broucker, P. de, Read, C., Harris, S., & Zhang, Y. (2001). Science and technologyskills: Participation and performance in elementary and secondary school. EducationQuarterly Review, 8 (1), 12–21. (Statistics Canada Catalogue Number 81-003)
Bowlby, J. W., & McMullen, K. (2002, January). At a crossroads: First results for the 18 to20-year-old cohort of the Youth in Transition Survey (Tech. Rep.). Ottawa, Ontario:Statistics Canada; Human Resources and Skills Development Canada. (StatisticsCanada Catalogue Number 81-591-XPE)
British Columbia College of Teachers. (2006a, June 2). College bylaws.British Columbia College of Teachers. (2006b, June 2). College policies.Burns, M. (1998). Math: Facing an American phobia. Sausalito, CA: Math Solutions
Publications.Burris, C. C., Heubert, J. P., & Levin, H. M. (2004). Math acceleration for all. Educational
Leadership, 61 (5), 68–71.Bushnik, T., Barr-Telford, L., & Bussiere, P. (2004, April). In and out of high school:
First results from the second cycle of the Youth in Transition Survey, 2002 (Tech.Rep.). Ottawa, Ontario: Statistics Canada; Human Resources and Skills DevelopmentCanada. (Statistics Canada Catalogue Number 81-595-MIE20004014)
66
References 67
Bussiere, P., Cartwright, F., & Knighton, T. (2004, December). Measuring up: Canadianresults of the OECD PISA study: The performance of Canada’s youth in mathematics,reading, science and problem solving 2003. First findings for Canadians aged 15 (Tech.Rep.). Ottawa, Ontario: Human Resources and Skills Development Canada; Councilof Ministers of Education, Canada; Statistics Canada. (Statistics Canada CatalogueNumber 81-590-XPE)
California State Board of Education. (1999). Mathematics content standards for Californiapublic schools: Kindergarten through grade twelve (Tech. Rep.). California: CaliforniaState Board of Education. (Adopted by the California State Board of Education onDecember 11, 1997)
Canadian Education Statistics Council. (2003, November). Education indicators in Canada:Report of the Pan-Canadian Education Indicators Program 2003 (Tech. Rep.). Ott-awa; Toronto: Statistics Canada; Council of Ministers of Education, Canada. (Stat-istics Canada Catalogue Number 81-582-XPE)
Canadian Education Statistics Council. (2006, April). Education indicators in Canada: Re-port of the Pan-Canadian Education Indicators Program 2005 (Tech. Rep.). Ottawa;Toronto: Statistics Canada; Council of Ministers of Education, Canada. (StatisticsCanada Catalogue Number 81-582-XPE)
Carroll, J. (1999, March). Understanding professional development through the analysis ofthe mathematical life histories of primary school teachers. Retrieved on May 22, 2006,from http://www.aare.edu.au/98pap/car98138.htm, Adelaide, Australia. (Paperpresented at The Association for Active Educational Researcher 1998 Adelaide Con-ference)
Cohen, R. (2003). Empowering math-anxious elementary teachers in overcoming theiranxiety and improving their teaching: an exploratory study. In E. Simmt & B. Davis(Eds.), Proceedings of the twenty-seventh annual meeting of the Canadian MathematicsEducation Study Group (pp. 147–148). Nova Scotia: Acadia University.
Cohen, R., & Green, K. (2002). Upper elementary teachers’ mathematics related anxietiesand their effects on their teaching. In A. Cockburn & E. Nardi (Eds.), Proceedings ofthe twenty-sixth annual conference of the International Group for the Psychology ofMathematics Education (Vol. 2, pp. 265–272). Norwich, United Kingdom: Universityof East Anglia.
Cohen, R., & Leung, P. (2004, October). Math-anxious, elementary teachers’ change pro-cesses in a graduate course aimed at building math confidence and reducing anxiety. InD. E. McDougall & J. A. Ross (Eds.), Proceedings of the twenty-sixth annual meeting,North American Chapter of the International Group for the Psychology of MathematicsEducation (Vol. 3, pp. 1079–1086). Toronto, Ontario: Ontario Institute for Studies.
Connell, E. H. (1999, March 20). Elements of abstract and linear algebra. Retrieved onJune 16, 2006, from www.math.miami.edu/∼ec/book/intro.pdf.
Corless, R. (1995, March 16). Scientific computing in mathematics education – one partof the revolution. Retrieved on June 16, 2006, from http://oldweb.cecm.sfu.ca/
publications/organic/rutgers/node6.html.

References 68
Cornell, C. (1999, Summer). “I hate math! I couldn’t learn it, and I can’t teach it!”.Childhood Education, 75 (4), 225–230.
Council of Ministers of Education, Canada. (2002). Report on mathematics assessment(III): School Achievement Indicators Program 2001 (Tech. Rep.). Toronto, Ontario:Council of Ministers of Education, Canada.
Department for Education and Employment. (1999, February 26). A fresh start – Improvingliteracy and numeracy. Report of a working group (chaired by Sir Claus Moser) (Tech.Rep.). London: Department for Education and Employment.
Diaz, D. P., & Bontenbal, K. F. (2000). Pedagogy-based technology training. In P. Hoffman& D. Lemke (Eds.), Teaching and learning in a network world (pp. 50–54). Amster-dam, Netherlands: IOS Press.
Education Quality and Accountability Office. (1997). Education quality and accountabil-ity office provincial report on achievement: English-language schools 1996–97 (Tech.Rep.). Toronto, Ontario: Education Quality and Accountability Office.
Education Quality and Accountability Office. (2005, October). The grades 3, 6 and 9provincial report, 2004-2005: English language schools. the results of the grade 3 andgrade 6 assessments of reading, writing and mathematics and the grade 9 assessment ofmathematics (Tech. Rep.). Toronto, Ontario: Education Quality and AccountabilityOffice.
Failing our students: Dumbed down curriculum needs an overhaul. (2004, August 17).Calgary Herald, p. A12. (Editorial: Opinion)
Gadanidis, G., & Namukasa, I. (2005). Math for preservice teachers at UWO. Retrieved onMay 17, 2006, from http://www.fields.utoronto.ca/programs/mathed/meforum/
minutes/05/submission.pdf. (Submitted to the Ontario College of Teachers Reviewof Teacher Qualifications)
Glimm, J. (Ed.). (1991). Mathematical sciences, technology, and economic competitiveness.Washington, DC: National Academy Press.
Heinrich, D. L., & Spielberger, C. D. (1982). Anxiety and complex learning. In H. W.Krohne & L. Laux (Eds.), Achievement, stress, and anxiety (pp. 145–165). Washing-ton: Hemisphere Publishing Corporation.
Hembree, R. (1990). The nature, effects, and relief of mathematics anxiety. Journal forResearch in Mathematics Education, 21 (1), 33–46.
Huggins, R., Izushi, H., & Davies, W. (2005). World knowledge competitiveness index 2005.Llantwit Fardre, Pontypridd, Wales: Robert Huggins Associates Ltd.
IMD. (2006). IMD world competitiveness yearbook 2006 (Tech. Rep.). Lausanne, Switzer-land: IMD.
Kaufman, D. (2003, October). Implementation of a web-based prototype for mathematicslearning.
Kellar, M., MacKay, B., Zhang, R., Watters, C., Kaufman, D., & Borwein, J. (2003).Dynamic composition of math lessons. Educational Technology & Society, 6 (4), 100–111.
Kilpatrick, J., Swafford, J., & Findell, B. (Eds.). (2001). Adding it up: Helping children

References 69
learn mathematics. Washington, DC: National Academy Press.Laucius, J. (2004, June 10). Professor challenges the math-challenged. The Ottawa Citizen,
p. D3.Levin, H. M. (1995). Learning from accelerated schools. In J. H. Block, S. T. Everson,
& T. R. Guskey (Eds.), School improvement programs (pp. 267–288). New York:Scholastic Inc.
Levine, G. (1996, April 12). Variability in anxiety for teaching mathematics among pre-service elementary school teachers enrolled in a mathematics course. (Paper presentedat the Annual Meeting of the American Educational Research Association, New YorkCity)
Littlejohn, A., Stefani, L., & Sclater, N. (1999). Promoting effective use of technology, thepedagogy and the practicalities: a case study. Active Learning, 11, 27–30.
Mass Insight Education and Research Institute. (2004, April 6). More math, please: Thesurprising consensus on math among parents, the public, and business leaders in two“new economy” states (Tech. Rep.). Boston, Massachusetts: Mass Insight Educationand Research Institute.
McCloskey, B. (2000, September 13). The three graces of rich media: Rich & streamingmedia. Retrieved on July 5, 2006, from http://www.clickz.com/experts/ad/rich
media/article.php/829091/.Meece, J. L., Wigfield, A., & Eccles, J. S. (1990). Predictors of math anxiety and its influence
on young adolescents’ course enrollment intentions and performance in mathematics.Journal of Educational Psychology, 82 (1), 60–70.
Milgram, R. J. (2005). The mathematics pre-service teachers need to know. Retrieved onMay 14, 2006, from http://math.stanford.edu/ftp/milgram/FIE-book.pdf. (Pre-pared for the U.S. Department of Education)
Ministry of Advanced Education. (2005, September). Employment outlook for Brit-ish Columbia (Tech. Rep.). British Columbia: Ministry of Advanced Education,Planning and Data Management Branch. Retrieved on June 17, 2006, from http:
//www.aved.gov.bc.ca/labourmarketinfo/reports/cops-bcunique-paper.pdf.Ministry of Education. (2005, September 15). Technical report: 2005 Ministry of Education
Graduate Transition Survey: Fall 2005 (Tech. Rep.). British Columbia: Ministry ofEducation, Information Department, Data Analysis and Reporting Unit. Retrieved onFebruary 25, 2006 from www.bced.gov.bc.ca/careers/gradtran/gradtrans2005.
pdf.National Council of Teachers of Mathematics. (1991). Professional standards for teaching
mathematics / prepared by the working groups of the Commission on Teaching Stand-ards for School Mathematics of the National Council of Teachers of Mathematics.Reston, Virginia: The National Council of Teachers of Mathematics.
Norris, C., Pignal, J., & Lipps, G. (2003). Measuring school engagement. EducationQuarterly Review, 9 (2), 25–34. (Statistics Canada Catalogue Number 81-003)
OECD. (2004). First results from PISA 2003: Executive summary (Tech. Rep.). Paris:Organisation for Economic Co-operation and Development.
References 70
OECD. (2005). Education at a glance: OECD indicators 2005 executive summary (Tech.Rep.). Paris: Organisation for Economic Co-operation and Development.
Ontario College of Teachers. (2001, December). Ontario College of Teachers additional basicqualification course guideline junior division: Schedule a regulation 184/97 teachers’qualifications.
Ontario College of Teachers. (2005). Think about becoming a teacher! [Brochure]. Toronto,Ontario: Ontario College of Teachers.
Ontario College of Teachers. (2006). Ontario College of Teachers member’s handbook 2006.Toronto, Ontario: Ontario College of Teachers.
Ontario Task Force on Competitiveness, Productivity and Economic Progress. (2002,November). Closing the prosperity gap: First annual report (Tech. Rep.). Toronto,Ontario: The Institute for Competitiveness and Prosperity.
Porter, M. E., Schwab, K., & Lopez-Claros, A. (Eds.). (2005). The global competitivenessreport 2005–2006: Policies underpinning rising prosperity (Tech. Rep.). Basingstoke:World Economic Forum.
Probert, B. S., & Vernon, A. E. (1997, Spring). Overcoming math anxiety: Counselingcenter offers math confidence groups [University of Florida Newsletter]. Student AffairsUpdate, 22 (2), pp. 4, 6.
Province of British Columbia, Ministry of Education, Skills and Training. (1996, January).Mathematics K to 7: Integrated resource package (1995).
Province of Nova Scotia, Department of Education. (2005). Minister’s report to parents:2005 student assessment results (Tech. Rep.). Nova Scotia: Department of Education,African Canadian Services Division.
Schmidt, R. (2005, May 27). B.C. math student results continue to slide in national Euclidcontest. Retrieved on November 13, 2005, from http://www.publicaffairs.ubc.
ca/media/releases/2005/mr-05-071.html. (Media Release)Schmidt, S. (2005, March 19). Remedial 101. Star-Phoenix, p. E12.Schmidt, W. H., McKnight, C. C., & Raizen, S. A. (1997). A splintered vision: An in-
vestigation of U.S. science and mathematics education. Dordrecht, The Netherlands:Kluwer Academic Publishers.
Seaman, R. (1998, August). I’ve got a secret: Math anxiety [Saskatchewan MathematicsTeachers’ Society Newsletter]. Ideas and Resources for Teachers of Mathematics.Retrieved on May 14, 2006, from mathcentral.uregina.ca/RR/database/RR.09.
97/seaman4.html.Shade, L. R. (2002, April). The digital divide: From definitional stances to policy initiatives.
(Prepared for the Department of Canadian Heritage P3: Policy and Program Forumin Ottawa)
Shore, K. (2005, November 4). Dr. Ken Shore’s classroom problem solver: Math anxiety.Retrieved on May 14, 2006, from http://www.education-world.com/a curr/shore/
shore066.shtml.Sokoloff, H. (2002a, April 4). Math = cool: e
2πi = 1. National Post, p. A12.Sokoloff, H. (2002b, January 5). Older students losing interest in math and sciences, report
References 71
says: Experts point to weak teachers and dry curriculum. National Post, p. A4.Statistics Canada. (1995). Literacy, economy and society: Results of the first International
Adult Literacy Survey (Tech. Rep.). Ottawa, Ontario: Statistics Canada; Organisationfor Economic Co-operation and Development. (Statistics Canada Catalogue Number89-545-XPE)
Statistics Canada. (2005, November). Building on our competencies: Canadian results of theInternational Adult Literacy and Skills Survey 2003 (Tech. Rep.). Ottawa, Ontario:Statistics Canada; Human Resources and Skills Development Canada. (StatisticsCanada Catalogue Number 89-617-XIE)
Stodolsky, S. S. (1985). Telling math: Origins of math aversion and anxiety. EducationalPsychologist, 20 (3), 125–133.
Tobias, S. (1978). Overcoming math anxiety (1st ed.). New York: W. W. Norton &Company Inc.
(US) National Research Council. (1989). Everybody counts: A report to the nation on thefuture of mathematics education. Washington, DC: National Academy Press.
Uusimaki, L., & Kidman, G. (2004). Reducing maths-anxiety: Results from an online anxi-ety survey. (Paper presented at the Australian Association for Research in Educa-tion International Education Research Conference in Melbourne, Victoria, Australia.November 29 – December 2, 2004)
Wagner, D. A. (2001). World Education Forum Dakar, Senegal 26–28 April 2000: Educa-tion for all 2000 assessment. Thematic studies: Literacy and adult education (Tech.Rep.). France: United Nations Educational, Scientific and Cultural Organization;International Literacy Institute. (Catalogue Number ED.2001/WS/10)
Welsh, J. (1997, May 25). Math skills linked to savvy investing. Times-Picaynne, p. F1.(Money Prospects)
Williams, W. V. (1988, February). Answers to questions about math anxiety. School Scienceand Mathematics, 88 (2), 95–104.
Yager, R. E. (2000). Real-world learning: A necessity for the success of current reformefforts. ENC Focus: A Magazine for Classroom Innovators, 7 (3), 18–19. (specialissue)
Zaslavsky, C. (1994). Fear of math: how to get over it and get on with your life. NewBrunswick, New Jersey: Rutgers University Press.
Related Documents