Southern Cross University ePublications@SCU eses 2011 e roles and values of personal knowledge management Kam Fai Cheong Southern Cross University ePublications@SCU is an electronic repository administered by Southern Cross University Library. Its goal is to capture and preserve the intellectual output of Southern Cross University authors and researchers, and to increase visibility and impact through open access to researchers around the world. For further information please contact [email protected]. Publication details Cheong, KF 2011, 'e roles and values of personal knowledge management', DBA thesis, Southern Cross University, Lismore, NSW. Copyright KF Cheong 2011

Welcome message from author
This document is posted to help you gain knowledge. Please leave a comment to let me know what you think about it! Share it to your friends and learn new things together.
Transcript
Southern Cross UniversityePublications@SCU
Theses
2011
The roles and values of personal knowledgemanagementKam Fai CheongSouthern Cross University
ePublications@SCU is an electronic repository administered by Southern Cross University Library. Its goal is to capture and preserve the intellectualoutput of Southern Cross University authors and researchers, and to increase visibility and impact through open access to researchers around theworld. For further information please contact [email protected].
Publication detailsCheong, KF 2011, 'The roles and values of personal knowledge management', DBA thesis, Southern Cross University, Lismore, NSW.Copyright KF Cheong 2011
TThhee RRoolleess aanndd VVaalluueess ooff
PPeerrssoonnaall KKnnoowwlleeddggee MMaannaaggeemmeenntt
Cheong, Kam Fai B.Sc. (HK), MBA (UK)
A research thesis submitted to the Graduate College of Management,
Southern Cross University, Australia, in partial fulfillment
of the requirements for the degree of
Doctor of Business Administration
May 2011

i
Statement of Original Authorship
I certify that the substance of this thesis has not currently been submitted for any degree
and has not previously being submitted for any other degree. I also certify that to the best
of my knowledge any help received in preparing this thesis and all sources used have
been acknowledged in this thesis.
……………………………………………….
Cheong, Kam Fai
ii
Acknowledgements
The completion of this dissertation would not have been possible without the support and
inspiration of many individuals and organisations. First and foremost, I wish to express
my heartfelt thanks to my supervisor Professor Eric Tsui who provided me with excellent
guidance, encouragement, assistance and support crucial to the successful completion of
my thesis. His profound knowledge in the field of knowledge management and in
particular to personal knowledge management enabled me to broaden my knowledge and
to complete this dissertation.
Furthermore, I would like to acknowledge the other outstanding academic and
administrative staff members of Southern Cross University and the Hong Kong Institute
of Technology for providing a splendid service throughout the course of my study. I am
especially grateful to: Associate Professor Peter Miller, Dr. Jun Xu, Dr. Simon Pervan
and Dr. Raymond Cheng for giving a lot of valuable advice and support on my research,
Miss Sue White and Miss Betty Yuen for their excellent administrative support. I would
like to also thanks Dr. Eric Cheng of Hong Kong Institution of Education, Miss Teresa
Liew of The Hong Kong Polytechnic University and Mr. Ricky Lee; they have also
provided me a lot of valuable advice, encouragement and support during my research. I
wish to thank Mr. Michael Pomfret for proofreading of this report.
Special thanks to all respondents who have completed my survey and I would also like to
thank those knowledge management organisations for their help in allowing me to
distribute the questionnaires to their members.
Last but not least my wife, Ruth Ma, for staying by me during some tough moments, for
encouraging and supporting me in terms of words and actions. Without her, I would not
have been able to complete this thesis.
iii
Abstract
The topic of Personal Knowledge Management (PKM) has seen accelerated growth
recently although PKM is not new, as our ancestors sought ways to learn better and to
improve their knowledge. From the literature, it is clear that an individual plays an
important role in organisational learning and knowledge management. However, there
has been very little empirical research or significant conceptual development carried out
with PKM (Pauleen 2009a), resulting in very few research publications (a search on Sept
13 2009 revealed that Google Scholar had only 1010 counts, ProQuest 28, EBSCO 22
and Emerald only 6) in this particular field of study, demonstrating that PKM is still an
under-explored or under-researched area (Pauleen 2009a; Tsui 2002b; Zhang 2009).
In the past decade, several scholars (e.g. Frand and Hixon (1999), Avery et al. (2001)
Berman and Annexstein (2003) , Efimova (2005), Wright (2005), Zuber-Skerritt (2005),
Agnihotri and Troutt (2009), and Jarche (2010a) ) have developed models to describe
PKM. Their models shared the same assumption that PKM is playing important roles in
knowledge management and has benefits to both individuals and organisations. However,
there is inadequate research investigating what are the roles and values of PKM. This
research represents the first global survey to investigate this under-explored area and to
unlock our understanding about the roles and values of PKM. There are four research
questions answered in this thesis. The first research question is “What are the roles of
PKM in the KM Process?”, the second is “What are the values of PKM for individuals
and organisations?”, the third is “Is there any correlation between the roles of PKM in
KM Processes and the values of PKM for individuals and organisations?” and the last
one is “ Is there any correlation between the values of PKM for individuals and the
values of PKM for organisations?”
A theoretical model was developed and an online survey was conducted by sending
invitations to the members of KM organisations. Altogether 206 KM participants in 44
different countries/locations completed the survey. The collected data was analysed by
both exploratory data analysis and confirmatory data analysis. Validity and reliability
tests were performed prior to the hypotheses tests that were done by standard regression
and structural equation modelling methods.
iv
The research determined that PKM is playing important roles in KM processes and has
significant values in both individual competences and organisation competences. The
results also showed that there are positive correlations between the roles of PKM in KM
processes and the values of PKM for both individuals and organisations. Moreover,
positive correlations were also found between the values of PKM for individuals and the
values of PKM for organisations.
Towards the end of this study, a PKM 2.0 conceptual model was developed which
consists of four key elements, namely personal information management (PIM), personal
knowledge internalisation (PKI), personal knowledge creation (PKC) and inter-personal
knowledge transferring (IKT). This model sets the foundation for future research and also
for applying PKM in the business environment e.g. business process management.
This research has made significant contributions with implications to both theory and
practice, in four key areas. Firstly, it provided empirical evidence to support Avery et al
(2001)’s PKM Skills Framework. Secondly, it filled the gap in the theory about the roles
and values of PKM and provided empirical evidence to support the assumption used by
many scholars that PKM is playing important roles in KM and has benefits to both
individuals and organisations. Thirdly, an empirical model was developed to describe the
Roles and Values of PKM which can be used for future research and the application of
PKM in organisations. Finally, it provided further support to the published literature
about the importance of individual learning in organisational learning and also supported
the concept that PKM is bridging the gap between individual learning and organisational
learning.
v
Publications resulting from this research
The following papers were originated from this research.
Refereed Journal Articles
Cheong, KFR & Tsui, E 2010, 'The Roles and Values of Personal Knowledge
Management: An exploratory study', VINE: The journal of information and knowledge
management systems, vol. 40, no. 2, pp. 204-227
Cheong, KFR & Tsui, E 2010, 'Exploring the Synergy Between Business Process
Management and Personal Knowledge Management', Cutter IT Journal, vol. 23, no. 5, pp.
28-33.
Cheong, KFR & Tsui, E 2011 Forthcoming, ‘From Skills and Competences to outcome-
based Collaborative Work: Tracking a decade’s development of Personal Knowledge
Management (PKM) Models (Accepted by Knowledge and Process Management Journal)
Book Chapters
Cheong, KFR & Tsui, E 2011, 'Exploring linkage between Personal Knowledge
Management and Organisational Learning', in D Pauleen & G Gorman (eds), Personal
Knowledge Management: Individual, Organisation and Social Perspectives Gower.
Cheong, KFR & Tsui, E 2010, 'The Roles and Values of Personal Knowledge
Management', in P Miller & R Cheng (eds), Doctoral research in management and
business in Hong Kong, Hong Kong Institute of Technology, Hong Kong
vi
Table of Contents
STATEMENT OF ORIGINAL AUTHORSHIP ........................................................................................ I
ACKNOWLEDGEMENTS .........................................................................................................................II
ABSTRACT ................................................................................................................................................ III
PUBLICATIONS RESULTING FROM THIS RESEARCH...................................................................V
TABLE OF CONTENTS ........................................................................................................................... VI
LIST OF FIGURES................................................................................................................................. VIII
LIST OF TABLES...................................................................................................................................... XI
ABBREVIATIONS.................................................................................................................................. XIII
CCHHAAPPTTEERR 11 -- IINNTTRROODDUUCCTTIIOONN ...............................................................................................................1
1.1 INTRODUCTION...........................................................................................................................2
1.2 BACKGROUND OF THE RESEARCH.......................................................................................2
1.3 JUSTIFICATION OF THE RESEARCH.....................................................................................3
1.4 RESEARCH PROBLEM AND RESEARCH QUESTIONS.......................................................5
1.5 RESEARCH METHODOLOGY AND FINDINGS.....................................................................7
1.6 OUTLINE OF THE REPORT.......................................................................................................9
1.7 DELIMITATION OF SCOPE AND KEY ASSUMPTIONS ....................................................10
1.8 CHAPTER CONCLUSION .........................................................................................................10
CCHHAAPPTTEERR 22 -- LLIITTEERRAATTUURREE RREEVVIIEEWW .................................................................................................12
2.1 INTRODUCTION.........................................................................................................................13
2.2 KNOWLEDGE MANAGEMENT...............................................................................................13
2.3 PERSONAL KNOWLEDGE MANAGEMENT (PKM) ...........................................................34
2.4 THE ROLES AND VALUES OF PERSONAL KNOWLEDGE MANAGEMENT ...............76
2.5 CHAPTER CONCLUSION .........................................................................................................87
CCHHAAPPTTEERR 33 -- RREESSEEAARRCCHH DDEESSIIGGNN AANNDD MMEETTHHOODDOOLLOOGGYY ...........................................................89
3.1 INTRODUCTION.........................................................................................................................90
3.2 RESEARCH PARADIGMS .........................................................................................................91
3.3 RESEARCH METHODOLOGY AND JUSTIFICATION.......................................................93
3.4 THE THEORETICAL MODEL..................................................................................................97
3.5 RESEARCH DESIGN ................................................................................................................101
3.6 DATA ANALYSIS APPROACH...............................................................................................116
3.7 ETHICAL CONSIDERATIONS ...............................................................................................120
3.8 CHAPTER CONCLUSION .......................................................................................................121
CCHHAAPPTTEERR 44 –– FFIINNDDIINNGGSS AANNDD DDAATTAA AANNAALLYYSSIISS ............................................................................122
4.1 INTRODUCTION.......................................................................................................................123
4.2 PILOT STUDY............................................................................................................................123
4.3 DATA PREPARATION .............................................................................................................124
4.4 RESPONDENTS’ PROFILE .....................................................................................................128
4.5 DATA SCREENING...................................................................................................................135
vii
4.6 DESCRIPTIVE STATISTICS ...................................................................................................136
4.7 CONSTRUCTS ASSESSMENT ................................................................................................147
4.8 EXPLORATORY DATA ANALYSIS ......................................................................................192
4.9 CONFIRMATORY DATA ANALYSIS BY STRUCTURED EQUATION MODELLING
(SEM) 218
4.10 CHAPTER CONCLUSION .......................................................................................................229
CCHHAAPPTTEERR 55 -- CCOONNCCLLUUSSIIOONNSS AANNDD IIMMPPLLIICCAATTIIOONNSS .....................................................................230
5.1 INTRODUCTION.......................................................................................................................231
5.2 ANSWERS TO RESEARCH QUESTIONS.............................................................................233
5.3 RESEARCH IMPLICATIONS .................................................................................................259
5.4 RESEARCH CONTRIBUTION................................................................................................266
5.5 RESEARCH LIMITATION ......................................................................................................269
5.6 CHAPTER CONCLUSION .......................................................................................................270
CCHHAAPPTTEERR 66 –– FFUUTTUURREE WWOORRKK ............................................................................................................271
6.1 INTRODUCTION.......................................................................................................................272
6.2 FUTURE RESEARCH ...............................................................................................................272
6.3 CHAPTER CONCLUSION .......................................................................................................276
REFERENCES ..........................................................................................................................................277
APPENDIX 1 – QUESTIONNAIRE........................................................................................................299
APPENDIX 2 – LIST OF KM ORGANISATIONS INVITED TO DISTRIBUTE THE SURVEY ..312
APPENDIX 3 – DISTRIBUTION OF THE RESPONDENTS BY COUNTRY ..................................313
APPENDIX 4 - SEM RESULTS OUTPUT.............................................................................................314
viii
List of Figures
Figure 1. 1: Structure of Chapter 1 ......................................................................................2
Figure 1. 2: Theoretical Model ............................................................................................6
Figure 1. 3: Chapters of this Thesis .....................................................................................9
Figure 2. 1: Structure of Literature Review.......................................................................13
Figure 2. 2: DIKW Hierarchy ............................................................................................16
Figure 2. 3: SEIC Model....................................................................................................19
Figure 2. 4: School of Knowledge Management ...............................................................24
Figure 2. 5: Various Knowledge Management Lifecycle..................................................26
Figure 2. 6: Knowledge Process Categories ......................................................................27
Figure 2. 7: Approaches of studying organisational learning and learning organisations.31
Figure 2. 8: Review of OL Literature ................................................................................33
Figure 2. 9: Individual Learning ........................................................................................34
Figure 2. 10: OADI-Shared Mental Models (SMM) Cycle...............................................37
Figure 2. 11: Experiential Learning Cycle.........................................................................38
Figure 2. 12: Similarities among conceptions of basic adaptive processes: inquiry /
research, creativity, decision-making, problem solving, learning .....................................39
Figure 2. 13 : PKM Development in Past Decade .............................................................47
Figure 2. 14: Berman and Annexstien (2003)’s PKM Model (PK-Book Model) .............58
Figure 2. 15: Efimova (2005)’s PKM Model.....................................................................61
Figure 2. 16: Wright (2005)’s PKM Framework ...............................................................64
Figure 2. 17: Zuber-Skerritt (2005)’s PKM Model (A values and actions model)...........69
Figure 2. 18: Agnihotri and Troutt (2009)’s PKM Model (PKM Skills Tools Fit Model)70
Figure 2. 19: Jarche (2010)’s PKM Model ........................................................................74
Figure 2. 20: Learning Process ..........................................................................................79
Figure 2. 21: Professional Competences............................................................................82
Figure 2. 22: The Effective Knowledge Organisation architectural framework ...............84
Figure 2. 23: Comparison of Knowledge-related element in Effective Knowledge
Organisation.......................................................................................................................85
Figure 3. 1: Structure of Research Methodology...............................................................90
Figure 3. 2: Theoretical Model ..........................................................................................98
Figure 3. 3: The Research Design....................................................................................102
Figure 3. 4: Question 3.1 for Roles of PKM in KM Process ...........................................112
Figure 3. 5: Questions 4.1 for Values of PKM for Individuals........................................112
Figure 3. 6: Questions 5.1 for Values of PKM for Individuals........................................113
Figure 3. 7: Summary of Research Design .....................................................................116
Figure 3. 8: Data Analysis Procedure ..............................................................................117
Figure 4. 1: Structure of Chapter 4 ..................................................................................123
Figure 4. 2 : PKM Adoption ............................................................................................129
Figure 4. 3 : PKM Training..............................................................................................130
Figure 4. 4 : Geographic Distribution of Respondents ....................................................131
Figure 4. 5 : Age Group ...................................................................................................131
Figure 4. 6 : Gender .........................................................................................................132
Figure 4. 7 : Work Position..............................................................................................132
Figure 4. 8 : Organisation Type .......................................................................................133
Figure 4. 9 : Industry........................................................................................................133
Figure 4. 10 : Work Experience.......................................................................................134
Figure 4. 11 : Education...................................................................................................134
Figure 4. 12 : Role of PKM in Locating / Capturing Knowledge....................................137
ix
Figure 4. 13 : The Role of PKM in Creating Knowledge................................................137
Figure 4. 14 : The Role of PKM in Transferring / Sharing Knowledge ..........................138
Figure 4. 15 : The Role of PKM in Applying Knowledge...............................................139
Figure 4. 16 : The Value of PKM in Communication Competence ................................140
Figure 4. 17 : The Value of PKM in Creativity Competence ..........................................140
Figure 4. 18 : The Value of PKM in Problem Solving Competence ...............................141
Figure 4. 19 : The Value of PKM in Learning / Self Development.................................141
Figure 4. 20 : The Value of PKM in Mental Agility Competence ..................................142
Figure 4. 21 : The Value of PKM in Analysis Competence ............................................143
Figure 4. 22 : The Value of PKM in Reflecting Competence .........................................143
Figure 4. 23 : The Value of PKM in External Information Awareness Competence......144
Figure 4. 24 : The Value of PKM in Internal Knowledge Dissemination Competence ..145
Figure 4. 25 : The Value of PKM in Effective Decision Making Competence...............145
Figure 4. 26 : The Value of PKM in Organisation Focus Competence...........................146
Figure 4. 27 : The Value of PKM in Continuous Innovation Competence .....................146
Figure 4. 28 : The Construct Assessment of PKM1 ........................................................149
Figure 4. 29 : Histogram of PKM1 ..................................................................................150
Figure 4. 30 : The construct Assessment of PKM 2 ........................................................151
Figure 4. 31 : Histogram of PKM2 ..................................................................................152
Figure 4. 32 : Construct Assessment of PKM3................................................................153
Figure 4. 33 : Histogram of PKM3 ..................................................................................154
Figure 4. 34 : Construct Assessment of PKM4................................................................155
Figure 4. 35 : Histogram of PKM4 ..................................................................................156
Figure 4. 36 : The Construct Assessment of PKM5 ........................................................157
Figure 4. 37 : Histogram of PKM5 ..................................................................................158
Figure 4. 38 : The Construct Assessment of PKM6 ........................................................159
Figure 4. 39 : Histogram of PKM6 ..................................................................................160
Figure 4. 40 : The Construct Assessment of PKM7 ........................................................161
Figure 4. 41 : Histogram of PKM7 ..................................................................................162
Figure 4. 42 : The Construct Assessment of IV.PKM1 ...................................................163
Figure 4. 43 : Histogram of IV.PKM1.............................................................................164
Figure 4. 44 : The Construct Assessment of IV.PKM2 ...................................................165
Figure 4. 45 : Histogram of IV.PKM2.............................................................................166
Figure 4. 46 : The Construct Assessment of IV.PKM3 ...................................................167
Figure 4. 47 : Histogram of IV.PKM3.............................................................................168
Figure 4. 48 : The Construct Assessment of IV.PKM4 ...................................................169
Figure 4. 49 : Histogram of IV.PKM4.............................................................................170
Figure 4. 50 : The Construct Assessment of IV.PKM5 ...................................................171
Figure 4. 51 : Histogram of IV.PKM5.............................................................................172
Figure 4. 52 : The Construct Assessment of IV.PKM6 ...................................................174
Figure 4. 53 : Histogram of IV.PKM6.............................................................................175
Figure 4. 54 : The Construct Assessment of IV.PKM7 ...................................................176
Figure 4. 55 : Histogram of IV.PKM7.............................................................................177
Figure 4. 56 : The Construct Assessment of OV.PKM1..................................................178
Figure 4. 57 : Histogram of OV.PKM1 ...........................................................................179
Figure 4. 58 : The Construct Assessment of OV.PKM2..................................................180
Figure 4. 59 : Histogram of OV.PKM2 ...........................................................................181
Figure 4. 60 : The Construct Assessment of OV.PKM3..................................................182
Figure 4. 61 : Histogram of OV.PKM3 ...........................................................................183
Figure 4. 62 : The Construct Assessment of OV.PKM4..................................................184
x
Figure 4. 63 : Histogram of OV.PKM4 ...........................................................................185
Figure 4. 64 : The Construct Assessment of OV.PKM5..................................................186
Figure 4. 65 : Histogram of OV.PKM5 ...........................................................................187
Figure 4. 66 : The Construct Assessment of OV.PKM6..................................................188
Figure 4. 67 : Histogram of OV.PKM6 ...........................................................................189
Figure 4. 68 : The Construct Assessment of OV.PKM7..................................................190
Figure 4. 69 : Histogram of OV.PKM7 ...........................................................................191
Figure 4. 70 : Mean Score of the Roles of PKM in KM Cycle........................................205
Figure 4. 71 : Mean Score of PKM Values for Individuals’ Competences .....................206
Figure 4. 72 : Mean Score of PKM Values for Organisations’ Competences.................208
Figure 4. 73 : Model for SEM Analysis...........................................................................219
Figure 4. 74 : Measurement Model..................................................................................223
Figure 4. 75 : Structural Model 1.....................................................................................225
Figure 4. 76 : Structural Model 2.....................................................................................228
Figure 5. 1 : Structure of Chapter 5 .................................................................................232
Figure 5. 2 : The Roles of Retrieving Skill in KM Processes..........................................236
Figure 5. 3 : The Roles of Evaluating Skill in KM Processes .........................................236
Figure 5. 4 : The Roles of Organising Skill in KM Processes.........................................237
Figure 5. 5 : The Roles of Analysing Skill in KM Processes ..........................................238
Figure 5. 6 : The Roles of Collaborating Skill in KM Processes.....................................239
Figure 5. 7 : The Roles of Presenting Skill in KM Processes..........................................239
Figure 5. 8 : The Roles of Securing Skill in KM Processes ............................................240
Figure 5. 9 : PKM Values for Communication Competence...........................................243
Figure 5. 10 : PKM Values for Creativity Competence...................................................243
Figure 5. 11 : PKM Values for Problem Solving Competence........................................244
Figure 5. 12 : PKM Values for Learning / Self Development Competence ....................245
Figure 5. 13 : PKM Values for Mental Agility Competence...........................................246
Figure 5. 14 : PKM Values for Analysis Competence.....................................................247
Figure 5. 15 : PKM Values for Reflection Competence..................................................247
Figure 5. 16 : PKM Values for External Information Awareness Competence ..............249
Figure 5. 17 : PKM Values for Internal Knowledge Dissemination Competence...........250
Figure 5. 18 : PKM Values for Effective Decision Making Competence .......................250
Figure 5. 19 : PKM Values for Organisation Focus Competence ...................................251
Figure 5. 20 : PKM Values for Continuous Innovation Competence..............................252
Figure 5. 21 : Model 1 and Model 2 of SEM Analysis....................................................258
Figure 5. 22 : Roles and Values PKM Model..................................................................268
Figure 6. 1 : Structure of Chapter 6 .................................................................................272
Figure 6. 2: PKM 2.0 Conceptual Model.........................................................................273
xi
List of Tables
Table 1. 1: KM and PKM search counts reported at Sept 13 2009 .....................................3
Table 1. 2: Research Question, Hypotheses and Sub-Hypotheses.......................................8
Table 2. 1: Benefits of Knowledge Management ..............................................................22
Table 2. 2: The Role of Frand and Hixon’s (1999) PKM Model .....................................50
Table 2. 3: The role of Avery et al. (2001)’s PKM Model ................................................57
Table 2. 4: The roles of Berman and Annexstein (2003)’s PKM Model...........................60
Table 2. 5: The Role of Efimova (2005)’s PKM Model....................................................61
Table 2. 6: The Role of Wright (2005)‘s PKM model.......................................................65
Table 2. 7: The Role of Zuber-Skerritt (2005)’s PKM model ...........................................68
Table 2. 8: The roles of Agnihotri and Troutt (2009)’s PKM model ...............................73
Table 2. 9: The roles of Jarche (2010)’s PKM model........................................................75
Table 2. 10: Analysis of PKM Models against KM Processes ..........................................78
Table 2. 11: Mapping of benefit and values to seven individuals competences................83
Table 3. 1: Basic Belief Systems of Alternative Enquiry Paradigms ................................93
Table 3. 2: Quantitative Research versus Qualitative Research ........................................93
Table 3. 3: Research Questions and Hypotheses ...............................................................99
Table 3. 4: Constructs and Variables for Measurement...................................................101
Table 3. 5: Probability and Non-probability Samplings Designs ....................................106
Table 3. 6: Advantages of On-line Survey.......................................................................110
Table 3. 7: Mapping of questions to hypotheses and research questions ........................115
Table 4. 1: Coding Scheme for this Research..................................................................128
Table 4. 2 : Renaming Variables Name...........................................................................192
Table 4. 3 : Assessment of the difference between groups for RPKM by ANOVA Test193
Table 4. 4 : Pro Hoc Comparison of RPKM1 and PKM_Adoption ................................194
Table 4. 5 : Pro Hoc Comparison of RPKM6 and PKM_Adoption ................................194
Table 4. 6 : Assessment of the difference between groups for IVPKM by ANOVA Test
..........................................................................................................................................195
Table 4. 7 : Pro Hoc Test of IVPKM1 and PKM_Adoption ...........................................195
Table 4. 8 : Pro Hoc Test of IVPKM5 and PKM_Adoption ...........................................196
Table 4. 9 : Assessment of the difference between groups for OVPKM by ANOVA Test
..........................................................................................................................................196
Table 4. 10 : Pro Hoc Test of OVPKM1 and PKM_Adoption........................................197
Table 4. 11 : Pro Hoc Test of OVPKM5 and PKM_Adoption........................................197
Table 4. 12 : Assessment of the difference between groups for RPKM and
Respondent_Industry by ANOVA Test ...........................................................................198
Table 4. 13 : Pro Hoc Comparison of RPKM6 and Respondent_Industry......................199
Table 4. 14 : Assessment of between groups for IVPKM and Respondent_Industry by
ANOVA Test ...................................................................................................................200
Table 4. 15 : Pro Hoc Test of IVPKM6 and Respondent_Industry .................................201
Table 4. 16 : Assessment of between groups for OVPKM and Respondent_Industry by
ANOVA Test ...................................................................................................................202
Table 4. 17 : Pro Hoc Test of OVPKM1 and Respondent_Industry ...............................203
Table 4. 18 : Mean Score of PKM Skills in KM Cycle ...................................................204
Table 4. 19 : Mean Score of PKM Values for Individuals Competences........................206
Table 4. 20 : Mean Score of PKM Values for Individuals’ Competences ......................206
Table 4. 21 : Mean Score of PKM Values for Organisations’ Competences ..................207
Table 4. 22 : Linear Regression of PKM Skills and PKM Values for Individuals..........209
Table 4. 23 : Linear Regression of PKM Skills and PKM Values for Organisations......211
xii
Table 4. 24 : Linear Regression of PKM Skills and PKM Values for Organisations......214
Table 4. 25 : Hypotheses Tests Results ...........................................................................217
Table 4. 26 : Reliability Test of Measurement Model.....................................................221
Table 4. 27 : Goodness-of-Fit of Measurement Model....................................................221
Table 4. 28 : Standard Regression of Measurement Model.............................................222
Table 4. 29 : Goodness-of-Fit of Structural Model 1.......................................................224
Table 4. 30 : Standard Regression of Structural Model 1................................................225
Table 4. 31 : Goodness-of-Fit of Structural Model 2.......................................................226
Table 4. 32 : Standard Regression of Structural Model 2................................................227
Table 5. 1 : Research Questions and Hypotheses ............................................................234
Table 5. 2 : The Means Score PKM skills in KM Processes ...........................................235
Table 5. 3 : Mean and Ranking of PKM Skills in Individuals Competences ..................241
Table 5. 4 : Mean and Ranking of PKM Skills in Individuals Competences ..................242
Table 5. 5 : Mean and Ranking of PKM Skills in Organisations Competences..............248
Table 5. 6 : The strength of relationship between the roles of PKM skills in KM Process
and the values of PKM skills in individuals competences...............................................254
Table 5. 7 : The strength of relationship between the roles of PKM skills in KM Process
and the values of PKM skills in organisation competences.............................................255
Table 5. 8 : The strength of relationship between the PKM skills’ values for individual
competences and organisation competences....................................................................257
Table 6. 1: PKM 2.0 Conceptual Model ..........................................................................273
xiii
Abbreviations
AMOS – A statistical software package for SEM, produced by SPSS
d.f. – Degree of Freedom
DV – Dependent Variable
EFA - Exploratory Factor Analysis
H – Hypothesis
HREC - Human Research Ethics Committee
IL – Individual Learning
IV – Independent Variable
KM – Knowledge Management
PCA – Principal Components Analysis
PKM – Personal Knowledge Management
PKMIV – Value of PKM for Individuals
PKMOV – Value of PKM for Organisations
OL – Organisation Learning
RQ – Research Question
SD – Standard Deviation
SEM – Structural Equation Modelling
PASW (SPSS) – Predictive Analytics Software (formerly, Statistical Package for the
Social Science
Chapter 1: Introduction
Copyright@ Ricky K.F. Cheong 2011 Page 1
CChhaapptteerr 11 -- IInnttrroodduuccttiioonn
Chapter 1: Introduction
Copyright@ Ricky K.F. Cheong 2011 Page 2
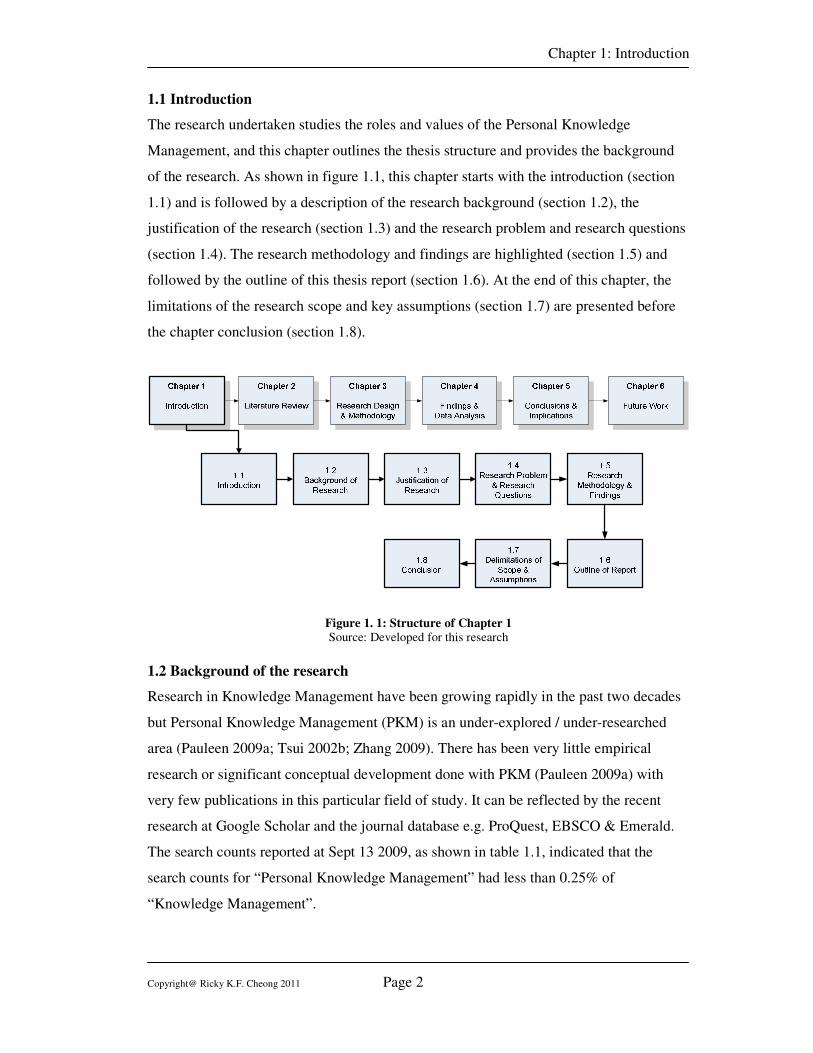
1.1 Introduction
The research undertaken studies the roles and values of the Personal Knowledge
Management, and this chapter outlines the thesis structure and provides the background
of the research. As shown in figure 1.1, this chapter starts with the introduction (section
1.1) and is followed by a description of the research background (section 1.2), the
justification of the research (section 1.3) and the research problem and research questions
(section 1.4). The research methodology and findings are highlighted (section 1.5) and
followed by the outline of this thesis report (section 1.6). At the end of this chapter, the
limitations of the research scope and key assumptions (section 1.7) are presented before
the chapter conclusion (section 1.8).
Figure 1. 1: Structure of Chapter 1
Source: Developed for this research
1.2 Background of the research
Research in Knowledge Management have been growing rapidly in the past two decades
but Personal Knowledge Management (PKM) is an under-explored / under-researched
area (Pauleen 2009a; Tsui 2002b; Zhang 2009). There has been very little empirical
research or significant conceptual development done with PKM (Pauleen 2009a) with
very few publications in this particular field of study. It can be reflected by the recent
research at Google Scholar and the journal database e.g. ProQuest, EBSCO & Emerald.
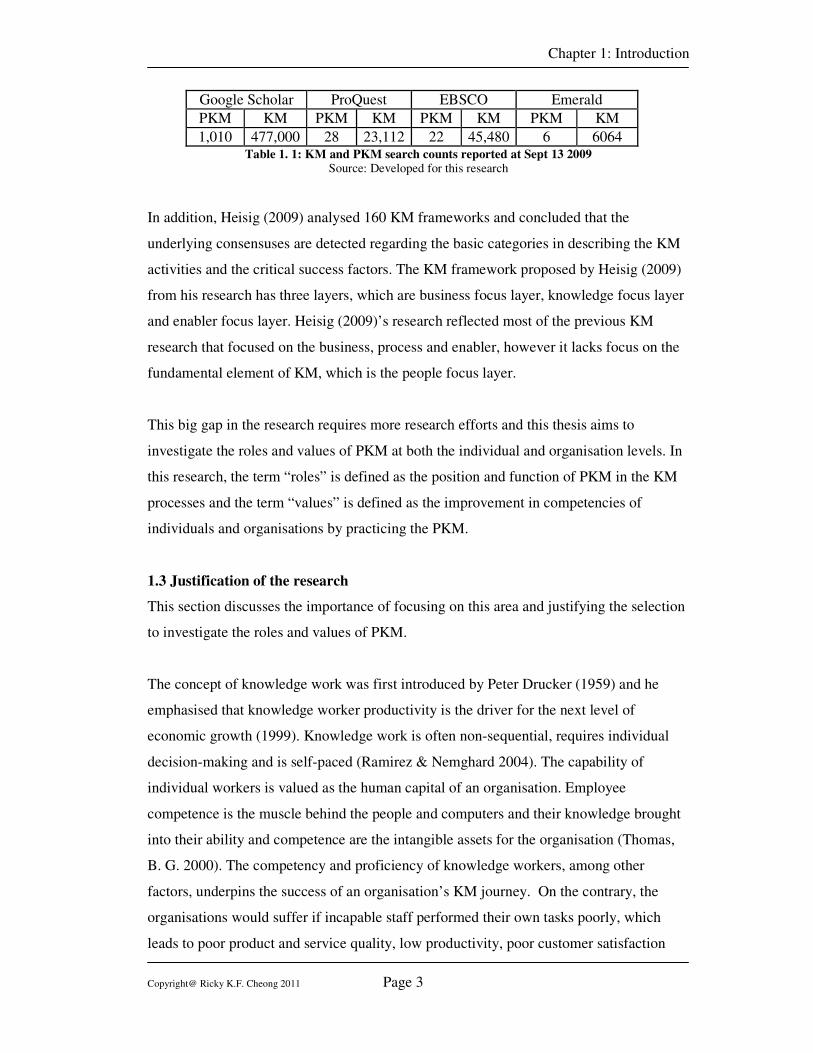
The search counts reported at Sept 13 2009, as shown in table 1.1, indicated that the
search counts for “Personal Knowledge Management” had less than 0.25% of
“Knowledge Management”.
Chapter 1: Introduction
Copyright@ Ricky K.F. Cheong 2011 Page 3
Google Scholar ProQuest EBSCO Emerald
PKM KM PKM KM PKM KM PKM KM
1,010 477,000 28 23,112 22 45,480 6 6064 Table 1. 1: KM and PKM search counts reported at Sept 13 2009
Source: Developed for this research
In addition, Heisig (2009) analysed 160 KM frameworks and concluded that the
underlying consensuses are detected regarding the basic categories in describing the KM
activities and the critical success factors. The KM framework proposed by Heisig (2009)
from his research has three layers, which are business focus layer, knowledge focus layer
and enabler focus layer. Heisig (2009)’s research reflected most of the previous KM
research that focused on the business, process and enabler, however it lacks focus on the
fundamental element of KM, which is the people focus layer.
This big gap in the research requires more research efforts and this thesis aims to
investigate the roles and values of PKM at both the individual and organisation levels. In
this research, the term “roles” is defined as the position and function of PKM in the KM
processes and the term “values” is defined as the improvement in competencies of
individuals and organisations by practicing the PKM.
1.3 Justification of the research
This section discusses the importance of focusing on this area and justifying the selection
to investigate the roles and values of PKM.
The concept of knowledge work was first introduced by Peter Drucker (1959) and he
emphasised that knowledge worker productivity is the driver for the next level of
economic growth (1999). Knowledge work is often non-sequential, requires individual
decision-making and is self-paced (Ramirez & Nemghard 2004). The capability of
individual workers is valued as the human capital of an organisation. Employee
competence is the muscle behind the people and computers and their knowledge brought
into their ability and competence are the intangible assets for the organisation (Thomas,
B. G. 2000). The competency and proficiency of knowledge workers, among other
factors, underpins the success of an organisation’s KM journey. On the contrary, the
organisations would suffer if incapable staff performed their own tasks poorly, which
leads to poor product and service quality, low productivity, poor customer satisfaction
Chapter 1: Introduction
Copyright@ Ricky K.F. Cheong 2011 Page 4
and ends up reducing the organisation’s competitive advantages in the market.
Obviously, individual knowledge and competence are important factors for organisations’
performance.
David Pauleen (2009a) mentioned that Personal Knowledge Management is helping
individuals to be more effective in personal, organisational and social environments.
From the previous literature, it was clear that the individual is playing an important role
in organisational learning and knowledge management. The main stream of
organisational learning considers individuals as “agents” for organisations to learn
(Argyris, C. & Schon 1978). New knowledge always begins with the individual making
personal knowledge available to others and is the central activity of the knowledge
creation company (Nonaka 1991). A learning organisation should primarily focus on
valuing, managing and enhancing the individual development of its employees
(Scarbrough, Swan & Preston 1998). The relationship between individual and
organisation learning is an important aspect (Kim, D. H. 1993; Matlay 2000). Ahmed et
al. (2002) mentioned that knowledge management involves individuals combining and
sharing their experience, skills, intuition, ideas, judgments, context, motivations and
interpretations. One of the knowledge management strategies proposed by Wiig (1997) is
personal knowledge responsibility.
Pauleen (2009a) argued that the history of PKM begins with the idea of the knowledge
worker by Drucker (1968), but Volkel and Abecker (2008) mentioned that the term PKM
had already been used since Polanyi (1958). Numbers of scholars have tried to define
their own PKM model e.g. Frand and Hixon (1999)’s PKM Model (PIM Model), Avery
et al (2001)’s PKM Model (PKM Skills Model), Berman and Annexstein (2003)’s PKM
Model (PK-Book Model) , Efimova (2005)’s PKM Model (Individuals, Ideas and
Communities Model), Wright (2005)’s PKM Model (Competences Model), Zuber-
Skerritt (2005)’s PKM Model (Values and Actions Model), Agnihotri and Troutt
(2009)’s PKM Model (PKM Skill-Tools Fit model), and Jarche (2010)’s PKM Model
(Aggregate, Understand and Connect Model). All these PKM models shared the same
assumption that PKM is important and could benefit individuals and organisations.
However, there is a shortfall of empirical research to investigate the roles and values of
PKM.
Chapter 1: Introduction
Copyright@ Ricky K.F. Cheong 2011 Page 5
This research is important as it can fill this gap in knowledge and can provide empirical
evidence to support the assumption in previous scholars’ work on PKM. It is also
important to have a roles and values PKM model which can be used for future research as
well as a reference for executives in organisations. It sets the foundation to further
develop the theory, policy and practice of PKM, and benefits both academia and business.
In addition, the author has keen interests in investigating the roles and values of PKM.
The author also believes that this research would lead to an improvement of his own
competences and PKM skills, and as a result can achieve a better performance through a
PKM strategy to manage his work and social life.
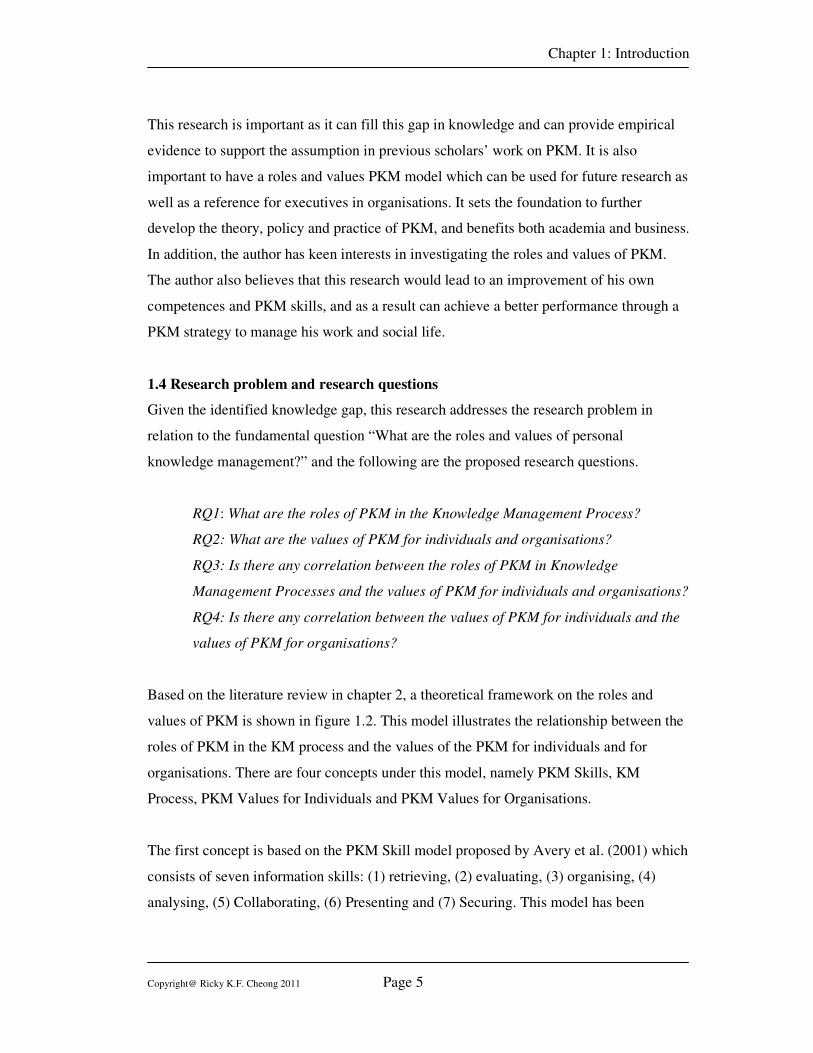
1.4 Research problem and research questions
Given the identified knowledge gap, this research addresses the research problem in
relation to the fundamental question “What are the roles and values of personal
knowledge management?” and the following are the proposed research questions.
RQ1: What are the roles of PKM in the Knowledge Management Process?
RQ2: What are the values of PKM for individuals and organisations?
RQ3: Is there any correlation between the roles of PKM in Knowledge
Management Processes and the values of PKM for individuals and organisations?
RQ4: Is there any correlation between the values of PKM for individuals and the
values of PKM for organisations?
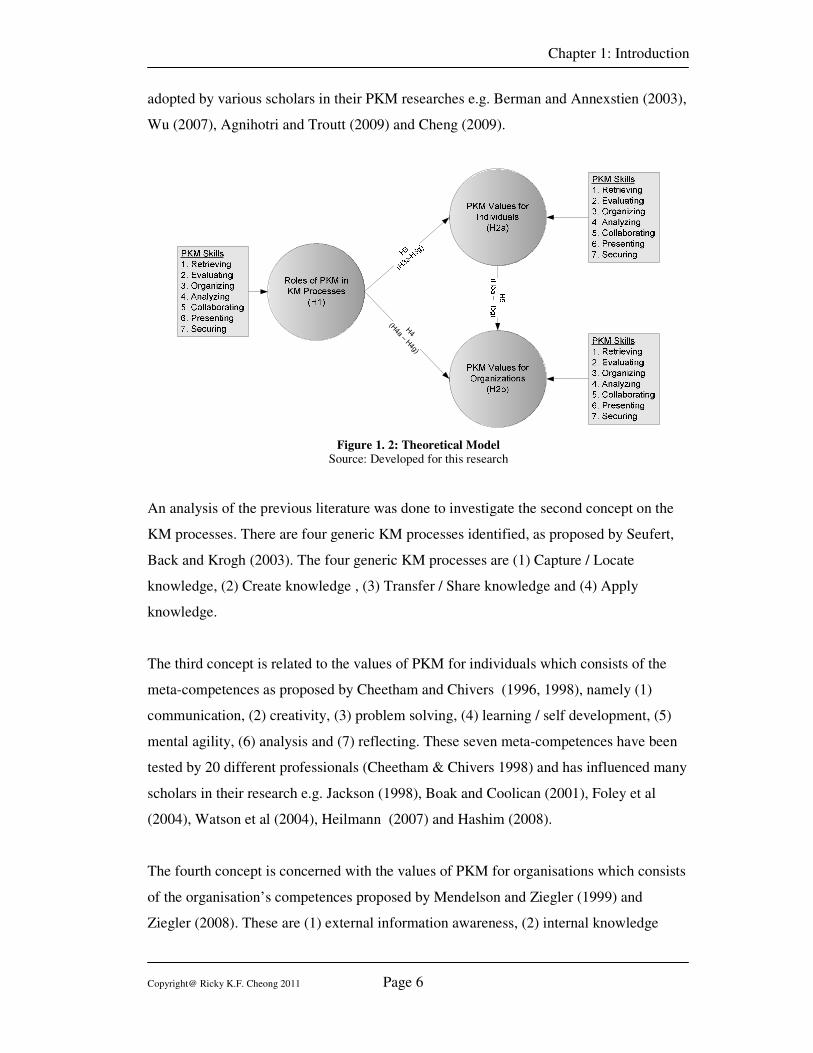
Based on the literature review in chapter 2, a theoretical framework on the roles and
values of PKM is shown in figure 1.2. This model illustrates the relationship between the
roles of PKM in the KM process and the values of the PKM for individuals and for
organisations. There are four concepts under this model, namely PKM Skills, KM
Process, PKM Values for Individuals and PKM Values for Organisations.
The first concept is based on the PKM Skill model proposed by Avery et al. (2001) which
consists of seven information skills: (1) retrieving, (2) evaluating, (3) organising, (4)
analysing, (5) Collaborating, (6) Presenting and (7) Securing. This model has been
Chapter 1: Introduction
Copyright@ Ricky K.F. Cheong 2011 Page 6
adopted by various scholars in their PKM researches e.g. Berman and Annexstien (2003),
Wu (2007), Agnihotri and Troutt (2009) and Cheng (2009).
H4
(H4a – H
4g)
Figure 1. 2: Theoretical Model Source: Developed for this research
An analysis of the previous literature was done to investigate the second concept on the
KM processes. There are four generic KM processes identified, as proposed by Seufert,
Back and Krogh (2003). The four generic KM processes are (1) Capture / Locate
knowledge, (2) Create knowledge , (3) Transfer / Share knowledge and (4) Apply
knowledge.
The third concept is related to the values of PKM for individuals which consists of the
meta-competences as proposed by Cheetham and Chivers (1996, 1998), namely (1)
communication, (2) creativity, (3) problem solving, (4) learning / self development, (5)
mental agility, (6) analysis and (7) reflecting. These seven meta-competences have been
tested by 20 different professionals (Cheetham & Chivers 1998) and has influenced many
scholars in their research e.g. Jackson (1998), Boak and Coolican (2001), Foley et al
(2004), Watson et al (2004), Heilmann (2007) and Hashim (2008).
The fourth concept is concerned with the values of PKM for organisations which consists
of the organisation’s competences proposed by Mendelson and Ziegler (1999) and
Ziegler (2008). These are (1) external information awareness, (2) internal knowledge
Chapter 1: Introduction
Copyright@ Ricky K.F. Cheong 2011 Page 7
dissemination, (3) effective decision making, (4) organisation focus and (5) continuous
innovation. Previous research performed by Mendelson and Ziegler confirmed that these
five organisation’s competences were positively correlated to the firm performance.
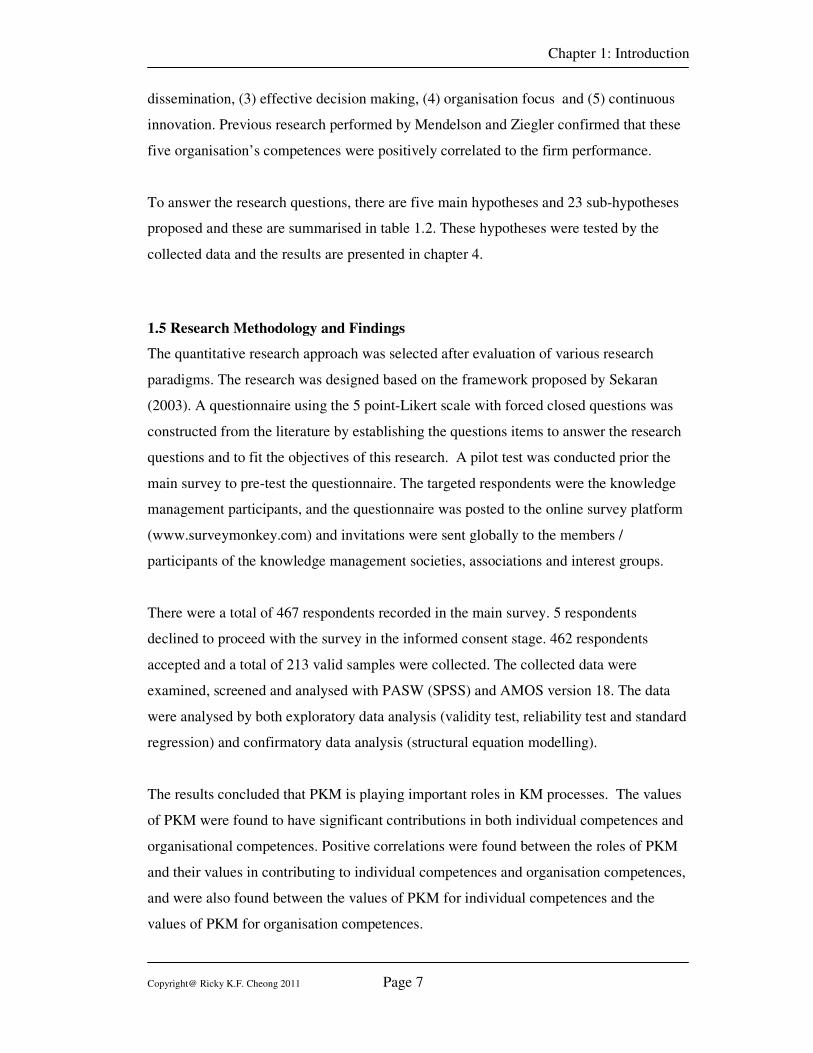
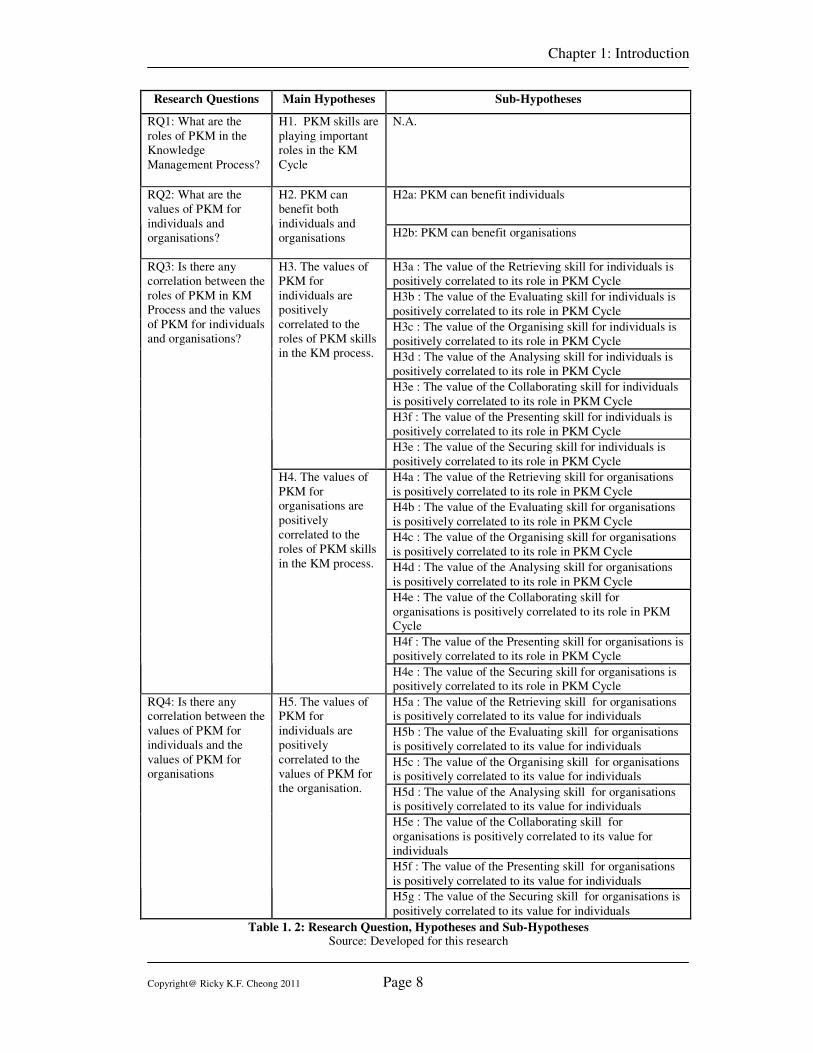
To answer the research questions, there are five main hypotheses and 23 sub-hypotheses
proposed and these are summarised in table 1.2. These hypotheses were tested by the
collected data and the results are presented in chapter 4.
1.5 Research Methodology and Findings
The quantitative research approach was selected after evaluation of various research
paradigms. The research was designed based on the framework proposed by Sekaran
(2003). A questionnaire using the 5 point-Likert scale with forced closed questions was
constructed from the literature by establishing the questions items to answer the research
questions and to fit the objectives of this research. A pilot test was conducted prior the
main survey to pre-test the questionnaire. The targeted respondents were the knowledge
management participants, and the questionnaire was posted to the online survey platform
(www.surveymonkey.com) and invitations were sent globally to the members /
participants of the knowledge management societies, associations and interest groups.
There were a total of 467 respondents recorded in the main survey. 5 respondents
declined to proceed with the survey in the informed consent stage. 462 respondents
accepted and a total of 213 valid samples were collected. The collected data were
examined, screened and analysed with PASW (SPSS) and AMOS version 18. The data
were analysed by both exploratory data analysis (validity test, reliability test and standard
regression) and confirmatory data analysis (structural equation modelling).
The results concluded that PKM is playing important roles in KM processes. The values
of PKM were found to have significant contributions in both individual competences and
organisational competences. Positive correlations were found between the roles of PKM
and their values in contributing to individual competences and organisation competences,
and were also found between the values of PKM for individual competences and the
values of PKM for organisation competences.
Chapter 1: Introduction
Copyright@ Ricky K.F. Cheong 2011 Page 8
Research Questions Main Hypotheses Sub-Hypotheses
RQ1: What are the
roles of PKM in the
Knowledge
Management Process?
H1. PKM skills are
playing important
roles in the KM
Cycle
N.A.
H2a: PKM can benefit individuals RQ2: What are the
values of PKM for
individuals and
organisations?
H2. PKM can
benefit both
individuals and
organisations H2b: PKM can benefit organisations
H3a : The value of the Retrieving skill for individuals is
positively correlated to its role in PKM Cycle
H3b : The value of the Evaluating skill for individuals is
positively correlated to its role in PKM Cycle
H3c : The value of the Organising skill for individuals is
positively correlated to its role in PKM Cycle
H3d : The value of the Analysing skill for individuals is
positively correlated to its role in PKM Cycle
H3e : The value of the Collaborating skill for individuals
is positively correlated to its role in PKM Cycle
H3f : The value of the Presenting skill for individuals is
positively correlated to its role in PKM Cycle
H3. The values of
PKM for
individuals are
positively
correlated to the
roles of PKM skills
in the KM process.
H3e : The value of the Securing skill for individuals is
positively correlated to its role in PKM Cycle
H4a : The value of the Retrieving skill for organisations
is positively correlated to its role in PKM Cycle
H4b : The value of the Evaluating skill for organisations
is positively correlated to its role in PKM Cycle
H4c : The value of the Organising skill for organisations
is positively correlated to its role in PKM Cycle
H4d : The value of the Analysing skill for organisations
is positively correlated to its role in PKM Cycle
H4e : The value of the Collaborating skill for
organisations is positively correlated to its role in PKM
Cycle
H4f : The value of the Presenting skill for organisations is
positively correlated to its role in PKM Cycle
RQ3: Is there any
correlation between the
roles of PKM in KM
Process and the values
of PKM for individuals
and organisations?
H4. The values of
PKM for
organisations are
positively
correlated to the
roles of PKM skills
in the KM process.
H4e : The value of the Securing skill for organisations is
positively correlated to its role in PKM Cycle
H5a : The value of the Retrieving skill for organisations
is positively correlated to its value for individuals
H5b : The value of the Evaluating skill for organisations
is positively correlated to its value for individuals
H5c : The value of the Organising skill for organisations
is positively correlated to its value for individuals
H5d : The value of the Analysing skill for organisations
is positively correlated to its value for individuals
H5e : The value of the Collaborating skill for
organisations is positively correlated to its value for
individuals
H5f : The value of the Presenting skill for organisations
is positively correlated to its value for individuals
RQ4: Is there any
correlation between the
values of PKM for
individuals and the
values of PKM for
organisations
H5. The values of
PKM for
individuals are
positively
correlated to the
values of PKM for
the organisation.
H5g : The value of the Securing skill for organisations is
positively correlated to its value for individuals
Table 1. 2: Research Question, Hypotheses and Sub-Hypotheses Source: Developed for this research
Chapter 1: Introduction
Copyright@ Ricky K.F. Cheong 2011 Page 9
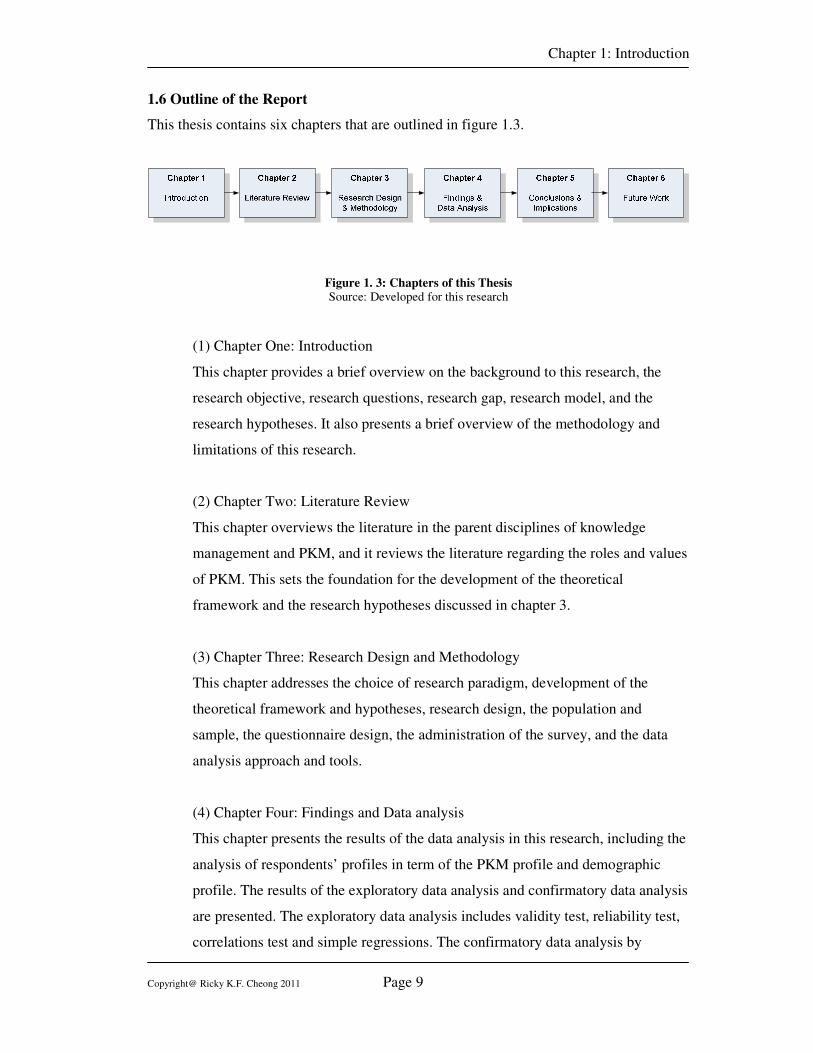
1.6 Outline of the Report
This thesis contains six chapters that are outlined in figure 1.3.
Figure 1. 3: Chapters of this Thesis Source: Developed for this research
(1) Chapter One: Introduction
This chapter provides a brief overview on the background to this research, the
research objective, research questions, research gap, research model, and the
research hypotheses. It also presents a brief overview of the methodology and
limitations of this research.
(2) Chapter Two: Literature Review
This chapter overviews the literature in the parent disciplines of knowledge
management and PKM, and it reviews the literature regarding the roles and values
of PKM. This sets the foundation for the development of the theoretical
framework and the research hypotheses discussed in chapter 3.
(3) Chapter Three: Research Design and Methodology
This chapter addresses the choice of research paradigm, development of the
theoretical framework and hypotheses, research design, the population and
sample, the questionnaire design, the administration of the survey, and the data
analysis approach and tools.
(4) Chapter Four: Findings and Data analysis
This chapter presents the results of the data analysis in this research, including the
analysis of respondents’ profiles in term of the PKM profile and demographic
profile. The results of the exploratory data analysis and confirmatory data analysis
are presented. The exploratory data analysis includes validity test, reliability test,
correlations test and simple regressions. The confirmatory data analysis by
Chapter 1: Introduction
Copyright@ Ricky K.F. Cheong 2011 Page 10
structural equation modeling was conducted to test both the measurement model
and hypotheses model.
(5) Chapter Five: Conclusion and Implications
This chapter provides the conclusions and implications for the whole thesis, and
discusses the research conclusion, the research implications for the theory, policy
and practice, research contributions and research limitations.
(6) Chapter Six: Future Work
This chapter presents the direction of future research. A PKM 2.0 model is
developed based on the research results and this model can set the foundation for
future research in the area of Personal Knowledge Management.
1.7 Delimitation of scope and key assumptions
The research was performed by online survey and limited only to those respondents who
could be reached on the Internet. The targeted respondents were affiliated to knowledge
management societies, associations or interest groups, which also is a delimitation of
scope. Although there is no geographic limitation set in this research, the footprint of the
targeted knowledge management organisations has indeed placed a limitation on the
locations of the respondents.
In addition, the delimitation set by the Southern Cross University’s Doctor of Business
Administration (DBA) program is that the limitation of the length of the thesis of
approximately 50,000 words is acknowledged.
A key assumption in this research is that the respondents were able to reflect their own
experience in determine the roles and values of the PKM, at both the individual and
organisation levels.
1.8 Chapter conclusion
This chapter lays the foundation for the thesis and provides an overview of the research.
The background of the research is explained, and the research problems and research
questions are introduced. The research is justified and followed by a brief discussion
about the research methodology. The outline of the thesis is presented and definitions of
Chapter 1: Introduction
Copyright@ Ricky K.F. Cheong 2011 Page 11
the key terms used in this research are highlighted. The delimitation of the scope and key
assumption are discussed. On these foundations, the rest of this thesis presents a detailed
description of the research.
Chapter 2: Literature Review
Copyright@ Ricky K.F. Cheong 2011 Page 12
CChhaapptteerr 22 -- LLiitteerraattuurree RReevviieeww
Chapter 2: Literature Review
Copyright@ Ricky K.F. Cheong 2011 Page 13
2.1 Introduction
The aim of the previous chapter is to provide background information about this research
which sets the scene for the rest of the thesis. The purpose of this chapter is to review the
existing literature which sets the foundation of the theoretical framework for this
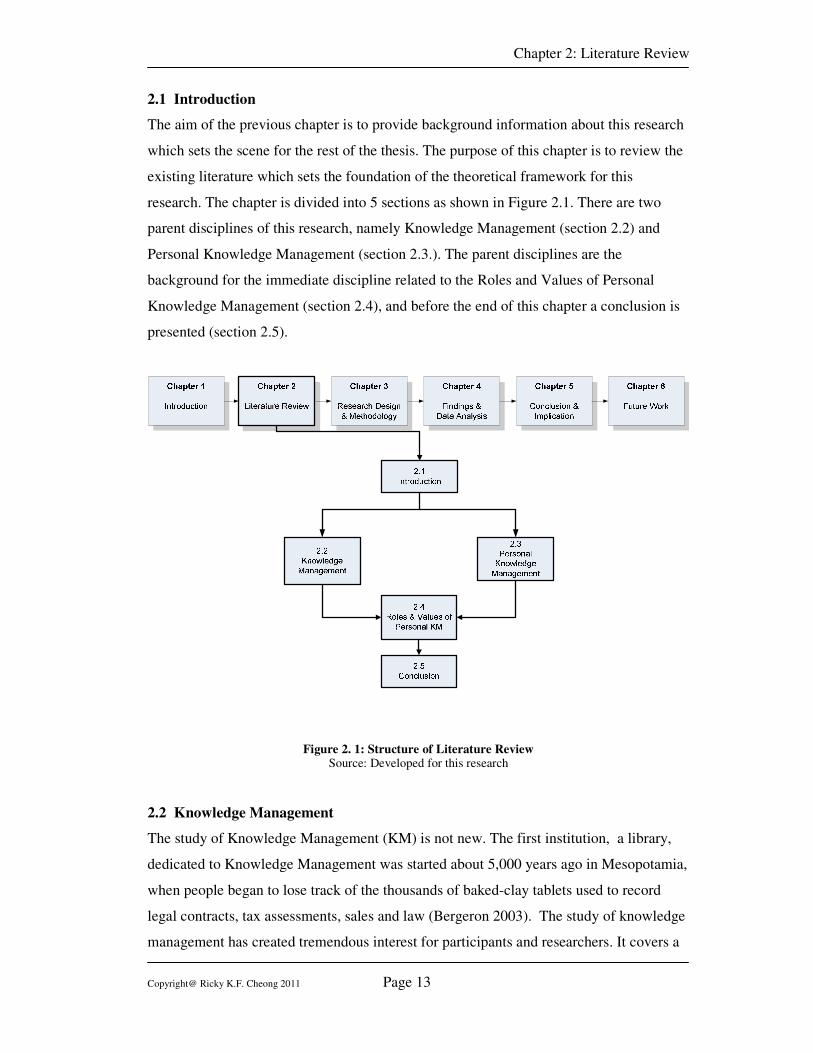
research. The chapter is divided into 5 sections as shown in Figure 2.1. There are two
parent disciplines of this research, namely Knowledge Management (section 2.2) and
Personal Knowledge Management (section 2.3.). The parent disciplines are the
background for the immediate discipline related to the Roles and Values of Personal
Knowledge Management (section 2.4), and before the end of this chapter a conclusion is
presented (section 2.5).
Figure 2. 1: Structure of Literature Review Source: Developed for this research
2.2 Knowledge Management
The study of Knowledge Management (KM) is not new. The first institution, a library,
dedicated to Knowledge Management was started about 5,000 years ago in Mesopotamia,
when people began to lose track of the thousands of baked-clay tablets used to record
legal contracts, tax assessments, sales and law (Bergeron 2003). The study of knowledge
management has created tremendous interest for participants and researchers. It covers a
Chapter 2: Literature Review
Copyright@ Ricky K.F. Cheong 2011 Page 14
broad range of fields, including but not limited to economics, information systems,
organisational behaviour, psychology, strategic management, linguistics, cognitive
science, philosophy, anthropology and sociology (Argote, McEvily & Reagans 2003;
Nonaka & Teece 2001).
This section provides the critical literature review of knowledge management, which
covers discussion on the definition of knowledge, types of knowledge, knowledge
conversion, definition of knowledge management, school of thoughts of knowledge
management, knowledge management process and organisational learning. These are the
foundation of our discussion in the next section related to the PKM.
2.2.1 What is Knowledge?
There is no single agreed definition of knowledge. Grant (2000) mentioned that there is a
philosophical debate as to what knowledge is and valuing what we do not even
understand is unlikely. The philosopher, Plato, defined knowledge as perception and true
judgement. The definitions of Knowledge in the Oxford English Dictionary are:
(1) Information and skills acquired through experience or education
(2) The sum of what is known
(3) Awareness or familiarity gained by experience of a fact or situation.
Van and Spijkervet (1997, p. 36) defined knowledge as the ‘whole set of insights,
experiences and procedures which are considered correct and true and which therefore
guide the thoughts, behaviour and communication of people’. Davenport and Prusak
(2000, p. 5) stated that knowledge is
“a fluid mix of framed experience, values, contextual information,
and expert insight that provides a framework for evaluating and
incorporating new experiences and information. It originates in and
is applied in the minds of knowers. In organisations, it often
becomes embedded not only in documents or repositories but also
in organisational routines, processes, practices, and norms...”
Chapter 2: Literature Review
Copyright@ Ricky K.F. Cheong 2011 Page 15
Stewart (2000) mentioned that knowledge is a conclusion drawn from data and
information. This knowledge hierarchy can be traced back in the poetry “The Rock” by
Eliot in 1934 (Sharma 2008). It is a Data, Information, Knowledge & Wisdom (DIKW)
hierarchy.
….
The endless cycle of idea and action,
Endless invention, endless experiment,
Brings knowledge of motion, but not of stillness;
Knowledge of speech, but not of silence;
Knowledge of words, and ignorance of the Word.
….
Where is the Life we have lost in living?
Where is the wisdom we have lost in knowledge?
Where is the knowledge we have lost in information?
Where is the information we have lost in data?
Data is a set of discrete, objective facts about events. Davenport and Prusak (1998)
mentioned that data is most usefully described as structured records of transaction in an
organisation. However, Zack (1999) argued that data is not meaningful as it represents
observations or facts out of the context.
Information is the result of placing data within some meaningful context and often it is in
the form of a message (Zack 1999). Davenport and Prusak (1998) mentioned that
information is usually in the form of a document or an audible or visible communication.
It has a sender and a receiver and the information is aimed at changing the perceptions of
the receiver e.g. judgement or behaviour.
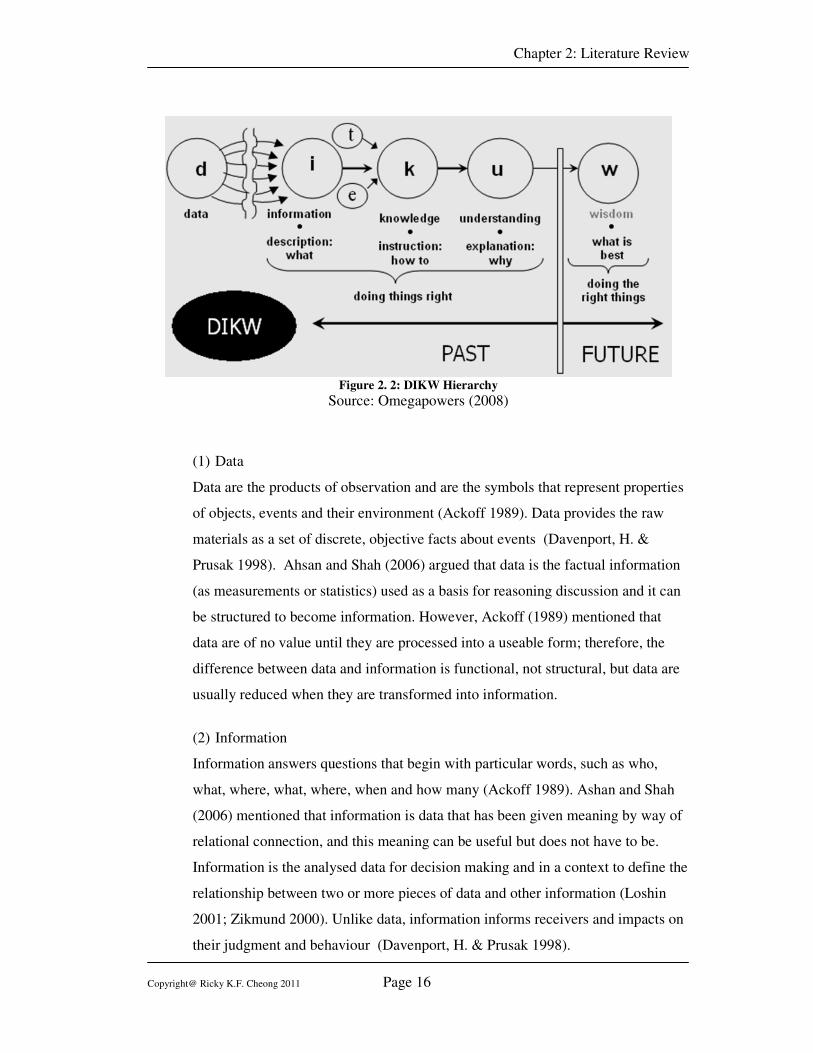
Russell Ackoff (1989) added another layer of “understanding” between knowledge and
wisdom in the knowledge hierarchy, as shown in figure 2.2. Understanding requires
diagnosis and prescription. In Russell Ackoff’s view, the first four layers are related to
the past, i.e. to deal with what has been known, and only wisdom deals with the future
because it is incorporated with the vision and design (Ahsan & Shan 2006).
Chapter 2: Literature Review
Copyright@ Ricky K.F. Cheong 2011 Page 16
Figure 2. 2: DIKW Hierarchy
Source: Omegapowers (2008)
(1) Data
Data are the products of observation and are the symbols that represent properties
of objects, events and their environment (Ackoff 1989). Data provides the raw
materials as a set of discrete, objective facts about events (Davenport, H. &
Prusak 1998). Ahsan and Shah (2006) argued that data is the factual information
(as measurements or statistics) used as a basis for reasoning discussion and it can
be structured to become information. However, Ackoff (1989) mentioned that
data are of no value until they are processed into a useable form; therefore, the
difference between data and information is functional, not structural, but data are
usually reduced when they are transformed into information.
(2) Information
Information answers questions that begin with particular words, such as who,
what, where, what, where, when and how many (Ackoff 1989). Ashan and Shah
(2006) mentioned that information is data that has been given meaning by way of
relational connection, and this meaning can be useful but does not have to be.
Information is the analysed data for decision making and in a context to define the
relationship between two or more pieces of data and other information (Loshin
2001; Zikmund 2000). Unlike data, information informs receivers and impacts on
their judgment and behaviour (Davenport, H. & Prusak 1998).
Chapter 2: Literature Review
Copyright@ Ricky K.F. Cheong 2011 Page 17
(3) Knowledge
Davenport and Prusak (1998) mentioned that knowledge is information combined
with experience, context, interpretation, reflection and perspective. Ashan and
Shah (2006) described knowledge as an appropriate collection of information
intended to be used. Ackoff (1989) said that knowledge is know-how and it is
what makes possible the transformation of information into instructions. James
(2005) argued that knowledge is blended by many things, and it is usually
subjective, and summarises the meaning of knowledge as an awareness,
understanding or familiarity gained from a blending of information, experience,
skills, principles, rules, values, insight, study, investigation and observation.
(4) Understanding
Ashan and Shah (2006) mentioned that understanding is an interpolative and
probabilistic process, is cognitive and analytical, and it is the process by which
individuals can take knowledge and synthesise new knowledge from the
previously held knowledge. Ackoff (1989) argued that understanding is generally
a man-machine system to facilitate and accelerate learning and adaptation, and
requires diagnosis and prescription, and focuses on efficiency.
(5) Wisdom
Ackoff (1989) argued that wisdom adds value which requires the mental function
of judgment. Wisdom is the judicious application of accumulated knowledge and
experience (James 2005), and is the ability to see through complexity and
discover the fundamental nature of issues or problems. Wisdom is an
extrapolative and non-deterministic, non-probabilistic process, and calls upon all
previous levels of consciousness, and specifically upon special types of human
programming e.g. moral, ethical, codes …etc.
Regardless of how knowledge is defined, many researchers (for example Drucker 1993;
1995; Hamel 2002; Leonard-Barton 1998; Michalisin, Smith and Kline 1997; Nonaka
1991; Pemberton and Stonehouse 2000) viewed that knowledge is the cornerstone for
competitive advantages (James 2005). Drucker (1993) argued that knowledge is not just
Chapter 2: Literature Review
Copyright@ Ricky K.F. Cheong 2011 Page 18
another resource alongside the traditional factors of production – labour, capital, and land
– but the only meaningful resource in the new economy.
New knowledge always begins with the individual making personal knowledge available
to others and is the central activity of the knowledge creation company (Nonaka 1991).
The learning that take place from others and the skills shared with others need to be
internalised – that is, reformed, enriched, and translated to fit the company’s self image
and identity (Nonaka & Takeuchi 1995). In the view of Nonaka and Takeuchi (1995),
knowledge not only can be acquired, taught, and trained through manuals, books, or
lectures. Instead, knowledge can be gained in less formal and systematic ways by using
metaphors, pictures or experiences which are highly subjective insights, intuitions, and
hunches.
2.2.2 Types of Knowledge
Knowledge is commonly viewed as two dimensions of “Explicit” and “Tacit”. Explicit
knowledge is deeply ingrained in the traditions of Western management, from Frederick
Taylor to Herbert Simon (Nonaka & Takeuchi 1995); it is in the form of words, numbers
and can be easily communicated and shared in the form of hard data, scientific formulae,
codified procedures, or universal principles (Nonaka & Takeuchi 1995). Best (1989)
mentioned that explicit knowledge is flexible and can often be reorganised to suite our
purpose. It is more precisely and formally expressed than tacit knowledge (Zack 1999).
Polanyi (1996) termed Tacit knowledge, based on the logic that “we know more than we
can tell”. It is something not easily visible and expressible; it is highly personal and hard
to formalise, making it difficult to communicate or to share with others; subjective
insights, intuitions and hunches are classified as tacit knowledge (Nonaka & Takeuchi
1995). It is ‘subconsciously understood and applied, difficult to articulate, developed
from direct experience and custom, and usually shared through highly interactive
conversation, storytelling, and shared experience’ (Zack 1999, p. 46). It is divided into a
technical dimension and a cognitive dimension (Takeuchi 1999). The technical dimension
refers to those skills or crafts said to be ‘know-how’; the cognitive dimension refers to
those ‘taken-for-granted’ beliefs, values and meta-models that shape the way a person
sees the world.
Chapter 2: Literature Review
Copyright@ Ricky K.F. Cheong 2011 Page 19
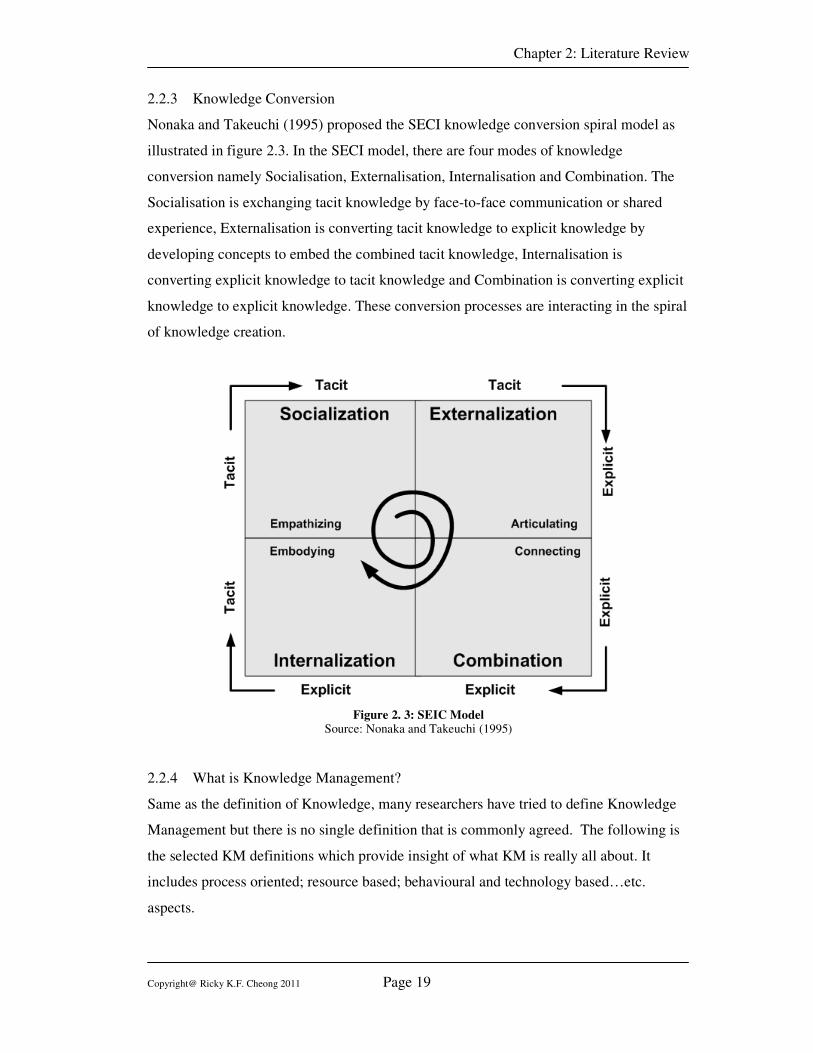
2.2.3 Knowledge Conversion
Nonaka and Takeuchi (1995) proposed the SECI knowledge conversion spiral model as
illustrated in figure 2.3. In the SECI model, there are four modes of knowledge
conversion namely Socialisation, Externalisation, Internalisation and Combination. The
Socialisation is exchanging tacit knowledge by face-to-face communication or shared
experience, Externalisation is converting tacit knowledge to explicit knowledge by
developing concepts to embed the combined tacit knowledge, Internalisation is
converting explicit knowledge to tacit knowledge and Combination is converting explicit
knowledge to explicit knowledge. These conversion processes are interacting in the spiral
of knowledge creation.
Figure 2. 3: SEIC Model Source: Nonaka and Takeuchi (1995)
2.2.4 What is Knowledge Management?
Same as the definition of Knowledge, many researchers have tried to define Knowledge
Management but there is no single definition that is commonly agreed. The following is
the selected KM definitions which provide insight of what KM is really all about. It
includes process oriented; resource based; behavioural and technology based…etc.
aspects.
Chapter 2: Literature Review
Copyright@ Ricky K.F. Cheong 2011 Page 20
(1) Knowledge management can be defined as the process of offering the right
knowledge to the right users at the right time and helping people share and put
information into action in ways that strive to improve organisational performance
(Schotte 2003, p. 18).
(2) Knowledge Management includes all methods, instruments and tools that
contribute to the promotion of an integrated core knowledge process – with the
following four core activities as a minimum, to generate knowledge, to store
knowledge, to distribute knowledge and to apply knowledge – in all areas and
levels of the organisation, in order to enhance organisational performance by
focusing on the value creating business process (Mertins, Heisig & Vorbeck 2003,
p. 11).
(3) Knowledge management caters for the critical issues of organisational adaption,
survival and competence in the face of increasingly discontinuous environment
change. Essentially, it embodies organisational processes that seek synergistic
combinations of data and information-processing capacity of information
technologies, and the creative and innovative capacity of human beings (Malhotra,
Y. 2001, p. 9).
(4) Knowledge management is defined as a method designed to simplify and improve
the process of creating, sharing, and using knowledge in an organisation
(Gottschalk 2005).
(5) Knowledge Management is the systematic and deliberate creation, renewal,
application, and leveraging of knowledge and other intellectual capital (IC) assets
to maximise the individual’s and the enterprise’s knowledge-related effectiveness
and returns (Wiig 2004, p. 217).
Apart from the definition of knowledge management, scholars and researchers have
articulated many different knowledge management objectives and benefits. The following
is selected literature which provides insight about what knowledge management can
provide.
Chapter 2: Literature Review
Copyright@ Ricky K.F. Cheong 2011 Page 21
(1) Knowledge management provides a competitive advantage for organisations as it
allows the organisation to solve problems and seize opportunities (Earl, M. J. &
Scott 1999; Parlby & Taylor 1999; Zack 1999).
(2) Parlby and Taylor (1999) argued that knowledge management can evaluate core
processes, capture insight about the findings, combine the skills and experience,
innovation and apply new ideas quickly.
(3) Knowledge management contributes to more effective decision making (Ernst &
Young 1999). Parlby and Taylor (1999) argued that decision making performance
may be impacted when the best know-how is not available to the decision makers
when they need it.
(4) Knowledge management improves productivity which includes reduced time to
market, improved innovation and improved personal productivity (Miller 1996).
(5) Knowledge management can improve the performance of organisational processes
(Van & Spijkervet 1997).
(6) Knowledge management can persuading people to share (Havens & Hass 2000)
(7) Knowledge management can build and exploit the organisation’s intellectual
capital affectivity (Wiig 1997).
(8) Knowledge management can make knowledge more visible throughout the
organisation (Allee 1997)
In additions, Cretau and Dfouni (2008, p. 66) summarised the values of knowledge
management in table 2.1
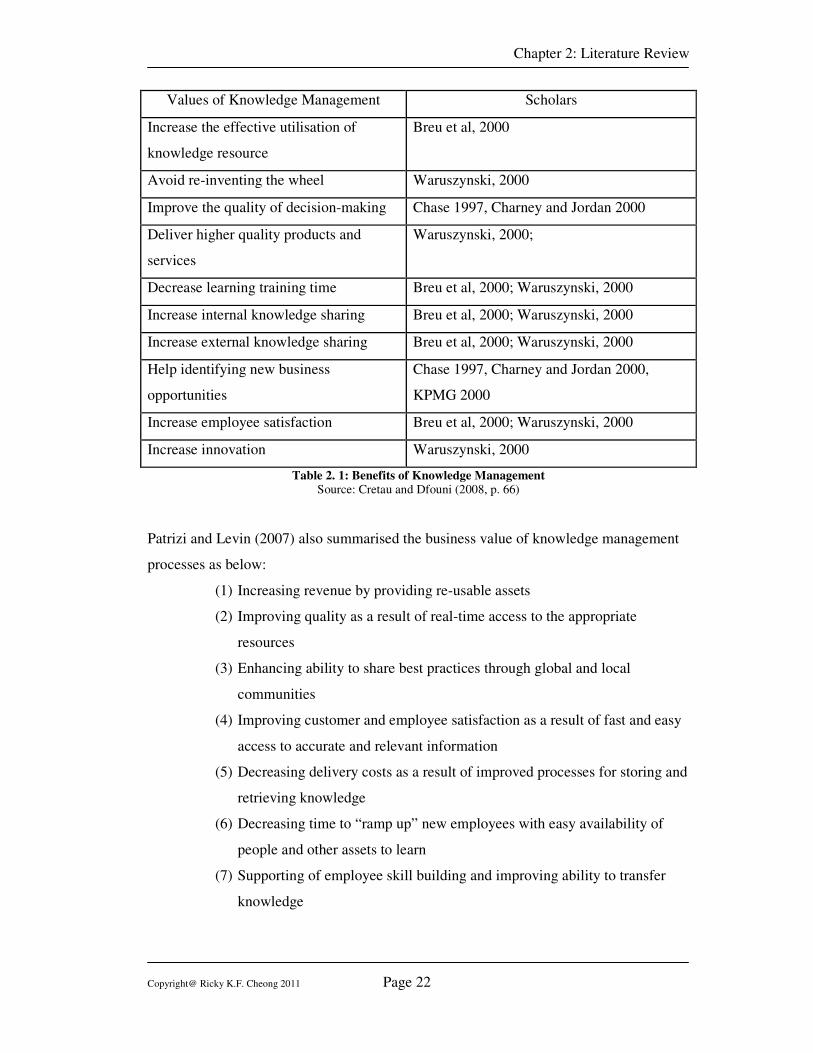
Chapter 2: Literature Review
Copyright@ Ricky K.F. Cheong 2011 Page 22
Values of Knowledge Management Scholars
Increase the effective utilisation of
knowledge resource
Breu et al, 2000
Avoid re-inventing the wheel Waruszynski, 2000
Improve the quality of decision-making Chase 1997, Charney and Jordan 2000
Deliver higher quality products and
services
Waruszynski, 2000;
Decrease learning training time Breu et al, 2000; Waruszynski, 2000
Increase internal knowledge sharing Breu et al, 2000; Waruszynski, 2000
Increase external knowledge sharing Breu et al, 2000; Waruszynski, 2000
Help identifying new business
opportunities
Chase 1997, Charney and Jordan 2000,
KPMG 2000
Increase employee satisfaction Breu et al, 2000; Waruszynski, 2000
Increase innovation Waruszynski, 2000
Table 2. 1: Benefits of Knowledge Management Source: Cretau and Dfouni (2008, p. 66)
Patrizi and Levin (2007) also summarised the business value of knowledge management
processes as below:
(1) Increasing revenue by providing re-usable assets
(2) Improving quality as a result of real-time access to the appropriate
resources
(3) Enhancing ability to share best practices through global and local
communities
(4) Improving customer and employee satisfaction as a result of fast and easy
access to accurate and relevant information
(5) Decreasing delivery costs as a result of improved processes for storing and
retrieving knowledge
(6) Decreasing time to “ramp up” new employees with easy availability of
people and other assets to learn
(7) Supporting of employee skill building and improving ability to transfer
knowledge
Chapter 2: Literature Review
Copyright@ Ricky K.F. Cheong 2011 Page 23
The above listed benefits and values stated by various scholars highlight the key drivers
for an organisation to practise knowledge management.
2.2.5 Major School of Thoughts of Knowledge Management
To best understand what knowledge management is, it can also be explored by studying
the different school of thoughts of knowledge management. Knowledge management has
been defined by scholars from different disciplines and Earl (2001) classified the school
of knowledge management into three catalogues, namely Technocratic, Economic and
Behavioural. Technocratic includes the systems school, cartographic school and
engineering school which are based on information or management technologies to
govern knowledge work in everyday tasks. Economic is mainly the commercial school of
knowledge management which explicitly creates revenue streams from the exploitation of
knowledge management and intellectual capital. Behavioural includes the organisational
school, spatial school and strategic school which stimulate and orchestrate managers to be
proactive in the creation, sharing, and use of knowledge management as a resource. The
attributes of each school is summarised in figure 2.4 below. Earl (2001) mentioned that
the primary purpose of the seven schools taxonomy is to help executives know what to do
and how to undertake knowledge management initiatives or solutions and improve the
effectiveness of any existing knowledge management program.
2.2.6 Knowledge Management Process
The Knowledge Management Process has been articulated in terms of the knowledge
management cycle by many researchers, e.g. Lethbridge (1994), Wiig (1997) and
Davenport and Prusak (1998), Dilnutt (2000), Schotte (2003), Bergeron (2003), Lytras
and Rouloudi (2003), Alfs (2003), Mertins et al. (2003), and Seufert, Back and Krogh
(2003)…etc.
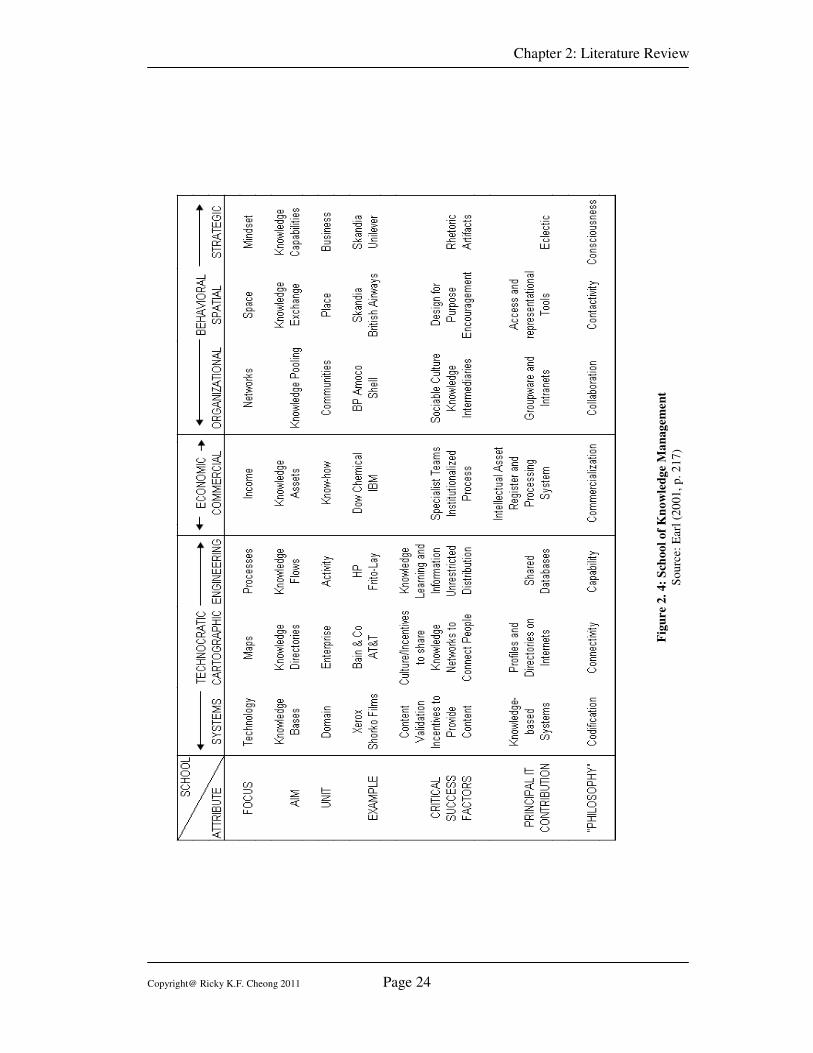
Chapter 2: Literature Review
Copyright@ Ricky K.F. Cheong 2011 Page 24
Fig
ure
2.
4:
Sch
ool
of
Kn
ow
led
ge
Ma
nagem
en
t
Sourc
e: E
arl
(20
01,
p. 2
17)
Chapter 2: Literature Review
Copyright@ Ricky K.F. Cheong 2011 Page 25
Dilnutt (2000) described the knowledge management process as Generate, Represent,
Access and Transfer. Schotte (2003) viewed that knowledge management is the cycling
process of Use, Provide, Find, Select, Organise, Distill, Share and Adapt. Bergeron
(2003) argued that knowledge management is the cycle of Create/Acquisition,
Modification, Use, Archiving, Transfer, Translation/Repurposing, Access and Disposal.
Lytras and Rouloudi (2003), based on the research done by Rubenstein-Montano et al.
(2001), summarised knowledge management activities by various researchers in 6 phases,
as in figure 2.5. Lytras and Rouloudi (2003) proposed an integrated model of KM which
consists of Relate/Value, Acquire, Organise, Enable / Reuse, Transfer and Use.
From the previous literature, apparently those different scholars have different
classifications of the process in their KM models. However, Alfs (2003) and Mertins et
al. (2003) stated that it should be a cyclic process which comprises of Generating,
Storing, Distributing and Applying knowledge, similar to the knowledge management
lifecycle proposed by Seufert, Back and Kroch (2003) where there are four generic
knowledge processes that can be distinguished: (1) Locating / Capturing, (2) Sharing /
Transferring, (3) Creating and (4) Applying.
Heisig (2009) analysed 160 knowledge management frameworks and concluded that an
underlying consensus is detected regarding the basic categories describing the knowledge
management activities and the critical success factors. The knowledge management
frameworks proposed by Heisig (2009) from his research has three layers, which are
business focus layer, knowledge focus layer and enabler focus layer. In the knowledge
focus layer, there are four core processes which are Create, Store, Share and Apply. This
classification is also similar to the knowledge process proposed by Alavi and Leidner
(2001) which consists of four the core processes namely: Creation/Construction, Storage/
Retrieval, Transfer and Applicati
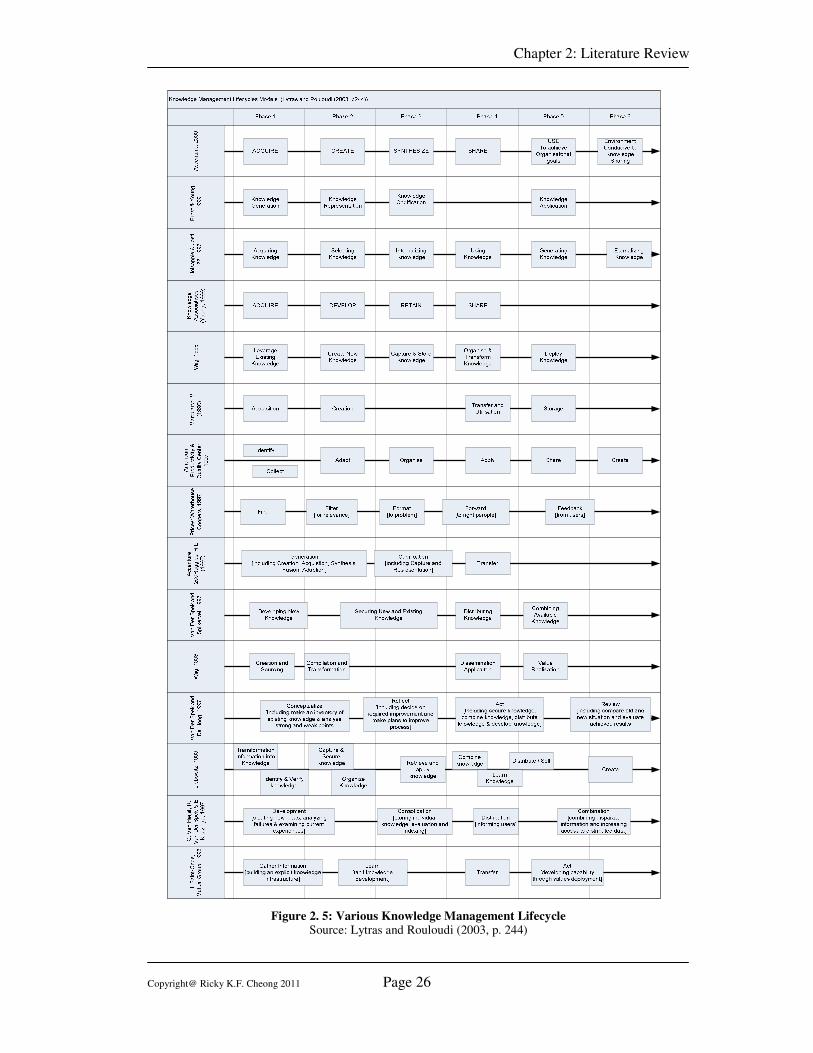
Chapter 2: Literature Review
Copyright@ Ricky K.F. Cheong 2011 Page 26
Figure 2. 5: Various Knowledge Management Lifecycle Source: Lytras and Rouloudi (2003, p. 244)
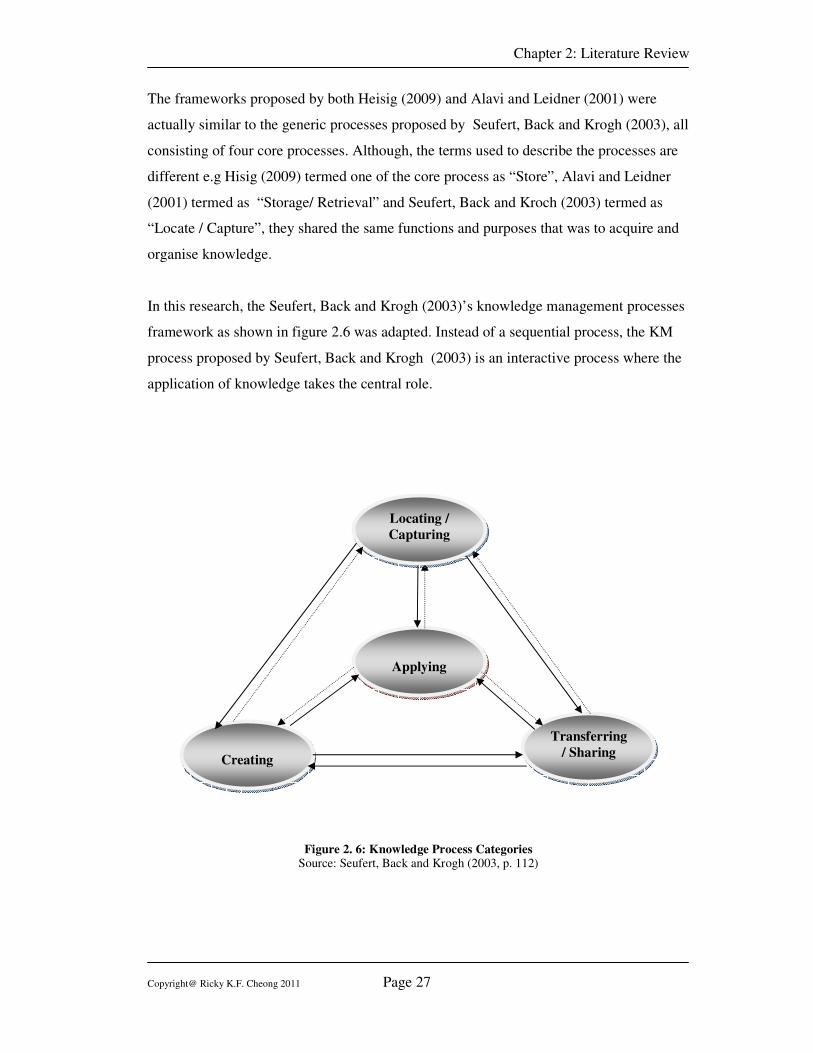
Chapter 2: Literature Review
Copyright@ Ricky K.F. Cheong 2011 Page 27
The frameworks proposed by both Heisig (2009) and Alavi and Leidner (2001) were
actually similar to the generic processes proposed by Seufert, Back and Krogh (2003), all
consisting of four core processes. Although, the terms used to describe the processes are
different e.g Hisig (2009) termed one of the core process as “Store”, Alavi and Leidner
(2001) termed as “Storage/ Retrieval” and Seufert, Back and Kroch (2003) termed as
“Locate / Capture”, they shared the same functions and purposes that was to acquire and
organise knowledge.
In this research, the Seufert, Back and Krogh (2003)’s knowledge management processes
framework as shown in figure 2.6 was adapted. Instead of a sequential process, the KM
process proposed by Seufert, Back and Krogh (2003) is an interactive process where the
application of knowledge takes the central role.
Figure 2. 6: Knowledge Process Categories Source: Seufert, Back and Krogh (2003, p. 112)
Creating
Applying
Transferring
/ Sharing
Locating /
Capturing
Chapter 2: Literature Review
Copyright@ Ricky K.F. Cheong 2011 Page 28
The following describes each of the KM processes applied in this research.
(1) Locating / Capturing Knowledge
Seufert, Back and Krogh (2003) mentioned that locating and capturing
knowledge depends on finding and charting already existing knowledge. It is a big
challenge when there is a widely dispersed knowledge base, and it is required to
have a system to reduce the search cost. This process also includes retrieval,
organising and storage of knowledge which includes written documents,
structured information stored in electronic databases, codified human knowledge
stored in expert systems, documented procedures and processes and the tacit
knowledge acquired by individuals (Tan et al. 1998). The knowledge retrieval
should be from both internal and external sources. Lim (2007) argued that staff
learn from experience. Continuous process improvement could be the internal
sources and external sources should include benchmarking, best practices from
other organisation, attending conferences, hiring consultants, monitoring social,
economic, and technological trends, collaborating with others, building alliances,
forming joint ventures and establishing links with partners. For organising and
storage, Kim, Suh and Kwang (2003) argued that the knowledge should be
structured and stored so that it can be found and delivered quickly. The ease and
ability to access the knowledge repository are critical (Davies et al. 2005).
(2) Sharing / Transferring Knowledge
Sharing / Transferring Knowledge refers to the leveraging of existing knowledge
and generating new values, and explicit knowledge is more easy to transfer
through electronic media or other forms of documents but tacit knowledge is more
difficult since it requires direct interaction with people (Seufert, Back & Krogh
2003). This process is happening at various levels which include the transfer of
knowledge from individuals to a group, between groups, across groups and from
groups to the organisation (Alavi & Leidner 2001). Albino, Garavelli and
Gorgoglione (2004) mentioned that knowledge transfer involves the mechanical,
electronic and interpersonal movement of information and knowledge, both
intentionally and unintentionally. The form of knowledge transfer between tacit
Chapter 2: Literature Review
Copyright@ Ricky K.F. Cheong 2011 Page 29
knowledge and explicit knowledge is best described by the SECI model proposed
by Nonaka and Takeuchi (1995), as discussed section 2.2.3.
(3) Creating Knowledge
Seufert, Back and Krogh (2003) argued that creating knowledge is concerned with
the development of new explicit or tacit knowledge by groups or individuals. New
knowledge can be created either through the expansion of the already existing
tacit or explicit knowledge, or through a new method of combining these forms of
knowledge. This process includes development of new content or replacing
existing content for both tacit and explicit knowledge (Pentland 1995). It is
through the processes of socialisation and collaboration as well as individual’s
cognitive processes, that the created knowledge can be shared, amplified, enlarged
and justified (Nonaka 1994). Unlike knowledge capturing that is an adaptive
process, knowledge creation is a generative process (Firestone & McElroy 2004).
Knowledge is created through actions and behaviour such as problem solving and
integration with the organisation existing knowledge stock (Devinney, Midgley &
Soo 2004). Knowledge creation occurs through the application and exploitation of
the acquired information and knowledge, and the outcome of the knowledge
creation includes the production of documents in paper or electronic form,
generation of skills, beliefs, norms, images, intuition and mental models...etc
(Fung 2008).
(4) Applying Knowledge
Applying knowledge comprises the application and usage of knowledge, i.e.
reflection, in actual situations such as in decision making or problem solving
(Seufert, Back & Krogh 2003). It is to create capability by integrating knowledge
(Grant 1996); it is to realize the value of knowledge (Lytras & Rouloudi 2003),
and for an organisation it is to create commercial values for customers (Demarest
1997). It involves the integration of knowledge into an organisation’s business
processes and key applications (Laudon & Laudon 2005). Lytras and Rouloudi
(2003) mentioned that it is a goal-oriented process, and knowledge must be
applied in the context of specific purposes and to construct meanings of higher
values and to support the learning processes.
Chapter 2: Literature Review
Copyright@ Ricky K.F. Cheong 2011 Page 30
2.2.7 Organisational Learning
Organisational Learning is an important branch in knowledge management, and actually
the concept of organisational learning can be traced back to the late 1950’s and early
1960’s to scholars like March and Simon (1958) and Cyert and March (1963).
Buchel and Probst (2002) argued that the organisational learning was primarily focusing
on identifying the learning theories and the processes of changing the organisational
knowledge, while knowledge management was taking a proactive role of providing
frameworks / guidelines for active intervention into an organisation’s knowledge base.
This section reviews the literature on organisational learning which provides better
understanding of the knowledge management at the organisational level.
2.2.7.1 Development of Organisational Learning
The development of organisational learning began to attract attention in the 1960’s and
many authors, e.g. Argyris and Schon (1978), Brown and Duguid (1991), Cangelosi and
Dill (1965), Cohen and Sproull (1996), Dodgson (1993), Duncan and Weiss (1979),
Easterby-Smith, Snell and Gherardi (1998), Fiol (1994), Hedberg (1981), Kim (1993),
Lahteenmaki, Toivonen and Mattila (2001), Levitt and March (1988), Matlay (2000),
Rashman, Withers and Jean (2008), Senge (1990), Wang and Ahmed(2003), tried to
illuminate the concept of organisational learning. There were over fifty academic articles
on organisational learning published in the 1980’s (Rashman, Withers & Jean 2008) and
the growth of the organisational learning study was mainly due to (1) the speed of
technological change, (2) the advance of globalisation, and (3) the growing corporate
competition (Easterby-Smith, Snell & Gherardi 1998).
Easterby-Smith, Snell and Gherardi (1998) discussed organisational learning
development by the four sets of issues or assumptions, which are (1) Teleology: the
purposes of organisational learning, (2) Ontology: the essence or fundamental stuff of
organisational learning, (3) Epistemology: the preferred research methodologies for
investigating organisational learning, and (4) Technology: the effectiveness of and
developmental direction for organisational learning interventions. The study of the
organisational learning has been focused on different approaches and Lahteenmaki,
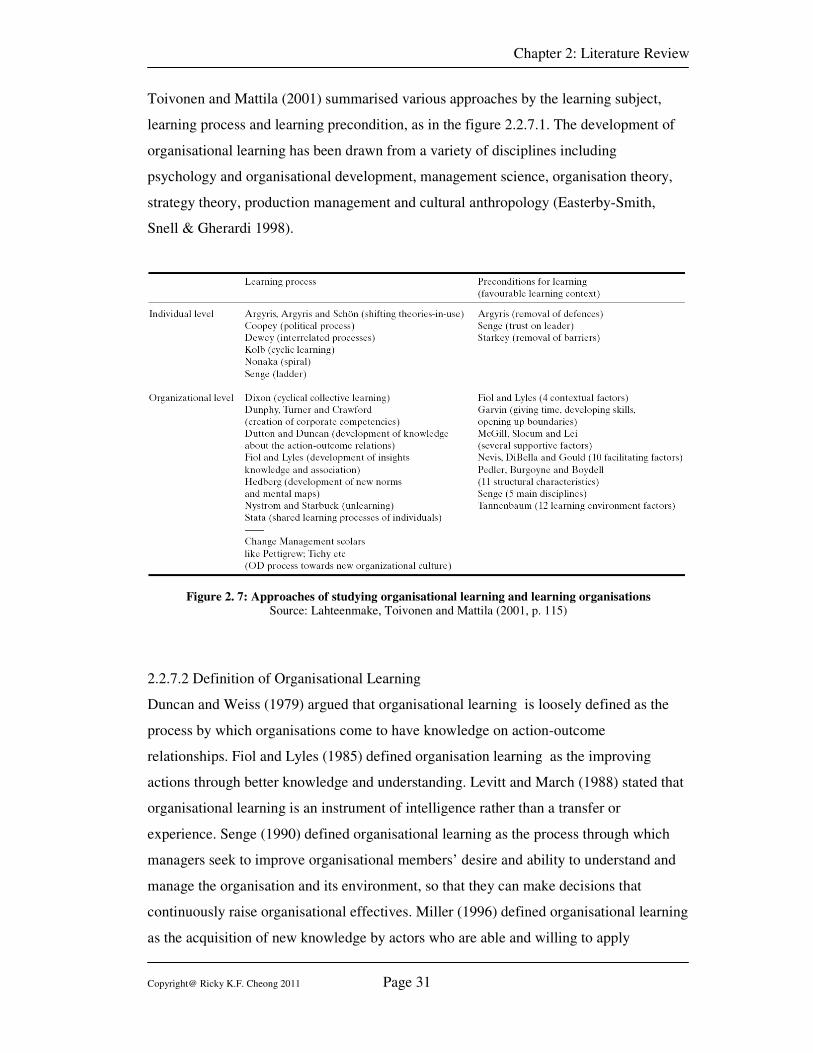
Chapter 2: Literature Review
Copyright@ Ricky K.F. Cheong 2011 Page 31
Toivonen and Mattila (2001) summarised various approaches by the learning subject,
learning process and learning precondition, as in the figure 2.2.7.1. The development of
organisational learning has been drawn from a variety of disciplines including
psychology and organisational development, management science, organisation theory,
strategy theory, production management and cultural anthropology (Easterby-Smith,
Snell & Gherardi 1998).
Figure 2. 7: Approaches of studying organisational learning and learning organisations Source: Lahteenmake, Toivonen and Mattila (2001, p. 115)
2.2.7.2 Definition of Organisational Learning
Duncan and Weiss (1979) argued that organisational learning is loosely defined as the
process by which organisations come to have knowledge on action-outcome
relationships. Fiol and Lyles (1985) defined organisation learning as the improving
actions through better knowledge and understanding. Levitt and March (1988) stated that
organisational learning is an instrument of intelligence rather than a transfer or
experience. Senge (1990) defined organisational learning as the process through which
managers seek to improve organisational members’ desire and ability to understand and
manage the organisation and its environment, so that they can make decisions that
continuously raise organisational effectives. Miller (1996) defined organisational learning
as the acquisition of new knowledge by actors who are able and willing to apply
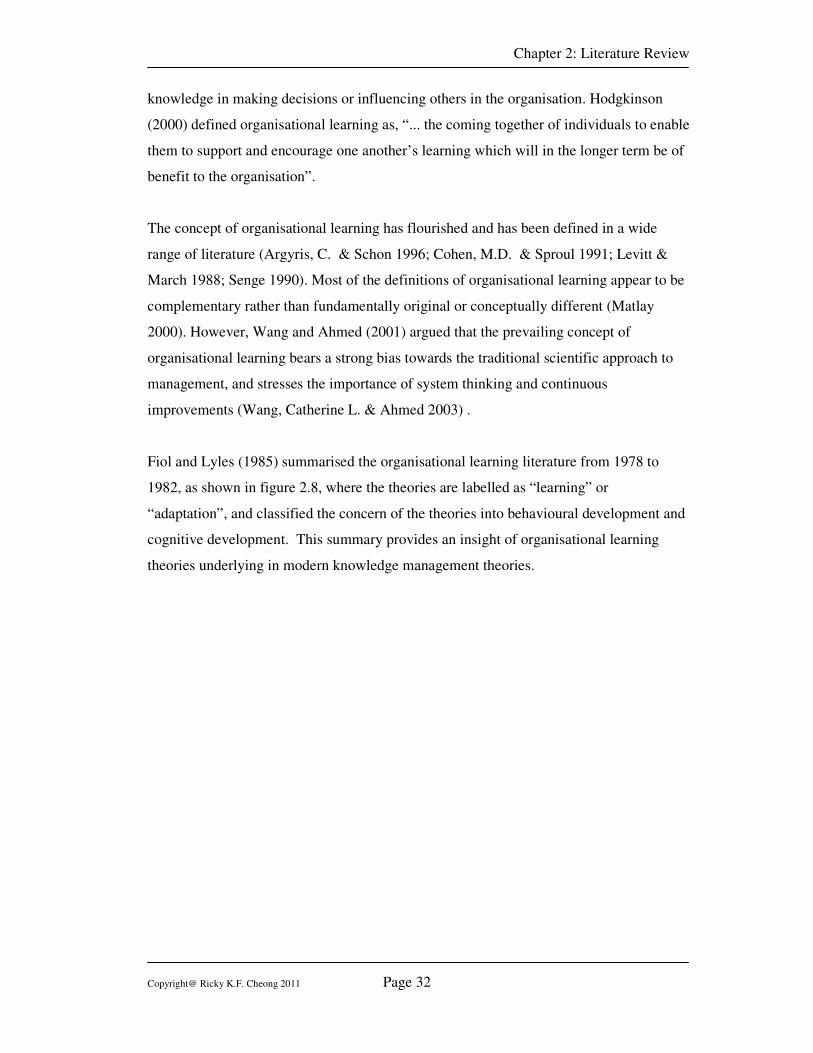
Chapter 2: Literature Review
Copyright@ Ricky K.F. Cheong 2011 Page 32
knowledge in making decisions or influencing others in the organisation. Hodgkinson
(2000) defined organisational learning as, “... the coming together of individuals to enable
them to support and encourage one another’s learning which will in the longer term be of
benefit to the organisation”.
The concept of organisational learning has flourished and has been defined in a wide
range of literature (Argyris, C. & Schon 1996; Cohen, M.D. & Sproul 1991; Levitt &
March 1988; Senge 1990). Most of the definitions of organisational learning appear to be
complementary rather than fundamentally original or conceptually different (Matlay
2000). However, Wang and Ahmed (2001) argued that the prevailing concept of
organisational learning bears a strong bias towards the traditional scientific approach to
management, and stresses the importance of system thinking and continuous
improvements (Wang, Catherine L. & Ahmed 2003) .
Fiol and Lyles (1985) summarised the organisational learning literature from 1978 to
1982, as shown in figure 2.8, where the theories are labelled as “learning” or
“adaptation”, and classified the concern of the theories into behavioural development and
cognitive development. This summary provides an insight of organisational learning
theories underlying in modern knowledge management theories.
Chapter 2: Literature Review
Copyright@ Ricky K.F. Cheong 2011 Page 33
Figure 2. 8: Review of OL Literature
Source: Fiol and Lyles (1985)
2.2.8 Section Summary of Knowledge Management
The literature of knowledge management concluded that no single definition can explain
knowledge (section 2.2.1) and knowledge management (section 2.2.4). However, it is
clear that knowledge management is a multi-discipline aspect which covers different
schools of thoughts (section 2.2.5) and mainly focuses at the organisation level. The
DIKW knowledge Hierarchy (section 2.2.1) and the types of knowledge, i.e. tacit
knowledge and explicit knowledge (section 2.2.2), and the knowledge conversation
model (section 2.2.3) provide the basic understanding of knowledge transformation from
one form to another. The knowledge management process outlined (section 2.2.6) the
generic model to describe the interaction between capture / locate, share / transfer, create
and apply knowledge. This generic model provided a visual presentation of different
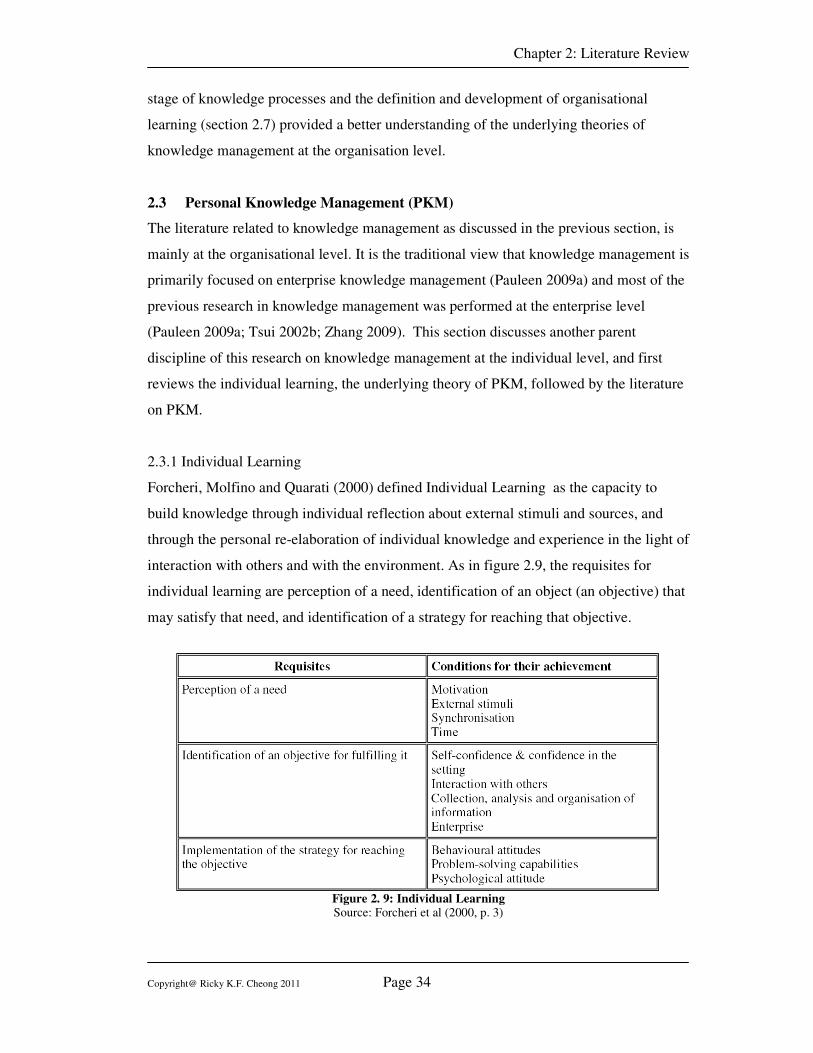
Chapter 2: Literature Review
Copyright@ Ricky K.F. Cheong 2011 Page 34
stage of knowledge processes and the definition and development of organisational
learning (section 2.7) provided a better understanding of the underlying theories of
knowledge management at the organisation level.
2.3 Personal Knowledge Management (PKM)
The literature related to knowledge management as discussed in the previous section, is
mainly at the organisational level. It is the traditional view that knowledge management is
primarily focused on enterprise knowledge management (Pauleen 2009a) and most of the
previous research in knowledge management was performed at the enterprise level
(Pauleen 2009a; Tsui 2002b; Zhang 2009). This section discusses another parent
discipline of this research on knowledge management at the individual level, and first
reviews the individual learning, the underlying theory of PKM, followed by the literature
on PKM.
2.3.1 Individual Learning
Forcheri, Molfino and Quarati (2000) defined Individual Learning as the capacity to
build knowledge through individual reflection about external stimuli and sources, and
through the personal re-elaboration of individual knowledge and experience in the light of
interaction with others and with the environment. As in figure 2.9, the requisites for
individual learning are perception of a need, identification of an object (an objective) that
may satisfy that need, and identification of a strategy for reaching that objective.
Figure 2. 9: Individual Learning Source: Forcheri et al (2000, p. 3)
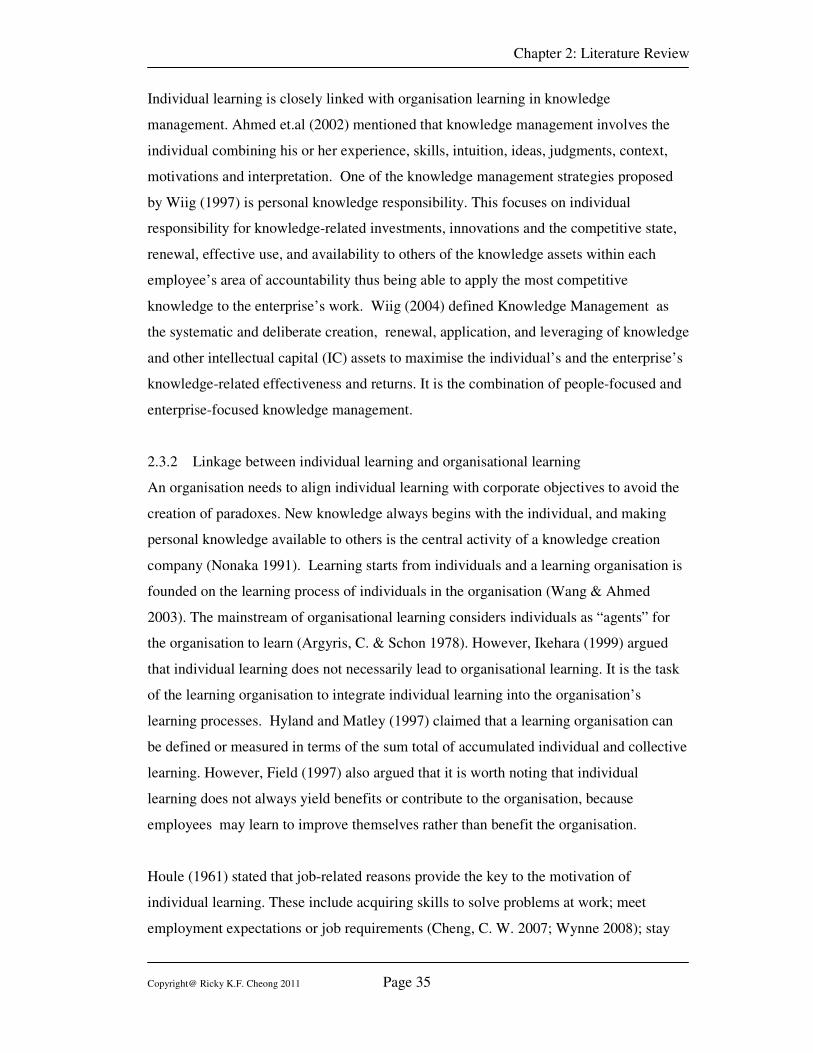
Chapter 2: Literature Review
Copyright@ Ricky K.F. Cheong 2011 Page 35
Individual learning is closely linked with organisation learning in knowledge
management. Ahmed et.al (2002) mentioned that knowledge management involves the
individual combining his or her experience, skills, intuition, ideas, judgments, context,
motivations and interpretation. One of the knowledge management strategies proposed
by Wiig (1997) is personal knowledge responsibility. This focuses on individual
responsibility for knowledge-related investments, innovations and the competitive state,
renewal, effective use, and availability to others of the knowledge assets within each
employee’s area of accountability thus being able to apply the most competitive
knowledge to the enterprise’s work. Wiig (2004) defined Knowledge Management as
the systematic and deliberate creation, renewal, application, and leveraging of knowledge
and other intellectual capital (IC) assets to maximise the individual’s and the enterprise’s
knowledge-related effectiveness and returns. It is the combination of people-focused and
enterprise-focused knowledge management.
2.3.2 Linkage between individual learning and organisational learning
An organisation needs to align individual learning with corporate objectives to avoid the
creation of paradoxes. New knowledge always begins with the individual, and making
personal knowledge available to others is the central activity of a knowledge creation
company (Nonaka 1991). Learning starts from individuals and a learning organisation is
founded on the learning process of individuals in the organisation (Wang & Ahmed
2003). The mainstream of organisational learning considers individuals as “agents” for
the organisation to learn (Argyris, C. & Schon 1978). However, Ikehara (1999) argued
that individual learning does not necessarily lead to organisational learning. It is the task
of the learning organisation to integrate individual learning into the organisation’s
learning processes. Hyland and Matley (1997) claimed that a learning organisation can
be defined or measured in terms of the sum total of accumulated individual and collective
learning. However, Field (1997) also argued that it is worth noting that individual
learning does not always yield benefits or contribute to the organisation, because
employees may learn to improve themselves rather than benefit the organisation.
Houle (1961) stated that job-related reasons provide the key to the motivation of
individual learning. These include acquiring skills to solve problems at work; meet
employment expectations or job requirements (Cheng, C. W. 2007; Wynne 2008); stay
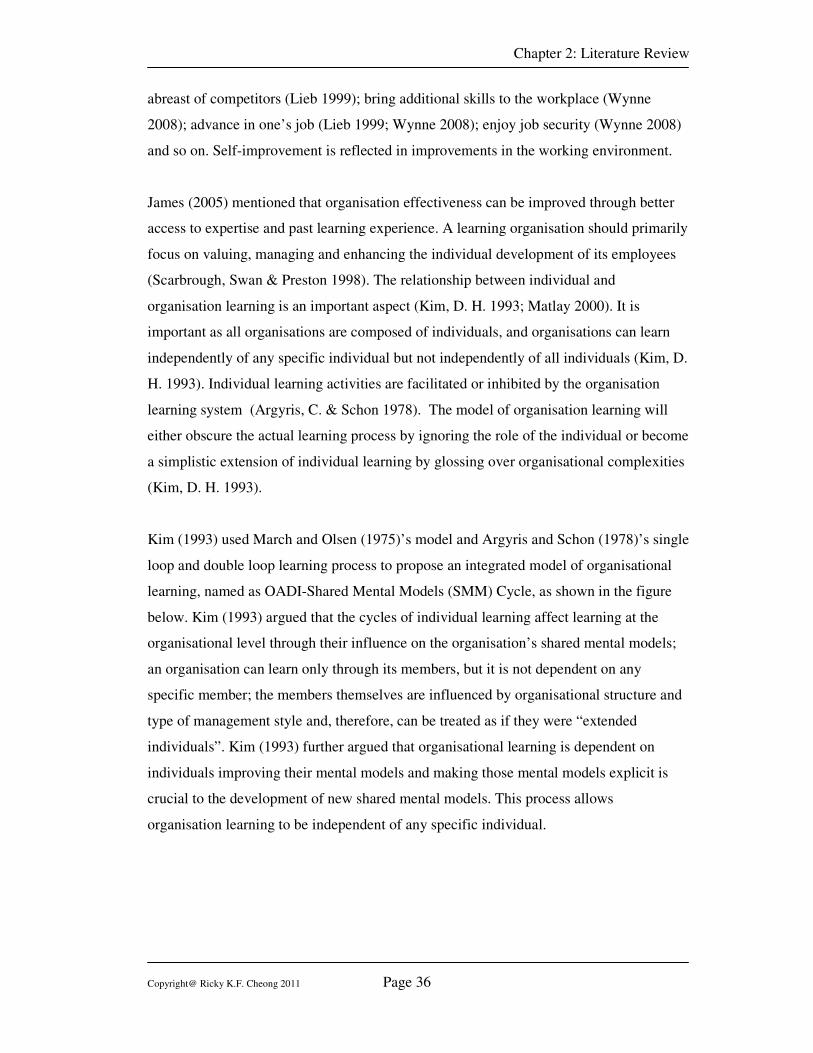
Chapter 2: Literature Review
Copyright@ Ricky K.F. Cheong 2011 Page 36
abreast of competitors (Lieb 1999); bring additional skills to the workplace (Wynne
2008); advance in one’s job (Lieb 1999; Wynne 2008); enjoy job security (Wynne 2008)
and so on. Self-improvement is reflected in improvements in the working environment.
James (2005) mentioned that organisation effectiveness can be improved through better
access to expertise and past learning experience. A learning organisation should primarily
focus on valuing, managing and enhancing the individual development of its employees
(Scarbrough, Swan & Preston 1998). The relationship between individual and
organisation learning is an important aspect (Kim, D. H. 1993; Matlay 2000). It is
important as all organisations are composed of individuals, and organisations can learn
independently of any specific individual but not independently of all individuals (Kim, D.
H. 1993). Individual learning activities are facilitated or inhibited by the organisation
learning system (Argyris, C. & Schon 1978). The model of organisation learning will
either obscure the actual learning process by ignoring the role of the individual or become
a simplistic extension of individual learning by glossing over organisational complexities
(Kim, D. H. 1993).
Kim (1993) used March and Olsen (1975)’s model and Argyris and Schon (1978)’s single
loop and double loop learning process to propose an integrated model of organisational
learning, named as OADI-Shared Mental Models (SMM) Cycle, as shown in the figure
below. Kim (1993) argued that the cycles of individual learning affect learning at the
organisational level through their influence on the organisation’s shared mental models;
an organisation can learn only through its members, but it is not dependent on any
specific member; the members themselves are influenced by organisational structure and
type of management style and, therefore, can be treated as if they were “extended
individuals”. Kim (1993) further argued that organisational learning is dependent on
individuals improving their mental models and making those mental models explicit is
crucial to the development of new shared mental models. This process allows
organisation learning to be independent of any specific individual.
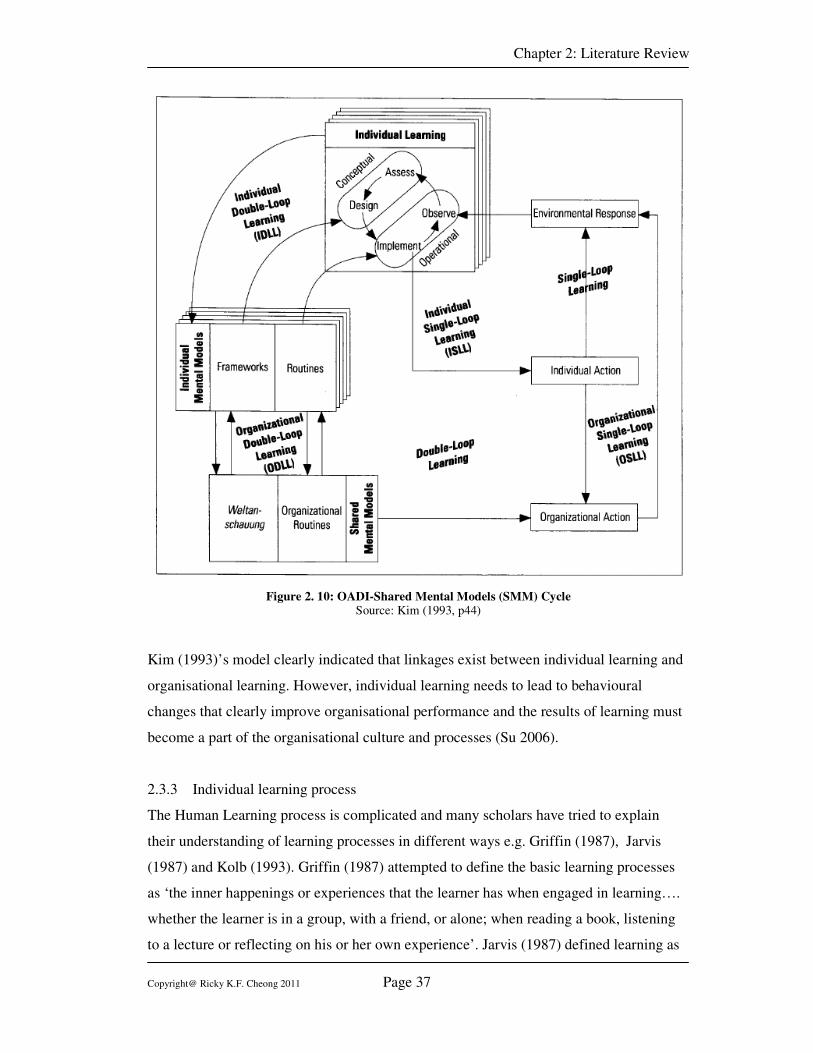
Chapter 2: Literature Review
Copyright@ Ricky K.F. Cheong 2011 Page 37
Figure 2. 10: OADI-Shared Mental Models (SMM) Cycle Source: Kim (1993, p44)
Kim (1993)’s model clearly indicated that linkages exist between individual learning and
organisational learning. However, individual learning needs to lead to behavioural
changes that clearly improve organisational performance and the results of learning must
become a part of the organisational culture and processes (Su 2006).
2.3.3 Individual learning process
The Human Learning process is complicated and many scholars have tried to explain
their understanding of learning processes in different ways e.g. Griffin (1987), Jarvis
(1987) and Kolb (1993). Griffin (1987) attempted to define the basic learning processes
as ‘the inner happenings or experiences that the learner has when engaged in learning….
whether the learner is in a group, with a friend, or alone; when reading a book, listening
to a lecture or reflecting on his or her own experience’. Jarvis (1987) defined learning as
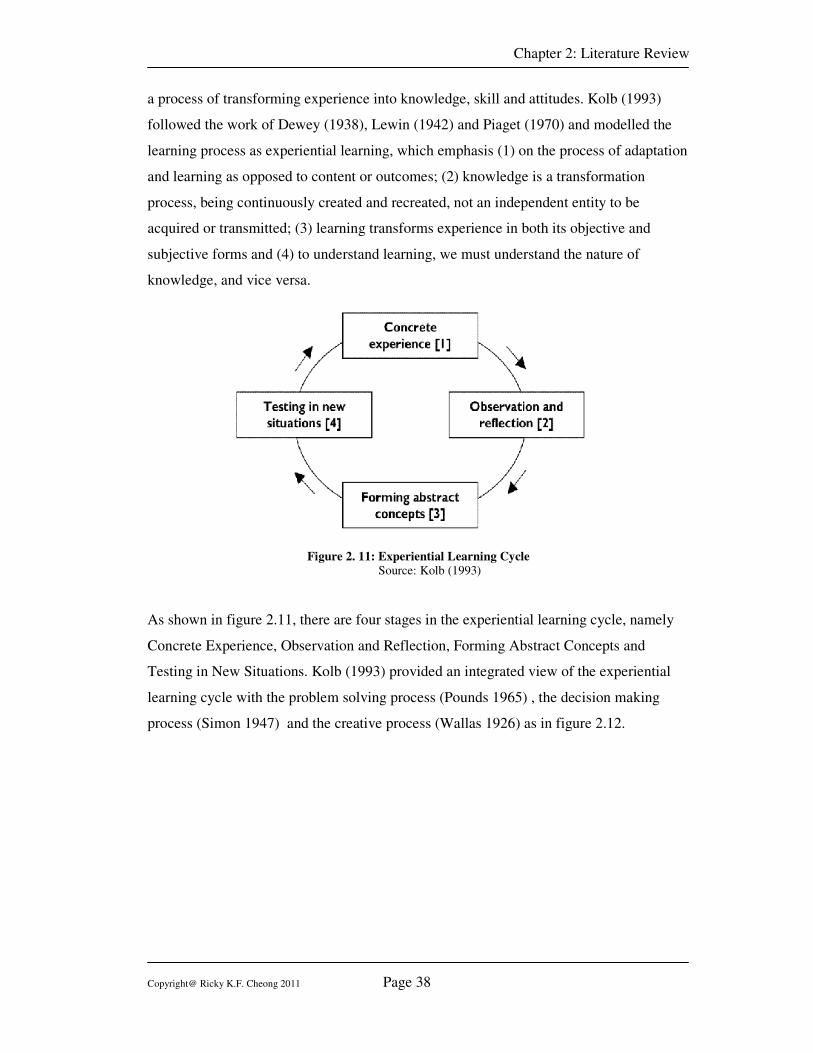
Chapter 2: Literature Review
Copyright@ Ricky K.F. Cheong 2011 Page 38
a process of transforming experience into knowledge, skill and attitudes. Kolb (1993)
followed the work of Dewey (1938), Lewin (1942) and Piaget (1970) and modelled the
learning process as experiential learning, which emphasis (1) on the process of adaptation
and learning as opposed to content or outcomes; (2) knowledge is a transformation
process, being continuously created and recreated, not an independent entity to be
acquired or transmitted; (3) learning transforms experience in both its objective and
subjective forms and (4) to understand learning, we must understand the nature of
knowledge, and vice versa.
Figure 2. 11: Experiential Learning Cycle
Source: Kolb (1993)
As shown in figure 2.11, there are four stages in the experiential learning cycle, namely
Concrete Experience, Observation and Reflection, Forming Abstract Concepts and
Testing in New Situations. Kolb (1993) provided an integrated view of the experiential
learning cycle with the problem solving process (Pounds 1965) , the decision making
process (Simon 1947) and the creative process (Wallas 1926) as in figure 2.12.
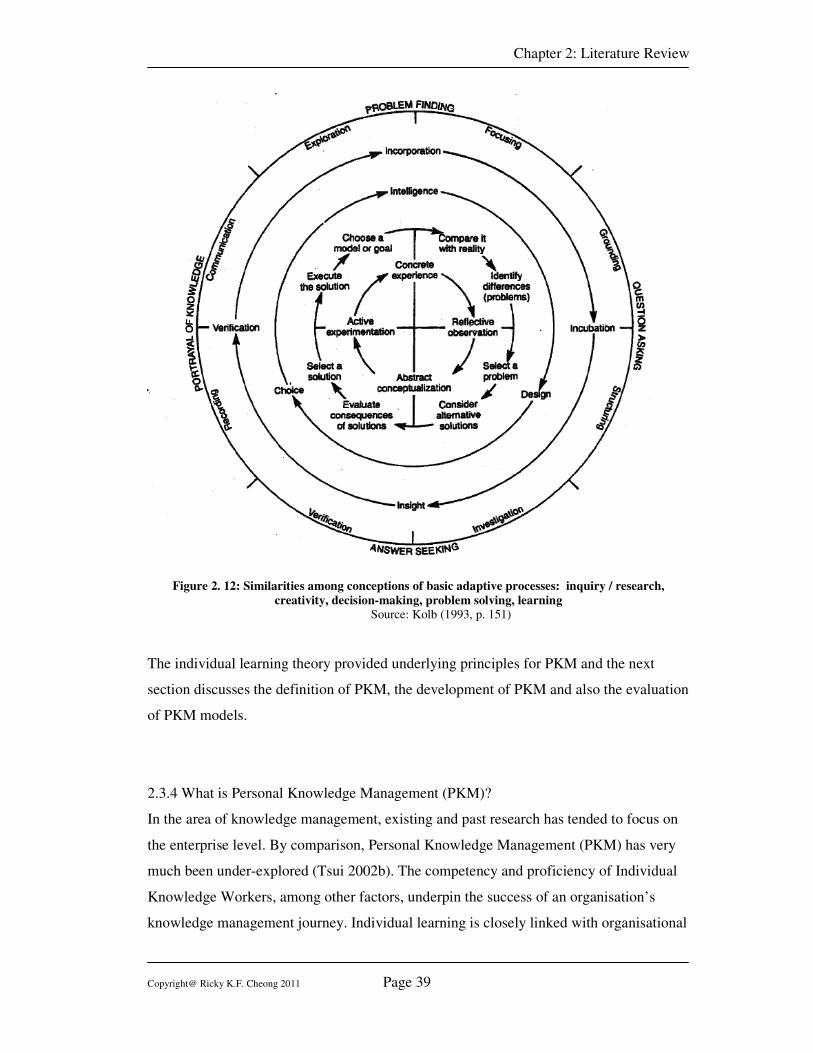
Chapter 2: Literature Review
Copyright@ Ricky K.F. Cheong 2011 Page 39
Figure 2. 12: Similarities among conceptions of basic adaptive processes: inquiry / research,
creativity, decision-making, problem solving, learning
Source: Kolb (1993, p. 151)
The individual learning theory provided underlying principles for PKM and the next
section discusses the definition of PKM, the development of PKM and also the evaluation
of PKM models.
2.3.4 What is Personal Knowledge Management (PKM)?
In the area of knowledge management, existing and past research has tended to focus on
the enterprise level. By comparison, Personal Knowledge Management (PKM) has very
much been under-explored (Tsui 2002b). The competency and proficiency of Individual
Knowledge Workers, among other factors, underpin the success of an organisation’s
knowledge management journey. Individual learning is closely linked with organisational
Chapter 2: Literature Review
Copyright@ Ricky K.F. Cheong 2011 Page 40
learning in knowledge management. Ahmed et al. (2002) mentioned that knowledge
management involves individuals combining and sharing their experience, skills,
intuition, ideas, judgments, context, motivations and interpretations. One of the
knowledge management strategies proposed by Wiig (1997) is personal knowledge
responsibility. It means focusing on individual responsibility for knowledge-related
investments, innovations and also on the competitive side, renewal, effective use and
availability to others of the knowledge assets within each employee’s area of
accountability. It also entails being able to apply the most competitive knowledge to the
work of the work.
2.3.4.1 Definitions of Personal Knowledge Management
In the past decades, although there was not much research in this area, several scholars
articulated what is PKM e.g. Frand and Hixon (1999), Avery et al. (2001), Higgison
(2004), Jefferson (2006), Volkel and Abecker (2008), Martin (2008) and Harold Jarche
(2010a). The following shows extracts from the related literature by different scholars,
which provides insights into the definition and nature of PKM.
(1) Frand and Hixon (1999)
PKM is a system designed by individuals for their own personal use (Frand &
Hixon 1999) and “it is a conceptual framework to organise and integrate
information that we, as individuals, feel is important so that it becomes part of our
personal knowledge base. It provides a strategy for transforming what might be
random pieces of information into something that can be systematically applied
and that expands our personal knowledge.”
(2) Avery et al. (2001)
Avery et al. (2001) argued that “PKM assumes that individuals have developed a
self-awareness of their limits and abilities, i.e. what they know and what they can
do. This personal self-awareness is an understanding of how much they know,
how to access the things they know, strategies for acquiring new knowledge and
strategies for accessing new information as needed. In the vast amount of
information available and many means for acquiring new information, individuals
Chapter 2: Literature Review
Copyright@ Ricky K.F. Cheong 2011 Page 41
have each mapped out their own areas of expertise and their own methods for
additional learning.”
(3) Higgsion (2004)
Higgison (2004) defined PKM as “managing and supporting personal knowledge
and information so that it is accessible, meaningful and valuable to the
individual; maintaining networks, contacts and communities; making life easier
and more enjoyable, and exploiting personal capital”
(4) Jefferson (2006)
Jefferson (2006) argued that “PKM is focused on bottom up approach, with an
individual perspective to KM. The goal is to allow individuals to choose what
information to collect, how to structure it, and who to share it with. Individuals
need to be able to manage their own information so that is meaningful, accessible
when it needed, can be easily exploited. PKM allows workers to organise both
digital and paper content in such a way to allow them to make sense of the deluge
they are continually exposed to.”
(5) Volkel and Abecker (2008)
Volkel and Abecker (2008) termed “Personal Knowledge Management to denote
the process of the individuals to manage knowledge” and “PKM deals with
embrained, embodied and encoded knowledge i.e. mostly with personal, self-
authored artefacts.”
(6) Jerome Martin (2008)
Martin (2008) argued that “PKM is knowing what knowledge we have and how
we can organise it, mobilise it and use it to accomplish our goal, and how we can
continue to create knowledge.”
(7) Harold Jarche (2010a)
Jarche (2010a) mentioned that “PKM is an individual, disciplined process by
which we make sense of information, observations and ideas. In the past it may
Chapter 2: Literature Review
Copyright@ Ricky K.F. Cheong 2011 Page 42
have been keeping a journal, writing letters or having conversations. These are
still valid, but with digital media we can add context by categorising, commenting
or even remixing it. We can also store digital media for easy retrieval”
Irrespective of how PKM is defined by different scholars, the key purpose of PKM is to
provide a framework for individuals to manage new information, integrate it and enrich
each individual knowledge database in an effective manner. Doing this successfully will
empower each individual to easily apply their own personal knowledge to deal with new
and old problems, to learn from new experience and to create new knowledge. It is a
continuous and interactive process which is not independent of other knowledge
management processes.
2.3.4.2 Development of Personal Knowledge Management
Volkel and Abecker (2008) mentioned that the term PKM had already been used since
Polanyi (1958), but Pauleen (2009a) argued that the history of PKM begins with the idea
of the knowledge worker by Drucker (1968). In this section, the development of PKM is
discussed since Frand and Hixon (1999), their work has impacted and drawn the focus of
many scholars in this areas in the past decade.
Frand and Hixon (1999) mentioned that we are living in a sea of data, our challenge is
knowledge and its management so that everyone must listen to a great deal of noise in
order to retrieve the few bits of information that are of value to them. Some problems
appear to be intrinsic knowledge management, whether it is being performed using a
word processor, a formal language-based tool or pencil and paper. These problems
include (1) Categorising or classifying; (2) Naming things and making distinctions
between them; and (3) Evaluating and assessing The PKM framework proposed by Frand
and Hixon (1995) focused on personal information management and failed to address the
importance of inter-personal knowledge activities.
The work of Avery et al (2001) was based on the idea created by Paul Dorsey and
developed another PKM framework which addressed this gap to include collaborating
around, securing and presenting information. Avery et al (2001) believed that PKM
requires to clarify the distinction between data, information and knowledge and believed
Chapter 2: Literature Review
Copyright@ Ricky K.F. Cheong 2011 Page 43
that information could become knowledge which entails activities such as comparing,
exploring consequences, making connection to other information and knowledge and
conversing with others. Their proposed PKM framework focused on the information
skills, consisting of seven PKM skills namely (1) Retrieving information; (2) Evaluating
information; (3) Organising information; (4) Collaborating around information; (5)
Analysing information; (6) Presenting information and (7) Securing Information.
Tsui (2002b) provided a technology-centric view on PKM and also explored the various
issues when using the PKM tools available at that time. In the view of Tsui (2002b),
PKM is a collection of processes that individuals need to carry out in their daily activities
in order to manage their own knowledge management work, including gather, classify,
store, search and retrieve knowledge, it is not limited to work-related activities but also to
social activities. Tsui (2002b) suggested that knowledge workers need constantly to (1)
locate the right information quickly, (2) stay abreast with business and technology trend,
(3) switching between learning and practising, (4) create new knowledge and be
innovative, and (5) maintain communications and build trust among peers. These five
suggestions are actually in line with the Avery et al (2001) PKM framework and
communications and working with peers are key elements in PKM. In addition, PKM
should enable innovation and put PKM into practise.
Berman and Annexstein (2003) based on Avery et al. (2001), proposed PKM Skills and
developed a personal knowledge book, “PK-Book”, model to actualise the PKM. Berman
and Annexstein (2003) argued that the ability to actualise the context for PKM is
facilitated by a design combination consisting of (a) a structured and secured container
for the organisation of information, (b) algorithms for the generation of associated
contextual metadata, and (c) utilisation of a contextual engine driven by applications. It is
the natural processes associated with the organisation of focused information which leads
to an ability to actualise the context in information applications, and conversely, through
the usage of context in applications, the focused information unit can be augmented and
improved over time. The PK-Book model seeks to provide users with a natural
organisational structure and methodology, along with a set of associated tools and
applications that together capture and reflect the structure of information as understood
by the individual (Berman & Annexstein 2003).
Chapter 2: Literature Review
Copyright@ Ricky K.F. Cheong 2011 Page 44
Pollard (2004) worked out his model of PKM which focused on information acquisition,
information processing and social activities. The information acquisition includes looking
up data, finding / retrieving information & answers, compiling/ researching / reading/
studying / learning, and subscribing to information source. The information processing
activities includes writing / analysing / narrating / interpreting, editing /reviewing /
annotating, and sharing and publishing knowledge work. The social activities include
finding people / experts, connecting to people, collaborating, and interacting. Pollard
(2004) argued that this system has no sequence, no flow and it is just an undifferentiated
set of knowledge activities to describe human intellectual activity.
Efimova (2005) argued that PKM is an interactive process between individuals, other
people and ideas. This is an approach which focuses on supporting knowledge worker
productivity by taking an active perspective in studying their work. Efimova (2005)
defined PKM as managing a one-person enterprise, the knowledge product, e.g. the
processes, tools, relations with partners, customers and suppliers, are connected with
literature on personal effectiveness and time management or personal branding and
networking. Efimova (2005) used Weblog as an example to illustrate PKM work.
Wright (2005) defined PKM as the capacity to access and apply information and
knowledge resources and processes to enhance the effectiveness, productivity and
innovation of individual workers. Wright (2005) mentioned that while PKM was
primarily an unconscious process and occurred naturally, it was more than personal.
Wright (2005) based on an exploratory study of the work and learning processes of highly
skilled experienced knowledge workers and proposed an alternative PKM framework
which linked the problem solving activities with specific cognitive, information, social
and learning competencies.
Zuber-Skerritt (2005) developed a “soft methodology” model of PKM based on the seven
commonly shared values and principles of the action learning and action research
(ALAR) culture in which the generated seven kinds of personal knowledge can be used
for knowledge management in management education and the workplace. Zuber-Skerritt
(2005) described this model as the values and actions for PKM and argued that which can
serve as a practical guide for application in situations where personal knowledge can
Chapter 2: Literature Review
Copyright@ Ricky K.F. Cheong 2011 Page 45
contribute to problem solving and effective organisational management for organisation
and all individuals.
Agnihotri and Troutt (2009) argued that technology is a critical part of PKM that
enhances individual efficiency and effectiveness such that it will help users to classify
ideas and information, or to archive interactive emails and other items of they are easy to
locate. Agnihotri and Troutt (2009) referenced to the PKM tools classification by Tsui
(2002b) and addressed the importance of the fit between PKM skills and the tools.
In recent years, the development of PKM started to focus on technologies, e.g. online
tools, Web 2.0 technology and semantic web, which enabled the development of PKM
tools to support the workers to practise PKM in an online and virtual environment.
Pettenati et al. (2007) studied the relationship between social networking software and
PKM skills; Diao, Zuo & Liu (2009) investigated the artificial intelligence in PKM; and
Kim, Breslin and Decker (2009) proposed a wiki-based semantic tagging system for
PKM and Volkel and Haller (2009) proposed a conceptual data structure for PKM.
Pettenati et al. (2007) concluded that social networking tools and methods provide a
tremendous opportunity and context to lead individuals into the learning and knowledge
landscape and PKM skills are the enabling condition and final outcome of social
network-based learning experience.
Diao, Zuo and Liu (2009) argued that although the application of artificial intelligence in
personal knowledge was still at the initial stage, the requirements of artificial intelligence
were increasing. Artificial intelligence can be applied to PKM for (1) intelligent search of
knowledge, (2) automatic classification of knowledge, and (3) conversion of tacit
knowledge. The use of artificial intelligence technology to assist in PKM illustrates the
usefulness of artificial intelligence.
Kim, Breslin and Decker (2009) argued that typical personal management systems do not
provide effective ways for representing knowledge worker’s unstructured knowledge or
ideas. Based on this, a Wiki-based semantic tagging system (Wiki-based social Network
Thin Client – WANT) was proposed to facilitate the collaboration and communication of
Chapter 2: Literature Review
Copyright@ Ricky K.F. Cheong 2011 Page 46
the knowledge creation and maintenance. The social semantic cloud of tags (SCOT) was
also suggested to represent tag data at a semantic level, combined with the ontology in
WANT. Kim, Breslin and Decker (2009) mentioned that the PKM system is not only
focused on managing data, but also on connecting people and enabling them to share data
between them.
Volkel and Haller (2009) developed a unified data model called Conceptual Data
Structure (CDS) to bridge the gap between unstructured content (e.g. informal notes) and
formal semantics (e.g. ontologies) by allowing the use of vague semantics and by
subsuming arbitrary relation types under more general ones. The purpose of the CDS
serves as a guideline for future PKM tools, providing a set of crucial structural primitives
as well as providing a knowledge exchange format.
Up to now, the development of PKM is divided into two clusters: skills/activities-centric
and technology-centric. The skills/activities centric mainly focused on the skills for an
individual to manage their knowledge activities e.g. retrieving, analysing and
collaborating information …etc. The technology centric mainly focused on classification
/ selection and development of tools, e.g. data structure and framework for tools
development. The scope of the PKM also expanded from an individual to a more
collaborative focus. Individual focus is mainly concerned with the self
development/reflection and collaborative focus concerned knowledge sharing and
interactive with people, community and society. The timeline of the PKM development
and their focuses are illustrated in figure 2.13.
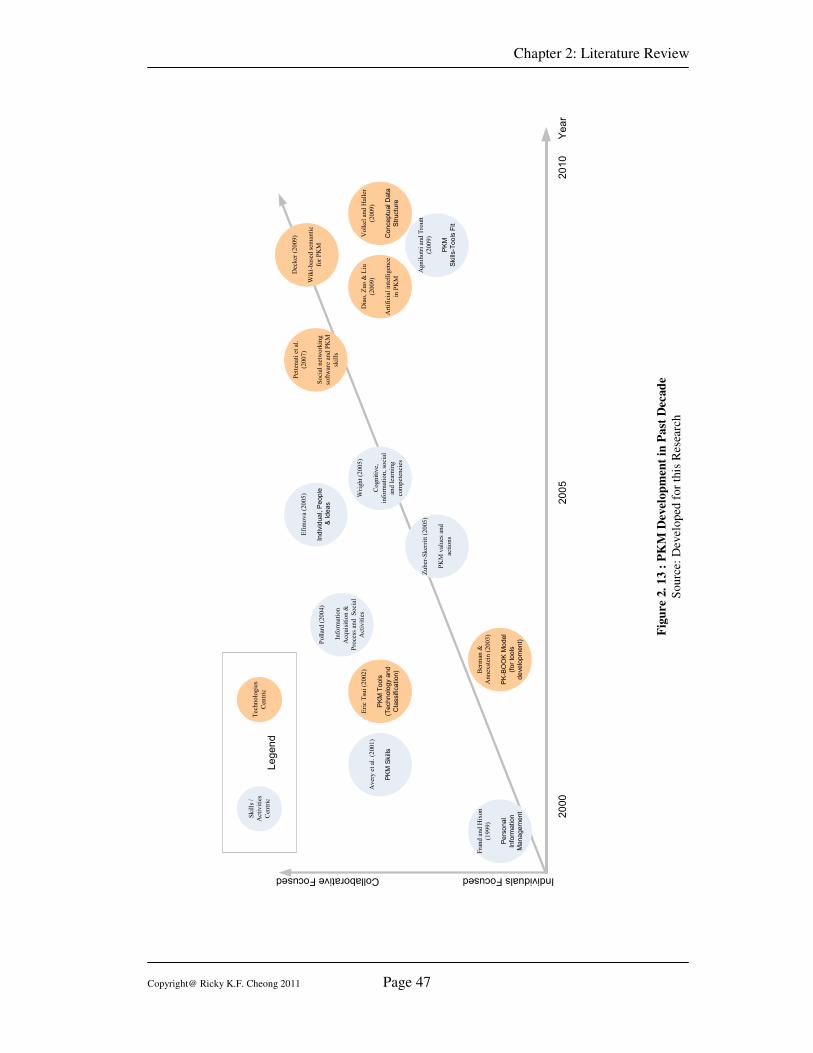
Chapter 2: Literature Review
Copyright@ Ricky K.F. Cheong 2011 Page 47
Frand and Hixon
(1999)
Personal
Information
Management
Avery et al. (2001)
PKM Skills
Eric Tsui (2002)
PKM Tools
(Technology and
Classification) Berman &
Annexstein (2003)
PK-BOOK Model
(for tools
development)Pollard (2004)
Inform
ation
Acquisition &
Process and Social
Activities
Wright (2005)
Cognitive,
inform
ation, social
and learning
competencies
Efimova (2005)
Individual, People
& Ideas
Zuber-Skerritt (2005)
PKM values and
actions
Volkel and Haller
(2009)
Conceptual Data
Structure
Agnihotri and Troutt
(2009)
PKM
Skills-Tools Fit
Pettenati et al.
(2007)
Social networking
software and PKM
skills
Decker (2009)
Wiki-based sem
antic
for PKM
Diao, Zuo &
Liu
(2009)
Artificial intelligence
in PKM
2000 2005 2010
Year
Individuals Focused Collaborative Focused
Legend
Skills /
Activities
Centric
Technologies
Centric
Fig
ure
2.
13 :
PK
M D
evel
op
men
t in
Past
Dec
ad
e
Sourc
e: D
evel
oped
for
this
Res
earc
h
Chapter 2: Literature Review
Copyright@ Ricky K.F. Cheong 2011 Page 48
The information technologies tools for PKM have been rapidly developed in the past
decade and the author believes that web 2.0 based tools are playing important roles to
facilitate the practising of the PKM. Tsui (2002b) argued that the IT based PKM tools are
mainly divided into group-based and personal based KM tools. The group-based KM
systems are generally for both intra (within group) and inter (between groups)
collaboration, while personal KM systems are adopted by individual knowledge workers
and operate within the permissible bounds of the enterprise IT framework and security
network. The recently development of Web 2.0 enables a new model of PKM that
involves formal and informal communication, collaboration and social networking tools
(Razmerita, Kirchner & Sudzina 2009).
Setrag (2010) argued that Web 2.0 is about connecting people, inventing communities,
and encouraging collaborative development on the Web; the greatest benefit of Web 2.0
will be realised through the context of collaboration within the enterprise, between
trading partners, and across the Internet. Setrag (2010, p. 6) also mentioned that
“Business processes provide the context of collaboration, and social networking supports
and augments the various phases of the BPM continuous improvement lifecycle.”
In additional to the collaboration, Web 2.0 based PKM tools also plays a multifaceted
role for communicating, sharing and managing knowledge; it enables a new model of
PKM to facilitate interaction, collaboration and knowledge exchanges on the web and in
organisations (Razmerita, Kirchner & Sudzina 2009).
2.3.4.3 Evaluation of Personal Knowledge Management Models
Many scholars have tried to put different aspects, e.g. skills, tools, connection,
communities …etc, of PKM together to form the PKM model and explain the
interactions. This section evaluates the PKM models proposed by different scholars,
including Frand and Hixon (1999)’s PKM Model (PIM Model), Avery et al (2001)’s
PKM Model (PKM Skills Model), Berman and Annexstein (2003)’s PKM Model (PK-
Book Model) , Efimova (2005)’s PKM Model (Individuals, Ideas and Communities
Model), Wright (2005)’s PKM Model (Competences Model), Zuber-Skerritt (2005)’s
PKM Model (Values and Actions Model), Agnihotri and Troutt (2009)’s PKM Model
(PKM Skill-Tools Fit model), and Jarche (2010)’s PKM Model (Aggregate, Understand
Chapter 2: Literature Review
Copyright@ Ricky K.F. Cheong 2011 Page 49
and Connect Model) . The models will also be assessed for their roles in the four generic
knowledge management process, as proposed by Seufert, Back & Krogh (2003).
2.3.4.3.1 Frand and Hixon (1999)’s PKM Model (PIM Model)
Frand and Hixon (1999) outlined five PKM techniques as (1) Searching / Finding; (2)
Categorising / Classifying; (3) Naming Things / Making Distinctions; (4) Evaluating /
Assessing; and (5) Integrating / Relating. Individuals would attempt to utilise the
computer to help manage the information explosion in an effective way.
(1) Searching / Finding
Searching / Finding focuses on using tools e.g. database selection tools and search
engines. Individuals need to select appropriate starting points based on the
characteristics of the data and understanding the different value and attributes of
different search engines.
(2) Categorising / Classifying
Categorising / classifying is based on the principles used by library scientists e.g.
Ranganthan, Deway, Cutter and others. It includes the classification schemes,
organising information from general to become more specific, putting items into
the most specific category, and subdividing when new category is required.
(3) Naming Things / Making Distinctions
Naming things / making distinctions focuses how to select or use names that are
meaningful to people. It also requires using unique terms in a consistent manner
for distinct concepts e.g. names, abbreviation, file extensions ...etc. The challenge
is how to select a name which is as complete as necessary and as short as possible
that is able to identify the content and minimise confusion.
(4) Evaluating / Assessing
Evaluating / assessing focuses on the tasks related to determine if the information
is complete and accurate, if any evidence of bias by evaluating the purpose of the
information is provided, if there are any sources that confirm or validate the
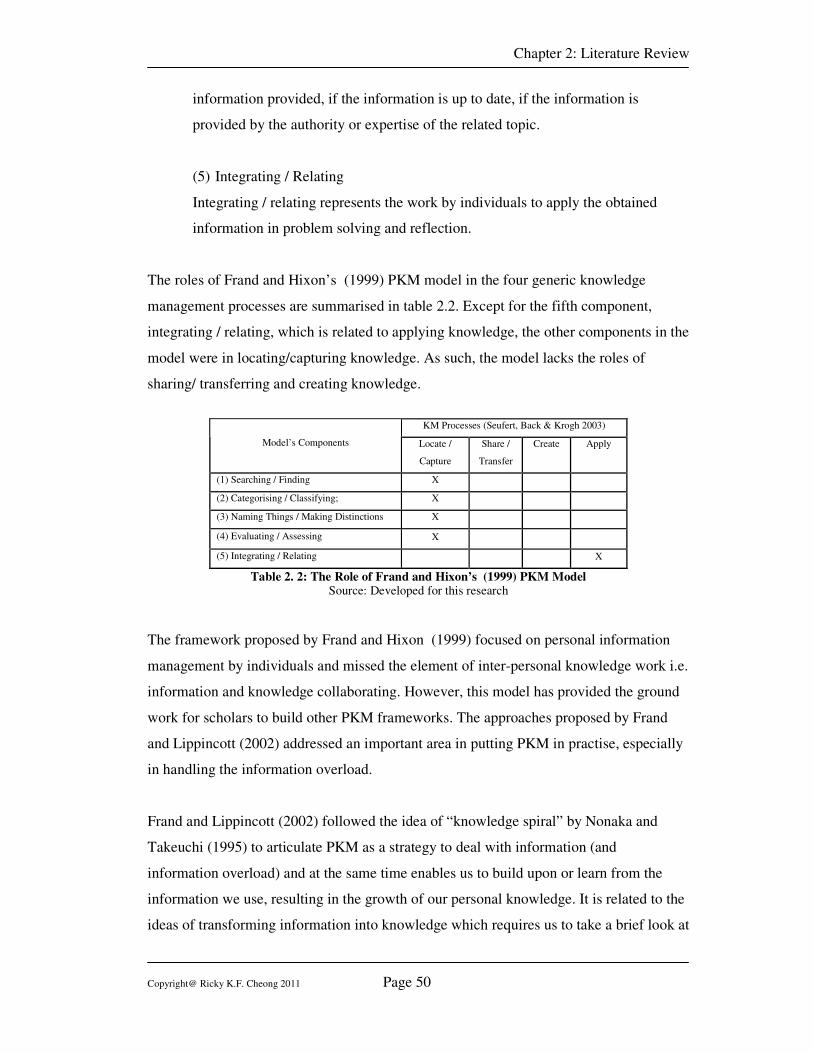
Chapter 2: Literature Review
Copyright@ Ricky K.F. Cheong 2011 Page 50
information provided, if the information is up to date, if the information is
provided by the authority or expertise of the related topic.
(5) Integrating / Relating
Integrating / relating represents the work by individuals to apply the obtained
information in problem solving and reflection.
The roles of Frand and Hixon’s (1999) PKM model in the four generic knowledge
management processes are summarised in table 2.2. Except for the fifth component,
integrating / relating, which is related to applying knowledge, the other components in the
model were in locating/capturing knowledge. As such, the model lacks the roles of
sharing/ transferring and creating knowledge.
KM Processes (Seufert, Back & Krogh 2003)
Model’s Components Locate /
Capture
Share /
Transfer
Create Apply
(1) Searching / Finding X
(2) Categorising / Classifying; X
(3) Naming Things / Making Distinctions X
(4) Evaluating / Assessing X
(5) Integrating / Relating X
Table 2. 2: The Role of Frand and Hixon’s (1999) PKM Model Source: Developed for this research
The framework proposed by Frand and Hixon (1999) focused on personal information
management by individuals and missed the element of inter-personal knowledge work i.e.
information and knowledge collaborating. However, this model has provided the ground
work for scholars to build other PKM frameworks. The approaches proposed by Frand
and Lippincott (2002) addressed an important area in putting PKM in practise, especially
in handling the information overload.
Frand and Lippincott (2002) followed the idea of “knowledge spiral” by Nonaka and
Takeuchi (1995) to articulate PKM as a strategy to deal with information (and
information overload) and at the same time enables us to build upon or learn from the
information we use, resulting in the growth of our personal knowledge. It is related to the
ideas of transforming information into knowledge which requires us to take a brief look at
Chapter 2: Literature Review
Copyright@ Ricky K.F. Cheong 2011 Page 51
some concepts from learning theory, and in building our personal knowledge entails
learning.
The following are PKM tactics suggested by Frand and Lippincott (2002).
(1) Clarify your information needs for each situation.
(2) Plan your information acquisition strategy.
(3) Develop a sourcing strategy for your ongoing information needs.
(4) Identify “push” vs “pull” information.
(5) Adopt naming conventions and stick to them.
(6) File single copies of information
(7) Set criteria for what you want to save or delete.
(8) Work out how and when to process information.
Frand and Lippincott (2002) mentioned that PKM comes into play wherever and
whenever working with information and knowledge, whether it is with paper or electronic
documents, no matter it is email or snail mail, whether it is in our office, home or on the
road. PKM should not focus on the tools used for personal task management e.g. “to do”
lists, calendars, address books, appointment books, and some of the very primitive
personal digital assistants, instead PKM should focus on the content of the tasks
specifically with the information and knowledge management associated with that
content (Frand & Lippincott 2002).
2.3.4.3.2 Avery et al. (2001)’s PKM Model (PKM Skills Model)
Avery et al.(2001) proposed a PKM framework with seven skills. The skills are, in one
sense, problem solving, rather than problem definition, skills. The skills focus on (1)
Retrieving information; (2) Evaluating information; (3) Organising information; (4)
Collaborating around information; (5) Analysing information; (6) Presenting information
and (7) Securing Information. The details of the proposed skills by Avery et al (2001) are
as follows:
Chapter 2: Literature Review
Copyright@ Ricky K.F. Cheong 2011 Page 52
(1) Retrieving information.
Avery et al (2001) mentioned that retrieving information “ involves gathering
information not just from print and electronic sources, but through
experimentation and oral inquiry, as well as a broad range of more discipline-
specific techniques. Capabilities required range from the low-tech skills of asking
questions, listening, and following up to skills in using search tools, reading and
note-taking. Concepts of widening and narrowing one’s search, Boolean logic,
and iterative search practices are an important part of the effective exercise of
this PKM skill as are social skills required for more effective oral inquiry. Also,
as the literature on information literacy emphasises, considerable effort should be
placed on framing inquiry even before information retrieval commences. The
effective use of Internet search engines and electronic databases in the inquiry
process requires technology skills as part of the repertoire of PKM skills.”
The challenge here is to identify those nuggets of information, from the large
information environment, which can help to create new knowledge (Avery et al.
2001). It is necessary to be familiar with the search subject and keywords, to
understand the usefulness of different information sources, and to know how to
use the search tools effectively and to be familiar with the concept of widening
and narrowing the scope of the search.
(2) Evaluating information.
Evaluating information skill is “closely related to the skill of retrieving
information. Strategies of information retrieval should be based on practices that
select data and information that pass some evaluative tests. However, evaluation
also takes place after retrieval as the quality and relevance of various pieces of
information are judged as they relate to the problem at hand. We recognise that
difference disciplines tend to emphasise disparate evaluative criteria as they
determine quality and relevance. The greater availability of information in the
current information-rich environments makes this skill of far greater importance
in the electronic age. The intelligent use of some crude electronic tools, such as
“relevance raters,” can be relevant to the effective evaluation of information.”
(Avery et al. 2001).
Chapter 2: Literature Review
Copyright@ Ricky K.F. Cheong 2011 Page 53
The challenge here is to be effective in evaluating the quality and relevance of
information from a large amount of information (Dorsey 2001). This skill requires
full understanding of the subject matter and sensitivity to the value of the
available information.
(3) Organising information.
Organising information skill is the core PKM skill identified by Frand and Hixon
(1999). It is “ a central part of the inquiry process focused on making the
connections necessary to link pieces of information. Techniques for organising
information help the inquirer to overcome some of the limitations of the human
information processing system. In some ways the key challenge in organising
information is for the inquirer to make the information his or her own through the
use of ordering and connecting principles that relate new information to old
information. Elementary skills of synthesis and analysis are central to this
process. Technological skills in organising information have become ever more
important as electronic tools such as directories and folders, databases, web
pages, and web portals provide the inquirer with ever more powerful tools to
make connections.” (Avery et al. 2001).
The skill of being able to organize information is the core personal knowledge
management skill identified by Frand and Hixon (1999). The challenge here is to
develop approaches that enable individual knowledge workers to develop
strategies that are consistent with the nature of their work, with their learning
styles, and with the nature of the collaborative relationships they may have
(Dorsey 2001). It requires considerable skill to connect new information to old
information using the mental process of pattern matching or recognition. Skills are
also required to use technologies, for example relational databases, web sites,
personal information software and so on, to store the information in a structural
way (for example, chronological, functional and role-based approaches) and so
on.
Chapter 2: Literature Review
Copyright@ Ricky K.F. Cheong 2011 Page 54
(4) Collaborating around information.
Avery et al. (2001) argued that “the interdisciplinary literature on effective teams
and groups is replete with principles for effective collaborative work. Listening,
showing respect for the understanding of others’ ideas, developing and following
through on shared practices, building win/win relationships, and resolving
conflicts are among those underlying principles. Within collaborative inquiry,
partners in inquiry need to learn to have their voice heard and to hear other
voices. Both cultural and more nuts-and-bolts practical issues need to be
attended to. The availability of new electronic tools for collaboration to support
both synchronous and asynchronous communication requires a whole new set of
procedures for efficient information exchange.”.
The challenge here, as it relates to technology, is to identify how information
technology can support the process of working smarter, rather than merely harder,
and to overcome obstacles in the absence of social cues for appropriate behaviour
(Dorsey 2001). It requires the use of different technologies, for example email,
instant messaging, conferencing systems, groupware and so on. These enable
individual knowledge workers to acquire new knowledge and thus help the
organization to achieve its business goals.
(5) Analysing information.
The analysis of information is “fundamental to the process of converting
information into knowledge. At the same time, this is the most discipline-specific
information skill since the models, theories and frameworks that are central to
analysis are frequently tied to the academic disciplines. Analysis builds on the
organisation of information, but goes beyond it in its emphasis on the importance
of respect for standards in public communities. This skill addresses the challenge
of extracting meaning out of data. In some disciplines, electronic tools such as
electronic spreadsheets and statistical software provide the means to analyse
information, but the human element is central in framing the models that are
embodied in that software.” (Avery et al. 2001).
Chapter 2: Literature Review
Copyright@ Ricky K.F. Cheong 2011 Page 55
The challenge is to extract meaningful information from data. This is the
fundamental process of converting information into knowledge (Avery et al.
2001). Information technology provides tools, for example spreadsheets and
statistical software, to perform data analysis but the human element is the most
important factor in the analysing process. It is the ability to process the
information and make sense using human experience and knowledge. This ability
is related to the intelligence of individuals, and sometimes intuition and specific
tools, for example data mining tools, also play a key role in performing an
analysis.
(6) Presenting information
Avery et al. (2001) argued that “key to the presentation of information is
audience; this means, as in the case of analysing information, that understanding
disciplinary communities—often an important audience--and their norms and
standards are of central importance. An effective presentation assumes not only
an understanding of audience, but a clear understanding of the purpose of the
presentation as it relates to audience. The history and theory of rhetoric provides
an abundant literature for guidance in the exercise of this skill. The emergence
of new electronic tools and venues for presentations, through computer-based
presentation tools and web sites, makes attention to this information skill even
more important.” (Avery et al. 2001).
It is important to have a clear understanding of the purpose of the presentation as
it relates to the audience (Dorsey 2001). This is the art of composition and
speaking. It is not enough just to prepare a professional looking PowerPoint slide
or a colourful chart. The presenter has to understand the characteristics of the
audience: who they are, what information they require, from what perspective
they will interpret the information and how they will make use of the information
presented. The challenge is to ensure the audience can pick up the information or
knowledge in the context that the presenter has selected.
Chapter 2: Literature Review
Copyright@ Ricky K.F. Cheong 2011 Page 56
(7) Securing information
Securing information is frequently being neglected as an information skill (Dorsey
2001). In the view of Avery et al (2001), securing information is “the centrality of
intellectual property issues and the multiplicity of security issues arising from the
explosion of electronically networked environments make security issues more
and more salient. Securing information entails developing and implementing
practices that help to assure the confidentiality, integrity and actual existence of
information. An appreciation of intellectual property issues of copyrights and
patents is very important. Such practices as password management, backup,
archiving and use of encryption are other important elements for the effective
practice of this skill in electronic environments.”
This is frequently neglected as an information skill (Dorsey 2001). It is however
becoming more and more important especially with the rapid development of the
Internet. The importance of keeping information secure is built on the concept of
intellectual property. A business will suffer if its trade secrets are stolen by
competitors. The care of intellectual property, copyright and patents is important
and it should be the concern of everyone, starting from the individual to improve
the state of information security awareness, for example password management,
safeguarding of information sources and so on.
The roles of Avery et al (2001)’s PKM model in the four generic knowledge
management processes are summarised in table 2.3. Retrieving information, evaluating
information and organising information were taking the role in locate/capture knowledge,
the collaborating around information was taking the role in share/transfer knowledge, the
analysing information was involving create knowledge; and the presenting information
and securing information were taking the role of share/transfer and apply knowledge.
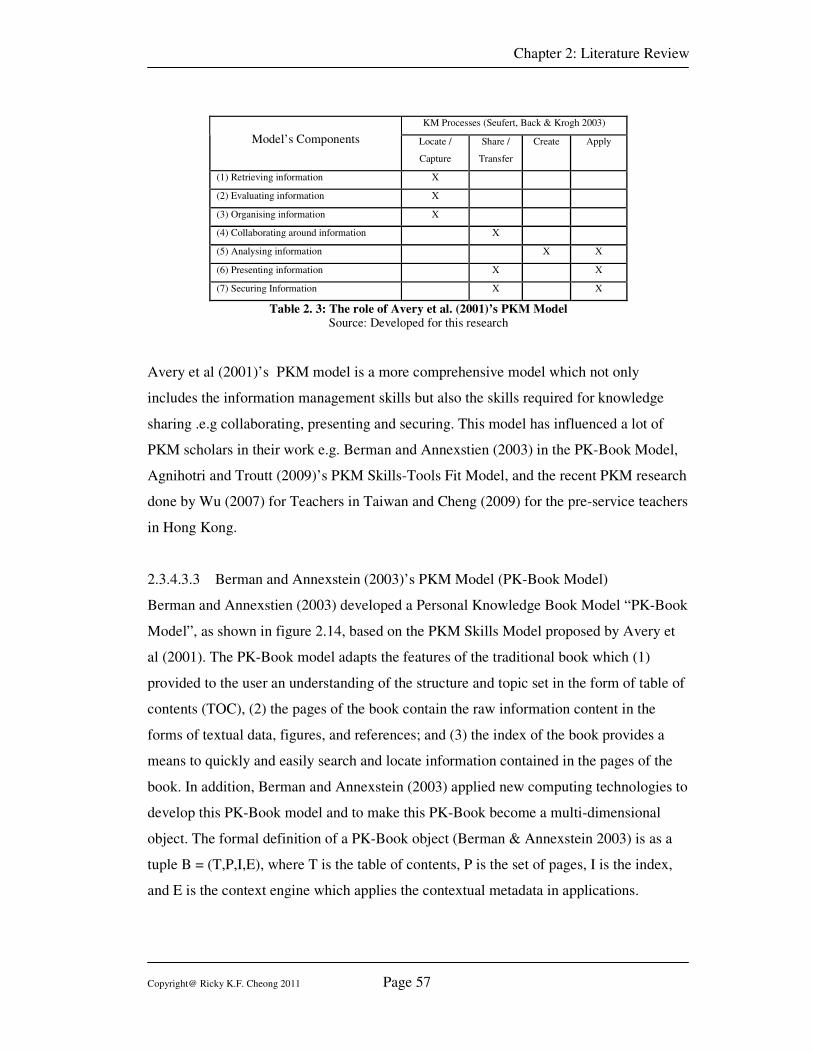
Chapter 2: Literature Review
Copyright@ Ricky K.F. Cheong 2011 Page 57
KM Processes (Seufert, Back & Krogh 2003)
Model’s Components Locate /
Capture
Share /
Transfer
Create Apply
(1) Retrieving information X
(2) Evaluating information X
(3) Organising information X
(4) Collaborating around information X
(5) Analysing information X X
(6) Presenting information X X
(7) Securing Information X X
Table 2. 3: The role of Avery et al. (2001)’s PKM Model Source: Developed for this research
Avery et al (2001)’s PKM model is a more comprehensive model which not only
includes the information management skills but also the skills required for knowledge
sharing .e.g collaborating, presenting and securing. This model has influenced a lot of
PKM scholars in their work e.g. Berman and Annexstien (2003) in the PK-Book Model,
Agnihotri and Troutt (2009)’s PKM Skills-Tools Fit Model, and the recent PKM research
done by Wu (2007) for Teachers in Taiwan and Cheng (2009) for the pre-service teachers
in Hong Kong.
2.3.4.3.3 Berman and Annexstein (2003)’s PKM Model (PK-Book Model)
Berman and Annexstien (2003) developed a Personal Knowledge Book Model “PK-Book
Model”, as shown in figure 2.14, based on the PKM Skills Model proposed by Avery et
al (2001). The PK-Book model adapts the features of the traditional book which (1)
provided to the user an understanding of the structure and topic set in the form of table of
contents (TOC), (2) the pages of the book contain the raw information content in the
forms of textual data, figures, and references; and (3) the index of the book provides a
means to quickly and easily search and locate information contained in the pages of the
book. In addition, Berman and Annexstein (2003) applied new computing technologies to
develop this PK-Book model and to make this PK-Book become a multi-dimensional
object. The formal definition of a PK-Book object (Berman & Annexstein 2003) is as a
tuple B = (T,P,I,E), where T is the table of contents, P is the set of pages, I is the index,
and E is the context engine which applies the contextual metadata in applications.
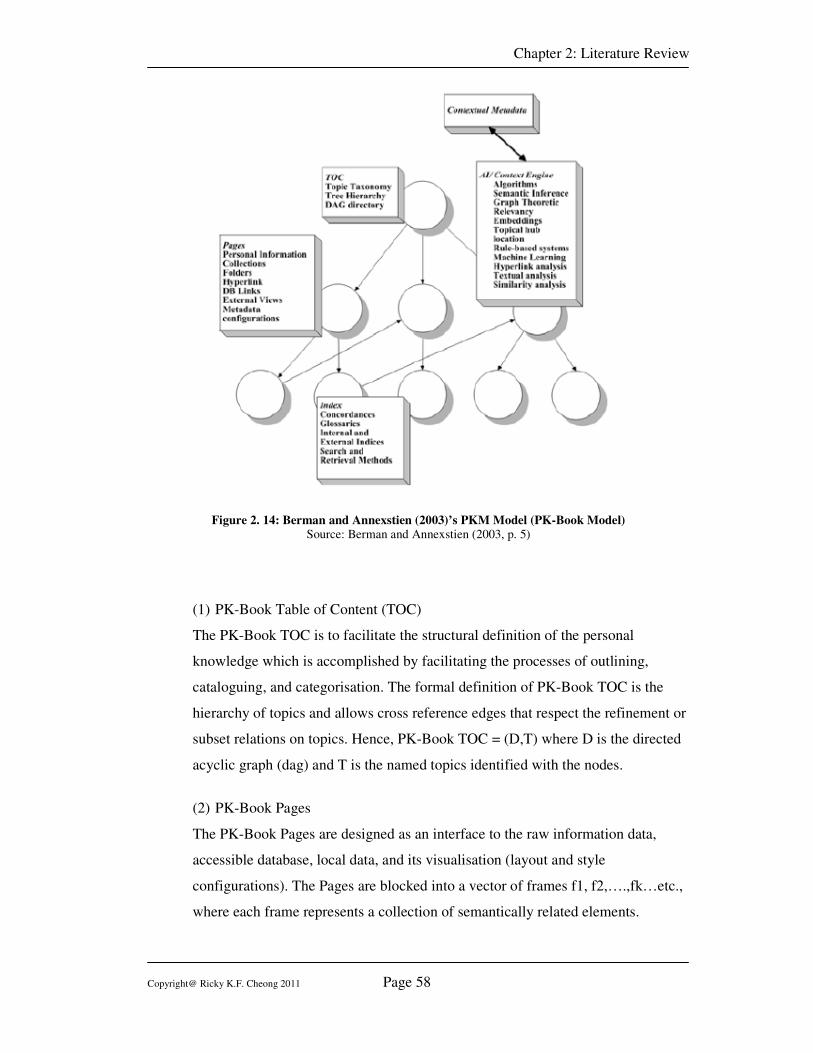
Chapter 2: Literature Review
Copyright@ Ricky K.F. Cheong 2011 Page 58
Figure 2. 14: Berman and Annexstien (2003)’s PKM Model (PK-Book Model)
Source: Berman and Annexstien (2003, p. 5)
(1) PK-Book Table of Content (TOC)
The PK-Book TOC is to facilitate the structural definition of the personal
knowledge which is accomplished by facilitating the processes of outlining,
cataloguing, and categorisation. The formal definition of PK-Book TOC is the
hierarchy of topics and allows cross reference edges that respect the refinement or
subset relations on topics. Hence, PK-Book TOC = (D,T) where D is the directed
acyclic graph (dag) and T is the named topics identified with the nodes.
(2) PK-Book Pages
The PK-Book Pages are designed as an interface to the raw information data,
accessible database, local data, and its visualisation (layout and style
configurations). The Pages are blocked into a vector of frames f1, f2,….,fk…etc.,
where each frame represents a collection of semantically related elements.
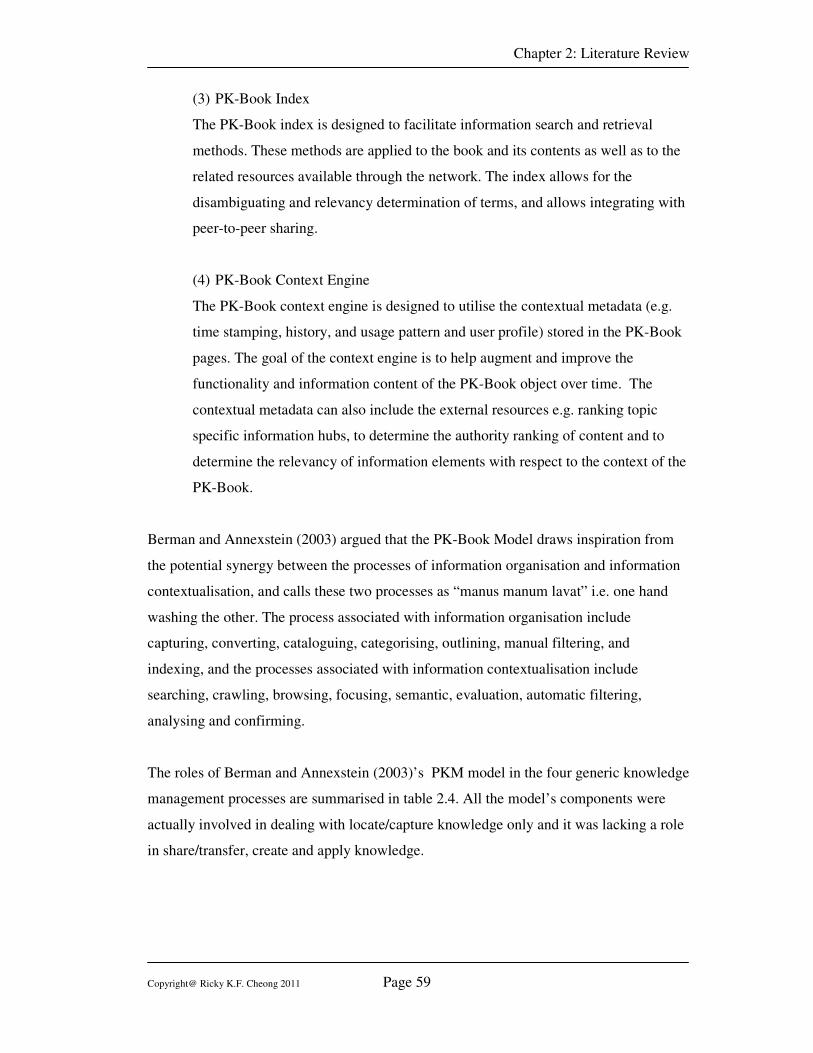
Chapter 2: Literature Review
Copyright@ Ricky K.F. Cheong 2011 Page 59
(3) PK-Book Index
The PK-Book index is designed to facilitate information search and retrieval
methods. These methods are applied to the book and its contents as well as to the
related resources available through the network. The index allows for the
disambiguating and relevancy determination of terms, and allows integrating with
peer-to-peer sharing.
(4) PK-Book Context Engine
The PK-Book context engine is designed to utilise the contextual metadata (e.g.
time stamping, history, and usage pattern and user profile) stored in the PK-Book
pages. The goal of the context engine is to help augment and improve the
functionality and information content of the PK-Book object over time. The
contextual metadata can also include the external resources e.g. ranking topic
specific information hubs, to determine the authority ranking of content and to
determine the relevancy of information elements with respect to the context of the
PK-Book.
Berman and Annexstein (2003) argued that the PK-Book Model draws inspiration from
the potential synergy between the processes of information organisation and information
contextualisation, and calls these two processes as “manus manum lavat” i.e. one hand
washing the other. The process associated with information organisation include
capturing, converting, cataloguing, categorising, outlining, manual filtering, and
indexing, and the processes associated with information contextualisation include
searching, crawling, browsing, focusing, semantic, evaluation, automatic filtering,
analysing and confirming.
The roles of Berman and Annexstein (2003)’s PKM model in the four generic knowledge
management processes are summarised in table 2.4. All the model’s components were
actually involved in dealing with locate/capture knowledge only and it was lacking a role
in share/transfer, create and apply knowledge.
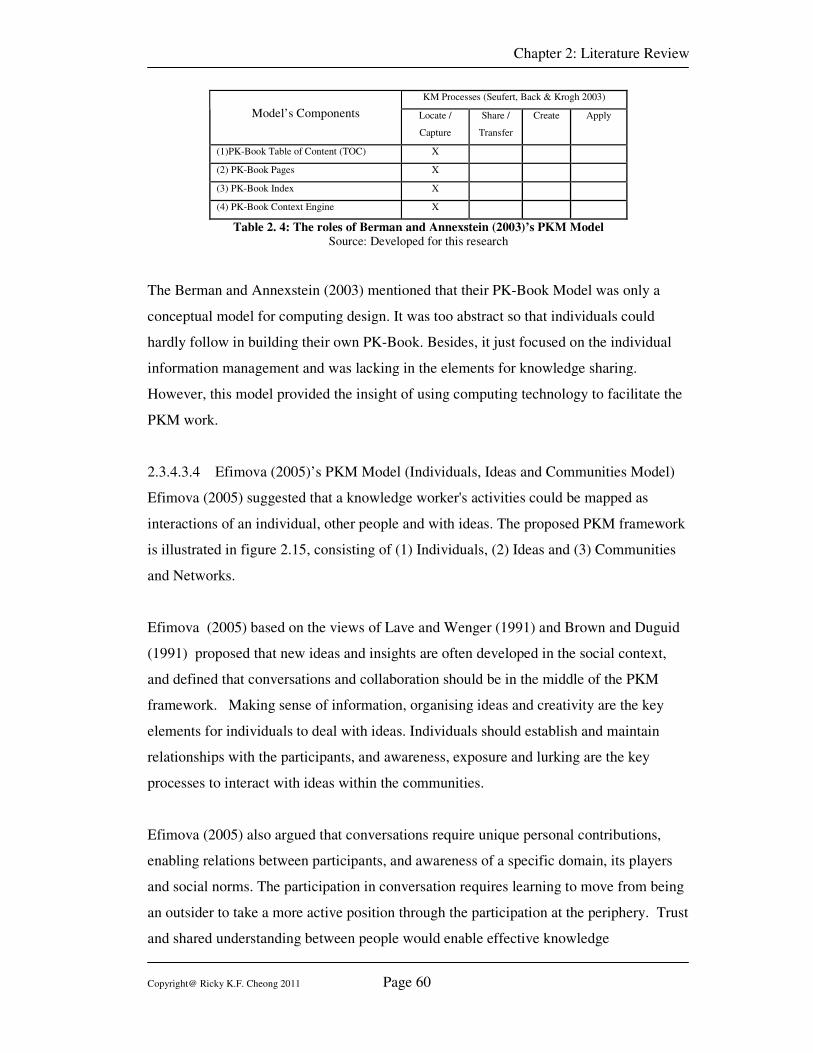
Chapter 2: Literature Review
Copyright@ Ricky K.F. Cheong 2011 Page 60
KM Processes (Seufert, Back & Krogh 2003)
Model’s Components Locate /
Capture
Share /
Transfer
Create Apply
(1)PK-Book Table of Content (TOC) X
(2) PK-Book Pages X
(3) PK-Book Index X
(4) PK-Book Context Engine X
Table 2. 4: The roles of Berman and Annexstein (2003)’s PKM Model
Source: Developed for this research
The Berman and Annexstein (2003) mentioned that their PK-Book Model was only a
conceptual model for computing design. It was too abstract so that individuals could
hardly follow in building their own PK-Book. Besides, it just focused on the individual
information management and was lacking in the elements for knowledge sharing.
However, this model provided the insight of using computing technology to facilitate the
PKM work.
2.3.4.3.4 Efimova (2005)’s PKM Model (Individuals, Ideas and Communities Model)
Efimova (2005) suggested that a knowledge worker's activities could be mapped as
interactions of an individual, other people and with ideas. The proposed PKM framework
is illustrated in figure 2.15, consisting of (1) Individuals, (2) Ideas and (3) Communities
and Networks.
Efimova (2005) based on the views of Lave and Wenger (1991) and Brown and Duguid
(1991) proposed that new ideas and insights are often developed in the social context,
and defined that conversations and collaboration should be in the middle of the PKM
framework. Making sense of information, organising ideas and creativity are the key
elements for individuals to deal with ideas. Individuals should establish and maintain
relationships with the participants, and awareness, exposure and lurking are the key
processes to interact with ideas within the communities.
Efimova (2005) also argued that conversations require unique personal contributions,
enabling relations between participants, and awareness of a specific domain, its players
and social norms. The participation in conversation requires learning to move from being
an outsider to take a more active position through the participation at the periphery. Trust
and shared understanding between people would enable effective knowledge
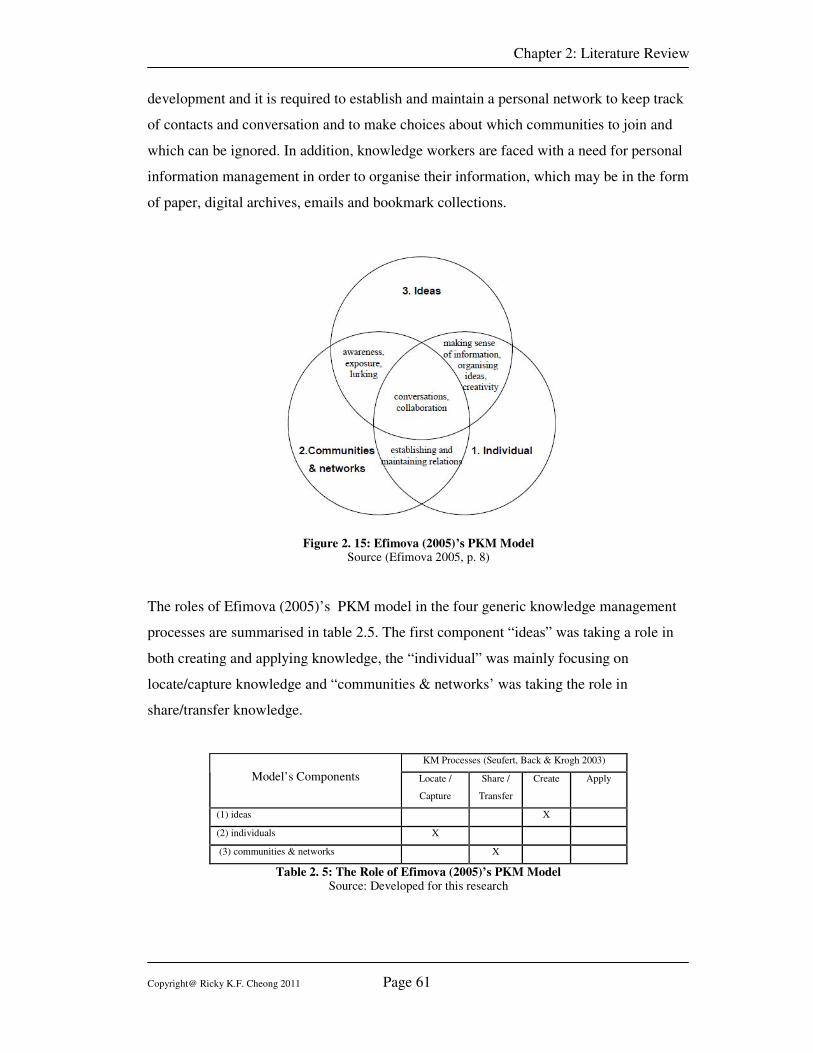
Chapter 2: Literature Review
Copyright@ Ricky K.F. Cheong 2011 Page 61
development and it is required to establish and maintain a personal network to keep track
of contacts and conversation and to make choices about which communities to join and
which can be ignored. In addition, knowledge workers are faced with a need for personal
information management in order to organise their information, which may be in the form
of paper, digital archives, emails and bookmark collections.
Figure 2. 15: Efimova (2005)’s PKM Model Source (Efimova 2005, p. 8)
The roles of Efimova (2005)’s PKM model in the four generic knowledge management
processes are summarised in table 2.5. The first component “ideas” was taking a role in
both creating and applying knowledge, the “individual” was mainly focusing on
locate/capture knowledge and “communities & networks’ was taking the role in
share/transfer knowledge.
KM Processes (Seufert, Back & Krogh 2003)
Model’s Components Locate /
Capture
Share /
Transfer
Create Apply
(1) ideas X
(2) individuals X
(3) communities & networks X
Table 2. 5: The Role of Efimova (2005)’s PKM Model Source: Developed for this research
Chapter 2: Literature Review
Copyright@ Ricky K.F. Cheong 2011 Page 62
Efimova (2005)’s PKM model provided the linkage between ideas, individuals and
communities. It provided some important key concept of practising PKM e.g. the
relationship between individual and communities need not just be established but also
need to be maintained; sense making of information and creativity are important for an
individual to generate ideas; and awareness, exposure and lurking are important for ideas
sharing within communities. The element of “Ideas” was introduced to the PKM model
which was not found in previous PKM models. However, this model is less focused on
the applying knowledge and how to better organise the information for future use.
2.3.4.3.5 Wright (2005)’s Personal Knowledge Management Framework (Competences
Model)
Wright (2005) proposed a PKM framework, as shown in figure 2.16, to link the problem
solving activities with specific cognitive, information, social and learning and
development competencies. It is based on the Tissen et al., (1998) proposed model of
knowledge worker competencies and added a fourth competency namely learning and
development. The capacity to apply the competencies requires the support by individuals,
and social and organisational enablers.
(1) Cognitive Competences
Knowledge workers develop and refine their problem solving capabilities through
ongoing learning, including formal training and informal learning, observations
and discussions, as well as work experience. Knowledge workers apply complex
thinking skills e.g. problem identification and definition, pattern recognition,
sense-making, analysis, implementation and monitoring. A variety of heuristic
processes and analytical models are used to solve problems. The workers are not
limited to a single approach to problem solving and will continuously adapt,
modify and refine their problem-solving techniques. As a result, the workers will
acquire advanced cognitive skills which include experimentation, prototyping and
modelling. Communication, negotiation and conflict resolution skills are
developed for application in developing new knowledge, and finally the process
of reflection, including individual reflection and double loop learning and
collaborative reflection within communities of practise, will occur around
particular problem-solving practices.
Chapter 2: Literature Review
Copyright@ Ricky K.F. Cheong 2011 Page 63
(2) Information Competences
The core information competences involve sensing and sourcing information
skills i.e. the ability to locate and capture the information in a short time, and
questioning skills which enable knowing what information resources to seek. It is
the ability to assess, organise, structure, present and discard information resources
which are vital elements for efficiently accessing and applying information. It
involves having strong search skills to enable quick assess to the quality and value
of information resources.
(3) Social Competences
Knowledge work is a social interaction. It is a challenge to the knowledge workers
that problem solving in today’s complex environment involves teams, projects,
collaboration and interaction. The problem solving involves working in a
collaborative environment and effective problem solving requires team building
and maintenance activities e.g. communication and conflict resolution skills. How
individual workers utilise their social competencies can be understood by the
concept of social capital (Adler & Kwon 2000; Nahapiet & Ghoshal 1998). The
social capital consists of three inter-related dimensions which are structural,
cognitive and common understanding and relational. Structural defines the ties
and configurations of the social networks which identify the patterns of
connections among workers. Cognitive include the elements of shared language.
Common understandings focus on the essential role of trust, shared norms and
common identification.
(4) Learning and Development Competences
Learning is a continuous process and it is indistinguishable from ongoing work
practices. Learning is contingent and contextual. For routine problems, workers
refine their ability to quickly recognise problem types and act. The novel
problems allow workers to develop stronger pattern recognition and sense-making
capacities and more robust analytical and problem-solving techniques. The new
knowledge is created through experimentation, innovation and prototyping.
Problems outside the expertise of workers can allow the application of reflection
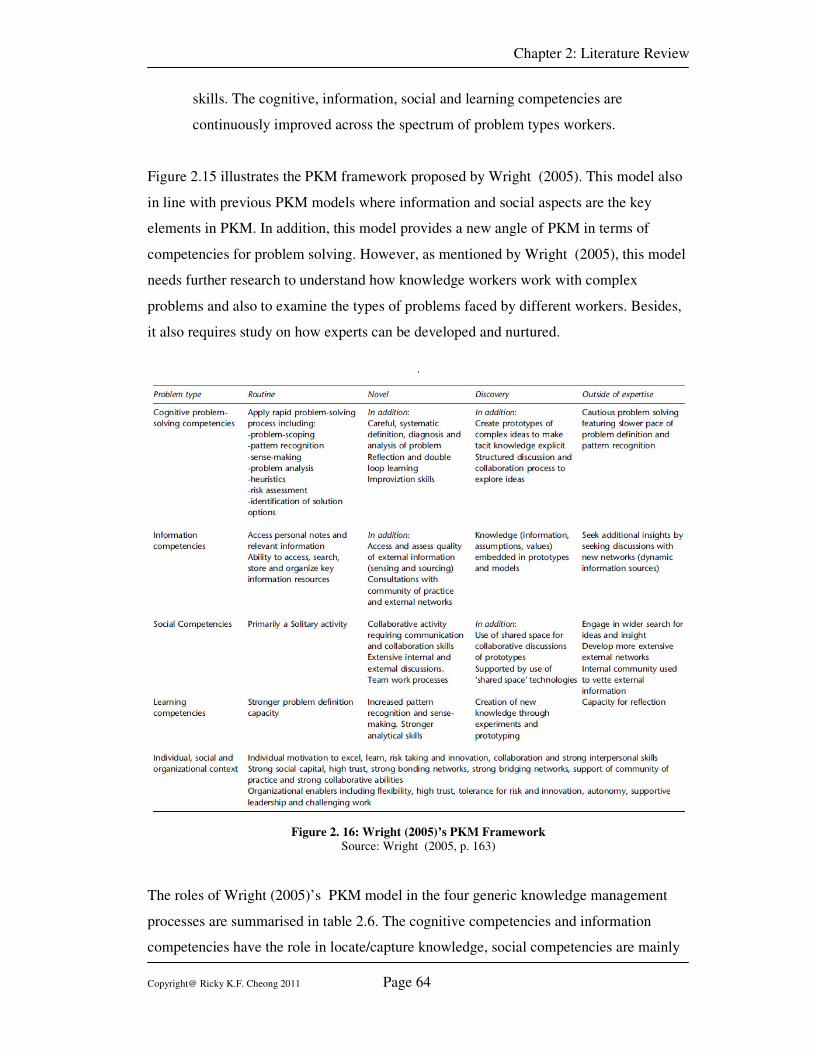
Chapter 2: Literature Review
Copyright@ Ricky K.F. Cheong 2011 Page 64
skills. The cognitive, information, social and learning competencies are
continuously improved across the spectrum of problem types workers.
Figure 2.15 illustrates the PKM framework proposed by Wright (2005). This model also
in line with previous PKM models where information and social aspects are the key
elements in PKM. In addition, this model provides a new angle of PKM in terms of
competencies for problem solving. However, as mentioned by Wright (2005), this model
needs further research to understand how knowledge workers work with complex
problems and also to examine the types of problems faced by different workers. Besides,
it also requires study on how experts can be developed and nurtured.
.
Figure 2. 16: Wright (2005)’s PKM Framework
Source: Wright (2005, p. 163)
The roles of Wright (2005)’s PKM model in the four generic knowledge management
processes are summarised in table 2.6. The cognitive competencies and information
competencies have the role in locate/capture knowledge, social competencies are mainly
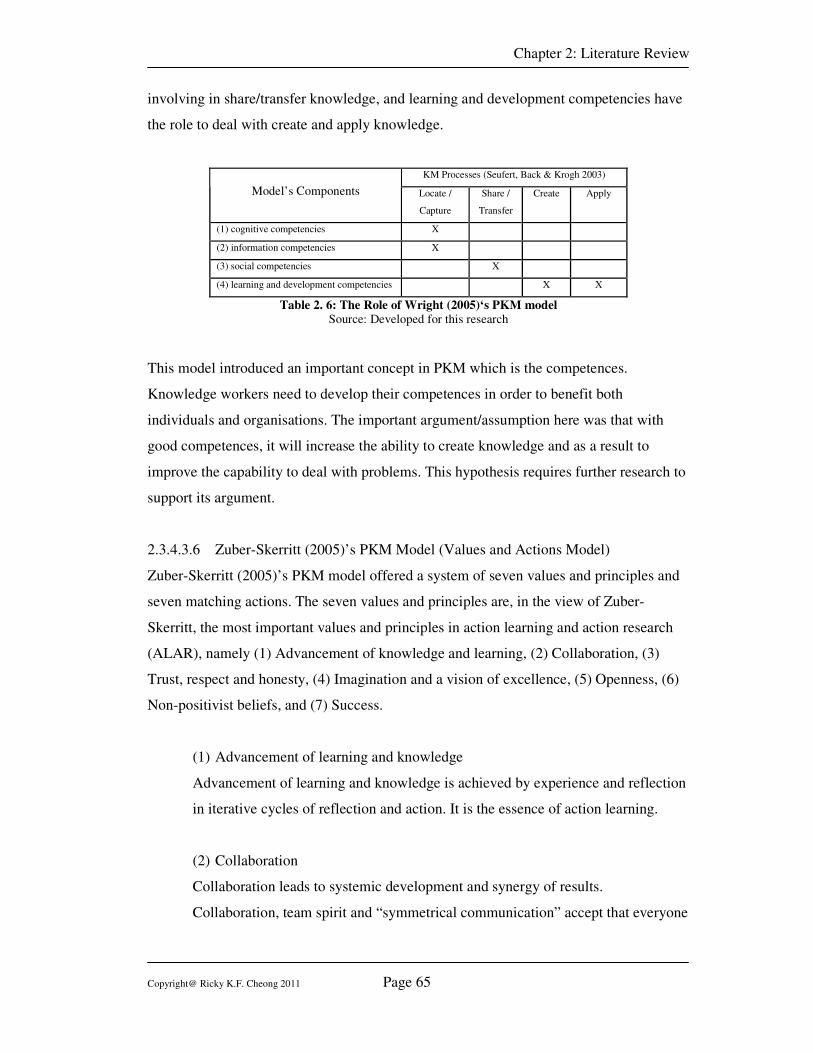
Chapter 2: Literature Review
Copyright@ Ricky K.F. Cheong 2011 Page 65
involving in share/transfer knowledge, and learning and development competencies have
the role to deal with create and apply knowledge.
KM Processes (Seufert, Back & Krogh 2003)
Model’s Components Locate /
Capture
Share /
Transfer
Create Apply
(1) cognitive competencies X
(2) information competencies X
(3) social competencies X
(4) learning and development competencies X X
Table 2. 6: The Role of Wright (2005)‘s PKM model
Source: Developed for this research
This model introduced an important concept in PKM which is the competences.
Knowledge workers need to develop their competences in order to benefit both
individuals and organisations. The important argument/assumption here was that with
good competences, it will increase the ability to create knowledge and as a result to
improve the capability to deal with problems. This hypothesis requires further research to
support its argument.
2.3.4.3.6 Zuber-Skerritt (2005)’s PKM Model (Values and Actions Model)
Zuber-Skerritt (2005)’s PKM model offered a system of seven values and principles and
seven matching actions. The seven values and principles are, in the view of Zuber-
Skerritt, the most important values and principles in action learning and action research
(ALAR), namely (1) Advancement of knowledge and learning, (2) Collaboration, (3)
Trust, respect and honesty, (4) Imagination and a vision of excellence, (5) Openness, (6)
Non-positivist beliefs, and (7) Success.
(1) Advancement of learning and knowledge
Advancement of learning and knowledge is achieved by experience and reflection
in iterative cycles of reflection and action. It is the essence of action learning.
(2) Collaboration
Collaboration leads to systemic development and synergy of results.
Collaboration, team spirit and “symmetrical communication” accept that everyone
Chapter 2: Literature Review
Copyright@ Ricky K.F. Cheong 2011 Page 66
is equal and unique and accept differences positively, and has the capacity to
contribute as best they can to solve a problem.
(3) Trust, respect and honesty
Trust, respect and honesty are the preconditions for the search for truth(s). It is the
heart of action learning and action research.
(4) Imagination and a vision of excellence
Imagination, intuition, and vision of excellence can enrich the pursuit of ideas,
possibilities and ultimately knowledge and appreciation. It can lead to high levels
of performance.
(5) Openness
Openness is to criticism and self-criticism fosters the exploration of multiple
possibilities, rather than single-minded or black and white solutions.
(6) Non-positivist beliefs
Non-positivist beliefs allow the development of grounded theory and reject the
positivist belief that only valid and legitimate knowledge is scientific in nature. It
recognises that knowledge is produced from various sources, including people’s
subjective insight, intuitions and hunches and, as mentioned by Nonaka and
Takeuchi (1995), it must be practical and integrate both explicit and tactic
knowledge.
(7) Success
Success means shared success, accountability, recognition and reward, manifest in
learning and productivity outcomes.
The seven matching actions are:
(1) Reflection on and in action,
(2) Effective use of processes and methods,
(3) Feedback from “Critical friends”,
Chapter 2: Literature Review
Copyright@ Ricky K.F. Cheong 2011 Page 67
(4) Leadership development,
(5) Exploration of new opportunities,
(6) Coaching,
(7) Team results.
The model integrated with these seven actions and seven values is illustrated in figure
2.17. Zuber-Skerritt (2005) argued that this model is for developing, accessing and
making explicit one type of knowledge in KM: the experiential, tacit and implicit
knowledge called personal knowledge. This model can help to identity personal
knowledge as:
(1) Knowledge through reflection on action / experience and through developing
concepts and personal theories,
(2) Knowledge through collaboration and effective use of group processes.
(3) Knowledge of oneself (strengths and weakness) and of significant others
through feedback, team building, respecting personal differences, and
understanding what constitutes a winning team.
(4) Knowledge of future goals and envisaged high achievement through vision
building, creative thinking, right-brain activities and developing energy and
motivation for success.
(5) Knowledge of how to explore new opportunities through self-assessment, self-
criticism, and through openness to criticism from others,
(6) Knowledge of our basic beliefs and of the assumptions underpinning our
research and development activities through learning from mentors, coaches
and from the literature, regarding paradigms and epistemology.
(7) Knowledge of team achievement and success through recognition, reward and
celebration.
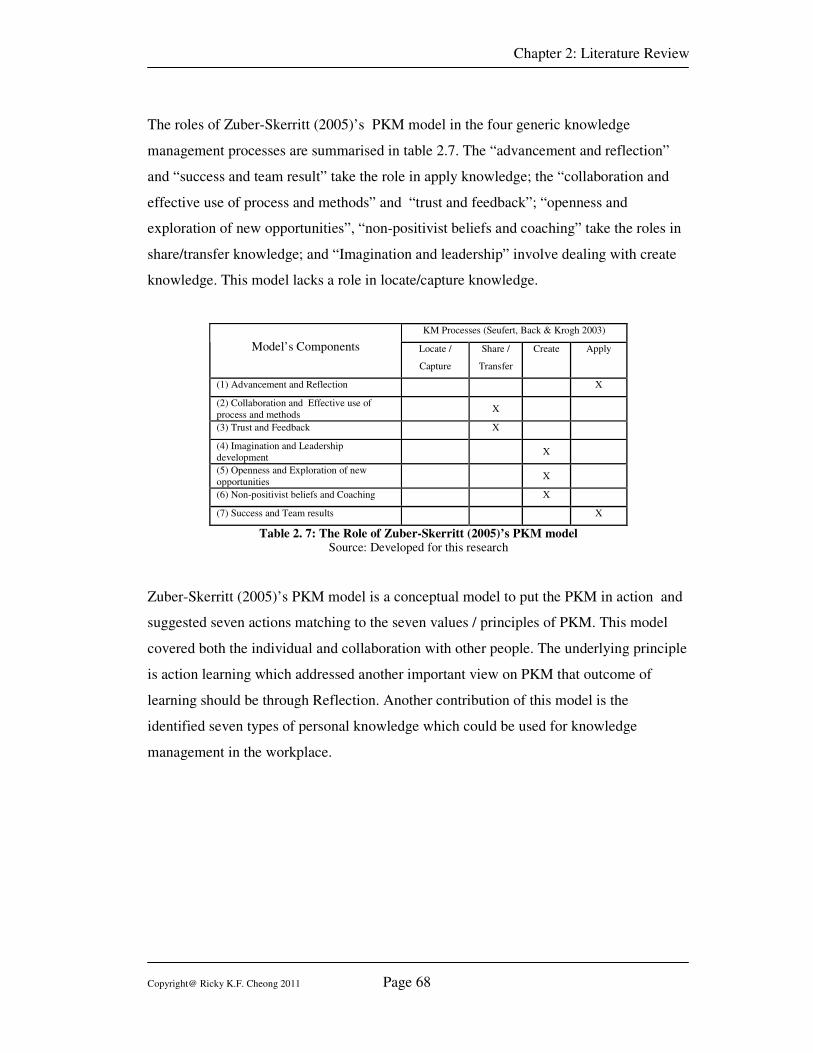
Chapter 2: Literature Review
Copyright@ Ricky K.F. Cheong 2011 Page 68
The roles of Zuber-Skerritt (2005)’s PKM model in the four generic knowledge
management processes are summarised in table 2.7. The “advancement and reflection”
and “success and team result” take the role in apply knowledge; the “collaboration and
effective use of process and methods” and “trust and feedback”; “openness and
exploration of new opportunities”, “non-positivist beliefs and coaching” take the roles in
share/transfer knowledge; and “Imagination and leadership” involve dealing with create
knowledge. This model lacks a role in locate/capture knowledge.
KM Processes (Seufert, Back & Krogh 2003)
Model’s Components Locate /
Capture
Share /
Transfer
Create Apply
(1) Advancement and Reflection X
(2) Collaboration and Effective use of
process and methods
X
(3) Trust and Feedback X
(4) Imagination and Leadership
development
X
(5) Openness and Exploration of new
opportunities
X
(6) Non-positivist beliefs and Coaching X
(7) Success and Team results X
Table 2. 7: The Role of Zuber-Skerritt (2005)’s PKM model Source: Developed for this research
Zuber-Skerritt (2005)’s PKM model is a conceptual model to put the PKM in action and
suggested seven actions matching to the seven values / principles of PKM. This model
covered both the individual and collaboration with other people. The underlying principle
is action learning which addressed another important view on PKM that outcome of
learning should be through Reflection. Another contribution of this model is the
identified seven types of personal knowledge which could be used for knowledge
management in the workplace.
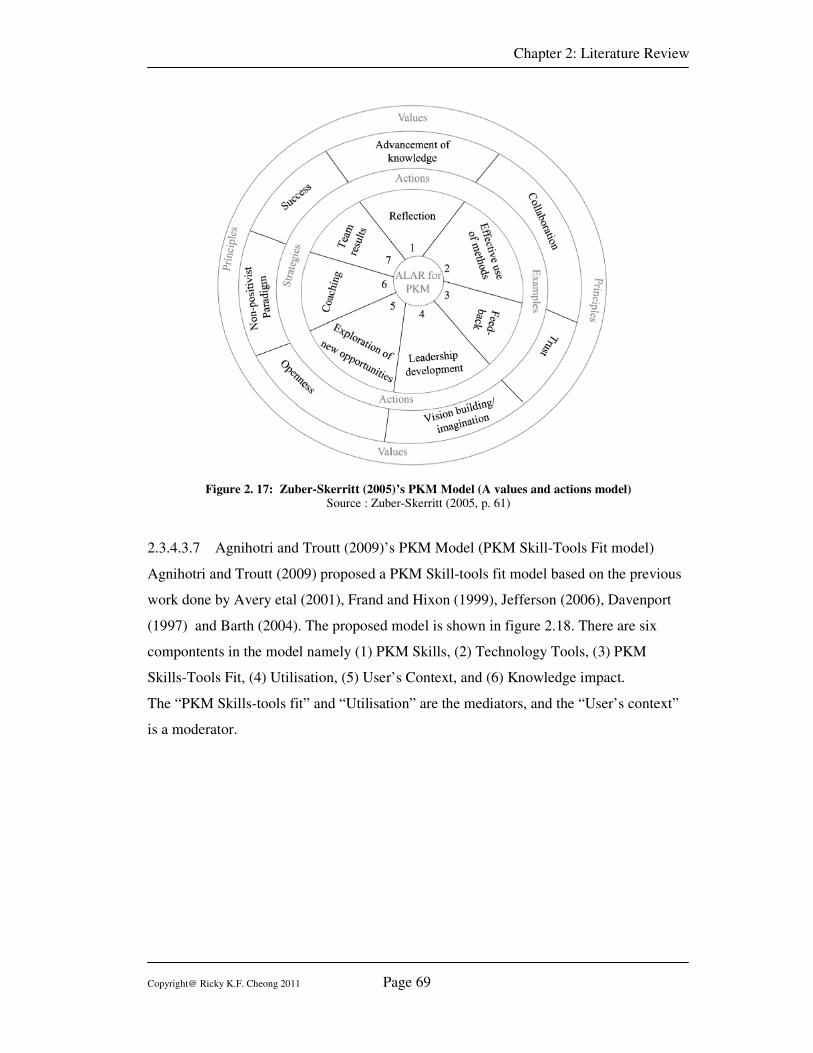
Chapter 2: Literature Review
Copyright@ Ricky K.F. Cheong 2011 Page 69
Figure 2. 17: Zuber-Skerritt (2005)’s PKM Model (A values and actions model) Source : Zuber-Skerritt (2005, p. 61)
2.3.4.3.7 Agnihotri and Troutt (2009)’s PKM Model (PKM Skill-Tools Fit model)
Agnihotri and Troutt (2009) proposed a PKM Skill-tools fit model based on the previous
work done by Avery etal (2001), Frand and Hixon (1999), Jefferson (2006), Davenport
(1997) and Barth (2004). The proposed model is shown in figure 2.18. There are six
compontents in the model namely (1) PKM Skills, (2) Technology Tools, (3) PKM
Skills-Tools Fit, (4) Utilisation, (5) User’s Context, and (6) Knowledge impact.
The “PKM Skills-tools fit” and “Utilisation” are the mediators, and the “User’s context”
is a moderator.
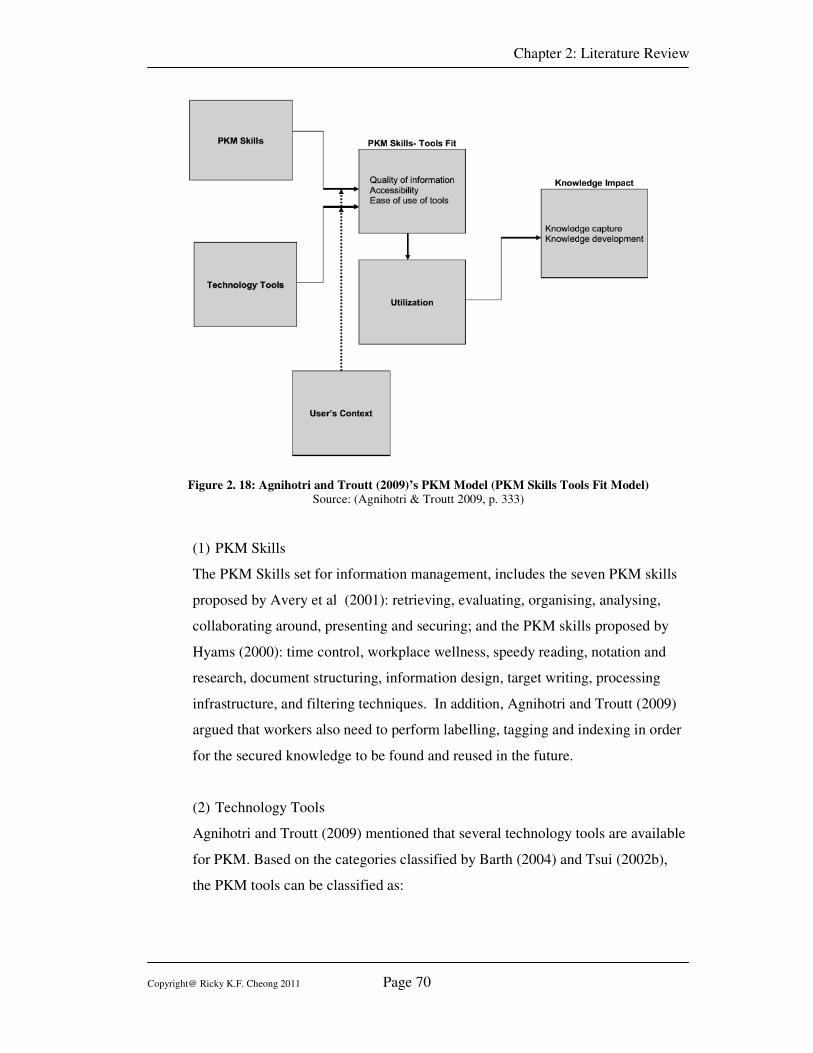
Chapter 2: Literature Review
Copyright@ Ricky K.F. Cheong 2011 Page 70
Figure 2. 18: Agnihotri and Troutt (2009)’s PKM Model (PKM Skills Tools Fit Model)
Source: (Agnihotri & Troutt 2009, p. 333)
(1) PKM Skills
The PKM Skills set for information management, includes the seven PKM skills
proposed by Avery et al (2001): retrieving, evaluating, organising, analysing,
collaborating around, presenting and securing; and the PKM skills proposed by
Hyams (2000): time control, workplace wellness, speedy reading, notation and
research, document structuring, information design, target writing, processing
infrastructure, and filtering techniques. In addition, Agnihotri and Troutt (2009)
argued that workers also need to perform labelling, tagging and indexing in order
for the secured knowledge to be found and reused in the future.
(2) Technology Tools
Agnihotri and Troutt (2009) mentioned that several technology tools are available
for PKM. Based on the categories classified by Barth (2004) and Tsui (2002b),
the PKM tools can be classified as:
Chapter 2: Literature Review
Copyright@ Ricky K.F. Cheong 2011 Page 71
(1) Index / Search Tools
(2) Meta-Search Tools
(3) Associative Links
(4) Concept / Mind Mapping
(5) Email management, analysis and unified messaging
(6) Voice recognition tools
(7) Collaboration and synchronisation tools
(8) Learning Tools
This classification is actually obsolete due to the technical advancement in recent
years. Updating of this model is the subject of further research by the author,
where collaborative and social software definitely play a key role in the revision
of this outdated model. Nevertheless, Agnihotri and Troutt (2009) argued that
these tools should not be the focal point, instead it is important to understand how
these tools and techniques can facilitate the process of finding the solutions for
knowledge worker’s needs. It should involve aligning and studying the PKM
skills and tools simultaneously.
(3) PKM Skills-Tools Fit
It is the core of Agnihotri and Troutt (2009)’s PKM model and is based on the
Task-Technology Fit (TTF) theory of Goodhue and Thompson (1995). The TTF
theory stated that there is a positive relationship between the available technology
tools and an individual’s performance; the technology must be utilised and have a
good fit with the tasks. In the context of PKM, there are three dimensions of the
PKM skills-tools fit; it is believed that an individual who tries to find meaning in
retrieved information and to integrate this information into their decision-making
process. As such, the following three dimensions were proposed to measure the
fit.
(1) Quality of information – to assess the proper interpretation of
information and transformation of this into knowledge.
(2) Accessibility of information – to assess if it is easily accessible to get
new information as well as the saved knowledge.
Chapter 2: Literature Review
Copyright@ Ricky K.F. Cheong 2011 Page 72
(3) Ease of use of tools – to assess the simplicity or complexity of the
technology used.
(4) User’s Context
The user’s context is referred to the “collection of relevant conditions and
surrounding influences that make a situation unique and comprehensible”
(Degler & Battle 2000). In PKM context, Schwarz (2006) outlined 8 user contexts
as below.
(1) Operational – active applications and services
(2) Organisational – current role of users, projects, department…etc.
(3) Environmental – location, present persons and used hardware,
(4) Historical – previous tasks
(5) Attentional – text scope.
(6) Behavioural – native operations, user actions
(7) Causal – task concepts(goals), tasks/workflow
(8) Informational – touched documents, relevant documents
Agnihotri and Troutt (2009) argued that the PKM skills-tools fit is moderated by
the user’s context.
(5) Utilisation and Knowledge Impact
Agnihotri and Troutt (2009) argued that if the tools can address the concerns of
the user in exercising the PKM skills, it is highly probable that the perceived
utility will be positively affected and there will be great improvement in terms of
utilisation of these PKM skills and tools. Therefore, this utilisation of PKM skills
and tools will lead to positive knowledge impact.
The roles of Agnihotri and Troutt (2009)’s PKM model in the four generic knowledge
management processes are summarised in table 2.8. The “PKM skills” were referenced to
the Avery et al. (2001)’s PKM model and therefore it was dealing with all four
knowledge management processes. The “technology tools” were mainly to deal with
locate/capture and share/transfer knowledge; the remaining model components were
focusing on the apply knowledge.
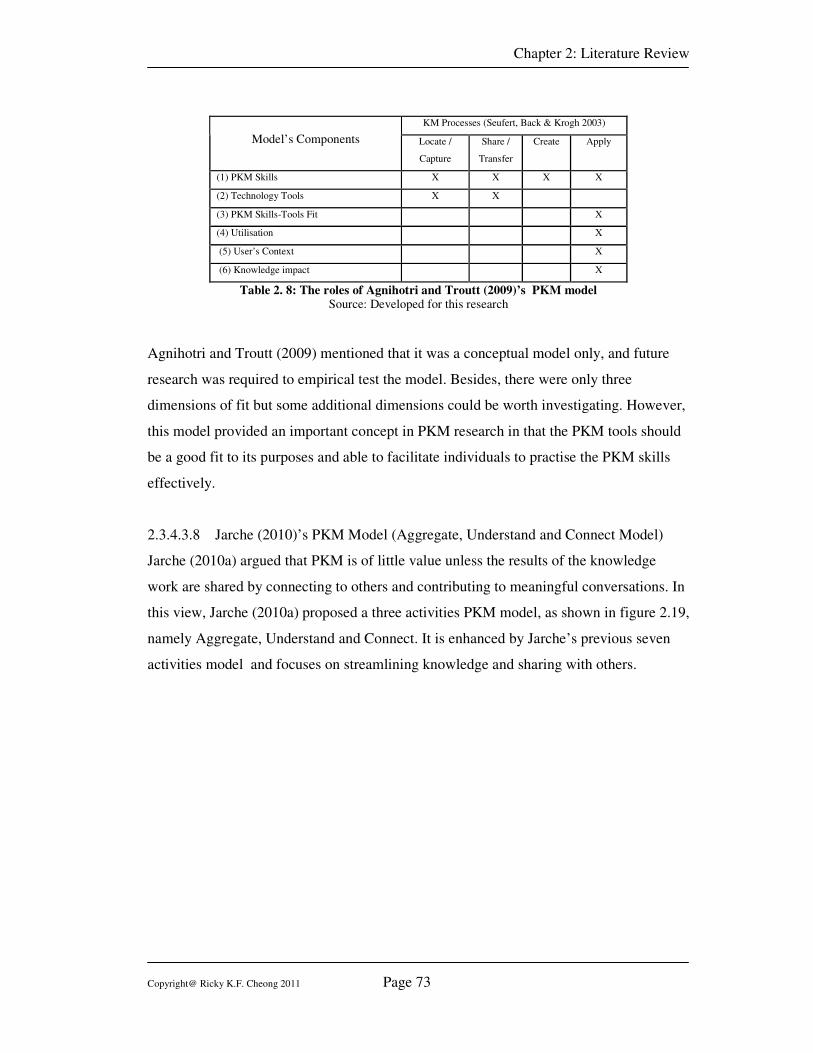
Chapter 2: Literature Review
Copyright@ Ricky K.F. Cheong 2011 Page 73
KM Processes (Seufert, Back & Krogh 2003)
Model’s Components Locate /
Capture
Share /
Transfer
Create Apply
(1) PKM Skills X X X X
(2) Technology Tools X X
(3) PKM Skills-Tools Fit X
(4) Utilisation X
(5) User’s Context X
(6) Knowledge impact X
Table 2. 8: The roles of Agnihotri and Troutt (2009)’s PKM model Source: Developed for this research
Agnihotri and Troutt (2009) mentioned that it was a conceptual model only, and future
research was required to empirical test the model. Besides, there were only three
dimensions of fit but some additional dimensions could be worth investigating. However,
this model provided an important concept in PKM research in that the PKM tools should
be a good fit to its purposes and able to facilitate individuals to practise the PKM skills
effectively.
2.3.4.3.8 Jarche (2010)’s PKM Model (Aggregate, Understand and Connect Model)
Jarche (2010a) argued that PKM is of little value unless the results of the knowledge
work are shared by connecting to others and contributing to meaningful conversations. In
this view, Jarche (2010a) proposed a three activities PKM model, as shown in figure 2.19,
namely Aggregate, Understand and Connect. It is enhanced by Jarche’s previous seven
activities model and focuses on streamlining knowledge and sharing with others.
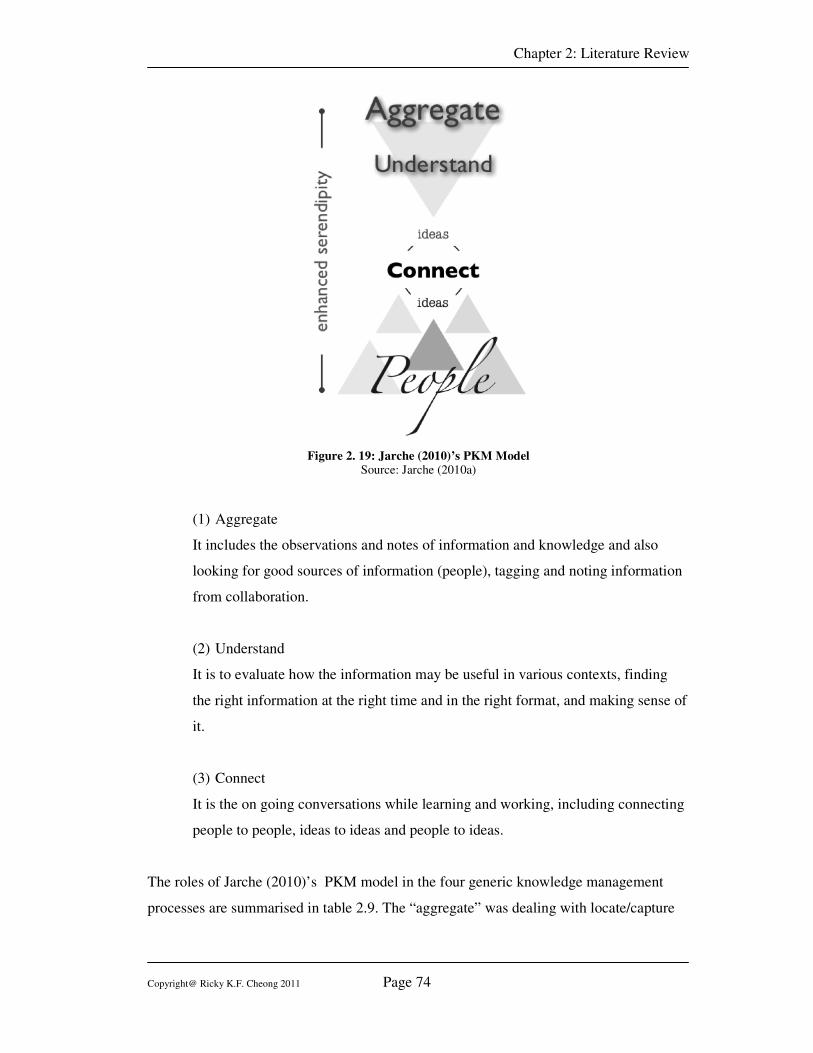
Chapter 2: Literature Review
Copyright@ Ricky K.F. Cheong 2011 Page 74
Figure 2. 19: Jarche (2010)’s PKM Model Source: Jarche (2010a)
(1) Aggregate
It includes the observations and notes of information and knowledge and also
looking for good sources of information (people), tagging and noting information
from collaboration.
(2) Understand
It is to evaluate how the information may be useful in various contexts, finding
the right information at the right time and in the right format, and making sense of
it.
(3) Connect
It is the on going conversations while learning and working, including connecting
people to people, ideas to ideas and people to ideas.
The roles of Jarche (2010)’s PKM model in the four generic knowledge management
processes are summarised in table 2.9. The “aggregate” was dealing with locate/capture
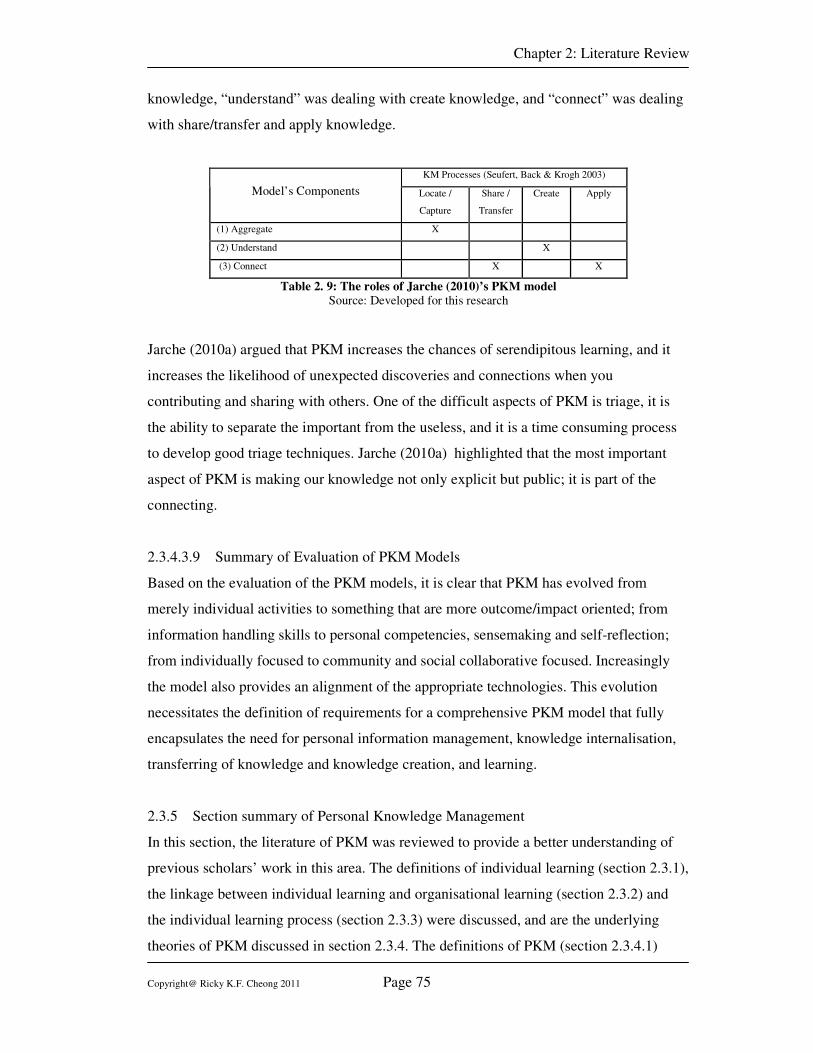
Chapter 2: Literature Review
Copyright@ Ricky K.F. Cheong 2011 Page 75
knowledge, “understand” was dealing with create knowledge, and “connect” was dealing
with share/transfer and apply knowledge.
KM Processes (Seufert, Back & Krogh 2003)
Model’s Components Locate /
Capture
Share /
Transfer
Create Apply
(1) Aggregate X
(2) Understand X
(3) Connect X X
Table 2. 9: The roles of Jarche (2010)’s PKM model
Source: Developed for this research
Jarche (2010a) argued that PKM increases the chances of serendipitous learning, and it
increases the likelihood of unexpected discoveries and connections when you
contributing and sharing with others. One of the difficult aspects of PKM is triage, it is
the ability to separate the important from the useless, and it is a time consuming process
to develop good triage techniques. Jarche (2010a) highlighted that the most important
aspect of PKM is making our knowledge not only explicit but public; it is part of the
connecting.
2.3.4.3.9 Summary of Evaluation of PKM Models
Based on the evaluation of the PKM models, it is clear that PKM has evolved from
merely individual activities to something that are more outcome/impact oriented; from
information handling skills to personal competencies, sensemaking and self-reflection;
from individually focused to community and social collaborative focused. Increasingly
the model also provides an alignment of the appropriate technologies. This evolution
necessitates the definition of requirements for a comprehensive PKM model that fully
encapsulates the need for personal information management, knowledge internalisation,
transferring of knowledge and knowledge creation, and learning.
2.3.5 Section summary of Personal Knowledge Management
In this section, the literature of PKM was reviewed to provide a better understanding of
previous scholars’ work in this area. The definitions of individual learning (section 2.3.1),
the linkage between individual learning and organisational learning (section 2.3.2) and
the individual learning process (section 2.3.3) were discussed, and are the underlying
theories of PKM discussed in section 2.3.4. The definitions of PKM (section 2.3.4.1)
Chapter 2: Literature Review
Copyright@ Ricky K.F. Cheong 2011 Page 76
were discussed and provided different scholars’ views on the meaning of PKM. The
development of PKM was discussed (section 2.3.4.2) since Frand and Hixon (1999) first
proposed a PKM model focused on personal information management to the recent
development focused on technology for PKM. Eight different PKM models were
evaluated (section 2.3.4.3) which provided in-depth understanding of the different
concepts, processes and the principles proposed by different PKM’s scholars in the past
few decades.
2.4 The Roles and Values of Personal Knowledge Management
The roles and values of PKM emerge as an immediate discipline in this research. This
section reviews and evaluates the related literature in order to develop a research model to
answer the research questions defined in chapter 1. The roles of PKM are discussed in
section 2.4.1, followed by the values of PKM in section 2.4.2.
As discussed in section 2.2.6, the Seufert, Back and Krogh (2003)’s knowledge
management processes (locate/capture, share/transfer, create and apply knowledge) were
adapted to develop the model in this research.
2.4.1 Roles of Personal Knowledge Management
In a previous section (section 2.3.4), eight different PKM models were evaluated. The
models and their corresponding roles in Seufert, Back and Krogh (2003)’s knowledge
management processes were analysed and summarised as shown in table 2.10.
• Frand and Hixon (1999)’s PKM Model (PIM Model) is mainly focused on
locating / capturing knowledge and applying knowledge.
• Avery et al. (2001)‘s PKM Model (PKM Skills Model) is a comprehensive model
which covers all four KM processes. It is also a generic PKM model and
influenced many scholars in their PKM research.
• Berman and Annexstein (2003)’s PKM Model (PK-Book Model) mainly focused
on locating / capturing knowledge.
• Efimova (2005)’s PKM Model (Individuals, Ideas and Communities Model)
mainly dealt with ideas generation and sharing. It lacks a role in applying
knowledge.
Chapter 2: Literature Review
Copyright@ Ricky K.F. Cheong 2011 Page 77
• Wright (2005)’s PKM Model (Competencies Model) is also a comprehensive
model which covers all four KM processes but it is mainly focused on problem
solving.
• Zuber-Skerritt (2005)’s PKM Model (Values and Actions Model) lacks a role to
capture/locate knowledge.
• Agnihotri and Troutt (2009)’s PKM Model (PKM Skill-Tools Fit model) covered
all four KM processes but the focus was in matching the skills and tools for PKM.
• Jarche (2010)’s PKM Model (Aggregate, Understand and Connect Model) lacks
a role to apply knowledge.
Based on the evaluation of the different PKM Models, the Avery et al. (2001)’s PKM
Model, Wright (2005)’s PKM Model and Agnihotri and Troutt (2009)’s PKM Model
(PKM Skills Tools Fit Model) are comprehensive models which cover all four generic
knowledge management processes as proposed by Seufert, Back and Krogh (2003).
Agnihotri and Troutt (2009)’s PKM Model (PKM Skills Tools Fit Model) mainly focused
on matching the tools to PKM skills and Wright (2005)’s PKM Model mainly focused on
problem solving.
In reviewing the purpose of this research to explore the roles and values of PKM, a
comprehensive and generic PKM model is required; therefore, the Avery et al. (2001)’s
PKM Model was adapted to develop the new research model.
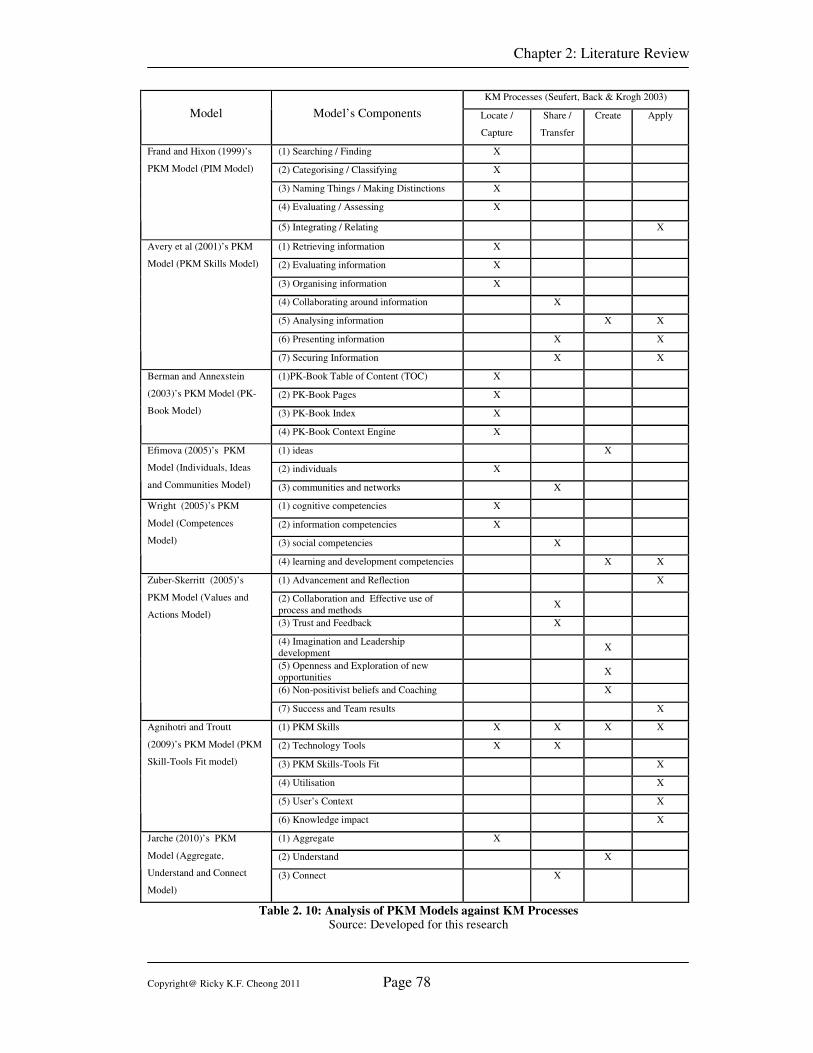
Chapter 2: Literature Review
Copyright@ Ricky K.F. Cheong 2011 Page 78
KM Processes (Seufert, Back & Krogh 2003)
Model Model’s Components Locate /
Capture
Share /
Transfer
Create Apply
(1) Searching / Finding X
(2) Categorising / Classifying X
(3) Naming Things / Making Distinctions X
(4) Evaluating / Assessing X
Frand and Hixon (1999)’s
PKM Model (PIM Model)
(5) Integrating / Relating X
(1) Retrieving information X
(2) Evaluating information X
(3) Organising information X
(4) Collaborating around information X
(5) Analysing information X X
(6) Presenting information X X
Avery et al (2001)’s PKM
Model (PKM Skills Model)
(7) Securing Information X X
(1)PK-Book Table of Content (TOC) X
(2) PK-Book Pages X
(3) PK-Book Index X
Berman and Annexstein
(2003)’s PKM Model (PK-
Book Model)
(4) PK-Book Context Engine X
(1) ideas X
(2) individuals X
Efimova (2005)’s PKM
Model (Individuals, Ideas
and Communities Model) (3) communities and networks X
(1) cognitive competencies X
(2) information competencies X
(3) social competencies X
Wright (2005)’s PKM
Model (Competences
Model)
(4) learning and development competencies X X
(1) Advancement and Reflection X
(2) Collaboration and Effective use of
process and methods
X
(3) Trust and Feedback X
(4) Imagination and Leadership
development
X
(5) Openness and Exploration of new
opportunities
X
(6) Non-positivist beliefs and Coaching X
Zuber-Skerritt (2005)’s
PKM Model (Values and
Actions Model)
(7) Success and Team results X
(1) PKM Skills X X X X
(2) Technology Tools X X
(3) PKM Skills-Tools Fit X
(4) Utilisation X
(5) User’s Context X
Agnihotri and Troutt
(2009)’s PKM Model (PKM
Skill-Tools Fit model)
(6) Knowledge impact X
(1) Aggregate X
(2) Understand X
Jarche (2010)’s PKM
Model (Aggregate,
Understand and Connect
Model)
(3) Connect X
Table 2. 10: Analysis of PKM Models against KM Processes Source: Developed for this research
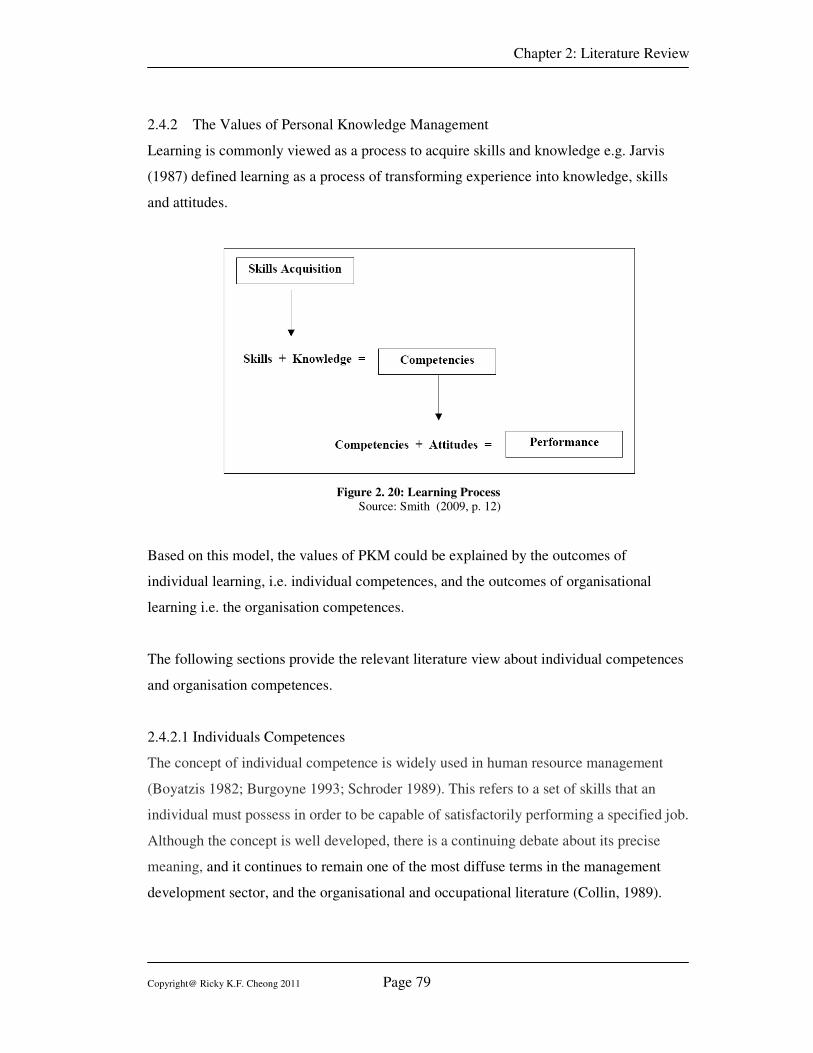
Chapter 2: Literature Review
Copyright@ Ricky K.F. Cheong 2011 Page 79
2.4.2 The Values of Personal Knowledge Management
Learning is commonly viewed as a process to acquire skills and knowledge e.g. Jarvis
(1987) defined learning as a process of transforming experience into knowledge, skills
and attitudes.
Figure 2. 20: Learning Process
Source: Smith (2009, p. 12)
Based on this model, the values of PKM could be explained by the outcomes of
individual learning, i.e. individual competences, and the outcomes of organisational
learning i.e. the organisation competences.
The following sections provide the relevant literature view about individual competences
and organisation competences.
2.4.2.1 Individuals Competences
The concept of individual competence is widely used in human resource management
(Boyatzis 1982; Burgoyne 1993; Schroder 1989). This refers to a set of skills that an
individual must possess in order to be capable of satisfactorily performing a specified job.
Although the concept is well developed, there is a continuing debate about its precise
meaning, and it continues to remain one of the most diffuse terms in the management
development sector, and the organisational and occupational literature (Collin, 1989).
Chapter 2: Literature Review
Copyright@ Ricky K.F. Cheong 2011 Page 80
Competence definition:
(1) Competence refers to a potential ability and / or a capability to function in a given
situation. Competency focuses on one’s actual performance in a situation. This
means that competence is required before one can expect to achieve competency
(Schroeter 2008).
(2) The Concise Oxford English Dictionary defines competence as “ability to do, for
a task” and (interestingly) as “sufficiency of means for living”.
(3) Streumer and Bjorkquist (1998) conclude that in the British literature competence
most often refers to an individual’s capability to perform tasks that have been
assigned to him.
(4) Cheetham and Chivers (2005) provide the general definition of competence:
competence is an effective overall performance within an occupation, which may
range from the basic level of proficiency through to the highest levels of
excellence (Cheetham & Chivers 2005, p. 54).
Many scholars have tried to define what competences are required for different types of
workers. Cheetham and Chivers (1996) proposed a holistic model of professional
competence which consists of four key components: (1) functional competence, (2)
personal or behaviour competence, (3) knowledge/cognitive competence and (4)
values/ethical competence.
(1) Functional competence
It is the ability to perform a range of work-based tasks effectively to produce
specific outcomes. This includes, and indeed requires, the passion of discrete
skills but the emphasis is on putting these to use to achieve specific outcomes.
(2) Personal or Behaviour competence
It is the ability to adopt appropriate, observable behaviours in work-related
situations.
Chapter 2: Literature Review
Copyright@ Ricky K.F. Cheong 2011 Page 81
(3) Knowledge / Cognitive competence
It is the possession of appropriate work-based knowledge and ability to put this to
effective use.
(4) Values / Ethical Competence
It is the possession of appropriate personal and professional values and the ability
to make sound judgments based upon these in work-related situations. The
linkage of ethical competence with values emphasises the point that values, like
knowledge, are of little use unless they are effectively applied. This ethical
competence refers to the effective and appropriate application of values in
professional settings.
Fleming (1991) argued that there are competences which work on other competences and
he defined these as Meta-Competence. It is the versatility to deal with a variety of
different problems by being able to draw on appropriate skills and knowledge in the
circumstances. Developing meta-competence is about lining subject-specific knowledge
with the particular competences that should be practised by the learner.
Fleming (1991) did not provide details about which competences are meta-competences
but Cheetham and Chivers (1996, 1998) argued that it should includes (1)
communication, (2) learning and self development, (3) creativity, (4) analysis, (5)
problem solving, (6) mental agility and (7) reflection. His revised professional
competence model is as shown in figure 2.21.
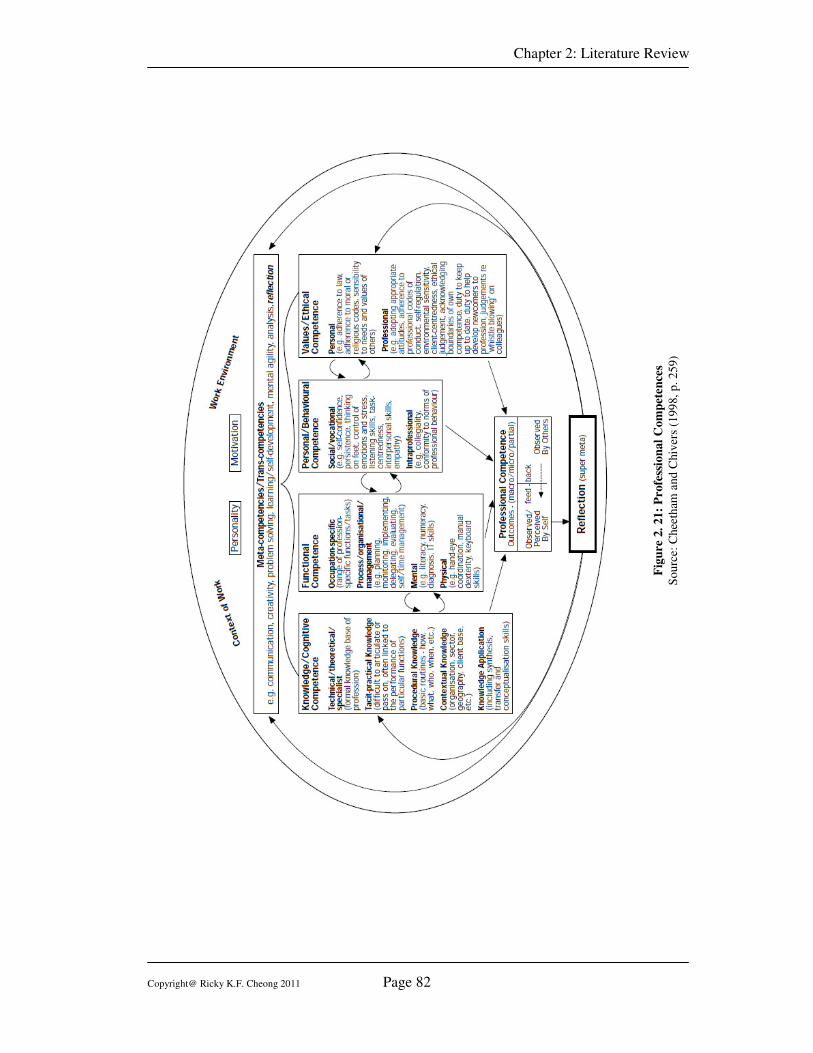
Chapter 2: Literature Review
Copyright@ Ricky K.F. Cheong 2011 Page 82
Fig
ure
2.
21:
Pro
fess
ion
al
Com
pet
en
ces
Sourc
e: C
hee
tham
and C
hiv
ers
(199
8,
p. 2
59)
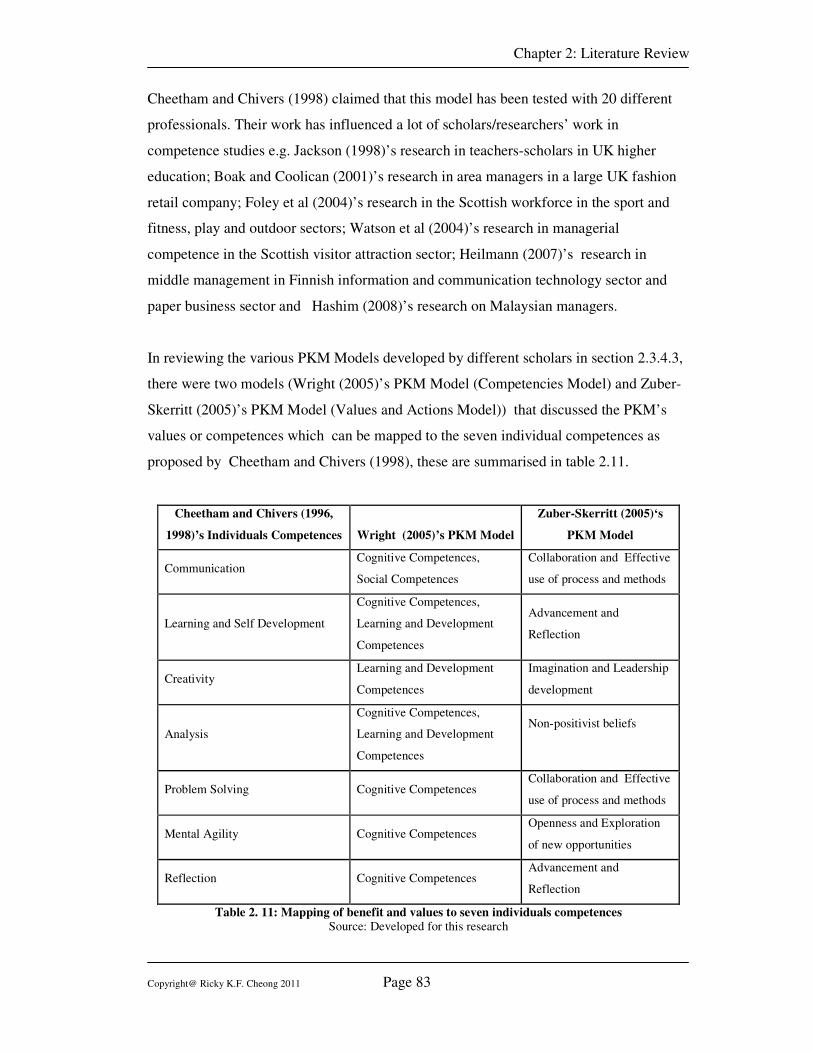
Chapter 2: Literature Review
Copyright@ Ricky K.F. Cheong 2011 Page 83
Cheetham and Chivers (1998) claimed that this model has been tested with 20 different
professionals. Their work has influenced a lot of scholars/researchers’ work in
competence studies e.g. Jackson (1998)’s research in teachers-scholars in UK higher
education; Boak and Coolican (2001)’s research in area managers in a large UK fashion
retail company; Foley et al (2004)’s research in the Scottish workforce in the sport and
fitness, play and outdoor sectors; Watson et al (2004)’s research in managerial
competence in the Scottish visitor attraction sector; Heilmann (2007)’s research in
middle management in Finnish information and communication technology sector and
paper business sector and Hashim (2008)’s research on Malaysian managers.
In reviewing the various PKM Models developed by different scholars in section 2.3.4.3,
there were two models (Wright (2005)’s PKM Model (Competencies Model) and Zuber-
Skerritt (2005)’s PKM Model (Values and Actions Model)) that discussed the PKM’s
values or competences which can be mapped to the seven individual competences as
proposed by Cheetham and Chivers (1998), these are summarised in table 2.11.
Cheetham and Chivers (1996,
1998)’s Individuals Competences Wright (2005)’s PKM Model
Zuber-Skerritt (2005)‘s
PKM Model
Communication Cognitive Competences,
Social Competences
Collaboration and Effective
use of process and methods
Learning and Self Development
Cognitive Competences,
Learning and Development
Competences
Advancement and
Reflection
Creativity Learning and Development
Competences
Imagination and Leadership
development
Analysis
Cognitive Competences,
Learning and Development
Competences
Non-positivist beliefs
Problem Solving Cognitive Competences Collaboration and Effective
use of process and methods
Mental Agility Cognitive Competences Openness and Exploration
of new opportunities
Reflection Cognitive Competences Advancement and
Reflection
Table 2. 11: Mapping of benefit and values to seven individuals competences
Source: Developed for this research
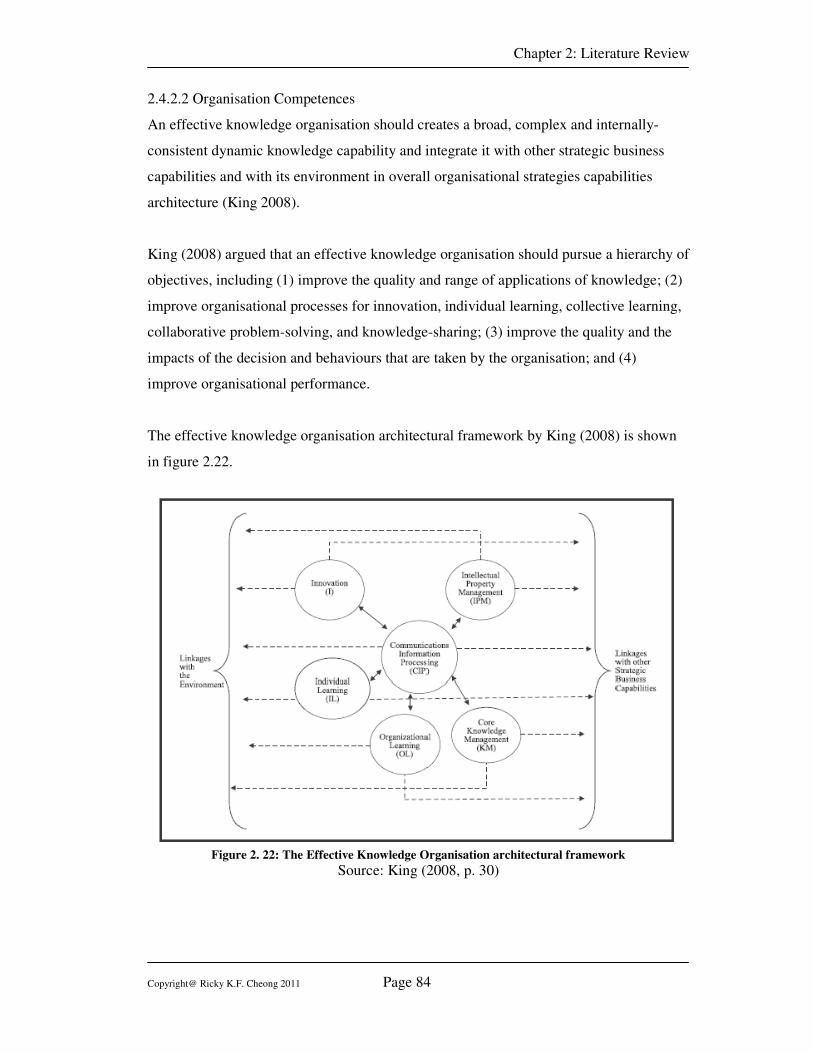
Chapter 2: Literature Review
Copyright@ Ricky K.F. Cheong 2011 Page 84
2.4.2.2 Organisation Competences
An effective knowledge organisation should creates a broad, complex and internally-
consistent dynamic knowledge capability and integrate it with other strategic business
capabilities and with its environment in overall organisational strategies capabilities
architecture (King 2008).
King (2008) argued that an effective knowledge organisation should pursue a hierarchy of
objectives, including (1) improve the quality and range of applications of knowledge; (2)
improve organisational processes for innovation, individual learning, collective learning,
collaborative problem-solving, and knowledge-sharing; (3) improve the quality and the
impacts of the decision and behaviours that are taken by the organisation; and (4)
improve organisational performance.
The effective knowledge organisation architectural framework by King (2008) is shown
in figure 2.22.
Figure 2. 22: The Effective Knowledge Organisation architectural framework
Source: King (2008, p. 30)
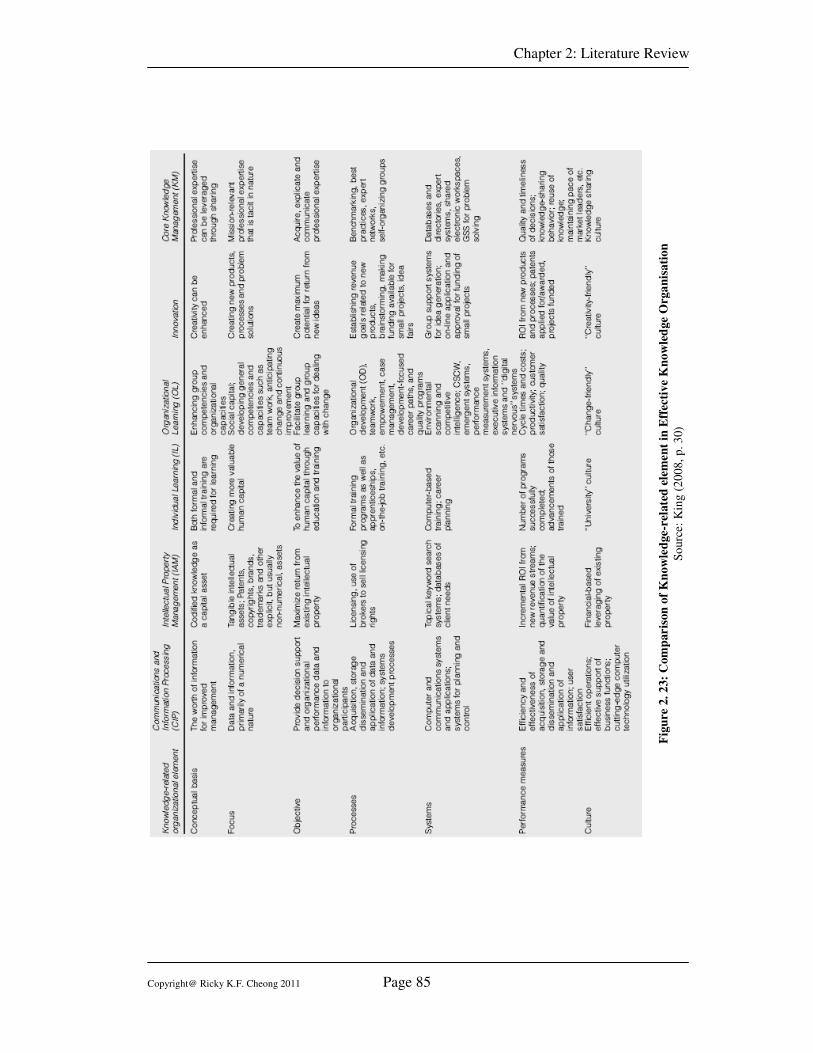
Chapter 2: Literature Review
Copyright@ Ricky K.F. Cheong 2011 Page 85
Fig
ure
2.
23:
Com
paris
on
of
Kn
ow
led
ge-
rela
ted
ele
men
t in
Eff
ecti
ve
Kn
ow
led
ge
Org
an
isati
on
So
urc
e: K
ing (
2008,
p. 3
0)
Chapter 2: Literature Review
Copyright@ Ricky K.F. Cheong 2011 Page 86
Nonaka and Takeuchi (1995) argued that in an effective knowledge organisation, the
knowledge acquired from external sources should be able to be shared widely within the
organisation, stored in the company’s knowledge database, and utilised by the staff to
develop new technologies, services and products. It requires a conversion process to
transform knowledge from outside to inside and back outside again in the form of new
products, services or systems. It requires continuous innovation which can lead to a
competitive advantage.
It is a challenge to measure the effectiveness of an effective knowledge organisation for
both the researcher and the manager. However, frameworks for measuring the
effectiveness of organisation are very mature and one of the models highly relevant to
knowledge organisation is the Organisational IQ (OIQ) framework proposed by
Mendelson and Ziegler (1999). Previous research by Mendelson and Ziegler have shown
that the OIQ is positively correlated to the firm performance, and the OIQ framework
consists of five keys indicator, namely (1) External Information Awareness, (2) Internal
Knowledge Dissemination, (3) Effective Decision Architecture, (4) Organisational Focus
and (5) Information-Age Business Network. Ziegler (2008) enhanced the framework to
replace the Information-Age Business Network by Continuous Innovation.
(1) External Information Awareness
The external information awareness measures the customer dynamics, technology
opportunities and competitive actions. Mendelson and Ziegler (1999) argued that
sharing knowledge within the organisation is important but it is not enough, and
the organisation must acquire knowledge from the outside world, i.e. external
learning at all levels.
(2) Internal Knowledge Dissemination
The internal knowledge dissemination measures the effective flow of information
horizontally, vertically (top down and bottom up) and reviews processes. To
encourage knowledge sharing, an organisation has to develop an effective
structure to allow the free flow of information (Mendelson & Ziegler 1999).
Chapter 2: Literature Review
Copyright@ Ricky K.F. Cheong 2011 Page 87
(3) Effective Decision Architecture
The effective decision architecture is to measure the decisions quality, decision
time and sense of ownership and accountability for decisions. The information or
knowledge required to make an effective decision may be located anywhere
within the organisation. The concern is the power diffusion throughout the
organisation so that if the decision maker has the knowledge required to make the
decision (Mendelson & Ziegler 1999).
(4) Organisational Focus
The organisational focus is to measure the scope of the business focus, core
competencies focus and simplification of processes. It means that organisations
can focus on their core competencies and let their business partners who have
complementary capabilities take care of the rest (Mendelson & Ziegler 1999).
(5) Continuous Innovation
Continuous innovation measures the creativity, product development and quality
improvement (Ziegler 2008). Mendelson and Ziegler (1999) argued that an
organisation should introduce new products and to develop new business on an
ongoing basis in order for the organisation to keep growing.
2.5 Chapter Conclusion
This chapter provides a critical literature review for this research, which includes the
literature on Knowledge Management, Personal Knowledge Management and the Roles
and Values of Personal Knowledge Management. In section 2.2, the definition of
knowledge and knowledge management, the DIKW knowledge hierarchy, the knowledge
conversion model and the knowledge management process were discussed. In section 2.3,
the definition of individual learning, the linkage between individual learning and
organisational learning, individual learning process, the definition of personal knowledge
management, the development of personal knowledge management and the evaluation of
different personal knowledge management models were discussed. Section 2.4, showed
the immediate discipline of this research which evaluated the roles of the previous PKM
models in the KM processes and also discussed the relevant literature concerning the
values of PKM in terms of individual competences and organisational competences.

Chapter 2: Literature Review
Copyright@ Ricky K.F. Cheong 2011 Page 88
These are the foundations for developing the theoretical model for this research,
discussed in next chapter.
Chapter 3: Research Design & Methodology
Copyright@ Ricky K.F. Cheong 2011 Page 89
CChhaapptteerr 33 -- RReesseeaarrcchh DDeessiiggnn aanndd
MMeetthhooddoollooggyy
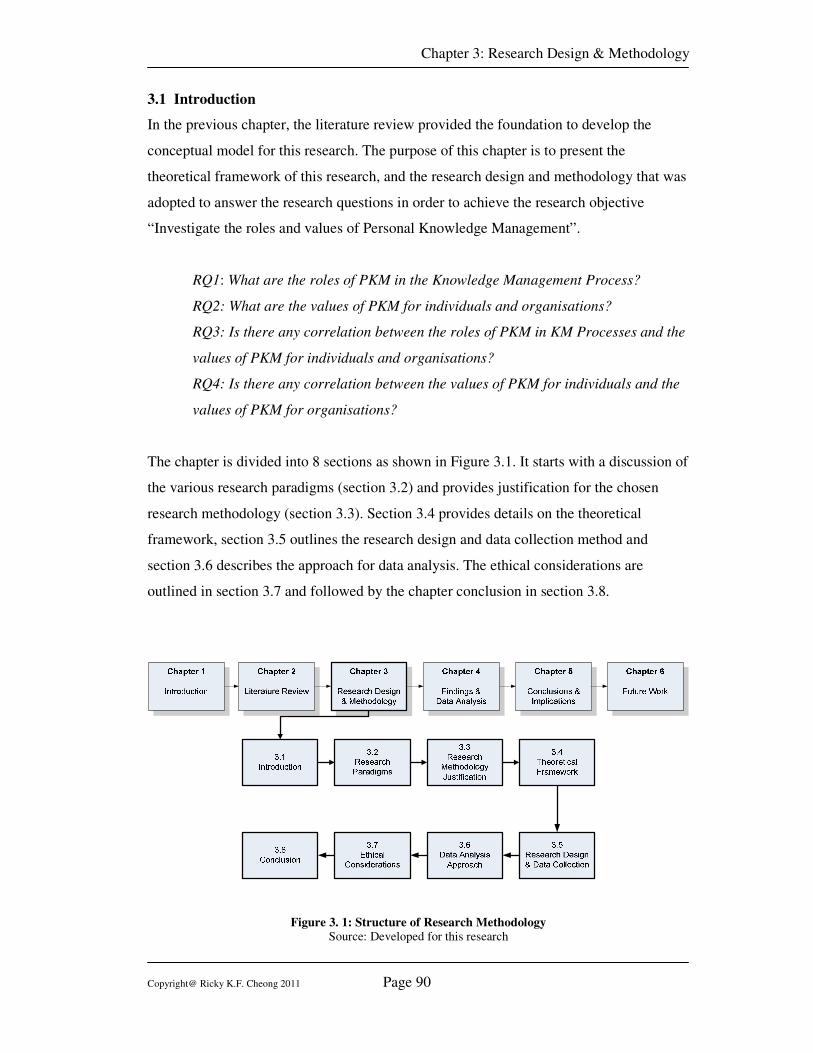
Chapter 3: Research Design & Methodology
Copyright@ Ricky K.F. Cheong 2011 Page 90
3.1 Introduction
In the previous chapter, the literature review provided the foundation to develop the
conceptual model for this research. The purpose of this chapter is to present the
theoretical framework of this research, and the research design and methodology that was
adopted to answer the research questions in order to achieve the research objective
“Investigate the roles and values of Personal Knowledge Management”.
RQ1: What are the roles of PKM in the Knowledge Management Process?
RQ2: What are the values of PKM for individuals and organisations?
RQ3: Is there any correlation between the roles of PKM in KM Processes and the
values of PKM for individuals and organisations?
RQ4: Is there any correlation between the values of PKM for individuals and the
values of PKM for organisations?
The chapter is divided into 8 sections as shown in Figure 3.1. It starts with a discussion of
the various research paradigms (section 3.2) and provides justification for the chosen
research methodology (section 3.3). Section 3.4 provides details on the theoretical
framework, section 3.5 outlines the research design and data collection method and
section 3.6 describes the approach for data analysis. The ethical considerations are
outlined in section 3.7 and followed by the chapter conclusion in section 3.8.
Figure 3. 1: Structure of Research Methodology
Source: Developed for this research
Chapter 3: Research Design & Methodology
Copyright@ Ricky K.F. Cheong 2011 Page 91
3.2 Research Paradigms
Research paradigms provide a general organising framework for theory and research that
includes the basic assumptions, key issues, models of quality research, and methods for
seeking answers (Neuman 2006). The research paradigms can be identified by three
different elements which are ontology, epistemology and methodology (Guba & Lincoln
1991; Healy & Perry 2000). Ontology is the branch of philosophy (of metaphysics) that is
concerned with issue of existence or being as such, i.e. the nature of the reality (Guba &
Lincoln 1991); epistemology is another branch of philosophy that deal with the origin,
nature and limits of human beings, and questions the relationship between the reality and
the researcher (Guba & Lincoln 1991); and the methodology is a more practical branch of
philosophy (of science) that deals with methods, systems, and rules for the conduct of an
inquiry (Guba & Lincoln 1991), and is the umbrella or collective concepts that together
combine to form a rigour research that is capable of being followed by another person not
involved in the research who can determine the value of the research (Burrell & Morgan
1979).
There are four main research paradigms namely Positivism, Realism, Critical Theory and
Constructivism (Guba & Lincoln 1994; Healy & Perry 2000; Perry, Riege & Brown
1999). Perry, Riege and Brown (1999) based their work on Guba and Lincoln (1994)’s
paper, and is summarised, in table 3.1, given the basic belief systems of the different
paradigms in regard to their position in ontology, epistemology and methodology.
3.2.1 Positivism
Positivism is the approach of natural sciences that it is a rigorous, exact measure and
objective research method (Neuman 2006). Ragin (1994) argued that the positivism is
viewed as condensing data to see the big picture. This paradigm is based on theory
testing, requiring precise quantitative data analysis to test hypotheses (Neuman 2006) and
to analyse the relationships between variables that are consistent across context, place and
time in order to explore the truth (Perry, Riege & Brown 1999). The researcher is
separate from the research process (Guba & Lincoln 1994; Healy & Perry 2000) and
maintains a value-free and theory-free position (Guba & Lincoln 1994; Neuman 2006).
Chapter 3: Research Design & Methodology
Copyright@ Ricky K.F. Cheong 2011 Page 92
3.2.2 Realism
Realism has elements of both positivism and constructivism and it concerns multiple
perceptions about a single, mind-independent reality (Healy & Perry 2000). Realism
believes that there is a real world to discover even it is only imperfectly apprehensible
(Guba & Lincoln 1994; Healy & Perry 2000). Healy and Perry (2000) mentioned that
Popper has summarised realism as a ‘real’ world which consists of abstract things that are
born of people’s minds but exist independently of any one person. It is largely
autonomous, though created by people. Krauss (2005) argued that realism recognises that
perceptions have a certain plasticity and that there are differences between reality and
people’s perceptions of reality
3.2.3 Critical Theory
Critical theory assumes apprehensive social realities, incorporating historically situated
structures and it aims to critique and transform social, political, cultural, economic, ethnic
and gender values (Perry, Riege & Brown 1999). Neuman (2006) mentioned that critical
theory research is to smash myths and empower people to change society. The researcher
acquires these realities based on the perceptions held by a group of individuals and the
research process is based on the researcher’s experience, expertise and organisational
abilities (Guba & Lincoln 1994).
3.2.4 Constructivism
Constructivism adopts relativism ontology and believes that truth is a construction which
refers to a particular belief system held in a particular context; it has multiple realities
which are socially and experientially based, intangible mental constructions of individual
persons (Perry, Riege & Brown 1999). Guba and Lincoln (1991) argued that the
constructivism believes that realities are ungoverned by any natural laws and truth is
defined as the best informed (amount and quality of information) and most sophisticated
(power with which the information is understood and used) construction on which there is
consensus (although there may be several constructions extant that simultaneously meet
that criterion). The researcher will interactively make a link between the research and the
perceptions of participants in order to create the findings (Guba & Lincoln 1994)
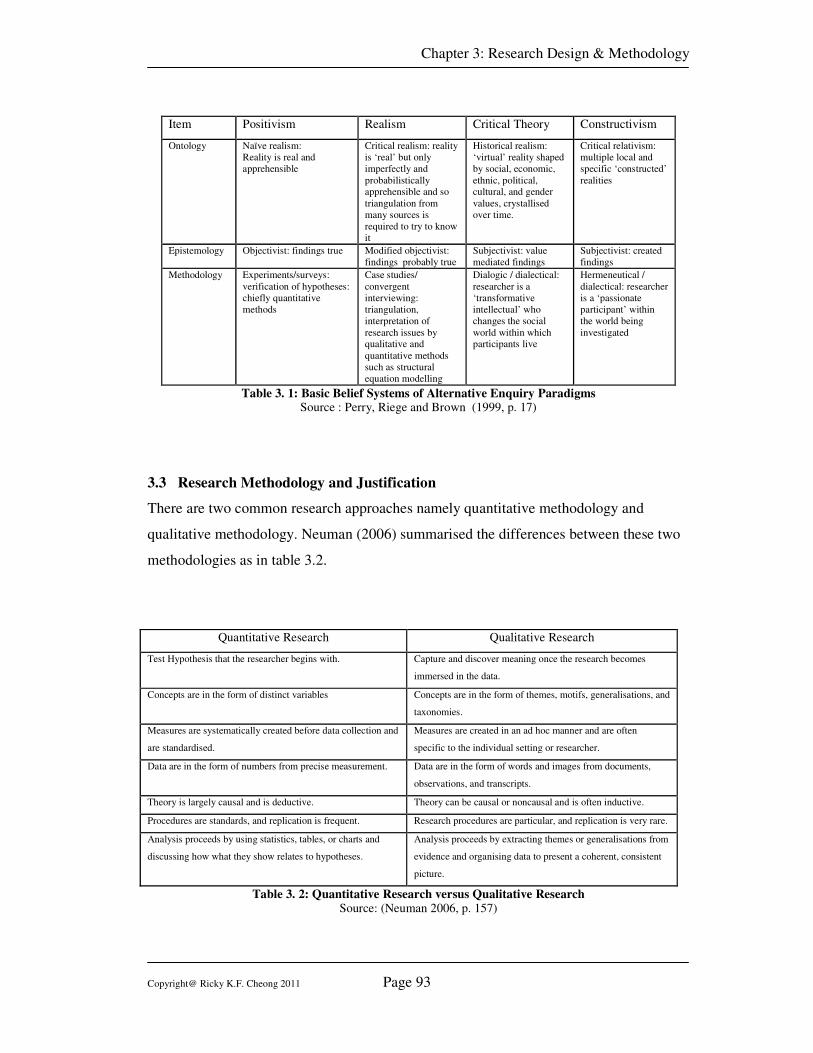
Chapter 3: Research Design & Methodology
Copyright@ Ricky K.F. Cheong 2011 Page 93
Item Positivism Realism Critical Theory Constructivism
Ontology Naïve realism:
Reality is real and
apprehensible
Critical realism: reality
is ‘real’ but only
imperfectly and
probabilistically apprehensible and so
triangulation from
many sources is
required to try to know
it
Historical realism:
‘virtual’ reality shaped
by social, economic,
ethnic, political, cultural, and gender
values, crystallised
over time.
Critical relativism:
multiple local and
specific ‘constructed’
realities
Epistemology Objectivist: findings true Modified objectivist:
findings probably true
Subjectivist: value
mediated findings
Subjectivist: created
findings
Methodology Experiments/surveys:
verification of hypotheses:
chiefly quantitative
methods
Case studies/
convergent
interviewing:
triangulation,
interpretation of
research issues by qualitative and
quantitative methods
such as structural
equation modelling
Dialogic / dialectical:
researcher is a
‘transformative
intellectual’ who
changes the social
world within which participants live
Hermeneutical /
dialectical: researcher
is a ‘passionate
participant’ within
the world being
investigated
Table 3. 1: Basic Belief Systems of Alternative Enquiry Paradigms Source : Perry, Riege and Brown (1999, p. 17)
3.3 Research Methodology and Justification
There are two common research approaches namely quantitative methodology and
qualitative methodology. Neuman (2006) summarised the differences between these two
methodologies as in table 3.2.
Quantitative Research Qualitative Research
Test Hypothesis that the researcher begins with. Capture and discover meaning once the research becomes
immersed in the data.
Concepts are in the form of distinct variables Concepts are in the form of themes, motifs, generalisations, and
taxonomies.
Measures are systematically created before data collection and
are standardised.
Measures are created in an ad hoc manner and are often
specific to the individual setting or researcher.
Data are in the form of numbers from precise measurement. Data are in the form of words and images from documents,
observations, and transcripts.
Theory is largely causal and is deductive. Theory can be causal or noncausal and is often inductive.
Procedures are standards, and replication is frequent. Research procedures are particular, and replication is very rare.
Analysis proceeds by using statistics, tables, or charts and
discussing how what they show relates to hypotheses.
Analysis proceeds by extracting themes or generalisations from
evidence and organising data to present a coherent, consistent
picture.
Table 3. 2: Quantitative Research versus Qualitative Research
Source: (Neuman 2006, p. 157)
Chapter 3: Research Design & Methodology
Copyright@ Ricky K.F. Cheong 2011 Page 94
3.3.1 Quantitative Methodology
Quantitative research is more concerned with design, measurement, and sampling
because the deductive approach emphasises on detailed planning prior the data collection
and analysis (Neuman 2006). It is a research approach following the positivism paradigm
and believes that science discovers a single apprehensible reality concerning the research
problem, and if the research is conducted correctly and is based on observation, the
resulting knowledge will be trustworthy (Lincoln & Guba 1985). It is opposite to the
qualitative research approach which seeks to establish reality through an inductive
approach in which phenomena are observed and conclusions drawn on the basis of the
deductive approach. Hence a conclusion is drawn on the basis of logical generalisation
about a known piece of information (Neuman 2006).
The deductive approach is underlying in quantitative research where a hypothesis is
deduced from theory, data is collected and analysed to confirm or discount the theory.
The deductive approach begin with abstract concepts or a theoretical proposition that
outlines the logical connection among concepts and then moves toward concrete,
empirical evidence (Neuman 2006). It is informally called the “top-down” approach and
the ultimately result of deductive approach can lead us to test the hypotheses with specific
data - a confirmation (or not) of our original theories (Trochim 2006).
A quantitative approach is often used for explanatory or causal research, having a focused
or specific research question, comparative large sample size and testing the theory
(Neuman 2006; Perry 1995; Zikmund 2000). Neuman (2006) also argued that quantitative
research is to measure objective facts, and the theory and data are separated. It is
independent of context and the quantitative researcher is detached from the research
context. The methods commonly employed by quantitative researchers include
interviews, surveys, observations, experiments, and the trustworthiness is achieved by
scientific testing of the data reliability and validity (Neuman 2006).
3.3.2 Qualitative Research Methodology
The qualitative research focuses on the issues of richness, texture, and feeling of raw data
because of the inductive approach emphasis in developing insights and generalisation out
of the data collected. It is a research methodology that often relies on interpretive or
Chapter 3: Research Design & Methodology
Copyright@ Ricky K.F. Cheong 2011 Page 95
critical social science, and it is an non-linear research approach and it applies logic in
practice (Neuman 2006).
Qualitative research has a number of characteristics which include: a focus on
interpretation rather than quantification; an emphasis on subjectivity rather than
objectivity; flexibility in the process of conducting research; an orientation towards the
process rather than the outcome; a concern with context regarding behaviour and situation
as being inextricably linked in forming experience; and finally, an explicit recognition of
the impacts of the research process on the research situation (Cassell & Symon 1994).
An inductive approach is underlying in qualitative research in which the theorising begins
with observing the empirical world and then reflecting on what is taking place, thinking
in increasingly more abstract ways, moving toward theoretical concepts and propositions
(Neuman 2006). Thomas (2003) mentioned that there are three purposes of the general
inductive approach which are to condense extensive and varied raw text data into a brief,
summary format; to establish clear links between research objectives and the summary
findings derived from the raw data and to ensure these links are both transparent and
defensible; to develop a model or theory about the underlying structure of experience or
processes which are evident in the text .
Qualitative research is often used for exploratory studies, and does not have a narrow
focus on specific questions, smaller sample size, and is useful for theory generation
(Neuman 2006; Perry 1995; Zikmund 2000). Neuman (2006) also argued that qualitative
research is to construct social reality and cultural meaning, focus on interactive processes
and events, fuse the theory and data. It is situational constrained and the research is
involved in the researched context. The method commonly employed by qualitative
researchers includes interviews, observations, focus groups, ethnography, case studies
and action research (Neuman 2006). The trustworthiness is achieved by focusing on
credibility, transferability , dependability and confirmability, as mentioned by Lincoln
and Guba (1985).
Chapter 3: Research Design & Methodology
Copyright@ Ricky K.F. Cheong 2011 Page 96
3.3.3 Justification of Selecting Quantitative Research Methodology
Based on the evaluation of the different research paradigms described in previous
sections and the basic belief systems of different paradigms summarised in table 3.1,
positivism was selected for this research due to the following reasons.
(1) The aim of this research is to investigate the roles and values of the PKM, and
it is believed that everyone is actually practising PKM even if they may not be
aware of it in a systematic view, the relationship between the roles and values
of PKM are a stable pre-existing pattern, consistent across time and context,
and it is discoverable by research. It is inline with the ontology position of
positivism as discussed in section 3.2.1.
(2) The purpose of this research is to find out a generalised theory to explain the
roles and values of PKM. The researcher has to stay objective and minimise
undue influences during the research process. It is inline with the
epistemology position of positivism as discussed in section 3.2.1.
(3) This research tests the theoretical model developed based on the previous
literature as discussed in the chapter 2. There are five main hypotheses to
explore the roles of PKM in knowledge management processes and their
correlations with their values at both individuals and organisations levels; it
focuses on the measurement and testing of theory. It involves a comparatively
large sample size, precise data analysis and requires quantitative methods. It is
inline with the nature and purpose of the quantitative approach as discussed in
section 3.3.1.
Based on the assessment of the ontology, epistemology and methodology as
recommended by various scholars e.g. Guba and Lincoln (1991) and Healy and Perry
(2000), the positivism research paradigm is justified. The quantitative methodology is
always associated to the positivism research paradigms while qualitative methodology is
usually associated to the interpretive / critical realism research paradigms (Neuman 2006;
Perry 1995). Therefore, quantitative research methodology was selected for this research.
Chapter 3: Research Design & Methodology
Copyright@ Ricky K.F. Cheong 2011 Page 97
3.4 The Theoretical Model
Based on the literature review in the previous sections, the conceptual model for this
research is developed as shown in figure 3.2. The model consists of four concepts which
are PKM skills, KM Process, PKM Values for the individual and PKM values for the
organisation.
The PKM skills are the underlying measurement of the roles in the KM Process and the
values of PKM for both individuals and organisations. There are seven PKM skills as
proposed by Avery et al.(2001): namely information retrieving skill (PKM1),
information evaluating skill (PKM2), information organising skill (PKM3), information
analysing skill (PKM4), collaborating around information skill (PKM5), information
presenting skill (PKM6) and information securing (PKM7).
The KM processes includes four interactive processes as suggested by Seufert, Back and
Korgh (2003, p. 112), which are locate / capture knowledge (KMC1), create knowledge
(KMC2), share / transfer knowledge (KMC3) and apply knowledge (KMC4).
The PKM values for individuals are measured by the seven individuals’ competences as
proposed Cheetham and Chivers (1996, 1998), namely communication (ICOMC),
creativity (ICREC), problem solving (IPBSC), learning / self development (ILSDC),
mental agility (IMEAC), analysis (IANAC) and reflecting (IREFC).
The PKM values for organisations are measured by the five organisation competences as
suggested by Mendelson and Ziegler (1999) and Ziegler (2008), and are external
information awareness (OEIAC), internal knowledge dissemination (OIKDC), effective
decision making (OEDMC), organisation focus (OORFC) and continuous innovation
(OCOIC).
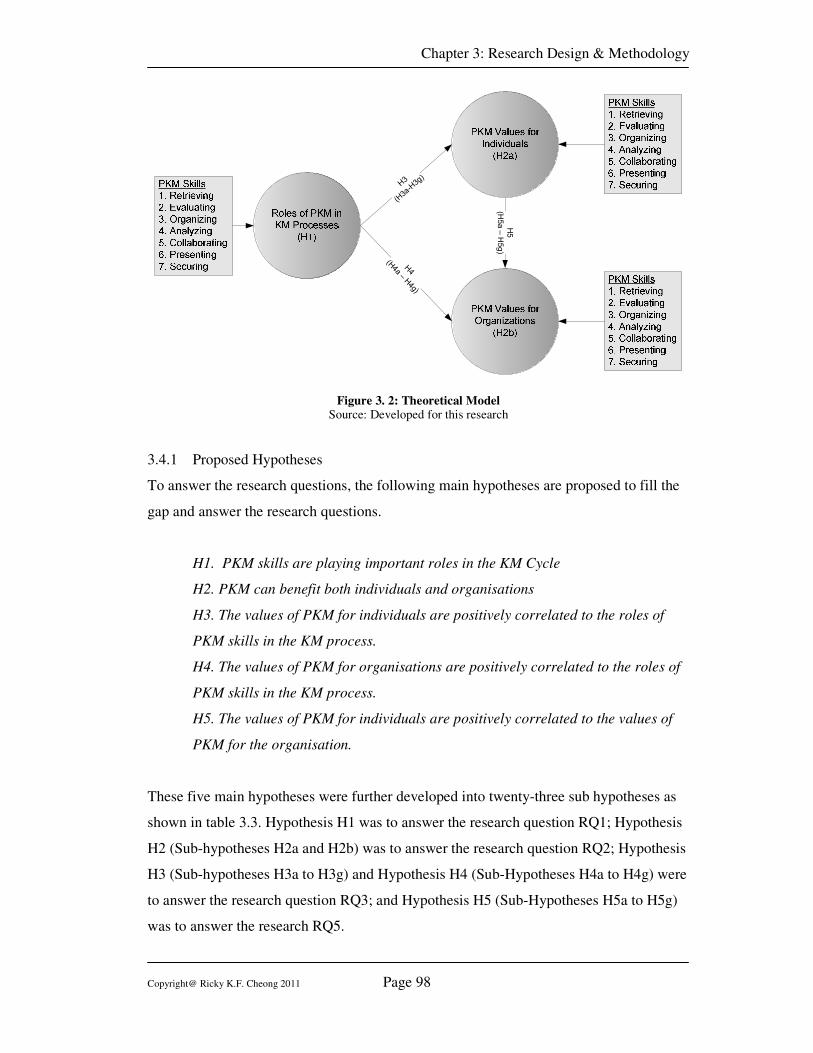
Chapter 3: Research Design & Methodology
Copyright@ Ricky K.F. Cheong 2011 Page 98
H5
(H5a – H5g)
H3
(H3a-H3g)
H4
(H4a – H
4g)
Figure 3. 2: Theoretical Model Source: Developed for this research
3.4.1 Proposed Hypotheses
To answer the research questions, the following main hypotheses are proposed to fill the
gap and answer the research questions.
H1. PKM skills are playing important roles in the KM Cycle
H2. PKM can benefit both individuals and organisations
H3. The values of PKM for individuals are positively correlated to the roles of
PKM skills in the KM process.
H4. The values of PKM for organisations are positively correlated to the roles of
PKM skills in the KM process.
H5. The values of PKM for individuals are positively correlated to the values of
PKM for the organisation.
These five main hypotheses were further developed into twenty-three sub hypotheses as
shown in table 3.3. Hypothesis H1 was to answer the research question RQ1; Hypothesis
H2 (Sub-hypotheses H2a and H2b) was to answer the research question RQ2; Hypothesis
H3 (Sub-hypotheses H3a to H3g) and Hypothesis H4 (Sub-Hypotheses H4a to H4g) were
to answer the research question RQ3; and Hypothesis H5 (Sub-Hypotheses H5a to H5g)
was to answer the research RQ5.
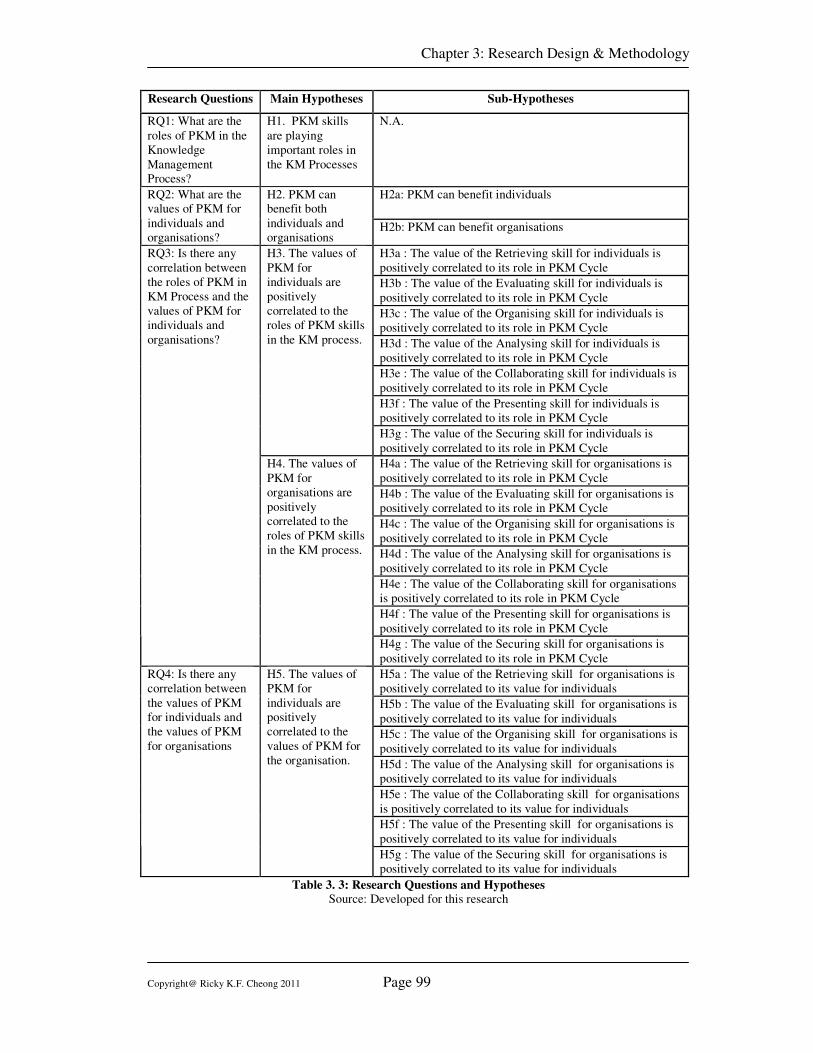
Chapter 3: Research Design & Methodology
Copyright@ Ricky K.F. Cheong 2011 Page 99
Research Questions Main Hypotheses Sub-Hypotheses
RQ1: What are the
roles of PKM in the
Knowledge
Management
Process?
H1. PKM skills
are playing
important roles in
the KM Processes
N.A.
H2a: PKM can benefit individuals RQ2: What are the
values of PKM for
individuals and
organisations?
H2. PKM can
benefit both
individuals and
organisations H2b: PKM can benefit organisations
H3a : The value of the Retrieving skill for individuals is
positively correlated to its role in PKM Cycle
H3b : The value of the Evaluating skill for individuals is
positively correlated to its role in PKM Cycle
H3c : The value of the Organising skill for individuals is
positively correlated to its role in PKM Cycle
H3d : The value of the Analysing skill for individuals is
positively correlated to its role in PKM Cycle
H3e : The value of the Collaborating skill for individuals is
positively correlated to its role in PKM Cycle
H3f : The value of the Presenting skill for individuals is
positively correlated to its role in PKM Cycle
H3. The values of
PKM for
individuals are
positively
correlated to the
roles of PKM skills
in the KM process.
H3g : The value of the Securing skill for individuals is
positively correlated to its role in PKM Cycle
H4a : The value of the Retrieving skill for organisations is
positively correlated to its role in PKM Cycle
H4b : The value of the Evaluating skill for organisations is
positively correlated to its role in PKM Cycle
H4c : The value of the Organising skill for organisations is
positively correlated to its role in PKM Cycle
H4d : The value of the Analysing skill for organisations is
positively correlated to its role in PKM Cycle
H4e : The value of the Collaborating skill for organisations
is positively correlated to its role in PKM Cycle
H4f : The value of the Presenting skill for organisations is
positively correlated to its role in PKM Cycle
RQ3: Is there any
correlation between
the roles of PKM in
KM Process and the
values of PKM for
individuals and
organisations?
H4. The values of
PKM for
organisations are
positively
correlated to the
roles of PKM skills
in the KM process.
H4g : The value of the Securing skill for organisations is
positively correlated to its role in PKM Cycle
H5a : The value of the Retrieving skill for organisations is
positively correlated to its value for individuals
H5b : The value of the Evaluating skill for organisations is
positively correlated to its value for individuals
H5c : The value of the Organising skill for organisations is
positively correlated to its value for individuals
H5d : The value of the Analysing skill for organisations is
positively correlated to its value for individuals
H5e : The value of the Collaborating skill for organisations
is positively correlated to its value for individuals
H5f : The value of the Presenting skill for organisations is
positively correlated to its value for individuals
RQ4: Is there any
correlation between
the values of PKM
for individuals and
the values of PKM
for organisations
H5. The values of
PKM for
individuals are
positively
correlated to the
values of PKM for
the organisation.
H5g : The value of the Securing skill for organisations is
positively correlated to its value for individuals
Table 3. 3: Research Questions and Hypotheses
Source: Developed for this research
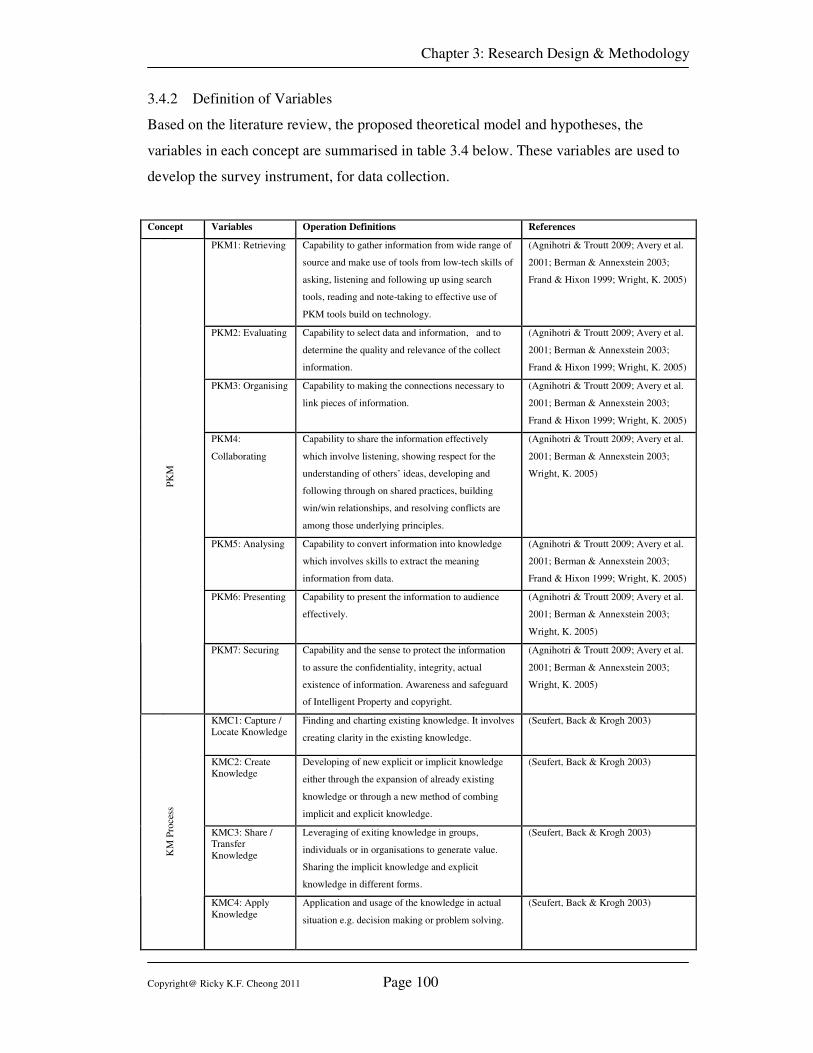
Chapter 3: Research Design & Methodology
Copyright@ Ricky K.F. Cheong 2011 Page 100
3.4.2 Definition of Variables
Based on the literature review, the proposed theoretical model and hypotheses, the
variables in each concept are summarised in table 3.4 below. These variables are used to
develop the survey instrument, for data collection.
Concept Variables Operation Definitions References
PKM1: Retrieving Capability to gather information from wide range of
source and make use of tools from low-tech skills of
asking, listening and following up using search
tools, reading and note-taking to effective use of
PKM tools build on technology.
(Agnihotri & Troutt 2009; Avery et al.
2001; Berman & Annexstein 2003;
Frand & Hixon 1999; Wright, K. 2005)
PKM2: Evaluating Capability to select data and information, and to
determine the quality and relevance of the collect
information.
(Agnihotri & Troutt 2009; Avery et al.
2001; Berman & Annexstein 2003;
Frand & Hixon 1999; Wright, K. 2005)
PKM3: Organising Capability to making the connections necessary to
link pieces of information.
(Agnihotri & Troutt 2009; Avery et al.
2001; Berman & Annexstein 2003;
Frand & Hixon 1999; Wright, K. 2005)
PKM4:
Collaborating
Capability to share the information effectively
which involve listening, showing respect for the
understanding of others’ ideas, developing and
following through on shared practices, building
win/win relationships, and resolving conflicts are
among those underlying principles.
(Agnihotri & Troutt 2009; Avery et al.
2001; Berman & Annexstein 2003;
Wright, K. 2005)
PKM5: Analysing Capability to convert information into knowledge
which involves skills to extract the meaning
information from data.
(Agnihotri & Troutt 2009; Avery et al.
2001; Berman & Annexstein 2003;
Frand & Hixon 1999; Wright, K. 2005)
PKM6: Presenting Capability to present the information to audience
effectively.
(Agnihotri & Troutt 2009; Avery et al.
2001; Berman & Annexstein 2003;
Wright, K. 2005)
PK
M
PKM7: Securing Capability and the sense to protect the information
to assure the confidentiality, integrity, actual
existence of information. Awareness and safeguard
of Intelligent Property and copyright.
(Agnihotri & Troutt 2009; Avery et al.
2001; Berman & Annexstein 2003;
Wright, K. 2005)
KMC1: Capture /
Locate Knowledge
Finding and charting existing knowledge. It involves
creating clarity in the existing knowledge.
(Seufert, Back & Krogh 2003)
KMC2: Create
Knowledge
Developing of new explicit or implicit knowledge
either through the expansion of already existing
knowledge or through a new method of combing
implicit and explicit knowledge.
(Seufert, Back & Krogh 2003)
KMC3: Share / Transfer
Knowledge
Leveraging of exiting knowledge in groups,
individuals or in organisations to generate value.
Sharing the implicit knowledge and explicit
knowledge in different forms.
(Seufert, Back & Krogh 2003)
KM
Pro
cess
KMC4: Apply
Knowledge
Application and usage of the knowledge in actual
situation e.g. decision making or problem solving.
(Seufert, Back & Krogh 2003)
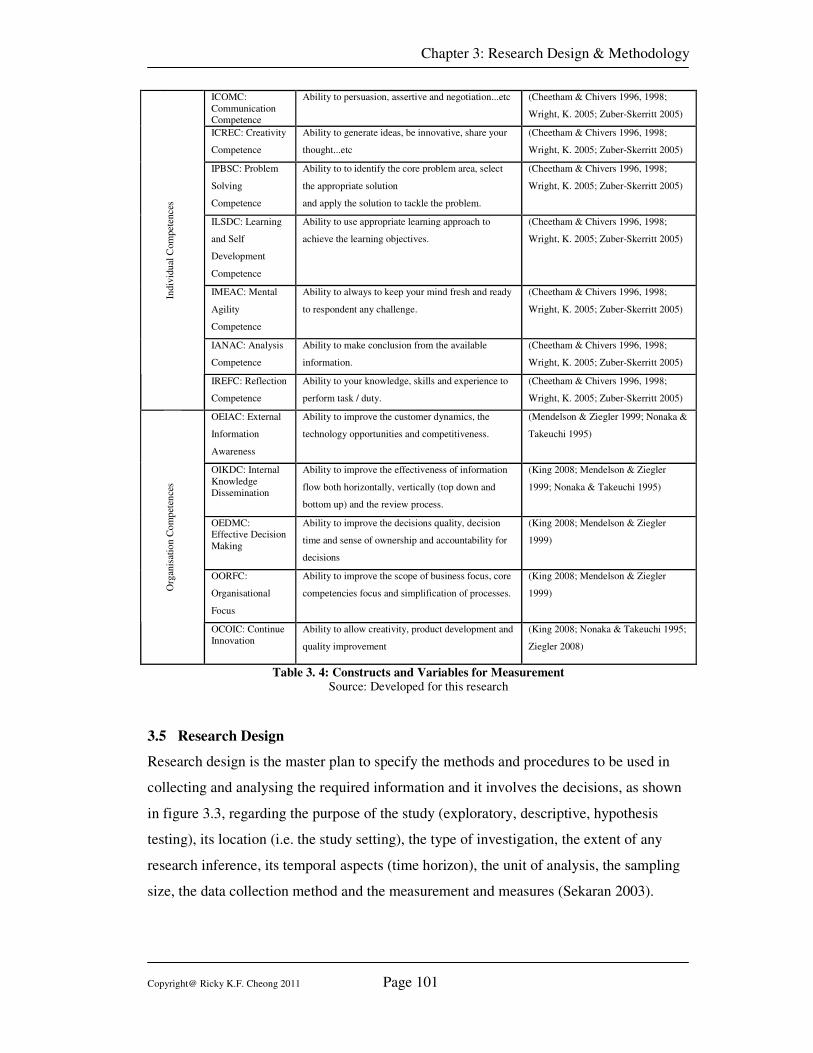
Chapter 3: Research Design & Methodology
Copyright@ Ricky K.F. Cheong 2011 Page 101
ICOMC:
Communication Competence
Ability to persuasion, assertive and negotiation...etc (Cheetham & Chivers 1996, 1998;
Wright, K. 2005; Zuber-Skerritt 2005)
ICREC: Creativity
Competence
Ability to generate ideas, be innovative, share your
thought...etc
(Cheetham & Chivers 1996, 1998;
Wright, K. 2005; Zuber-Skerritt 2005)
IPBSC: Problem
Solving
Competence
Ability to to identify the core problem area, select
the appropriate solution
and apply the solution to tackle the problem.
(Cheetham & Chivers 1996, 1998;
Wright, K. 2005; Zuber-Skerritt 2005)
ILSDC: Learning
and Self
Development
Competence
Ability to use appropriate learning approach to
achieve the learning objectives.
(Cheetham & Chivers 1996, 1998;
Wright, K. 2005; Zuber-Skerritt 2005)
IMEAC: Mental
Agility
Competence
Ability to always to keep your mind fresh and ready
to respondent any challenge.
(Cheetham & Chivers 1996, 1998;
Wright, K. 2005; Zuber-Skerritt 2005)
IANAC: Analysis
Competence
Ability to make conclusion from the available
information.
(Cheetham & Chivers 1996, 1998;
Wright, K. 2005; Zuber-Skerritt 2005)
Indiv
idu
al C
om
pet
ences
IREFC: Reflection
Competence
Ability to your knowledge, skills and experience to
perform task / duty.
(Cheetham & Chivers 1996, 1998;
Wright, K. 2005; Zuber-Skerritt 2005)
OEIAC: External
Information
Awareness
Ability to improve the customer dynamics, the
technology opportunities and competitiveness.
(Mendelson & Ziegler 1999; Nonaka &
Takeuchi 1995)
OIKDC: Internal
Knowledge
Dissemination
Ability to improve the effectiveness of information
flow both horizontally, vertically (top down and
bottom up) and the review process.
(King 2008; Mendelson & Ziegler
1999; Nonaka & Takeuchi 1995)
OEDMC: Effective Decision
Making
Ability to improve the decisions quality, decision
time and sense of ownership and accountability for
decisions
(King 2008; Mendelson & Ziegler
1999)
OORFC:
Organisational
Focus
Ability to improve the scope of business focus, core
competencies focus and simplification of processes.
(King 2008; Mendelson & Ziegler
1999)
Org
anis
atio
n C
om
pet
ence
s
OCOIC: Continue
Innovation
Ability to allow creativity, product development and
quality improvement
(King 2008; Nonaka & Takeuchi 1995;
Ziegler 2008)
Table 3. 4: Constructs and Variables for Measurement
Source: Developed for this research
3.5 Research Design
Research design is the master plan to specify the methods and procedures to be used in
collecting and analysing the required information and it involves the decisions, as shown
in figure 3.3, regarding the purpose of the study (exploratory, descriptive, hypothesis
testing), its location (i.e. the study setting), the type of investigation, the extent of any
research inference, its temporal aspects (time horizon), the unit of analysis, the sampling
size, the data collection method and the measurement and measures (Sekaran 2003).
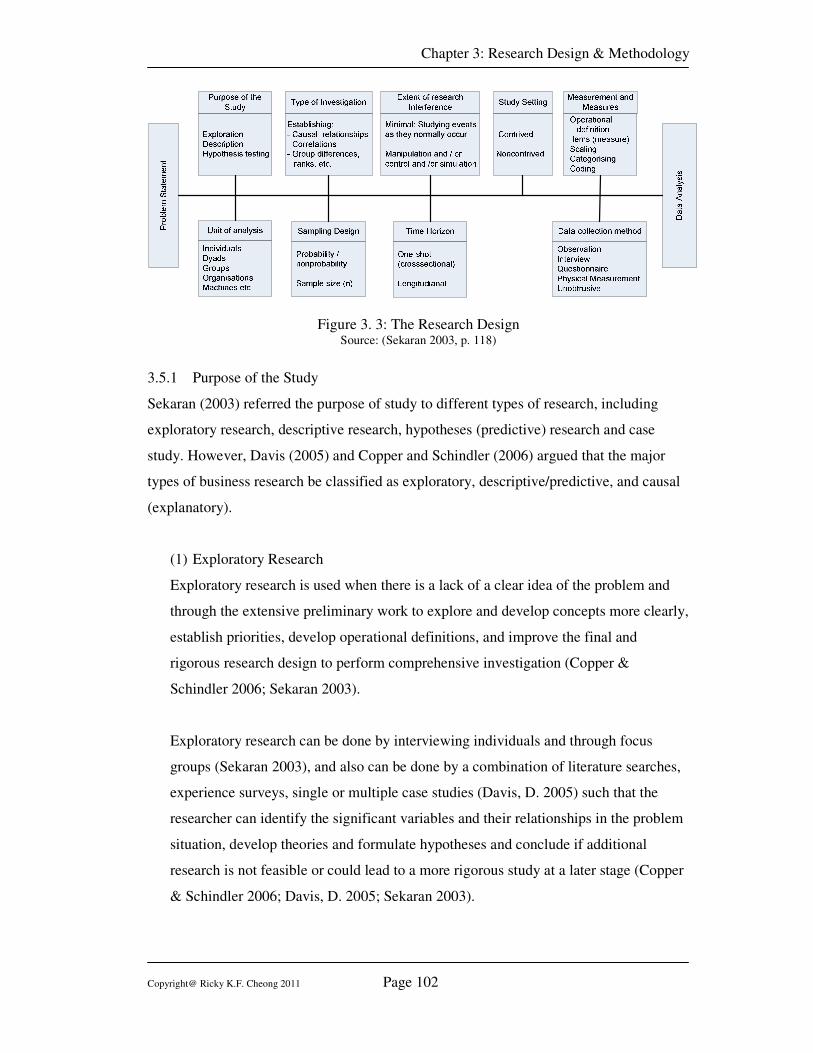
Chapter 3: Research Design & Methodology
Copyright@ Ricky K.F. Cheong 2011 Page 102
Figure 3. 3: The Research Design Source: (Sekaran 2003, p. 118)
3.5.1 Purpose of the Study
Sekaran (2003) referred the purpose of study to different types of research, including
exploratory research, descriptive research, hypotheses (predictive) research and case
study. However, Davis (2005) and Copper and Schindler (2006) argued that the major
types of business research be classified as exploratory, descriptive/predictive, and causal
(explanatory).
(1) Exploratory Research
Exploratory research is used when there is a lack of a clear idea of the problem and
through the extensive preliminary work to explore and develop concepts more clearly,
establish priorities, develop operational definitions, and improve the final and
rigorous research design to perform comprehensive investigation (Copper &
Schindler 2006; Sekaran 2003).
Exploratory research can be done by interviewing individuals and through focus
groups (Sekaran 2003), and also can be done by a combination of literature searches,
experience surveys, single or multiple case studies (Davis, D. 2005) such that the
researcher can identify the significant variables and their relationships in the problem
situation, develop theories and formulate hypotheses and conclude if additional
research is not feasible or could lead to a more rigorous study at a later stage (Copper
& Schindler 2006; Davis, D. 2005; Sekaran 2003).
Chapter 3: Research Design & Methodology
Copyright@ Ricky K.F. Cheong 2011 Page 103
(2) Descriptive Research
In contrast to exploratory study, descriptive research is typically structured with
clearly stated hypotheses or investigation questions, usually using standardised
questionnaires, to describe the characteristics of the variables of interest in a
particular situation (Copper & Schindler 2006; Davis, D. 2005; Sekaran 2003). The
goal of descriptive research is to offer the researcher a profile or to describe relevant
aspects of the phenomena of interest from an individual, organisation, industry-
oriented, or other perspective (Sekaran 2003).
Descriptive research is usually performed by quantitative analysis in terms of
frequencies, means, standard deviations, correlational studies, cross-tabulations …etc.
(Copper & Schindler 2006; Sekaran 2003).
(3) Causal Research
The causal research is done when it is necessary to establish a definitive cause-and-
effects relationship (Sekaran 2003). The concern of causal analysis is how one
variable affect or is responsible for changes in another variable, and their relationship
can be described as either symmetrical, reciprocal or asymmetrical (Copper &
Schindler 2006).
Davis (2005) argued that causal research is usually done by experimental design
which is either carried out as a field experiment (a realistic setting) or a laboratory
experiment (an artificial setting).
In this research, it is a combination of exploration, descriptive and causal (hypotheses
testing) study. The exploration study was first done by a comprehensive literature review
as discussed in chapter 2, the theoretical model was then developed and hypotheses were
formulated. The descriptive study was performed by questionnaires and rigorous
statistical analysis. The hypotheses testing was first performed by classical statistics
analysis, e.g. factor analysis, reliability test, correlations test and simple regression, and
followed by confirmatory analysis by structured equation modelling.
3.5.2 Type of Investigation
Chapter 3: Research Design & Methodology
Copyright@ Ricky K.F. Cheong 2011 Page 104
Davis (2005) mentioned that the type of investigation is either a causal or correlational
study. The causal study is done when it is necessary to establish a definitive cause-and-
effect relationship and correlational study is used when it is merely to identify the
important factors associated with the problem. Neuman (2006) mentioned that
correlational study seeks to establish the extent of a possible relationship between two or
more variables. For example, causal study can investigate if smoking causes cancer and
for correlational study can study if smoking and cancer are related (Davis, D. 2005).
In this research, the relationship between the roles and values of PKM was investigated; it
was not to study the absolute cause-and-effect relationship, instead it was to delineate the
importance associated between the roles and values. Therefore, correlation study has been
chosen for this research.
3.5.3 Extent of the researcher’s Interference
A correlation study is conducted in the natural environment with minimum interference
by the researcher on the normal flow of work (Sekaran 2003). The researcher should
collect the data without influencing the respondents and to analysis the data in an
objective manner in order to come up with the findings. In this research, as discussed in
the previous section, it is a correlations study and therefore minimum interference is
required. One of the most common approaches for collecting the data with minimum
interference is by using questionnaires and this is discussed in the data collection section
later.
3.5.4 Study Setting
The study setting is the environment within which the study is running, and it is important
to define how the data is collected and analysed. The study setting is either contrived or
non-contrived, and correlational studies are invariably conducted in non-contrived
settings (Sekaran 2003). The contrived setting is mainly for experiment study which
would be either a field study, e.g. in a factory, or a laboratory experiment study, e.g. in an
artificial laboratory environment.
In this research, the objective is to have generalisability of findings; therefore, the study
setting should be non-contrived and the researcher should be objective in collecting the
Chapter 3: Research Design & Methodology
Copyright@ Ricky K.F. Cheong 2011 Page 105
data and analysing the data. In addition, the targeted respondents should not be limited to
any particular geographic location, industry, age group, gender, working experience and
education …etc. The only criterion of the targeted respondents is they should have basic
understanding of knowledge management to ensure the respondents can understand and
answer the questions correctly. The growth of knowledge management in the past
decades has attracted a lot of people from different backgrounds to affiliate to various
knowledge management associations or societies and also to interest groups; therefore,
members of these bodies were candidates meeting all our criteria.
3.5.5 Unit of analysis
The unit of analysis refers to the level of aggregation of the data collected during the
subsequent data analysis stage (Davis, D. 2005). In this research, the PKM is the subject
of investigation which is at the individual level rather than a group of people or an
organisation. Although the benefit of PKM can be reflected at the organisation level,
individuals as the agents of organisational learning (Argyris, C. & Schon 1978) should be
able to reflect their experience in practicing PKM at both the individual and organisation
levels; therefore, the unit of analysis for this research was an individual.
3.5.6 Sampling Design
It is practically impossible to collect data from the entire population and a sample survey
is used. The sample survey allows gathering a sizeable amount of information from a
relatively large sample (Kerlinger 1992).
Zikmund (2003) provided several sampling methods that can be used by researchers,
including random sampling, probability sampling, stratified sampling, convenience
sampling, judgment sampling, quota sampling and snowball sampling. The sampling
methods can be divided into two major types: probability and non-probability.
Davis (2000) summarised different sampling methods as in table 3.5 and he also
suggested five considerations of sampling method: cost, accuracy, time, acceptance of
results and generalisability of results. The requirement of a targeted respondent was
discussed in section 3.5.4 so that members of knowledge management associations or
societies and interest groups are appropriate respondents. Simple random sampling within
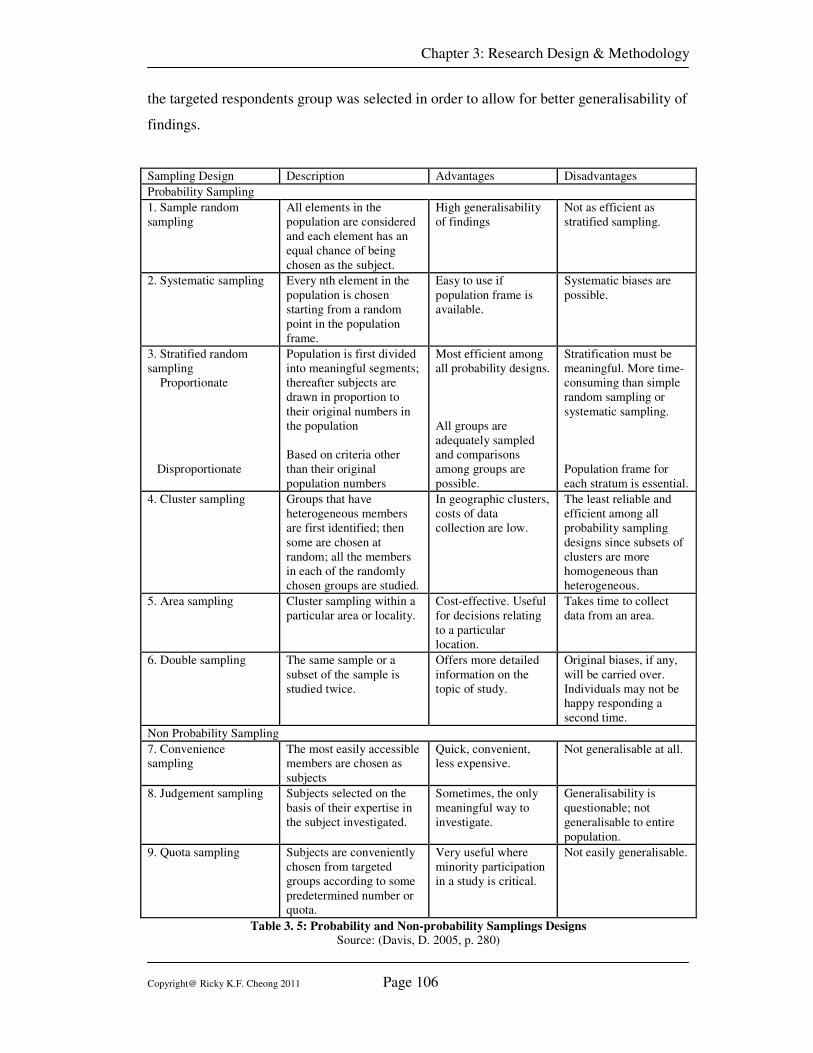
Chapter 3: Research Design & Methodology
Copyright@ Ricky K.F. Cheong 2011 Page 106
the targeted respondents group was selected in order to allow for better generalisability of
findings.
Sampling Design Description Advantages Disadvantages
Probability Sampling
1. Sample random
sampling
All elements in the
population are considered
and each element has an
equal chance of being
chosen as the subject.
High generalisability
of findings
Not as efficient as
stratified sampling.
2. Systematic sampling Every nth element in the
population is chosen
starting from a random
point in the population
frame.
Easy to use if
population frame is
available.
Systematic biases are
possible.
3. Stratified random
sampling
Proportionate
Disproportionate
Population is first divided
into meaningful segments;
thereafter subjects are
drawn in proportion to
their original numbers in
the population
Based on criteria other
than their original
population numbers
Most efficient among
all probability designs.
All groups are
adequately sampled
and comparisons
among groups are
possible.
Stratification must be
meaningful. More time-
consuming than simple
random sampling or
systematic sampling.
Population frame for
each stratum is essential.
4. Cluster sampling Groups that have
heterogeneous members
are first identified; then
some are chosen at
random; all the members
in each of the randomly
chosen groups are studied.
In geographic clusters,
costs of data
collection are low.
The least reliable and
efficient among all
probability sampling
designs since subsets of
clusters are more
homogeneous than
heterogeneous.
5. Area sampling Cluster sampling within a
particular area or locality.
Cost-effective. Useful
for decisions relating
to a particular
location.
Takes time to collect
data from an area.
6. Double sampling The same sample or a
subset of the sample is
studied twice.
Offers more detailed
information on the
topic of study.
Original biases, if any,
will be carried over.
Individuals may not be
happy responding a
second time.
Non Probability Sampling
7. Convenience
sampling
The most easily accessible
members are chosen as
subjects
Quick, convenient,
less expensive.
Not generalisable at all.
8. Judgement sampling Subjects selected on the
basis of their expertise in
the subject investigated.
Sometimes, the only
meaningful way to
investigate.
Generalisability is
questionable; not
generalisable to entire
population.
9. Quota sampling Subjects are conveniently
chosen from targeted
groups according to some
predetermined number or
quota.
Very useful where
minority participation
in a study is critical.
Not easily generalisable.
Table 3. 5: Probability and Non-probability Samplings Designs
Source: (Davis, D. 2005, p. 280)
Chapter 3: Research Design & Methodology
Copyright@ Ricky K.F. Cheong 2011 Page 107
3.4.6.1 Sampling Size
The sampling size affects the precision and confidence level of the research. Roscoe
(1975) proposed four rules of thumb for determining sample size: (1) the size of sample
that is appropriate for most research is between 30 to 500 samples, (2) a minimum
sample size of 30 is necessary for each sub-group when samples are broken into sub-
samples, (3) in multivariate research, the sample size should be several times as large as
the number of variables in the study, (4) sample size as small as 10 to 20 is possible for
the simple experimental research with tight experimental control.
The sampling size number can also be calculated by Cochran’s sample size formula as
below.
N0 = t2 x s
2 / d
2
Where t = 1.96 for the 0.05 alpha level
s = 0.83 for a 5 point scale and 6 standard deviations
d = 0.15 for a 5 point scale and an 0.03 margin of error
Therefore, the sample size required is N0 = (1.96)2 x (0.83)
2 / (0.15)
2 = 118
Based on the Cochran’s formula, the minimum sampling size is 118. However, there are
up to 21 variables in the research model, and the target sample size would be better 10
times (Roscoe, 1975; Barlett et al, 2001) the variables and therefore the target sample size
in this research is 210. This size (>200) is also appropriate for Structural Equation
Modelling (SEM) analysis by maximum likelihood estimation (Byrne 2010; Kline 2005).
3.5.7 One-shot or Longitudinal study (Time Horizon)
The study can be done either just one time or over a period of time, called one-shot or
cross sectional study, and in the case of the longitudinal study, the data is collected more
than one time, to study the effect of change (Sekaran 2003). In this research, one-shot
study was selected; it was to collect the respondents’ experience of their role of PKM
applied in their individual knowledge management processes and the perceived values or
Chapter 3: Research Design & Methodology
Copyright@ Ricky K.F. Cheong 2011 Page 108
their experience that the benefit of PKM in improving their competences at both the
individual and organisation levels.
3.5.8 Data Collection Method
Sekaran (2003) mentioned that the common data collection methods are interview,
observation and survey by questionnaire. Interview is a conversation with a purpose
(Berg 2004) and data can be captured in the form of informants’ speech, appearance,
attitude and emotion. Open-end questions are always asked during the interview with
follow up questions. It allows in-depth communications to be established (Patton 2002).
Observation involves paying close attention, watching, and listening carefully (Neuman
2006). In additional to looking at the physical surroundings, the researcher will observe
people and their actions, noting each person’s observable characteristics: age, sex, race,
and stature (Neuman 2006). Both interview and observation are used by qualitative
research, and for quantitative research a questionnaire survey is commonly used. A
questionnaire is a pre-formulated written set of questions to which respondents record
their answers, normally using closed ended questions (Sekaran 2003). Survey by
questionnaire has advantages when there are many questions that have to be obtained and
the respondents are geographically dispersed; therefore, a questionnaire survey is selected
in this research.
3.5.8.1 Survey Administration
Traditionally, the method for the administration of a questionnaire consists of face-to-
face, mail and telephone. Recently, the web-based / online survey is very popular. This
section evaluates these four different types of survey methods and selects the appropriate
one for this research.
(1) Fact-to-face Survey
Dillmam (1978) viewed that a face-to-face survey has the advantages of high
response rate as it allows long and complex questionnaires and avoids missing
data. It also allows the interviewer to observe the respondent’s reactions to the
questions (Neuman 2006). However, the disadvantage of a face-to-face survey
that it is very time consuming and the cost is very high. Besides, a face-to-face
survey may introduce bias due to the respondent’s or interviewer’s characteristics,
such as the appearance, tone and voice (Neuman 2006).
Chapter 3: Research Design & Methodology
Copyright@ Ricky K.F. Cheong 2011 Page 109
(2) Telephone survey
A telephone survey is another popular survey type and may be thought as a
compromise between a mail survey and a face-to-face survey and therefore
combines many advantages of each type (Sekaran 2000). This method has a high
response rate (Dillmam 1978; Neuman 2006) and it almost guarantees an
immediate response(Neuman 2006). However, it may not always be convenient to
the respondent to answer the questions at the time of calling, or not suitable for a
long questionnaire with boring questions; and therefore the control of completing
the questions may have problem (Dillmam 1978) . Same as face-to-face
interviews, it may introduce bias by the respondent’s and interviewer’s
characteristics and the cost to implement the survey is also high. Therefore, it is
also inappropriate to use a telephone survey in this research.
(3) Mail survey
A mail survey sends the questionnaire directly to the respondent and it is by far
the cheapest type of survey (Neuman 2006). As this type of survey has no direct
contact with the respondent, it can eliminate the bias from the interviewer’s and
respondent’s characteristics (Dillmam 1978; Neuman 2006). Besides, it is an
excellent survey method to have accuracy on sensitive data (Davis, D. 2005). It
can allow the respondent to have more time to collect the information in order to
answer the questions. However, the down size of this type of survey is the low
response rate. Although Dillmam (1978) rated that the response rate for this
method is good, previous experience has shown it is not the case. Sekaran (2003)
stated that return rates of mail questionnaires are typically low, and 30% response
rate is considered acceptable. However, the response rate can be improved by
good planning and it is still the most popular method of survey. Therefore, it is
selected for this research.
(4) Online Survey
Recently, a lot of surveys are done by Internet based methods e.g. web
questionnaire or email. Davis (2005) stated that it is excellent in controlling
interview effects, very good in time needed, good in flexibility, anonymity of
respondents, and accuracy on sensitive data. Neuman (2006) stated that the
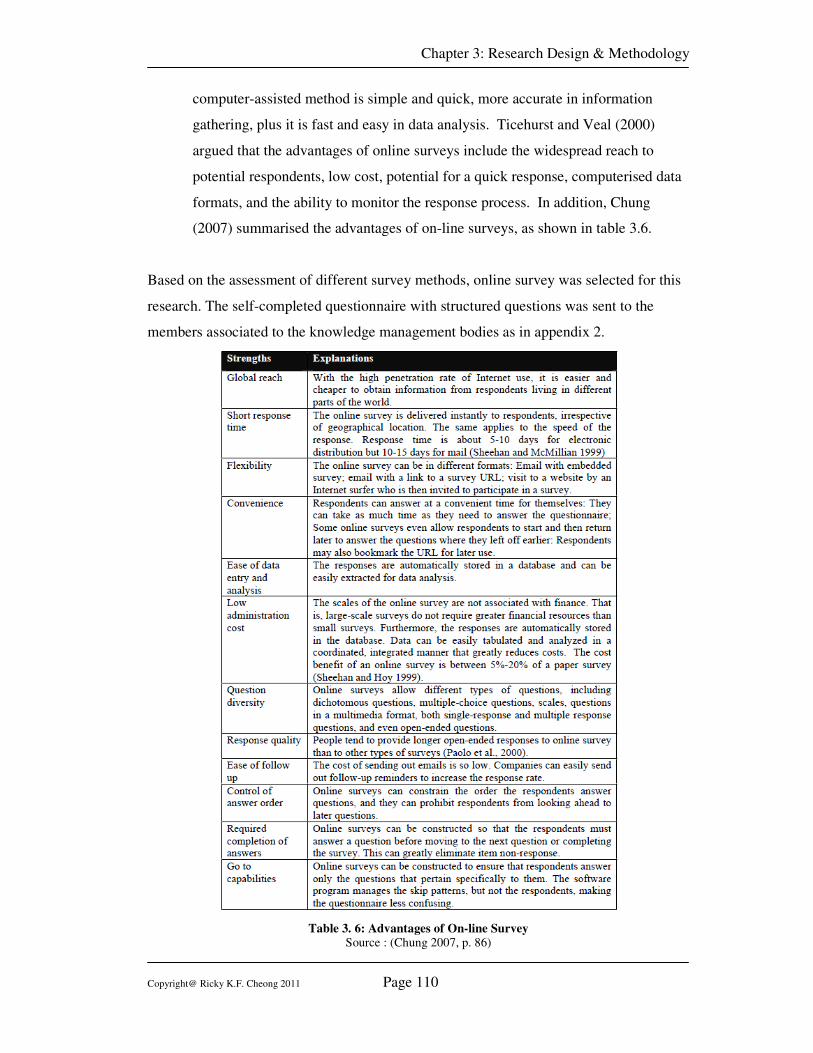
Chapter 3: Research Design & Methodology
Copyright@ Ricky K.F. Cheong 2011 Page 110
computer-assisted method is simple and quick, more accurate in information
gathering, plus it is fast and easy in data analysis. Ticehurst and Veal (2000)
argued that the advantages of online surveys include the widespread reach to
potential respondents, low cost, potential for a quick response, computerised data
formats, and the ability to monitor the response process. In addition, Chung
(2007) summarised the advantages of on-line surveys, as shown in table 3.6.
Based on the assessment of different survey methods, online survey was selected for this
research. The self-completed questionnaire with structured questions was sent to the
members associated to the knowledge management bodies as in appendix 2.
Table 3. 6: Advantages of On-line Survey
Source : (Chung 2007, p. 86)
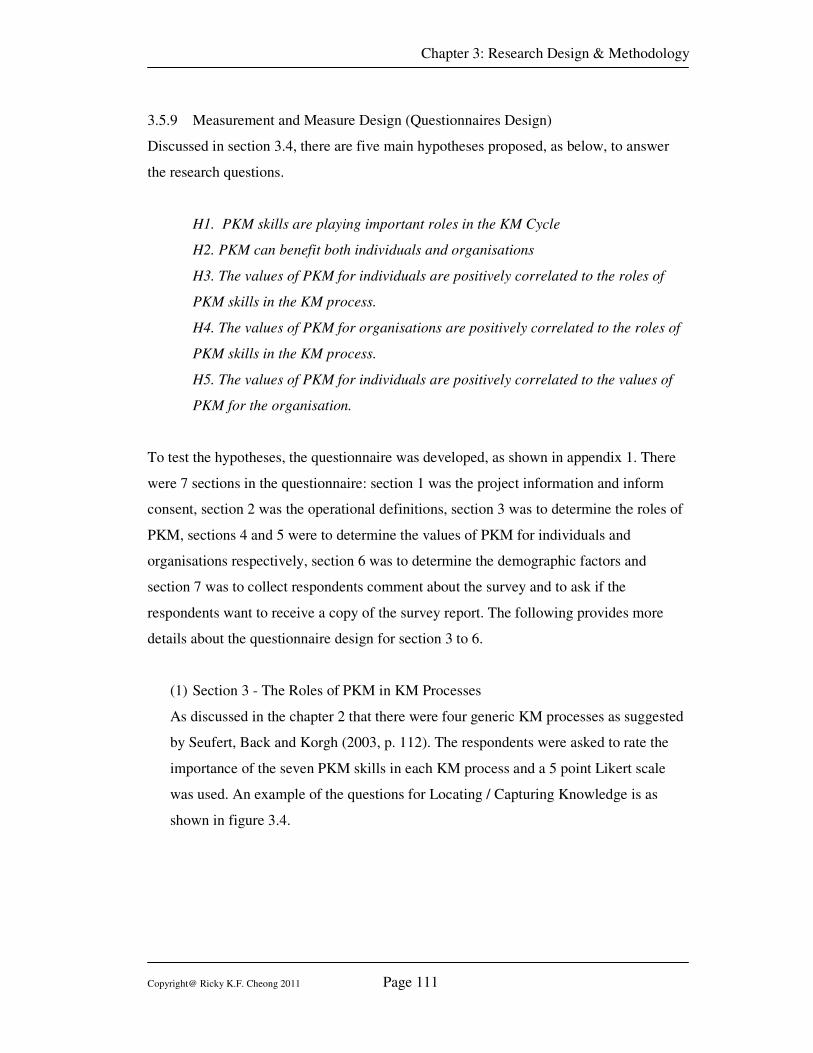
Chapter 3: Research Design & Methodology
Copyright@ Ricky K.F. Cheong 2011 Page 111
3.5.9 Measurement and Measure Design (Questionnaires Design)
Discussed in section 3.4, there are five main hypotheses proposed, as below, to answer
the research questions.
H1. PKM skills are playing important roles in the KM Cycle
H2. PKM can benefit both individuals and organisations
H3. The values of PKM for individuals are positively correlated to the roles of
PKM skills in the KM process.
H4. The values of PKM for organisations are positively correlated to the roles of
PKM skills in the KM process.
H5. The values of PKM for individuals are positively correlated to the values of
PKM for the organisation.
To test the hypotheses, the questionnaire was developed, as shown in appendix 1. There
were 7 sections in the questionnaire: section 1 was the project information and inform
consent, section 2 was the operational definitions, section 3 was to determine the roles of
PKM, sections 4 and 5 were to determine the values of PKM for individuals and
organisations respectively, section 6 was to determine the demographic factors and
section 7 was to collect respondents comment about the survey and to ask if the
respondents want to receive a copy of the survey report. The following provides more
details about the questionnaire design for section 3 to 6.
(1) Section 3 - The Roles of PKM in KM Processes
As discussed in the chapter 2 that there were four generic KM processes as suggested
by Seufert, Back and Korgh (2003, p. 112). The respondents were asked to rate the
importance of the seven PKM skills in each KM process and a 5 point Likert scale
was used. An example of the questions for Locating / Capturing Knowledge is as
shown in figure 3.4.
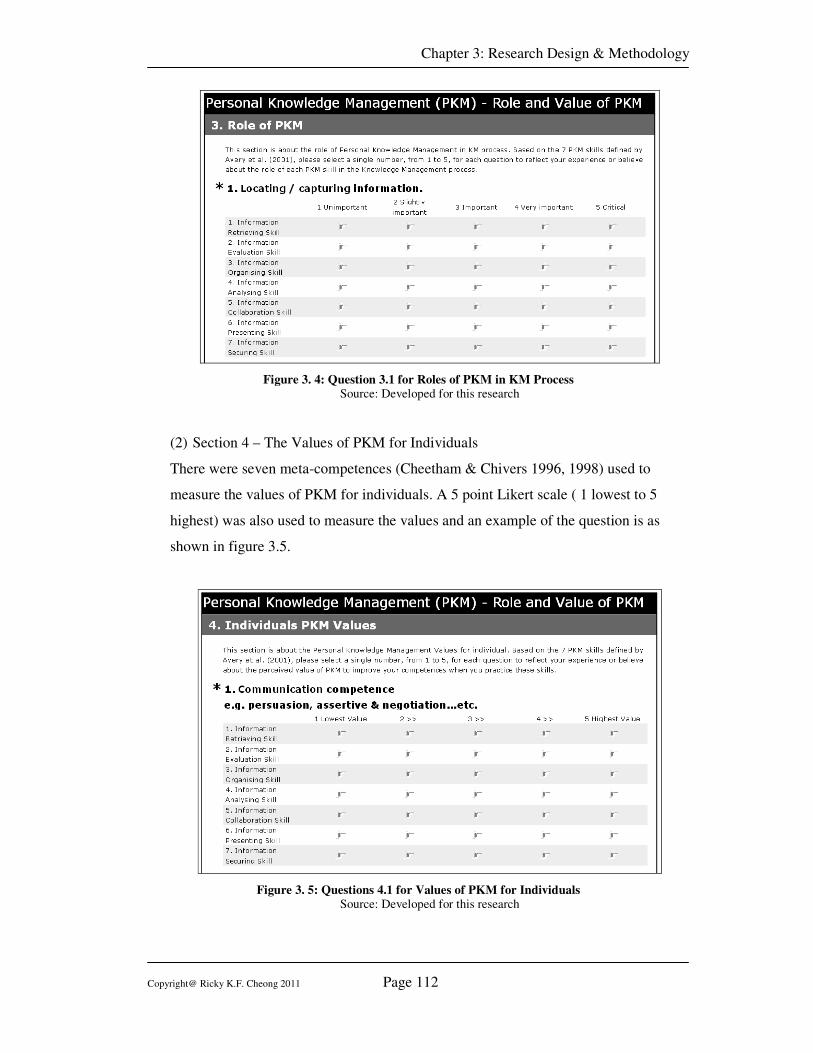
Chapter 3: Research Design & Methodology
Copyright@ Ricky K.F. Cheong 2011 Page 112
Figure 3. 4: Question 3.1 for Roles of PKM in KM Process
Source: Developed for this research
(2) Section 4 – The Values of PKM for Individuals
There were seven meta-competences (Cheetham & Chivers 1996, 1998) used to
measure the values of PKM for individuals. A 5 point Likert scale ( 1 lowest to 5
highest) was also used to measure the values and an example of the question is as
shown in figure 3.5.
Figure 3. 5: Questions 4.1 for Values of PKM for Individuals
Source: Developed for this research
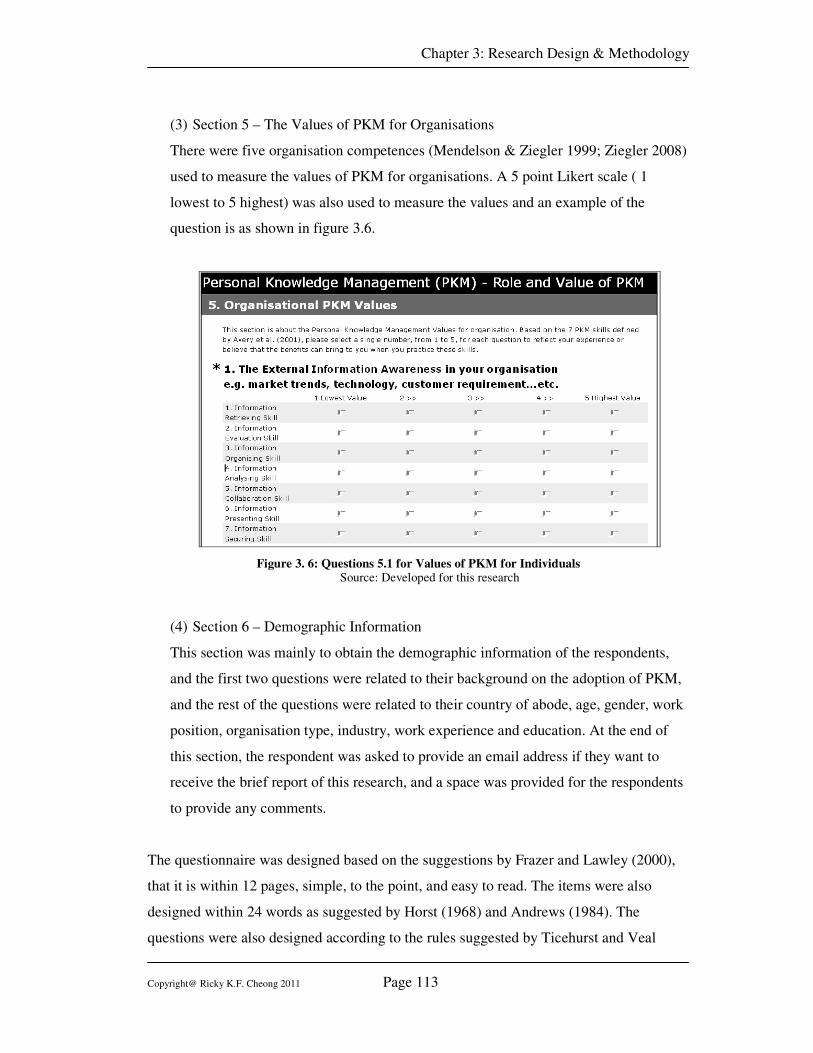
Chapter 3: Research Design & Methodology
Copyright@ Ricky K.F. Cheong 2011 Page 113
(3) Section 5 – The Values of PKM for Organisations
There were five organisation competences (Mendelson & Ziegler 1999; Ziegler 2008)
used to measure the values of PKM for organisations. A 5 point Likert scale ( 1
lowest to 5 highest) was also used to measure the values and an example of the
question is as shown in figure 3.6.
Figure 3. 6: Questions 5.1 for Values of PKM for Individuals Source: Developed for this research
(4) Section 6 – Demographic Information
This section was mainly to obtain the demographic information of the respondents,
and the first two questions were related to their background on the adoption of PKM,
and the rest of the questions were related to their country of abode, age, gender, work
position, organisation type, industry, work experience and education. At the end of
this section, the respondent was asked to provide an email address if they want to
receive the brief report of this research, and a space was provided for the respondents
to provide any comments.
The questionnaire was designed based on the suggestions by Frazer and Lawley (2000),
that it is within 12 pages, simple, to the point, and easy to read. The items were also
designed within 24 words as suggested by Horst (1968) and Andrews (1984). The
questions were also designed according to the rules suggested by Ticehurst and Veal
Chapter 3: Research Design & Methodology
Copyright@ Ricky K.F. Cheong 2011 Page 114
(2000) in that jargon, leading questions and ambiguities were avoided. The sequence of
the questions was based on the order suggested by Ticehurst and Veal (2000) in that easy
and relevant questions were asked first. The questionnaire included an information sheet,
brief literature to describe the definition of the PKM and also a question to confirm the
respondent’s consent. A complete set of the survey pack posted in the online survey tools
appears in appendix 1.
The mapping of the questions to the hypotheses and research questions is illustrated in
table 3.7. The composite variables for data analysis were constructed based on this table.
3.5.10 Pilot Survey
Zikmund (2003) mentioned that a pilot survey is a collective term for a pre-test on a
questionnaire and it uses a small number of samples prior to collecting the data in a larger
survey. Copper and Schindler (2006) pointed out that pre-test is the final step to improve
the survey and the purpose is to (1) discover ways to increase the participant response, (2)
increase the likelihood that participants will remain engaged till the completion of the
survey, (3) discover target question groups where researcher training is needed, and (4)
explore ways to improve the overall quality of the survey data. In addition, Veal (2006)
argued that the purpose of the pilot test is to test the questionnaire wording, sequence,
layout, completion time and also the analysis procedures.
In this research, a pilot survey was performed in order to enhance the questionnaire
design. A total of 50 participants were invited, and 37 completed samples were returned.
The pilot participants were the KM participants known by the researcher in KM
activities/conferences. The respondents’ comments about the survey instrument were
carefully reviewed and some clarifications were done by phone. There were some minor
changes in the wordings used in the questionaries based on the feedback, and the revised
questionnaire is attached in the appendix
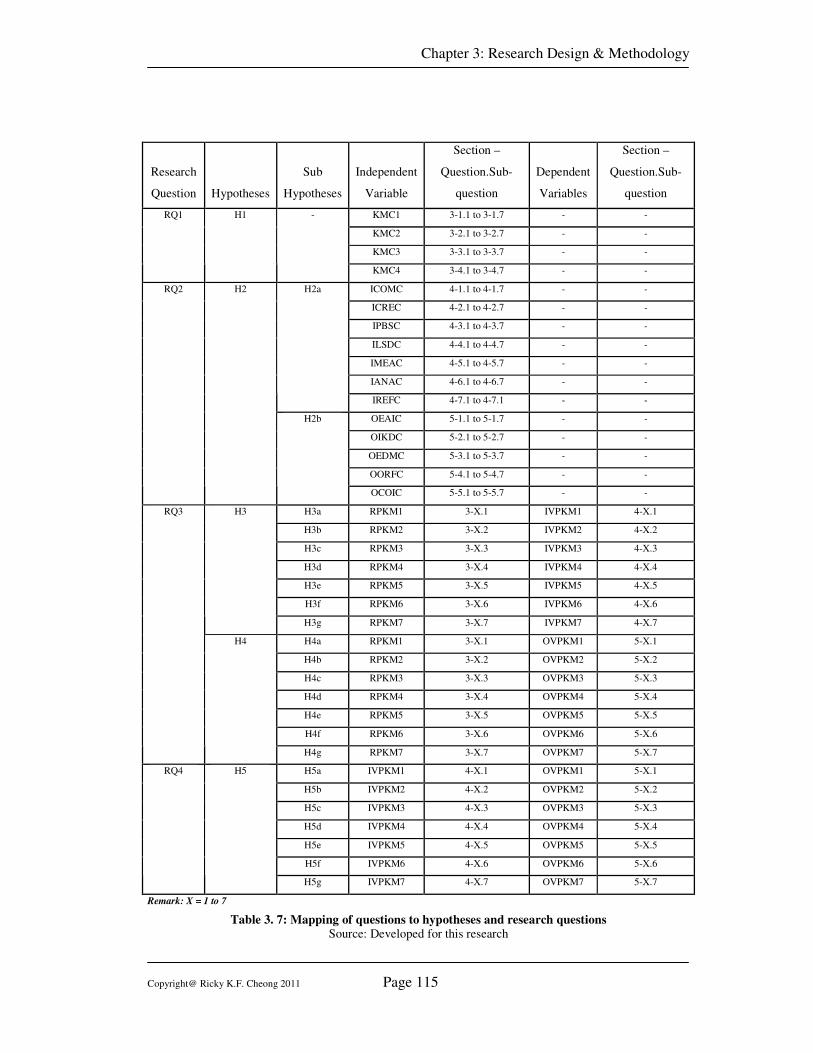
Chapter 3: Research Design & Methodology
Copyright@ Ricky K.F. Cheong 2011 Page 115
Research
Question Hypotheses
Sub
Hypotheses
Independent
Variable
Section –
Question.Sub-
question
Dependent
Variables
Section –
Question.Sub-
question
KMC1 3-1.1 to 3-1.7 - -
KMC2 3-2.1 to 3-2.7 - -
KMC3 3-3.1 to 3-3.7 - -
RQ1 H1 -
KMC4 3-4.1 to 3-4.7 - -
ICOMC 4-1.1 to 4-1.7 - -
ICREC 4-2.1 to 4-2.7 - -
IPBSC 4-3.1 to 4-3.7 - -
ILSDC 4-4.1 to 4-4.7 - -
IMEAC 4-5.1 to 4-5.7 - -
IANAC 4-6.1 to 4-6.7 - -
H2a
IREFC 4-7.1 to 4-7.1 - -
OEAIC 5-1.1 to 5-1.7 - -
OIKDC 5-2.1 to 5-2.7 - -
OEDMC 5-3.1 to 5-3.7 - -
OORFC 5-4.1 to 5-4.7 - -
RQ2 H2
H2b
OCOIC 5-5.1 to 5-5.7 - -
H3a RPKM1 3-X.1 IVPKM1 4-X.1
H3b RPKM2 3-X.2 IVPKM2 4-X.2
H3c RPKM3 3-X.3 IVPKM3 4-X.3
H3d RPKM4 3-X.4 IVPKM4 4-X.4
H3e RPKM5 3-X.5 IVPKM5 4-X.5
H3f RPKM6 3-X.6 IVPKM6 4-X.6
H3
H3g RPKM7 3-X.7 IVPKM7 4-X.7
H4a RPKM1 3-X.1 OVPKM1 5-X.1
H4b RPKM2 3-X.2 OVPKM2 5-X.2
H4c RPKM3 3-X.3 OVPKM3 5-X.3
H4d RPKM4 3-X.4 OVPKM4 5-X.4
H4e RPKM5 3-X.5 OVPKM5 5-X.5
H4f RPKM6 3-X.6 OVPKM6 5-X.6
RQ3
H4
H4g RPKM7 3-X.7 OVPKM7 5-X.7
H5a IVPKM1 4-X.1 OVPKM1 5-X.1
H5b IVPKM2 4-X.2 OVPKM2 5-X.2
H5c IVPKM3 4-X.3 OVPKM3 5-X.3
H5d IVPKM4 4-X.4 OVPKM4 5-X.4
H5e IVPKM5 4-X.5 OVPKM5 5-X.5
H5f IVPKM6 4-X.6 OVPKM6 5-X.6
RQ4 H5
H5g IVPKM7 4-X.7 OVPKM7 5-X.7
Remark: X = 1 to 7
Table 3. 7: Mapping of questions to hypotheses and research questions
Source: Developed for this research
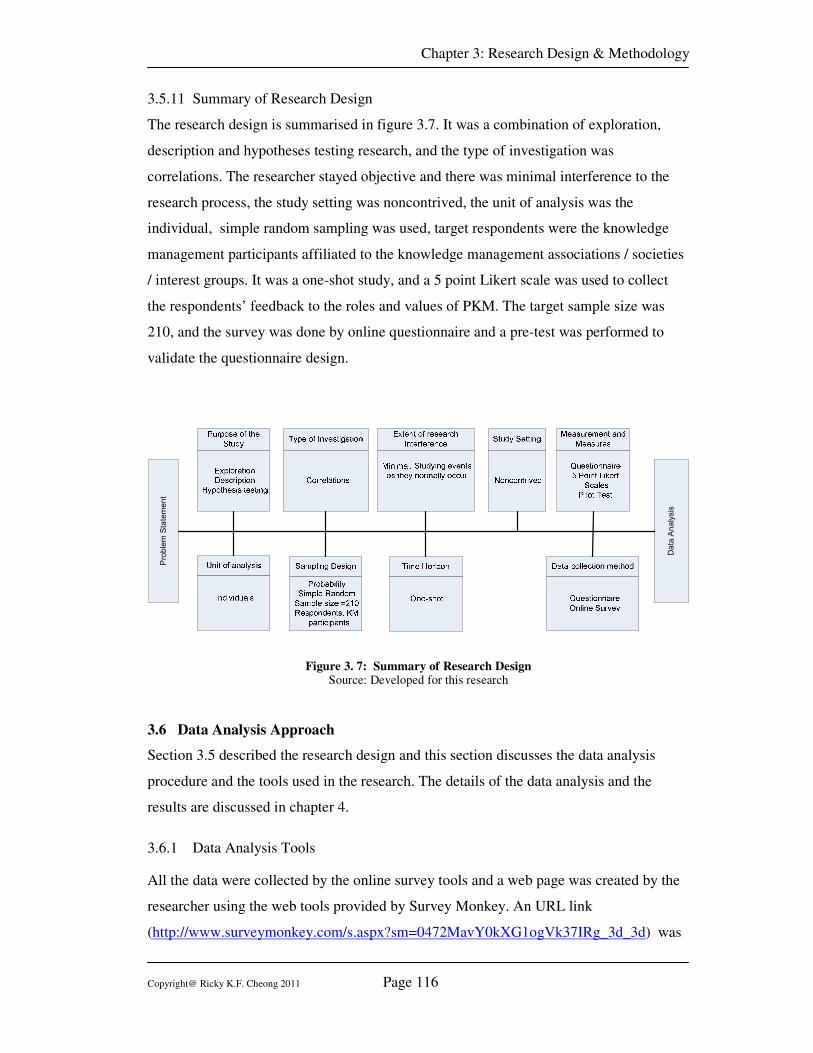
Chapter 3: Research Design & Methodology
Copyright@ Ricky K.F. Cheong 2011 Page 116
3.5.11 Summary of Research Design
The research design is summarised in figure 3.7. It was a combination of exploration,
description and hypotheses testing research, and the type of investigation was
correlations. The researcher stayed objective and there was minimal interference to the
research process, the study setting was noncontrived, the unit of analysis was the
individual, simple random sampling was used, target respondents were the knowledge
management participants affiliated to the knowledge management associations / societies
/ interest groups. It was a one-shot study, and a 5 point Likert scale was used to collect
the respondents’ feedback to the roles and values of PKM. The target sample size was
210, and the survey was done by online questionnaire and a pre-test was performed to
validate the questionnaire design.
Problem Statement
Data Analysis
Figure 3. 7: Summary of Research Design Source: Developed for this research
3.6 Data Analysis Approach
Section 3.5 described the research design and this section discusses the data analysis
procedure and the tools used in the research. The details of the data analysis and the
results are discussed in chapter 4.
3.6.1 Data Analysis Tools
All the data were collected by the online survey tools and a web page was created by the
researcher using the web tools provided by Survey Monkey. An URL link
(http://www.surveymonkey.com/s.aspx?sm=0472MavY0kXG1ogVk37IRg_3d_3d) was
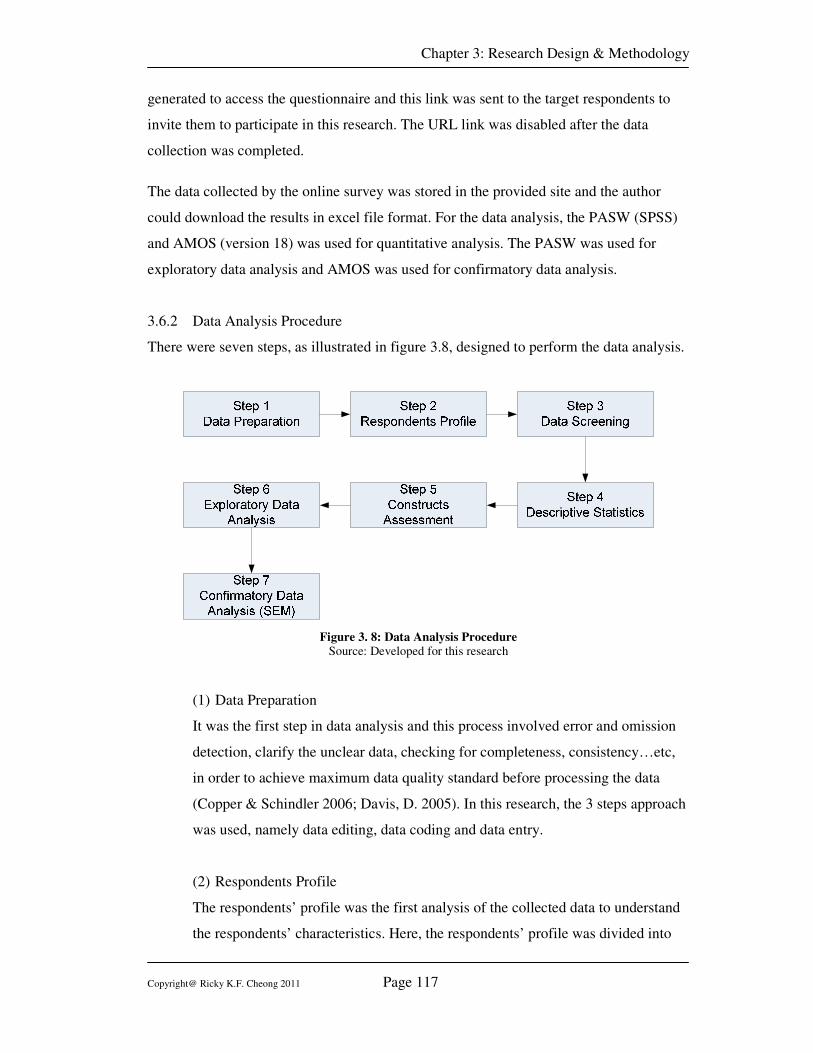
Chapter 3: Research Design & Methodology
Copyright@ Ricky K.F. Cheong 2011 Page 117
generated to access the questionnaire and this link was sent to the target respondents to
invite them to participate in this research. The URL link was disabled after the data
collection was completed.
The data collected by the online survey was stored in the provided site and the author
could download the results in excel file format. For the data analysis, the PASW (SPSS)
and AMOS (version 18) was used for quantitative analysis. The PASW was used for
exploratory data analysis and AMOS was used for confirmatory data analysis.
3.6.2 Data Analysis Procedure
There were seven steps, as illustrated in figure 3.8, designed to perform the data analysis.
Figure 3. 8: Data Analysis Procedure
Source: Developed for this research
(1) Data Preparation
It was the first step in data analysis and this process involved error and omission
detection, clarify the unclear data, checking for completeness, consistency…etc,
in order to achieve maximum data quality standard before processing the data
(Copper & Schindler 2006; Davis, D. 2005). In this research, the 3 steps approach
was used, namely data editing, data coding and data entry.
(2) Respondents Profile
The respondents’ profile was the first analysis of the collected data to understand
the respondents’ characteristics. Here, the respondents’ profile was divided into
Chapter 3: Research Design & Methodology
Copyright@ Ricky K.F. Cheong 2011 Page 118
two parts; the first part was related to the PKM profile of the respondents and the
second part was the personal profile. The PKM profile concerns the stage of PKM
adoption which was based on the adoption stage classified by Rogers (1962), and
their previous training on PKM. The personal profile was demographic
information as discussed in the questionnaire design in section 3.4.9. The analysis
was done by the statistical values of frequency and percentage…etc.
(3) Data Screening
The data screening was mainly focused on any missing data and outliers for the
collected data in section 1 to section 3 of the questionnaire, on the roles and
values of the PKM. Both univariate and multivariate outliers were checked. For
the univariate outliers, the histograms, box-plots and z-scores were checked. For the
multivariate, the Mahalanobis distance was calculated and checked to see if it
exceeded the chi-square values for the corresponding degree of freedom. The records
with substantial missing data and significant outlier problems were removed from the
dataset before performing the next step in the analysis.
(4) Descriptive Statistics
Descriptive statistics provided clear understanding, with graphical displays, for
the roles and values of PKM. The data concerned were in section 1 to section 3 of
the questionnaire. It tested hypothesis H1 and hypothesis H2. All data were
collected by the 5 point Likert Scale from 1 to 5 and the minimum, maximum,
mean score and standard deviations were reported. A score above 3 was
considered as important or significant.
(5) Constructs Assessment
Constructs assessment were used to test the validity, reliability and normality of
the composite variables created for hypotheses analysis in the next step. The
validity was assessed by Pearson correlations and Principal Components analysis
(PCA). For the Pearson correlations, the item-to-item correlations should exceed
0.3 and item-to total correlations should exceed 0.5 (Hair, J. F. et al. 1998); for
the PCA, there should be only eigenvalues greater than 1 and the loading factors
were all > 0.5. The Cronbach’s Alpha coefficient was used for reliability testing,
Chapter 3: Research Design & Methodology
Copyright@ Ricky K.F. Cheong 2011 Page 119
the values >0.6 were acceptable for the exploratory study, >0.7 were acceptable,
>0.8 were good and >0.9 were excellent, as suggested by Hair et al (1998) and
Sekaran (2003). The normality was assessed by the Z-score and both skewness and
kurtosis were checked to see if they exceeded the absolute value of 2.58 (samples
<300), as proposed by Tabachnick and Fidell (2001). Transformation was performed
for those construct did not meet this requirement.
(6) Exploratory Data Analysis
The exploratory data analysis was performed in two steps. The first step was to
check if the scoring was associated with the PKM adoption stages of the
respondents. It was to access the generalisability of the data before the second step
of testing the hypotheses by simple regression. The first step was using ANOVA
which was recommended by Manning and Munro (2004, p. 82) ANOVA is
suitable if one variable is related to another variable when the variables are scale
or ratio types. The second step was to test hypotheses H3 to H5 and simple
regression was used. Instead of just checking the correlation between variables,
simple regressions provide additional information about the coefficients of the
regressions equations such that a researcher can have a better understanding about
the relationships between the independent and dependent variables (Manning &
Munro 2004).
(7) Confirmatory Data Analysis
The exploratory data analysis provided evidence of the hypotheses testing and the
confirmatory approach by structural equation modelling, as recommended by
Byrne (2010), that was used on the analysis of a structural theory on the roles and
values of PKM. The analysis was performed in two stages to test the measurement
model and hypotheses model. In the SEM analysis, the Maximum Likelihood
(ML) estimation was used. The goodness of fit was assessed by the normed chi-
square, χ2 /df (<3.0), CFI, IFI and TFI (> 0.9) and RMSEA (< 0.08), as
recommended by various scholars e.g. Kline (2005), Byrne (2010) and Hu and
Bentler (1999).
Chapter 3: Research Design & Methodology
Copyright@ Ricky K.F. Cheong 2011 Page 120
This section provides a guideline on the data analysis in this research. The results,
conclusion and the implications are presented in chapter 4 and chapter 5.
3.7 Ethical Considerations
All efforts related to this research were conducted in a manner which conforms to
acceptable ethical standards, and abides by the guidelines of the Ethics Committee of the
University. The issues to be addressed in this research are Informed Consent, Privacy,
and Confidentiality. The aim is, of course, not to cause any harm to the research
participants (Rubin & Rubin 1995).
The Informed Consent procedure which ensures that participants understand all the facts
of the research that may be relevant to them in making a decision to participate in the
study, and requests their permission before proceeding with the survey (Emory & Cooper
1991). Before taking the survey, an information sheet was provided about the purpose,
procedure and the respondents’ right to withdraw from the survey at any time. The
respondents were asked for their consent before answering any question.
For the Privacy and Confidentiality issues, the data presented in the research report were
coded and no particular information was disclosed, so that individual respondents would
not be traceable. All collected data have been kept in safe storage by the author.
This research project has abided by all the ethical standards and principles required by
Southern Cross University and its Human Research Ethics Committee (HREC), and
ethics approval has been obtained from HREC with the approval number was ECN-08-
159.
The cover letter of this questionnaire also indicated that if the participants had any
questions, they could directly contact the researcher and supervisor by mail or e-mail. So,
based on all of the above factors, there were no ethical risks taken and no possible harm
to the respondents.
Chapter 3: Research Design & Methodology
Copyright@ Ricky K.F. Cheong 2011 Page 121
3.8 Chapter Conclusion
This chapter has discussed research paradigms, research methodology, research design,
data collection methods, data analysis approaches and ethical considerations. Based on
the evaluation, a positivism paradigm and a quantitative research approach were selected.
The research design was based on the framework proposed by Sekaran (2003). A survey
by online questionnaire was used, with a targeted sample size of 210, and the targeted
respondents selected were the knowledge management participants in affiliated
knowledge management associations / societies / interest groups. The data analysis was
performed by PASW (SPSS) and AMOS. A seven steps analysis approach was defined
and both exploratory data analysis and confirmatory data analysis were undertaken.
Finally, the ethical issues were discussed and ethics approval was obtained from HREC
prior to data collection.
Chapter 4: Findings & Data Analysis
Copyright@ Ricky K.F. Cheong 2011 Page 122
CChhaapptteerr 44 –– FFiinnddiinnggss aanndd DDaattaa AAnnaallyyssiiss
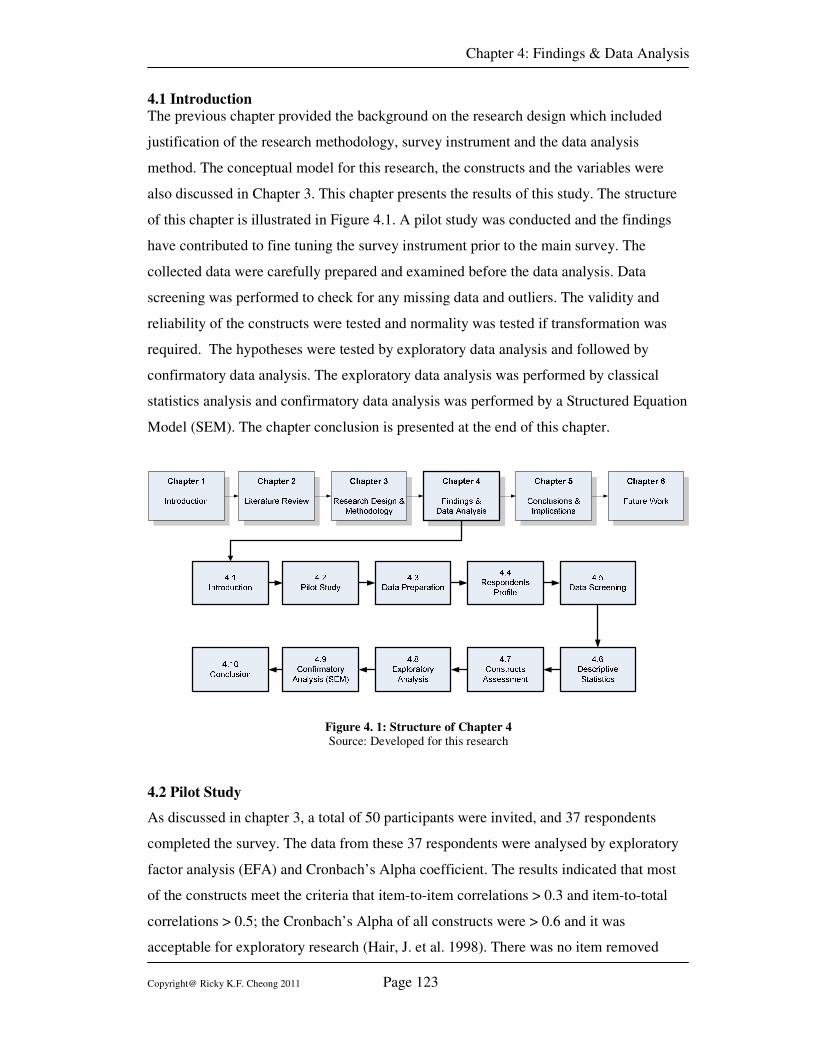
Chapter 4: Findings & Data Analysis
Copyright@ Ricky K.F. Cheong 2011 Page 123
4.1 Introduction
The previous chapter provided the background on the research design which included
justification of the research methodology, survey instrument and the data analysis
method. The conceptual model for this research, the constructs and the variables were
also discussed in Chapter 3. This chapter presents the results of this study. The structure
of this chapter is illustrated in Figure 4.1. A pilot study was conducted and the findings
have contributed to fine tuning the survey instrument prior to the main survey. The
collected data were carefully prepared and examined before the data analysis. Data
screening was performed to check for any missing data and outliers. The validity and
reliability of the constructs were tested and normality was tested if transformation was
required. The hypotheses were tested by exploratory data analysis and followed by
confirmatory data analysis. The exploratory data analysis was performed by classical
statistics analysis and confirmatory data analysis was performed by a Structured Equation
Model (SEM). The chapter conclusion is presented at the end of this chapter.
Figure 4. 1: Structure of Chapter 4
Source: Developed for this research
4.2 Pilot Study
As discussed in chapter 3, a total of 50 participants were invited, and 37 respondents
completed the survey. The data from these 37 respondents were analysed by exploratory
factor analysis (EFA) and Cronbach’s Alpha coefficient. The results indicated that most
of the constructs meet the criteria that item-to-item correlations > 0.3 and item-to-total
correlations > 0.5; the Cronbach’s Alpha of all constructs were > 0.6 and it was
acceptable for exploratory research (Hair, J. et al. 1998). There was no item removed
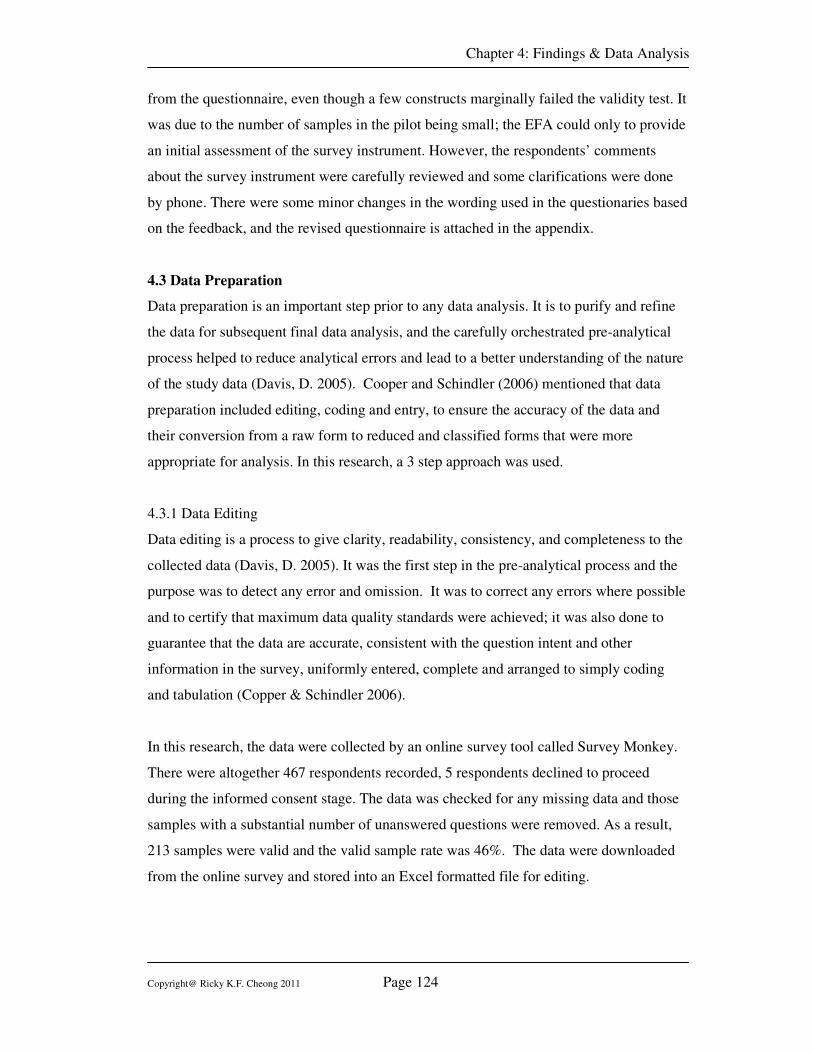
Chapter 4: Findings & Data Analysis
Copyright@ Ricky K.F. Cheong 2011 Page 124
from the questionnaire, even though a few constructs marginally failed the validity test. It
was due to the number of samples in the pilot being small; the EFA could only to provide
an initial assessment of the survey instrument. However, the respondents’ comments
about the survey instrument were carefully reviewed and some clarifications were done
by phone. There were some minor changes in the wording used in the questionaries based
on the feedback, and the revised questionnaire is attached in the appendix.
4.3 Data Preparation
Data preparation is an important step prior to any data analysis. It is to purify and refine
the data for subsequent final data analysis, and the carefully orchestrated pre-analytical
process helped to reduce analytical errors and lead to a better understanding of the nature
of the study data (Davis, D. 2005). Cooper and Schindler (2006) mentioned that data
preparation included editing, coding and entry, to ensure the accuracy of the data and
their conversion from a raw form to reduced and classified forms that were more
appropriate for analysis. In this research, a 3 step approach was used.
4.3.1 Data Editing
Data editing is a process to give clarity, readability, consistency, and completeness to the
collected data (Davis, D. 2005). It was the first step in the pre-analytical process and the
purpose was to detect any error and omission. It was to correct any errors where possible
and to certify that maximum data quality standards were achieved; it was also done to
guarantee that the data are accurate, consistent with the question intent and other
information in the survey, uniformly entered, complete and arranged to simply coding
and tabulation (Copper & Schindler 2006).
In this research, the data were collected by an online survey tool called Survey Monkey.
There were altogether 467 respondents recorded, 5 respondents declined to proceed
during the informed consent stage. The data was checked for any missing data and those
samples with a substantial number of unanswered questions were removed. As a result,
213 samples were valid and the valid sample rate was 46%. The data were downloaded
from the online survey and stored into an Excel formatted file for editing.
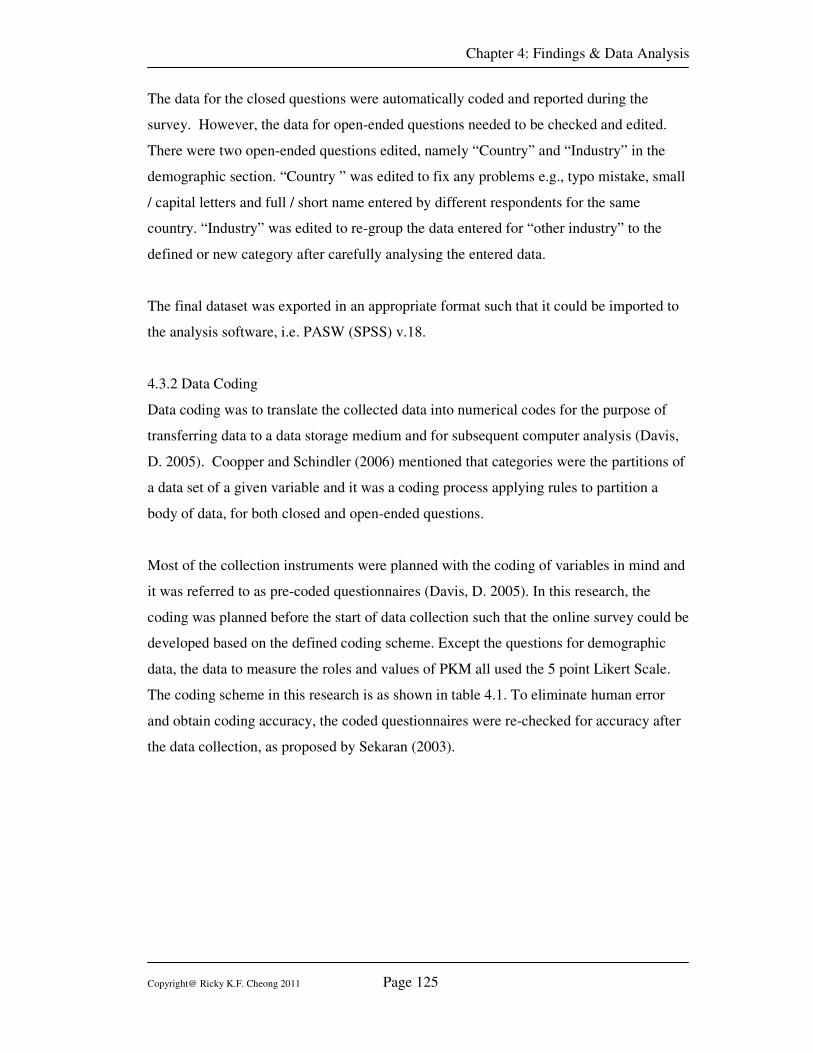
Chapter 4: Findings & Data Analysis
Copyright@ Ricky K.F. Cheong 2011 Page 125
The data for the closed questions were automatically coded and reported during the
survey. However, the data for open-ended questions needed to be checked and edited.
There were two open-ended questions edited, namely “Country” and “Industry” in the
demographic section. “Country ” was edited to fix any problems e.g., typo mistake, small
/ capital letters and full / short name entered by different respondents for the same
country. “Industry” was edited to re-group the data entered for “other industry” to the
defined or new category after carefully analysing the entered data.
The final dataset was exported in an appropriate format such that it could be imported to
the analysis software, i.e. PASW (SPSS) v.18.
4.3.2 Data Coding
Data coding was to translate the collected data into numerical codes for the purpose of
transferring data to a data storage medium and for subsequent computer analysis (Davis,
D. 2005). Coopper and Schindler (2006) mentioned that categories were the partitions of
a data set of a given variable and it was a coding process applying rules to partition a
body of data, for both closed and open-ended questions.
Most of the collection instruments were planned with the coding of variables in mind and
it was referred to as pre-coded questionnaires (Davis, D. 2005). In this research, the
coding was planned before the start of data collection such that the online survey could be
developed based on the defined coding scheme. Except the questions for demographic
data, the data to measure the roles and values of PKM all used the 5 point Likert Scale.
The coding scheme in this research is as shown in table 4.1. To eliminate human error
and obtain coding accuracy, the coded questionnaires were re-checked for accuracy after
the data collection, as proposed by Sekaran (2003).
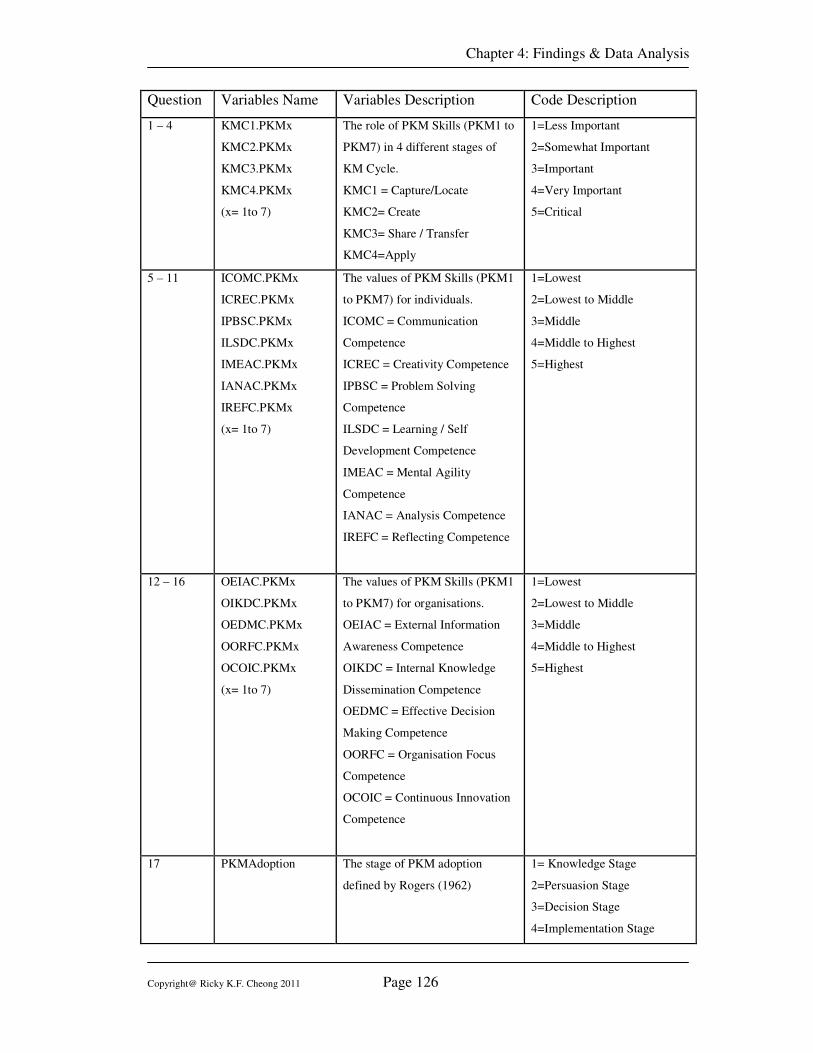
Chapter 4: Findings & Data Analysis
Copyright@ Ricky K.F. Cheong 2011 Page 126
Question Variables Name Variables Description Code Description
1 – 4 KMC1.PKMx
KMC2.PKMx
KMC3.PKMx
KMC4.PKMx
(x= 1to 7)
The role of PKM Skills (PKM1 to
PKM7) in 4 different stages of
KM Cycle.
KMC1 = Capture/Locate
KMC2= Create
KMC3= Share / Transfer
KMC4=Apply
1=Less Important
2=Somewhat Important
3=Important
4=Very Important
5=Critical
5 – 11 ICOMC.PKMx
ICREC.PKMx
IPBSC.PKMx
ILSDC.PKMx
IMEAC.PKMx
IANAC.PKMx
IREFC.PKMx
(x= 1to 7)
The values of PKM Skills (PKM1
to PKM7) for individuals.
ICOMC = Communication
Competence
ICREC = Creativity Competence
IPBSC = Problem Solving
Competence
ILSDC = Learning / Self
Development Competence
IMEAC = Mental Agility
Competence
IANAC = Analysis Competence
IREFC = Reflecting Competence
1=Lowest
2=Lowest to Middle
3=Middle
4=Middle to Highest
5=Highest
12 – 16 OEIAC.PKMx
OIKDC.PKMx
OEDMC.PKMx
OORFC.PKMx
OCOIC.PKMx
(x= 1to 7)
The values of PKM Skills (PKM1
to PKM7) for organisations.
OEIAC = External Information
Awareness Competence
OIKDC = Internal Knowledge
Dissemination Competence
OEDMC = Effective Decision
Making Competence
OORFC = Organisation Focus
Competence
OCOIC = Continuous Innovation
Competence
1=Lowest
2=Lowest to Middle
3=Middle
4=Middle to Highest
5=Highest
17 PKMAdoption The stage of PKM adoption
defined by Rogers (1962)
1= Knowledge Stage
2=Persuasion Stage
3=Decision Stage
4=Implementation Stage
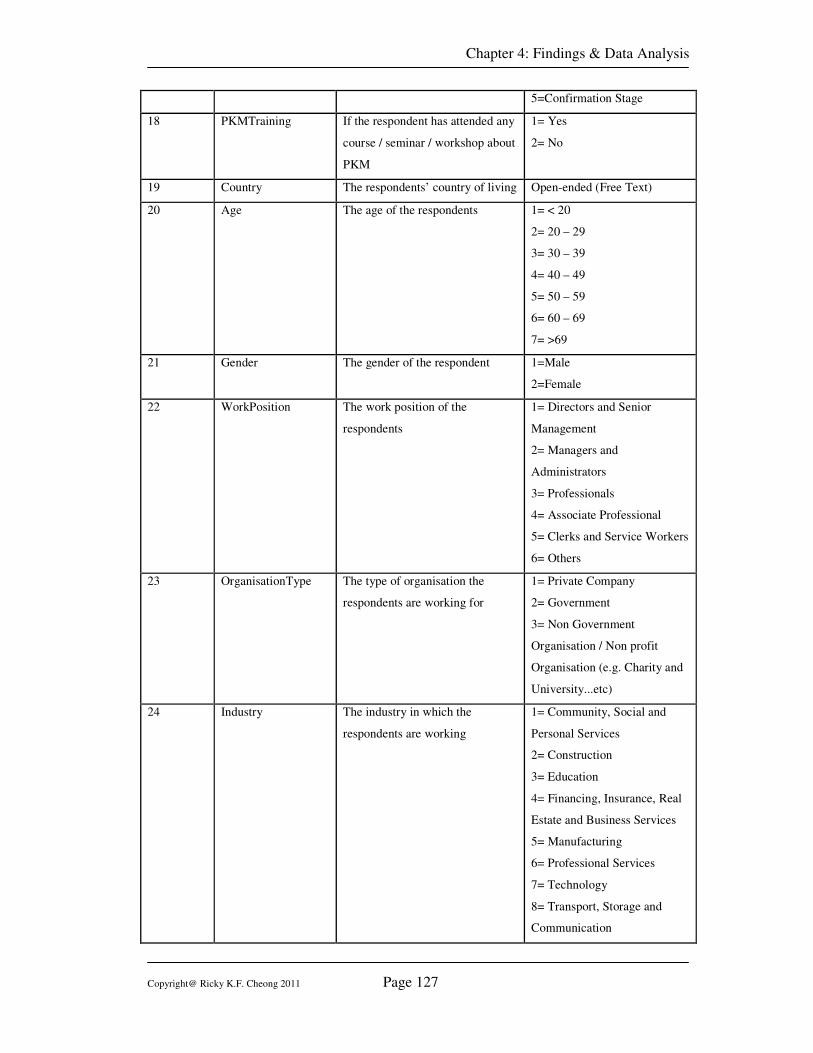
Chapter 4: Findings & Data Analysis
Copyright@ Ricky K.F. Cheong 2011 Page 127
5=Confirmation Stage
18 PKMTraining If the respondent has attended any
course / seminar / workshop about
PKM
1= Yes
2= No
19 Country The respondents’ country of living Open-ended (Free Text)
20 Age The age of the respondents 1= < 20
2= 20 – 29
3= 30 – 39
4= 40 – 49
5= 50 – 59
6= 60 – 69
7= >69
21 Gender The gender of the respondent 1=Male
2=Female
22 WorkPosition
The work position of the
respondents
1= Directors and Senior
Management
2= Managers and
Administrators
3= Professionals
4= Associate Professional
5= Clerks and Service Workers
6= Others
23 OrganisationType
The type of organisation the
respondents are working for
1= Private Company
2= Government
3= Non Government
Organisation / Non profit
Organisation (e.g. Charity and
University...etc)
24 Industry
The industry in which the
respondents are working
1= Community, Social and
Personal Services
2= Construction
3= Education
4= Financing, Insurance, Real
Estate and Business Services
5= Manufacturing
6= Professional Services
7= Technology
8= Transport, Storage and
Communication
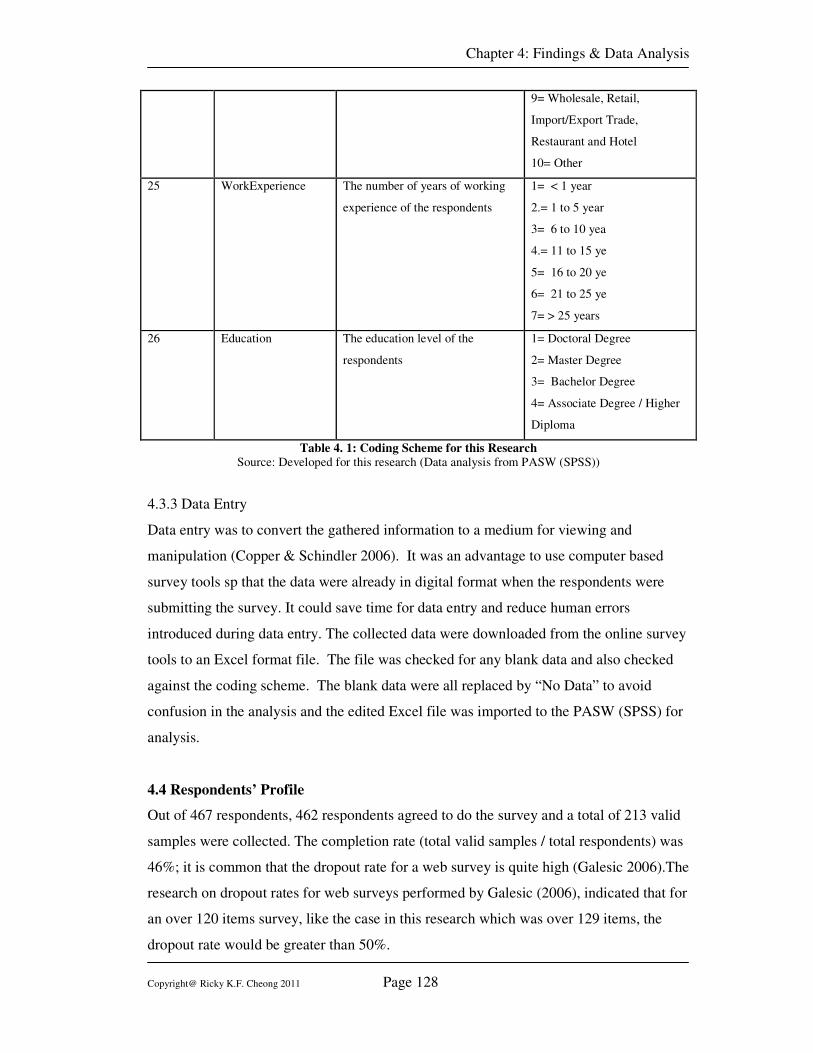
Chapter 4: Findings & Data Analysis
Copyright@ Ricky K.F. Cheong 2011 Page 128
9= Wholesale, Retail,
Import/Export Trade,
Restaurant and Hotel
10= Other
25 WorkExperience
The number of years of working
experience of the respondents
1= < 1 year
2.= 1 to 5 year
3= 6 to 10 yea
4.= 11 to 15 ye
5= 16 to 20 ye
6= 21 to 25 ye
7= > 25 years
26 Education The education level of the
respondents
1= Doctoral Degree
2= Master Degree
3= Bachelor Degree
4= Associate Degree / Higher
Diploma
Table 4. 1: Coding Scheme for this Research
Source: Developed for this research (Data analysis from PASW (SPSS))
4.3.3 Data Entry
Data entry was to convert the gathered information to a medium for viewing and
manipulation (Copper & Schindler 2006). It was an advantage to use computer based
survey tools sp that the data were already in digital format when the respondents were
submitting the survey. It could save time for data entry and reduce human errors
introduced during data entry. The collected data were downloaded from the online survey
tools to an Excel format file. The file was checked for any blank data and also checked
against the coding scheme. The blank data were all replaced by “No Data” to avoid
confusion in the analysis and the edited Excel file was imported to the PASW (SPSS) for
analysis.
4.4 Respondents’ Profile
Out of 467 respondents, 462 respondents agreed to do the survey and a total of 213 valid
samples were collected. The completion rate (total valid samples / total respondents) was
46%; it is common that the dropout rate for a web survey is quite high (Galesic 2006).The
research on dropout rates for web surveys performed by Galesic (2006), indicated that for
an over 120 items survey, like the case in this research which was over 129 items, the
dropout rate would be greater than 50%.
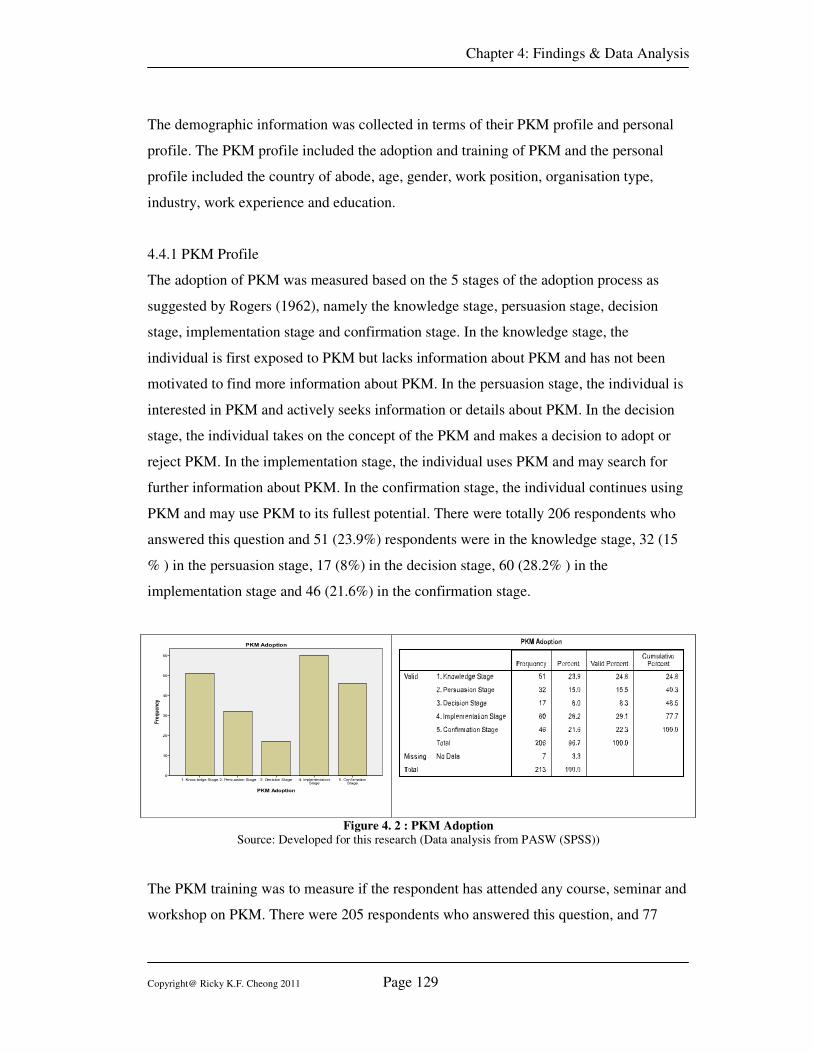
Chapter 4: Findings & Data Analysis
Copyright@ Ricky K.F. Cheong 2011 Page 129
The demographic information was collected in terms of their PKM profile and personal
profile. The PKM profile included the adoption and training of PKM and the personal
profile included the country of abode, age, gender, work position, organisation type,
industry, work experience and education.
4.4.1 PKM Profile
The adoption of PKM was measured based on the 5 stages of the adoption process as
suggested by Rogers (1962), namely the knowledge stage, persuasion stage, decision
stage, implementation stage and confirmation stage. In the knowledge stage, the
individual is first exposed to PKM but lacks information about PKM and has not been
motivated to find more information about PKM. In the persuasion stage, the individual is
interested in PKM and actively seeks information or details about PKM. In the decision
stage, the individual takes on the concept of the PKM and makes a decision to adopt or
reject PKM. In the implementation stage, the individual uses PKM and may search for
further information about PKM. In the confirmation stage, the individual continues using
PKM and may use PKM to its fullest potential. There were totally 206 respondents who
answered this question and 51 (23.9%) respondents were in the knowledge stage, 32 (15
% ) in the persuasion stage, 17 (8%) in the decision stage, 60 (28.2% ) in the
implementation stage and 46 (21.6%) in the confirmation stage.
Figure 4. 2 : PKM Adoption
Source: Developed for this research (Data analysis from PASW (SPSS))
The PKM training was to measure if the respondent has attended any course, seminar and
workshop on PKM. There were 205 respondents who answered this question, and 77
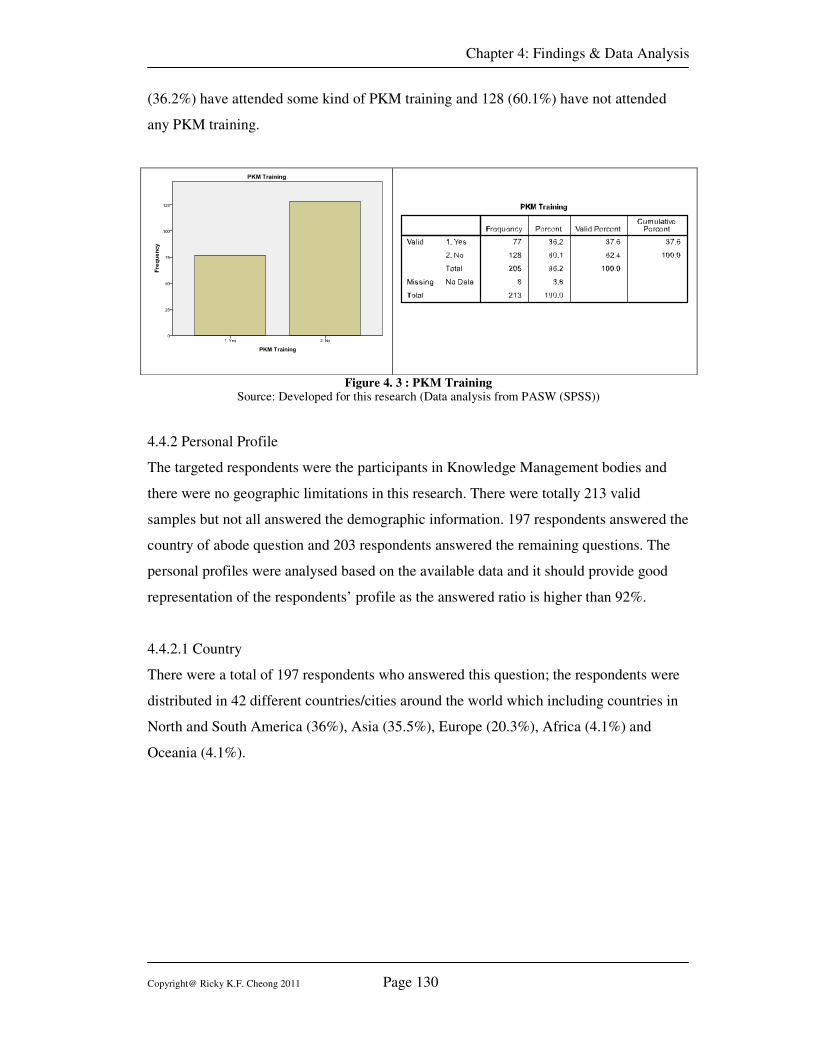
Chapter 4: Findings & Data Analysis
Copyright@ Ricky K.F. Cheong 2011 Page 130
(36.2%) have attended some kind of PKM training and 128 (60.1%) have not attended
any PKM training.
Figure 4. 3 : PKM Training
Source: Developed for this research (Data analysis from PASW (SPSS))
4.4.2 Personal Profile
The targeted respondents were the participants in Knowledge Management bodies and
there were no geographic limitations in this research. There were totally 213 valid
samples but not all answered the demographic information. 197 respondents answered the
country of abode question and 203 respondents answered the remaining questions. The
personal profiles were analysed based on the available data and it should provide good
representation of the respondents’ profile as the answered ratio is higher than 92%.
4.4.2.1 Country
There were a total of 197 respondents who answered this question; the respondents were
distributed in 42 different countries/cities around the world which including countries in
North and South America (36%), Asia (35.5%), Europe (20.3%), Africa (4.1%) and
Oceania (4.1%).
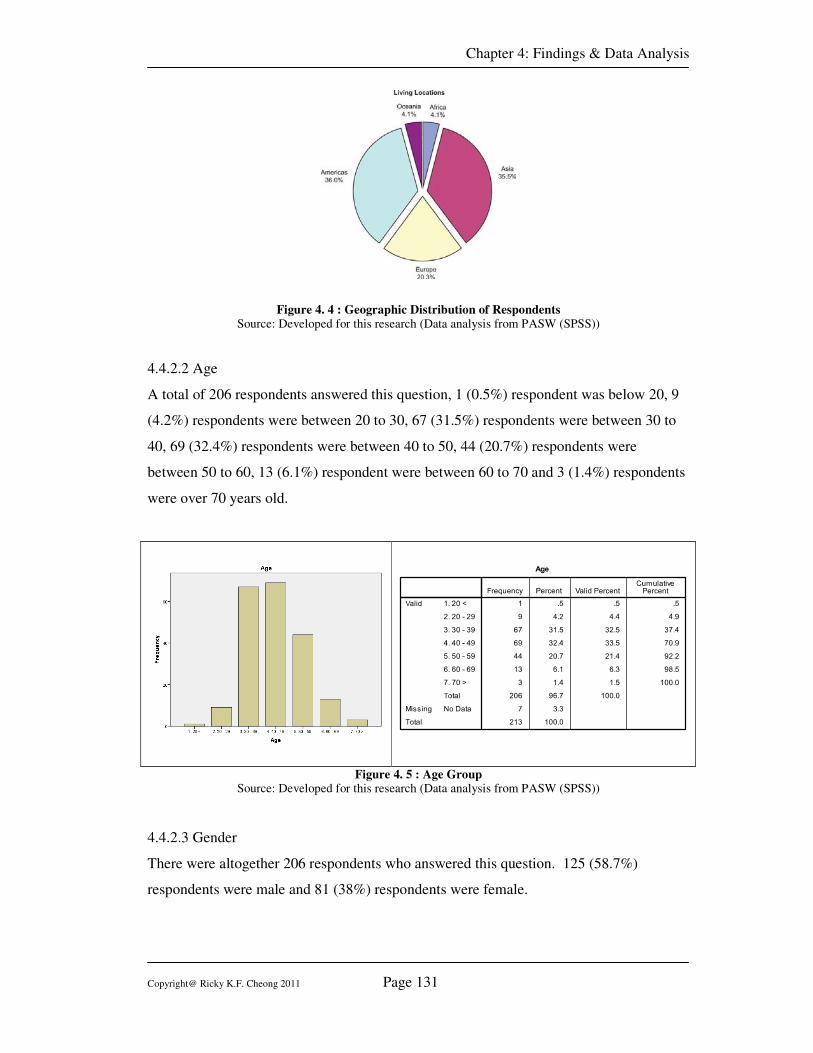
Chapter 4: Findings & Data Analysis
Copyright@ Ricky K.F. Cheong 2011 Page 131
Figure 4. 4 : Geographic Distribution of Respondents
Source: Developed for this research (Data analysis from PASW (SPSS))
4.4.2.2 Age
A total of 206 respondents answered this question, 1 (0.5%) respondent was below 20, 9
(4.2%) respondents were between 20 to 30, 67 (31.5%) respondents were between 30 to
40, 69 (32.4%) respondents were between 40 to 50, 44 (20.7%) respondents were
between 50 to 60, 13 (6.1%) respondent were between 60 to 70 and 3 (1.4%) respondents
were over 70 years old.
Figure 4. 5 : Age Group
Source: Developed for this research (Data analysis from PASW (SPSS))
4.4.2.3 Gender
There were altogether 206 respondents who answered this question. 125 (58.7%)
respondents were male and 81 (38%) respondents were female.
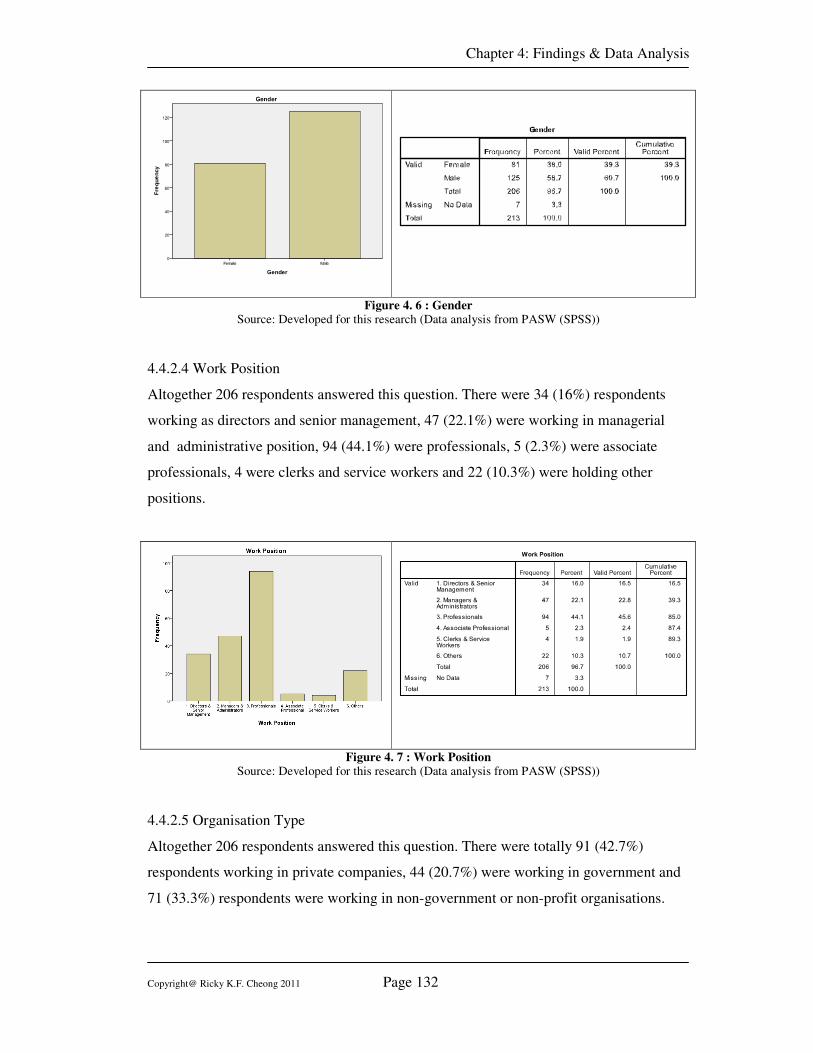
Chapter 4: Findings & Data Analysis
Copyright@ Ricky K.F. Cheong 2011 Page 132
Figure 4. 6 : Gender
Source: Developed for this research (Data analysis from PASW (SPSS))
4.4.2.4 Work Position
Altogether 206 respondents answered this question. There were 34 (16%) respondents
working as directors and senior management, 47 (22.1%) were working in managerial
and administrative position, 94 (44.1%) were professionals, 5 (2.3%) were associate
professionals, 4 were clerks and service workers and 22 (10.3%) were holding other
positions.
Figure 4. 7 : Work Position
Source: Developed for this research (Data analysis from PASW (SPSS))
4.4.2.5 Organisation Type
Altogether 206 respondents answered this question. There were totally 91 (42.7%)
respondents working in private companies, 44 (20.7%) were working in government and
71 (33.3%) respondents were working in non-government or non-profit organisations.
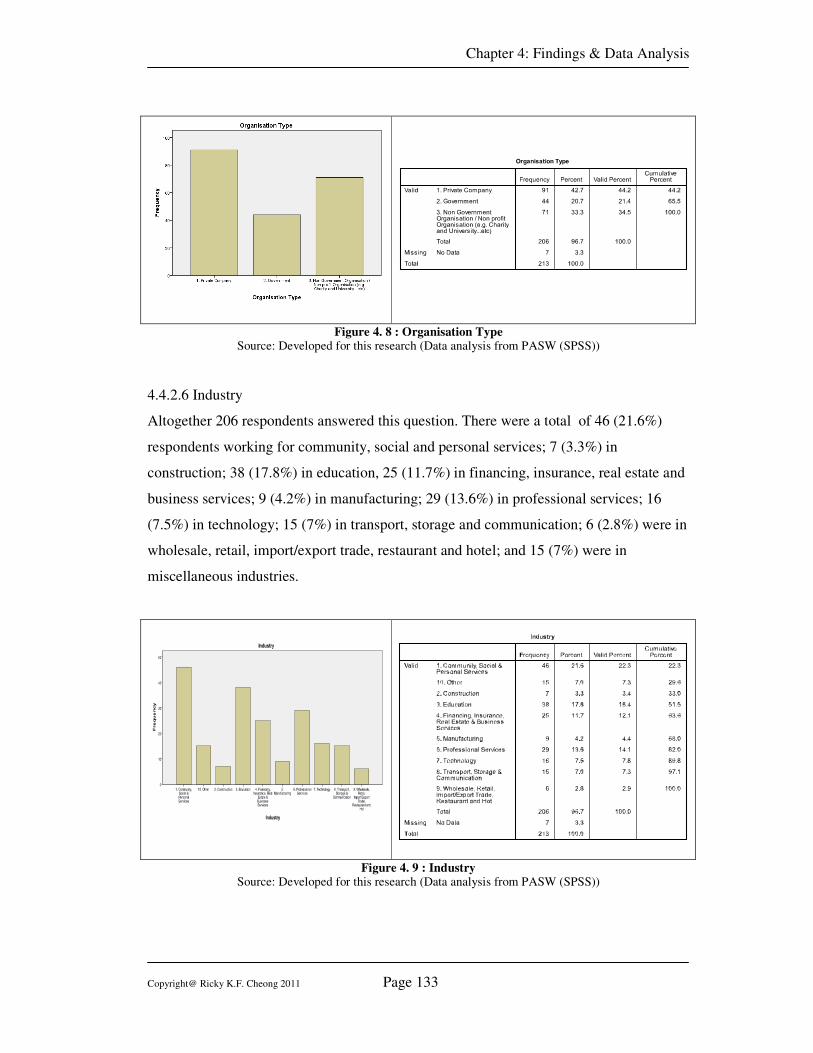
Chapter 4: Findings & Data Analysis
Copyright@ Ricky K.F. Cheong 2011 Page 133
Figure 4. 8 : Organisation Type
Source: Developed for this research (Data analysis from PASW (SPSS))
4.4.2.6 Industry
Altogether 206 respondents answered this question. There were a total of 46 (21.6%)
respondents working for community, social and personal services; 7 (3.3%) in
construction; 38 (17.8%) in education, 25 (11.7%) in financing, insurance, real estate and
business services; 9 (4.2%) in manufacturing; 29 (13.6%) in professional services; 16
(7.5%) in technology; 15 (7%) in transport, storage and communication; 6 (2.8%) were in
wholesale, retail, import/export trade, restaurant and hotel; and 15 (7%) were in
miscellaneous industries.
Figure 4. 9 : Industry
Source: Developed for this research (Data analysis from PASW (SPSS))
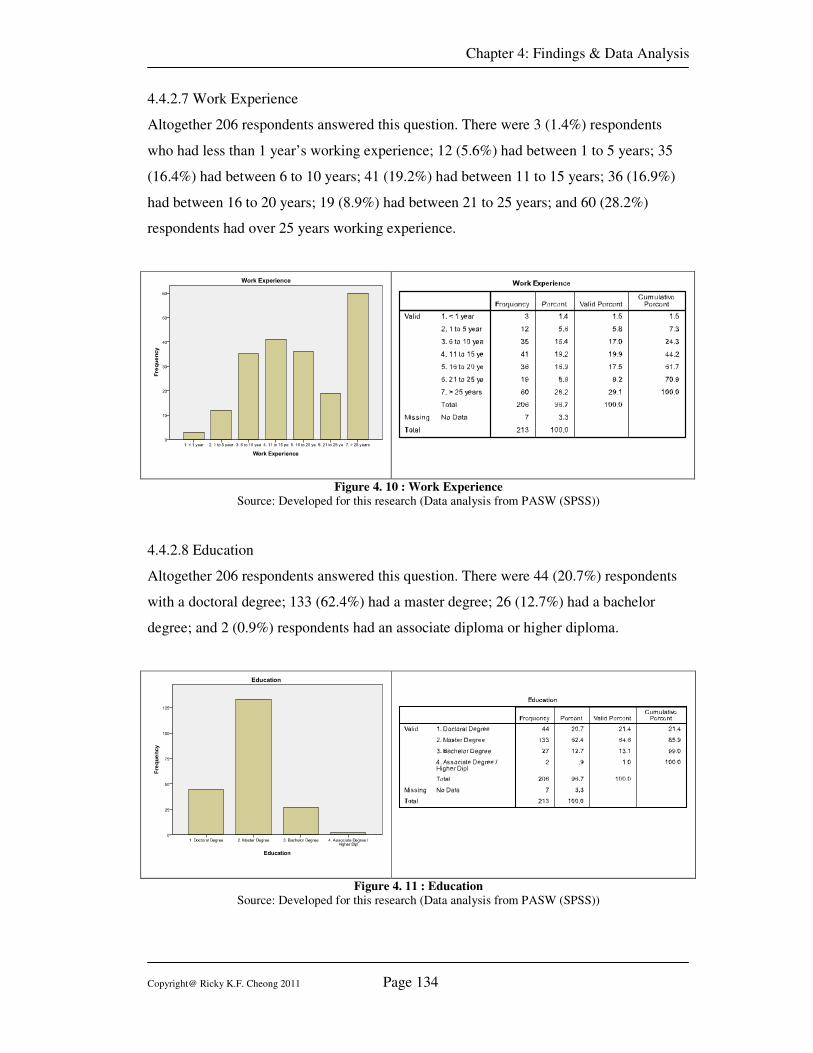
Chapter 4: Findings & Data Analysis
Copyright@ Ricky K.F. Cheong 2011 Page 134
4.4.2.7 Work Experience
Altogether 206 respondents answered this question. There were 3 (1.4%) respondents
who had less than 1 year’s working experience; 12 (5.6%) had between 1 to 5 years; 35
(16.4%) had between 6 to 10 years; 41 (19.2%) had between 11 to 15 years; 36 (16.9%)
had between 16 to 20 years; 19 (8.9%) had between 21 to 25 years; and 60 (28.2%)
respondents had over 25 years working experience.
Figure 4. 10 : Work Experience
Source: Developed for this research (Data analysis from PASW (SPSS))
4.4.2.8 Education
Altogether 206 respondents answered this question. There were 44 (20.7%) respondents
with a doctoral degree; 133 (62.4%) had a master degree; 26 (12.7%) had a bachelor
degree; and 2 (0.9%) respondents had an associate diploma or higher diploma.
Figure 4. 11 : Education
Source: Developed for this research (Data analysis from PASW (SPSS))
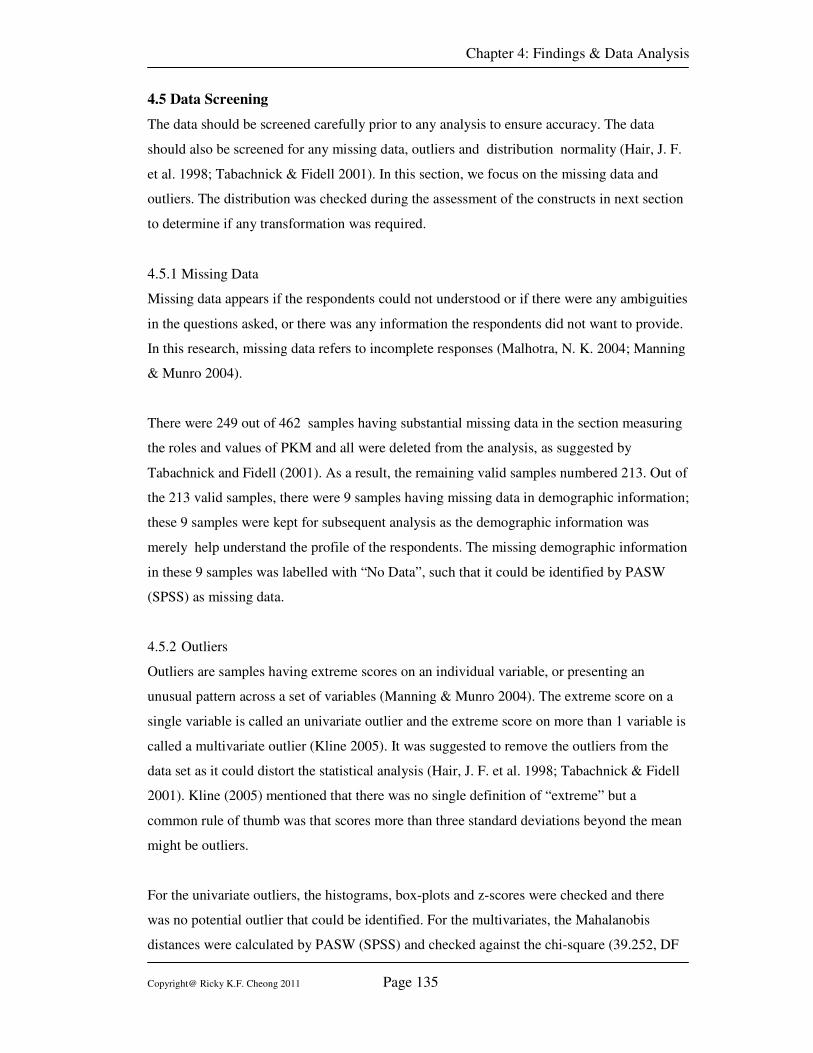
Chapter 4: Findings & Data Analysis
Copyright@ Ricky K.F. Cheong 2011 Page 135
4.5 Data Screening
The data should be screened carefully prior to any analysis to ensure accuracy. The data
should also be screened for any missing data, outliers and distribution normality (Hair, J. F.
et al. 1998; Tabachnick & Fidell 2001). In this section, we focus on the missing data and
outliers. The distribution was checked during the assessment of the constructs in next section
to determine if any transformation was required.
4.5.1 Missing Data
Missing data appears if the respondents could not understood or if there were any ambiguities
in the questions asked, or there was any information the respondents did not want to provide.
In this research, missing data refers to incomplete responses (Malhotra, N. K. 2004; Manning
& Munro 2004).
There were 249 out of 462 samples having substantial missing data in the section measuring
the roles and values of PKM and all were deleted from the analysis, as suggested by
Tabachnick and Fidell (2001). As a result, the remaining valid samples numbered 213. Out of
the 213 valid samples, there were 9 samples having missing data in demographic information;
these 9 samples were kept for subsequent analysis as the demographic information was
merely help understand the profile of the respondents. The missing demographic information
in these 9 samples was labelled with “No Data”, such that it could be identified by PASW
(SPSS) as missing data.
4.5.2 Outliers
Outliers are samples having extreme scores on an individual variable, or presenting an
unusual pattern across a set of variables (Manning & Munro 2004). The extreme score on a
single variable is called an univariate outlier and the extreme score on more than 1 variable is
called a multivariate outlier (Kline 2005). It was suggested to remove the outliers from the
data set as it could distort the statistical analysis (Hair, J. F. et al. 1998; Tabachnick & Fidell
2001). Kline (2005) mentioned that there was no single definition of “extreme” but a
common rule of thumb was that scores more than three standard deviations beyond the mean
might be outliers.
For the univariate outliers, the histograms, box-plots and z-scores were checked and there
was no potential outlier that could be identified. For the multivariates, the Mahalanobis
distances were calculated by PASW (SPSS) and checked against the chi-square (39.252, DF
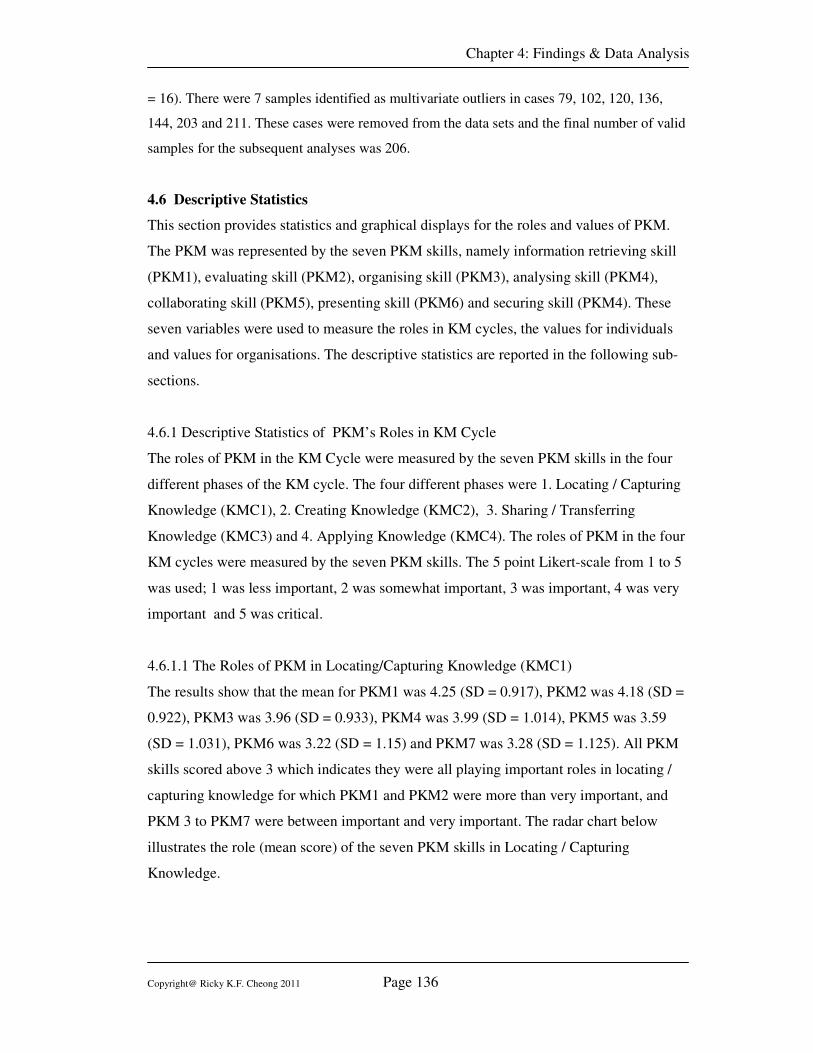
Chapter 4: Findings & Data Analysis
Copyright@ Ricky K.F. Cheong 2011 Page 136
= 16). There were 7 samples identified as multivariate outliers in cases 79, 102, 120, 136,
144, 203 and 211. These cases were removed from the data sets and the final number of valid
samples for the subsequent analyses was 206.
4.6 Descriptive Statistics
This section provides statistics and graphical displays for the roles and values of PKM.
The PKM was represented by the seven PKM skills, namely information retrieving skill
(PKM1), evaluating skill (PKM2), organising skill (PKM3), analysing skill (PKM4),
collaborating skill (PKM5), presenting skill (PKM6) and securing skill (PKM4). These
seven variables were used to measure the roles in KM cycles, the values for individuals
and values for organisations. The descriptive statistics are reported in the following sub-
sections.
4.6.1 Descriptive Statistics of PKM’s Roles in KM Cycle
The roles of PKM in the KM Cycle were measured by the seven PKM skills in the four
different phases of the KM cycle. The four different phases were 1. Locating / Capturing
Knowledge (KMC1), 2. Creating Knowledge (KMC2), 3. Sharing / Transferring
Knowledge (KMC3) and 4. Applying Knowledge (KMC4). The roles of PKM in the four
KM cycles were measured by the seven PKM skills. The 5 point Likert-scale from 1 to 5
was used; 1 was less important, 2 was somewhat important, 3 was important, 4 was very
important and 5 was critical.
4.6.1.1 The Roles of PKM in Locating/Capturing Knowledge (KMC1)
The results show that the mean for PKM1 was 4.25 (SD = 0.917), PKM2 was 4.18 (SD =
0.922), PKM3 was 3.96 (SD = 0.933), PKM4 was 3.99 (SD = 1.014), PKM5 was 3.59
(SD = 1.031), PKM6 was 3.22 (SD = 1.15) and PKM7 was 3.28 (SD = 1.125). All PKM
skills scored above 3 which indicates they were all playing important roles in locating /
capturing knowledge for which PKM1 and PKM2 were more than very important, and
PKM 3 to PKM7 were between important and very important. The radar chart below
illustrates the role (mean score) of the seven PKM skills in Locating / Capturing
Knowledge.
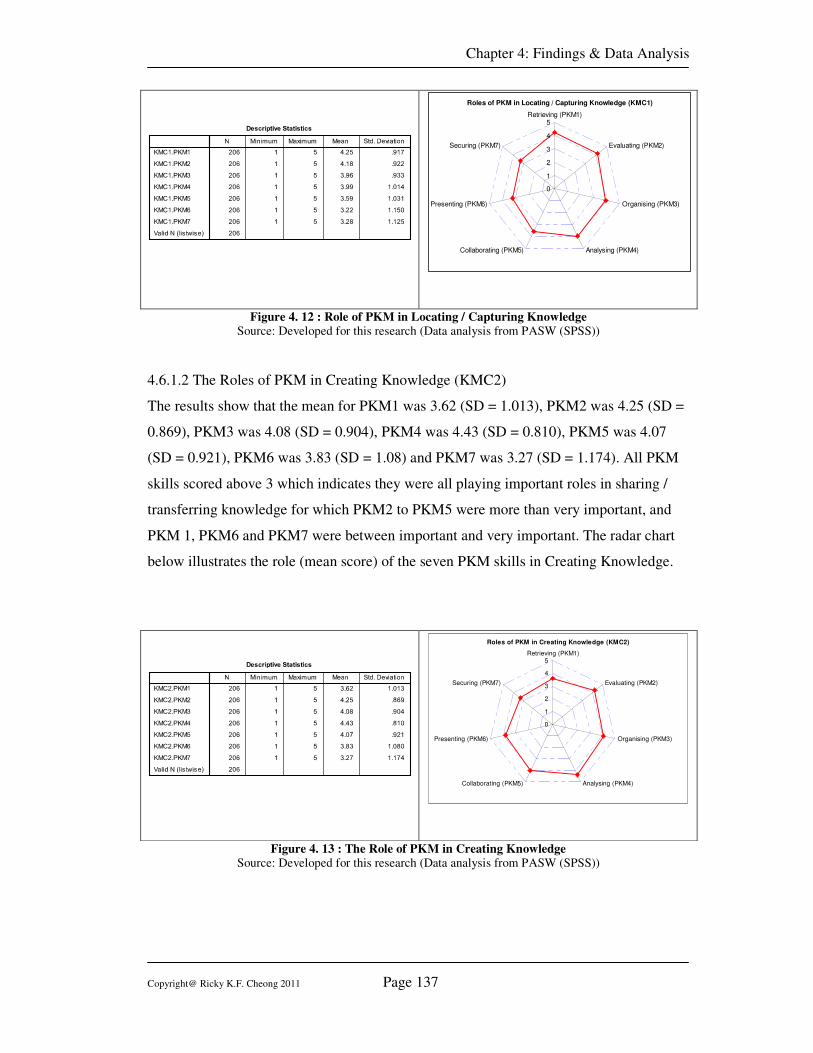
Chapter 4: Findings & Data Analysis
Copyright@ Ricky K.F. Cheong 2011 Page 137
Roles of PKM in Locating / Capturing Knowledge (KMC1)
0
1
2
3
4
5Retrieving (PKM1)
Evaluating (PKM2)
Organising (PKM3)
Analysing (PKM4)Collaborating (PKM5)
Presenting (PKM6)
Securing (PKM7)
Figure 4. 12 : Role of PKM in Locating / Capturing Knowledge
Source: Developed for this research (Data analysis from PASW (SPSS))
4.6.1.2 The Roles of PKM in Creating Knowledge (KMC2)
The results show that the mean for PKM1 was 3.62 (SD = 1.013), PKM2 was 4.25 (SD =
0.869), PKM3 was 4.08 (SD = 0.904), PKM4 was 4.43 (SD = 0.810), PKM5 was 4.07
(SD = 0.921), PKM6 was 3.83 (SD = 1.08) and PKM7 was 3.27 (SD = 1.174). All PKM
skills scored above 3 which indicates they were all playing important roles in sharing /
transferring knowledge for which PKM2 to PKM5 were more than very important, and
PKM 1, PKM6 and PKM7 were between important and very important. The radar chart
below illustrates the role (mean score) of the seven PKM skills in Creating Knowledge.
Roles of PKM in Creating Knowledge (KMC2)
0
1
2
3
4
5Retrieving (PKM1)
Evaluating (PKM2)
Organising (PKM3)
Analysing (PKM4)Collaborating (PKM5)
Presenting (PKM6)
Securing (PKM7)
Figure 4. 13 : The Role of PKM in Creating Knowledge
Source: Developed for this research (Data analysis from PASW (SPSS))
Chapter 4: Findings & Data Analysis
Copyright@ Ricky K.F. Cheong 2011 Page 138
4.6.1.3 The Roles of PKM in Sharing / Transferring Knowledge (KMC3)
The results show that the mean for PKM1 was 3.45 (SD = 1.119), PKM2 was 3.77 (SD =
1.075), PKM3 was 4.10 (SD = 0.827), PKM4 was 3.87 (SD = 0.966), PKM5 was 4.44
(SD = 0.779), PKM6 was 4.53 (SD = 0.730) and PKM7 was 3.42 (SD = 1.135). All PKM
skills scored above 3 which indicates they were all playing important roles in sharing /
transferring knowledge for which PKM3, PKM5 and PKM6 were more than very
important, and PKM 1, PKM2, PKM4 and PKM7 were between important and very
important. The radar chart below illustrates the role (mean score) of the seven PKM skills
Sharing / Transferring Knowledge.
Roles of PKM in Sharing / Transferring Knowledge (KMC3)
0
1
2
3
4
5Retrieving (PKM1)
Evaluating (PKM2)
Organising (PKM3)
Analysing (PKM4)Collaborating (PKM5)
Presenting (PKM6)
Securing (PKM7)
Figure 4. 14 : The Role of PKM in Transferring / Sharing Knowledge Source: Developed for this research (Data analysis from PASW (SPSS))
4.6.1.4 The Roles of PKM in Applying Knowledge (KMC4)
The results show that the mean for PKM1 was 3.52 (SD = 1.090), PKM2 was 4.14 (SD =
0.943), PKM3 was 3.84 (SD = 1.000), PKM4 was 4.39 (SD = 0.774), PKM5 was 4.06
(SD = 0.993), PKM6 was 3.94 (SD = 1.055) and PKM7 was 3.28 (SD = 1.151). All PKM
skills scored above 3 which indicates they were all playing important roles in applying
knowledge for which PKM2, PKM4 and PKM5 were more than very important, and
PKM 1, PKM3, PKM6 and PKM7 were between important and very important. The radar
chart below illustrates the role (mean score) of the seven PKM skills Applying
Knowledge.
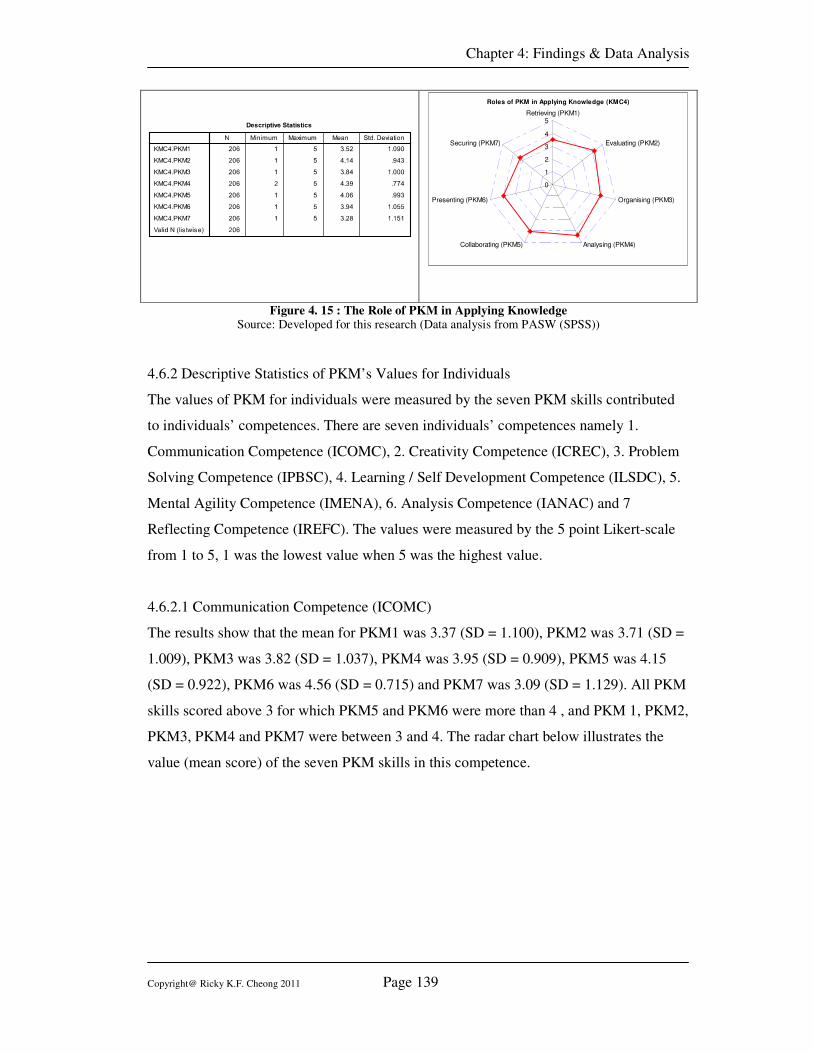
Chapter 4: Findings & Data Analysis
Copyright@ Ricky K.F. Cheong 2011 Page 139
Roles of PKM in Applying Knowledge (KMC4)
0
1
2
3
4
5Retrieving (PKM1)
Evaluating (PKM2)
Organising (PKM3)
Analysing (PKM4)Collaborating (PKM5)
Presenting (PKM6)
Securing (PKM7)
Figure 4. 15 : The Role of PKM in Applying Knowledge Source: Developed for this research (Data analysis from PASW (SPSS))
4.6.2 Descriptive Statistics of PKM’s Values for Individuals
The values of PKM for individuals were measured by the seven PKM skills contributed
to individuals’ competences. There are seven individuals’ competences namely 1.
Communication Competence (ICOMC), 2. Creativity Competence (ICREC), 3. Problem
Solving Competence (IPBSC), 4. Learning / Self Development Competence (ILSDC), 5.
Mental Agility Competence (IMENA), 6. Analysis Competence (IANAC) and 7
Reflecting Competence (IREFC). The values were measured by the 5 point Likert-scale
from 1 to 5, 1 was the lowest value when 5 was the highest value.
4.6.2.1 Communication Competence (ICOMC)
The results show that the mean for PKM1 was 3.37 (SD = 1.100), PKM2 was 3.71 (SD =
1.009), PKM3 was 3.82 (SD = 1.037), PKM4 was 3.95 (SD = 0.909), PKM5 was 4.15
(SD = 0.922), PKM6 was 4.56 (SD = 0.715) and PKM7 was 3.09 (SD = 1.129). All PKM
skills scored above 3 for which PKM5 and PKM6 were more than 4 , and PKM 1, PKM2,
PKM3, PKM4 and PKM7 were between 3 and 4. The radar chart below illustrates the
value (mean score) of the seven PKM skills in this competence.
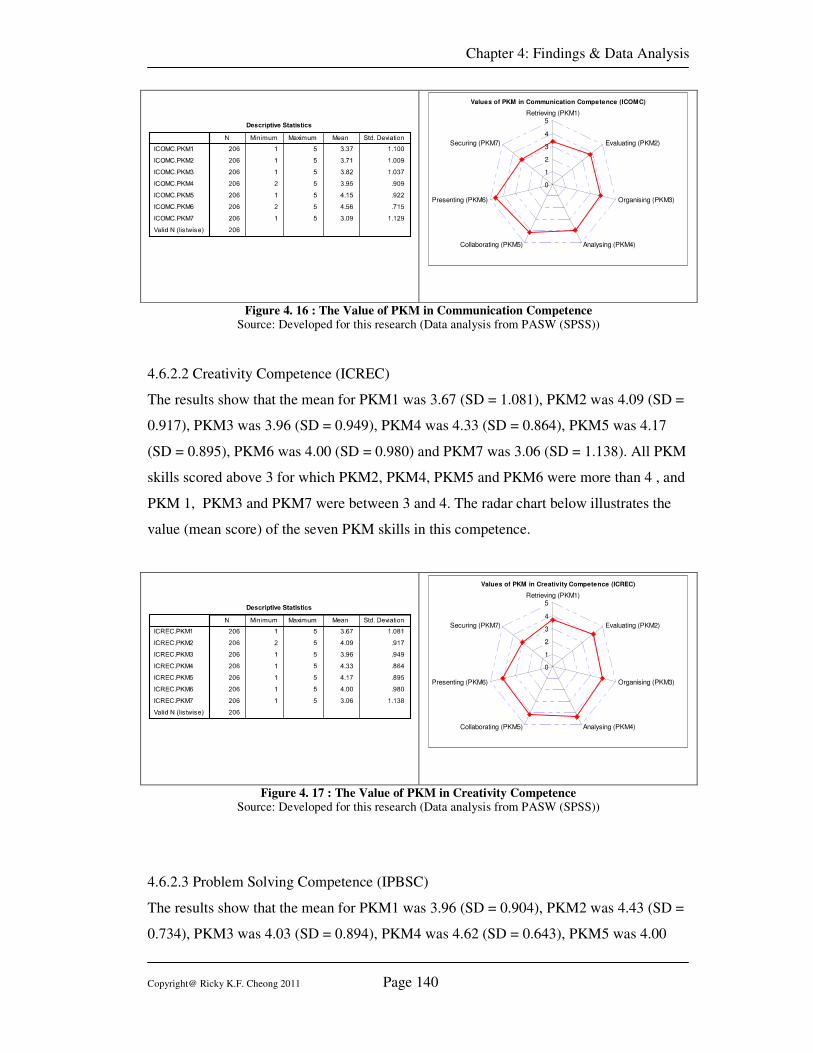
Chapter 4: Findings & Data Analysis
Copyright@ Ricky K.F. Cheong 2011 Page 140
Values of PKM in Communication Competence (ICOMC)
0
1
2
3
4
5Retrieving (PKM1)
Evaluating (PKM2)
Organising (PKM3)
Analysing (PKM4)Collaborating (PKM5)
Presenting (PKM6)
Securing (PKM7)
Figure 4. 16 : The Value of PKM in Communication Competence Source: Developed for this research (Data analysis from PASW (SPSS))
4.6.2.2 Creativity Competence (ICREC)
The results show that the mean for PKM1 was 3.67 (SD = 1.081), PKM2 was 4.09 (SD =
0.917), PKM3 was 3.96 (SD = 0.949), PKM4 was 4.33 (SD = 0.864), PKM5 was 4.17
(SD = 0.895), PKM6 was 4.00 (SD = 0.980) and PKM7 was 3.06 (SD = 1.138). All PKM
skills scored above 3 for which PKM2, PKM4, PKM5 and PKM6 were more than 4 , and
PKM 1, PKM3 and PKM7 were between 3 and 4. The radar chart below illustrates the
value (mean score) of the seven PKM skills in this competence.
Values of PKM in Creativity Competence (ICREC)
0
1
2
3
4
5Retrieving (PKM1)
Evaluating (PKM2)
Organising (PKM3)
Analysing (PKM4)Collaborating (PKM5)
Presenting (PKM6)
Securing (PKM7)
Figure 4. 17 : The Value of PKM in Creativity Competence Source: Developed for this research (Data analysis from PASW (SPSS))
4.6.2.3 Problem Solving Competence (IPBSC)
The results show that the mean for PKM1 was 3.96 (SD = 0.904), PKM2 was 4.43 (SD =
0.734), PKM3 was 4.03 (SD = 0.894), PKM4 was 4.62 (SD = 0.643), PKM5 was 4.00
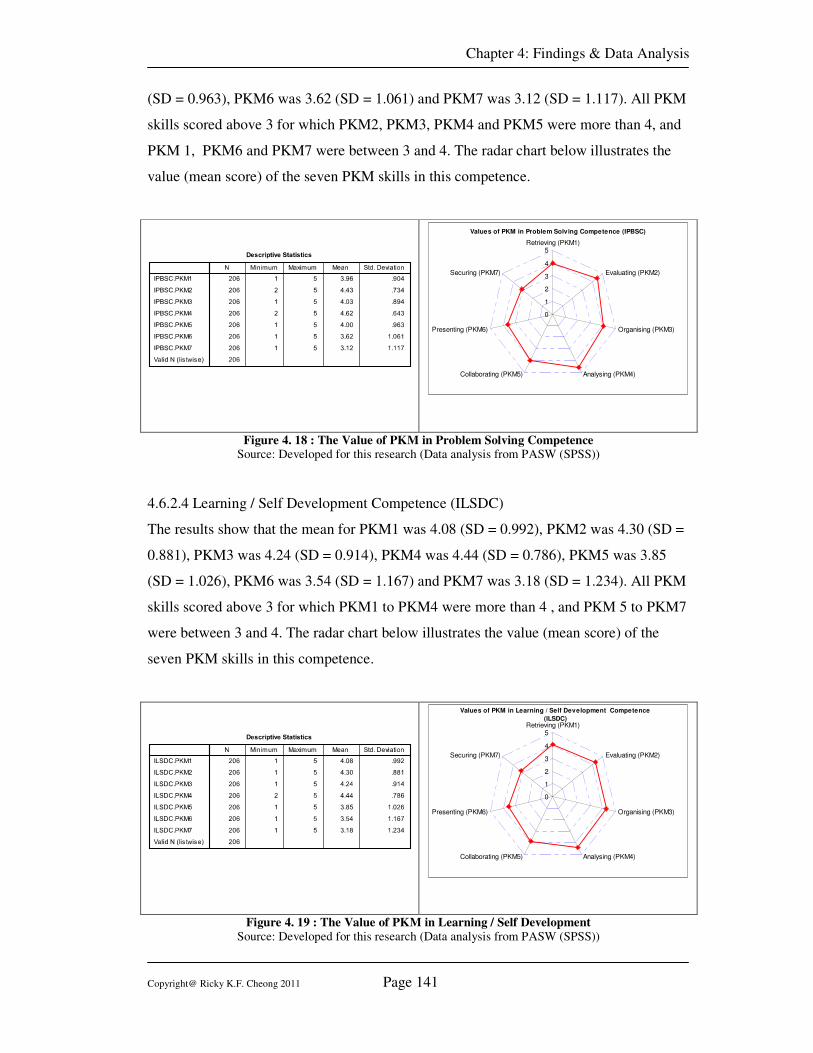
Chapter 4: Findings & Data Analysis
Copyright@ Ricky K.F. Cheong 2011 Page 141
(SD = 0.963), PKM6 was 3.62 (SD = 1.061) and PKM7 was 3.12 (SD = 1.117). All PKM
skills scored above 3 for which PKM2, PKM3, PKM4 and PKM5 were more than 4, and
PKM 1, PKM6 and PKM7 were between 3 and 4. The radar chart below illustrates the
value (mean score) of the seven PKM skills in this competence.
Values of PKM in Problem Solving Competence (IPBSC)
0
1
2
3
4
5Retrieving (PKM1)
Evaluating (PKM2)
Organising (PKM3)
Analysing (PKM4)Collaborating (PKM5)
Presenting (PKM6)
Securing (PKM7)
Figure 4. 18 : The Value of PKM in Problem Solving Competence Source: Developed for this research (Data analysis from PASW (SPSS))
4.6.2.4 Learning / Self Development Competence (ILSDC)
The results show that the mean for PKM1 was 4.08 (SD = 0.992), PKM2 was 4.30 (SD =
0.881), PKM3 was 4.24 (SD = 0.914), PKM4 was 4.44 (SD = 0.786), PKM5 was 3.85
(SD = 1.026), PKM6 was 3.54 (SD = 1.167) and PKM7 was 3.18 (SD = 1.234). All PKM
skills scored above 3 for which PKM1 to PKM4 were more than 4 , and PKM 5 to PKM7
were between 3 and 4. The radar chart below illustrates the value (mean score) of the
seven PKM skills in this competence.
Values of PKM in Learning / Self Development Competence
(ILSDC)
0
1
2
3
4
5Retrieving (PKM1)
Evaluating (PKM2)
Organising (PKM3)
Analysing (PKM4)Collaborating (PKM5)
Presenting (PKM6)
Securing (PKM7)
Figure 4. 19 : The Value of PKM in Learning / Self Development
Source: Developed for this research (Data analysis from PASW (SPSS))
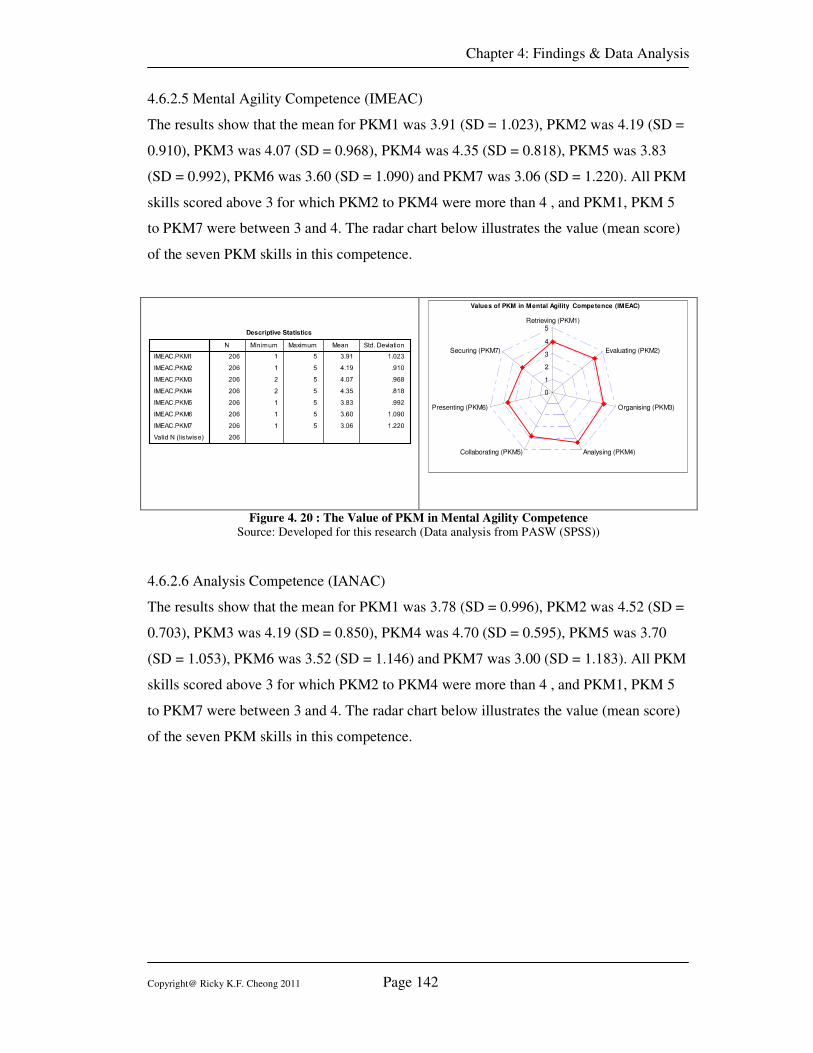
Chapter 4: Findings & Data Analysis
Copyright@ Ricky K.F. Cheong 2011 Page 142
4.6.2.5 Mental Agility Competence (IMEAC)
The results show that the mean for PKM1 was 3.91 (SD = 1.023), PKM2 was 4.19 (SD =
0.910), PKM3 was 4.07 (SD = 0.968), PKM4 was 4.35 (SD = 0.818), PKM5 was 3.83
(SD = 0.992), PKM6 was 3.60 (SD = 1.090) and PKM7 was 3.06 (SD = 1.220). All PKM
skills scored above 3 for which PKM2 to PKM4 were more than 4 , and PKM1, PKM 5
to PKM7 were between 3 and 4. The radar chart below illustrates the value (mean score)
of the seven PKM skills in this competence.
Values of PKM in Mental Agility Competence (IMEAC)
0
1
2
3
4
5Retrieving (PKM1)
Evaluating (PKM2)
Organising (PKM3)
Analysing (PKM4)Collaborating (PKM5)
Presenting (PKM6)
Securing (PKM7)
Figure 4. 20 : The Value of PKM in Mental Agility Competence
Source: Developed for this research (Data analysis from PASW (SPSS))
4.6.2.6 Analysis Competence (IANAC)
The results show that the mean for PKM1 was 3.78 (SD = 0.996), PKM2 was 4.52 (SD =
0.703), PKM3 was 4.19 (SD = 0.850), PKM4 was 4.70 (SD = 0.595), PKM5 was 3.70
(SD = 1.053), PKM6 was 3.52 (SD = 1.146) and PKM7 was 3.00 (SD = 1.183). All PKM
skills scored above 3 for which PKM2 to PKM4 were more than 4 , and PKM1, PKM 5
to PKM7 were between 3 and 4. The radar chart below illustrates the value (mean score)
of the seven PKM skills in this competence.
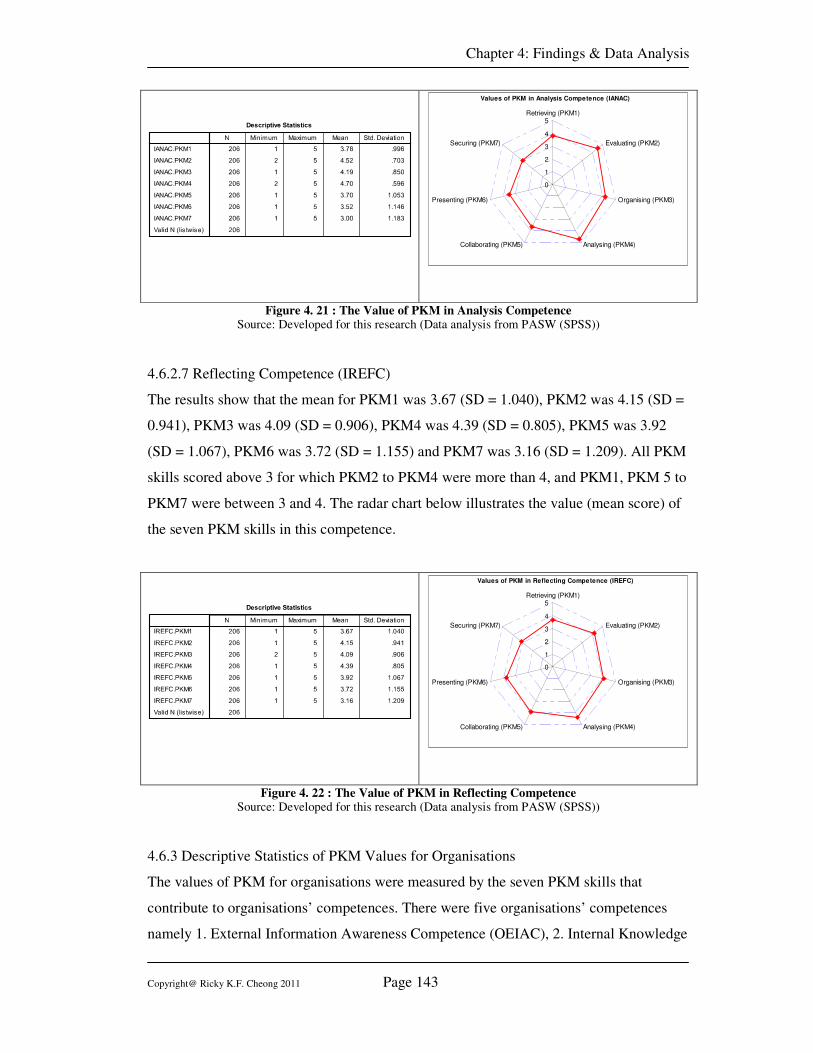
Chapter 4: Findings & Data Analysis
Copyright@ Ricky K.F. Cheong 2011 Page 143
Values of PKM in Analysis Competence (IANAC)
0
1
2
3
4
5Retrieving (PKM1)
Evaluating (PKM2)
Organising (PKM3)
Analysing (PKM4)Collaborating (PKM5)
Presenting (PKM6)
Securing (PKM7)
Figure 4. 21 : The Value of PKM in Analysis Competence Source: Developed for this research (Data analysis from PASW (SPSS))
4.6.2.7 Reflecting Competence (IREFC)
The results show that the mean for PKM1 was 3.67 (SD = 1.040), PKM2 was 4.15 (SD =
0.941), PKM3 was 4.09 (SD = 0.906), PKM4 was 4.39 (SD = 0.805), PKM5 was 3.92
(SD = 1.067), PKM6 was 3.72 (SD = 1.155) and PKM7 was 3.16 (SD = 1.209). All PKM
skills scored above 3 for which PKM2 to PKM4 were more than 4, and PKM1, PKM 5 to
PKM7 were between 3 and 4. The radar chart below illustrates the value (mean score) of
the seven PKM skills in this competence.
Values of PKM in Reflecting Competence (IREFC)
0
1
2
3
4
5Retrieving (PKM1)
Evaluating (PKM2)
Organising (PKM3)
Analysing (PKM4)Collaborating (PKM5)
Presenting (PKM6)
Securing (PKM7)
Figure 4. 22 : The Value of PKM in Reflecting Competence Source: Developed for this research (Data analysis from PASW (SPSS))
4.6.3 Descriptive Statistics of PKM Values for Organisations
The values of PKM for organisations were measured by the seven PKM skills that
contribute to organisations’ competences. There were five organisations’ competences
namely 1. External Information Awareness Competence (OEIAC), 2. Internal Knowledge
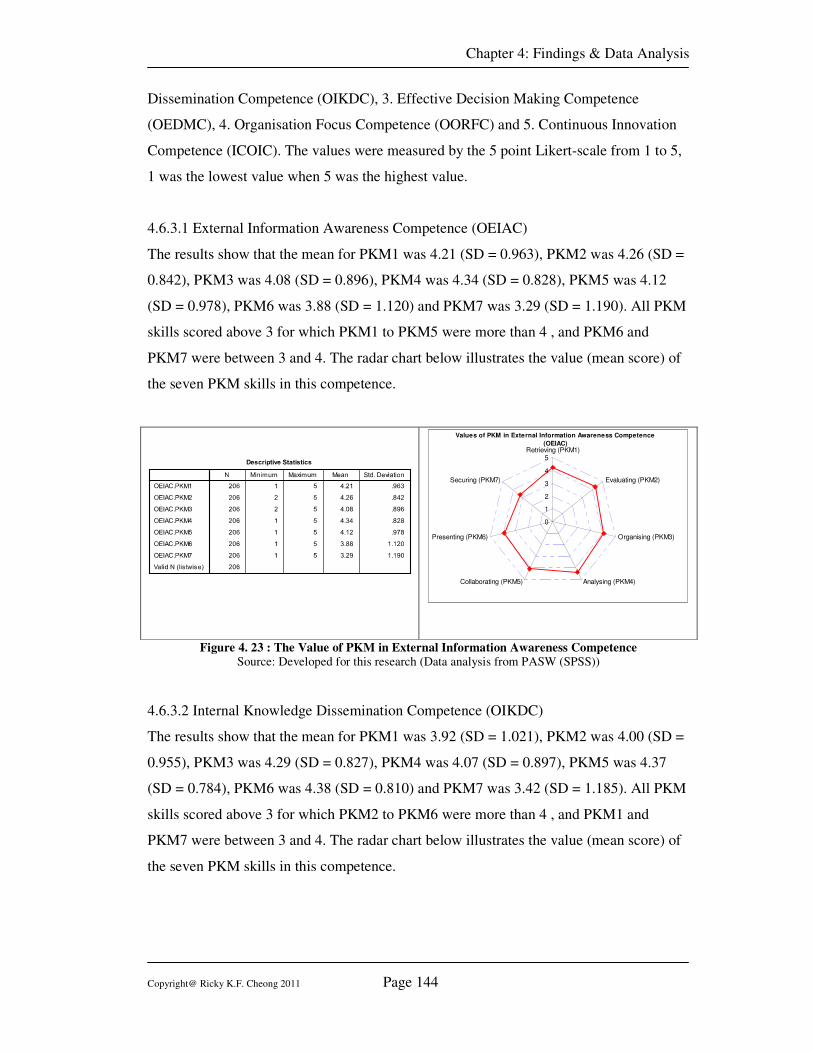
Chapter 4: Findings & Data Analysis
Copyright@ Ricky K.F. Cheong 2011 Page 144
Dissemination Competence (OIKDC), 3. Effective Decision Making Competence
(OEDMC), 4. Organisation Focus Competence (OORFC) and 5. Continuous Innovation
Competence (ICOIC). The values were measured by the 5 point Likert-scale from 1 to 5,
1 was the lowest value when 5 was the highest value.
4.6.3.1 External Information Awareness Competence (OEIAC)
The results show that the mean for PKM1 was 4.21 (SD = 0.963), PKM2 was 4.26 (SD =
0.842), PKM3 was 4.08 (SD = 0.896), PKM4 was 4.34 (SD = 0.828), PKM5 was 4.12
(SD = 0.978), PKM6 was 3.88 (SD = 1.120) and PKM7 was 3.29 (SD = 1.190). All PKM
skills scored above 3 for which PKM1 to PKM5 were more than 4 , and PKM6 and
PKM7 were between 3 and 4. The radar chart below illustrates the value (mean score) of
the seven PKM skills in this competence.
Values of PKM in External Information Awareness Competence
(OEIAC)
0
1
2
3
4
5Retrieving (PKM1)
Evaluating (PKM2)
Organising (PKM3)
Analysing (PKM4)Collaborating (PKM5)
Presenting (PKM6)
Securing (PKM7)
Figure 4. 23 : The Value of PKM in External Information Awareness Competence
Source: Developed for this research (Data analysis from PASW (SPSS))
4.6.3.2 Internal Knowledge Dissemination Competence (OIKDC)
The results show that the mean for PKM1 was 3.92 (SD = 1.021), PKM2 was 4.00 (SD =
0.955), PKM3 was 4.29 (SD = 0.827), PKM4 was 4.07 (SD = 0.897), PKM5 was 4.37
(SD = 0.784), PKM6 was 4.38 (SD = 0.810) and PKM7 was 3.42 (SD = 1.185). All PKM
skills scored above 3 for which PKM2 to PKM6 were more than 4 , and PKM1 and
PKM7 were between 3 and 4. The radar chart below illustrates the value (mean score) of
the seven PKM skills in this competence.
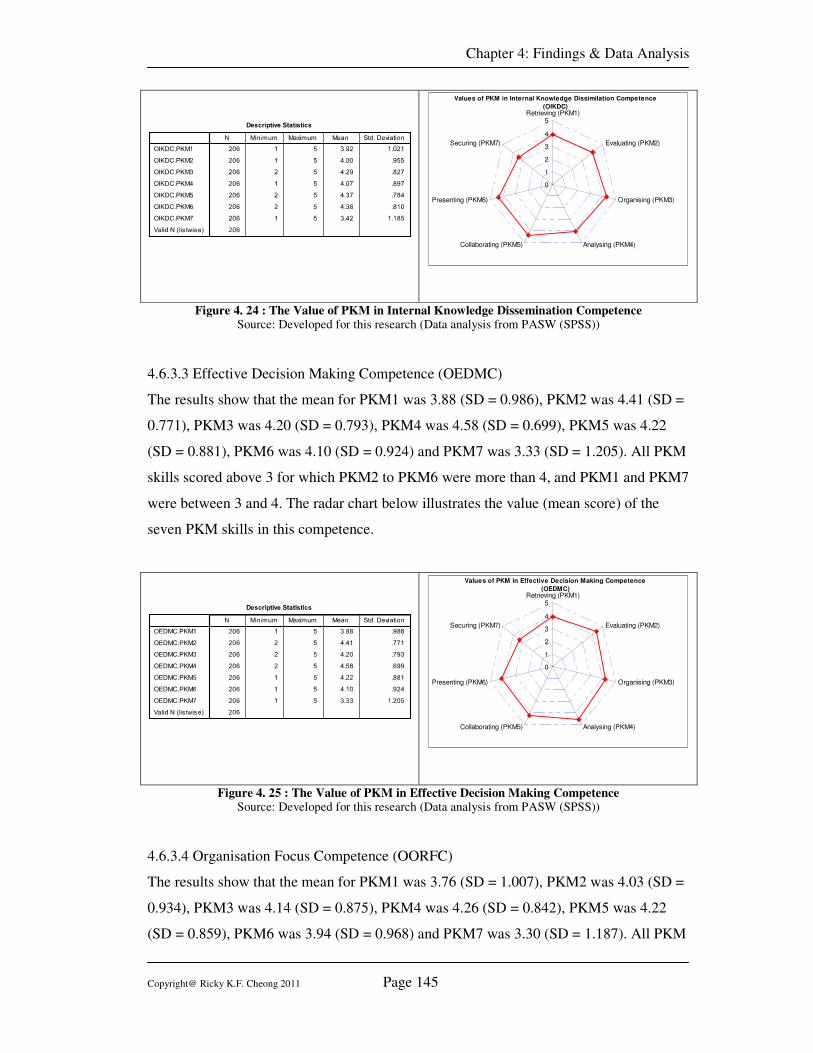
Chapter 4: Findings & Data Analysis
Copyright@ Ricky K.F. Cheong 2011 Page 145
Values of PKM in Internal Knowledge Dissimilation Competence
(OIKDC)
0
1
2
3
4
5Retrieving (PKM1)
Evaluating (PKM2)
Organising (PKM3)
Analysing (PKM4)Collaborating (PKM5)
Presenting (PKM6)
Securing (PKM7)
Figure 4. 24 : The Value of PKM in Internal Knowledge Dissemination Competence Source: Developed for this research (Data analysis from PASW (SPSS))
4.6.3.3 Effective Decision Making Competence (OEDMC)
The results show that the mean for PKM1 was 3.88 (SD = 0.986), PKM2 was 4.41 (SD =
0.771), PKM3 was 4.20 (SD = 0.793), PKM4 was 4.58 (SD = 0.699), PKM5 was 4.22
(SD = 0.881), PKM6 was 4.10 (SD = 0.924) and PKM7 was 3.33 (SD = 1.205). All PKM
skills scored above 3 for which PKM2 to PKM6 were more than 4, and PKM1 and PKM7
were between 3 and 4. The radar chart below illustrates the value (mean score) of the
seven PKM skills in this competence.
Values of PKM in Effective Decision Making Competence
(OEDMC)
0
1
2
3
4
5Retrieving (PKM1)
Evaluating (PKM2)
Organising (PKM3)
Analysing (PKM4)Collaborating (PKM5)
Presenting (PKM6)
Securing (PKM7)
Figure 4. 25 : The Value of PKM in Effective Decision Making Competence Source: Developed for this research (Data analysis from PASW (SPSS))
4.6.3.4 Organisation Focus Competence (OORFC)
The results show that the mean for PKM1 was 3.76 (SD = 1.007), PKM2 was 4.03 (SD =
0.934), PKM3 was 4.14 (SD = 0.875), PKM4 was 4.26 (SD = 0.842), PKM5 was 4.22
(SD = 0.859), PKM6 was 3.94 (SD = 0.968) and PKM7 was 3.30 (SD = 1.187). All PKM
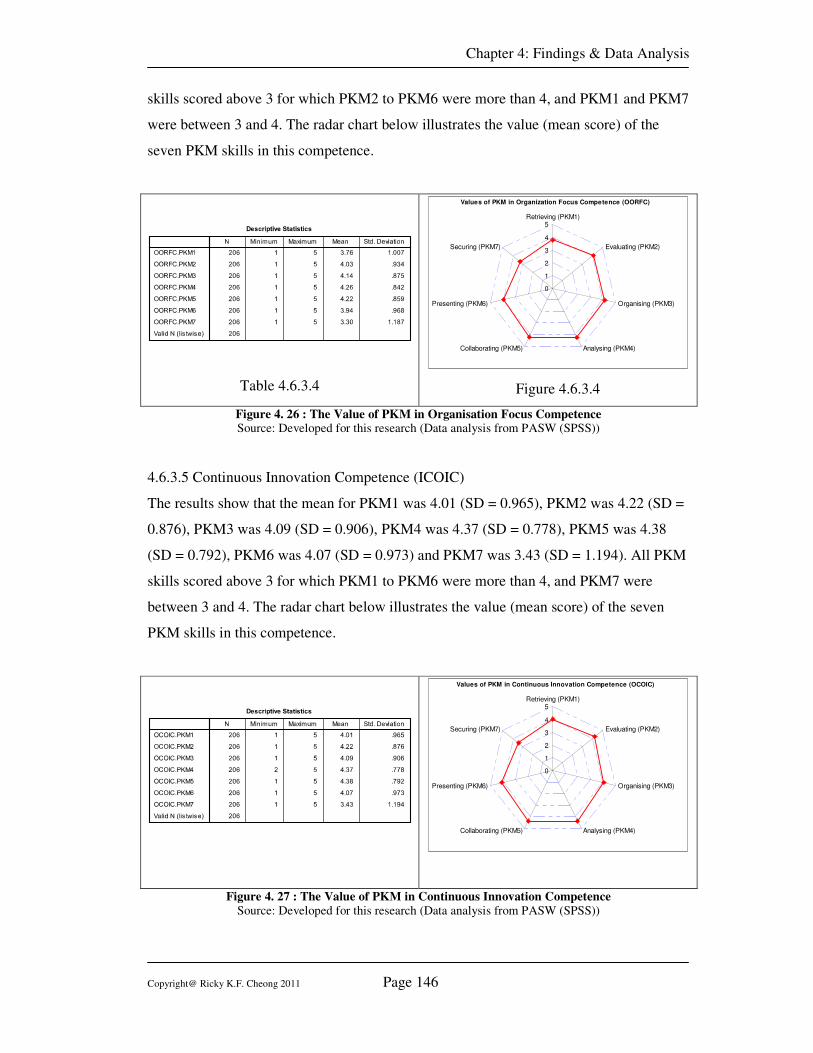
Chapter 4: Findings & Data Analysis
Copyright@ Ricky K.F. Cheong 2011 Page 146
skills scored above 3 for which PKM2 to PKM6 were more than 4, and PKM1 and PKM7
were between 3 and 4. The radar chart below illustrates the value (mean score) of the
seven PKM skills in this competence.
Table 4.6.3.4
Values of PKM in Organization Focus Competence (OORFC)
0
1
2
3
4
5Retrieving (PKM1)
Evaluating (PKM2)
Organising (PKM3)
Analysing (PKM4)Collaborating (PKM5)
Presenting (PKM6)
Securing (PKM7)
Figure 4.6.3.4
Figure 4. 26 : The Value of PKM in Organisation Focus Competence Source: Developed for this research (Data analysis from PASW (SPSS))
4.6.3.5 Continuous Innovation Competence (ICOIC)
The results show that the mean for PKM1 was 4.01 (SD = 0.965), PKM2 was 4.22 (SD =
0.876), PKM3 was 4.09 (SD = 0.906), PKM4 was 4.37 (SD = 0.778), PKM5 was 4.38
(SD = 0.792), PKM6 was 4.07 (SD = 0.973) and PKM7 was 3.43 (SD = 1.194). All PKM
skills scored above 3 for which PKM1 to PKM6 were more than 4, and PKM7 were
between 3 and 4. The radar chart below illustrates the value (mean score) of the seven
PKM skills in this competence.
Values of PKM in Continuous Innovation Competence (OCOIC)
0
1
2
3
4
5Retrieving (PKM1)
Evaluating (PKM2)
Organising (PKM3)
Analysing (PKM4)Collaborating (PKM5)
Presenting (PKM6)
Securing (PKM7)
Figure 4. 27 : The Value of PKM in Continuous Innovation Competence
Source: Developed for this research (Data analysis from PASW (SPSS))
Chapter 4: Findings & Data Analysis
Copyright@ Ricky K.F. Cheong 2011 Page 147
4.7 Constructs Assessment
In this research, there were three main concepts measured, the roles of PKM in KM
processes (PKM), values of PKM for the individual (IV_PKM) and values of PKM for
the organisation (OV_PKM). There were seven constructs in each of these concepts.
These seven constructs that represent the PKM skills are, Information Retrieving
(PKM1), Information Evaluating (PKM2), Information Organising (PKM3), Information
Analysing (PKM4), Information Collaborating (PKM5), Information Presenting (PKM6),
Information Securing (PKM7).
The validity and reliability of each construct were assessed by Exploratory Factor
Analysis (EFA) and Cronbach’s Alpha Coefficients. The normality was checked to
determine if any transformation was required prior to performing any multivariate
analysis.
The EFA used Pearson correlations and Principal Components Analysis (PCA). For the
Pearson correlations, the item-to-item correlations should exceed 0.3 and item-to total
correlations should exceed 0.5 (Hair, J. F. et al. 1998). For the PCA, there should be only
one eigenvalue greater than 1 and the loading factors are all > 0.5. For the Cronbach’s
Alpha coefficient, the values >0.6 were acceptable for exploratory study, >0.7 were
acceptable, >0.8 were good and >0.9 were excellent as suggested by Hair et al (1998) and
Sekaran (2003).
Data normality is a common prerequisite in most multivariate analyses (Kline 2005). A
skewness and kurtosis test was done by PASW (SPSS) and the Z-score calculated for each of
the four composite variables. This Z-Score was used to check the significance of the
skewness by dividing the statistical value of skewness and the standard error of skewness
(Tabachnick & Fidell 2001). For samples size less than 300, the data will be non-normal if
the skewness is significant, which is indicated when the absolute value of the Z-score exceeds
the Z standard value of 2.58 (Tabachnick & Fidell 2001). The same testing was performed to
determine if there was significant kurtosis.
The following sections describe the assessment of each of the constructs.
Chapter 4: Findings & Data Analysis
Copyright@ Ricky K.F. Cheong 2011 Page 148
4.7.1 Roles of PKM in KM Process Cycle (PKM)
There were seven constructs under this concept which measured the roles of PKM in each
of the KM Processes, namely 1. Capture/Locate (KMC1), 2. Transfer (KMC2), 3. Create
(KMC3) and 4. Apply (KMC4). The following section assesses each constructs in this
concept.
4.7.1.1 The Roles of Information Retrieving (PKM1)
A composite variable PKM1 was calculated by taking the average of the 4 fours
variables, namely KMC1.PKM1, KMC2.PKM1, KMC3.PKM1 and KMC4.PKM1. The
Pearson correlations of these four variables and the composite variable were calculated by
PASW (SPSS). The item-to-item correlations should exceed 0.3 and item-to-total
correlations should exceed 0.5, as suggested by Hair et al (1998). KMC4.PKM1 was
found not to meet this requirement and was removed. A new composite variable PKM1A
was created by the remaining three variables. The Pearson correlations were recalculated
and the results indicated that the item-to-item correlations exceeded 0.3 (from 0.324 to
0.601, p<0.01) and the item-to-total exceeded 0.5 (from 0.717 to 0.864, p<0.01).
The PCA was performed and there was only one eigenvalue greater than 1 and the
loading factors were all > 0.5 (from 0.772 to 0.782), which indicated that these three
variables measured the same construct (Hair, J. F. et al. 1998).
The reliability of this construct was measured by Cronbach’s Alpha and the result was
0.724, which indicated acceptable reliability, as suggested by Hair et al (1998) and
Sekaran (2003).
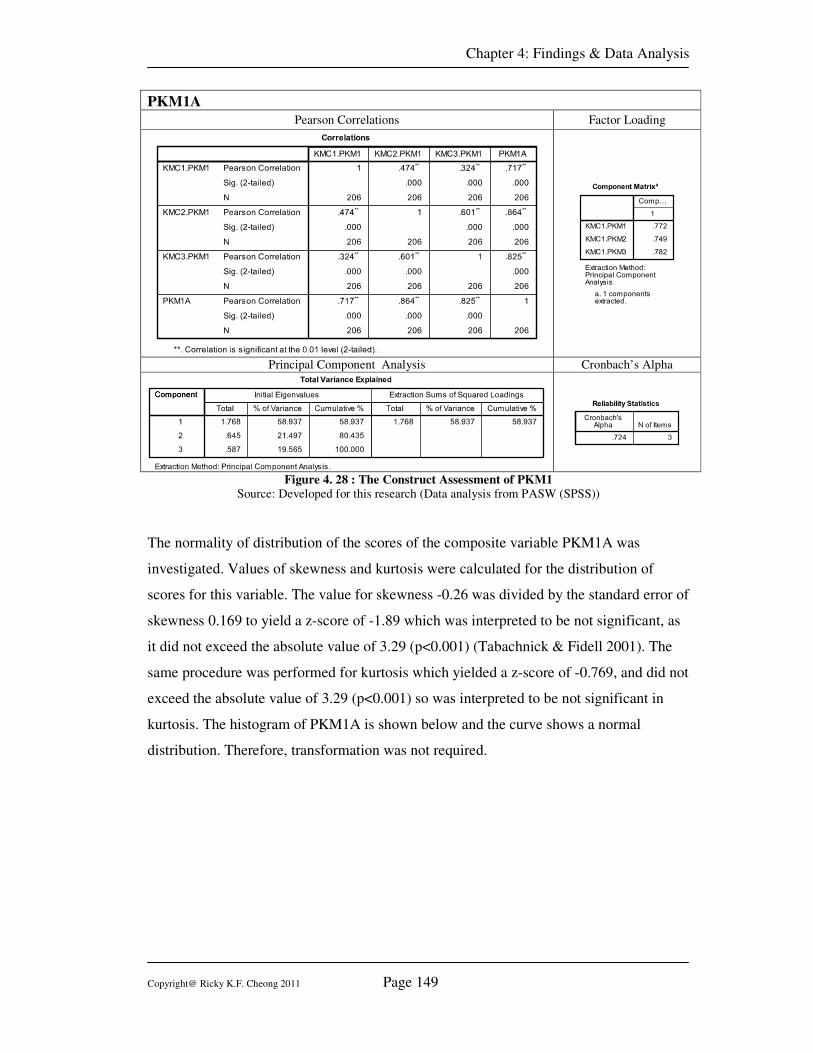
Chapter 4: Findings & Data Analysis
Copyright@ Ricky K.F. Cheong 2011 Page 149
PKM1A
Pearson Correlations Factor Loading
Principal Component Analysis Cronbach’s Alpha
Figure 4. 28 : The Construct Assessment of PKM1
Source: Developed for this research (Data analysis from PASW (SPSS))
The normality of distribution of the scores of the composite variable PKM1A was
investigated. Values of skewness and kurtosis were calculated for the distribution of
scores for this variable. The value for skewness -0.26 was divided by the standard error of
skewness 0.169 to yield a z-score of -1.89 which was interpreted to be not significant, as
it did not exceed the absolute value of 3.29 (p<0.001) (Tabachnick & Fidell 2001). The
same procedure was performed for kurtosis which yielded a z-score of -0.769, and did not
exceed the absolute value of 3.29 (p<0.001) so was interpreted to be not significant in
kurtosis. The histogram of PKM1A is shown below and the curve shows a normal
distribution. Therefore, transformation was not required.
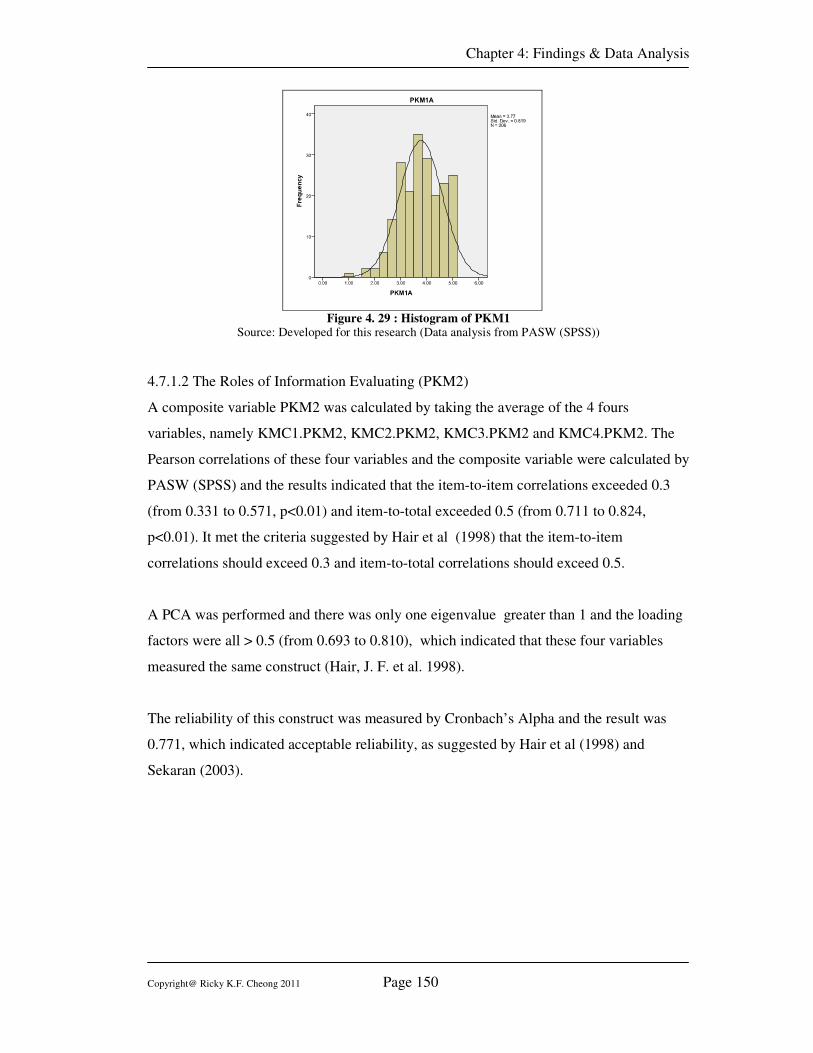
Chapter 4: Findings & Data Analysis
Copyright@ Ricky K.F. Cheong 2011 Page 150
Figure 4. 29 : Histogram of PKM1 Source: Developed for this research (Data analysis from PASW (SPSS))
4.7.1.2 The Roles of Information Evaluating (PKM2)
A composite variable PKM2 was calculated by taking the average of the 4 fours
variables, namely KMC1.PKM2, KMC2.PKM2, KMC3.PKM2 and KMC4.PKM2. The
Pearson correlations of these four variables and the composite variable were calculated by
PASW (SPSS) and the results indicated that the item-to-item correlations exceeded 0.3
(from 0.331 to 0.571, p<0.01) and item-to-total exceeded 0.5 (from 0.711 to 0.824,
p<0.01). It met the criteria suggested by Hair et al (1998) that the item-to-item
correlations should exceed 0.3 and item-to-total correlations should exceed 0.5.
A PCA was performed and there was only one eigenvalue greater than 1 and the loading
factors were all > 0.5 (from 0.693 to 0.810), which indicated that these four variables
measured the same construct (Hair, J. F. et al. 1998).
The reliability of this construct was measured by Cronbach’s Alpha and the result was
0.771, which indicated acceptable reliability, as suggested by Hair et al (1998) and
Sekaran (2003).
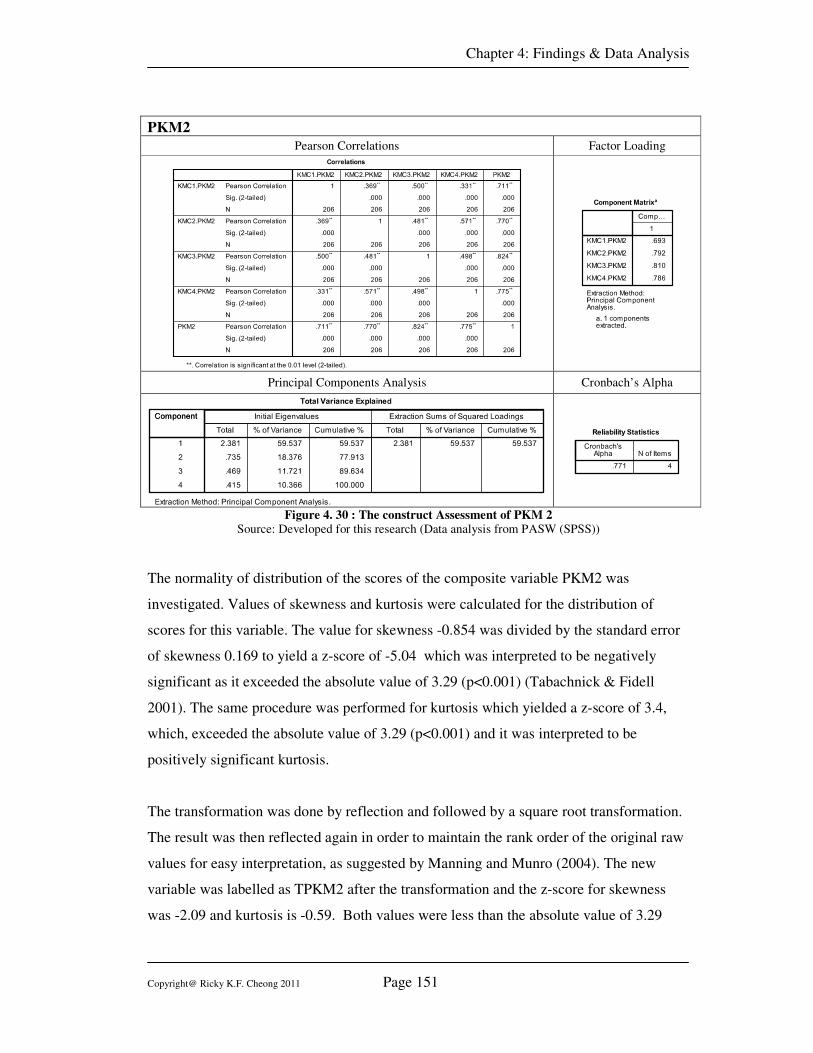
Chapter 4: Findings & Data Analysis
Copyright@ Ricky K.F. Cheong 2011 Page 151
PKM2
Pearson Correlations Factor Loading
Principal Components Analysis Cronbach’s Alpha
Figure 4. 30 : The construct Assessment of PKM 2
Source: Developed for this research (Data analysis from PASW (SPSS))
The normality of distribution of the scores of the composite variable PKM2 was
investigated. Values of skewness and kurtosis were calculated for the distribution of
scores for this variable. The value for skewness -0.854 was divided by the standard error
of skewness 0.169 to yield a z-score of -5.04 which was interpreted to be negatively
significant as it exceeded the absolute value of 3.29 (p<0.001) (Tabachnick & Fidell
2001). The same procedure was performed for kurtosis which yielded a z-score of 3.4,
which, exceeded the absolute value of 3.29 (p<0.001) and it was interpreted to be
positively significant kurtosis.
The transformation was done by reflection and followed by a square root transformation.
The result was then reflected again in order to maintain the rank order of the original raw
values for easy interpretation, as suggested by Manning and Munro (2004). The new
variable was labelled as TPKM2 after the transformation and the z-score for skewness
was -2.09 and kurtosis is -0.59. Both values were less than the absolute value of 3.29
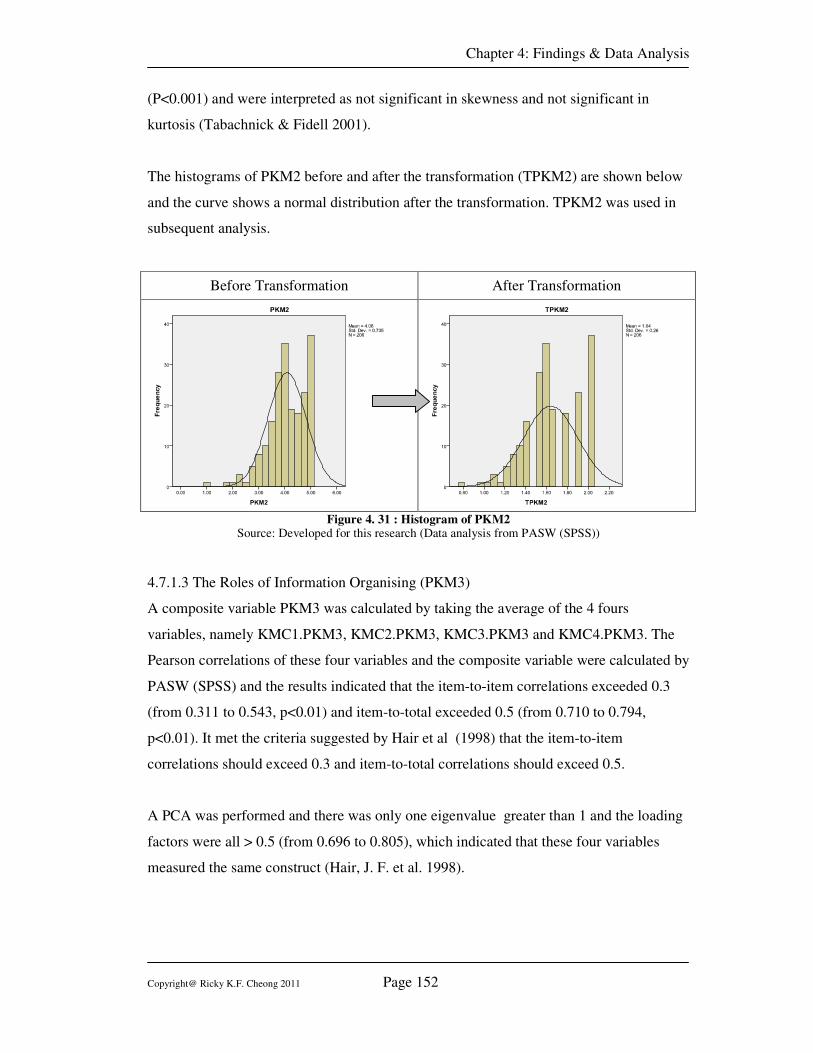
Chapter 4: Findings & Data Analysis
Copyright@ Ricky K.F. Cheong 2011 Page 152
(P<0.001) and were interpreted as not significant in skewness and not significant in
kurtosis (Tabachnick & Fidell 2001).
The histograms of PKM2 before and after the transformation (TPKM2) are shown below
and the curve shows a normal distribution after the transformation. TPKM2 was used in
subsequent analysis.
Before Transformation After Transformation
Figure 4. 31 : Histogram of PKM2
Source: Developed for this research (Data analysis from PASW (SPSS))
4.7.1.3 The Roles of Information Organising (PKM3)
A composite variable PKM3 was calculated by taking the average of the 4 fours
variables, namely KMC1.PKM3, KMC2.PKM3, KMC3.PKM3 and KMC4.PKM3. The
Pearson correlations of these four variables and the composite variable were calculated by
PASW (SPSS) and the results indicated that the item-to-item correlations exceeded 0.3
(from 0.311 to 0.543, p<0.01) and item-to-total exceeded 0.5 (from 0.710 to 0.794,
p<0.01). It met the criteria suggested by Hair et al (1998) that the item-to-item
correlations should exceed 0.3 and item-to-total correlations should exceed 0.5.
A PCA was performed and there was only one eigenvalue greater than 1 and the loading
factors were all > 0.5 (from 0.696 to 0.805), which indicated that these four variables
measured the same construct (Hair, J. F. et al. 1998).

Chapter 4: Findings & Data Analysis
Copyright@ Ricky K.F. Cheong 2011 Page 153
The reliability of this construct was measured by Cronbach’s Alpha and the result was
0.749 which indicated acceptable reliability, as suggested by Hair et al (1998) and
Sekaran (2003).
PKM3
Pearson Correlations Factor Loading
Principal Components Analysis Cronbach’s Alpha
Figure 4. 32 : Construct Assessment of PKM3 Source: Developed for this research (Data analysis from PASW (SPSS))
The normality of distribution of the scores of the composite variable PKM3 was
investigated. Values of skewness and kurtosis were calculated for the distribution of
scores for this variable. The value for skewness -0.582 was divided by the standard error
of skewness 0.169 to yield a z-score of -3.43, which was interpreted to be a negatively
significant as it exceeded the absolute value of 3.29 (p<0.001) (Tabachnick & Fidell
2001). The same procedure was performed for kurtosis which yielded a z-score of 1.95,
and did not exceed the absolute value of 3.29 (p<0.001) and was interpreted to be not
significant in kurtosis.
The transformation was done by reflection and followed by a square root transformation.
The result was then reflected again in order to maintain the rank order of the original raw
values for easy interpretation, as suggested by Manning and Munro (2004). The new
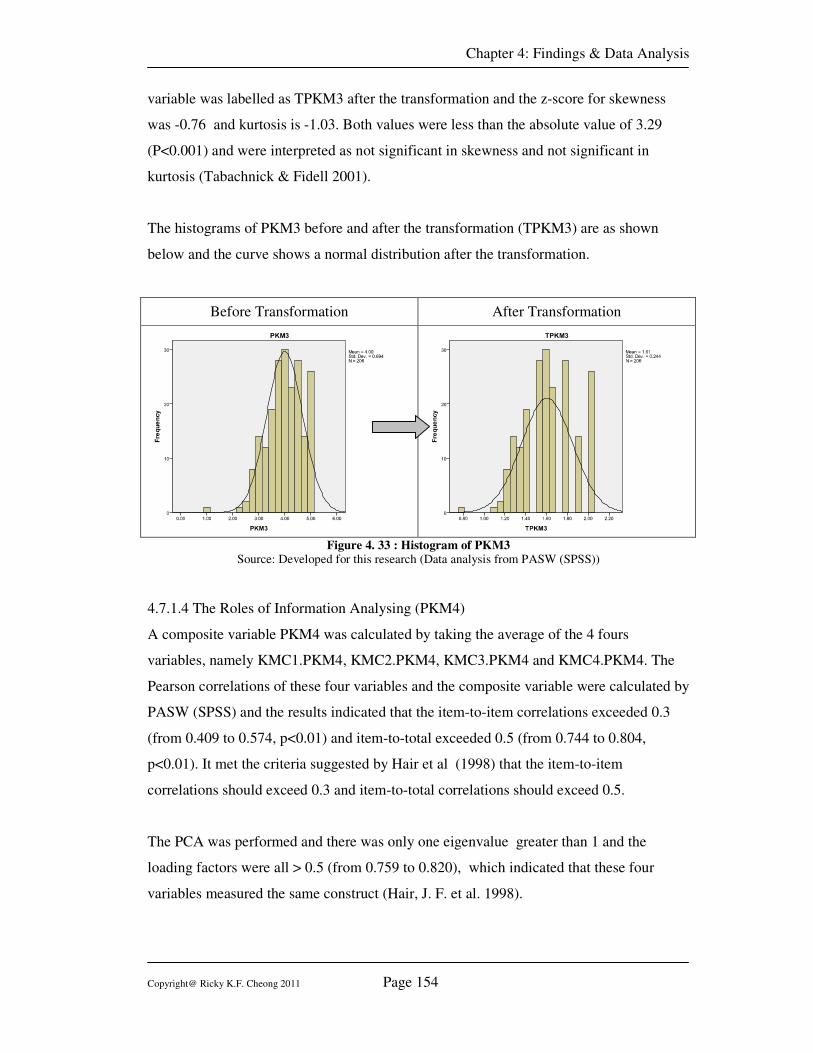
Chapter 4: Findings & Data Analysis
Copyright@ Ricky K.F. Cheong 2011 Page 154
variable was labelled as TPKM3 after the transformation and the z-score for skewness
was -0.76 and kurtosis is -1.03. Both values were less than the absolute value of 3.29
(P<0.001) and were interpreted as not significant in skewness and not significant in
kurtosis (Tabachnick & Fidell 2001).
The histograms of PKM3 before and after the transformation (TPKM3) are as shown
below and the curve shows a normal distribution after the transformation.
Before Transformation After Transformation
Figure 4. 33 : Histogram of PKM3
Source: Developed for this research (Data analysis from PASW (SPSS))
4.7.1.4 The Roles of Information Analysing (PKM4)
A composite variable PKM4 was calculated by taking the average of the 4 fours
variables, namely KMC1.PKM4, KMC2.PKM4, KMC3.PKM4 and KMC4.PKM4. The
Pearson correlations of these four variables and the composite variable were calculated by
PASW (SPSS) and the results indicated that the item-to-item correlations exceeded 0.3
(from 0.409 to 0.574, p<0.01) and item-to-total exceeded 0.5 (from 0.744 to 0.804,
p<0.01). It met the criteria suggested by Hair et al (1998) that the item-to-item
correlations should exceed 0.3 and item-to-total correlations should exceed 0.5.
The PCA was performed and there was only one eigenvalue greater than 1 and the
loading factors were all > 0.5 (from 0.759 to 0.820), which indicated that these four
variables measured the same construct (Hair, J. F. et al. 1998).
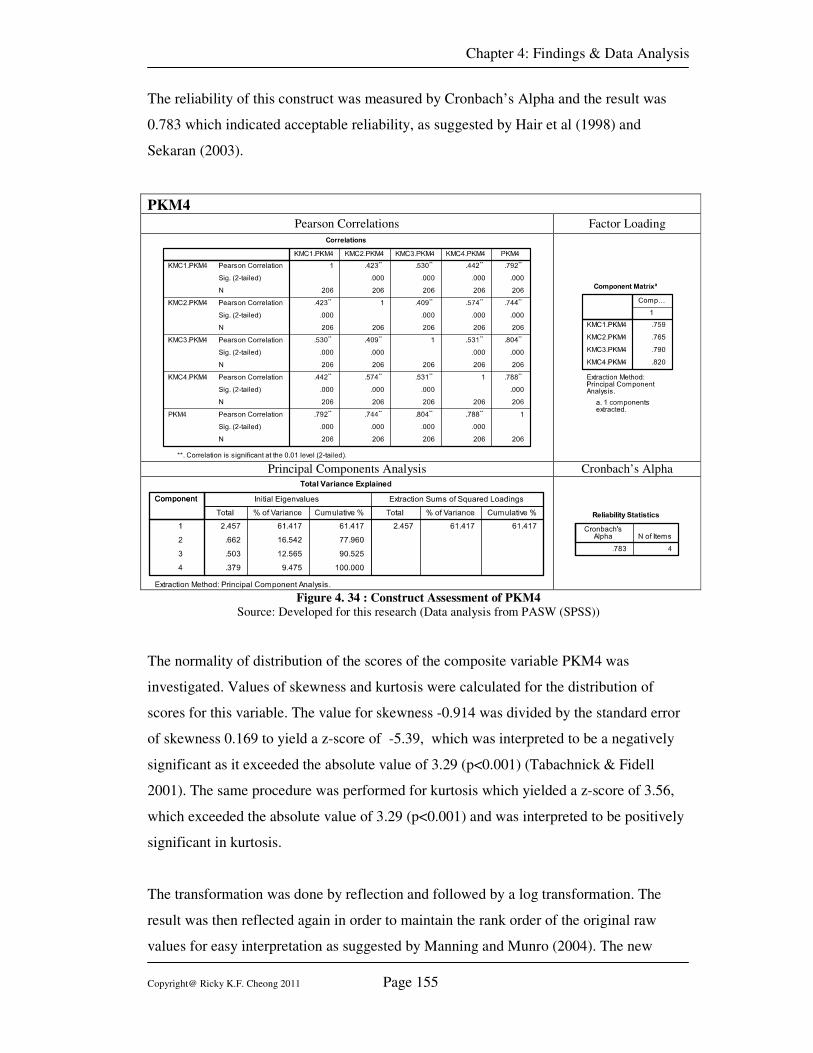
Chapter 4: Findings & Data Analysis
Copyright@ Ricky K.F. Cheong 2011 Page 155
The reliability of this construct was measured by Cronbach’s Alpha and the result was
0.783 which indicated acceptable reliability, as suggested by Hair et al (1998) and
Sekaran (2003).
PKM4
Pearson Correlations Factor Loading
Principal Components Analysis Cronbach’s Alpha
Figure 4. 34 : Construct Assessment of PKM4
Source: Developed for this research (Data analysis from PASW (SPSS))
The normality of distribution of the scores of the composite variable PKM4 was
investigated. Values of skewness and kurtosis were calculated for the distribution of
scores for this variable. The value for skewness -0.914 was divided by the standard error
of skewness 0.169 to yield a z-score of -5.39, which was interpreted to be a negatively
significant as it exceeded the absolute value of 3.29 (p<0.001) (Tabachnick & Fidell
2001). The same procedure was performed for kurtosis which yielded a z-score of 3.56,
which exceeded the absolute value of 3.29 (p<0.001) and was interpreted to be positively
significant in kurtosis.
The transformation was done by reflection and followed by a log transformation. The
result was then reflected again in order to maintain the rank order of the original raw
values for easy interpretation as suggested by Manning and Munro (2004). The new
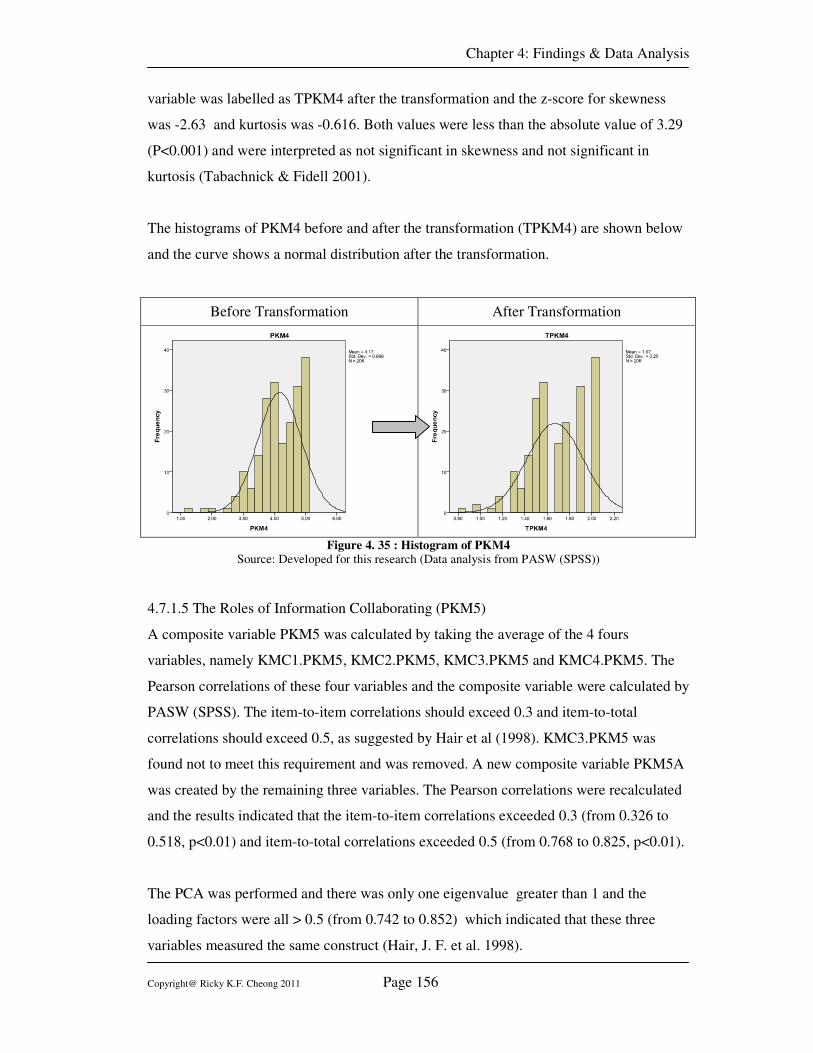
Chapter 4: Findings & Data Analysis
Copyright@ Ricky K.F. Cheong 2011 Page 156
variable was labelled as TPKM4 after the transformation and the z-score for skewness
was -2.63 and kurtosis was -0.616. Both values were less than the absolute value of 3.29
(P<0.001) and were interpreted as not significant in skewness and not significant in
kurtosis (Tabachnick & Fidell 2001).
The histograms of PKM4 before and after the transformation (TPKM4) are shown below
and the curve shows a normal distribution after the transformation.
Before Transformation After Transformation
Figure 4. 35 : Histogram of PKM4
Source: Developed for this research (Data analysis from PASW (SPSS))
4.7.1.5 The Roles of Information Collaborating (PKM5)
A composite variable PKM5 was calculated by taking the average of the 4 fours
variables, namely KMC1.PKM5, KMC2.PKM5, KMC3.PKM5 and KMC4.PKM5. The
Pearson correlations of these four variables and the composite variable were calculated by
PASW (SPSS). The item-to-item correlations should exceed 0.3 and item-to-total
correlations should exceed 0.5, as suggested by Hair et al (1998). KMC3.PKM5 was
found not to meet this requirement and was removed. A new composite variable PKM5A
was created by the remaining three variables. The Pearson correlations were recalculated
and the results indicated that the item-to-item correlations exceeded 0.3 (from 0.326 to
0.518, p<0.01) and item-to-total correlations exceeded 0.5 (from 0.768 to 0.825, p<0.01).
The PCA was performed and there was only one eigenvalue greater than 1 and the
loading factors were all > 0.5 (from 0.742 to 0.852) which indicated that these three
variables measured the same construct (Hair, J. F. et al. 1998).

Chapter 4: Findings & Data Analysis
Copyright@ Ricky K.F. Cheong 2011 Page 157
The reliability of this construct was measured by Cronbach’s Alpha and the result was
0.695 which indicated acceptable reliability for exploratory study, as suggested by Hair et
al (1998) and Sekaran (2003).
PKM5A
Pearson Correlations Factor Loading
Principal Components Analysis Cronbach’s Alpha
Figure 4. 36 : The Construct Assessment of PKM5
Source: Developed for this research (Data analysis from PASW (SPSS))
The normality of distribution of the scores of the composite variable PKM5A was
investigated. Values of skewness and kurtosis were calculated for the distribution of
scores for this variable. The value for skewness -0.569 was divided by the standard error
of skewness 0.169 to yield a z-score of -3.35 which was interpreted to be a negatively
significant as it exceeded the absolute value of 3.29 (p<0.001) (Tabachnick & Fidell
2001). The same procedure was performed for kurtosis which yielded a z-score of 0.29,
and did not exceed the absolute value of 3.29 (p<0.001) and was interpreted not to be
significant in kurtosis.
The transformation was done by reflection and followed by a square root transformation.
The result was then reflected again in order to maintain the rank order of the original raw
values for easy interpretation, as suggested by Manning and Munro (2004). The new
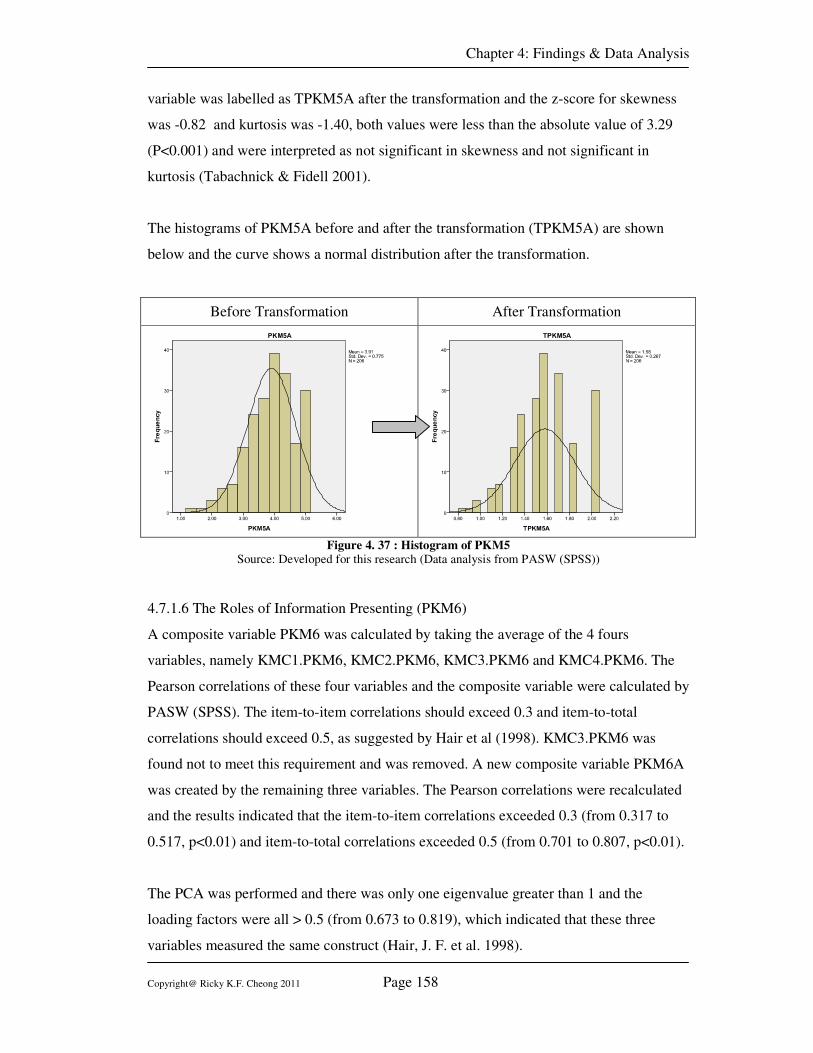
Chapter 4: Findings & Data Analysis
Copyright@ Ricky K.F. Cheong 2011 Page 158
variable was labelled as TPKM5A after the transformation and the z-score for skewness
was -0.82 and kurtosis was -1.40, both values were less than the absolute value of 3.29
(P<0.001) and were interpreted as not significant in skewness and not significant in
kurtosis (Tabachnick & Fidell 2001).
The histograms of PKM5A before and after the transformation (TPKM5A) are shown
below and the curve shows a normal distribution after the transformation.
Before Transformation After Transformation
Figure 4. 37 : Histogram of PKM5
Source: Developed for this research (Data analysis from PASW (SPSS))
4.7.1.6 The Roles of Information Presenting (PKM6)
A composite variable PKM6 was calculated by taking the average of the 4 fours
variables, namely KMC1.PKM6, KMC2.PKM6, KMC3.PKM6 and KMC4.PKM6. The
Pearson correlations of these four variables and the composite variable were calculated by
PASW (SPSS). The item-to-item correlations should exceed 0.3 and item-to-total
correlations should exceed 0.5, as suggested by Hair et al (1998). KMC3.PKM6 was
found not to meet this requirement and was removed. A new composite variable PKM6A
was created by the remaining three variables. The Pearson correlations were recalculated
and the results indicated that the item-to-item correlations exceeded 0.3 (from 0.317 to
0.517, p<0.01) and item-to-total correlations exceeded 0.5 (from 0.701 to 0.807, p<0.01).
The PCA was performed and there was only one eigenvalue greater than 1 and the
loading factors were all > 0.5 (from 0.673 to 0.819), which indicated that these three
variables measured the same construct (Hair, J. F. et al. 1998).
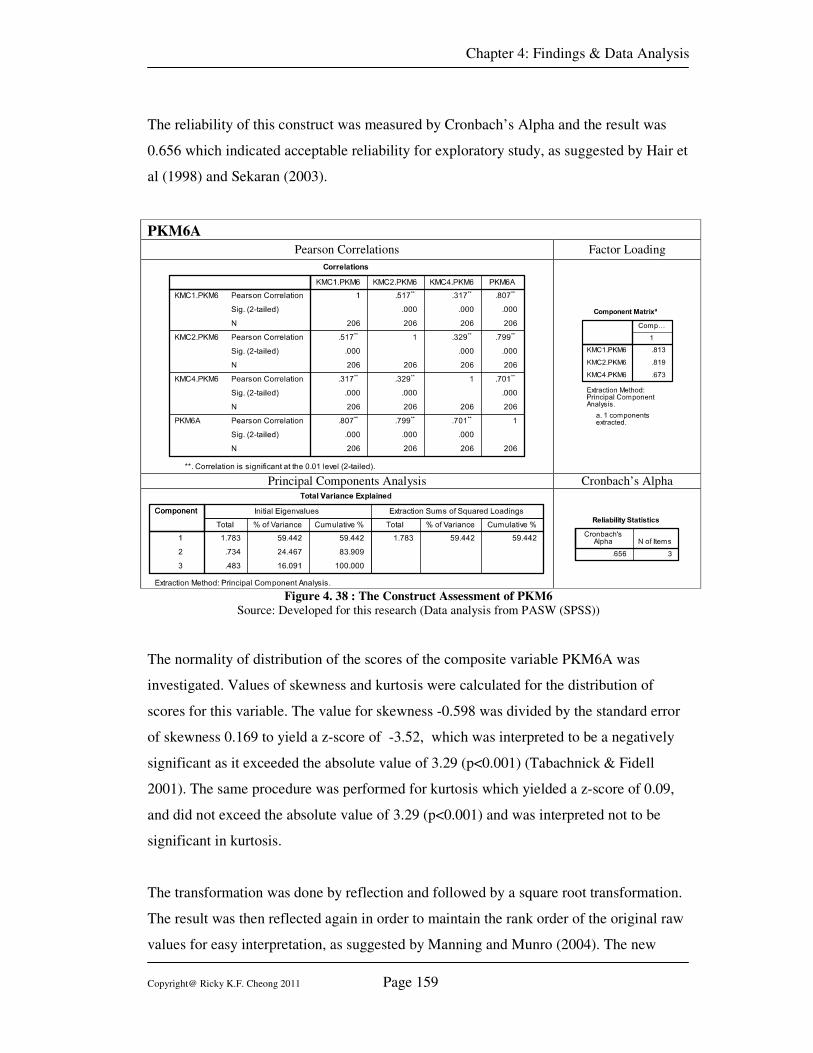
Chapter 4: Findings & Data Analysis
Copyright@ Ricky K.F. Cheong 2011 Page 159
The reliability of this construct was measured by Cronbach’s Alpha and the result was
0.656 which indicated acceptable reliability for exploratory study, as suggested by Hair et
al (1998) and Sekaran (2003).
PKM6A
Pearson Correlations Factor Loading
Principal Components Analysis Cronbach’s Alpha
Figure 4. 38 : The Construct Assessment of PKM6
Source: Developed for this research (Data analysis from PASW (SPSS))
The normality of distribution of the scores of the composite variable PKM6A was
investigated. Values of skewness and kurtosis were calculated for the distribution of
scores for this variable. The value for skewness -0.598 was divided by the standard error
of skewness 0.169 to yield a z-score of -3.52, which was interpreted to be a negatively
significant as it exceeded the absolute value of 3.29 (p<0.001) (Tabachnick & Fidell
2001). The same procedure was performed for kurtosis which yielded a z-score of 0.09,
and did not exceed the absolute value of 3.29 (p<0.001) and was interpreted not to be
significant in kurtosis.
The transformation was done by reflection and followed by a square root transformation.
The result was then reflected again in order to maintain the rank order of the original raw
values for easy interpretation, as suggested by Manning and Munro (2004). The new
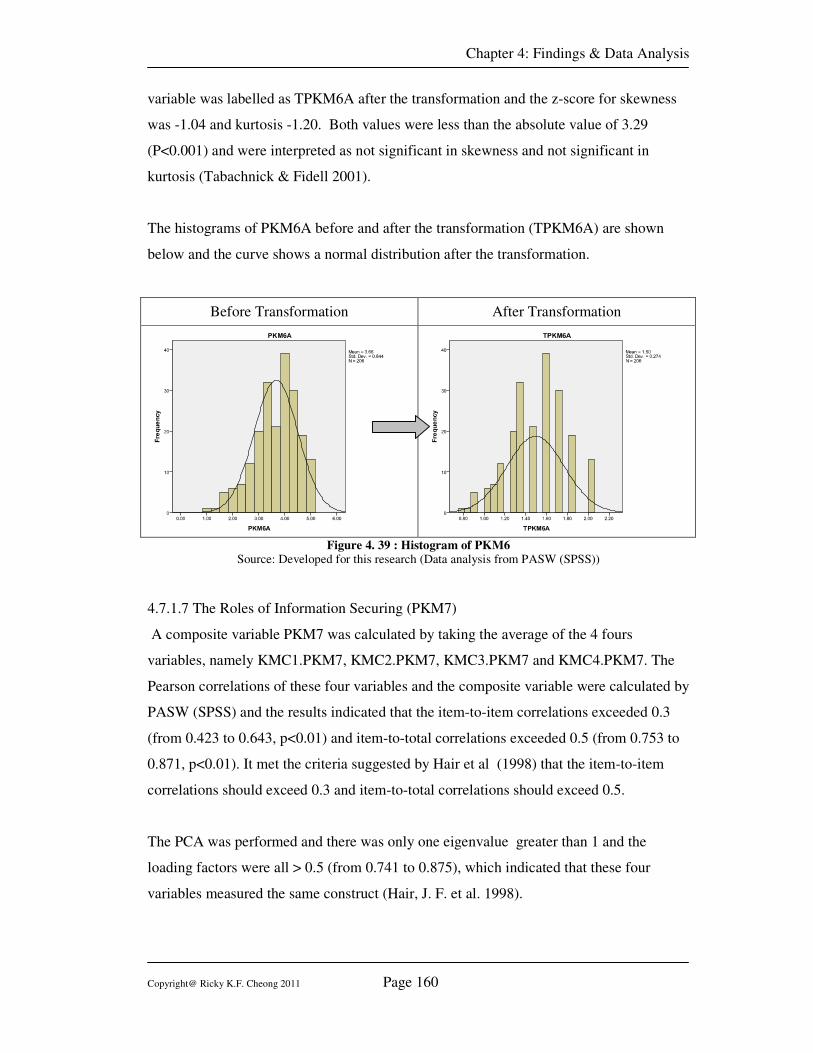
Chapter 4: Findings & Data Analysis
Copyright@ Ricky K.F. Cheong 2011 Page 160
variable was labelled as TPKM6A after the transformation and the z-score for skewness
was -1.04 and kurtosis -1.20. Both values were less than the absolute value of 3.29
(P<0.001) and were interpreted as not significant in skewness and not significant in
kurtosis (Tabachnick & Fidell 2001).
The histograms of PKM6A before and after the transformation (TPKM6A) are shown
below and the curve shows a normal distribution after the transformation.
Before Transformation After Transformation
Figure 4. 39 : Histogram of PKM6
Source: Developed for this research (Data analysis from PASW (SPSS))
4.7.1.7 The Roles of Information Securing (PKM7)
A composite variable PKM7 was calculated by taking the average of the 4 fours
variables, namely KMC1.PKM7, KMC2.PKM7, KMC3.PKM7 and KMC4.PKM7. The
Pearson correlations of these four variables and the composite variable were calculated by
PASW (SPSS) and the results indicated that the item-to-item correlations exceeded 0.3
(from 0.423 to 0.643, p<0.01) and item-to-total correlations exceeded 0.5 (from 0.753 to
0.871, p<0.01). It met the criteria suggested by Hair et al (1998) that the item-to-item
correlations should exceed 0.3 and item-to-total correlations should exceed 0.5.
The PCA was performed and there was only one eigenvalue greater than 1 and the
loading factors were all > 0.5 (from 0.741 to 0.875), which indicated that these four
variables measured the same construct (Hair, J. F. et al. 1998).
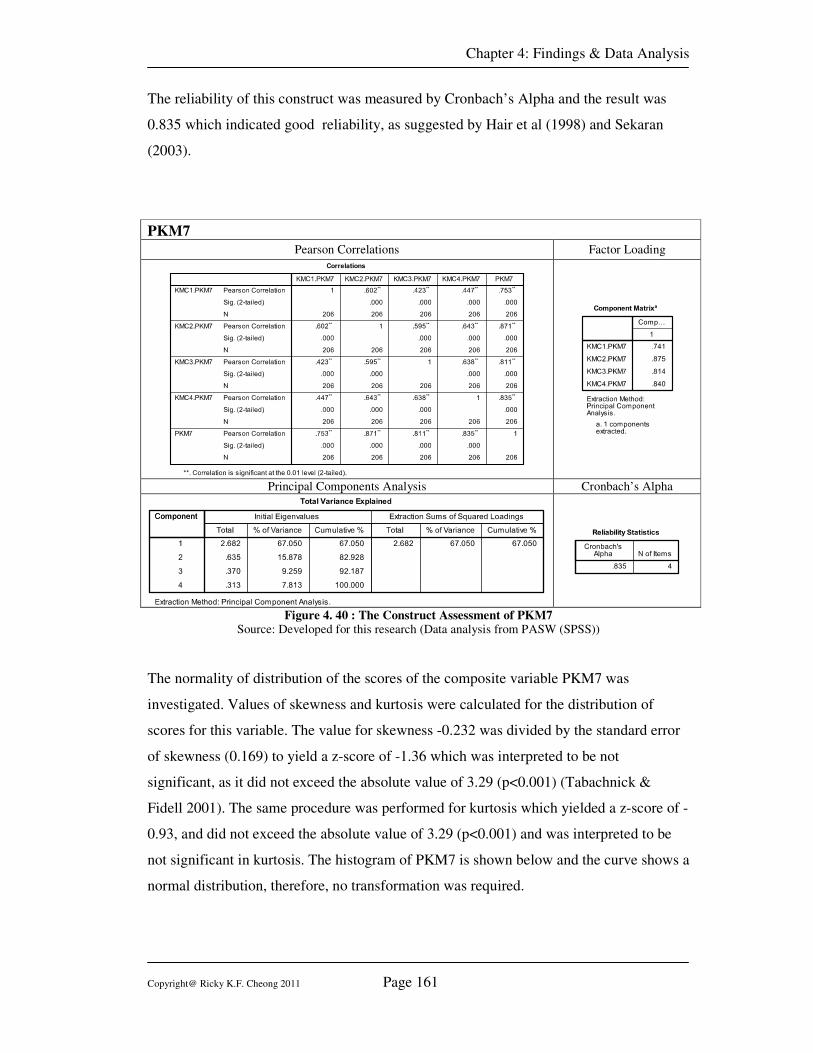
Chapter 4: Findings & Data Analysis
Copyright@ Ricky K.F. Cheong 2011 Page 161
The reliability of this construct was measured by Cronbach’s Alpha and the result was
0.835 which indicated good reliability, as suggested by Hair et al (1998) and Sekaran
(2003).
PKM7
Pearson Correlations Factor Loading
Principal Components Analysis Cronbach’s Alpha
Figure 4. 40 : The Construct Assessment of PKM7 Source: Developed for this research (Data analysis from PASW (SPSS))
The normality of distribution of the scores of the composite variable PKM7 was
investigated. Values of skewness and kurtosis were calculated for the distribution of
scores for this variable. The value for skewness -0.232 was divided by the standard error
of skewness (0.169) to yield a z-score of -1.36 which was interpreted to be not
significant, as it did not exceed the absolute value of 3.29 (p<0.001) (Tabachnick &
Fidell 2001). The same procedure was performed for kurtosis which yielded a z-score of -
0.93, and did not exceed the absolute value of 3.29 (p<0.001) and was interpreted to be
not significant in kurtosis. The histogram of PKM7 is shown below and the curve shows a
normal distribution, therefore, no transformation was required.
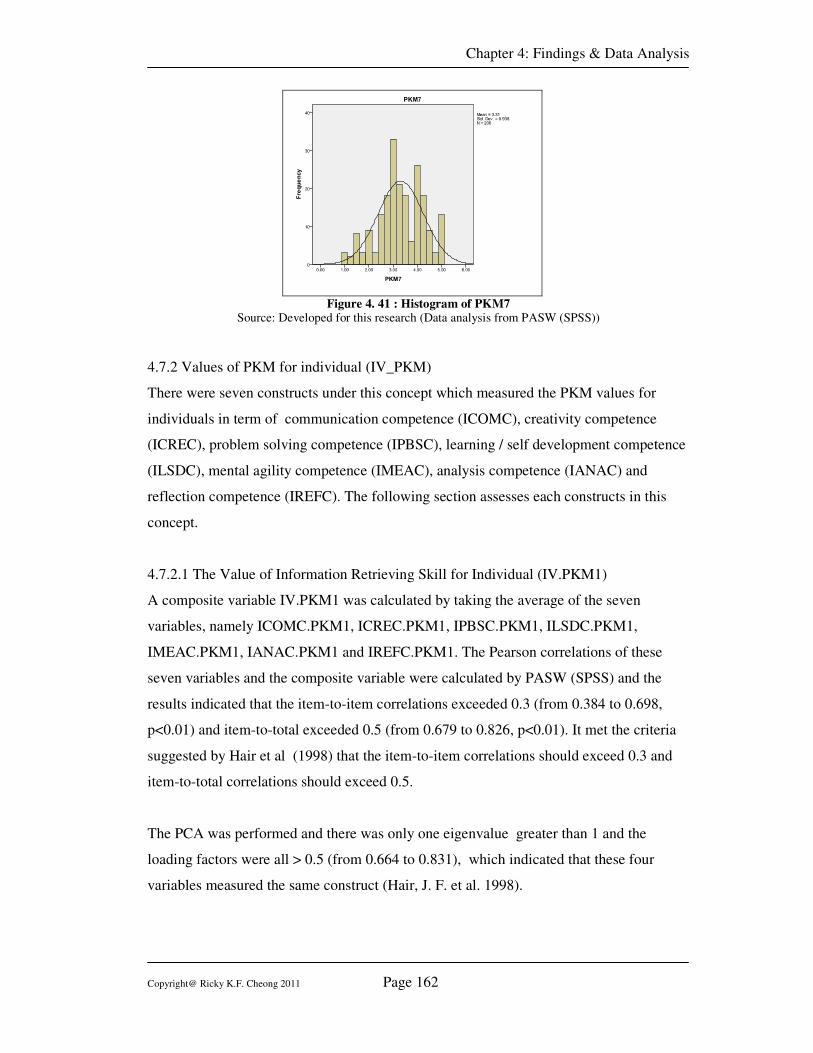
Chapter 4: Findings & Data Analysis
Copyright@ Ricky K.F. Cheong 2011 Page 162
Figure 4. 41 : Histogram of PKM7 Source: Developed for this research (Data analysis from PASW (SPSS))
4.7.2 Values of PKM for individual (IV_PKM)
There were seven constructs under this concept which measured the PKM values for
individuals in term of communication competence (ICOMC), creativity competence
(ICREC), problem solving competence (IPBSC), learning / self development competence
(ILSDC), mental agility competence (IMEAC), analysis competence (IANAC) and
reflection competence (IREFC). The following section assesses each constructs in this
concept.
4.7.2.1 The Value of Information Retrieving Skill for Individual (IV.PKM1)
A composite variable IV.PKM1 was calculated by taking the average of the seven
variables, namely ICOMC.PKM1, ICREC.PKM1, IPBSC.PKM1, ILSDC.PKM1,
IMEAC.PKM1, IANAC.PKM1 and IREFC.PKM1. The Pearson correlations of these
seven variables and the composite variable were calculated by PASW (SPSS) and the
results indicated that the item-to-item correlations exceeded 0.3 (from 0.384 to 0.698,
p<0.01) and item-to-total exceeded 0.5 (from 0.679 to 0.826, p<0.01). It met the criteria
suggested by Hair et al (1998) that the item-to-item correlations should exceed 0.3 and
item-to-total correlations should exceed 0.5.
The PCA was performed and there was only one eigenvalue greater than 1 and the
loading factors were all > 0.5 (from 0.664 to 0.831), which indicated that these four
variables measured the same construct (Hair, J. F. et al. 1998).
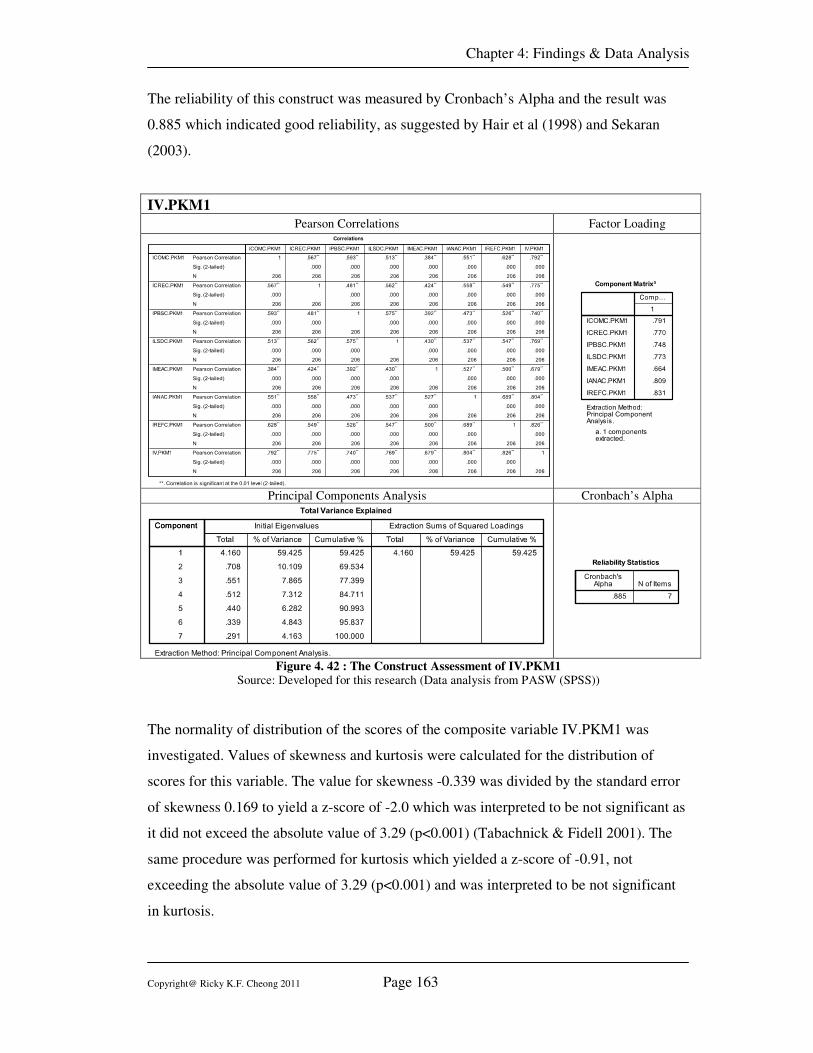
Chapter 4: Findings & Data Analysis
Copyright@ Ricky K.F. Cheong 2011 Page 163
The reliability of this construct was measured by Cronbach’s Alpha and the result was
0.885 which indicated good reliability, as suggested by Hair et al (1998) and Sekaran
(2003).
IV.PKM1
Pearson Correlations Factor Loading
Principal Components Analysis Cronbach’s Alpha
Figure 4. 42 : The Construct Assessment of IV.PKM1 Source: Developed for this research (Data analysis from PASW (SPSS))
The normality of distribution of the scores of the composite variable IV.PKM1 was
investigated. Values of skewness and kurtosis were calculated for the distribution of
scores for this variable. The value for skewness -0.339 was divided by the standard error
of skewness 0.169 to yield a z-score of -2.0 which was interpreted to be not significant as
it did not exceed the absolute value of 3.29 (p<0.001) (Tabachnick & Fidell 2001). The
same procedure was performed for kurtosis which yielded a z-score of -0.91, not
exceeding the absolute value of 3.29 (p<0.001) and was interpreted to be not significant
in kurtosis.
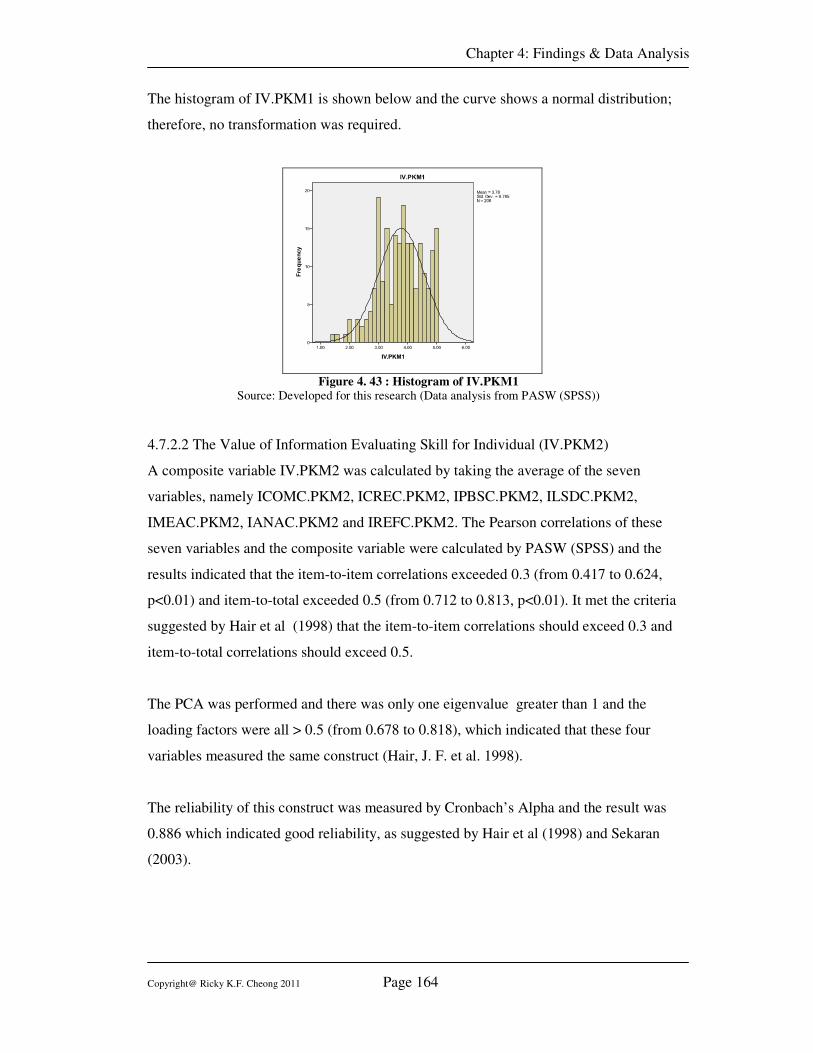
Chapter 4: Findings & Data Analysis
Copyright@ Ricky K.F. Cheong 2011 Page 164
The histogram of IV.PKM1 is shown below and the curve shows a normal distribution;
therefore, no transformation was required.
Figure 4. 43 : Histogram of IV.PKM1
Source: Developed for this research (Data analysis from PASW (SPSS))
4.7.2.2 The Value of Information Evaluating Skill for Individual (IV.PKM2)
A composite variable IV.PKM2 was calculated by taking the average of the seven
variables, namely ICOMC.PKM2, ICREC.PKM2, IPBSC.PKM2, ILSDC.PKM2,
IMEAC.PKM2, IANAC.PKM2 and IREFC.PKM2. The Pearson correlations of these
seven variables and the composite variable were calculated by PASW (SPSS) and the
results indicated that the item-to-item correlations exceeded 0.3 (from 0.417 to 0.624,
p<0.01) and item-to-total exceeded 0.5 (from 0.712 to 0.813, p<0.01). It met the criteria
suggested by Hair et al (1998) that the item-to-item correlations should exceed 0.3 and
item-to-total correlations should exceed 0.5.
The PCA was performed and there was only one eigenvalue greater than 1 and the
loading factors were all > 0.5 (from 0.678 to 0.818), which indicated that these four
variables measured the same construct (Hair, J. F. et al. 1998).
The reliability of this construct was measured by Cronbach’s Alpha and the result was
0.886 which indicated good reliability, as suggested by Hair et al (1998) and Sekaran
(2003).
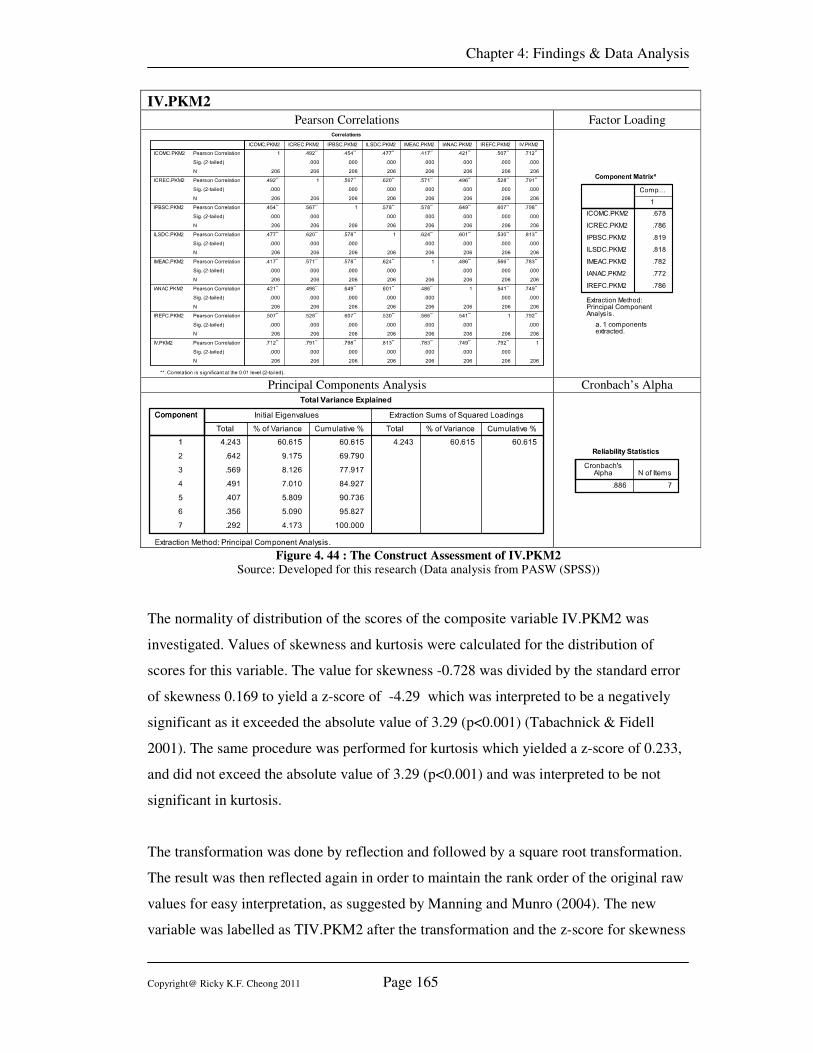
Chapter 4: Findings & Data Analysis
Copyright@ Ricky K.F. Cheong 2011 Page 165
IV.PKM2
Pearson Correlations Factor Loading
Principal Components Analysis Cronbach’s Alpha
Figure 4. 44 : The Construct Assessment of IV.PKM2 Source: Developed for this research (Data analysis from PASW (SPSS))
The normality of distribution of the scores of the composite variable IV.PKM2 was
investigated. Values of skewness and kurtosis were calculated for the distribution of
scores for this variable. The value for skewness -0.728 was divided by the standard error
of skewness 0.169 to yield a z-score of -4.29 which was interpreted to be a negatively
significant as it exceeded the absolute value of 3.29 (p<0.001) (Tabachnick & Fidell
2001). The same procedure was performed for kurtosis which yielded a z-score of 0.233,
and did not exceed the absolute value of 3.29 (p<0.001) and was interpreted to be not
significant in kurtosis.
The transformation was done by reflection and followed by a square root transformation.
The result was then reflected again in order to maintain the rank order of the original raw
values for easy interpretation, as suggested by Manning and Munro (2004). The new
variable was labelled as TIV.PKM2 after the transformation and the z-score for skewness
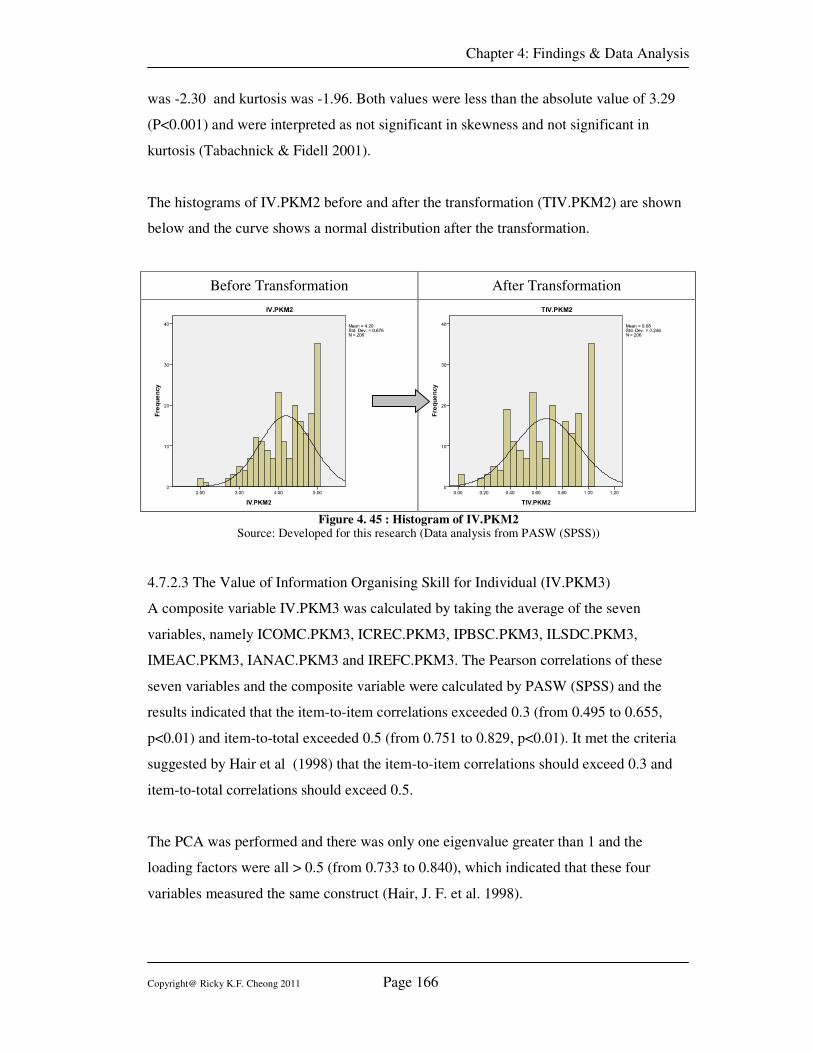
Chapter 4: Findings & Data Analysis
Copyright@ Ricky K.F. Cheong 2011 Page 166
was -2.30 and kurtosis was -1.96. Both values were less than the absolute value of 3.29
(P<0.001) and were interpreted as not significant in skewness and not significant in
kurtosis (Tabachnick & Fidell 2001).
The histograms of IV.PKM2 before and after the transformation (TIV.PKM2) are shown
below and the curve shows a normal distribution after the transformation.
Before Transformation After Transformation
Figure 4. 45 : Histogram of IV.PKM2
Source: Developed for this research (Data analysis from PASW (SPSS))
4.7.2.3 The Value of Information Organising Skill for Individual (IV.PKM3)
A composite variable IV.PKM3 was calculated by taking the average of the seven
variables, namely ICOMC.PKM3, ICREC.PKM3, IPBSC.PKM3, ILSDC.PKM3,
IMEAC.PKM3, IANAC.PKM3 and IREFC.PKM3. The Pearson correlations of these
seven variables and the composite variable were calculated by PASW (SPSS) and the
results indicated that the item-to-item correlations exceeded 0.3 (from 0.495 to 0.655,
p<0.01) and item-to-total exceeded 0.5 (from 0.751 to 0.829, p<0.01). It met the criteria
suggested by Hair et al (1998) that the item-to-item correlations should exceed 0.3 and
item-to-total correlations should exceed 0.5.
The PCA was performed and there was only one eigenvalue greater than 1 and the
loading factors were all > 0.5 (from 0.733 to 0.840), which indicated that these four
variables measured the same construct (Hair, J. F. et al. 1998).
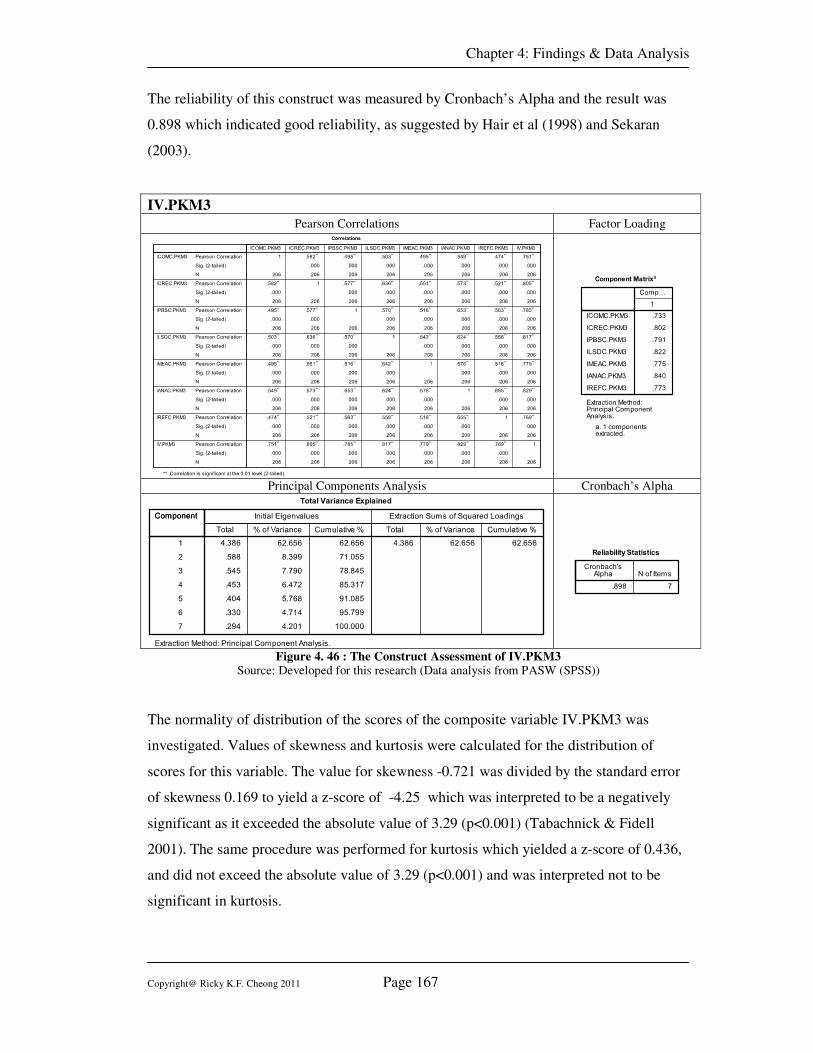
Chapter 4: Findings & Data Analysis
Copyright@ Ricky K.F. Cheong 2011 Page 167
The reliability of this construct was measured by Cronbach’s Alpha and the result was
0.898 which indicated good reliability, as suggested by Hair et al (1998) and Sekaran
(2003).
IV.PKM3
Pearson Correlations Factor Loading
Principal Components Analysis Cronbach’s Alpha
Figure 4. 46 : The Construct Assessment of IV.PKM3 Source: Developed for this research (Data analysis from PASW (SPSS))
The normality of distribution of the scores of the composite variable IV.PKM3 was
investigated. Values of skewness and kurtosis were calculated for the distribution of
scores for this variable. The value for skewness -0.721 was divided by the standard error
of skewness 0.169 to yield a z-score of -4.25 which was interpreted to be a negatively
significant as it exceeded the absolute value of 3.29 (p<0.001) (Tabachnick & Fidell
2001). The same procedure was performed for kurtosis which yielded a z-score of 0.436,
and did not exceed the absolute value of 3.29 (p<0.001) and was interpreted not to be
significant in kurtosis.
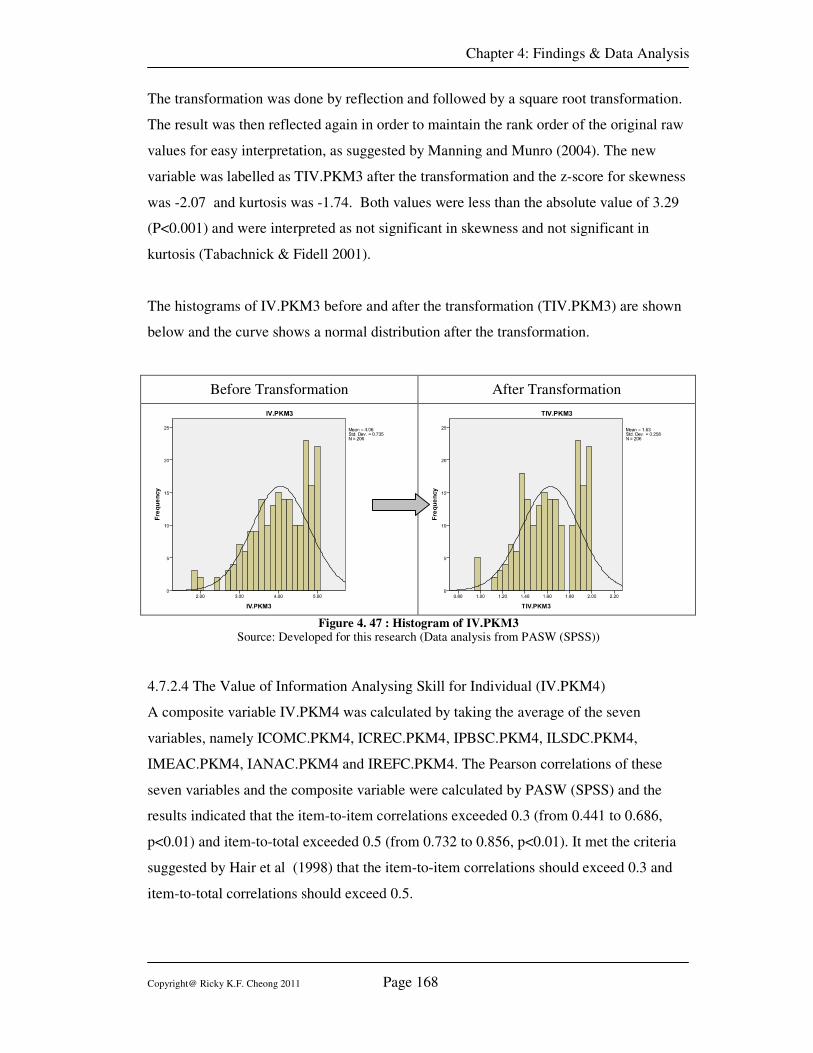
Chapter 4: Findings & Data Analysis
Copyright@ Ricky K.F. Cheong 2011 Page 168
The transformation was done by reflection and followed by a square root transformation.
The result was then reflected again in order to maintain the rank order of the original raw
values for easy interpretation, as suggested by Manning and Munro (2004). The new
variable was labelled as TIV.PKM3 after the transformation and the z-score for skewness
was -2.07 and kurtosis was -1.74. Both values were less than the absolute value of 3.29
(P<0.001) and were interpreted as not significant in skewness and not significant in
kurtosis (Tabachnick & Fidell 2001).
The histograms of IV.PKM3 before and after the transformation (TIV.PKM3) are shown
below and the curve shows a normal distribution after the transformation.
Before Transformation After Transformation
Figure 4. 47 : Histogram of IV.PKM3
Source: Developed for this research (Data analysis from PASW (SPSS))
4.7.2.4 The Value of Information Analysing Skill for Individual (IV.PKM4)
A composite variable IV.PKM4 was calculated by taking the average of the seven
variables, namely ICOMC.PKM4, ICREC.PKM4, IPBSC.PKM4, ILSDC.PKM4,
IMEAC.PKM4, IANAC.PKM4 and IREFC.PKM4. The Pearson correlations of these
seven variables and the composite variable were calculated by PASW (SPSS) and the
results indicated that the item-to-item correlations exceeded 0.3 (from 0.441 to 0.686,
p<0.01) and item-to-total exceeded 0.5 (from 0.732 to 0.856, p<0.01). It met the criteria
suggested by Hair et al (1998) that the item-to-item correlations should exceed 0.3 and
item-to-total correlations should exceed 0.5.
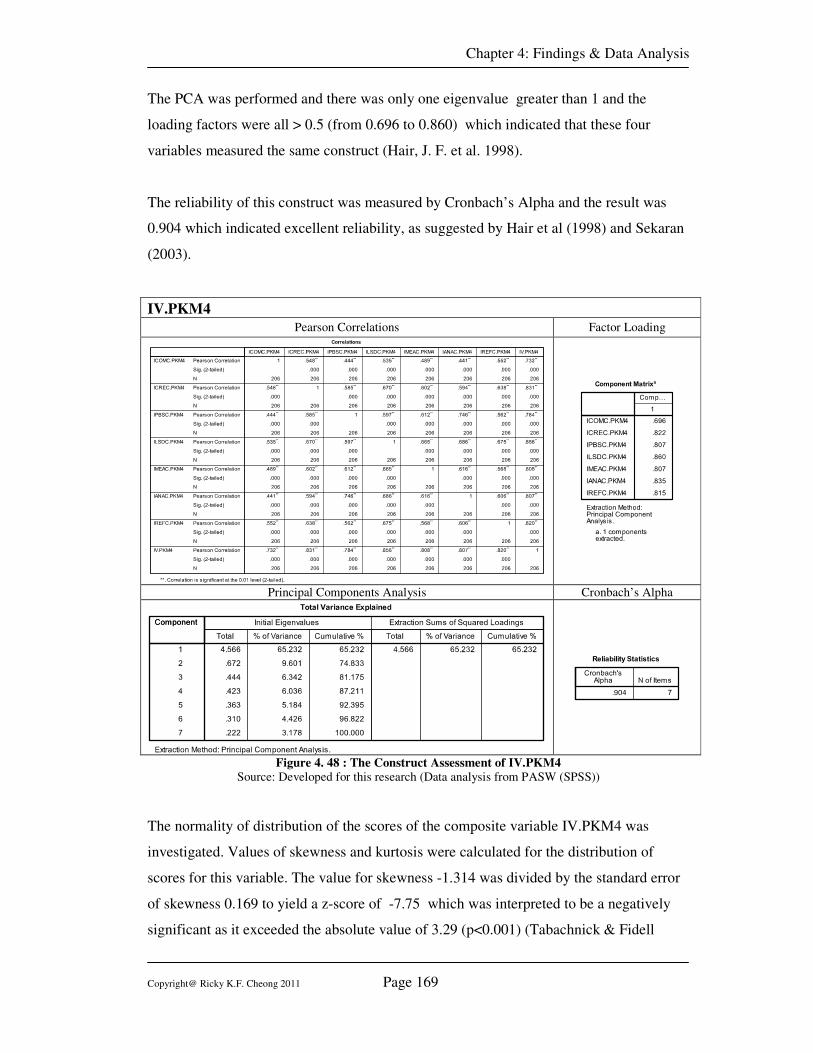
Chapter 4: Findings & Data Analysis
Copyright@ Ricky K.F. Cheong 2011 Page 169
The PCA was performed and there was only one eigenvalue greater than 1 and the
loading factors were all > 0.5 (from 0.696 to 0.860) which indicated that these four
variables measured the same construct (Hair, J. F. et al. 1998).
The reliability of this construct was measured by Cronbach’s Alpha and the result was
0.904 which indicated excellent reliability, as suggested by Hair et al (1998) and Sekaran
(2003).
IV.PKM4
Pearson Correlations Factor Loading
Principal Components Analysis Cronbach’s Alpha
Figure 4. 48 : The Construct Assessment of IV.PKM4
Source: Developed for this research (Data analysis from PASW (SPSS))
The normality of distribution of the scores of the composite variable IV.PKM4 was
investigated. Values of skewness and kurtosis were calculated for the distribution of
scores for this variable. The value for skewness -1.314 was divided by the standard error
of skewness 0.169 to yield a z-score of -7.75 which was interpreted to be a negatively
significant as it exceeded the absolute value of 3.29 (p<0.001) (Tabachnick & Fidell
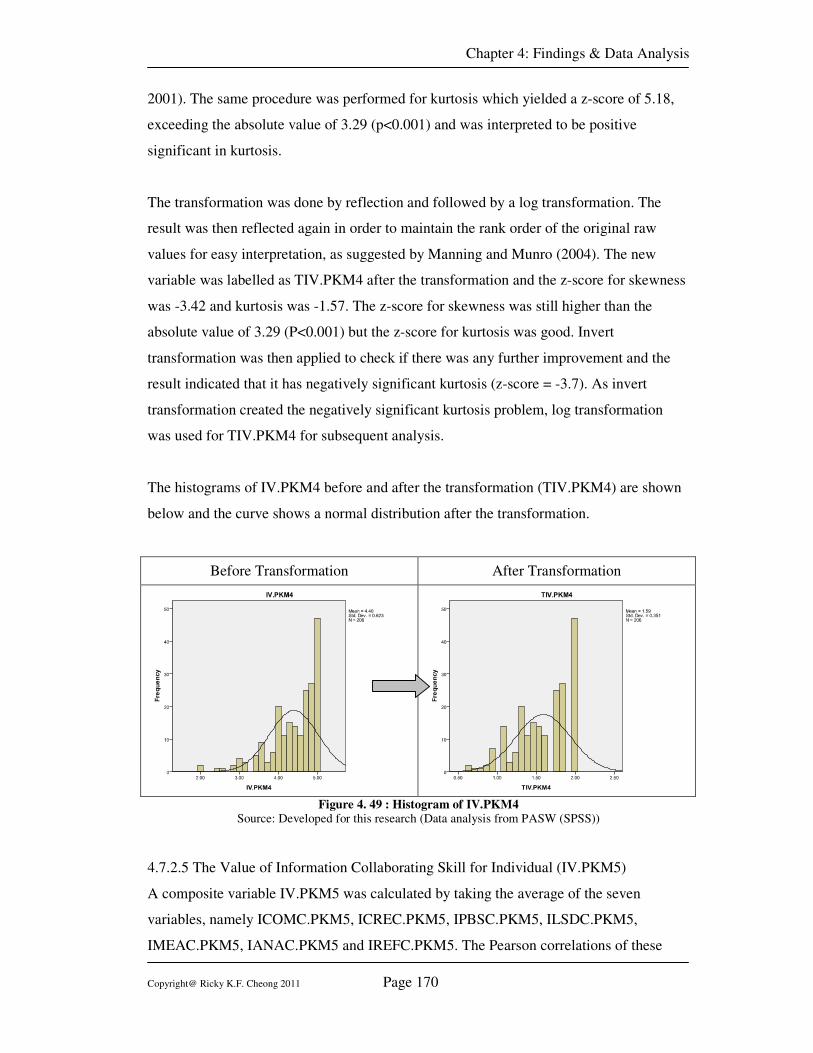
Chapter 4: Findings & Data Analysis
Copyright@ Ricky K.F. Cheong 2011 Page 170
2001). The same procedure was performed for kurtosis which yielded a z-score of 5.18,
exceeding the absolute value of 3.29 (p<0.001) and was interpreted to be positive
significant in kurtosis.
The transformation was done by reflection and followed by a log transformation. The
result was then reflected again in order to maintain the rank order of the original raw
values for easy interpretation, as suggested by Manning and Munro (2004). The new
variable was labelled as TIV.PKM4 after the transformation and the z-score for skewness
was -3.42 and kurtosis was -1.57. The z-score for skewness was still higher than the
absolute value of 3.29 (P<0.001) but the z-score for kurtosis was good. Invert
transformation was then applied to check if there was any further improvement and the
result indicated that it has negatively significant kurtosis (z-score = -3.7). As invert
transformation created the negatively significant kurtosis problem, log transformation
was used for TIV.PKM4 for subsequent analysis.
The histograms of IV.PKM4 before and after the transformation (TIV.PKM4) are shown
below and the curve shows a normal distribution after the transformation.
Before Transformation After Transformation
Figure 4. 49 : Histogram of IV.PKM4
Source: Developed for this research (Data analysis from PASW (SPSS))
4.7.2.5 The Value of Information Collaborating Skill for Individual (IV.PKM5)
A composite variable IV.PKM5 was calculated by taking the average of the seven
variables, namely ICOMC.PKM5, ICREC.PKM5, IPBSC.PKM5, ILSDC.PKM5,
IMEAC.PKM5, IANAC.PKM5 and IREFC.PKM5. The Pearson correlations of these
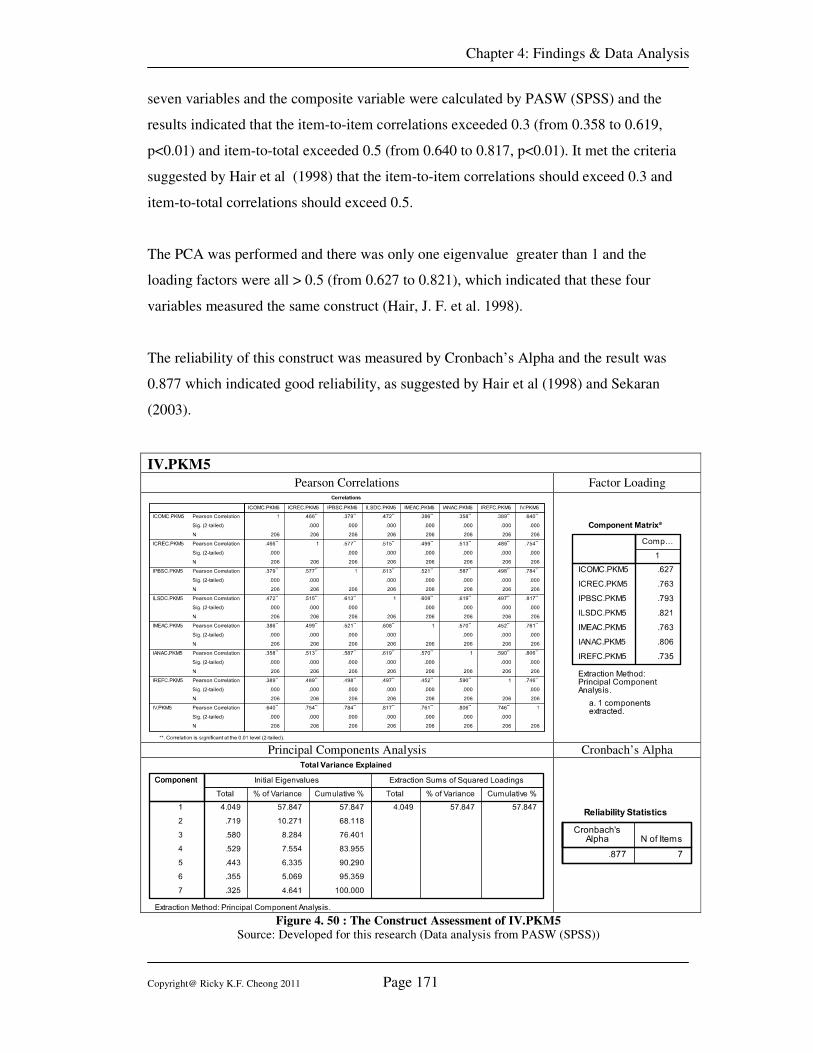
Chapter 4: Findings & Data Analysis
Copyright@ Ricky K.F. Cheong 2011 Page 171
seven variables and the composite variable were calculated by PASW (SPSS) and the
results indicated that the item-to-item correlations exceeded 0.3 (from 0.358 to 0.619,
p<0.01) and item-to-total exceeded 0.5 (from 0.640 to 0.817, p<0.01). It met the criteria
suggested by Hair et al (1998) that the item-to-item correlations should exceed 0.3 and
item-to-total correlations should exceed 0.5.
The PCA was performed and there was only one eigenvalue greater than 1 and the
loading factors were all > 0.5 (from 0.627 to 0.821), which indicated that these four
variables measured the same construct (Hair, J. F. et al. 1998).
The reliability of this construct was measured by Cronbach’s Alpha and the result was
0.877 which indicated good reliability, as suggested by Hair et al (1998) and Sekaran
(2003).
IV.PKM5
Pearson Correlations Factor Loading
Principal Components Analysis Cronbach’s Alpha
Figure 4. 50 : The Construct Assessment of IV.PKM5 Source: Developed for this research (Data analysis from PASW (SPSS))
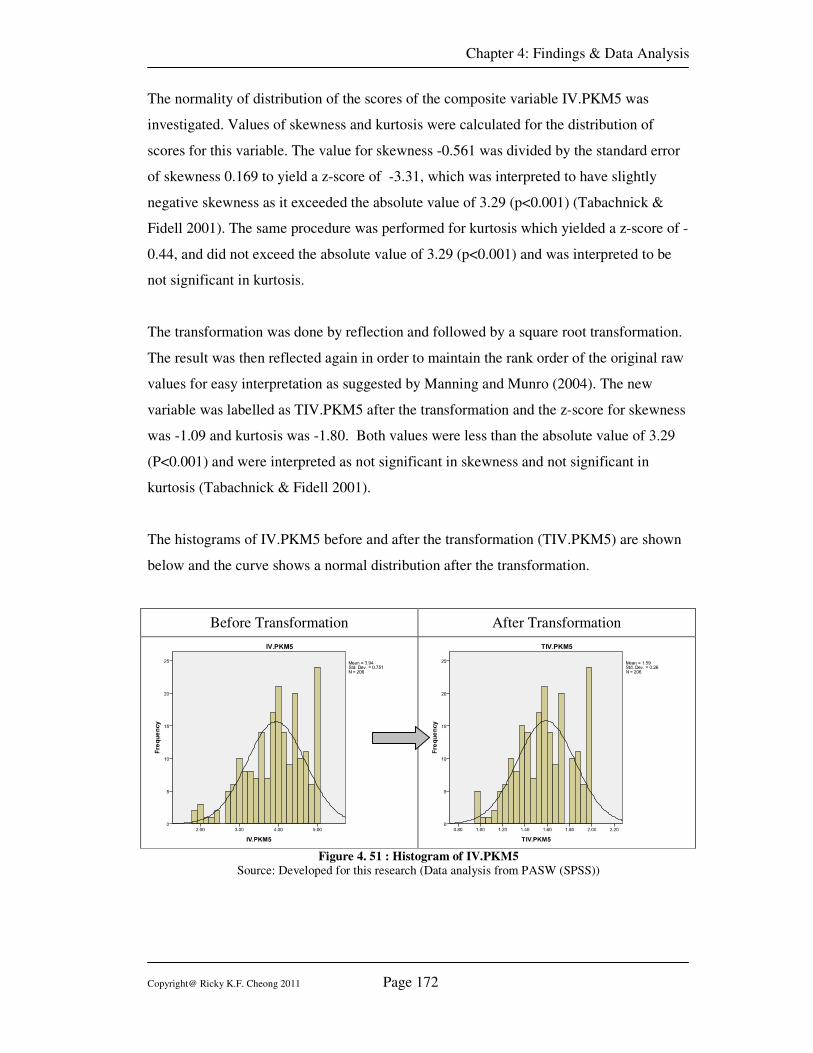
Chapter 4: Findings & Data Analysis
Copyright@ Ricky K.F. Cheong 2011 Page 172
The normality of distribution of the scores of the composite variable IV.PKM5 was
investigated. Values of skewness and kurtosis were calculated for the distribution of
scores for this variable. The value for skewness -0.561 was divided by the standard error
of skewness 0.169 to yield a z-score of -3.31, which was interpreted to have slightly
negative skewness as it exceeded the absolute value of 3.29 (p<0.001) (Tabachnick &
Fidell 2001). The same procedure was performed for kurtosis which yielded a z-score of -
0.44, and did not exceed the absolute value of 3.29 (p<0.001) and was interpreted to be
not significant in kurtosis.
The transformation was done by reflection and followed by a square root transformation.
The result was then reflected again in order to maintain the rank order of the original raw
values for easy interpretation as suggested by Manning and Munro (2004). The new
variable was labelled as TIV.PKM5 after the transformation and the z-score for skewness
was -1.09 and kurtosis was -1.80. Both values were less than the absolute value of 3.29
(P<0.001) and were interpreted as not significant in skewness and not significant in
kurtosis (Tabachnick & Fidell 2001).
The histograms of IV.PKM5 before and after the transformation (TIV.PKM5) are shown
below and the curve shows a normal distribution after the transformation.
Before Transformation After Transformation
Figure 4. 51 : Histogram of IV.PKM5
Source: Developed for this research (Data analysis from PASW (SPSS))
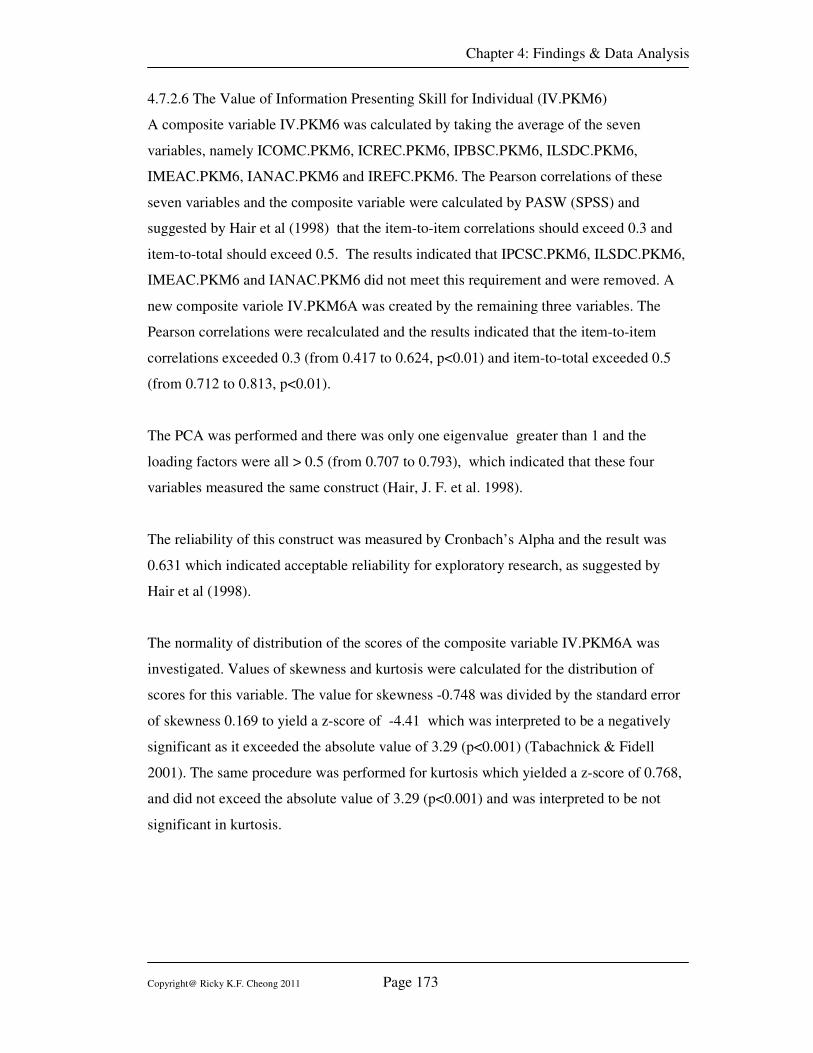
Chapter 4: Findings & Data Analysis
Copyright@ Ricky K.F. Cheong 2011 Page 173
4.7.2.6 The Value of Information Presenting Skill for Individual (IV.PKM6)
A composite variable IV.PKM6 was calculated by taking the average of the seven
variables, namely ICOMC.PKM6, ICREC.PKM6, IPBSC.PKM6, ILSDC.PKM6,
IMEAC.PKM6, IANAC.PKM6 and IREFC.PKM6. The Pearson correlations of these
seven variables and the composite variable were calculated by PASW (SPSS) and
suggested by Hair et al (1998) that the item-to-item correlations should exceed 0.3 and
item-to-total should exceed 0.5. The results indicated that IPCSC.PKM6, ILSDC.PKM6,
IMEAC.PKM6 and IANAC.PKM6 did not meet this requirement and were removed. A
new composite variole IV.PKM6A was created by the remaining three variables. The
Pearson correlations were recalculated and the results indicated that the item-to-item
correlations exceeded 0.3 (from 0.417 to 0.624, p<0.01) and item-to-total exceeded 0.5
(from 0.712 to 0.813, p<0.01).
The PCA was performed and there was only one eigenvalue greater than 1 and the
loading factors were all > 0.5 (from 0.707 to 0.793), which indicated that these four
variables measured the same construct (Hair, J. F. et al. 1998).
The reliability of this construct was measured by Cronbach’s Alpha and the result was
0.631 which indicated acceptable reliability for exploratory research, as suggested by
Hair et al (1998).
The normality of distribution of the scores of the composite variable IV.PKM6A was
investigated. Values of skewness and kurtosis were calculated for the distribution of
scores for this variable. The value for skewness -0.748 was divided by the standard error
of skewness 0.169 to yield a z-score of -4.41 which was interpreted to be a negatively
significant as it exceeded the absolute value of 3.29 (p<0.001) (Tabachnick & Fidell
2001). The same procedure was performed for kurtosis which yielded a z-score of 0.768,
and did not exceed the absolute value of 3.29 (p<0.001) and was interpreted to be not
significant in kurtosis.
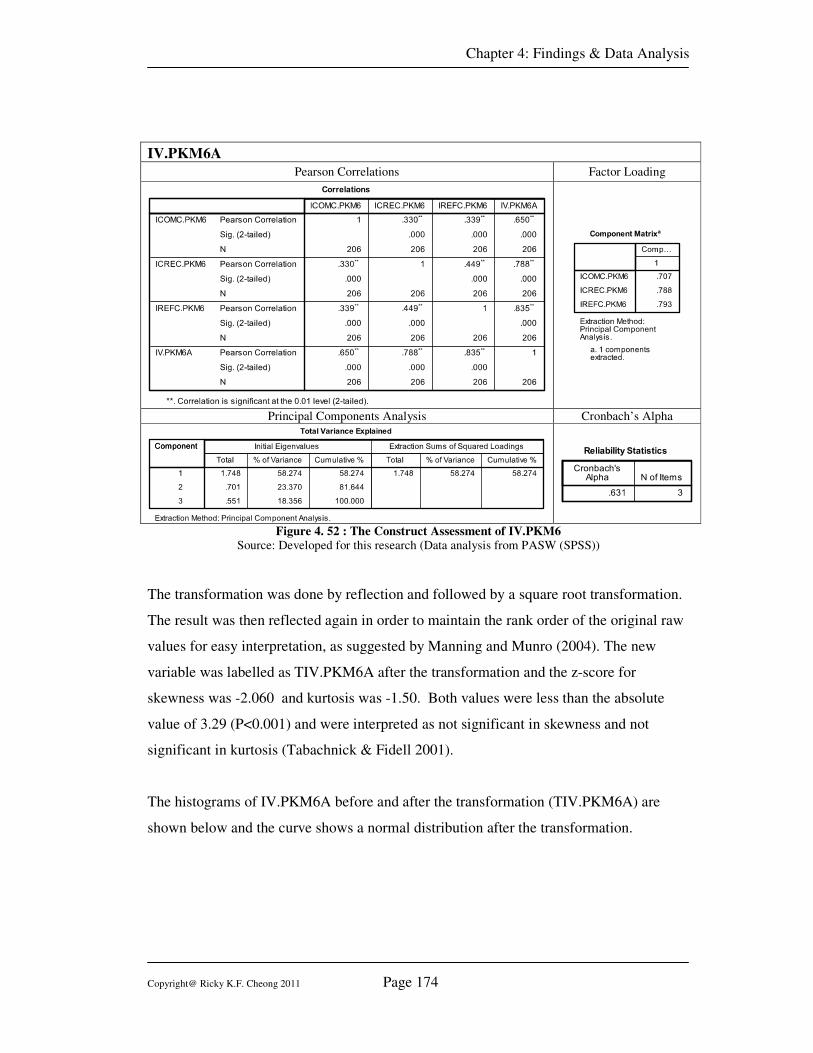
Chapter 4: Findings & Data Analysis
Copyright@ Ricky K.F. Cheong 2011 Page 174
IV.PKM6A
Pearson Correlations Factor Loading
Principal Components Analysis Cronbach’s Alpha
Figure 4. 52 : The Construct Assessment of IV.PKM6
Source: Developed for this research (Data analysis from PASW (SPSS))
The transformation was done by reflection and followed by a square root transformation.
The result was then reflected again in order to maintain the rank order of the original raw
values for easy interpretation, as suggested by Manning and Munro (2004). The new
variable was labelled as TIV.PKM6A after the transformation and the z-score for
skewness was -2.060 and kurtosis was -1.50. Both values were less than the absolute
value of 3.29 (P<0.001) and were interpreted as not significant in skewness and not
significant in kurtosis (Tabachnick & Fidell 2001).
The histograms of IV.PKM6A before and after the transformation (TIV.PKM6A) are
shown below and the curve shows a normal distribution after the transformation.
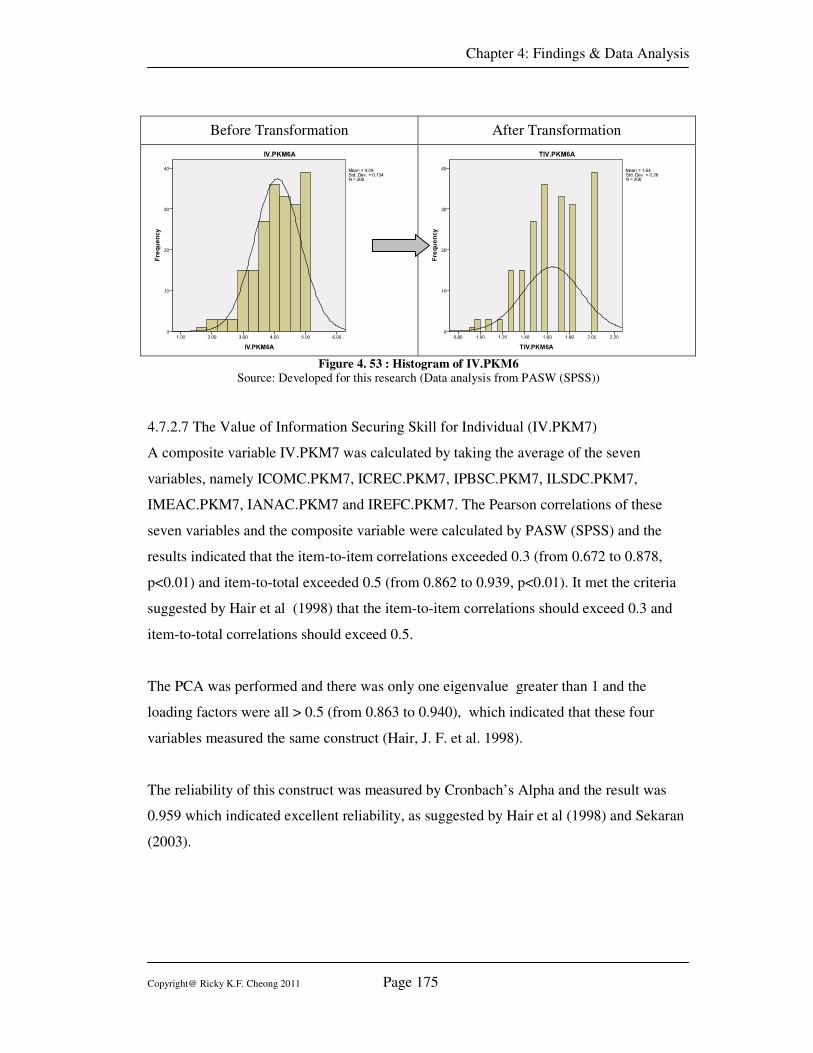
Chapter 4: Findings & Data Analysis
Copyright@ Ricky K.F. Cheong 2011 Page 175
Before Transformation After Transformation
Figure 4. 53 : Histogram of IV.PKM6
Source: Developed for this research (Data analysis from PASW (SPSS))
4.7.2.7 The Value of Information Securing Skill for Individual (IV.PKM7)
A composite variable IV.PKM7 was calculated by taking the average of the seven
variables, namely ICOMC.PKM7, ICREC.PKM7, IPBSC.PKM7, ILSDC.PKM7,
IMEAC.PKM7, IANAC.PKM7 and IREFC.PKM7. The Pearson correlations of these
seven variables and the composite variable were calculated by PASW (SPSS) and the
results indicated that the item-to-item correlations exceeded 0.3 (from 0.672 to 0.878,
p<0.01) and item-to-total exceeded 0.5 (from 0.862 to 0.939, p<0.01). It met the criteria
suggested by Hair et al (1998) that the item-to-item correlations should exceed 0.3 and
item-to-total correlations should exceed 0.5.
The PCA was performed and there was only one eigenvalue greater than 1 and the
loading factors were all > 0.5 (from 0.863 to 0.940), which indicated that these four
variables measured the same construct (Hair, J. F. et al. 1998).
The reliability of this construct was measured by Cronbach’s Alpha and the result was
0.959 which indicated excellent reliability, as suggested by Hair et al (1998) and Sekaran
(2003).
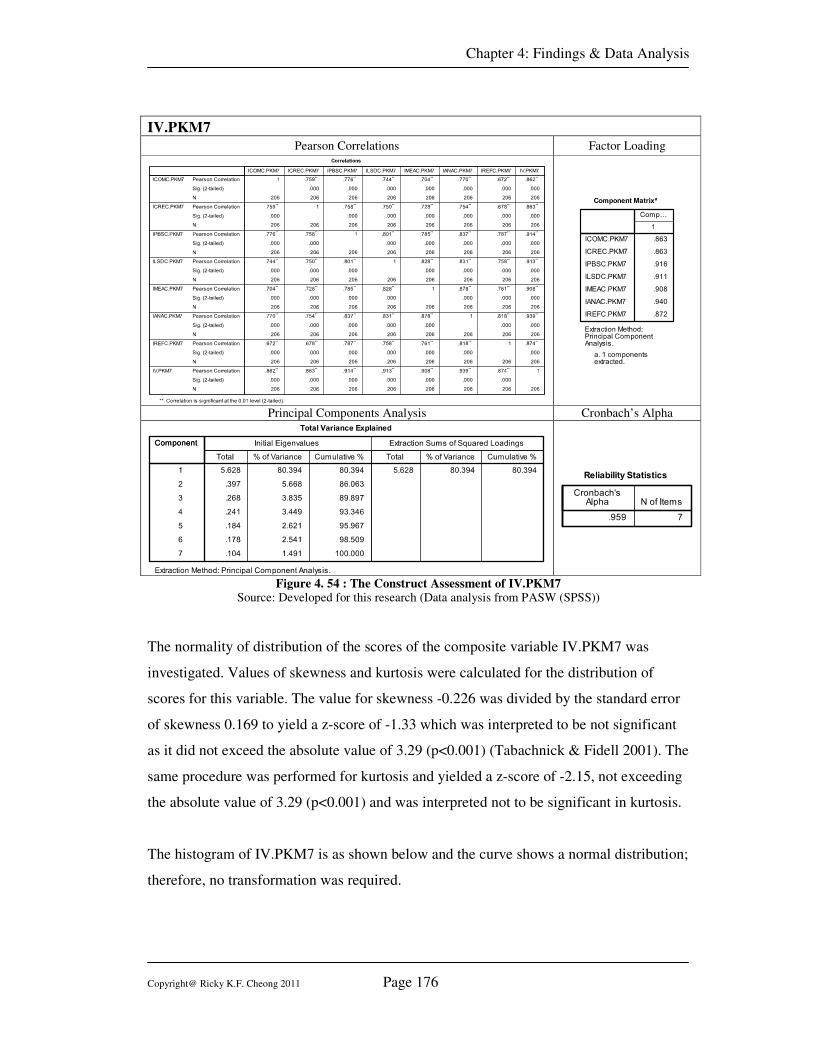
Chapter 4: Findings & Data Analysis
Copyright@ Ricky K.F. Cheong 2011 Page 176
IV.PKM7
Pearson Correlations Factor Loading
Principal Components Analysis Cronbach’s Alpha
Figure 4. 54 : The Construct Assessment of IV.PKM7 Source: Developed for this research (Data analysis from PASW (SPSS))
The normality of distribution of the scores of the composite variable IV.PKM7 was
investigated. Values of skewness and kurtosis were calculated for the distribution of
scores for this variable. The value for skewness -0.226 was divided by the standard error
of skewness 0.169 to yield a z-score of -1.33 which was interpreted to be not significant
as it did not exceed the absolute value of 3.29 (p<0.001) (Tabachnick & Fidell 2001). The
same procedure was performed for kurtosis and yielded a z-score of -2.15, not exceeding
the absolute value of 3.29 (p<0.001) and was interpreted not to be significant in kurtosis.
The histogram of IV.PKM7 is as shown below and the curve shows a normal distribution;
therefore, no transformation was required.
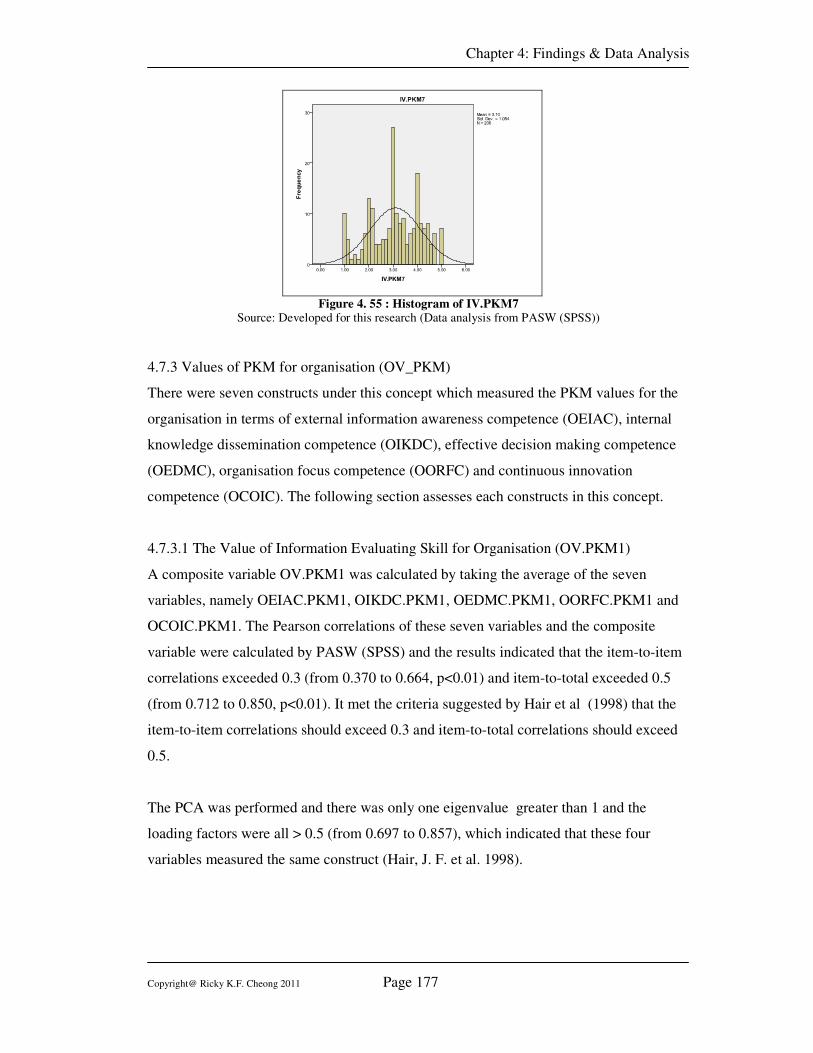
Chapter 4: Findings & Data Analysis
Copyright@ Ricky K.F. Cheong 2011 Page 177
Figure 4. 55 : Histogram of IV.PKM7 Source: Developed for this research (Data analysis from PASW (SPSS))
4.7.3 Values of PKM for organisation (OV_PKM)
There were seven constructs under this concept which measured the PKM values for the
organisation in terms of external information awareness competence (OEIAC), internal
knowledge dissemination competence (OIKDC), effective decision making competence
(OEDMC), organisation focus competence (OORFC) and continuous innovation
competence (OCOIC). The following section assesses each constructs in this concept.
4.7.3.1 The Value of Information Evaluating Skill for Organisation (OV.PKM1)
A composite variable OV.PKM1 was calculated by taking the average of the seven
variables, namely OEIAC.PKM1, OIKDC.PKM1, OEDMC.PKM1, OORFC.PKM1 and
OCOIC.PKM1. The Pearson correlations of these seven variables and the composite
variable were calculated by PASW (SPSS) and the results indicated that the item-to-item
correlations exceeded 0.3 (from 0.370 to 0.664, p<0.01) and item-to-total exceeded 0.5
(from 0.712 to 0.850, p<0.01). It met the criteria suggested by Hair et al (1998) that the
item-to-item correlations should exceed 0.3 and item-to-total correlations should exceed
0.5.
The PCA was performed and there was only one eigenvalue greater than 1 and the
loading factors were all > 0.5 (from 0.697 to 0.857), which indicated that these four
variables measured the same construct (Hair, J. F. et al. 1998).
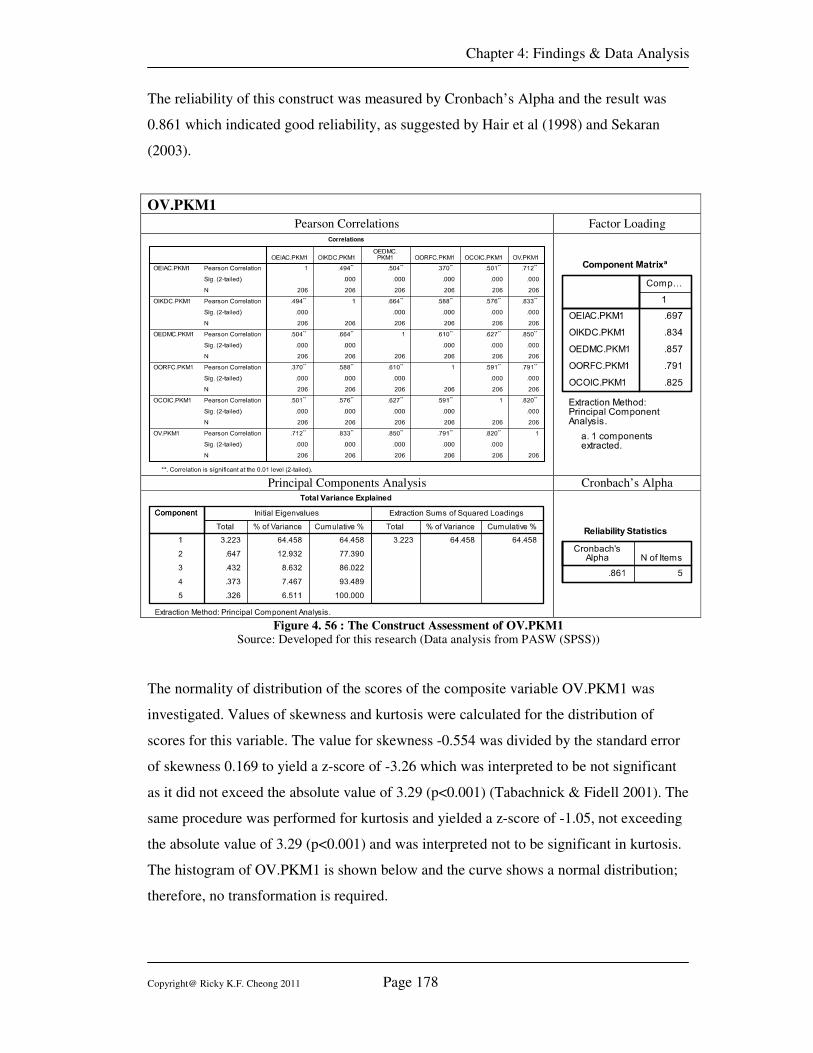
Chapter 4: Findings & Data Analysis
Copyright@ Ricky K.F. Cheong 2011 Page 178
The reliability of this construct was measured by Cronbach’s Alpha and the result was
0.861 which indicated good reliability, as suggested by Hair et al (1998) and Sekaran
(2003).
OV.PKM1
Pearson Correlations Factor Loading
Principal Components Analysis Cronbach’s Alpha
Figure 4. 56 : The Construct Assessment of OV.PKM1 Source: Developed for this research (Data analysis from PASW (SPSS))
The normality of distribution of the scores of the composite variable OV.PKM1 was
investigated. Values of skewness and kurtosis were calculated for the distribution of
scores for this variable. The value for skewness -0.554 was divided by the standard error
of skewness 0.169 to yield a z-score of -3.26 which was interpreted to be not significant
as it did not exceed the absolute value of 3.29 (p<0.001) (Tabachnick & Fidell 2001). The
same procedure was performed for kurtosis and yielded a z-score of -1.05, not exceeding
the absolute value of 3.29 (p<0.001) and was interpreted not to be significant in kurtosis.
The histogram of OV.PKM1 is shown below and the curve shows a normal distribution;
therefore, no transformation is required.
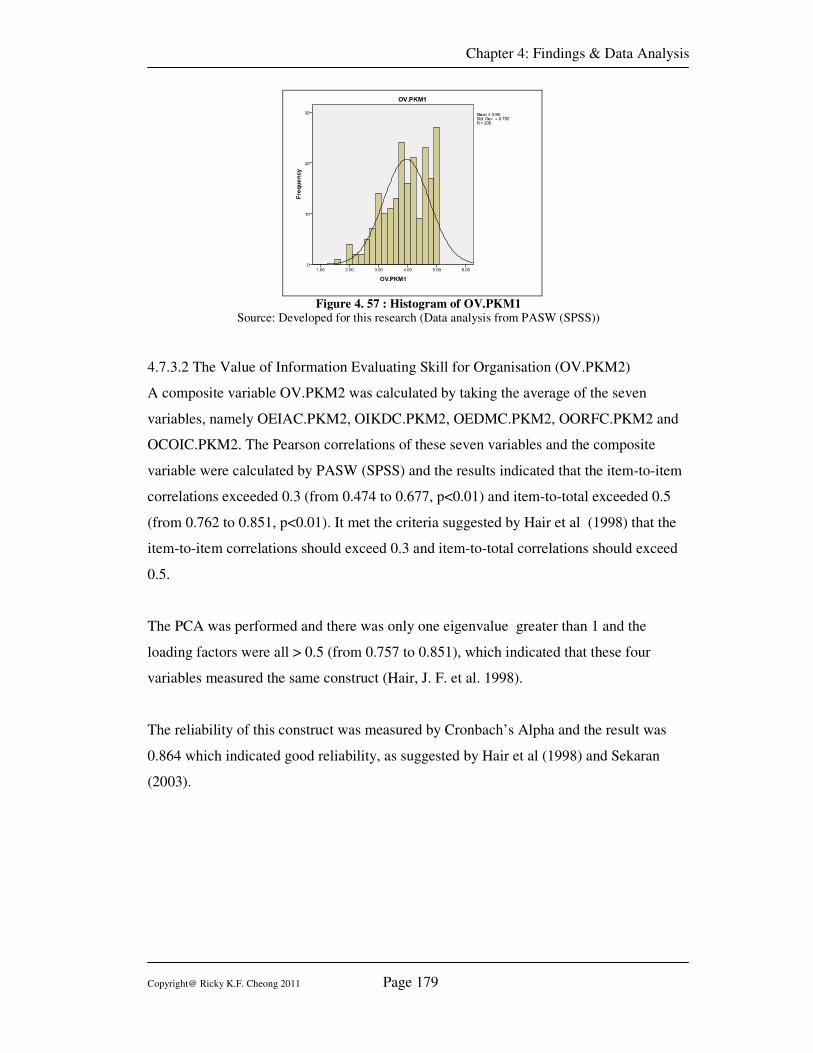
Chapter 4: Findings & Data Analysis
Copyright@ Ricky K.F. Cheong 2011 Page 179
Figure 4. 57 : Histogram of OV.PKM1 Source: Developed for this research (Data analysis from PASW (SPSS))
4.7.3.2 The Value of Information Evaluating Skill for Organisation (OV.PKM2)
A composite variable OV.PKM2 was calculated by taking the average of the seven
variables, namely OEIAC.PKM2, OIKDC.PKM2, OEDMC.PKM2, OORFC.PKM2 and
OCOIC.PKM2. The Pearson correlations of these seven variables and the composite
variable were calculated by PASW (SPSS) and the results indicated that the item-to-item
correlations exceeded 0.3 (from 0.474 to 0.677, p<0.01) and item-to-total exceeded 0.5
(from 0.762 to 0.851, p<0.01). It met the criteria suggested by Hair et al (1998) that the
item-to-item correlations should exceed 0.3 and item-to-total correlations should exceed
0.5.
The PCA was performed and there was only one eigenvalue greater than 1 and the
loading factors were all > 0.5 (from 0.757 to 0.851), which indicated that these four
variables measured the same construct (Hair, J. F. et al. 1998).
The reliability of this construct was measured by Cronbach’s Alpha and the result was
0.864 which indicated good reliability, as suggested by Hair et al (1998) and Sekaran
(2003).
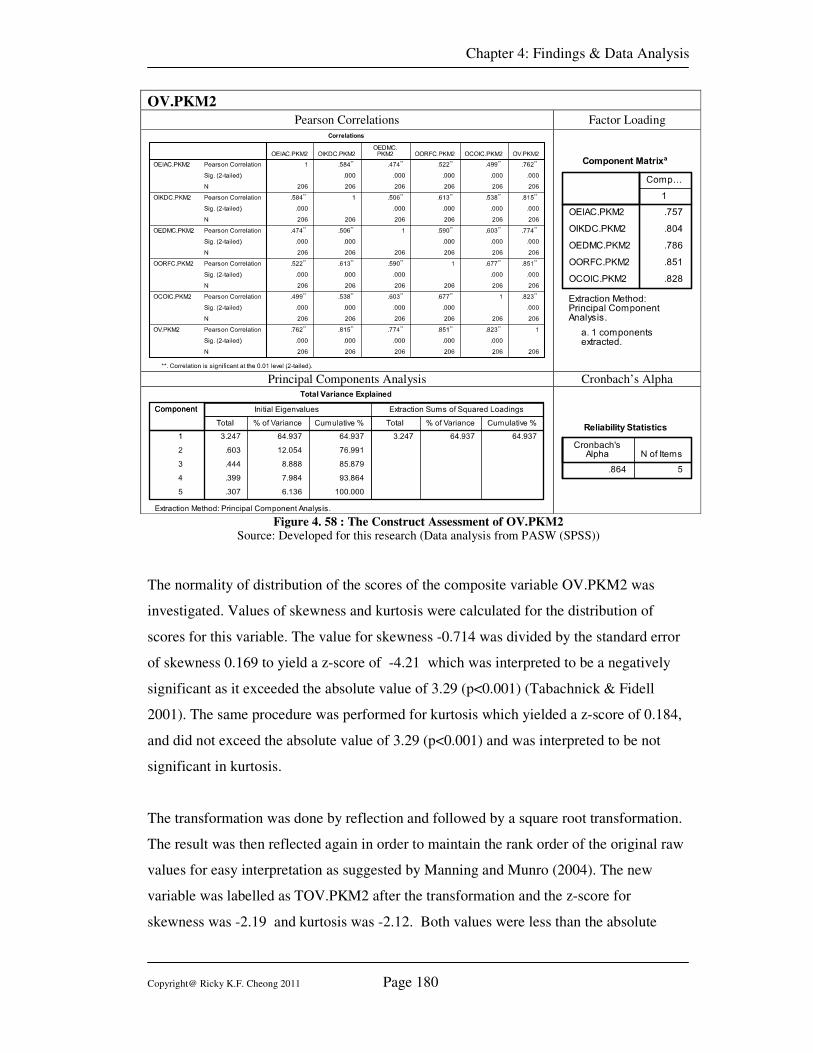
Chapter 4: Findings & Data Analysis
Copyright@ Ricky K.F. Cheong 2011 Page 180
OV.PKM2
Pearson Correlations Factor Loading
Principal Components Analysis Cronbach’s Alpha
Figure 4. 58 : The Construct Assessment of OV.PKM2 Source: Developed for this research (Data analysis from PASW (SPSS))
The normality of distribution of the scores of the composite variable OV.PKM2 was
investigated. Values of skewness and kurtosis were calculated for the distribution of
scores for this variable. The value for skewness -0.714 was divided by the standard error
of skewness 0.169 to yield a z-score of -4.21 which was interpreted to be a negatively
significant as it exceeded the absolute value of 3.29 (p<0.001) (Tabachnick & Fidell
2001). The same procedure was performed for kurtosis which yielded a z-score of 0.184,
and did not exceed the absolute value of 3.29 (p<0.001) and was interpreted to be not
significant in kurtosis.
The transformation was done by reflection and followed by a square root transformation.
The result was then reflected again in order to maintain the rank order of the original raw
values for easy interpretation as suggested by Manning and Munro (2004). The new
variable was labelled as TOV.PKM2 after the transformation and the z-score for
skewness was -2.19 and kurtosis was -2.12. Both values were less than the absolute
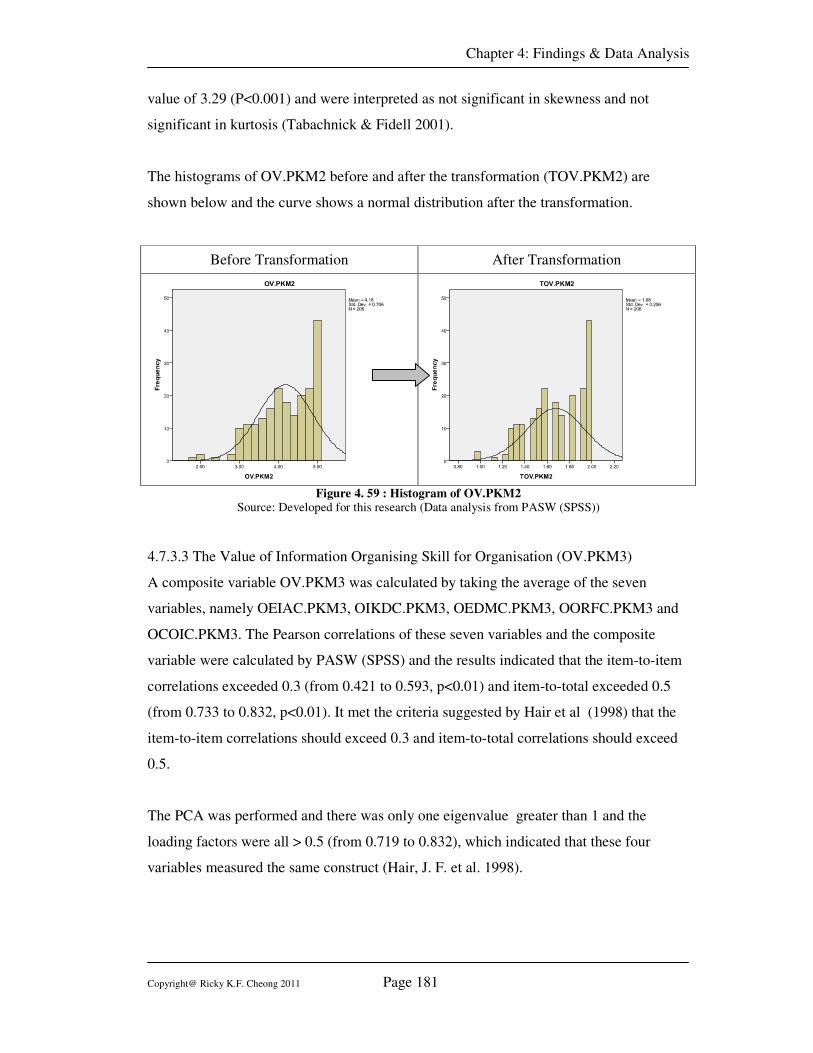
Chapter 4: Findings & Data Analysis
Copyright@ Ricky K.F. Cheong 2011 Page 181
value of 3.29 (P<0.001) and were interpreted as not significant in skewness and not
significant in kurtosis (Tabachnick & Fidell 2001).
The histograms of OV.PKM2 before and after the transformation (TOV.PKM2) are
shown below and the curve shows a normal distribution after the transformation.
Before Transformation After Transformation
Figure 4. 59 : Histogram of OV.PKM2
Source: Developed for this research (Data analysis from PASW (SPSS))
4.7.3.3 The Value of Information Organising Skill for Organisation (OV.PKM3)
A composite variable OV.PKM3 was calculated by taking the average of the seven
variables, namely OEIAC.PKM3, OIKDC.PKM3, OEDMC.PKM3, OORFC.PKM3 and
OCOIC.PKM3. The Pearson correlations of these seven variables and the composite
variable were calculated by PASW (SPSS) and the results indicated that the item-to-item
correlations exceeded 0.3 (from 0.421 to 0.593, p<0.01) and item-to-total exceeded 0.5
(from 0.733 to 0.832, p<0.01). It met the criteria suggested by Hair et al (1998) that the
item-to-item correlations should exceed 0.3 and item-to-total correlations should exceed
0.5.
The PCA was performed and there was only one eigenvalue greater than 1 and the
loading factors were all > 0.5 (from 0.719 to 0.832), which indicated that these four
variables measured the same construct (Hair, J. F. et al. 1998).
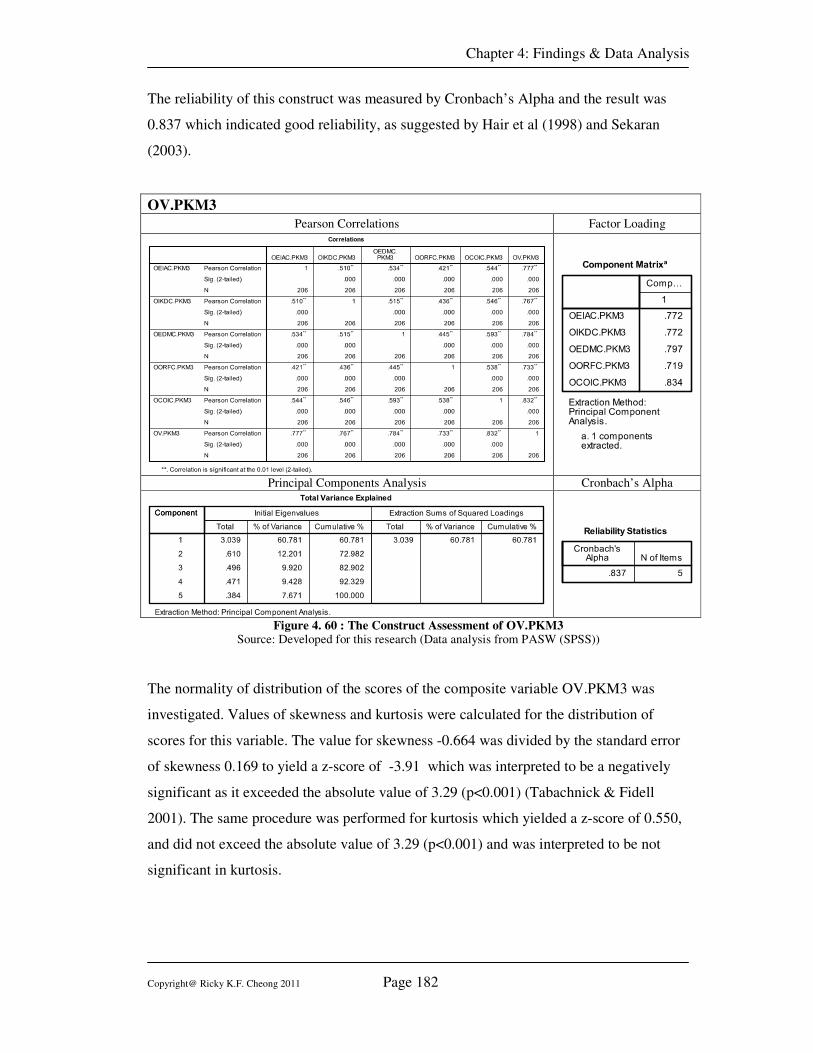
Chapter 4: Findings & Data Analysis
Copyright@ Ricky K.F. Cheong 2011 Page 182
The reliability of this construct was measured by Cronbach’s Alpha and the result was
0.837 which indicated good reliability, as suggested by Hair et al (1998) and Sekaran
(2003).
OV.PKM3
Pearson Correlations Factor Loading
Principal Components Analysis Cronbach’s Alpha
Figure 4. 60 : The Construct Assessment of OV.PKM3 Source: Developed for this research (Data analysis from PASW (SPSS))
The normality of distribution of the scores of the composite variable OV.PKM3 was
investigated. Values of skewness and kurtosis were calculated for the distribution of
scores for this variable. The value for skewness -0.664 was divided by the standard error
of skewness 0.169 to yield a z-score of -3.91 which was interpreted to be a negatively
significant as it exceeded the absolute value of 3.29 (p<0.001) (Tabachnick & Fidell
2001). The same procedure was performed for kurtosis which yielded a z-score of 0.550,
and did not exceed the absolute value of 3.29 (p<0.001) and was interpreted to be not
significant in kurtosis.
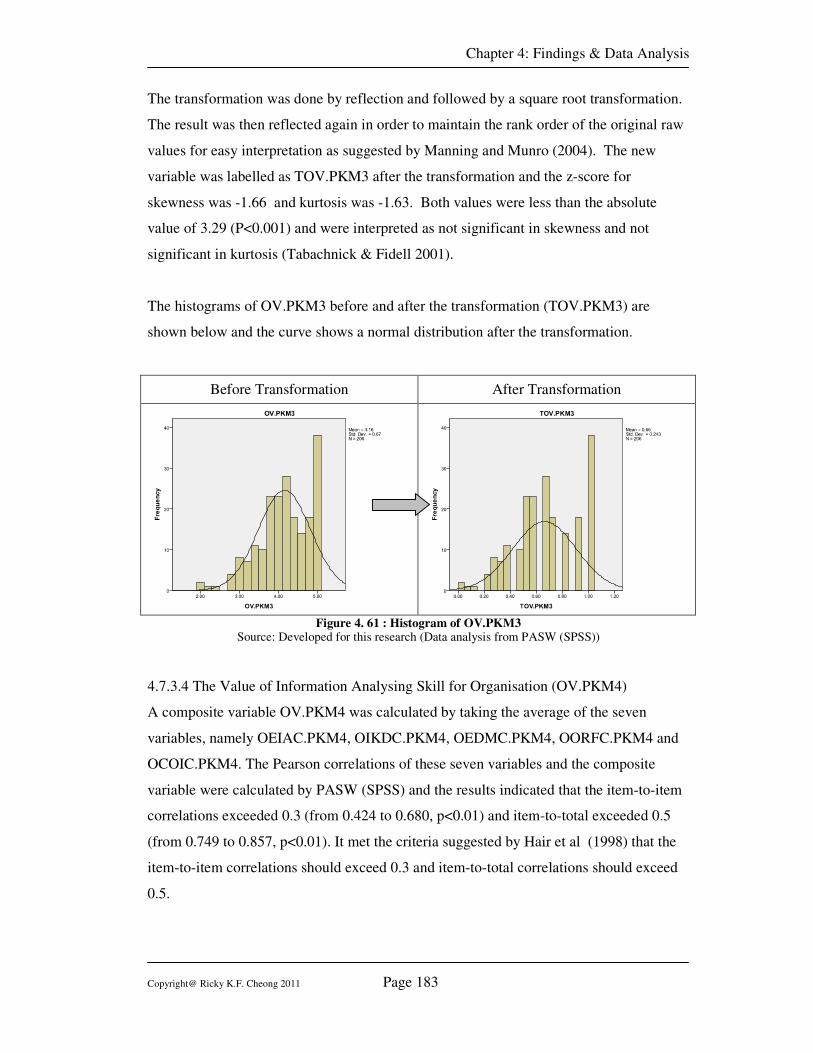
Chapter 4: Findings & Data Analysis
Copyright@ Ricky K.F. Cheong 2011 Page 183
The transformation was done by reflection and followed by a square root transformation.
The result was then reflected again in order to maintain the rank order of the original raw
values for easy interpretation as suggested by Manning and Munro (2004). The new
variable was labelled as TOV.PKM3 after the transformation and the z-score for
skewness was -1.66 and kurtosis was -1.63. Both values were less than the absolute
value of 3.29 (P<0.001) and were interpreted as not significant in skewness and not
significant in kurtosis (Tabachnick & Fidell 2001).
The histograms of OV.PKM3 before and after the transformation (TOV.PKM3) are
shown below and the curve shows a normal distribution after the transformation.
Before Transformation After Transformation
Figure 4. 61 : Histogram of OV.PKM3
Source: Developed for this research (Data analysis from PASW (SPSS))
4.7.3.4 The Value of Information Analysing Skill for Organisation (OV.PKM4)
A composite variable OV.PKM4 was calculated by taking the average of the seven
variables, namely OEIAC.PKM4, OIKDC.PKM4, OEDMC.PKM4, OORFC.PKM4 and
OCOIC.PKM4. The Pearson correlations of these seven variables and the composite
variable were calculated by PASW (SPSS) and the results indicated that the item-to-item
correlations exceeded 0.3 (from 0.424 to 0.680, p<0.01) and item-to-total exceeded 0.5
(from 0.749 to 0.857, p<0.01). It met the criteria suggested by Hair et al (1998) that the
item-to-item correlations should exceed 0.3 and item-to-total correlations should exceed
0.5.
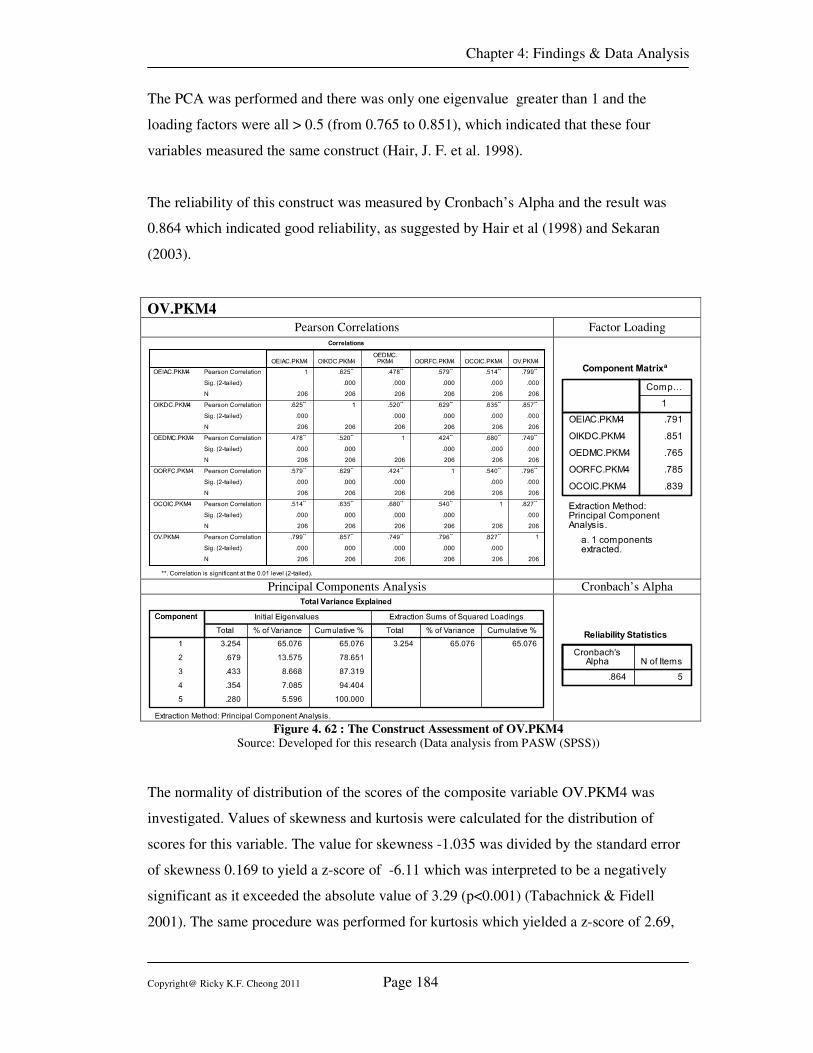
Chapter 4: Findings & Data Analysis
Copyright@ Ricky K.F. Cheong 2011 Page 184
The PCA was performed and there was only one eigenvalue greater than 1 and the
loading factors were all > 0.5 (from 0.765 to 0.851), which indicated that these four
variables measured the same construct (Hair, J. F. et al. 1998).
The reliability of this construct was measured by Cronbach’s Alpha and the result was
0.864 which indicated good reliability, as suggested by Hair et al (1998) and Sekaran
(2003).
OV.PKM4
Pearson Correlations Factor Loading
Principal Components Analysis Cronbach’s Alpha
Figure 4. 62 : The Construct Assessment of OV.PKM4
Source: Developed for this research (Data analysis from PASW (SPSS))
The normality of distribution of the scores of the composite variable OV.PKM4 was
investigated. Values of skewness and kurtosis were calculated for the distribution of
scores for this variable. The value for skewness -1.035 was divided by the standard error
of skewness 0.169 to yield a z-score of -6.11 which was interpreted to be a negatively
significant as it exceeded the absolute value of 3.29 (p<0.001) (Tabachnick & Fidell
2001). The same procedure was performed for kurtosis which yielded a z-score of 2.69,
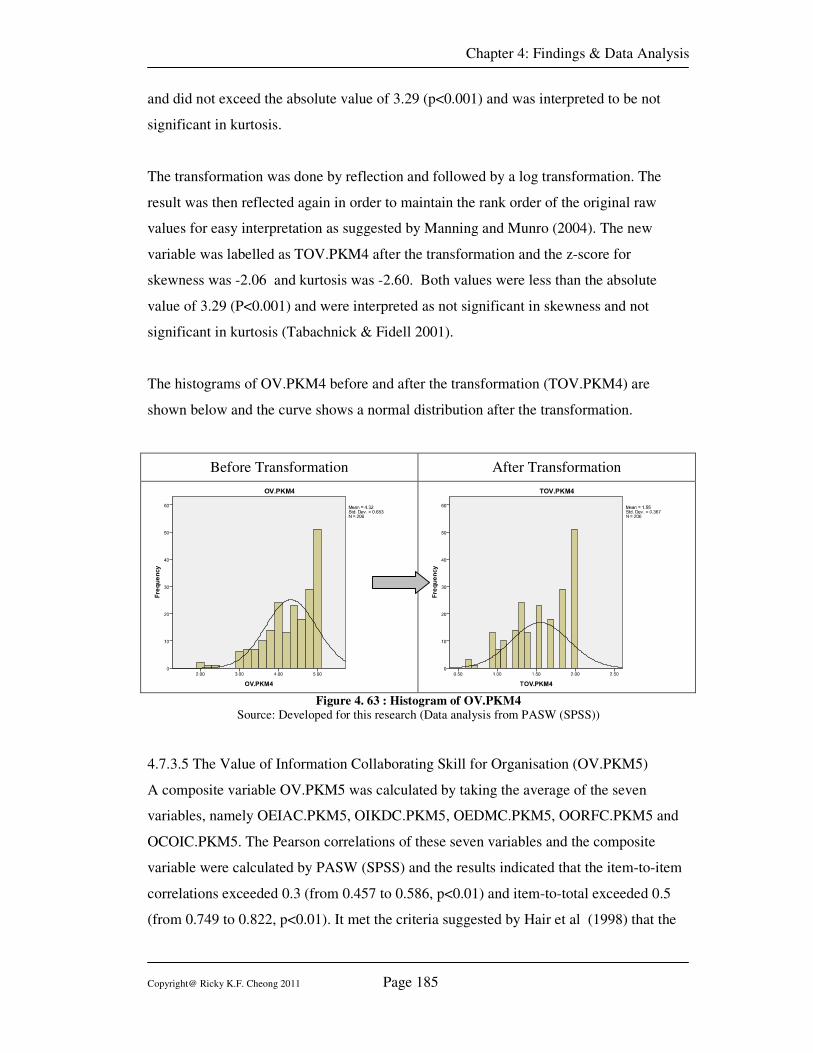
Chapter 4: Findings & Data Analysis
Copyright@ Ricky K.F. Cheong 2011 Page 185
and did not exceed the absolute value of 3.29 (p<0.001) and was interpreted to be not
significant in kurtosis.
The transformation was done by reflection and followed by a log transformation. The
result was then reflected again in order to maintain the rank order of the original raw
values for easy interpretation as suggested by Manning and Munro (2004). The new
variable was labelled as TOV.PKM4 after the transformation and the z-score for
skewness was -2.06 and kurtosis was -2.60. Both values were less than the absolute
value of 3.29 (P<0.001) and were interpreted as not significant in skewness and not
significant in kurtosis (Tabachnick & Fidell 2001).
The histograms of OV.PKM4 before and after the transformation (TOV.PKM4) are
shown below and the curve shows a normal distribution after the transformation.
Before Transformation After Transformation
Figure 4. 63 : Histogram of OV.PKM4
Source: Developed for this research (Data analysis from PASW (SPSS))
4.7.3.5 The Value of Information Collaborating Skill for Organisation (OV.PKM5)
A composite variable OV.PKM5 was calculated by taking the average of the seven
variables, namely OEIAC.PKM5, OIKDC.PKM5, OEDMC.PKM5, OORFC.PKM5 and
OCOIC.PKM5. The Pearson correlations of these seven variables and the composite
variable were calculated by PASW (SPSS) and the results indicated that the item-to-item
correlations exceeded 0.3 (from 0.457 to 0.586, p<0.01) and item-to-total exceeded 0.5
(from 0.749 to 0.822, p<0.01). It met the criteria suggested by Hair et al (1998) that the
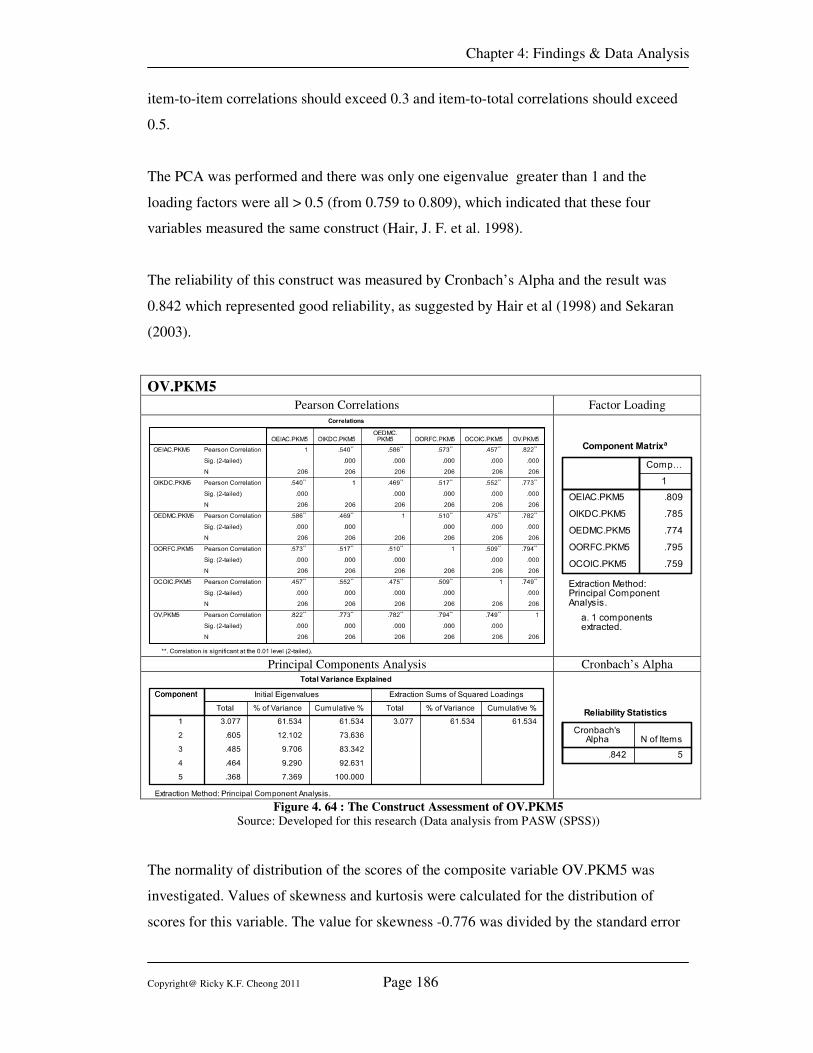
Chapter 4: Findings & Data Analysis
Copyright@ Ricky K.F. Cheong 2011 Page 186
item-to-item correlations should exceed 0.3 and item-to-total correlations should exceed
0.5.
The PCA was performed and there was only one eigenvalue greater than 1 and the
loading factors were all > 0.5 (from 0.759 to 0.809), which indicated that these four
variables measured the same construct (Hair, J. F. et al. 1998).
The reliability of this construct was measured by Cronbach’s Alpha and the result was
0.842 which represented good reliability, as suggested by Hair et al (1998) and Sekaran
(2003).
OV.PKM5
Pearson Correlations Factor Loading
Principal Components Analysis Cronbach’s Alpha
Figure 4. 64 : The Construct Assessment of OV.PKM5
Source: Developed for this research (Data analysis from PASW (SPSS))
The normality of distribution of the scores of the composite variable OV.PKM5 was
investigated. Values of skewness and kurtosis were calculated for the distribution of
scores for this variable. The value for skewness -0.776 was divided by the standard error
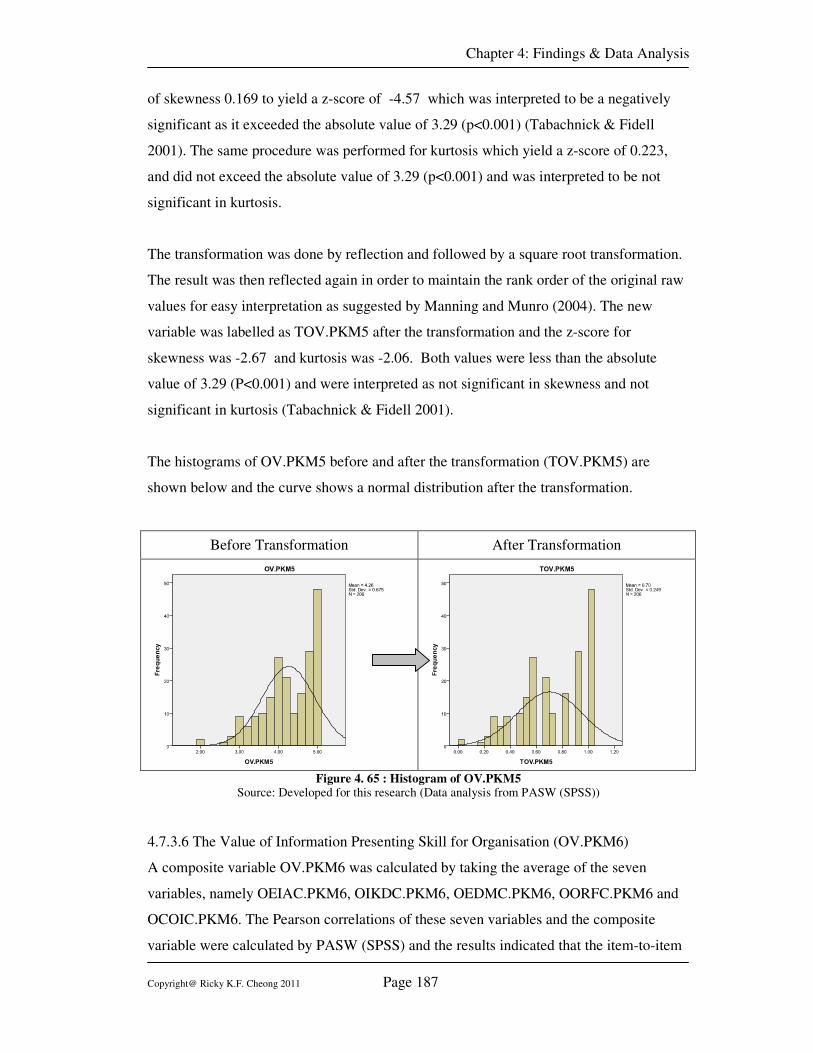
Chapter 4: Findings & Data Analysis
Copyright@ Ricky K.F. Cheong 2011 Page 187
of skewness 0.169 to yield a z-score of -4.57 which was interpreted to be a negatively
significant as it exceeded the absolute value of 3.29 (p<0.001) (Tabachnick & Fidell
2001). The same procedure was performed for kurtosis which yield a z-score of 0.223,
and did not exceed the absolute value of 3.29 (p<0.001) and was interpreted to be not
significant in kurtosis.
The transformation was done by reflection and followed by a square root transformation.
The result was then reflected again in order to maintain the rank order of the original raw
values for easy interpretation as suggested by Manning and Munro (2004). The new
variable was labelled as TOV.PKM5 after the transformation and the z-score for
skewness was -2.67 and kurtosis was -2.06. Both values were less than the absolute
value of 3.29 (P<0.001) and were interpreted as not significant in skewness and not
significant in kurtosis (Tabachnick & Fidell 2001).
The histograms of OV.PKM5 before and after the transformation (TOV.PKM5) are
shown below and the curve shows a normal distribution after the transformation.
Before Transformation After Transformation
Figure 4. 65 : Histogram of OV.PKM5
Source: Developed for this research (Data analysis from PASW (SPSS))
4.7.3.6 The Value of Information Presenting Skill for Organisation (OV.PKM6)
A composite variable OV.PKM6 was calculated by taking the average of the seven
variables, namely OEIAC.PKM6, OIKDC.PKM6, OEDMC.PKM6, OORFC.PKM6 and
OCOIC.PKM6. The Pearson correlations of these seven variables and the composite
variable were calculated by PASW (SPSS) and the results indicated that the item-to-item
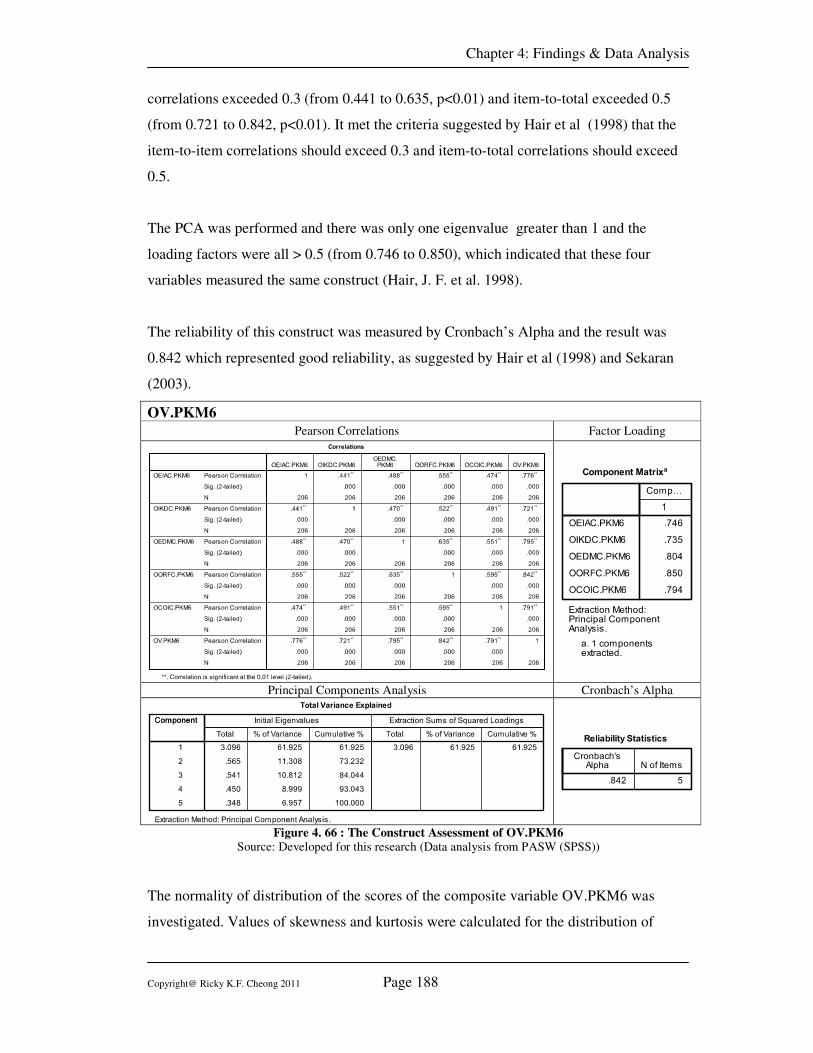
Chapter 4: Findings & Data Analysis
Copyright@ Ricky K.F. Cheong 2011 Page 188
correlations exceeded 0.3 (from 0.441 to 0.635, p<0.01) and item-to-total exceeded 0.5
(from 0.721 to 0.842, p<0.01). It met the criteria suggested by Hair et al (1998) that the
item-to-item correlations should exceed 0.3 and item-to-total correlations should exceed
0.5.
The PCA was performed and there was only one eigenvalue greater than 1 and the
loading factors were all > 0.5 (from 0.746 to 0.850), which indicated that these four
variables measured the same construct (Hair, J. F. et al. 1998).
The reliability of this construct was measured by Cronbach’s Alpha and the result was
0.842 which represented good reliability, as suggested by Hair et al (1998) and Sekaran
(2003).
OV.PKM6
Pearson Correlations Factor Loading
Principal Components Analysis Cronbach’s Alpha
Figure 4. 66 : The Construct Assessment of OV.PKM6
Source: Developed for this research (Data analysis from PASW (SPSS))
The normality of distribution of the scores of the composite variable OV.PKM6 was
investigated. Values of skewness and kurtosis were calculated for the distribution of
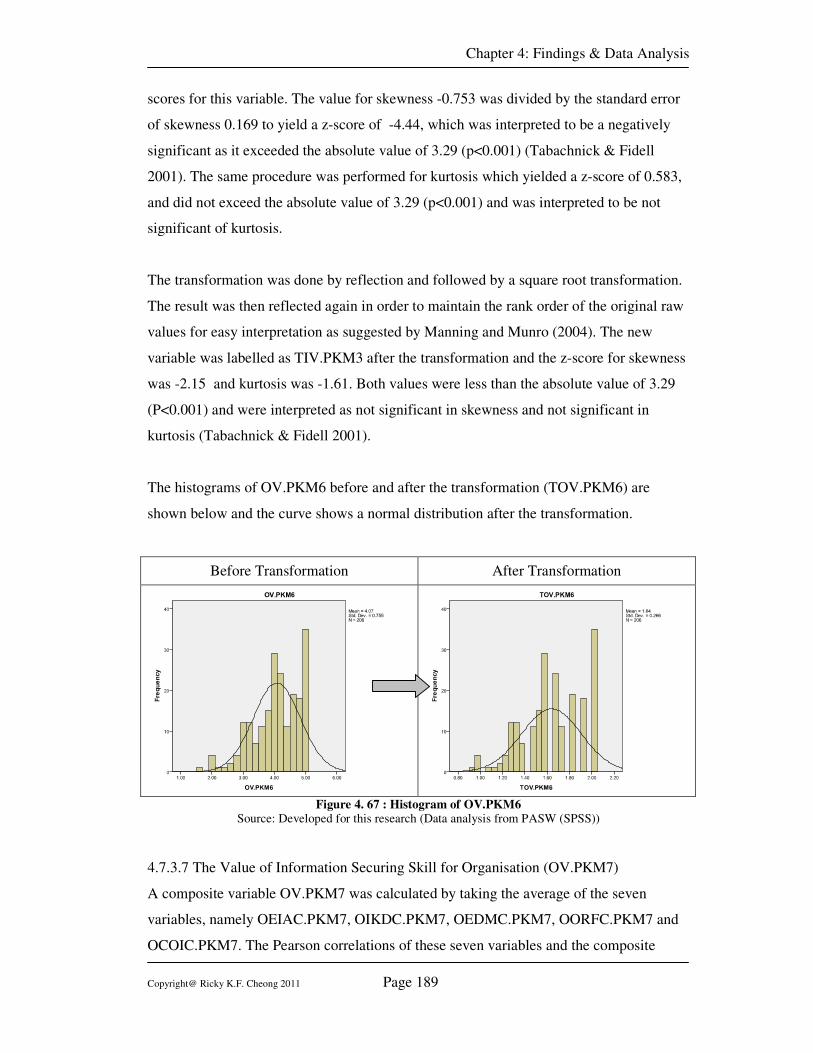
Chapter 4: Findings & Data Analysis
Copyright@ Ricky K.F. Cheong 2011 Page 189
scores for this variable. The value for skewness -0.753 was divided by the standard error
of skewness 0.169 to yield a z-score of -4.44, which was interpreted to be a negatively
significant as it exceeded the absolute value of 3.29 (p<0.001) (Tabachnick & Fidell
2001). The same procedure was performed for kurtosis which yielded a z-score of 0.583,
and did not exceed the absolute value of 3.29 (p<0.001) and was interpreted to be not
significant of kurtosis.
The transformation was done by reflection and followed by a square root transformation.
The result was then reflected again in order to maintain the rank order of the original raw
values for easy interpretation as suggested by Manning and Munro (2004). The new
variable was labelled as TIV.PKM3 after the transformation and the z-score for skewness
was -2.15 and kurtosis was -1.61. Both values were less than the absolute value of 3.29
(P<0.001) and were interpreted as not significant in skewness and not significant in
kurtosis (Tabachnick & Fidell 2001).
The histograms of OV.PKM6 before and after the transformation (TOV.PKM6) are
shown below and the curve shows a normal distribution after the transformation.
Before Transformation After Transformation
Figure 4. 67 : Histogram of OV.PKM6
Source: Developed for this research (Data analysis from PASW (SPSS))
4.7.3.7 The Value of Information Securing Skill for Organisation (OV.PKM7)
A composite variable OV.PKM7 was calculated by taking the average of the seven
variables, namely OEIAC.PKM7, OIKDC.PKM7, OEDMC.PKM7, OORFC.PKM7 and
OCOIC.PKM7. The Pearson correlations of these seven variables and the composite
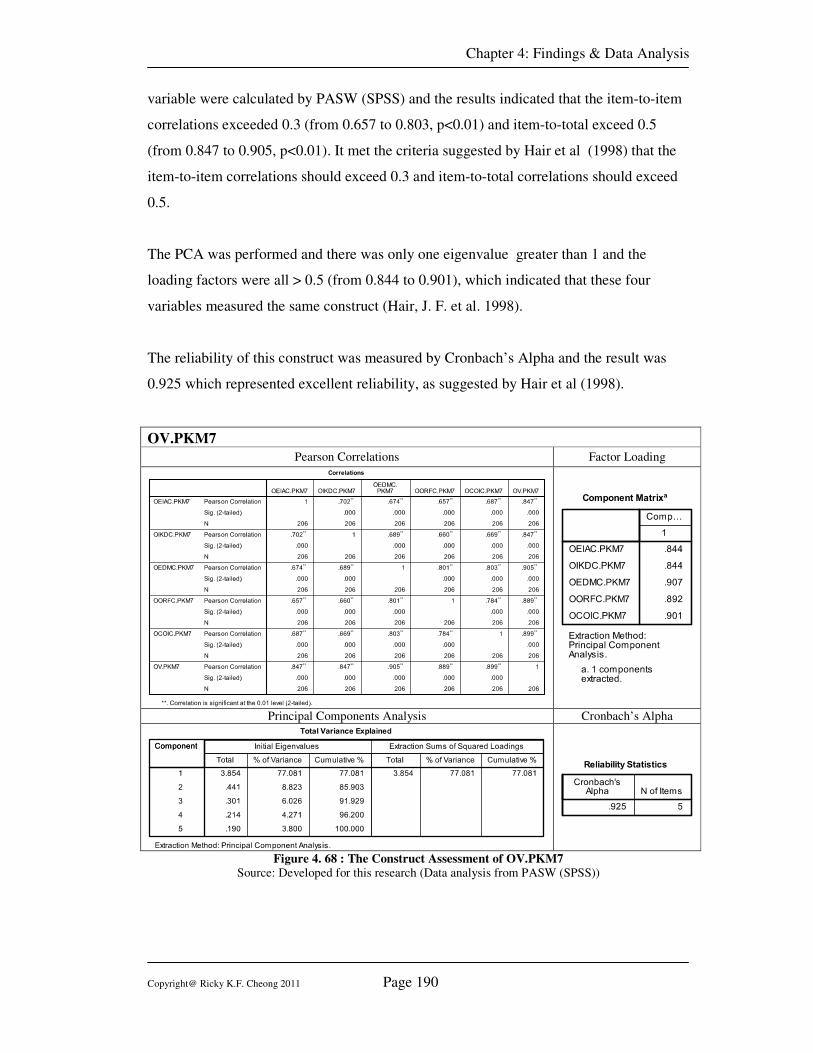
Chapter 4: Findings & Data Analysis
Copyright@ Ricky K.F. Cheong 2011 Page 190
variable were calculated by PASW (SPSS) and the results indicated that the item-to-item
correlations exceeded 0.3 (from 0.657 to 0.803, p<0.01) and item-to-total exceed 0.5
(from 0.847 to 0.905, p<0.01). It met the criteria suggested by Hair et al (1998) that the
item-to-item correlations should exceed 0.3 and item-to-total correlations should exceed
0.5.
The PCA was performed and there was only one eigenvalue greater than 1 and the
loading factors were all > 0.5 (from 0.844 to 0.901), which indicated that these four
variables measured the same construct (Hair, J. F. et al. 1998).
The reliability of this construct was measured by Cronbach’s Alpha and the result was
0.925 which represented excellent reliability, as suggested by Hair et al (1998).
OV.PKM7
Pearson Correlations Factor Loading
Principal Components Analysis Cronbach’s Alpha
Figure 4. 68 : The Construct Assessment of OV.PKM7
Source: Developed for this research (Data analysis from PASW (SPSS))
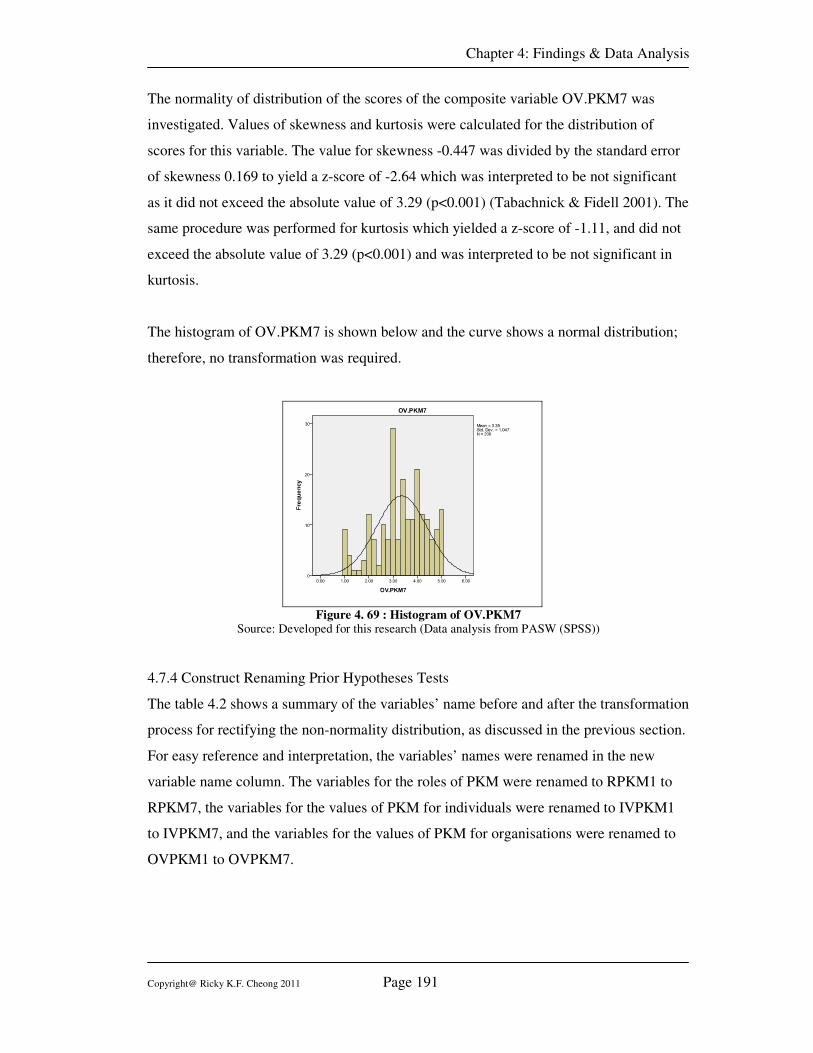
Chapter 4: Findings & Data Analysis
Copyright@ Ricky K.F. Cheong 2011 Page 191
The normality of distribution of the scores of the composite variable OV.PKM7 was
investigated. Values of skewness and kurtosis were calculated for the distribution of
scores for this variable. The value for skewness -0.447 was divided by the standard error
of skewness 0.169 to yield a z-score of -2.64 which was interpreted to be not significant
as it did not exceed the absolute value of 3.29 (p<0.001) (Tabachnick & Fidell 2001). The
same procedure was performed for kurtosis which yielded a z-score of -1.11, and did not
exceed the absolute value of 3.29 (p<0.001) and was interpreted to be not significant in
kurtosis.
The histogram of OV.PKM7 is shown below and the curve shows a normal distribution;
therefore, no transformation was required.
Figure 4. 69 : Histogram of OV.PKM7 Source: Developed for this research (Data analysis from PASW (SPSS))
4.7.4 Construct Renaming Prior Hypotheses Tests
The table 4.2 shows a summary of the variables’ name before and after the transformation
process for rectifying the non-normality distribution, as discussed in the previous section.
For easy reference and interpretation, the variables’ names were renamed in the new
variable name column. The variables for the roles of PKM were renamed to RPKM1 to
RPKM7, the variables for the values of PKM for individuals were renamed to IVPKM1
to IVPKM7, and the variables for the values of PKM for organisations were renamed to
OVPKM1 to OVPKM7.
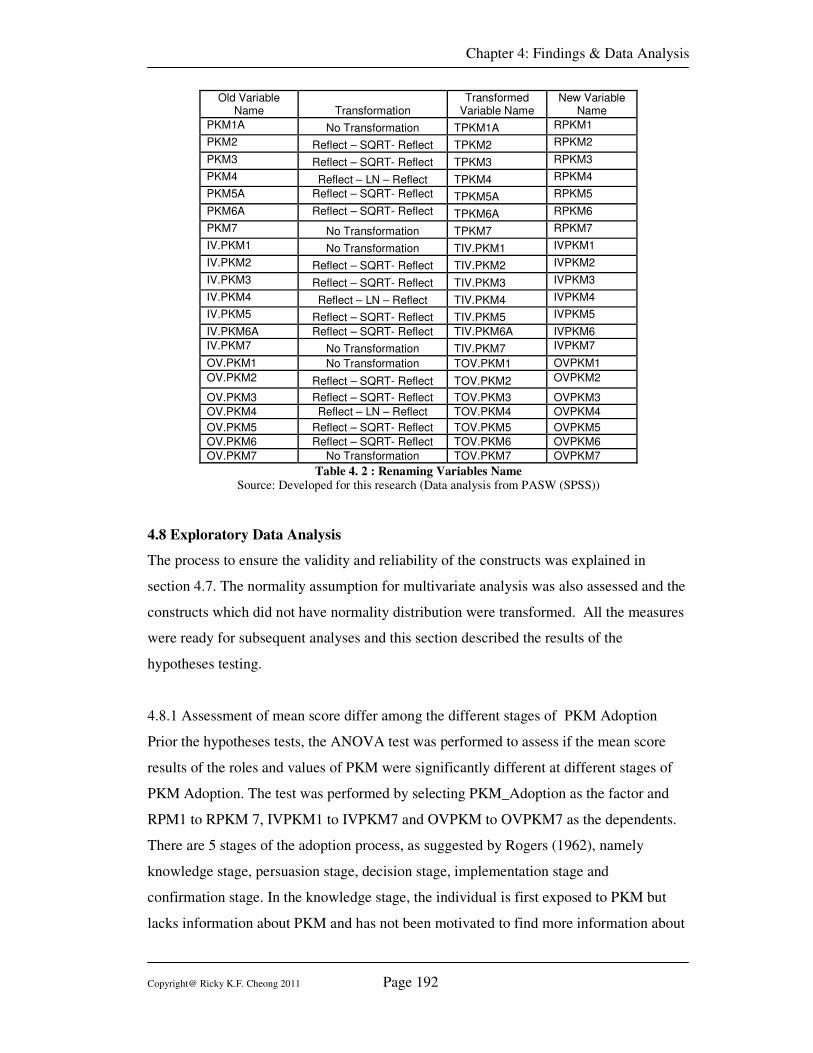
Chapter 4: Findings & Data Analysis
Copyright@ Ricky K.F. Cheong 2011 Page 192
Old Variable Name Transformation
Transformed Variable Name
New Variable Name
PKM1A No Transformation TPKM1A RPKM1
PKM2 Reflect – SQRT- Reflect TPKM2 RPKM2
PKM3 Reflect – SQRT- Reflect TPKM3 RPKM3
PKM4 Reflect – LN – Reflect TPKM4 RPKM4
PKM5A Reflect – SQRT- Reflect TPKM5A RPKM5
PKM6A Reflect – SQRT- Reflect TPKM6A RPKM6
PKM7 No Transformation TPKM7 RPKM7
IV.PKM1 No Transformation TIV.PKM1 IVPKM1
IV.PKM2 Reflect – SQRT- Reflect TIV.PKM2 IVPKM2
IV.PKM3 Reflect – SQRT- Reflect TIV.PKM3 IVPKM3
IV.PKM4 Reflect – LN – Reflect TIV.PKM4 IVPKM4
IV.PKM5 Reflect – SQRT- Reflect TIV.PKM5 IVPKM5
IV.PKM6A Reflect – SQRT- Reflect TIV.PKM6A IVPKM6
IV.PKM7 No Transformation TIV.PKM7 IVPKM7
OV.PKM1 No Transformation TOV.PKM1 OVPKM1
OV.PKM2 Reflect – SQRT- Reflect TOV.PKM2 OVPKM2
OV.PKM3 Reflect – SQRT- Reflect TOV.PKM3 OVPKM3
OV.PKM4 Reflect – LN – Reflect TOV.PKM4 OVPKM4
OV.PKM5 Reflect – SQRT- Reflect TOV.PKM5 OVPKM5
OV.PKM6 Reflect – SQRT- Reflect TOV.PKM6 OVPKM6
OV.PKM7 No Transformation TOV.PKM7 OVPKM7
Table 4. 2 : Renaming Variables Name Source: Developed for this research (Data analysis from PASW (SPSS))
4.8 Exploratory Data Analysis
The process to ensure the validity and reliability of the constructs was explained in
section 4.7. The normality assumption for multivariate analysis was also assessed and the
constructs which did not have normality distribution were transformed. All the measures
were ready for subsequent analyses and this section described the results of the
hypotheses testing.
4.8.1 Assessment of mean score differ among the different stages of PKM Adoption
Prior the hypotheses tests, the ANOVA test was performed to assess if the mean score
results of the roles and values of PKM were significantly different at different stages of
PKM Adoption. The test was performed by selecting PKM_Adoption as the factor and
RPM1 to RPKM 7, IVPKM1 to IVPKM7 and OVPKM to OVPKM7 as the dependents.
There are 5 stages of the adoption process, as suggested by Rogers (1962), namely
knowledge stage, persuasion stage, decision stage, implementation stage and
confirmation stage. In the knowledge stage, the individual is first exposed to PKM but
lacks information about PKM and has not been motivated to find more information about
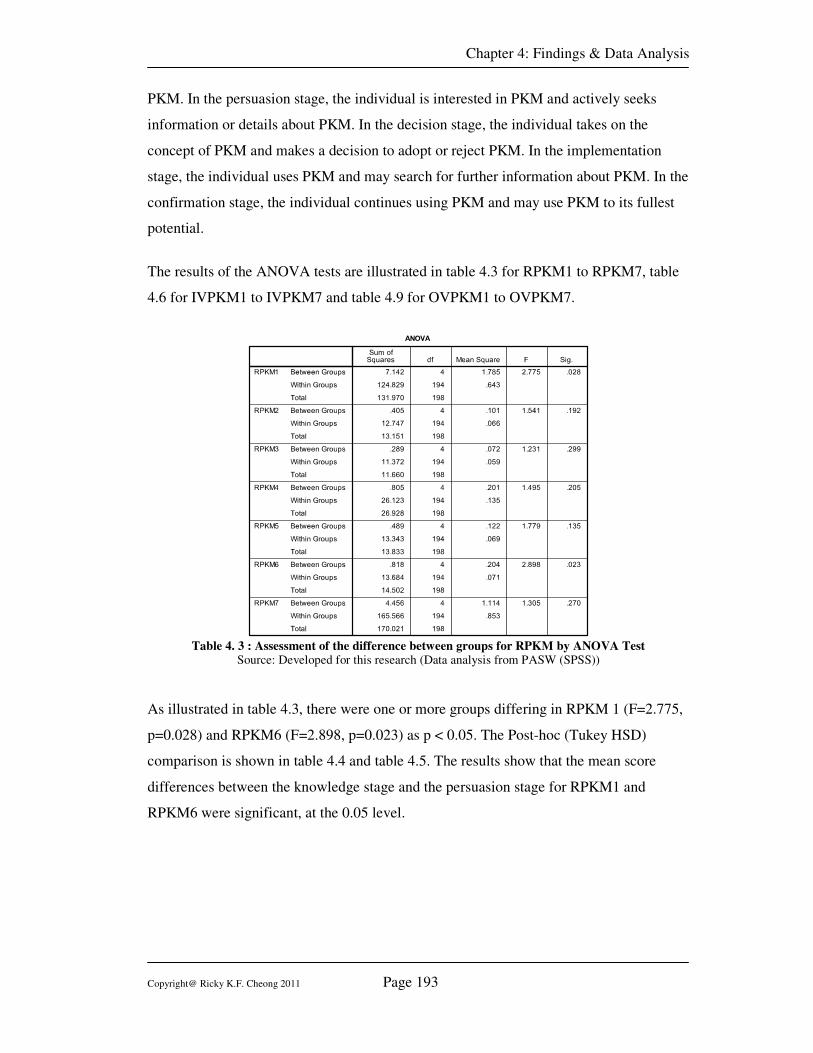
Chapter 4: Findings & Data Analysis
Copyright@ Ricky K.F. Cheong 2011 Page 193
PKM. In the persuasion stage, the individual is interested in PKM and actively seeks
information or details about PKM. In the decision stage, the individual takes on the
concept of PKM and makes a decision to adopt or reject PKM. In the implementation
stage, the individual uses PKM and may search for further information about PKM. In the
confirmation stage, the individual continues using PKM and may use PKM to its fullest
potential.
The results of the ANOVA tests are illustrated in table 4.3 for RPKM1 to RPKM7, table
4.6 for IVPKM1 to IVPKM7 and table 4.9 for OVPKM1 to OVPKM7.
Table 4. 3 : Assessment of the difference between groups for RPKM by ANOVA Test
Source: Developed for this research (Data analysis from PASW (SPSS))
As illustrated in table 4.3, there were one or more groups differing in RPKM 1 (F=2.775,
p=0.028) and RPKM6 (F=2.898, p=0.023) as p < 0.05. The Post-hoc (Tukey HSD)
comparison is shown in table 4.4 and table 4.5. The results show that the mean score
differences between the knowledge stage and the persuasion stage for RPKM1 and
RPKM6 were significant, at the 0.05 level.
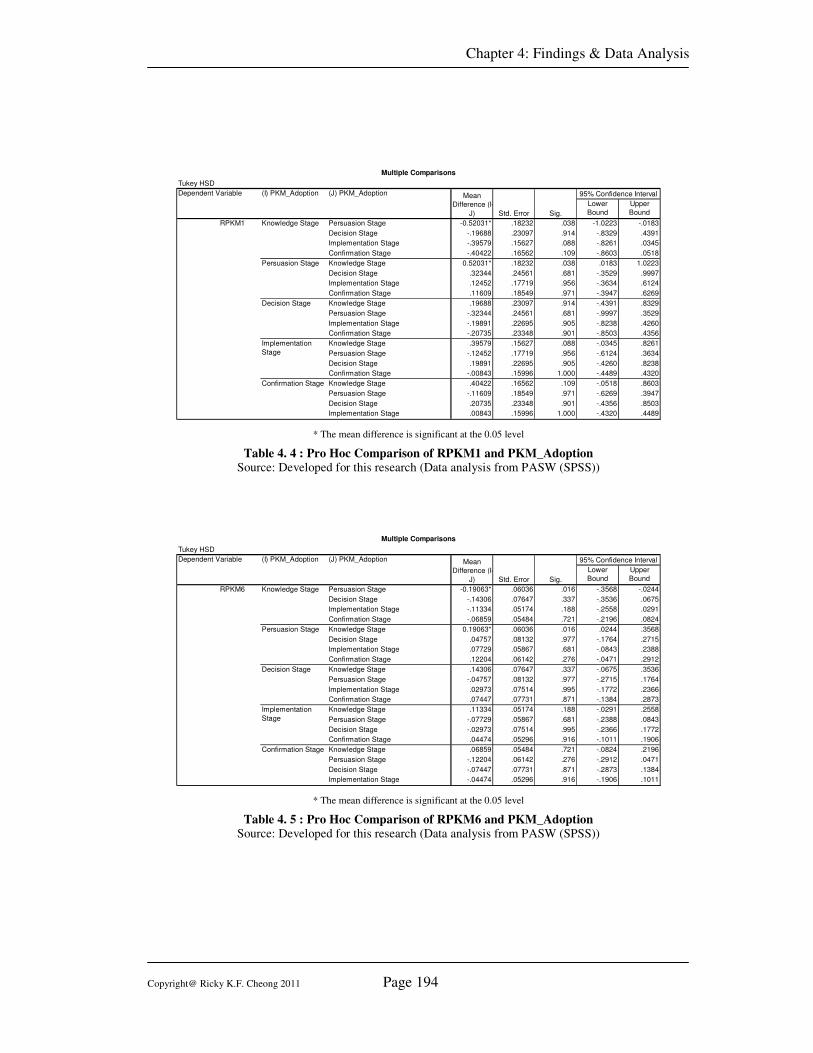
Chapter 4: Findings & Data Analysis
Copyright@ Ricky K.F. Cheong 2011 Page 194
Lower
Bound
Upper
Bound
Persuasion Stage -0.52031* .18232 .038 -1.0223 -.0183
Decision Stage -.19688 .23097 .914 -.8329 .4391
Implementation Stage -.39579 .15627 .088 -.8261 .0345
Confirmation Stage -.40422 .16562 .109 -.8603 .0518
Knowledge Stage 0.52031* .18232 .038 .0183 1.0223
Decision Stage .32344 .24561 .681 -.3529 .9997
Implementation Stage .12452 .17719 .956 -.3634 .6124
Confirmation Stage .11609 .18549 .971 -.3947 .6269
Knowledge Stage .19688 .23097 .914 -.4391 .8329
Persuasion Stage -.32344 .24561 .681 -.9997 .3529
Implementation Stage -.19891 .22695 .905 -.8238 .4260
Confirmation Stage -.20735 .23348 .901 -.8503 .4356
Knowledge Stage .39579 .15627 .088 -.0345 .8261
Persuasion Stage -.12452 .17719 .956 -.6124 .3634
Decision Stage .19891 .22695 .905 -.4260 .8238
Confirmation Stage -.00843 .15996 1.000 -.4489 .4320
Knowledge Stage .40422 .16562 .109 -.0518 .8603
Persuasion Stage -.11609 .18549 .971 -.6269 .3947
Decision Stage .20735 .23348 .901 -.4356 .8503
Implementation Stage .00843 .15996 1.000 -.4320 .4489
RPKM1 Knowledge Stage
Persuasion Stage
Decision Stage
Implementation
Stage
Confirmation Stage
Multiple Comparisons
Tukey HSD
Dependent Variable (I) PKM_Adoption (J) PKM_Adoption Mean
Difference (I-
J) Std. Error Sig.
95% Confidence Interval
* The mean difference is significant at the 0.05 level
Table 4. 4 : Pro Hoc Comparison of RPKM1 and PKM_Adoption
Source: Developed for this research (Data analysis from PASW (SPSS))
Lower
Bound
Upper
Bound
Persuasion Stage -0.19063* .06036 .016 -.3568 -.0244
Decision Stage -.14306 .07647 .337 -.3536 .0675
Implementation Stage -.11334 .05174 .188 -.2558 .0291
Confirmation Stage -.06859 .05484 .721 -.2196 .0824
Knowledge Stage 0.19063* .06036 .016 .0244 .3568
Decision Stage .04757 .08132 .977 -.1764 .2715
Implementation Stage .07729 .05867 .681 -.0843 .2388
Confirmation Stage .12204 .06142 .276 -.0471 .2912
Knowledge Stage .14306 .07647 .337 -.0675 .3536
Persuasion Stage -.04757 .08132 .977 -.2715 .1764
Implementation Stage .02973 .07514 .995 -.1772 .2366
Confirmation Stage .07447 .07731 .871 -.1384 .2873
Knowledge Stage .11334 .05174 .188 -.0291 .2558
Persuasion Stage -.07729 .05867 .681 -.2388 .0843
Decision Stage -.02973 .07514 .995 -.2366 .1772
Confirmation Stage .04474 .05296 .916 -.1011 .1906
Knowledge Stage .06859 .05484 .721 -.0824 .2196
Persuasion Stage -.12204 .06142 .276 -.2912 .0471
Decision Stage -.07447 .07731 .871 -.2873 .1384
Implementation Stage -.04474 .05296 .916 -.1906 .1011
RPKM6 Knowledge Stage
Persuasion Stage
Decision Stage
Implementation
Stage
Confirmation Stage
Multiple Comparisons
Tukey HSD
Dependent Variable (I) PKM_Adoption (J) PKM_Adoption Mean
Difference (I-
J) Std. Error Sig.
95% Confidence Interval
* The mean difference is significant at the 0.05 level
Table 4. 5 : Pro Hoc Comparison of RPKM6 and PKM_Adoption
Source: Developed for this research (Data analysis from PASW (SPSS))
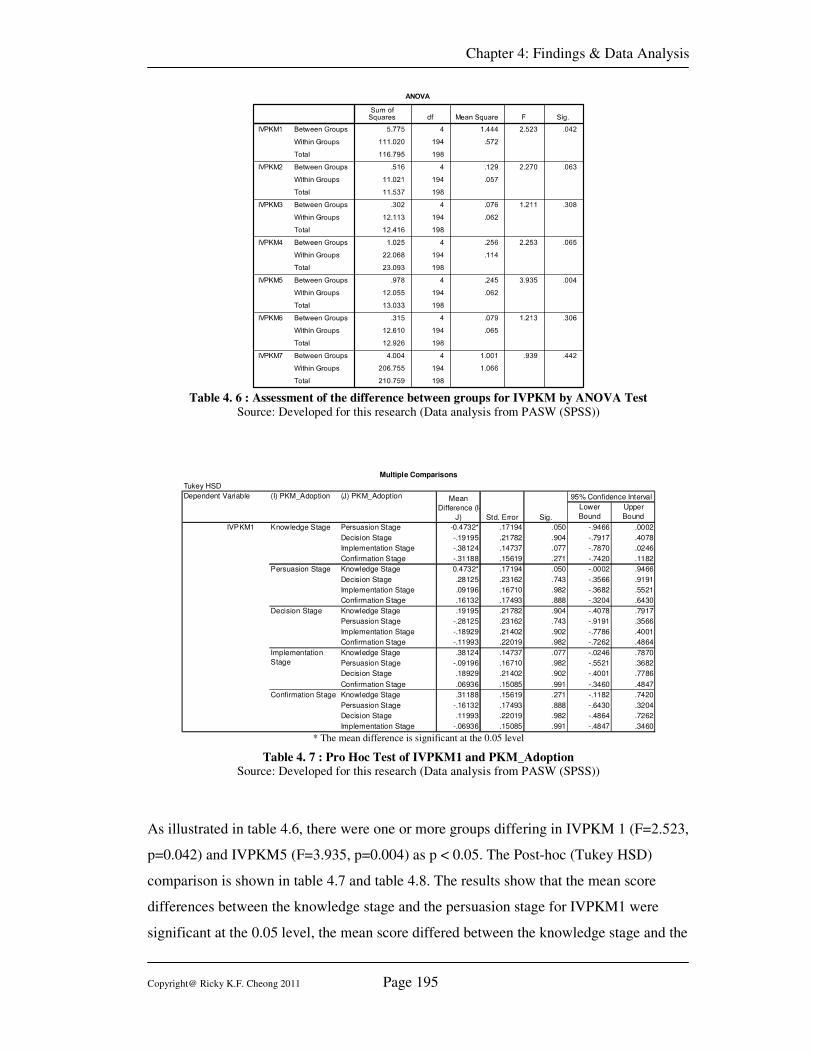
Chapter 4: Findings & Data Analysis
Copyright@ Ricky K.F. Cheong 2011 Page 195
Table 4. 6 : Assessment of the difference between groups for IVPKM by ANOVA Test
Source: Developed for this research (Data analysis from PASW (SPSS))
Lower
Bound
Upper
Bound
Persuasion Stage -0.4732* .17194 .050 -.9466 .0002
Decision Stage -.19195 .21782 .904 -.7917 .4078
Implementation Stage -.38124 .14737 .077 -.7870 .0246
Confirmation Stage -.31188 .15619 .271 -.7420 .1182
Knowledge Stage 0.4732* .17194 .050 -.0002 .9466
Decision Stage .28125 .23162 .743 -.3566 .9191
Implementation Stage .09196 .16710 .982 -.3682 .5521
Confirmation Stage .16132 .17493 .888 -.3204 .6430
Knowledge Stage .19195 .21782 .904 -.4078 .7917
Persuasion Stage -.28125 .23162 .743 -.9191 .3566
Implementation Stage -.18929 .21402 .902 -.7786 .4001
Confirmation Stage -.11993 .22019 .982 -.7262 .4864
Knowledge Stage .38124 .14737 .077 -.0246 .7870
Persuasion Stage -.09196 .16710 .982 -.5521 .3682
Decision Stage .18929 .21402 .902 -.4001 .7786
Confirmation Stage .06936 .15085 .991 -.3460 .4847
Knowledge Stage .31188 .15619 .271 -.1182 .7420
Persuasion Stage -.16132 .17493 .888 -.6430 .3204
Decision Stage .11993 .22019 .982 -.4864 .7262
Implementation Stage -.06936 .15085 .991 -.4847 .3460
IVPKM1 Knowledge Stage
Persuasion Stage
Decision Stage
Implementation
Stage
Confirmation Stage
Multiple Comparisons
Tukey HSD
Dependent Variable (I) PKM_Adoption (J) PKM_Adoption Mean
Difference (I-
J) Std. Error Sig.
95% Confidence Interval
* The mean difference is significant at the 0.05 level
Table 4. 7 : Pro Hoc Test of IVPKM1 and PKM_Adoption Source: Developed for this research (Data analysis from PASW (SPSS))
As illustrated in table 4.6, there were one or more groups differing in IVPKM 1 (F=2.523,
p=0.042) and IVPKM5 (F=3.935, p=0.004) as p < 0.05. The Post-hoc (Tukey HSD)
comparison is shown in table 4.7 and table 4.8. The results show that the mean score
differences between the knowledge stage and the persuasion stage for IVPKM1 were
significant at the 0.05 level, the mean score differed between the knowledge stage and the
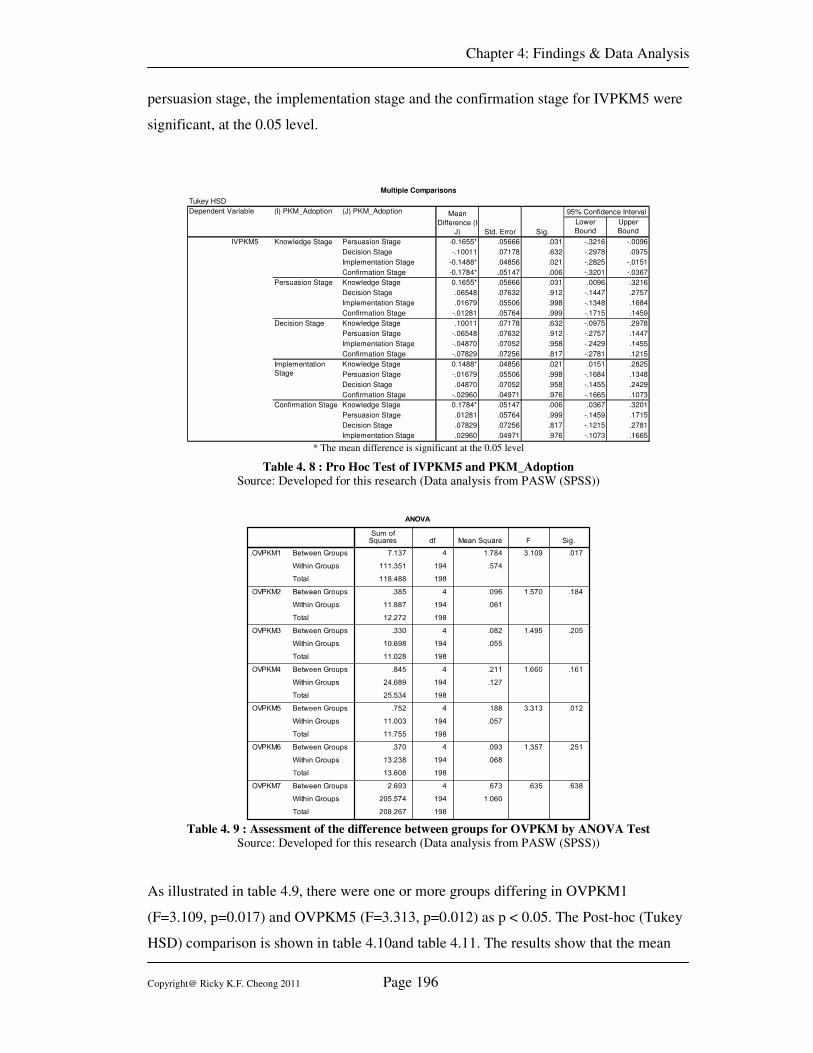
Chapter 4: Findings & Data Analysis
Copyright@ Ricky K.F. Cheong 2011 Page 196
persuasion stage, the implementation stage and the confirmation stage for IVPKM5 were
significant, at the 0.05 level.
Lower
Bound
Upper
Bound
Persuasion Stage -0.1655* .05666 .031 -.3216 -.0096
Decision Stage -.10011 .07178 .632 -.2978 .0975
Implementation Stage -0.1488* .04856 .021 -.2825 -.0151
Confirmation Stage -0.1784* .05147 .006 -.3201 -.0367
Knowledge Stage 0.1655* .05666 .031 .0096 .3216
Decision Stage .06548 .07632 .912 -.1447 .2757
Implementation Stage .01679 .05506 .998 -.1348 .1684
Confirmation Stage -.01281 .05764 .999 -.1715 .1459
Knowledge Stage .10011 .07178 .632 -.0975 .2978
Persuasion Stage -.06548 .07632 .912 -.2757 .1447
Implementation Stage -.04870 .07052 .958 -.2429 .1455
Confirmation Stage -.07829 .07256 .817 -.2781 .1215
Knowledge Stage 0.1488* .04856 .021 .0151 .2825
Persuasion Stage -.01679 .05506 .998 -.1684 .1348
Decision Stage .04870 .07052 .958 -.1455 .2429
Confirmation Stage -.02960 .04971 .976 -.1665 .1073
Knowledge Stage 0.1784* .05147 .006 .0367 .3201
Persuasion Stage .01281 .05764 .999 -.1459 .1715
Decision Stage .07829 .07256 .817 -.1215 .2781
Implementation Stage .02960 .04971 .976 -.1073 .1665
IVPKM5 Knowledge Stage
Persuasion Stage
Decision Stage
Implementation
Stage
Confirmation Stage
Multiple Comparisons
Tukey HSD
Dependent Variable (I) PKM_Adoption (J) PKM_Adoption Mean
Difference (I-
J) Std. Error Sig.
95% Confidence Interval
* The mean difference is significant at the 0.05 level
Table 4. 8 : Pro Hoc Test of IVPKM5 and PKM_Adoption Source: Developed for this research (Data analysis from PASW (SPSS))
Table 4. 9 : Assessment of the difference between groups for OVPKM by ANOVA Test
Source: Developed for this research (Data analysis from PASW (SPSS))
As illustrated in table 4.9, there were one or more groups differing in OVPKM1
(F=3.109, p=0.017) and OVPKM5 (F=3.313, p=0.012) as p < 0.05. The Post-hoc (Tukey
HSD) comparison is shown in table 4.10and table 4.11. The results show that the mean
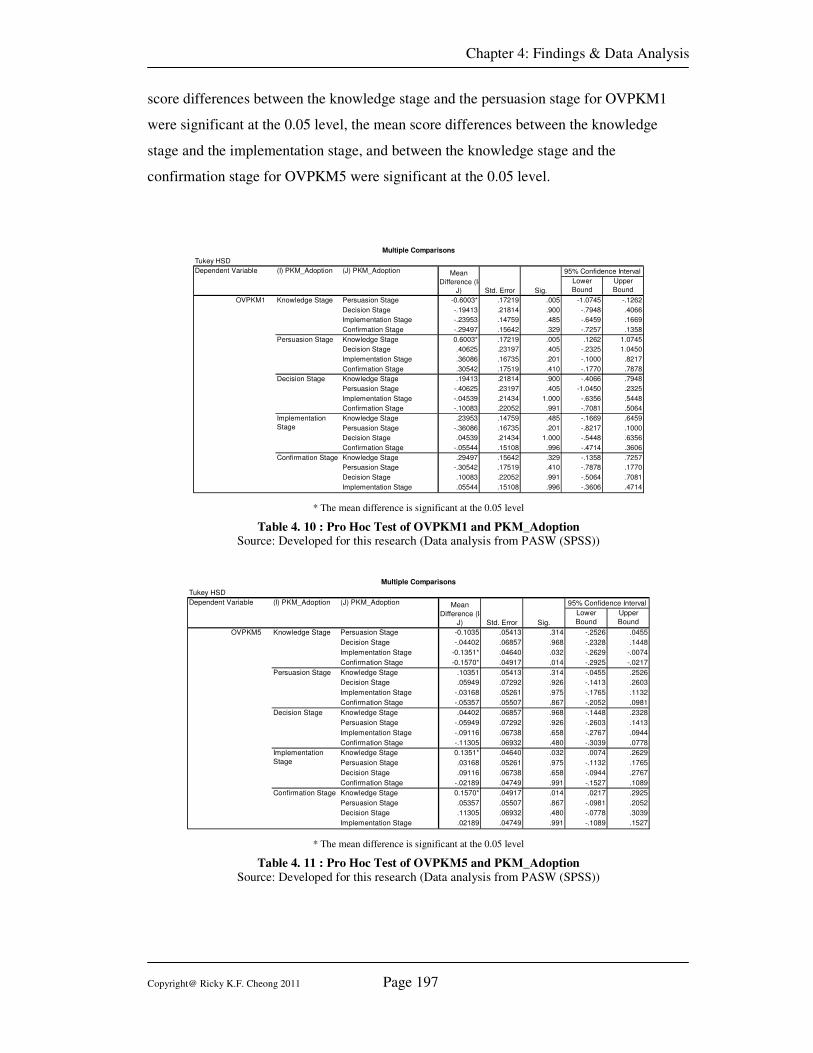
Chapter 4: Findings & Data Analysis
Copyright@ Ricky K.F. Cheong 2011 Page 197
score differences between the knowledge stage and the persuasion stage for OVPKM1
were significant at the 0.05 level, the mean score differences between the knowledge
stage and the implementation stage, and between the knowledge stage and the
confirmation stage for OVPKM5 were significant at the 0.05 level.
Lower
Bound
Upper
Bound
Persuasion Stage -0.6003* .17219 .005 -1.0745 -.1262
Decision Stage -.19413 .21814 .900 -.7948 .4066
Implementation Stage -.23953 .14759 .485 -.6459 .1669
Confirmation Stage -.29497 .15642 .329 -.7257 .1358
Knowledge Stage 0.6003* .17219 .005 .1262 1.0745
Decision Stage .40625 .23197 .405 -.2325 1.0450
Implementation Stage .36086 .16735 .201 -.1000 .8217
Confirmation Stage .30542 .17519 .410 -.1770 .7878
Knowledge Stage .19413 .21814 .900 -.4066 .7948
Persuasion Stage -.40625 .23197 .405 -1.0450 .2325
Implementation Stage -.04539 .21434 1.000 -.6356 .5448
Confirmation Stage -.10083 .22052 .991 -.7081 .5064
Knowledge Stage .23953 .14759 .485 -.1669 .6459
Persuasion Stage -.36086 .16735 .201 -.8217 .1000
Decision Stage .04539 .21434 1.000 -.5448 .6356
Confirmation Stage -.05544 .15108 .996 -.4714 .3606
Knowledge Stage .29497 .15642 .329 -.1358 .7257
Persuasion Stage -.30542 .17519 .410 -.7878 .1770
Decision Stage .10083 .22052 .991 -.5064 .7081
Implementation Stage .05544 .15108 .996 -.3606 .4714
OVPKM1 Knowledge Stage
Persuasion Stage
Decision Stage
Implementation
Stage
Confirmation Stage
Multiple Comparisons
Tukey HSD
Dependent Variable (I) PKM_Adoption (J) PKM_Adoption Mean
Difference (I-
J) Std. Error Sig.
95% Confidence Interval
* The mean difference is significant at the 0.05 level
Table 4. 10 : Pro Hoc Test of OVPKM1 and PKM_Adoption Source: Developed for this research (Data analysis from PASW (SPSS))
Lower
Bound
Upper
Bound
Persuasion Stage -0.1035 .05413 .314 -.2526 .0455
Decision Stage -.04402 .06857 .968 -.2328 .1448
Implementation Stage -0.1351* .04640 .032 -.2629 -.0074
Confirmation Stage -0.1570* .04917 .014 -.2925 -.0217
Knowledge Stage .10351 .05413 .314 -.0455 .2526
Decision Stage .05949 .07292 .926 -.1413 .2603
Implementation Stage -.03168 .05261 .975 -.1765 .1132
Confirmation Stage -.05357 .05507 .867 -.2052 .0981
Knowledge Stage .04402 .06857 .968 -.1448 .2328
Persuasion Stage -.05949 .07292 .926 -.2603 .1413
Implementation Stage -.09116 .06738 .658 -.2767 .0944
Confirmation Stage -.11305 .06932 .480 -.3039 .0778
Knowledge Stage 0.1351* .04640 .032 .0074 .2629
Persuasion Stage .03168 .05261 .975 -.1132 .1765
Decision Stage .09116 .06738 .658 -.0944 .2767
Confirmation Stage -.02189 .04749 .991 -.1527 .1089
Knowledge Stage 0.1570* .04917 .014 .0217 .2925
Persuasion Stage .05357 .05507 .867 -.0981 .2052
Decision Stage .11305 .06932 .480 -.0778 .3039
Implementation Stage .02189 .04749 .991 -.1089 .1527
OVPKM5 Knowledge Stage
Persuasion Stage
Decision Stage
Implementation
Stage
Confirmation Stage
Multiple Comparisons
Tukey HSD
Dependent Variable (I) PKM_Adoption (J) PKM_Adoption Mean
Difference (I-
J) Std. Error Sig.
95% Confidence Interval
* The mean difference is significant at the 0.05 level
Table 4. 11 : Pro Hoc Test of OVPKM5 and PKM_Adoption
Source: Developed for this research (Data analysis from PASW (SPSS))
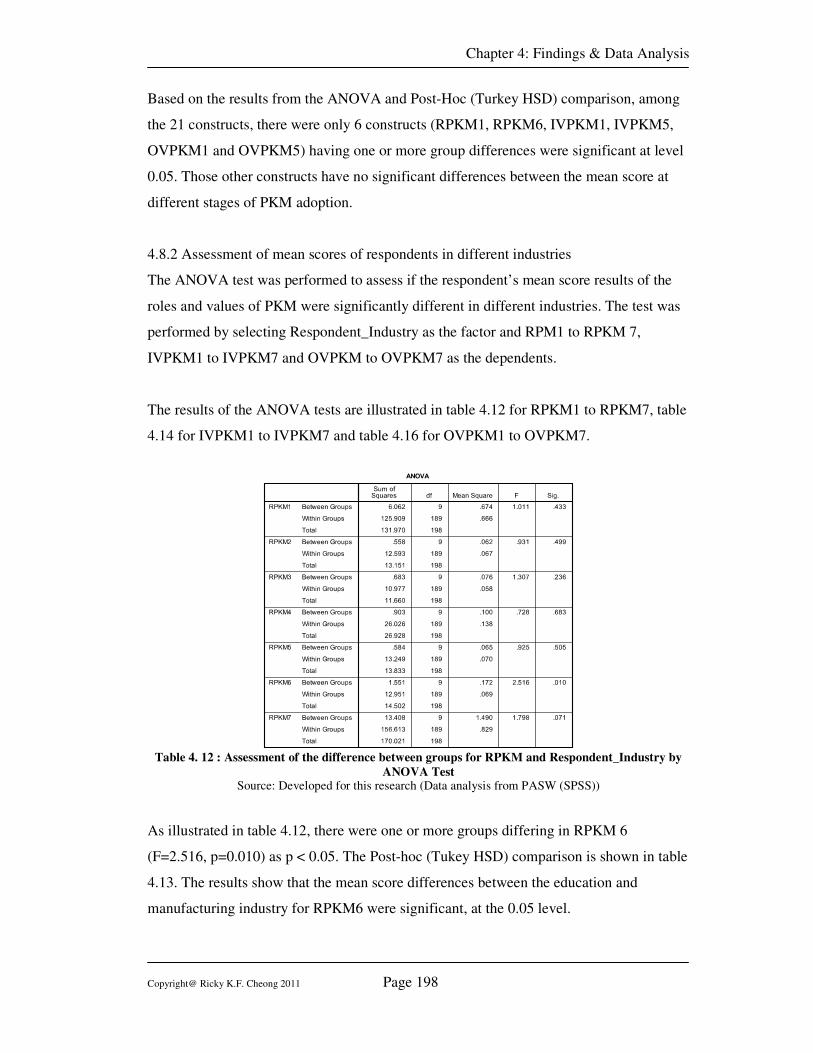
Chapter 4: Findings & Data Analysis
Copyright@ Ricky K.F. Cheong 2011 Page 198
Based on the results from the ANOVA and Post-Hoc (Turkey HSD) comparison, among
the 21 constructs, there were only 6 constructs (RPKM1, RPKM6, IVPKM1, IVPKM5,
OVPKM1 and OVPKM5) having one or more group differences were significant at level
0.05. Those other constructs have no significant differences between the mean score at
different stages of PKM adoption.
4.8.2 Assessment of mean scores of respondents in different industries
The ANOVA test was performed to assess if the respondent’s mean score results of the
roles and values of PKM were significantly different in different industries. The test was
performed by selecting Respondent_Industry as the factor and RPM1 to RPKM 7,
IVPKM1 to IVPKM7 and OVPKM to OVPKM7 as the dependents.
The results of the ANOVA tests are illustrated in table 4.12 for RPKM1 to RPKM7, table
4.14 for IVPKM1 to IVPKM7 and table 4.16 for OVPKM1 to OVPKM7.
Table 4. 12 : Assessment of the difference between groups for RPKM and Respondent_Industry by
ANOVA Test Source: Developed for this research (Data analysis from PASW (SPSS))
As illustrated in table 4.12, there were one or more groups differing in RPKM 6
(F=2.516, p=0.010) as p < 0.05. The Post-hoc (Tukey HSD) comparison is shown in table
4.13. The results show that the mean score differences between the education and
manufacturing industry for RPKM6 were significant, at the 0.05 level.
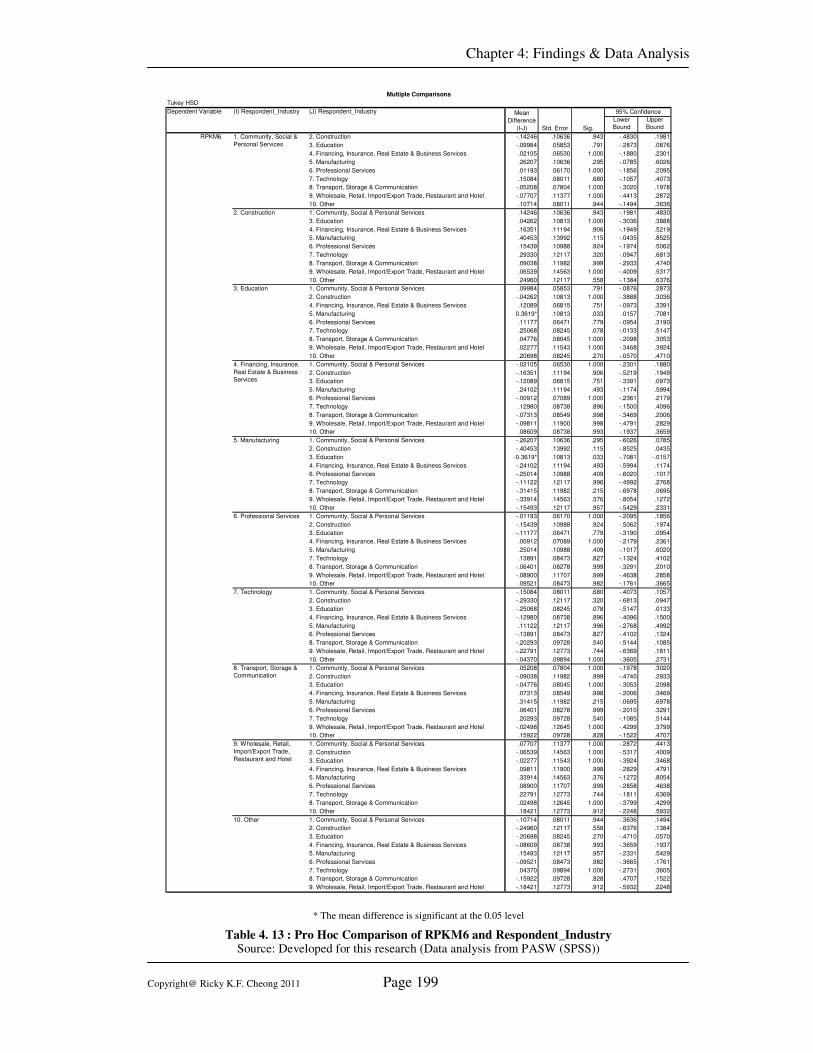
Chapter 4: Findings & Data Analysis
Copyright@ Ricky K.F. Cheong 2011 Page 199
Lower
Bound
Upper
Bound
2. Construction -.14246 .10636 .943 -.4830 .1981
3. Education -.09984 .05853 .791 -.2873 .0876
4. Financing, Insurance, Real Estate & Business Services .02105 .06530 1.000 -.1880 .2301
5. Manufacturing .26207 .10636 .295 -.0785 .6026
6. Professional Services .01193 .06170 1.000 -.1856 .2095
7. Technology .15084 .08011 .680 -.1057 .4073
8. Transport, Storage & Communication -.05208 .07804 1.000 -.3020 .1978
9. Wholesale, Retail, Import/Export Trade, Restaurant and Hotel -.07707 .11377 1.000 -.4413 .2872
10. Other .10714 .08011 .944 -.1494 .3636
1. Community, Social & Personal Services .14246 .10636 .943 -.1981 .4830
3. Education .04262 .10813 1.000 -.3036 .3888
4. Financing, Insurance, Real Estate & Business Services .16351 .11194 .906 -.1949 .5219
5. Manufacturing .40453 .13992 .115 -.0435 .8525
6. Professional Services .15439 .10988 .924 -.1974 .5062
7. Technology .29330 .12117 .320 -.0947 .6813
8. Transport, Storage & Communication .09038 .11982 .999 -.2933 .4740
9. Wholesale, Retail, Import/Export Trade, Restaurant and Hotel .06539 .14563 1.000 -.4009 .5317
10. Other .24960 .12117 .558 -.1384 .6376
1. Community, Social & Personal Services .09984 .05853 .791 -.0876 .2873
2. Construction -.04262 .10813 1.000 -.3888 .3036
4. Financing, Insurance, Real Estate & Business Services .12089 .06815 .751 -.0973 .3391
5. Manufacturing 0.3619* .10813 .033 .0157 .7081
6. Professional Services .11177 .06471 .779 -.0954 .3190
7. Technology .25068 .08245 .078 -.0133 .5147
8. Transport, Storage & Communication .04776 .08045 1.000 -.2098 .3053
9. Wholesale, Retail, Import/Export Trade, Restaurant and Hotel .02277 .11543 1.000 -.3468 .3924
10. Other .20698 .08245 .270 -.0570 .4710
1. Community, Social & Personal Services -.02105 .06530 1.000 -.2301 .1880
2. Construction -.16351 .11194 .906 -.5219 .1949
3. Education -.12089 .06815 .751 -.3391 .0973
5. Manufacturing .24102 .11194 .493 -.1174 .5994
6. Professional Services -.00912 .07089 1.000 -.2361 .2179
7. Technology .12980 .08738 .896 -.1500 .4096
8. Transport, Storage & Communication -.07313 .08549 .998 -.3469 .2006
9. Wholesale, Retail, Import/Export Trade, Restaurant and Hotel -.09811 .11900 .998 -.4791 .2829
10. Other .08609 .08738 .993 -.1937 .3659
1. Community, Social & Personal Services -.26207 .10636 .295 -.6026 .0785
2. Construction -.40453 .13992 .115 -.8525 .0435
3. Education -0.3619* .10813 .033 -.7081 -.0157
4. Financing, Insurance, Real Estate & Business Services -.24102 .11194 .493 -.5994 .1174
6. Professional Services -.25014 .10988 .409 -.6020 .1017
7. Technology -.11122 .12117 .996 -.4992 .2768
8. Transport, Storage & Communication -.31415 .11982 .215 -.6978 .0695
9. Wholesale, Retail, Import/Export Trade, Restaurant and Hotel -.33914 .14563 .376 -.8054 .1272
10. Other -.15493 .12117 .957 -.5429 .2331
1. Community, Social & Personal Services -.01193 .06170 1.000 -.2095 .1856
2. Construction -.15439 .10988 .924 -.5062 .1974
3. Education -.11177 .06471 .779 -.3190 .0954
4. Financing, Insurance, Real Estate & Business Services .00912 .07089 1.000 -.2179 .2361
5. Manufacturing .25014 .10988 .409 -.1017 .6020
7. Technology .13891 .08473 .827 -.1324 .4102
8. Transport, Storage & Communication -.06401 .08278 .999 -.3291 .2010
9. Wholesale, Retail, Import/Export Trade, Restaurant and Hotel -.08900 .11707 .999 -.4638 .2858
10. Other .09521 .08473 .982 -.1761 .3665
1. Community, Social & Personal Services -.15084 .08011 .680 -.4073 .1057
2. Construction -.29330 .12117 .320 -.6813 .0947
3. Education -.25068 .08245 .078 -.5147 .0133
4. Financing, Insurance, Real Estate & Business Services -.12980 .08738 .896 -.4096 .1500
5. Manufacturing .11122 .12117 .996 -.2768 .4992
6. Professional Services -.13891 .08473 .827 -.4102 .1324
8. Transport, Storage & Communication -.20293 .09728 .540 -.5144 .1085
9. Wholesale, Retail, Import/Export Trade, Restaurant and Hotel -.22791 .12773 .744 -.6369 .1811
10. Other -.04370 .09894 1.000 -.3605 .2731
1. Community, Social & Personal Services .05208 .07804 1.000 -.1978 .3020
2. Construction -.09038 .11982 .999 -.4740 .2933
3. Education -.04776 .08045 1.000 -.3053 .2098
4. Financing, Insurance, Real Estate & Business Services .07313 .08549 .998 -.2006 .3469
5. Manufacturing .31415 .11982 .215 -.0695 .6978
6. Professional Services .06401 .08278 .999 -.2010 .3291
7. Technology .20293 .09728 .540 -.1085 .5144
9. Wholesale, Retail, Import/Export Trade, Restaurant and Hotel -.02498 .12645 1.000 -.4299 .3799
10. Other .15922 .09728 .828 -.1522 .4707
1. Community, Social & Personal Services .07707 .11377 1.000 -.2872 .4413
2. Construction -.06539 .14563 1.000 -.5317 .4009
3. Education -.02277 .11543 1.000 -.3924 .3468
4. Financing, Insurance, Real Estate & Business Services .09811 .11900 .998 -.2829 .4791
5. Manufacturing .33914 .14563 .376 -.1272 .8054
6. Professional Services .08900 .11707 .999 -.2858 .4638
7. Technology .22791 .12773 .744 -.1811 .6369
8. Transport, Storage & Communication .02498 .12645 1.000 -.3799 .4299
10. Other .18421 .12773 .912 -.2248 .5932
1. Community, Social & Personal Services -.10714 .08011 .944 -.3636 .1494
2. Construction -.24960 .12117 .558 -.6376 .1384
3. Education -.20698 .08245 .270 -.4710 .0570
4. Financing, Insurance, Real Estate & Business Services -.08609 .08738 .993 -.3659 .1937
5. Manufacturing .15493 .12117 .957 -.2331 .5429
6. Professional Services -.09521 .08473 .982 -.3665 .1761
7. Technology .04370 .09894 1.000 -.2731 .3605
8. Transport, Storage & Communication -.15922 .09728 .828 -.4707 .1522
9. Wholesale, Retail, Import/Export Trade, Restaurant and Hotel -.18421 .12773 .912 -.5932 .2248
8. Transport, Storage &
Communication
9. Wholesale, Retail,
Import/Export Trade,
Restaurant and Hotel
10. Other
RPKM6 1. Community, Social &
Personal Services
2. Construction
3. Education
4. Financing, Insurance,
Real Estate & Business
Services
5. Manufacturing
6. Professional Services
7. Technology
Multiple Comparisons
Tukey HSD
Dependent Variable (I) Respondent_Industry (J) Respondent_Industry Mean
Difference
(I-J) Std. Error Sig.
95% Confidence
* The mean difference is significant at the 0.05 level
Table 4. 13 : Pro Hoc Comparison of RPKM6 and Respondent_Industry Source: Developed for this research (Data analysis from PASW (SPSS))
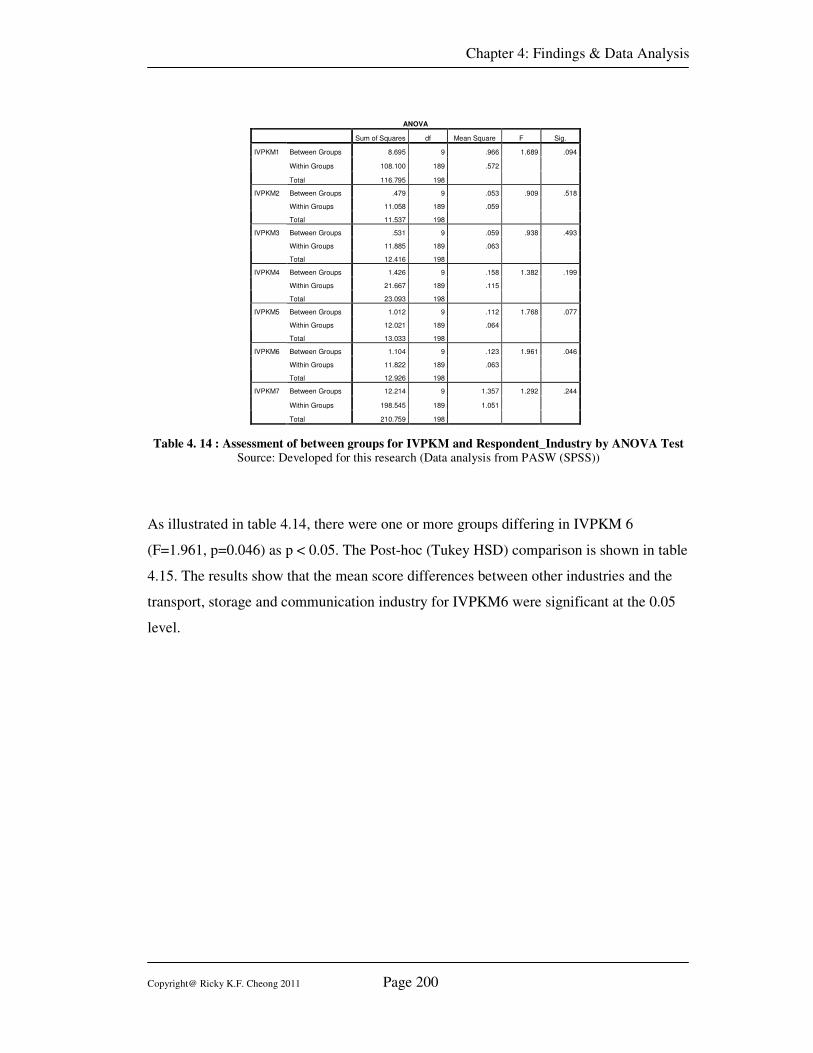
Chapter 4: Findings & Data Analysis
Copyright@ Ricky K.F. Cheong 2011 Page 200
ANOVA
Sum of Squares df Mean Square F Sig.
Between Groups 8.695 9 .966 1.689 .094
Within Groups 108.100 189 .572
IVPKM1
Total 116.795 198
Between Groups .479 9 .053 .909 .518
Within Groups 11.058 189 .059
IVPKM2
Total 11.537 198
Between Groups .531 9 .059 .938 .493
Within Groups 11.885 189 .063
IVPKM3
Total 12.416 198
Between Groups 1.426 9 .158 1.382 .199
Within Groups 21.667 189 .115
IVPKM4
Total 23.093 198
Between Groups 1.012 9 .112 1.768 .077
Within Groups 12.021 189 .064
IVPKM5
Total 13.033 198
Between Groups 1.104 9 .123 1.961 .046
Within Groups 11.822 189 .063
IVPKM6
Total 12.926 198
Between Groups 12.214 9 1.357 1.292 .244
Within Groups 198.545 189 1.051
IVPKM7
Total 210.759 198
Table 4. 14 : Assessment of between groups for IVPKM and Respondent_Industry by ANOVA Test
Source: Developed for this research (Data analysis from PASW (SPSS))
As illustrated in table 4.14, there were one or more groups differing in IVPKM 6
(F=1.961, p=0.046) as p < 0.05. The Post-hoc (Tukey HSD) comparison is shown in table
4.15. The results show that the mean score differences between other industries and the
transport, storage and communication industry for IVPKM6 were significant at the 0.05
level.
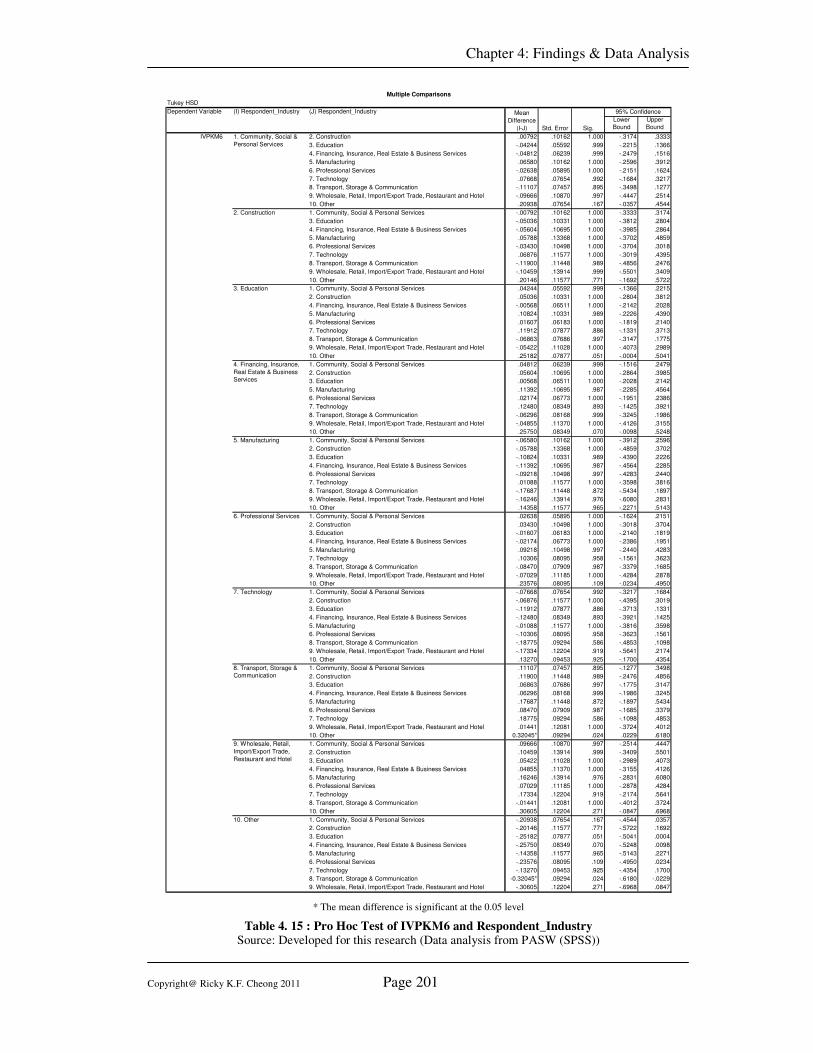
Chapter 4: Findings & Data Analysis
Copyright@ Ricky K.F. Cheong 2011 Page 201
Lower
Bound
Upper
Bound
2. Construction .00792 .10162 1.000 -.3174 .3333
3. Education -.04244 .05592 .999 -.2215 .1366
4. Financing, Insurance, Real Estate & Business Services -.04812 .06239 .999 -.2479 .1516
5. Manufacturing .06580 .10162 1.000 -.2596 .3912
6. Professional Services -.02638 .05895 1.000 -.2151 .1624
7. Technology .07668 .07654 .992 -.1684 .3217
8. Transport, Storage & Communication -.11107 .07457 .895 -.3498 .1277
9. Wholesale, Retail, Import/Export Trade, Restaurant and Hotel -.09666 .10870 .997 -.4447 .2514
10. Other .20938 .07654 .167 -.0357 .4544
1. Community, Social & Personal Services -.00792 .10162 1.000 -.3333 .3174
3. Education -.05036 .10331 1.000 -.3812 .2804
4. Financing, Insurance, Real Estate & Business Services -.05604 .10695 1.000 -.3985 .2864
5. Manufacturing .05788 .13368 1.000 -.3702 .4859
6. Professional Services -.03430 .10498 1.000 -.3704 .3018
7. Technology .06876 .11577 1.000 -.3019 .4395
8. Transport, Storage & Communication -.11900 .11448 .989 -.4856 .2476
9. Wholesale, Retail, Import/Export Trade, Restaurant and Hotel -.10459 .13914 .999 -.5501 .3409
10. Other .20146 .11577 .771 -.1692 .5722
1. Community, Social & Personal Services .04244 .05592 .999 -.1366 .2215
2. Construction .05036 .10331 1.000 -.2804 .3812
4. Financing, Insurance, Real Estate & Business Services -.00568 .06511 1.000 -.2142 .2028
5. Manufacturing .10824 .10331 .989 -.2226 .4390
6. Professional Services .01607 .06183 1.000 -.1819 .2140
7. Technology .11912 .07877 .886 -.1331 .3713
8. Transport, Storage & Communication -.06863 .07686 .997 -.3147 .1775
9. Wholesale, Retail, Import/Export Trade, Restaurant and Hotel -.05422 .11028 1.000 -.4073 .2989
10. Other .25182 .07877 .051 -.0004 .5041
1. Community, Social & Personal Services .04812 .06239 .999 -.1516 .2479
2. Construction .05604 .10695 1.000 -.2864 .3985
3. Education .00568 .06511 1.000 -.2028 .2142
5. Manufacturing .11392 .10695 .987 -.2285 .4564
6. Professional Services .02174 .06773 1.000 -.1951 .2386
7. Technology .12480 .08349 .893 -.1425 .3921
8. Transport, Storage & Communication -.06296 .08168 .999 -.3245 .1986
9. Wholesale, Retail, Import/Export Trade, Restaurant and Hotel -.04855 .11370 1.000 -.4126 .3155
10. Other .25750 .08349 .070 -.0098 .5248
1. Community, Social & Personal Services -.06580 .10162 1.000 -.3912 .2596
2. Construction -.05788 .13368 1.000 -.4859 .3702
3. Education -.10824 .10331 .989 -.4390 .2226
4. Financing, Insurance, Real Estate & Business Services -.11392 .10695 .987 -.4564 .2285
6. Professional Services -.09218 .10498 .997 -.4283 .2440
7. Technology .01088 .11577 1.000 -.3598 .3816
8. Transport, Storage & Communication -.17687 .11448 .872 -.5434 .1897
9. Wholesale, Retail, Import/Export Trade, Restaurant and Hotel -.16246 .13914 .976 -.6080 .2831
10. Other .14358 .11577 .965 -.2271 .5143
1. Community, Social & Personal Services .02638 .05895 1.000 -.1624 .2151
2. Construction .03430 .10498 1.000 -.3018 .3704
3. Education -.01607 .06183 1.000 -.2140 .1819
4. Financing, Insurance, Real Estate & Business Services -.02174 .06773 1.000 -.2386 .1951
5. Manufacturing .09218 .10498 .997 -.2440 .4283
7. Technology .10306 .08095 .958 -.1561 .3623
8. Transport, Storage & Communication -.08470 .07909 .987 -.3379 .1685
9. Wholesale, Retail, Import/Export Trade, Restaurant and Hotel -.07029 .11185 1.000 -.4284 .2878
10. Other .23576 .08095 .109 -.0234 .4950
1. Community, Social & Personal Services -.07668 .07654 .992 -.3217 .1684
2. Construction -.06876 .11577 1.000 -.4395 .3019
3. Education -.11912 .07877 .886 -.3713 .1331
4. Financing, Insurance, Real Estate & Business Services -.12480 .08349 .893 -.3921 .1425
5. Manufacturing -.01088 .11577 1.000 -.3816 .3598
6. Professional Services -.10306 .08095 .958 -.3623 .1561
8. Transport, Storage & Communication -.18775 .09294 .586 -.4853 .1098
9. Wholesale, Retail, Import/Export Trade, Restaurant and Hotel -.17334 .12204 .919 -.5641 .2174
10. Other .13270 .09453 .925 -.1700 .4354
1. Community, Social & Personal Services .11107 .07457 .895 -.1277 .3498
2. Construction .11900 .11448 .989 -.2476 .4856
3. Education .06863 .07686 .997 -.1775 .3147
4. Financing, Insurance, Real Estate & Business Services .06296 .08168 .999 -.1986 .3245
5. Manufacturing .17687 .11448 .872 -.1897 .5434
6. Professional Services .08470 .07909 .987 -.1685 .3379
7. Technology .18775 .09294 .586 -.1098 .4853
9. Wholesale, Retail, Import/Export Trade, Restaurant and Hotel .01441 .12081 1.000 -.3724 .4012
10. Other 0.32045* .09294 .024 .0229 .6180
1. Community, Social & Personal Services .09666 .10870 .997 -.2514 .4447
2. Construction .10459 .13914 .999 -.3409 .5501
3. Education .05422 .11028 1.000 -.2989 .4073
4. Financing, Insurance, Real Estate & Business Services .04855 .11370 1.000 -.3155 .4126
5. Manufacturing .16246 .13914 .976 -.2831 .6080
6. Professional Services .07029 .11185 1.000 -.2878 .4284
7. Technology .17334 .12204 .919 -.2174 .5641
8. Transport, Storage & Communication -.01441 .12081 1.000 -.4012 .3724
10. Other .30605 .12204 .271 -.0847 .6968
1. Community, Social & Personal Services -.20938 .07654 .167 -.4544 .0357
2. Construction -.20146 .11577 .771 -.5722 .1692
3. Education -.25182 .07877 .051 -.5041 .0004
4. Financing, Insurance, Real Estate & Business Services -.25750 .08349 .070 -.5248 .0098
5. Manufacturing -.14358 .11577 .965 -.5143 .2271
6. Professional Services -.23576 .08095 .109 -.4950 .0234
7. Technology -.13270 .09453 .925 -.4354 .1700
8. Transport, Storage & Communication -0.32045* .09294 .024 -.6180 -.0229
9. Wholesale, Retail, Import/Export Trade, Restaurant and Hotel -.30605 .12204 .271 -.6968 .0847
Multiple Comparisons
Tukey HSD
Dependent Variable (I) Respondent_Industry (J) Respondent_Industry Mean
Difference
(I-J) Std. Error Sig.
95% Confidence
8. Transport, Storage &
Communication
9. Wholesale, Retail,
Import/Export Trade,
Restaurant and Hotel
IVPKM6 1. Community, Social &
Personal Services
2. Construction
3. Education
4. Financing, Insurance,
Real Estate & Business
Services
5. Manufacturing
6. Professional Services
7. Technology
10. Other
* The mean difference is significant at the 0.05 level
Table 4. 15 : Pro Hoc Test of IVPKM6 and Respondent_Industry
Source: Developed for this research (Data analysis from PASW (SPSS))
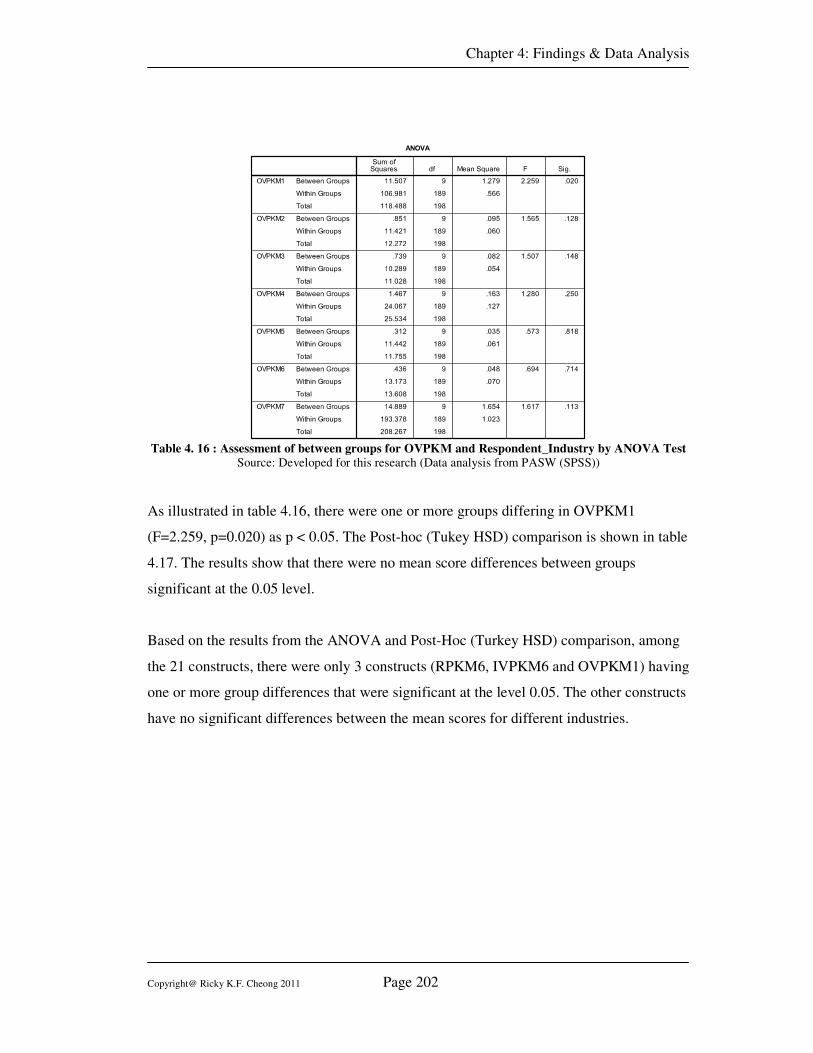
Chapter 4: Findings & Data Analysis
Copyright@ Ricky K.F. Cheong 2011 Page 202
Table 4. 16 : Assessment of between groups for OVPKM and Respondent_Industry by ANOVA Test
Source: Developed for this research (Data analysis from PASW (SPSS))
As illustrated in table 4.16, there were one or more groups differing in OVPKM1
(F=2.259, p=0.020) as p < 0.05. The Post-hoc (Tukey HSD) comparison is shown in table
4.17. The results show that there were no mean score differences between groups
significant at the 0.05 level.
Based on the results from the ANOVA and Post-Hoc (Turkey HSD) comparison, among
the 21 constructs, there were only 3 constructs (RPKM6, IVPKM6 and OVPKM1) having
one or more group differences that were significant at the level 0.05. The other constructs
have no significant differences between the mean scores for different industries.
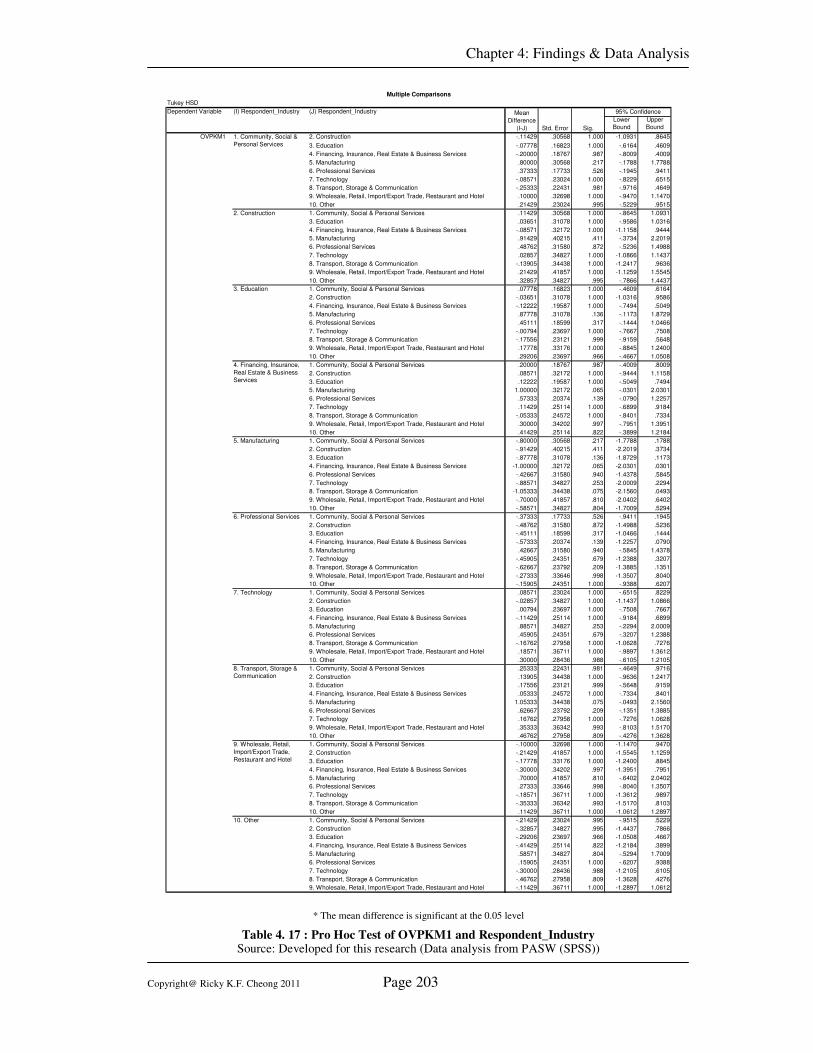
Chapter 4: Findings & Data Analysis
Copyright@ Ricky K.F. Cheong 2011 Page 203
Lower
Bound
Upper
Bound
2. Construction -.11429 .30568 1.000 -1.0931 .8645
3. Education -.07778 .16823 1.000 -.6164 .4609
4. Financing, Insurance, Real Estate & Business Services -.20000 .18767 .987 -.8009 .4009
5. Manufacturing .80000 .30568 .217 -.1788 1.7788
6. Professional Services .37333 .17733 .526 -.1945 .9411
7. Technology -.08571 .23024 1.000 -.8229 .6515
8. Transport, Storage & Communication -.25333 .22431 .981 -.9716 .4649
9. Wholesale, Retail, Import/Export Trade, Restaurant and Hotel .10000 .32698 1.000 -.9470 1.1470
10. Other .21429 .23024 .995 -.5229 .9515
1. Community, Social & Personal Services .11429 .30568 1.000 -.8645 1.0931
3. Education .03651 .31078 1.000 -.9586 1.0316
4. Financing, Insurance, Real Estate & Business Services -.08571 .32172 1.000 -1.1158 .9444
5. Manufacturing .91429 .40215 .411 -.3734 2.2019
6. Professional Services .48762 .31580 .872 -.5236 1.4988
7. Technology .02857 .34827 1.000 -1.0866 1.1437
8. Transport, Storage & Communication -.13905 .34438 1.000 -1.2417 .9636
9. Wholesale, Retail, Import/Export Trade, Restaurant and Hotel .21429 .41857 1.000 -1.1259 1.5545
10. Other .32857 .34827 .995 -.7866 1.4437
1. Community, Social & Personal Services .07778 .16823 1.000 -.4609 .6164
2. Construction -.03651 .31078 1.000 -1.0316 .9586
4. Financing, Insurance, Real Estate & Business Services -.12222 .19587 1.000 -.7494 .5049
5. Manufacturing .87778 .31078 .136 -.1173 1.8729
6. Professional Services .45111 .18599 .317 -.1444 1.0466
7. Technology -.00794 .23697 1.000 -.7667 .7508
8. Transport, Storage & Communication -.17556 .23121 .999 -.9159 .5648
9. Wholesale, Retail, Import/Export Trade, Restaurant and Hotel .17778 .33176 1.000 -.8845 1.2400
10. Other .29206 .23697 .966 -.4667 1.0508
1. Community, Social & Personal Services .20000 .18767 .987 -.4009 .8009
2. Construction .08571 .32172 1.000 -.9444 1.1158
3. Education .12222 .19587 1.000 -.5049 .7494
5. Manufacturing 1.00000 .32172 .065 -.0301 2.0301
6. Professional Services .57333 .20374 .139 -.0790 1.2257
7. Technology .11429 .25114 1.000 -.6899 .9184
8. Transport, Storage & Communication -.05333 .24572 1.000 -.8401 .7334
9. Wholesale, Retail, Import/Export Trade, Restaurant and Hotel .30000 .34202 .997 -.7951 1.3951
10. Other .41429 .25114 .822 -.3899 1.2184
1. Community, Social & Personal Services -.80000 .30568 .217 -1.7788 .1788
2. Construction -.91429 .40215 .411 -2.2019 .3734
3. Education -.87778 .31078 .136 -1.8729 .1173
4. Financing, Insurance, Real Estate & Business Services -1.00000 .32172 .065 -2.0301 .0301
6. Professional Services -.42667 .31580 .940 -1.4378 .5845
7. Technology -.88571 .34827 .253 -2.0009 .2294
8. Transport, Storage & Communication -1.05333 .34438 .075 -2.1560 .0493
9. Wholesale, Retail, Import/Export Trade, Restaurant and Hotel -.70000 .41857 .810 -2.0402 .6402
10. Other -.58571 .34827 .804 -1.7009 .5294
1. Community, Social & Personal Services -.37333 .17733 .526 -.9411 .1945
2. Construction -.48762 .31580 .872 -1.4988 .5236
3. Education -.45111 .18599 .317 -1.0466 .1444
4. Financing, Insurance, Real Estate & Business Services -.57333 .20374 .139 -1.2257 .0790
5. Manufacturing .42667 .31580 .940 -.5845 1.4378
7. Technology -.45905 .24351 .679 -1.2388 .3207
8. Transport, Storage & Communication -.62667 .23792 .209 -1.3885 .1351
9. Wholesale, Retail, Import/Export Trade, Restaurant and Hotel -.27333 .33646 .998 -1.3507 .8040
10. Other -.15905 .24351 1.000 -.9388 .6207
1. Community, Social & Personal Services .08571 .23024 1.000 -.6515 .8229
2. Construction -.02857 .34827 1.000 -1.1437 1.0866
3. Education .00794 .23697 1.000 -.7508 .7667
4. Financing, Insurance, Real Estate & Business Services -.11429 .25114 1.000 -.9184 .6899
5. Manufacturing .88571 .34827 .253 -.2294 2.0009
6. Professional Services .45905 .24351 .679 -.3207 1.2388
8. Transport, Storage & Communication -.16762 .27958 1.000 -1.0628 .7276
9. Wholesale, Retail, Import/Export Trade, Restaurant and Hotel .18571 .36711 1.000 -.9897 1.3612
10. Other .30000 .28436 .988 -.6105 1.2105
1. Community, Social & Personal Services .25333 .22431 .981 -.4649 .9716
2. Construction .13905 .34438 1.000 -.9636 1.2417
3. Education .17556 .23121 .999 -.5648 .9159
4. Financing, Insurance, Real Estate & Business Services .05333 .24572 1.000 -.7334 .8401
5. Manufacturing 1.05333 .34438 .075 -.0493 2.1560
6. Professional Services .62667 .23792 .209 -.1351 1.3885
7. Technology .16762 .27958 1.000 -.7276 1.0628
9. Wholesale, Retail, Import/Export Trade, Restaurant and Hotel .35333 .36342 .993 -.8103 1.5170
10. Other .46762 .27958 .809 -.4276 1.3628
1. Community, Social & Personal Services -.10000 .32698 1.000 -1.1470 .9470
2. Construction -.21429 .41857 1.000 -1.5545 1.1259
3. Education -.17778 .33176 1.000 -1.2400 .8845
4. Financing, Insurance, Real Estate & Business Services -.30000 .34202 .997 -1.3951 .7951
5. Manufacturing .70000 .41857 .810 -.6402 2.0402
6. Professional Services .27333 .33646 .998 -.8040 1.3507
7. Technology -.18571 .36711 1.000 -1.3612 .9897
8. Transport, Storage & Communication -.35333 .36342 .993 -1.5170 .8103
10. Other .11429 .36711 1.000 -1.0612 1.2897
1. Community, Social & Personal Services -.21429 .23024 .995 -.9515 .5229
2. Construction -.32857 .34827 .995 -1.4437 .7866
3. Education -.29206 .23697 .966 -1.0508 .4667
4. Financing, Insurance, Real Estate & Business Services -.41429 .25114 .822 -1.2184 .3899
5. Manufacturing .58571 .34827 .804 -.5294 1.7009
6. Professional Services .15905 .24351 1.000 -.6207 .9388
7. Technology -.30000 .28436 .988 -1.2105 .6105
8. Transport, Storage & Communication -.46762 .27958 .809 -1.3628 .4276
9. Wholesale, Retail, Import/Export Trade, Restaurant and Hotel -.11429 .36711 1.000 -1.2897 1.0612
Multiple Comparisons
Tukey HSD
Dependent Variable (I) Respondent_Industry (J) Respondent_Industry Mean
Difference
(I-J) Std. Error Sig.
95% Confidence
OVPKM1 1. Community, Social &
Personal Services
2. Construction
3. Education
4. Financing, Insurance,
Real Estate & Business
Services
5. Manufacturing
6. Professional Services
7. Technology
8. Transport, Storage &
Communication
9. Wholesale, Retail,
Import/Export Trade,
Restaurant and Hotel
10. Other
* The mean difference is significant at the 0.05 level
Table 4. 17 : Pro Hoc Test of OVPKM1 and Respondent_Industry Source: Developed for this research (Data analysis from PASW (SPSS))
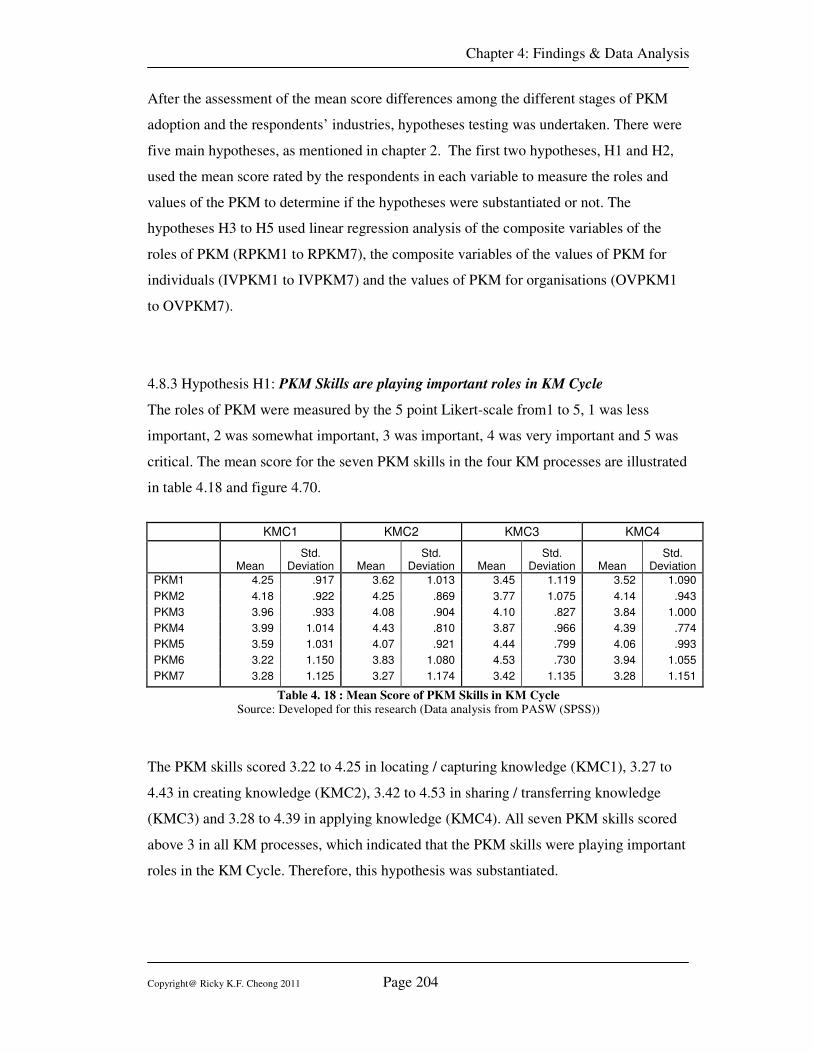
Chapter 4: Findings & Data Analysis
Copyright@ Ricky K.F. Cheong 2011 Page 204
After the assessment of the mean score differences among the different stages of PKM
adoption and the respondents’ industries, hypotheses testing was undertaken. There were
five main hypotheses, as mentioned in chapter 2. The first two hypotheses, H1 and H2,
used the mean score rated by the respondents in each variable to measure the roles and
values of the PKM to determine if the hypotheses were substantiated or not. The
hypotheses H3 to H5 used linear regression analysis of the composite variables of the
roles of PKM (RPKM1 to RPKM7), the composite variables of the values of PKM for
individuals (IVPKM1 to IVPKM7) and the values of PKM for organisations (OVPKM1
to OVPKM7).
4.8.3 Hypothesis H1: PKM Skills are playing important roles in KM Cycle
The roles of PKM were measured by the 5 point Likert-scale from1 to 5, 1 was less
important, 2 was somewhat important, 3 was important, 4 was very important and 5 was
critical. The mean score for the seven PKM skills in the four KM processes are illustrated
in table 4.18 and figure 4.70.
KMC1 KMC2 KMC3 KMC4
Mean
Std. Deviation Mean
Std. Deviation Mean
Std. Deviation Mean
Std. Deviation
PKM1 4.25 .917 3.62 1.013 3.45 1.119 3.52 1.090
PKM2 4.18 .922 4.25 .869 3.77 1.075 4.14 .943
PKM3 3.96 .933 4.08 .904 4.10 .827 3.84 1.000
PKM4 3.99 1.014 4.43 .810 3.87 .966 4.39 .774
PKM5 3.59 1.031 4.07 .921 4.44 .799 4.06 .993
PKM6 3.22 1.150 3.83 1.080 4.53 .730 3.94 1.055
PKM7 3.28 1.125 3.27 1.174 3.42 1.135 3.28 1.151
Table 4. 18 : Mean Score of PKM Skills in KM Cycle Source: Developed for this research (Data analysis from PASW (SPSS))
The PKM skills scored 3.22 to 4.25 in locating / capturing knowledge (KMC1), 3.27 to
4.43 in creating knowledge (KMC2), 3.42 to 4.53 in sharing / transferring knowledge
(KMC3) and 3.28 to 4.39 in applying knowledge (KMC4). All seven PKM skills scored
above 3 in all KM processes, which indicated that the PKM skills were playing important
roles in the KM Cycle. Therefore, this hypothesis was substantiated.
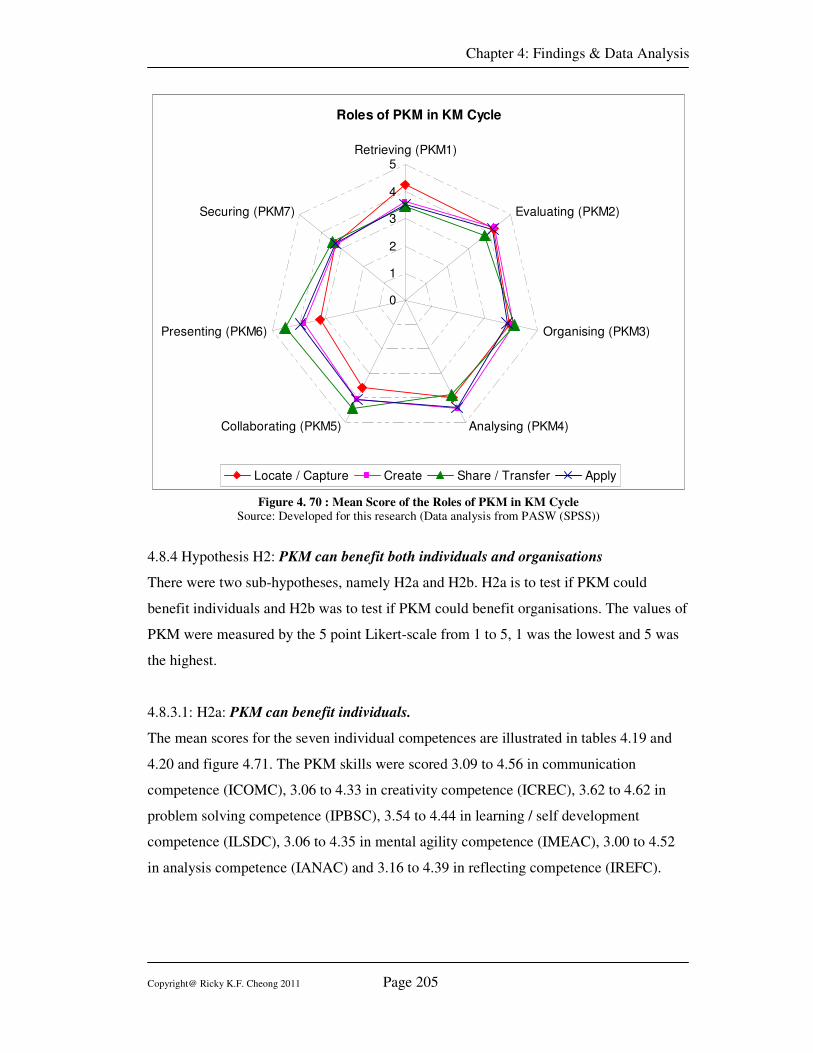
Chapter 4: Findings & Data Analysis
Copyright@ Ricky K.F. Cheong 2011 Page 205
Roles of PKM in KM Cycle
0
1
2
3
4
5Retrieving (PKM1)
Evaluating (PKM2)
Organising (PKM3)
Analysing (PKM4)Collaborating (PKM5)
Presenting (PKM6)
Securing (PKM7)
Locate / Capture Create Share / Transfer Apply
Figure 4. 70 : Mean Score of the Roles of PKM in KM Cycle Source: Developed for this research (Data analysis from PASW (SPSS))
4.8.4 Hypothesis H2: PKM can benefit both individuals and organisations
There were two sub-hypotheses, namely H2a and H2b. H2a is to test if PKM could
benefit individuals and H2b was to test if PKM could benefit organisations. The values of
PKM were measured by the 5 point Likert-scale from 1 to 5, 1 was the lowest and 5 was
the highest.
4.8.3.1: H2a: PKM can benefit individuals.
The mean scores for the seven individual competences are illustrated in tables 4.19 and
4.20 and figure 4.71. The PKM skills were scored 3.09 to 4.56 in communication
competence (ICOMC), 3.06 to 4.33 in creativity competence (ICREC), 3.62 to 4.62 in
problem solving competence (IPBSC), 3.54 to 4.44 in learning / self development
competence (ILSDC), 3.06 to 4.35 in mental agility competence (IMEAC), 3.00 to 4.52
in analysis competence (IANAC) and 3.16 to 4.39 in reflecting competence (IREFC).
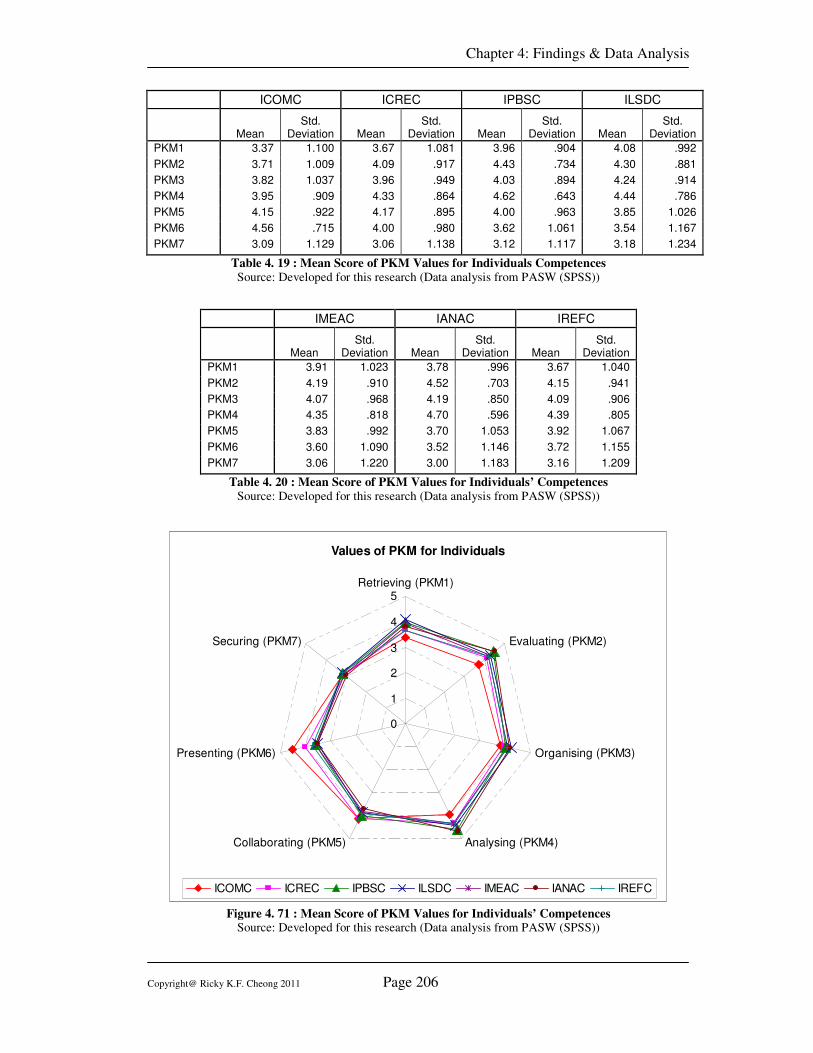
Chapter 4: Findings & Data Analysis
Copyright@ Ricky K.F. Cheong 2011 Page 206
ICOMC ICREC IPBSC ILSDC
Mean
Std. Deviation Mean
Std. Deviation Mean
Std. Deviation Mean
Std. Deviation
PKM1 3.37 1.100 3.67 1.081 3.96 .904 4.08 .992
PKM2 3.71 1.009 4.09 .917 4.43 .734 4.30 .881
PKM3 3.82 1.037 3.96 .949 4.03 .894 4.24 .914
PKM4 3.95 .909 4.33 .864 4.62 .643 4.44 .786
PKM5 4.15 .922 4.17 .895 4.00 .963 3.85 1.026
PKM6 4.56 .715 4.00 .980 3.62 1.061 3.54 1.167
PKM7 3.09 1.129 3.06 1.138 3.12 1.117 3.18 1.234
Table 4. 19 : Mean Score of PKM Values for Individuals Competences
Source: Developed for this research (Data analysis from PASW (SPSS))
IMEAC IANAC IREFC
Mean
Std. Deviation Mean
Std. Deviation Mean
Std. Deviation
PKM1 3.91 1.023 3.78 .996 3.67 1.040
PKM2 4.19 .910 4.52 .703 4.15 .941
PKM3 4.07 .968 4.19 .850 4.09 .906
PKM4 4.35 .818 4.70 .596 4.39 .805
PKM5 3.83 .992 3.70 1.053 3.92 1.067
PKM6 3.60 1.090 3.52 1.146 3.72 1.155
PKM7 3.06 1.220 3.00 1.183 3.16 1.209
Table 4. 20 : Mean Score of PKM Values for Individuals’ Competences
Source: Developed for this research (Data analysis from PASW (SPSS))
Values of PKM for Individuals
0
1
2
3
4
5Retrieving (PKM1)
Evaluating (PKM2)
Organising (PKM3)
Analysing (PKM4)Collaborating (PKM5)
Presenting (PKM6)
Securing (PKM7)
ICOMC ICREC IPBSC ILSDC IMEAC IANAC IREFC
Figure 4. 71 : Mean Score of PKM Values for Individuals’ Competences Source: Developed for this research (Data analysis from PASW (SPSS))
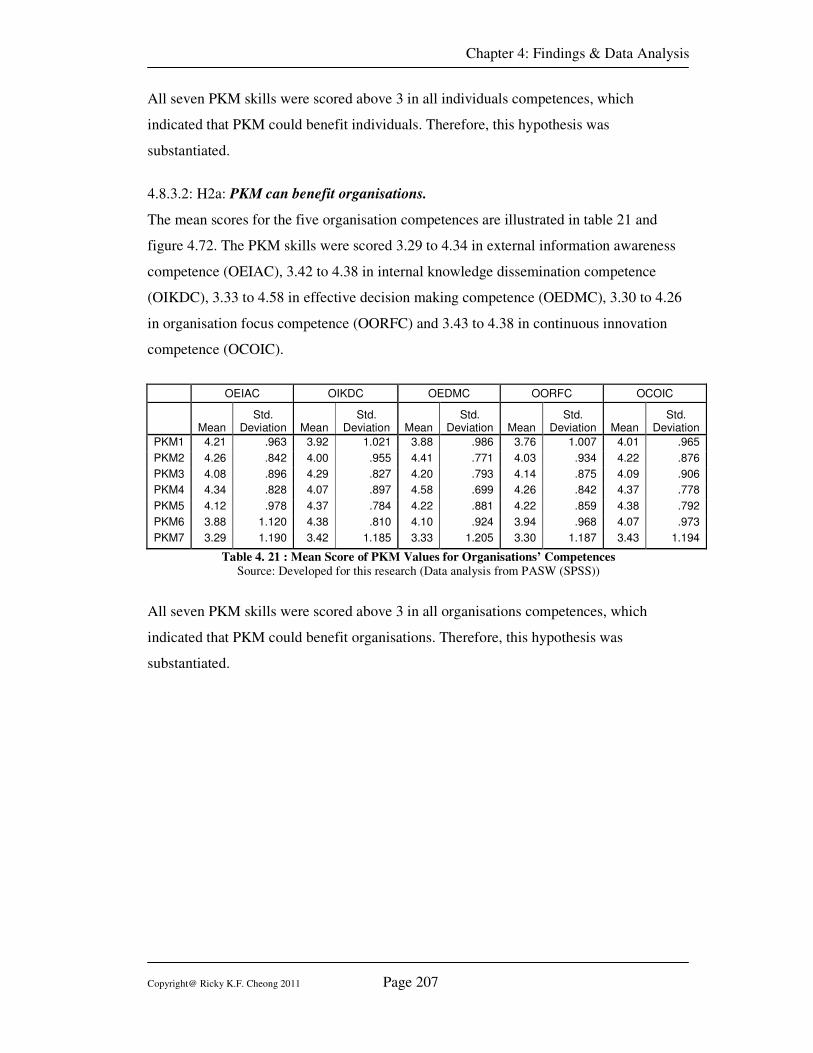
Chapter 4: Findings & Data Analysis
Copyright@ Ricky K.F. Cheong 2011 Page 207
All seven PKM skills were scored above 3 in all individuals competences, which
indicated that PKM could benefit individuals. Therefore, this hypothesis was
substantiated.
4.8.3.2: H2a: PKM can benefit organisations.
The mean scores for the five organisation competences are illustrated in table 21 and
figure 4.72. The PKM skills were scored 3.29 to 4.34 in external information awareness
competence (OEIAC), 3.42 to 4.38 in internal knowledge dissemination competence
(OIKDC), 3.33 to 4.58 in effective decision making competence (OEDMC), 3.30 to 4.26
in organisation focus competence (OORFC) and 3.43 to 4.38 in continuous innovation
competence (OCOIC).
OEIAC OIKDC OEDMC OORFC OCOIC
Mean
Std. Deviation Mean
Std. Deviation Mean
Std. Deviation Mean
Std. Deviation Mean
Std. Deviation
PKM1 4.21 .963 3.92 1.021 3.88 .986 3.76 1.007 4.01 .965
PKM2 4.26 .842 4.00 .955 4.41 .771 4.03 .934 4.22 .876
PKM3 4.08 .896 4.29 .827 4.20 .793 4.14 .875 4.09 .906
PKM4 4.34 .828 4.07 .897 4.58 .699 4.26 .842 4.37 .778
PKM5 4.12 .978 4.37 .784 4.22 .881 4.22 .859 4.38 .792
PKM6 3.88 1.120 4.38 .810 4.10 .924 3.94 .968 4.07 .973
PKM7 3.29 1.190 3.42 1.185 3.33 1.205 3.30 1.187 3.43 1.194
Table 4. 21 : Mean Score of PKM Values for Organisations’ Competences
Source: Developed for this research (Data analysis from PASW (SPSS))
All seven PKM skills were scored above 3 in all organisations competences, which
indicated that PKM could benefit organisations. Therefore, this hypothesis was
substantiated.
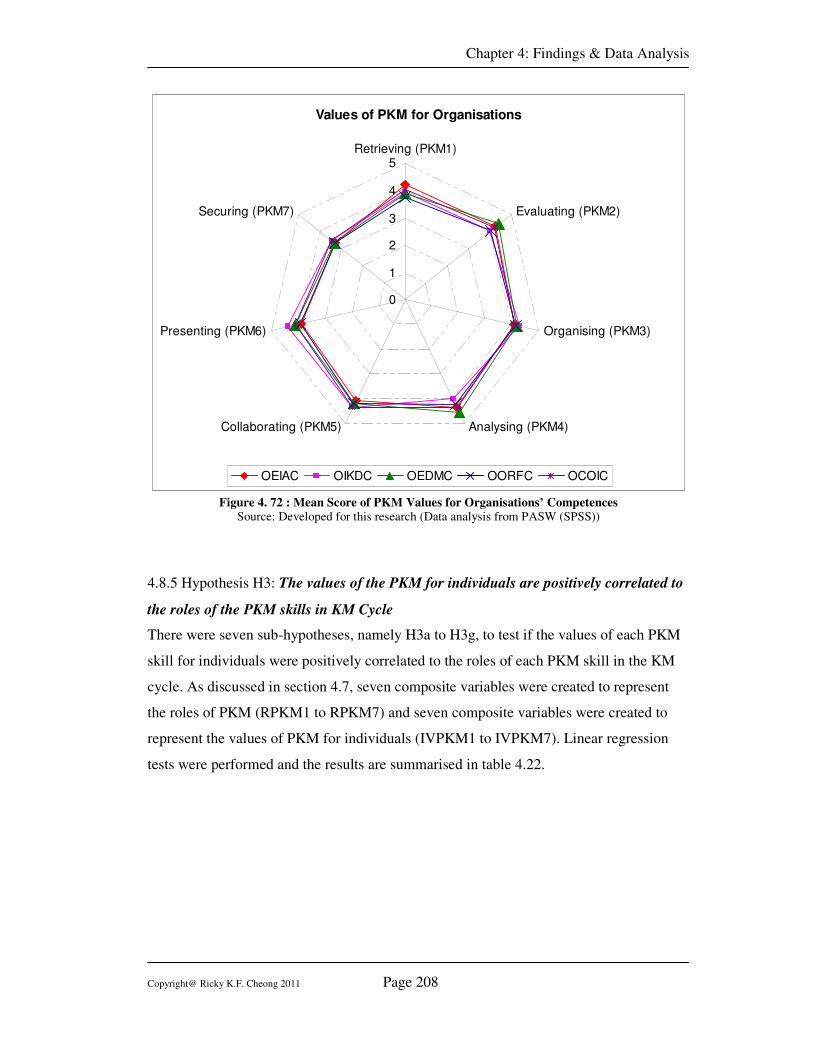
Chapter 4: Findings & Data Analysis
Copyright@ Ricky K.F. Cheong 2011 Page 208
Values of PKM for Organisations
0
1
2
3
4
5Retrieving (PKM1)
Evaluating (PKM2)
Organising (PKM3)
Analysing (PKM4)Collaborating (PKM5)
Presenting (PKM6)
Securing (PKM7)
OEIAC OIKDC OEDMC OORFC OCOIC
Figure 4. 72 : Mean Score of PKM Values for Organisations’ Competences
Source: Developed for this research (Data analysis from PASW (SPSS))
4.8.5 Hypothesis H3: The values of the PKM for individuals are positively correlated to
the roles of the PKM skills in KM Cycle
There were seven sub-hypotheses, namely H3a to H3g, to test if the values of each PKM
skill for individuals were positively correlated to the roles of each PKM skill in the KM
cycle. As discussed in section 4.7, seven composite variables were created to represent
the roles of PKM (RPKM1 to RPKM7) and seven composite variables were created to
represent the values of PKM for individuals (IVPKM1 to IVPKM7). Linear regression
tests were performed and the results are summarised in table 4.22.
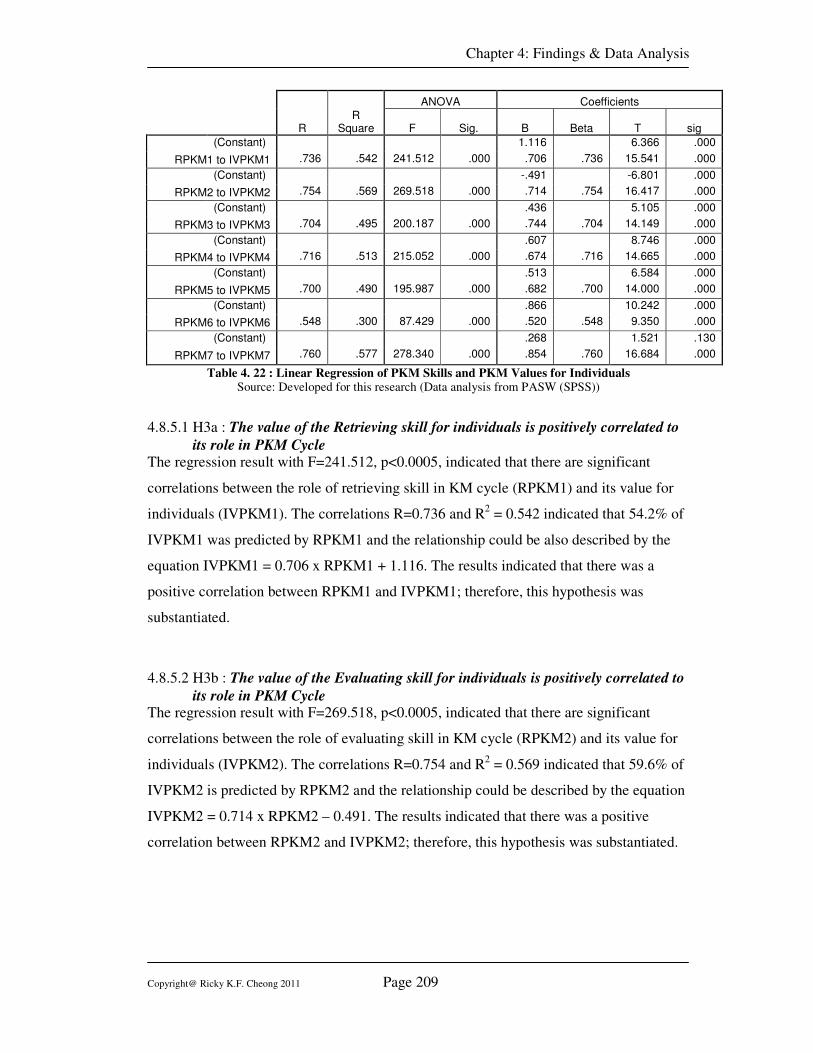
Chapter 4: Findings & Data Analysis
Copyright@ Ricky K.F. Cheong 2011 Page 209
ANOVA Coefficients
R
R Square F Sig. B Beta T sig
(Constant) 1.116 6.366 .000
RPKM1 to IVPKM1 .736 .542 241.512 .000 .706 .736 15.541 .000
(Constant) -.491 -6.801 .000
RPKM2 to IVPKM2 .754 .569 269.518 .000 .714 .754 16.417 .000
(Constant) .436 5.105 .000
RPKM3 to IVPKM3 .704 .495 200.187 .000 .744 .704 14.149 .000
(Constant) .607 8.746 .000
RPKM4 to IVPKM4 .716 .513 215.052 .000 .674 .716 14.665 .000
(Constant) .513 6.584 .000
RPKM5 to IVPKM5 .700 .490 195.987 .000 .682 .700 14.000 .000
(Constant) .866 10.242 .000
RPKM6 to IVPKM6 .548 .300 87.429 .000 .520 .548 9.350 .000
(Constant) .268 1.521 .130
RPKM7 to IVPKM7 .760 .577 278.340 .000 .854 .760 16.684 .000
Table 4. 22 : Linear Regression of PKM Skills and PKM Values for Individuals Source: Developed for this research (Data analysis from PASW (SPSS))
4.8.5.1 H3a : The value of the Retrieving skill for individuals is positively correlated to
its role in PKM Cycle The regression result with F=241.512, p<0.0005, indicated that there are significant
correlations between the role of retrieving skill in KM cycle (RPKM1) and its value for
individuals (IVPKM1). The correlations R=0.736 and R2 = 0.542 indicated that 54.2% of
IVPKM1 was predicted by RPKM1 and the relationship could be also described by the
equation IVPKM1 = 0.706 x RPKM1 + 1.116. The results indicated that there was a
positive correlation between RPKM1 and IVPKM1; therefore, this hypothesis was
substantiated.
4.8.5.2 H3b : The value of the Evaluating skill for individuals is positively correlated to
its role in PKM Cycle The regression result with F=269.518, p<0.0005, indicated that there are significant
correlations between the role of evaluating skill in KM cycle (RPKM2) and its value for
individuals (IVPKM2). The correlations R=0.754 and R2 = 0.569 indicated that 59.6% of
IVPKM2 is predicted by RPKM2 and the relationship could be described by the equation
IVPKM2 = 0.714 x RPKM2 – 0.491. The results indicated that there was a positive
correlation between RPKM2 and IVPKM2; therefore, this hypothesis was substantiated.
Chapter 4: Findings & Data Analysis
Copyright@ Ricky K.F. Cheong 2011 Page 210
4.8.5.3 H3c: The value of the Organising skill for individuals is positively correlated to
its role in PKM Cycle The regression result with F=200.187, p<0.0005 indicated, that there are significant
correlations between the role of organising skill in KM cycle (RPKM3) and its value for
individuals (IVPKM3). The correlations R=0.704 and R2 = 0.495 indicated that 49.5% of
IVPKM3 is predicted by RPKM3 and the relationship could be described by the equation
IVPKM3 = 0.744 x RPKM3 +0.436. The results indicated that there was a positive
correlation between RPKM3 and IVPKM3; therefore, this hypothesis was substantiated.
4.8.5.4 H3d: The value of the Analysing skill for individuals is positively correlated to
its role in PKM Cycle The regression result with F=215.052, p<0.0005, indicated that there are significant
correlations between the role of analysing skill in KM cycle (RPKM4) and its value for
individuals (IVPKM4). The correlations R=0.716 and R2 = 0.513 indicated that 51.3% of
IVPKM4 is predicted by RPKM4 and the relationship could be described by the equation
IVPKM4 = 0.674 x RPKM4 +0.607. The results indicated that there was a positive
correlation between RPKM4 and IVPKM4; therefore, this hypothesis was substantiated.
4.8.5.5 H3e : The value of the Collaborating skill for individuals is positively correlated
to its role in PKM Cycle The regression result with F=195.987, p<0.0005, indicated that there are significant
correlations between the role of collaborating skill in KM cycle (RPKM5) and its value
for individuals (IVPKM5). The correlations R=0.700 and R2 = 0.490 indicated that 49%
of IVPKM5 is predicted by RPKM5 and the relationship could be described by the
equation IVPKM5 = 0.682 x RPKM5 +0.513. The results indicated that there was a
positive correlation between RPKM5 and IVPKM5; therefore, this hypothesis was
substantiated.
4.8.5.6 H3f : The value of the Presenting skill for individuals is positively correlated to
its role in PKM Cycle The regression result with F=87.429, p<0.0005, indicated that there are significant
correlations between the role of presenting skill in KM cycle (RPKM6) and its value for
individuals (IVPKM6). The correlations R=0.548 and R2 = 0.300 indicated that 30% of
IVPKM6 is predicted by RPKM6 and the relationship could be described by the equation
IVPKM6 = 0.520 x RPKM6 +0.866. The results indicated that there was a positive
correlation between RPKM6 and IVPKM6; therefore, this hypothesis was substantiated.
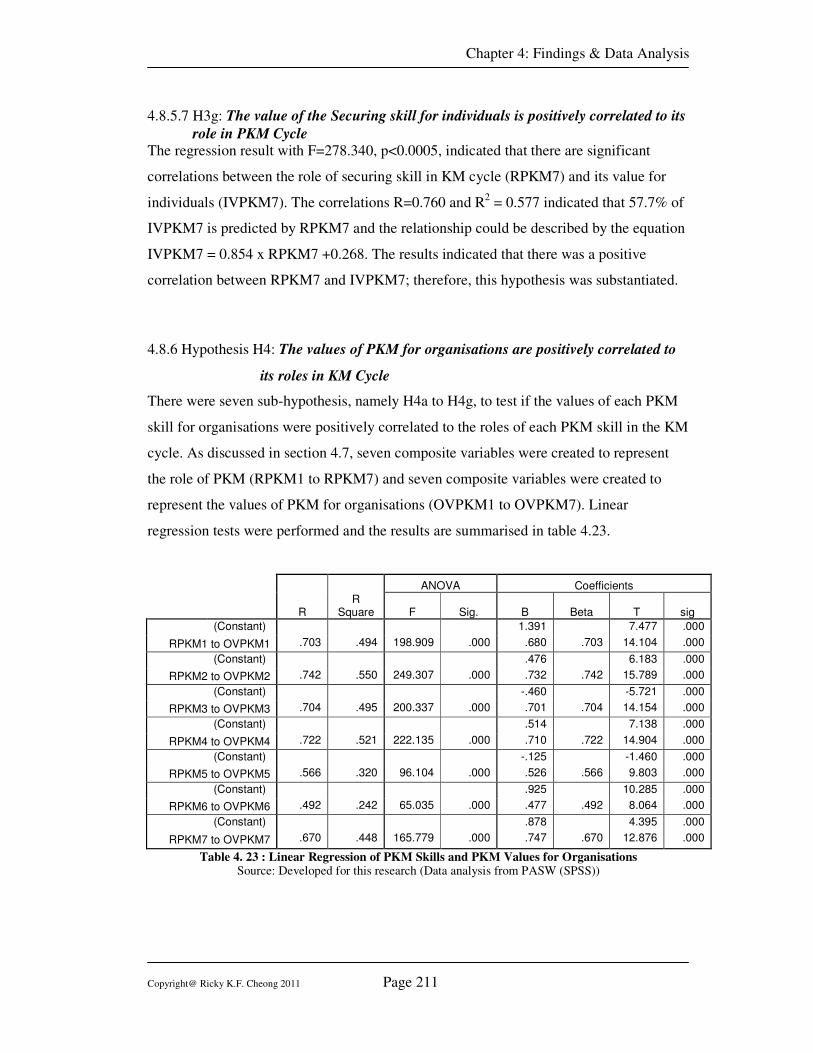
Chapter 4: Findings & Data Analysis
Copyright@ Ricky K.F. Cheong 2011 Page 211
4.8.5.7 H3g: The value of the Securing skill for individuals is positively correlated to its
role in PKM Cycle The regression result with F=278.340, p<0.0005, indicated that there are significant
correlations between the role of securing skill in KM cycle (RPKM7) and its value for
individuals (IVPKM7). The correlations R=0.760 and R2 = 0.577 indicated that 57.7% of
IVPKM7 is predicted by RPKM7 and the relationship could be described by the equation
IVPKM7 = 0.854 x RPKM7 +0.268. The results indicated that there was a positive
correlation between RPKM7 and IVPKM7; therefore, this hypothesis was substantiated.
4.8.6 Hypothesis H4: The values of PKM for organisations are positively correlated to
its roles in KM Cycle
There were seven sub-hypothesis, namely H4a to H4g, to test if the values of each PKM
skill for organisations were positively correlated to the roles of each PKM skill in the KM
cycle. As discussed in section 4.7, seven composite variables were created to represent
the role of PKM (RPKM1 to RPKM7) and seven composite variables were created to
represent the values of PKM for organisations (OVPKM1 to OVPKM7). Linear
regression tests were performed and the results are summarised in table 4.23.
ANOVA Coefficients
R
R Square F Sig. B Beta T sig
(Constant) 1.391 7.477 .000
RPKM1 to OVPKM1 .703 .494 198.909 .000 .680 .703 14.104 .000
(Constant) .476 6.183 .000
RPKM2 to OVPKM2 .742 .550 249.307 .000 .732 .742 15.789 .000
(Constant) -.460 -5.721 .000
RPKM3 to OVPKM3 .704 .495 200.337 .000 .701 .704 14.154 .000
(Constant) .514 7.138 .000
RPKM4 to OVPKM4 .722 .521 222.135 .000 .710 .722 14.904 .000
(Constant) -.125 -1.460 .000
RPKM5 to OVPKM5 .566 .320 96.104 .000 .526 .566 9.803 .000
(Constant) .925 10.285 .000
RPKM6 to OVPKM6 .492 .242 65.035 .000 .477 .492 8.064 .000
(Constant) .878 4.395 .000
RPKM7 to OVPKM7 .670 .448 165.779 .000 .747 .670 12.876 .000
Table 4. 23 : Linear Regression of PKM Skills and PKM Values for Organisations Source: Developed for this research (Data analysis from PASW (SPSS))
Chapter 4: Findings & Data Analysis
Copyright@ Ricky K.F. Cheong 2011 Page 212
4.8.6.1 H4a : The value of the Retrieving skill for organisations is positively correlated
to its role in PKM Cycle The regression result with F=198.909, p<0.0005, indicated that there are significant
correlations between the role of retrieving skill in KM cycle (RPKM1) and its value for
organisations (OVPKM1). The correlations R=0.703 and R2 = 0.494 indicated that 49.4%
of OVPKM1 is predicted by RPKM1 and the relationship could be also described by the
equation OVPKM1 = 0.680 x RPKM1 + 1.391. The results indicated that there was a
positive correlation between RPKM1 and OVPKM1; therefore, this hypothesis was
substantiated.
4.8.6.2 H4b : The value of the Evaluating skill for organisations is positively correlated
to its role in PKM Cycle The regression result with F=249.307, p<0.0005, indicated that there are significant
correlations between the role of evaluating skill in KM cycle (RPKM2) and its value for
organisations (OVPKM2). The correlations R=0.742 and R2 = 0.550 indicated that 55%
of OVPKM2 is predicted by RPKM2 and the relationship could be described by the
equation OVPKM2 = 0.732 x RPKM2 +0.476. The results indicated that there was a
positive correlation between RPKM2 and OVPKM2; therefore, this hypothesis was
substantiated.
4.8.6.3 H4c: The value of the Organising skill for organisations is positively correlated
to its role in PKM Cycle The regression result with F=200.337, p<0.0005, indicated that there are significant
correlations between the role of organising skill in KM cycle (RPKM3) and its value for
organisations (OVPKM3). The correlations R=0.704 and R2 = 0.495 indicated that 49.5%
of OVPKM3 is predicted by RPKM3 and the relationship could be described by the
equation OVPKM3 = 0.701 x RPKM3 -0.460. The results indicated that there was a
positive correlation between RPKM3 and OVPKM3; therefore, this hypothesis was
substantiated.
4.8.6.4 H4d: The value of the Analysing skill for organisations is positively correlated
to its role in PKM Cycle The regression result with F=222.135, p<0.0005, indicated that there are significant
correlations between the role of analysing skill in KM cycle (RPKM4) and its value for
organisations (OVPKM4). The correlations R=0.722 and R2 = 0.521 indicated that 52.1%
of OVPKM4 is predicted by RPKM4 and the relationship could be described by the
equation OVPKM4 = 0.710 x RPKM4 +0.514. The results indicated that there was a
Chapter 4: Findings & Data Analysis
Copyright@ Ricky K.F. Cheong 2011 Page 213
positive correlation between RPKM4 and OVPKM4; therefore, this hypothesis was
substantiated.
4.8.6.5 H4e : The value of the Collaborating skill for organisations is positively
correlated to its role in PKM Cycle The regression result with F=96.104, p<0.0005, indicated that there are significant
correlations between the role of collaborating skill in KM cycle (RPKM5) and its value
for organisations (OVPKM5). The correlations R=0.566 and R2 = 0.320 indicated that
32% of OVPKM5 is predicted by RPKM5 and the relationship could be described by the
equation OVPKM5 = 0.526 x RPKM5 -0.125. The results indicated that there was a
positive correlation between RPKM5 and OVPKM5; therefore, this hypothesis was
substantiated.
4.8.6.6 H4f : The value of the Presenting skill for organisations is positively correlated
to its role in PKM Cycle The regression result with F=65.035, p<0.0005, indicated that there are significant
correlations between the role of presenting skill in KM cycle (RPKM6) and its value for
organisations (OVPKM6). The correlations R=0.492 and R2 = 0.242 indicated that 24.2%
of OVPKM6 is predicted by RPKM6 and the relationship could be described by the
equation OVPKM6 = 0.477 x RPKM6 +0.925. The results indicated that there was a
positive correlation between RPKM6 and OVPKM6; therefore, this hypothesis was
substantiated.
4.8.6.7 H4g: The value of the Securing skill for organisations is positively correlated to
its role in PKM Cycle
The regression result with F=165.779, p<0.0005, indicated that there are significant
correlations between the role of securing skill in KM cycle (RPKM7) and its value for
organisations (OVPKM7). The correlations R=0.670 and R2 = 0.448 indicated that 44.8%
of OVPKM7 is predicted by RPKM7 and the relationship could be described by the
equation OVPKM7 = 0.747 x RPKM7 +0.878. The results indicated that there was a
positive correlation between RPKM7 and IVPKM7; therefore, this hypothesis was
substantiated.
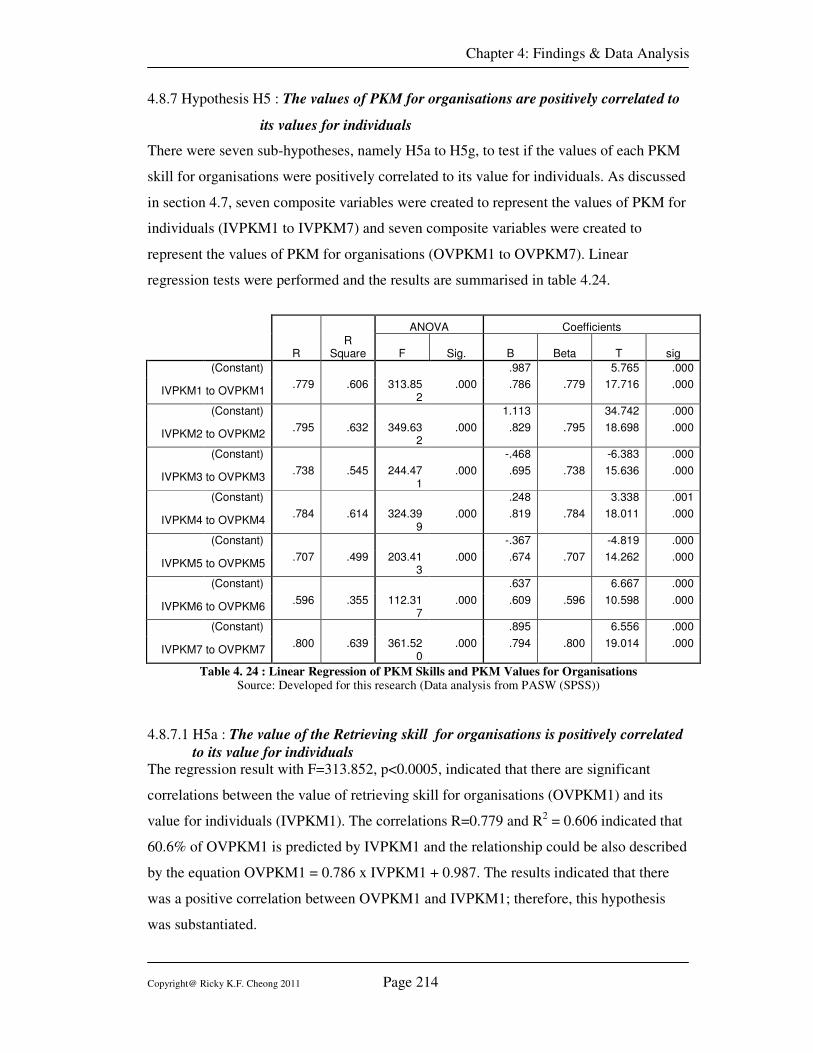
Chapter 4: Findings & Data Analysis
Copyright@ Ricky K.F. Cheong 2011 Page 214
4.8.7 Hypothesis H5 : The values of PKM for organisations are positively correlated to
its values for individuals
There were seven sub-hypotheses, namely H5a to H5g, to test if the values of each PKM
skill for organisations were positively correlated to its value for individuals. As discussed
in section 4.7, seven composite variables were created to represent the values of PKM for
individuals (IVPKM1 to IVPKM7) and seven composite variables were created to
represent the values of PKM for organisations (OVPKM1 to OVPKM7). Linear
regression tests were performed and the results are summarised in table 4.24.
ANOVA Coefficients
R R
Square F Sig. B Beta T sig
(Constant) .987 5.765 .000
IVPKM1 to OVPKM1 .779 .606 313.85
2 .000 .786 .779 17.716 .000
(Constant) 1.113 34.742 .000
IVPKM2 to OVPKM2 .795 .632 349.63
2 .000 .829 .795 18.698 .000
(Constant) -.468 -6.383 .000
IVPKM3 to OVPKM3 .738 .545 244.47
1 .000 .695 .738 15.636 .000
(Constant) .248 3.338 .001
IVPKM4 to OVPKM4 .784 .614 324.39
9 .000 .819 .784 18.011 .000
(Constant) -.367 -4.819 .000
IVPKM5 to OVPKM5 .707 .499 203.41
3 .000 .674 .707 14.262 .000
(Constant) .637 6.667 .000
IVPKM6 to OVPKM6 .596 .355 112.31
7 .000 .609 .596 10.598 .000
(Constant) .895 6.556 .000
IVPKM7 to OVPKM7 .800 .639 361.52
0 .000 .794 .800 19.014 .000
Table 4. 24 : Linear Regression of PKM Skills and PKM Values for Organisations Source: Developed for this research (Data analysis from PASW (SPSS))
4.8.7.1 H5a : The value of the Retrieving skill for organisations is positively correlated
to its value for individuals The regression result with F=313.852, p<0.0005, indicated that there are significant
correlations between the value of retrieving skill for organisations (OVPKM1) and its
value for individuals (IVPKM1). The correlations R=0.779 and R2 = 0.606 indicated that
60.6% of OVPKM1 is predicted by IVPKM1 and the relationship could be also described
by the equation OVPKM1 = 0.786 x IVPKM1 + 0.987. The results indicated that there
was a positive correlation between OVPKM1 and IVPKM1; therefore, this hypothesis
was substantiated.
Chapter 4: Findings & Data Analysis
Copyright@ Ricky K.F. Cheong 2011 Page 215
4.8.7.2 H5b : The value of the Evaluating skill for organisations is positively correlated
to its value for individuals The regression result with F=349.632, p<0.0005, indicated that there are significant
correlations between the value of evaluating skill for organisations (OVPKM2) and its
value for individuals (IVPKM2). The correlations R=0.795 and R2 = 0.632 indicated that
63.2% of OVPKM2 is predicted by IVPKM2 and the relationship could be also described
by the equation OVPKM2 = 0.829 x IVPKM2 + 1.113. The results indicated that there
was a positive correlation between OVPKM2 and IVPKM2; therefore, this hypothesis
was substantiated.
4.8.7.3 H5c : The value of the Organising skill for organisations is positively correlated
to its value for individuals The regression result with F=244.471, p<0.0005, indicated that there are significant
correlations between the value of organising skill for organisations (OVPKM3) and its
value for individuals (IVPKM3). The correlations R=0.738 and R2 = 0.545 indicated that
54.5% of OVPKM3 is predicted by IVPKM3 and the relationship could be also described
by the equation OVPKM3 = 0.695 x IVPKM3 -0.468. The results indicated that there was
a positive correlation between OVPKM3 and IVPKM3; therefore, this hypothesis was
substantiated.
4.8.7.4 H5d : The value of the Analysing skill for organisations is positively correlated
to its value for individuals The regression result with F=324.399, p<0.0005, indicated that there are significant
correlations between the value of analysing skill for organisations (OVPKM4) and its
value for individuals (IVPKM4). The correlations R=0.784 and R2 = 0.614 indicated that
61.4% of OVPKM4 is predicted by IVPKM4 and the relationship could be also described
by the equation OVPKM4 = 0.819 x IVPKM4 -0.248. The results indicated that there was
a positive correlation between OVPKM4 and IVPKM4; therefore, this hypothesis was
substantiated.
4.8.7.5 H5e : The value of the Collaborating skill for organisations is positively
correlated to its value for individuals The regression result with F=203.413, p<0.0005, indicated that there are significant
correlations between the value of collaborating skill for organisations (OVPKM5) and its
value for individuals (IVPKM5). The correlations R=0.707 and R2 = 0.499 indicated that
Chapter 4: Findings & Data Analysis
Copyright@ Ricky K.F. Cheong 2011 Page 216
49.9% of OVPKM5 is predicted by IVPKM5 and the relationship could be also described
by the equation OVPKM5 = 0.674 x IVPKM5 -0.367. The results indicated that there was
a positive correlation between OVPKM5 and IVPKM5; therefore, this hypothesis was
substantiated.
4.8.7.6 H5f : The value of the Presenting skill for organisations is positively correlated
to its value for individuals The regression result with F=112.317, p<0.0005, indicated that there are significant
correlations between the value of presenting skill for organisations (OVPKM6) and its
value for individuals (IVPKM6). The correlations R=0.596 and R2 = 0.355 indicated that
35.5% of OVPKM6 is predicted by IVPKM6 and the relationship could be also described
by the equation OVPKM6 = 0.609 x IVPKM6 +0.637. The results indicated that there
was a positive correlation between OVPKM6 and IVPKM6; therefore, this hypothesis
was substantiated.
4.8.7.7 H5g: The value of the Securing skill for organisations is positively correlated to
its value for individuals The regression result with F=361.520, p<0.0005, indicated that there are significant
correlations between the value of securing skill for organisations (OVPKM7) and its
value for individuals (IVPKM7). The correlations R=0.800 and R2 = 0.639 indicated that
63.9% of OVPKM7 is predicted by IVPKM7 and the relationship could be also described
by the equation OVPKM7 = 0.794 x IVPKM7 +0.895. The results indicated that there
was a positive correlation between OVPKM7 and IVPKM7; therefore, this hypothesis
was substantiated.
4.8.8 Summary of Hypotheses Testings
The results of the hypotheses tests are summarised in table 4.25. In short, all tested
hypotheses were supported by the analyses. All seven PKM skills were found to play
important roles in the KM processes; PKM can provide benefits to improve the individual
and organisation competences; the values of PKM for individuals were positively
correlated to their roles in the KM processes; the values of PKM for organisations were
positively correlated to their roles in the KM processes and the values of PKM for
organisations were positively correlated to the values of PKM for individuals.
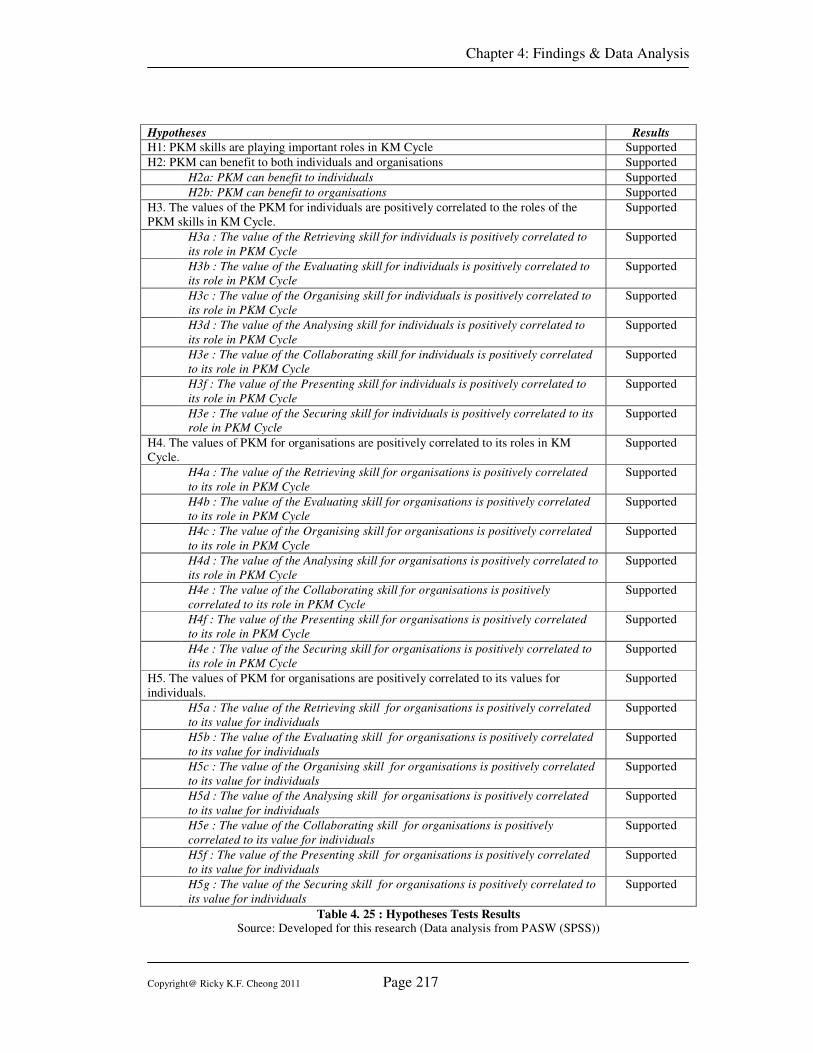
Chapter 4: Findings & Data Analysis
Copyright@ Ricky K.F. Cheong 2011 Page 217
Hypotheses Results
H1: PKM skills are playing important roles in KM Cycle Supported
H2: PKM can benefit to both individuals and organisations Supported
H2a: PKM can benefit to individuals Supported
H2b: PKM can benefit to organisations Supported
H3. The values of the PKM for individuals are positively correlated to the roles of the
PKM skills in KM Cycle.
Supported
H3a : The value of the Retrieving skill for individuals is positively correlated to
its role in PKM Cycle
Supported
H3b : The value of the Evaluating skill for individuals is positively correlated to
its role in PKM Cycle
Supported
H3c : The value of the Organising skill for individuals is positively correlated to
its role in PKM Cycle
Supported
H3d : The value of the Analysing skill for individuals is positively correlated to
its role in PKM Cycle
Supported
H3e : The value of the Collaborating skill for individuals is positively correlated
to its role in PKM Cycle
Supported
H3f : The value of the Presenting skill for individuals is positively correlated to
its role in PKM Cycle
Supported
H3e : The value of the Securing skill for individuals is positively correlated to its
role in PKM Cycle
Supported
H4. The values of PKM for organisations are positively correlated to its roles in KM
Cycle.
Supported
H4a : The value of the Retrieving skill for organisations is positively correlated
to its role in PKM Cycle
Supported
H4b : The value of the Evaluating skill for organisations is positively correlated
to its role in PKM Cycle
Supported
H4c : The value of the Organising skill for organisations is positively correlated
to its role in PKM Cycle
Supported
H4d : The value of the Analysing skill for organisations is positively correlated to
its role in PKM Cycle
Supported
H4e : The value of the Collaborating skill for organisations is positively
correlated to its role in PKM Cycle
Supported
H4f : The value of the Presenting skill for organisations is positively correlated
to its role in PKM Cycle
Supported
H4e : The value of the Securing skill for organisations is positively correlated to
its role in PKM Cycle
Supported
H5. The values of PKM for organisations are positively correlated to its values for
individuals.
Supported
H5a : The value of the Retrieving skill for organisations is positively correlated
to its value for individuals
Supported
H5b : The value of the Evaluating skill for organisations is positively correlated
to its value for individuals
Supported
H5c : The value of the Organising skill for organisations is positively correlated
to its value for individuals
Supported
H5d : The value of the Analysing skill for organisations is positively correlated
to its value for individuals
Supported
H5e : The value of the Collaborating skill for organisations is positively
correlated to its value for individuals
Supported
H5f : The value of the Presenting skill for organisations is positively correlated
to its value for individuals
Supported
H5g : The value of the Securing skill for organisations is positively correlated to
its value for individuals
Supported
Table 4. 25 : Hypotheses Tests Results Source: Developed for this research (Data analysis from PASW (SPSS))
Chapter 4: Findings & Data Analysis
Copyright@ Ricky K.F. Cheong 2011 Page 218
4.9 Confirmatory Data Analysis by Structured Equation Modelling (SEM)
The hypotheses testing in section 4.8 provides an exploratory data analysis of the roles
and values of PKM. The SEM analysis in this section is intended to provide an
alternative way, the confirmatory approach as recommended by Byrne (2010), for the
analysis of the structural theory about the roles and values of PKM. SEM permits the
measurement of several variables and their interrelationships simultaneously and it is a
powerful statistical technique that combines measurement modelling or confirmatory
factor analysis (CFA) and structural modelling into a simultaneous statistical test (Hoe
2008).
In this section, the model was built based on the literature review in chapter 2 and the
results in section 4.8. The model for SEM testing is shown in figure 4.73. A partial
aggregation approach was used, as recommend by Baggozzi and Heatherton (1994).
Unlike the total aggregation approach, a partial aggregation approach was used to assess
the complex structural models and could retain the idea of a single underlying factor
(Bogozzi & Heatherton 1994; Heidt & Scott 2007; Hoe 2008). Heidt & Scott (2007)
proposed that in partial aggregation approach, a composite variable be created from the
items of each separate dimension of the construct and it becomes the single indicator of a
single factor model. SEM confirmatory factor analysis can then be performed to test an
overall model. This approach can provide greater substantive content for each variable
within a smaller matrix, less distraction from accumulated errors and thereby, greater
reliability (Bentler & Wu 1995; Leohlin 1992).
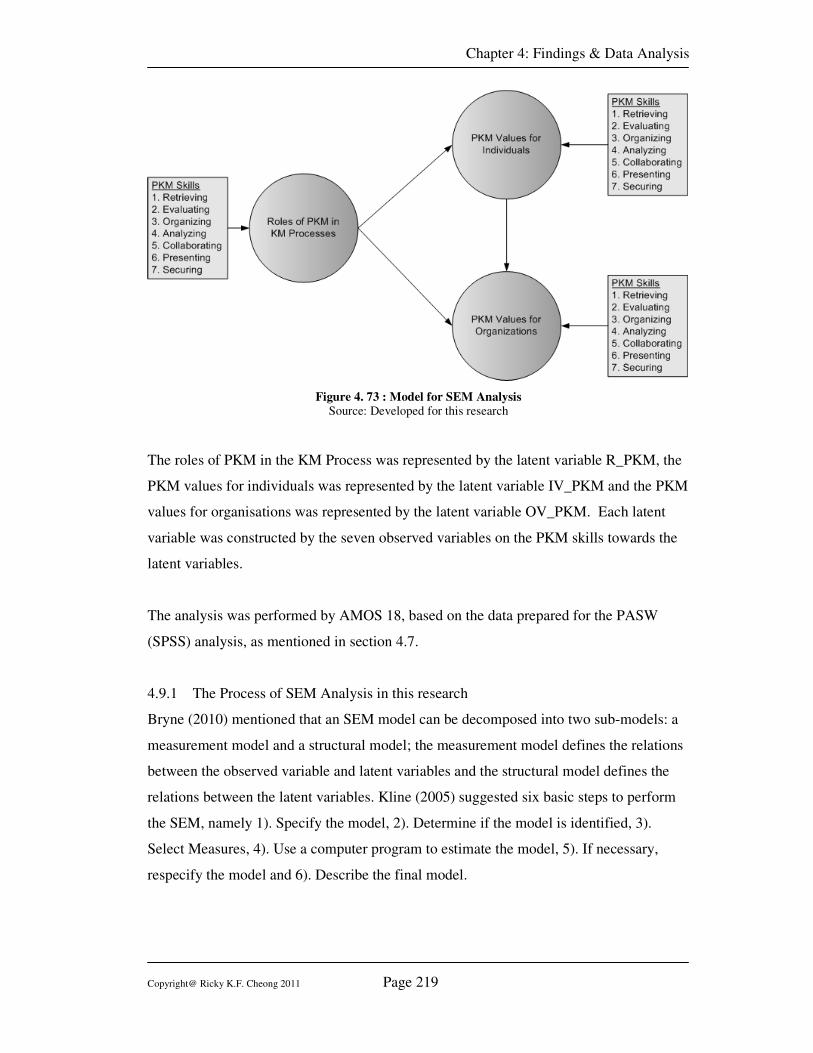
Chapter 4: Findings & Data Analysis
Copyright@ Ricky K.F. Cheong 2011 Page 219
Figure 4. 73 : Model for SEM Analysis
Source: Developed for this research
The roles of PKM in the KM Process was represented by the latent variable R_PKM, the
PKM values for individuals was represented by the latent variable IV_PKM and the PKM
values for organisations was represented by the latent variable OV_PKM. Each latent
variable was constructed by the seven observed variables on the PKM skills towards the
latent variables.
The analysis was performed by AMOS 18, based on the data prepared for the PASW
(SPSS) analysis, as mentioned in section 4.7.
4.9.1 The Process of SEM Analysis in this research
Bryne (2010) mentioned that an SEM model can be decomposed into two sub-models: a
measurement model and a structural model; the measurement model defines the relations
between the observed variable and latent variables and the structural model defines the
relations between the latent variables. Kline (2005) suggested six basic steps to perform
the SEM, namely 1). Specify the model, 2). Determine if the model is identified, 3).
Select Measures, 4). Use a computer program to estimate the model, 5). If necessary,
respecify the model and 6). Describe the final model.
Chapter 4: Findings & Data Analysis
Copyright@ Ricky K.F. Cheong 2011 Page 220
In this research, the processes of SEM analysis were divided into two stages. Stage 1 was
to assess the measurement model and stage 2 was to assess the structural model. The six
basic steps suggested by Kline(2005) were underlying the process in each stage. Besides,
Kline (2005) also suggested that data screening for SEM was crucial, as in all
multivariable analyses, which include the assessment of the normality, reliability and
validity. The reliability and validity of the latent variables were assessed in the
measurement model, as described in next section.
In SEM analysis, the non-normality of the data can be handled in two ways. Kline (2005)
stated that one way to deal with non-normality was transformation, and Bryne (2010)
mentioned that it could be handled by using the estimation approach, which does not have
normality assumed e.g. the Satorra-Bentler scaled statistical approach. In this research,
the transformation approach was selected as the transformation has been done in the
sections 4.8 during the exploratory data analysis, and also the Satorra-Bentler analysis is
not available in AMOS.
In this research, Maximum Likelihood (ML) estimation was selected. This estimation
procedure requires a sample size range from 200 to 500 (Byrne 2010; Hair, J. F. et al.
1998; Kline 2005). Hence, our final valid samples size of 206 was appropriate.
4.9.2 The Measurement Model
The measurement model, as illustrated in figure 4.74, has three latent variables, namely
R_PKM, IV_PKM and OV_PKM. Each latent variable has seven observed variables.
RPKM1 to RPKM7 were the observed variables for R_PKM, IV_PKM1 to IV_PKM7
were the observed variables for IV_PKM1 and OVPKM1 to OVPKM7 were the observed
variables for OV_PKM.
The reliability of the constructs was measured by the Cronbach’s Alpha coefficient and
the result is as shown in table 4.26. The Cronbach’s Alpha coefficient for R_PKM was
0.815, IV_PKM was 0.807 and IV_PKM was 0.829, all of which exceeded 0.8 and
considered to have good reliability, as suggested by Hair et al (1998).
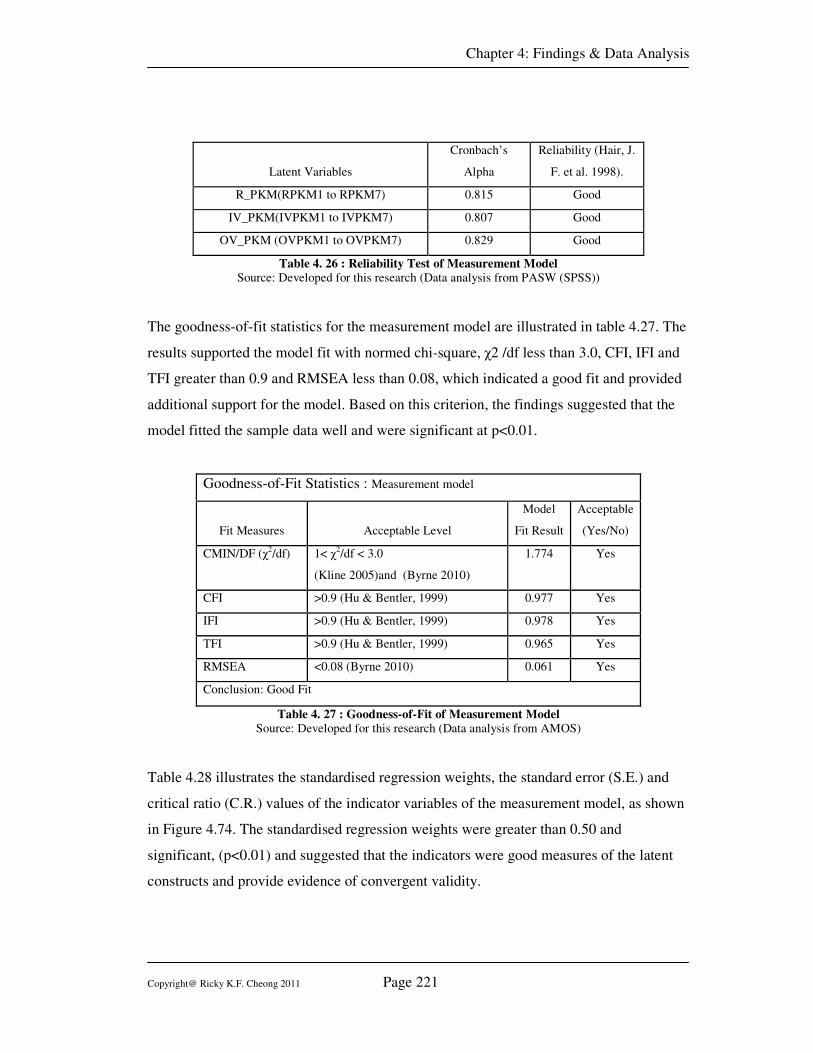
Chapter 4: Findings & Data Analysis
Copyright@ Ricky K.F. Cheong 2011 Page 221
Latent Variables
Cronbach’s
Alpha
Reliability (Hair, J.
F. et al. 1998).
R_PKM(RPKM1 to RPKM7) 0.815 Good
IV_PKM(IVPKM1 to IVPKM7) 0.807 Good
OV_PKM (OVPKM1 to OVPKM7) 0.829 Good
Table 4. 26 : Reliability Test of Measurement Model
Source: Developed for this research (Data analysis from PASW (SPSS))
The goodness-of-fit statistics for the measurement model are illustrated in table 4.27. The
results supported the model fit with normed chi-square, χ2 /df less than 3.0, CFI, IFI and
TFI greater than 0.9 and RMSEA less than 0.08, which indicated a good fit and provided
additional support for the model. Based on this criterion, the findings suggested that the
model fitted the sample data well and were significant at p<0.01.
Goodness-of-Fit Statistics : Measurement model
Fit Measures Acceptable Level
Model
Fit Result
Acceptable
(Yes/No)
CMIN/DF (χ2/df) 1< χ
2/df < 3.0
(Kline 2005)and (Byrne 2010)
1.774 Yes
CFI >0.9 (Hu & Bentler, 1999) 0.977 Yes
IFI >0.9 (Hu & Bentler, 1999) 0.978 Yes
TFI >0.9 (Hu & Bentler, 1999) 0.965 Yes
RMSEA <0.08 (Byrne 2010) 0.061 Yes
Conclusion: Good Fit
Table 4. 27 : Goodness-of-Fit of Measurement Model
Source: Developed for this research (Data analysis from AMOS)
Table 4.28 illustrates the standardised regression weights, the standard error (S.E.) and
critical ratio (C.R.) values of the indicator variables of the measurement model, as shown
in Figure 4.74. The standardised regression weights were greater than 0.50 and
significant, (p<0.01) and suggested that the indicators were good measures of the latent
constructs and provide evidence of convergent validity.
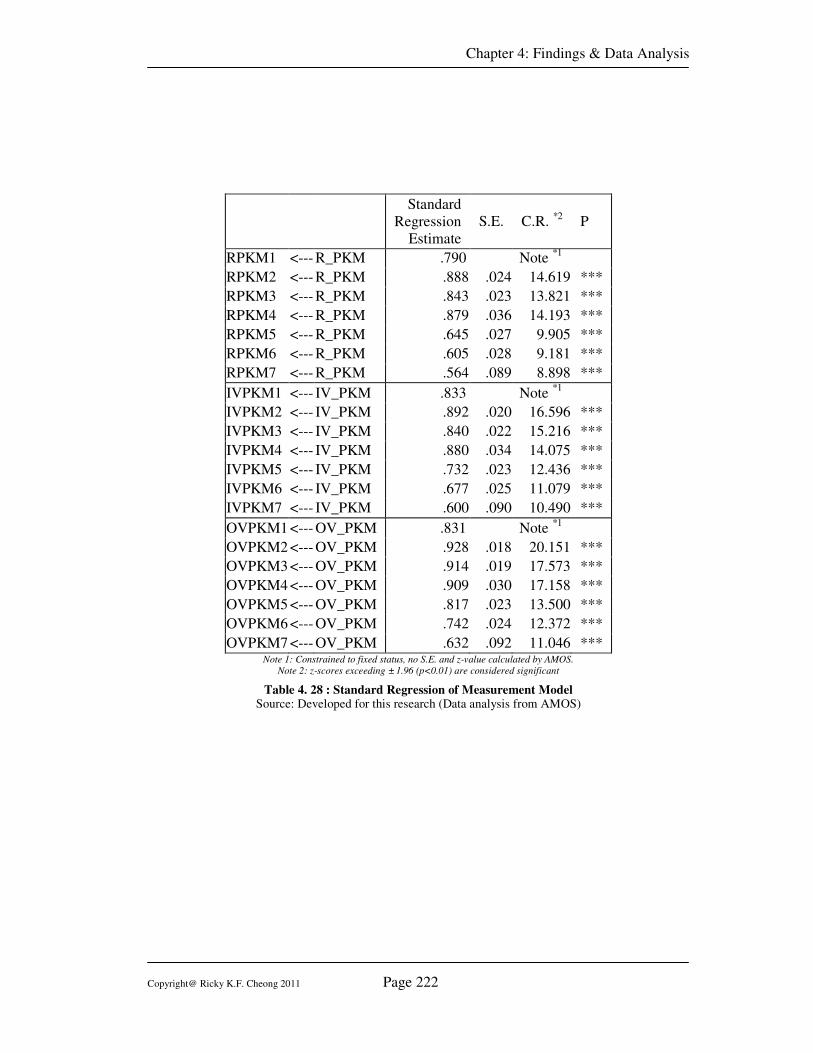
Chapter 4: Findings & Data Analysis
Copyright@ Ricky K.F. Cheong 2011 Page 222
Standard
Regression
Estimate
S.E. C.R. *2
P
RPKM1 <--- R_PKM .790 Note *1
RPKM2 <--- R_PKM .888 .024 14.619 ***
RPKM3 <--- R_PKM .843 .023 13.821 ***
RPKM4 <--- R_PKM .879 .036 14.193 ***
RPKM5 <--- R_PKM .645 .027 9.905 ***
RPKM6 <--- R_PKM .605 .028 9.181 ***
RPKM7 <--- R_PKM .564 .089 8.898 ***
IVPKM1 <--- IV_PKM .833 Note *1
IVPKM2 <--- IV_PKM .892 .020 16.596 ***
IVPKM3 <--- IV_PKM .840 .022 15.216 ***
IVPKM4 <--- IV_PKM .880 .034 14.075 ***
IVPKM5 <--- IV_PKM .732 .023 12.436 ***
IVPKM6 <--- IV_PKM .677 .025 11.079 ***
IVPKM7 <--- IV_PKM .600 .090 10.490 ***
OVPKM1 <--- OV_PKM .831 Note *1
OVPKM2 <--- OV_PKM .928 .018 20.151 ***
OVPKM3 <--- OV_PKM .914 .019 17.573 ***
OVPKM4 <--- OV_PKM .909 .030 17.158 ***
OVPKM5 <--- OV_PKM .817 .023 13.500 ***
OVPKM6 <--- OV_PKM .742 .024 12.372 ***
OVPKM7 <--- OV_PKM .632 .092 11.046 *** Note 1: Constrained to fixed status, no S.E. and z-value calculated by AMOS.
Note 2: z-scores exceeding ± 1.96 (p<0.01) are considered significant
Table 4. 28 : Standard Regression of Measurement Model Source: Developed for this research (Data analysis from AMOS)
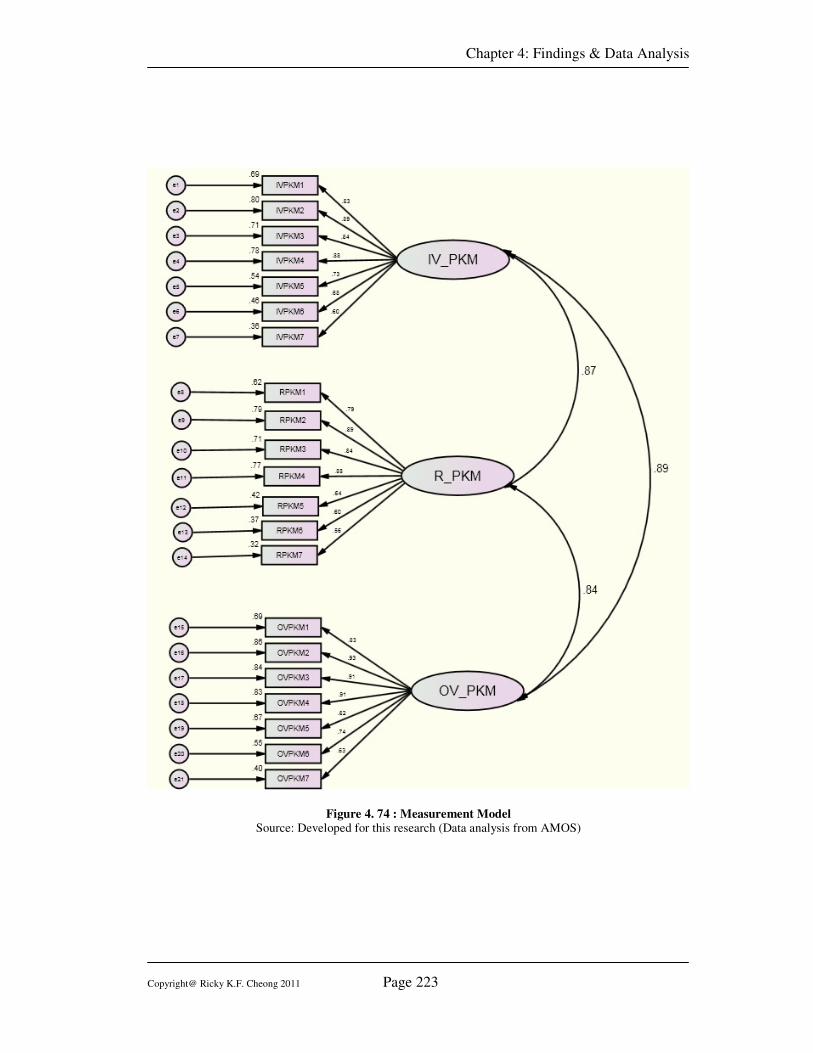
Chapter 4: Findings & Data Analysis
Copyright@ Ricky K.F. Cheong 2011 Page 223
Figure 4. 74 : Measurement Model
Source: Developed for this research (Data analysis from AMOS)
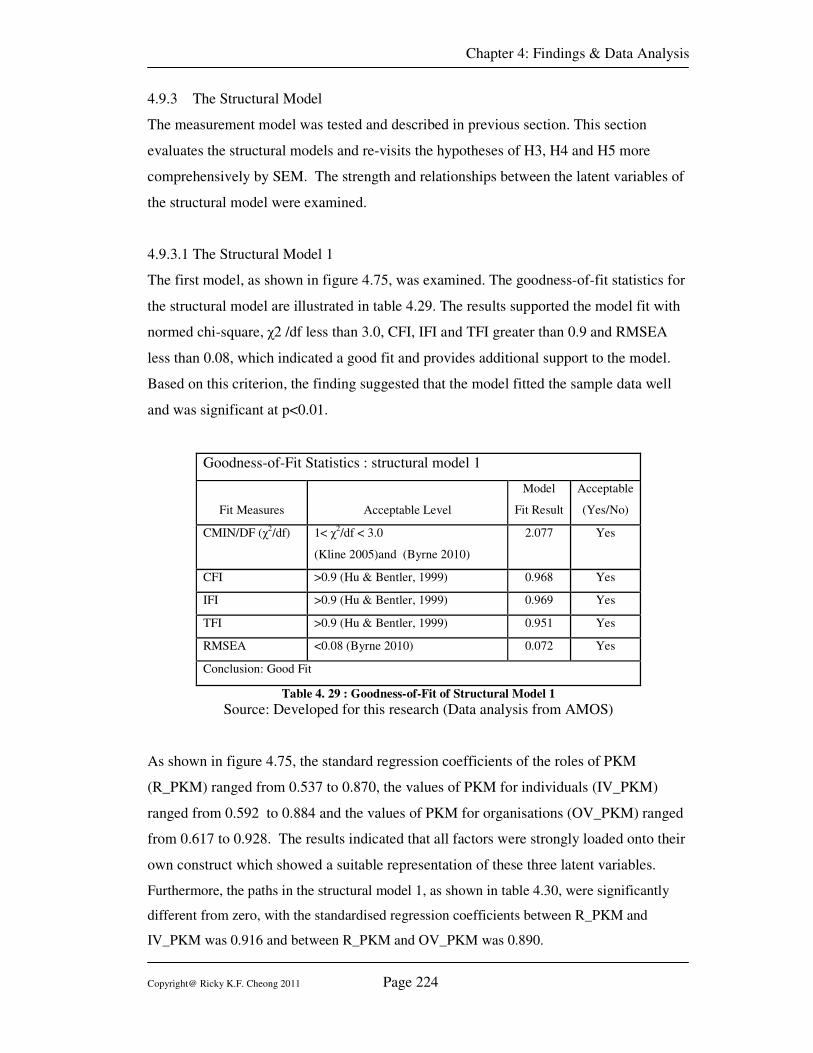
Chapter 4: Findings & Data Analysis
Copyright@ Ricky K.F. Cheong 2011 Page 224
4.9.3 The Structural Model
The measurement model was tested and described in previous section. This section
evaluates the structural models and re-visits the hypotheses of H3, H4 and H5 more
comprehensively by SEM. The strength and relationships between the latent variables of
the structural model were examined.
4.9.3.1 The Structural Model 1
The first model, as shown in figure 4.75, was examined. The goodness-of-fit statistics for
the structural model are illustrated in table 4.29. The results supported the model fit with
normed chi-square, χ2 /df less than 3.0, CFI, IFI and TFI greater than 0.9 and RMSEA
less than 0.08, which indicated a good fit and provides additional support to the model.
Based on this criterion, the finding suggested that the model fitted the sample data well
and was significant at p<0.01.
Goodness-of-Fit Statistics : structural model 1
Fit Measures Acceptable Level
Model
Fit Result
Acceptable
(Yes/No)
CMIN/DF (χ2/df) 1< χ
2/df < 3.0
(Kline 2005)and (Byrne 2010)
2.077 Yes
CFI >0.9 (Hu & Bentler, 1999) 0.968 Yes
IFI >0.9 (Hu & Bentler, 1999) 0.969 Yes
TFI >0.9 (Hu & Bentler, 1999) 0.951 Yes
RMSEA <0.08 (Byrne 2010) 0.072 Yes
Conclusion: Good Fit
Table 4. 29 : Goodness-of-Fit of Structural Model 1
Source: Developed for this research (Data analysis from AMOS)
As shown in figure 4.75, the standard regression coefficients of the roles of PKM
(R_PKM) ranged from 0.537 to 0.870, the values of PKM for individuals (IV_PKM)
ranged from 0.592 to 0.884 and the values of PKM for organisations (OV_PKM) ranged
from 0.617 to 0.928. The results indicated that all factors were strongly loaded onto their
own construct which showed a suitable representation of these three latent variables.
Furthermore, the paths in the structural model 1, as shown in table 4.30, were significantly
different from zero, with the standardised regression coefficients between R_PKM and
IV_PKM was 0.916 and between R_PKM and OV_PKM was 0.890.
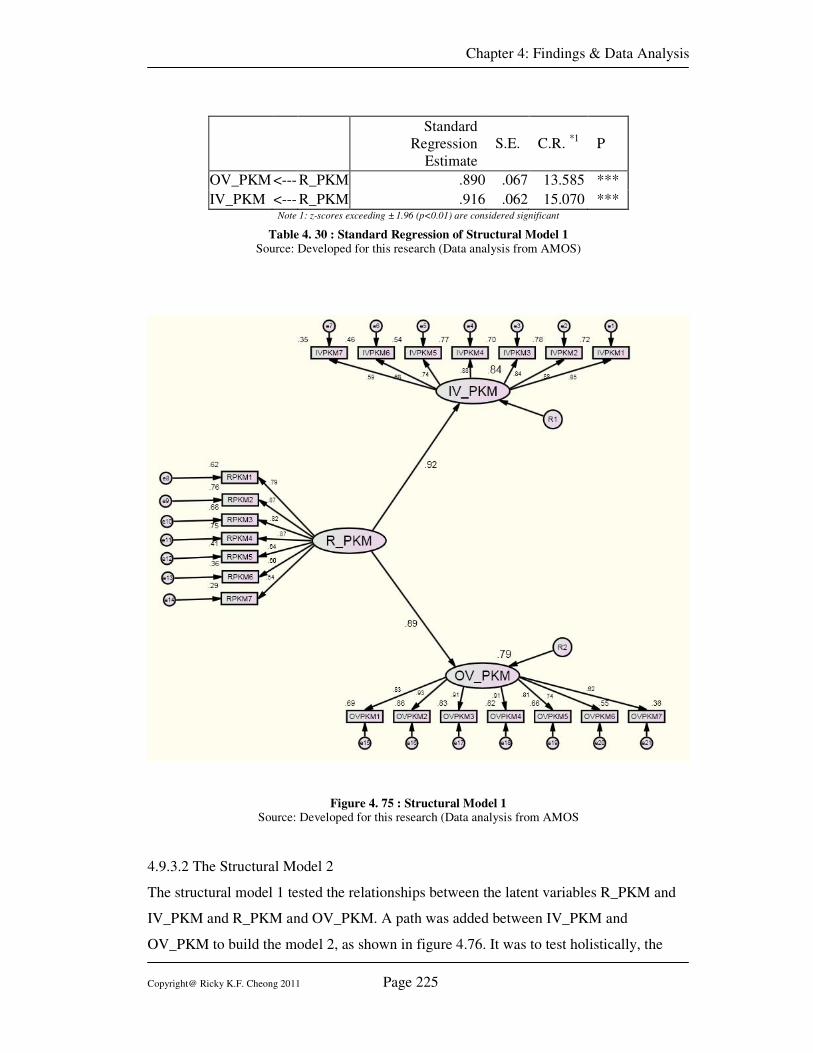
Chapter 4: Findings & Data Analysis
Copyright@ Ricky K.F. Cheong 2011 Page 225
Standard
Regression
Estimate
S.E. C.R. *1
P
OV_PKM <--- R_PKM .890 .067 13.585 ***
IV_PKM <--- R_PKM .916 .062 15.070 *** Note 1: z-scores exceeding ± 1.96 (p<0.01) are considered significant
Table 4. 30 : Standard Regression of Structural Model 1
Source: Developed for this research (Data analysis from AMOS)
Figure 4. 75 : Structural Model 1 Source: Developed for this research (Data analysis from AMOS
4.9.3.2 The Structural Model 2
The structural model 1 tested the relationships between the latent variables R_PKM and
IV_PKM and R_PKM and OV_PKM. A path was added between IV_PKM and
OV_PKM to build the model 2, as shown in figure 4.76. It was to test holistically, the
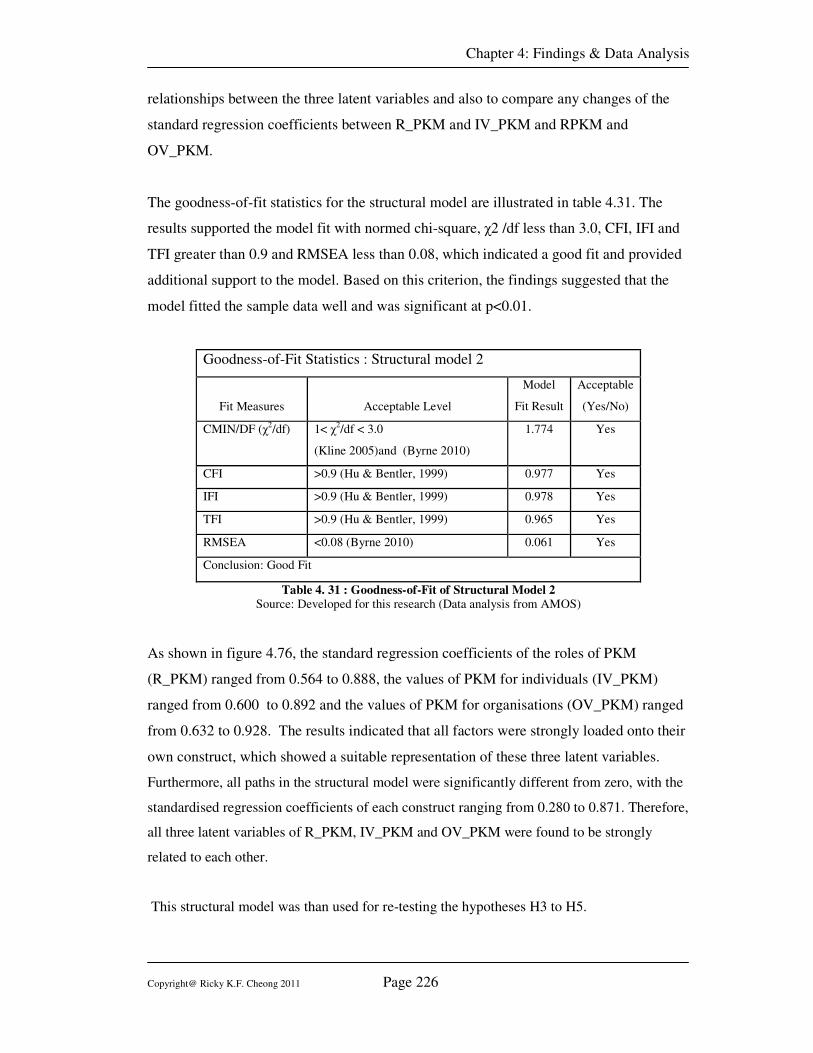
Chapter 4: Findings & Data Analysis
Copyright@ Ricky K.F. Cheong 2011 Page 226
relationships between the three latent variables and also to compare any changes of the
standard regression coefficients between R_PKM and IV_PKM and RPKM and
OV_PKM.
The goodness-of-fit statistics for the structural model are illustrated in table 4.31. The
results supported the model fit with normed chi-square, χ2 /df less than 3.0, CFI, IFI and
TFI greater than 0.9 and RMSEA less than 0.08, which indicated a good fit and provided
additional support to the model. Based on this criterion, the findings suggested that the
model fitted the sample data well and was significant at p<0.01.
Goodness-of-Fit Statistics : Structural model 2
Fit Measures Acceptable Level
Model
Fit Result
Acceptable
(Yes/No)
CMIN/DF (χ2/df) 1< χ
2/df < 3.0
(Kline 2005)and (Byrne 2010)
1.774 Yes
CFI >0.9 (Hu & Bentler, 1999) 0.977 Yes
IFI >0.9 (Hu & Bentler, 1999) 0.978 Yes
TFI >0.9 (Hu & Bentler, 1999) 0.965 Yes
RMSEA <0.08 (Byrne 2010) 0.061 Yes
Conclusion: Good Fit
Table 4. 31 : Goodness-of-Fit of Structural Model 2
Source: Developed for this research (Data analysis from AMOS)
As shown in figure 4.76, the standard regression coefficients of the roles of PKM
(R_PKM) ranged from 0.564 to 0.888, the values of PKM for individuals (IV_PKM)
ranged from 0.600 to 0.892 and the values of PKM for organisations (OV_PKM) ranged
from 0.632 to 0.928. The results indicated that all factors were strongly loaded onto their
own construct, which showed a suitable representation of these three latent variables.
Furthermore, all paths in the structural model were significantly different from zero, with the
standardised regression coefficients of each construct ranging from 0.280 to 0.871. Therefore,
all three latent variables of R_PKM, IV_PKM and OV_PKM were found to be strongly
related to each other.
This structural model was than used for re-testing the hypotheses H3 to H5.
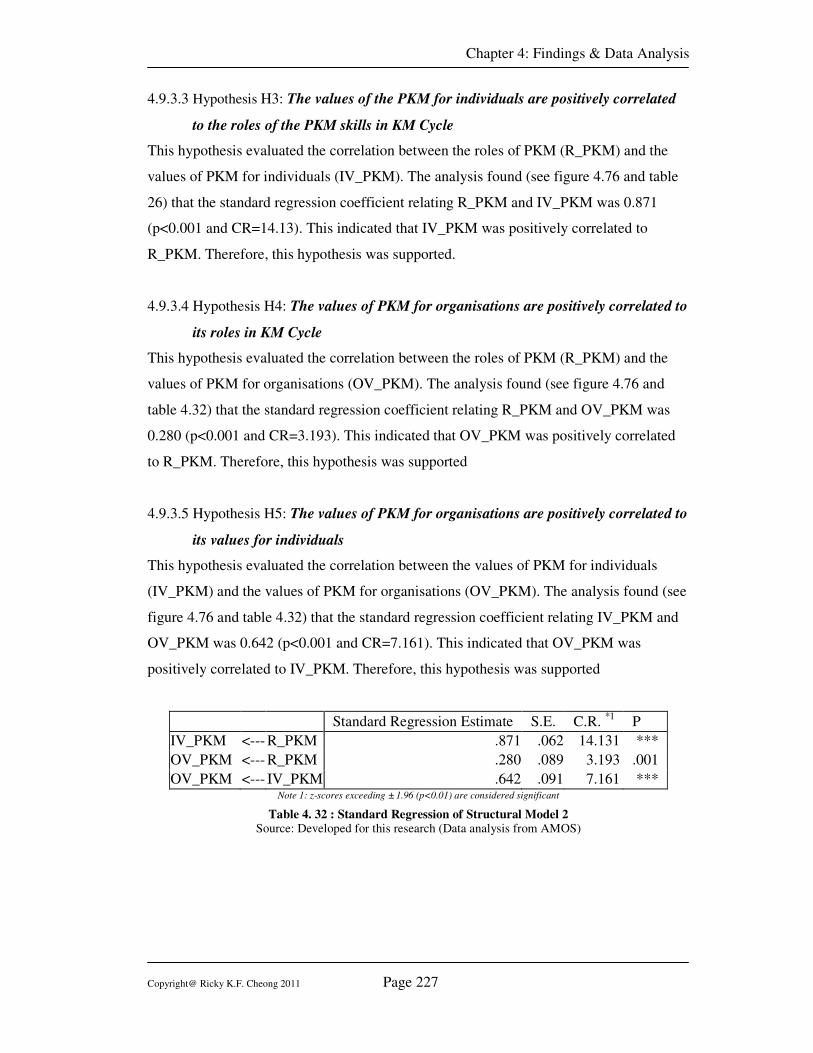
Chapter 4: Findings & Data Analysis
Copyright@ Ricky K.F. Cheong 2011 Page 227
4.9.3.3 Hypothesis H3: The values of the PKM for individuals are positively correlated
to the roles of the PKM skills in KM Cycle
This hypothesis evaluated the correlation between the roles of PKM (R_PKM) and the
values of PKM for individuals (IV_PKM). The analysis found (see figure 4.76 and table
26) that the standard regression coefficient relating R_PKM and IV_PKM was 0.871
(p<0.001 and CR=14.13). This indicated that IV_PKM was positively correlated to
R_PKM. Therefore, this hypothesis was supported.
4.9.3.4 Hypothesis H4: The values of PKM for organisations are positively correlated to
its roles in KM Cycle
This hypothesis evaluated the correlation between the roles of PKM (R_PKM) and the
values of PKM for organisations (OV_PKM). The analysis found (see figure 4.76 and
table 4.32) that the standard regression coefficient relating R_PKM and OV_PKM was
0.280 (p<0.001 and CR=3.193). This indicated that OV_PKM was positively correlated
to R_PKM. Therefore, this hypothesis was supported
4.9.3.5 Hypothesis H5: The values of PKM for organisations are positively correlated to
its values for individuals
This hypothesis evaluated the correlation between the values of PKM for individuals
(IV_PKM) and the values of PKM for organisations (OV_PKM). The analysis found (see
figure 4.76 and table 4.32) that the standard regression coefficient relating IV_PKM and
OV_PKM was 0.642 (p<0.001 and CR=7.161). This indicated that OV_PKM was
positively correlated to IV_PKM. Therefore, this hypothesis was supported
Standard Regression Estimate S.E. C.R. *1
P
IV_PKM <--- R_PKM .871 .062 14.131 ***
OV_PKM <--- R_PKM .280 .089 3.193 .001
OV_PKM <--- IV_PKM .642 .091 7.161 *** Note 1: z-scores exceeding ± 1.96 (p<0.01) are considered significant
Table 4. 32 : Standard Regression of Structural Model 2
Source: Developed for this research (Data analysis from AMOS)
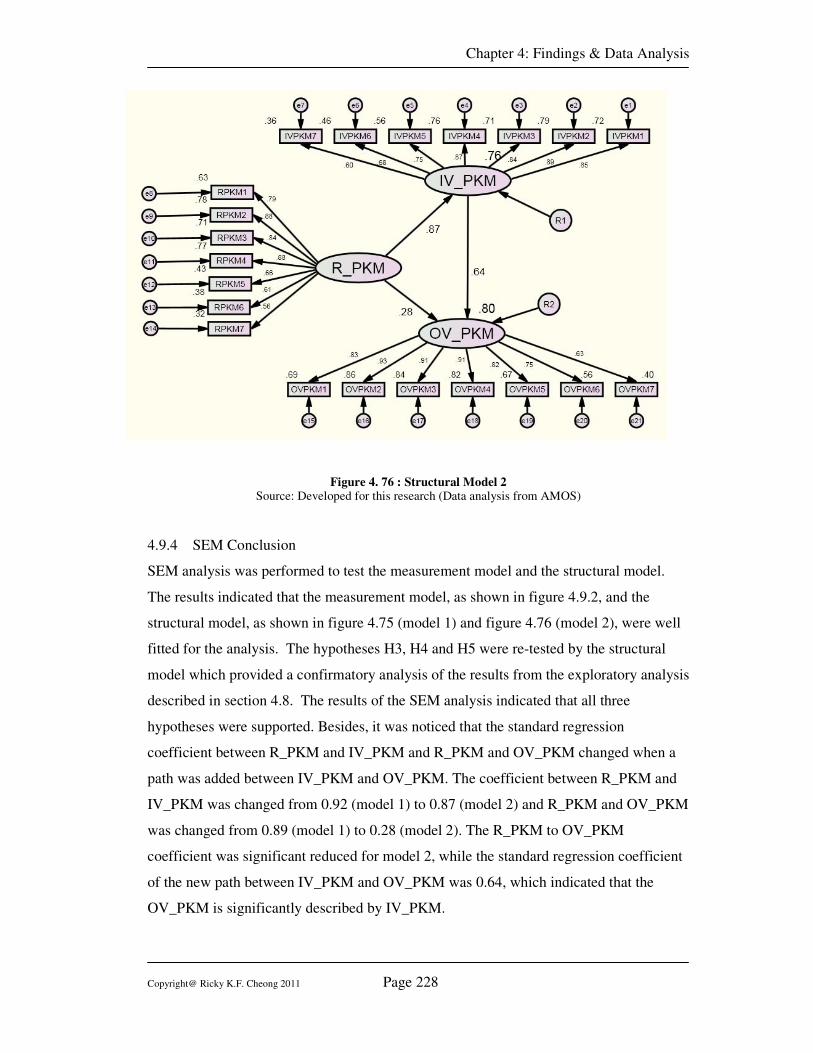
Chapter 4: Findings & Data Analysis
Copyright@ Ricky K.F. Cheong 2011 Page 228
Figure 4. 76 : Structural Model 2 Source: Developed for this research (Data analysis from AMOS)
4.9.4 SEM Conclusion
SEM analysis was performed to test the measurement model and the structural model.
The results indicated that the measurement model, as shown in figure 4.9.2, and the
structural model, as shown in figure 4.75 (model 1) and figure 4.76 (model 2), were well
fitted for the analysis. The hypotheses H3, H4 and H5 were re-tested by the structural
model which provided a confirmatory analysis of the results from the exploratory analysis
described in section 4.8. The results of the SEM analysis indicated that all three
hypotheses were supported. Besides, it was noticed that the standard regression
coefficient between R_PKM and IV_PKM and R_PKM and OV_PKM changed when a
path was added between IV_PKM and OV_PKM. The coefficient between R_PKM and
IV_PKM was changed from 0.92 (model 1) to 0.87 (model 2) and R_PKM and OV_PKM
was changed from 0.89 (model 1) to 0.28 (model 2). The R_PKM to OV_PKM
coefficient was significant reduced for model 2, while the standard regression coefficient
of the new path between IV_PKM and OV_PKM was 0.64, which indicated that the
OV_PKM is significantly described by IV_PKM.
Chapter 4: Findings & Data Analysis
Copyright@ Ricky K.F. Cheong 2011 Page 229
4.10 Chapter Conclusion
This chapter discussed the results of the data analysis performed by using PASW (SPSS)
18 and AMOS 18. The data preparation and screening were formed and the respondents
profile and the descriptive statistics were presented. The analysis was done by
exploratory data analysis and followed by confirmatory data analysis. The validity and
reliability of the constructs were tested and found to be acceptable. The normality was
also checked and transformation was undertaken prior the hypotheses testing. The
exploratory data analysis found that all hypotheses in this research were supported, and
the hypotheses related to the correlations between the roles of PKM, the values of PKM
for individuals, and the values of PKM for organisations were re-tested by SEM to
provide confirmatory results. The SEM was performed to test both the measurement
model and the structural model. The goodness-of-fit results indicated that both the
measurement model and structural model were suitable for analysis. The results of the
SEM on the structural model also indicated that the tested hypotheses were supported
which provided confirmation to the exploratory analysis results.
In order to draw an appropriate conclusion in answering the research questions, the
research results presented in this chapter have been considered in conjunction with the
literature review as presented in Chapter 2. The conclusions of this research are presented
together with the implications of the findings in next chapter to form the final part of this
thesis.
Chapter 5: Conclusions and Implications
Copyright@ Ricky K.F. Cheong 2011 Page 230
CChhaapptteerr 55 -- CCoonncclluussiioonnss aanndd IImmpplliiccaattiioonnss
Chapter 5: Conclusions and Implications
Copyright@ Ricky K.F. Cheong 2011 Page 231
5.1 Introduction
Chapter 1 provided the background and objectives of this research and identified the
following research questions.
RQ1: What are the roles of PKM in the Knowledge Management Process?
RQ2: What are the values of PKM for individuals and organisations?
RQ3: Is there any correlation between the roles of PKM in the KM Process and
the values of PKM for individuals and organisations?
RQ4: Is there any correlation between the values of PKM for individuals and the
values of PKM for organisations?
To answer the research questions, chapter 2 reviewed the literature in relation to
knowledge management, personal knowledge management, individual learning,
individual competences, organisational learning, and organisation competences. A gap
existing due to inadequate research that relates to the roles and values of the personal
knowledge management was recognised.
Based on the literature review, a conceptual model was developed, as described in
chapter 3, and the following main hypotheses were proposed to fill the gap in the
literature and answer the research questions.
H1. PKM skills are playing important roles in the KM Cycle
H2. PKM can benefit both individuals and organisations
H3. The values of PKM for individuals are positively correlated to the roles of
PKM skills in the KM process.
H4. The values of PKM for organisations are positively correlated to the roles of
PKM skills in the KM process.
H5. The values of PKM for individuals are positively correlated to the values of
PKM for the organisation.
Chapter 3 also provided the details on the research design and methodology employed in
the research. A quantitative approach was selected as the most appropriate method to test
the conceptual model. To collect the data, an online survey was used and invitations were
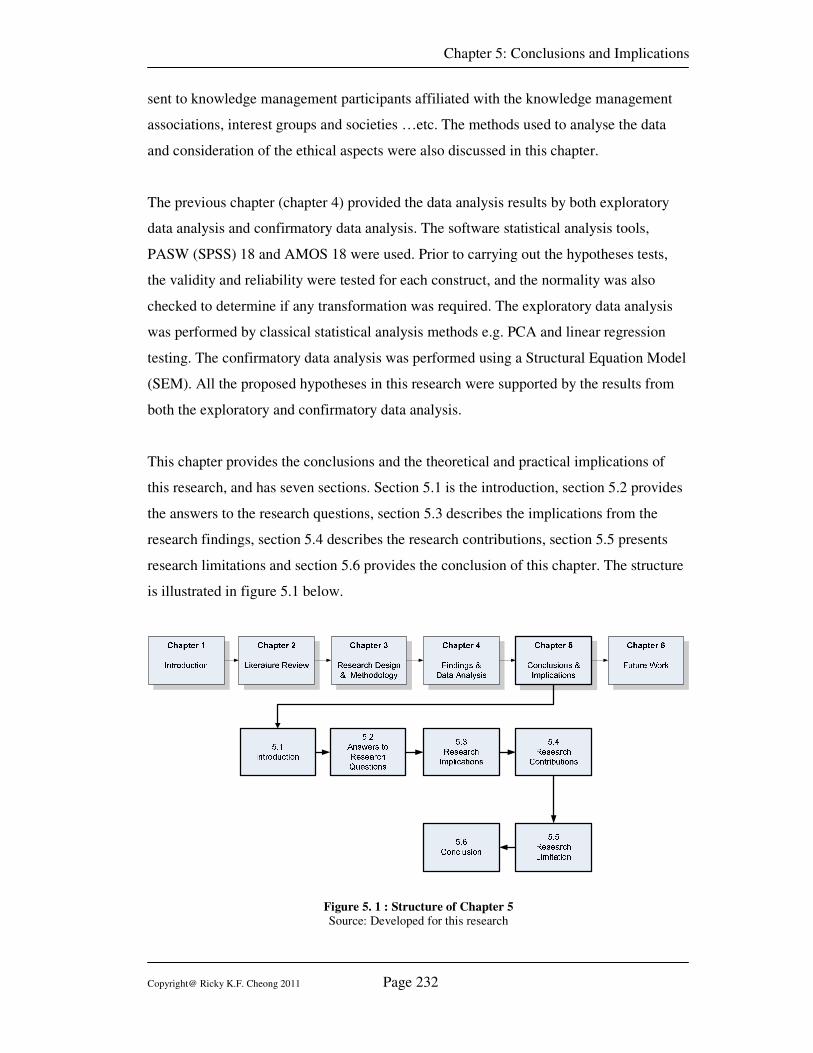
Chapter 5: Conclusions and Implications
Copyright@ Ricky K.F. Cheong 2011 Page 232
sent to knowledge management participants affiliated with the knowledge management
associations, interest groups and societies …etc. The methods used to analyse the data
and consideration of the ethical aspects were also discussed in this chapter.
The previous chapter (chapter 4) provided the data analysis results by both exploratory
data analysis and confirmatory data analysis. The software statistical analysis tools,
PASW (SPSS) 18 and AMOS 18 were used. Prior to carrying out the hypotheses tests,
the validity and reliability were tested for each construct, and the normality was also
checked to determine if any transformation was required. The exploratory data analysis
was performed by classical statistical analysis methods e.g. PCA and linear regression
testing. The confirmatory data analysis was performed using a Structural Equation Model
(SEM). All the proposed hypotheses in this research were supported by the results from
both the exploratory and confirmatory data analysis.
This chapter provides the conclusions and the theoretical and practical implications of
this research, and has seven sections. Section 5.1 is the introduction, section 5.2 provides
the answers to the research questions, section 5.3 describes the implications from the
research findings, section 5.4 describes the research contributions, section 5.5 presents
research limitations and section 5.6 provides the conclusion of this chapter. The structure
is illustrated in figure 5.1 below.
Figure 5. 1 : Structure of Chapter 5
Source: Developed for this research
Chapter 5: Conclusions and Implications
Copyright@ Ricky K.F. Cheong 2011 Page 233
5.2 Answers to Research Questions
In order to answer the research questions, five main hypotheses and twenty-three sub
hypotheses were developed. Table 5.1 summarises the related hypotheses in answering
the research questions. Hypothesis H1 was to answer the research question RQ1;
Hypothesis H2 (Sub-hypotheses H2a and H2b) was to answer the research question RQ2;
Hypothesis H3 (Sub-hypotheses H3a to H3g) and Hypothesis H4 (Sub-Hypotheses H4a
to H4g) were to answer the research question RQ3; and Hypothesis H5 (Sub-Hypotheses
H5a to H5g) was to answer the research RQ5.
This section provides conclusions of the relevant hypotheses in answer to the research
questions.
5.2.1 RQ1: What are the roles of PKM in the Knowledge Management Process?
Hypothesis H1 was proposed to answer the research question RQ1.
H1. PKM skills are playing important roles in the KM Cycle
Under this hypothesis, the seven PKM skills were measured to examine the roles of PKM
in the KM Processes.
The literature review in chapter 2 stated that Avery et al. (2001) defined PKM as an
overall structured process for intentionally managing information and turning it into
useful knowledge. There were seven PKM skills in the proposed PKM framework,
namely (1) Retrieving information; (2) Evaluating information; (3) Organising
information; (4) Collaborating around information; (5) Analysing information; (6)
Presenting information; and (7) Securing information.
Seufert, Back and Krogh (2003) suggested four generic knowledge processes,
Locating/Capturing (KMC1), Creating (KMC2), Sharing/Transferring (KMC3) and
Applying (KMC4). These four processes were interactive instead of sequential and the
application of knowledge took the central role in the KM cycle.
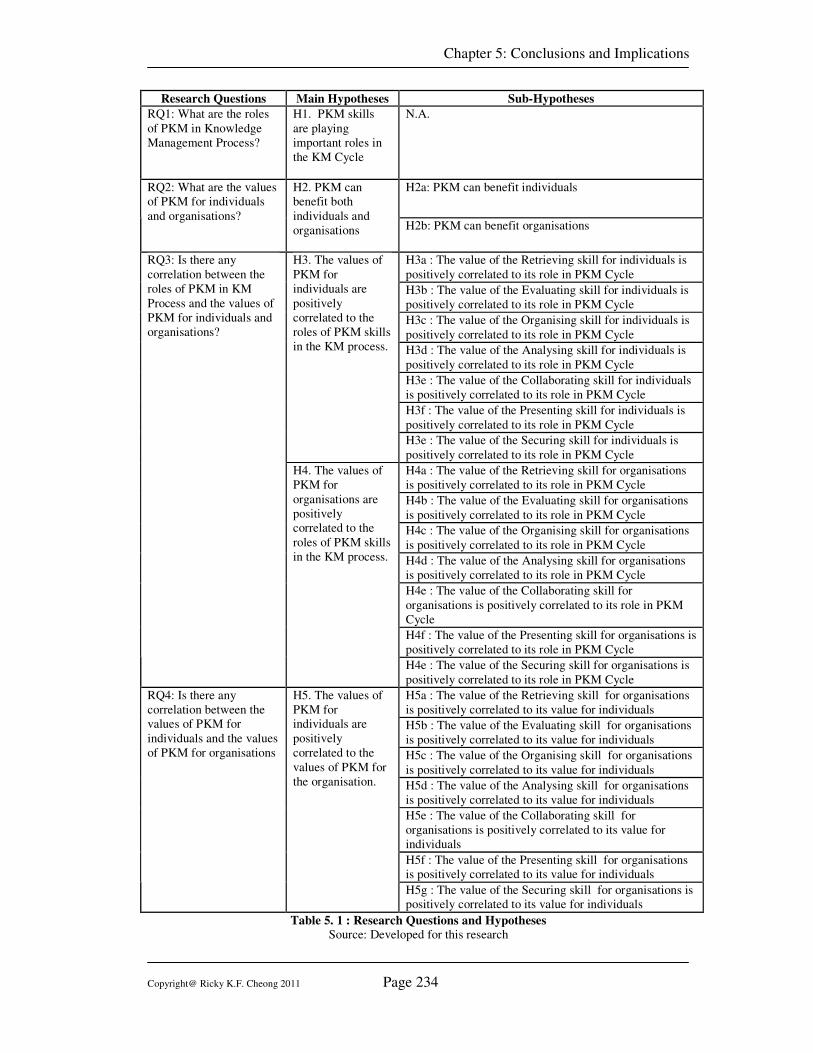
Chapter 5: Conclusions and Implications
Copyright@ Ricky K.F. Cheong 2011 Page 234
Research Questions Main Hypotheses Sub-Hypotheses
RQ1: What are the roles
of PKM in Knowledge
Management Process?
H1. PKM skills
are playing
important roles in
the KM Cycle
N.A.
H2a: PKM can benefit individuals RQ2: What are the values
of PKM for individuals
and organisations?
H2. PKM can
benefit both
individuals and
organisations H2b: PKM can benefit organisations
H3a : The value of the Retrieving skill for individuals is
positively correlated to its role in PKM Cycle
H3b : The value of the Evaluating skill for individuals is
positively correlated to its role in PKM Cycle
H3c : The value of the Organising skill for individuals is
positively correlated to its role in PKM Cycle
H3d : The value of the Analysing skill for individuals is
positively correlated to its role in PKM Cycle
H3e : The value of the Collaborating skill for individuals
is positively correlated to its role in PKM Cycle
H3f : The value of the Presenting skill for individuals is
positively correlated to its role in PKM Cycle
H3. The values of
PKM for
individuals are
positively
correlated to the
roles of PKM skills
in the KM process.
H3e : The value of the Securing skill for individuals is
positively correlated to its role in PKM Cycle
H4a : The value of the Retrieving skill for organisations
is positively correlated to its role in PKM Cycle
H4b : The value of the Evaluating skill for organisations
is positively correlated to its role in PKM Cycle
H4c : The value of the Organising skill for organisations
is positively correlated to its role in PKM Cycle
H4d : The value of the Analysing skill for organisations
is positively correlated to its role in PKM Cycle
H4e : The value of the Collaborating skill for
organisations is positively correlated to its role in PKM
Cycle
H4f : The value of the Presenting skill for organisations is
positively correlated to its role in PKM Cycle
RQ3: Is there any
correlation between the
roles of PKM in KM
Process and the values of
PKM for individuals and
organisations?
H4. The values of
PKM for
organisations are
positively
correlated to the
roles of PKM skills
in the KM process.
H4e : The value of the Securing skill for organisations is
positively correlated to its role in PKM Cycle
H5a : The value of the Retrieving skill for organisations
is positively correlated to its value for individuals
H5b : The value of the Evaluating skill for organisations
is positively correlated to its value for individuals
H5c : The value of the Organising skill for organisations
is positively correlated to its value for individuals
H5d : The value of the Analysing skill for organisations
is positively correlated to its value for individuals
H5e : The value of the Collaborating skill for
organisations is positively correlated to its value for
individuals
H5f : The value of the Presenting skill for organisations
is positively correlated to its value for individuals
RQ4: Is there any
correlation between the
values of PKM for
individuals and the values
of PKM for organisations
H5. The values of
PKM for
individuals are
positively
correlated to the
values of PKM for
the organisation.
H5g : The value of the Securing skill for organisations is
positively correlated to its value for individuals
Table 5. 1 : Research Questions and Hypotheses
Source: Developed for this research
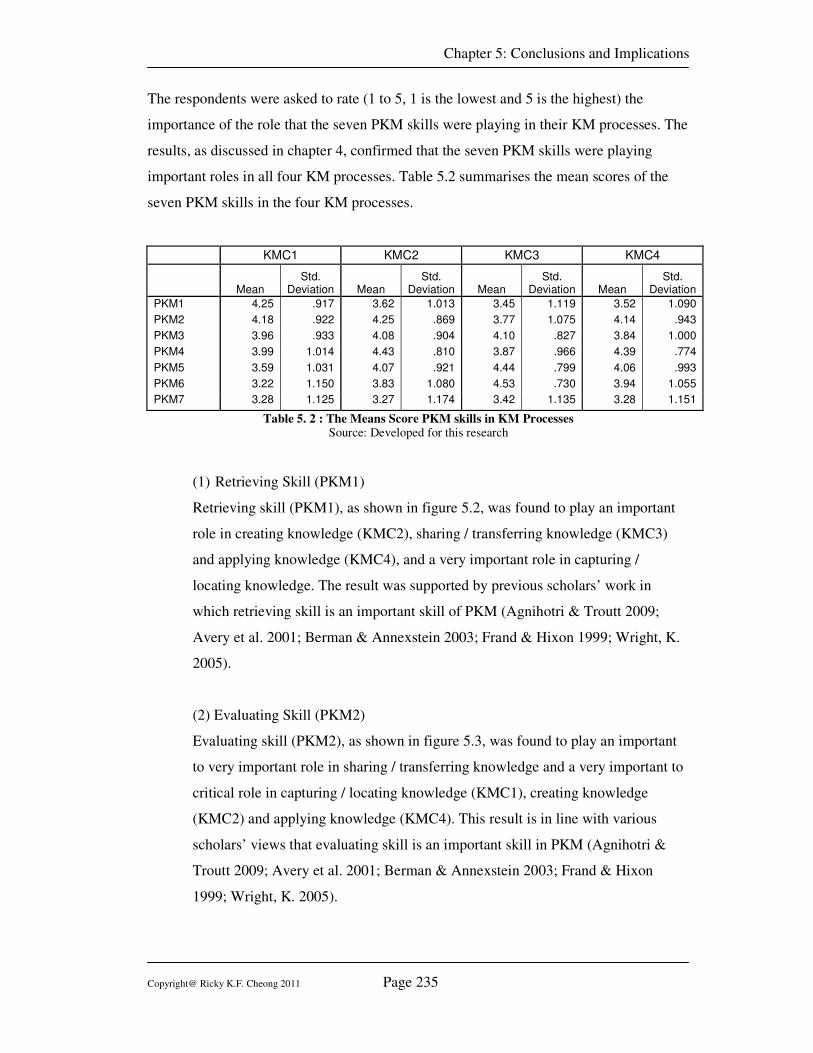
Chapter 5: Conclusions and Implications
Copyright@ Ricky K.F. Cheong 2011 Page 235
The respondents were asked to rate (1 to 5, 1 is the lowest and 5 is the highest) the
importance of the role that the seven PKM skills were playing in their KM processes. The
results, as discussed in chapter 4, confirmed that the seven PKM skills were playing
important roles in all four KM processes. Table 5.2 summarises the mean scores of the
seven PKM skills in the four KM processes.
KMC1 KMC2 KMC3 KMC4
Mean
Std. Deviation Mean
Std. Deviation Mean
Std. Deviation Mean
Std. Deviation
PKM1 4.25 .917 3.62 1.013 3.45 1.119 3.52 1.090
PKM2 4.18 .922 4.25 .869 3.77 1.075 4.14 .943
PKM3 3.96 .933 4.08 .904 4.10 .827 3.84 1.000
PKM4 3.99 1.014 4.43 .810 3.87 .966 4.39 .774
PKM5 3.59 1.031 4.07 .921 4.44 .799 4.06 .993
PKM6 3.22 1.150 3.83 1.080 4.53 .730 3.94 1.055
PKM7 3.28 1.125 3.27 1.174 3.42 1.135 3.28 1.151
Table 5. 2 : The Means Score PKM skills in KM Processes Source: Developed for this research
(1) Retrieving Skill (PKM1)
Retrieving skill (PKM1), as shown in figure 5.2, was found to play an important
role in creating knowledge (KMC2), sharing / transferring knowledge (KMC3)
and applying knowledge (KMC4), and a very important role in capturing /
locating knowledge. The result was supported by previous scholars’ work in
which retrieving skill is an important skill of PKM (Agnihotri & Troutt 2009;
Avery et al. 2001; Berman & Annexstein 2003; Frand & Hixon 1999; Wright, K.
2005).
(2) Evaluating Skill (PKM2)
Evaluating skill (PKM2), as shown in figure 5.3, was found to play an important
to very important role in sharing / transferring knowledge and a very important to
critical role in capturing / locating knowledge (KMC1), creating knowledge
(KMC2) and applying knowledge (KMC4). This result is in line with various
scholars’ views that evaluating skill is an important skill in PKM (Agnihotri &
Troutt 2009; Avery et al. 2001; Berman & Annexstein 2003; Frand & Hixon
1999; Wright, K. 2005).
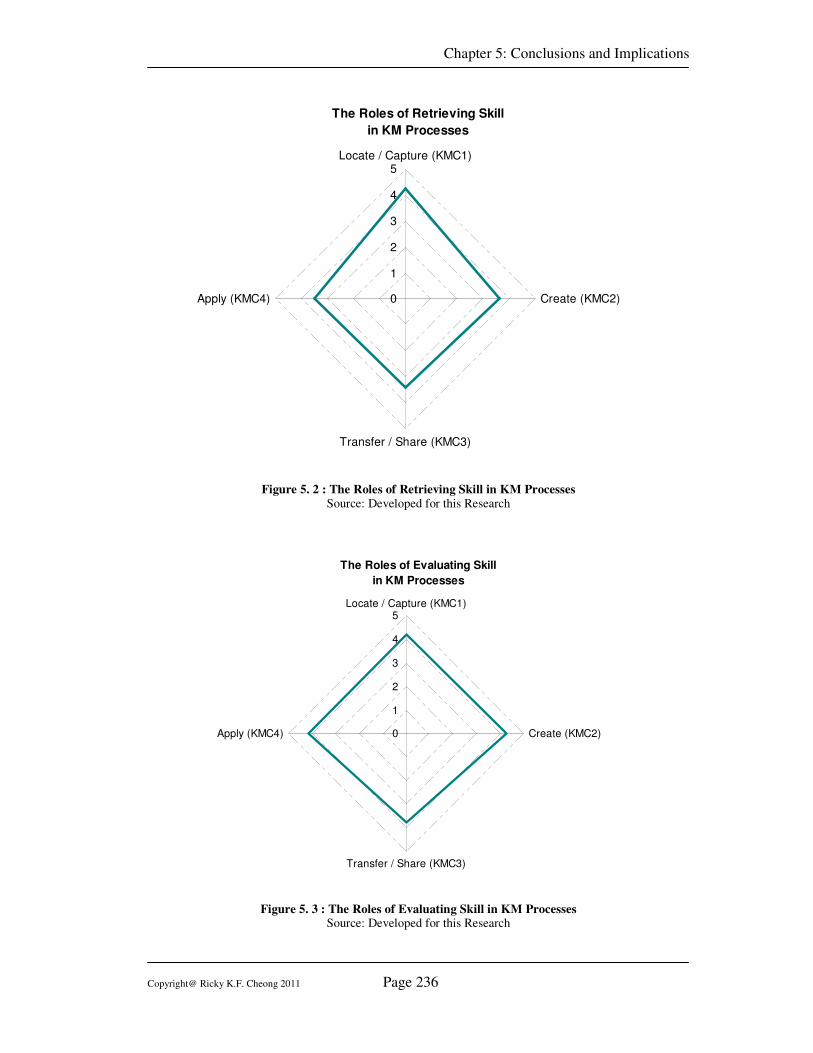
Chapter 5: Conclusions and Implications
Copyright@ Ricky K.F. Cheong 2011 Page 236
The Roles of Retrieving Skill
in KM Processes
0
1
2
3
4
5Locate / Capture (KMC1)
Create (KMC2)
Transfer / Share (KMC3)
Apply (KMC4)
Figure 5. 2 : The Roles of Retrieving Skill in KM Processes
Source: Developed for this Research
The Roles of Evaluating Skill
in KM Processes
0
1
2
3
4
5Locate / Capture (KMC1)
Create (KMC2)
Transfer / Share (KMC3)
Apply (KMC4)
Figure 5. 3 : The Roles of Evaluating Skill in KM Processes Source: Developed for this Research
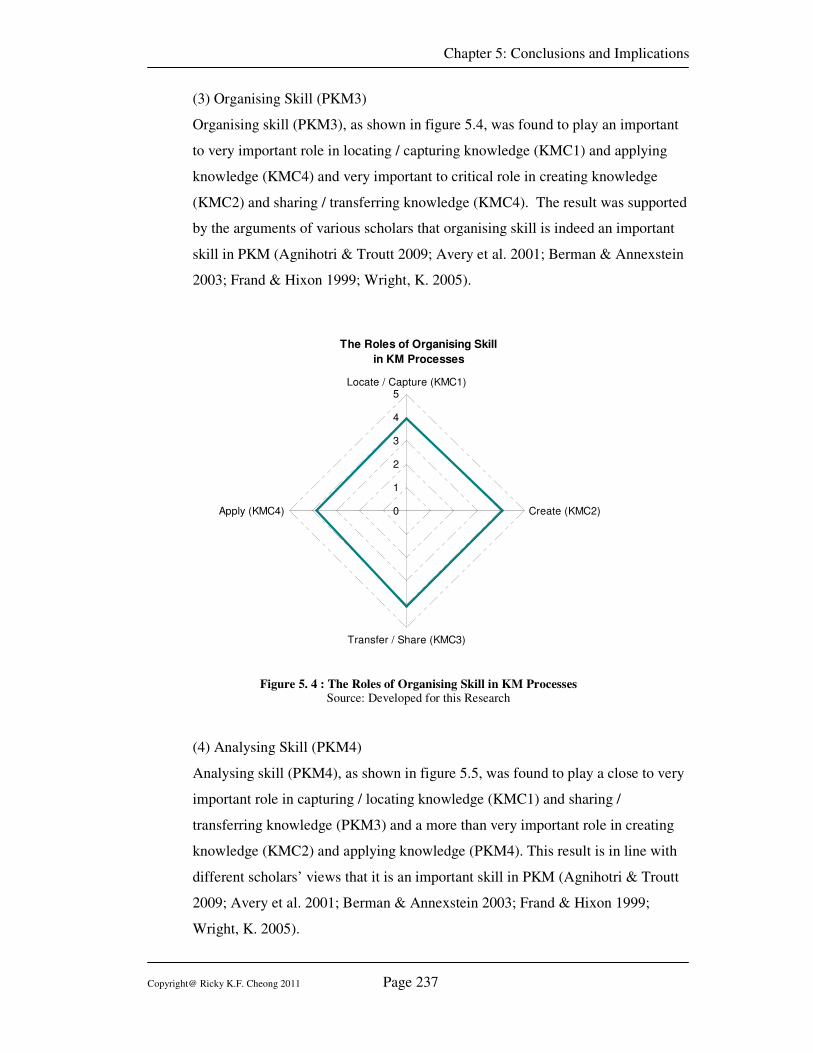
Chapter 5: Conclusions and Implications
Copyright@ Ricky K.F. Cheong 2011 Page 237
(3) Organising Skill (PKM3)
Organising skill (PKM3), as shown in figure 5.4, was found to play an important
to very important role in locating / capturing knowledge (KMC1) and applying
knowledge (KMC4) and very important to critical role in creating knowledge
(KMC2) and sharing / transferring knowledge (KMC4). The result was supported
by the arguments of various scholars that organising skill is indeed an important
skill in PKM (Agnihotri & Troutt 2009; Avery et al. 2001; Berman & Annexstein
2003; Frand & Hixon 1999; Wright, K. 2005).
The Roles of Organising Skill
in KM Processes
0
1
2
3
4
5Locate / Capture (KMC1)
Create (KMC2)
Transfer / Share (KMC3)
Apply (KMC4)
Figure 5. 4 : The Roles of Organising Skill in KM Processes Source: Developed for this Research
(4) Analysing Skill (PKM4)
Analysing skill (PKM4), as shown in figure 5.5, was found to play a close to very
important role in capturing / locating knowledge (KMC1) and sharing /
transferring knowledge (PKM3) and a more than very important role in creating
knowledge (KMC2) and applying knowledge (PKM4). This result is in line with
different scholars’ views that it is an important skill in PKM (Agnihotri & Troutt
2009; Avery et al. 2001; Berman & Annexstein 2003; Frand & Hixon 1999;
Wright, K. 2005).
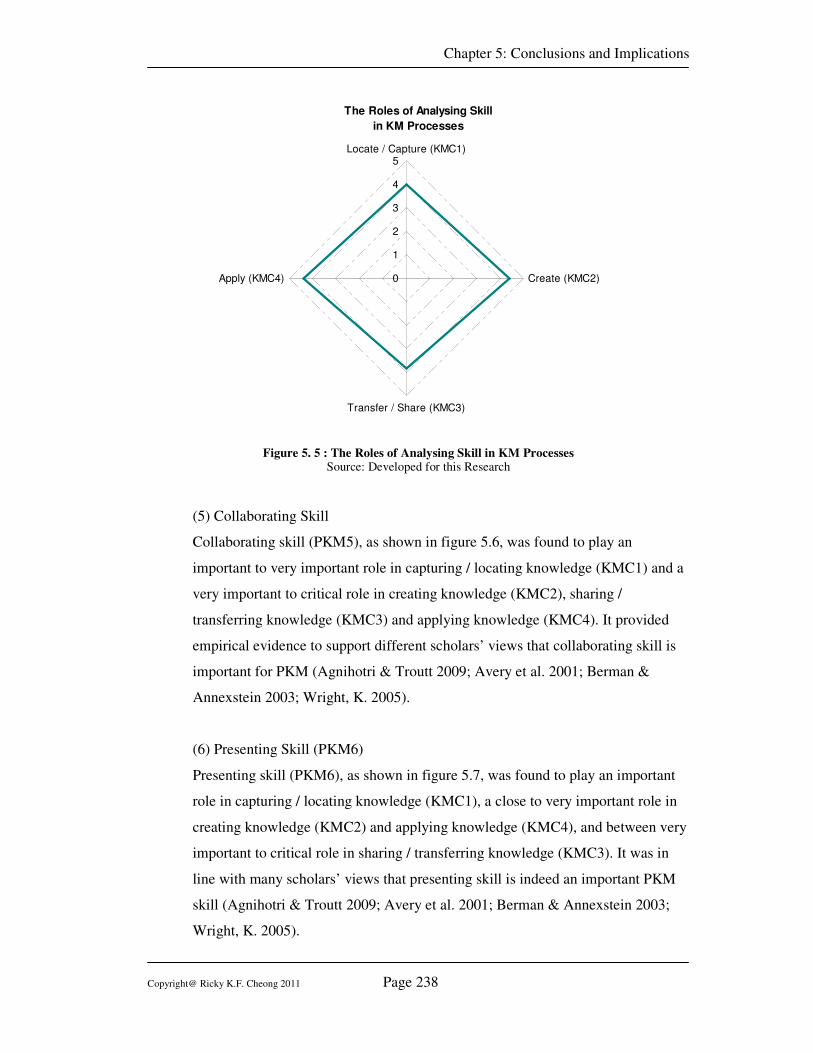
Chapter 5: Conclusions and Implications
Copyright@ Ricky K.F. Cheong 2011 Page 238
The Roles of Analysing Skill
in KM Processes
0
1
2
3
4
5Locate / Capture (KMC1)
Create (KMC2)
Transfer / Share (KMC3)
Apply (KMC4)
Figure 5. 5 : The Roles of Analysing Skill in KM Processes Source: Developed for this Research
(5) Collaborating Skill
Collaborating skill (PKM5), as shown in figure 5.6, was found to play an
important to very important role in capturing / locating knowledge (KMC1) and a
very important to critical role in creating knowledge (KMC2), sharing /
transferring knowledge (KMC3) and applying knowledge (KMC4). It provided
empirical evidence to support different scholars’ views that collaborating skill is
important for PKM (Agnihotri & Troutt 2009; Avery et al. 2001; Berman &
Annexstein 2003; Wright, K. 2005).
(6) Presenting Skill (PKM6)
Presenting skill (PKM6), as shown in figure 5.7, was found to play an important
role in capturing / locating knowledge (KMC1), a close to very important role in
creating knowledge (KMC2) and applying knowledge (KMC4), and between very
important to critical role in sharing / transferring knowledge (KMC3). It was in
line with many scholars’ views that presenting skill is indeed an important PKM
skill (Agnihotri & Troutt 2009; Avery et al. 2001; Berman & Annexstein 2003;
Wright, K. 2005).
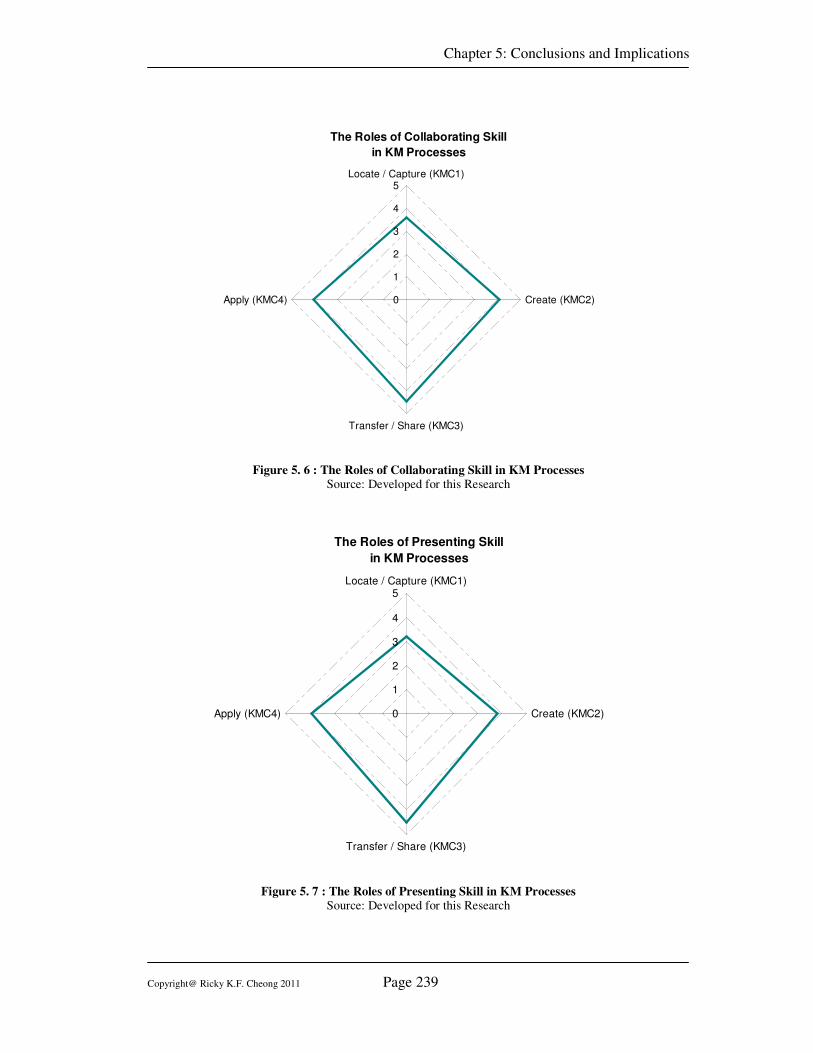
Chapter 5: Conclusions and Implications
Copyright@ Ricky K.F. Cheong 2011 Page 239
The Roles of Collaborating Skill
in KM Processes
0
1
2
3
4
5Locate / Capture (KMC1)
Create (KMC2)
Transfer / Share (KMC3)
Apply (KMC4)
Figure 5. 6 : The Roles of Collaborating Skill in KM Processes
Source: Developed for this Research
The Roles of Presenting Skill
in KM Processes
0
1
2
3
4
5Locate / Capture (KMC1)
Create (KMC2)
Transfer / Share (KMC3)
Apply (KMC4)
Figure 5. 7 : The Roles of Presenting Skill in KM Processes
Source: Developed for this Research
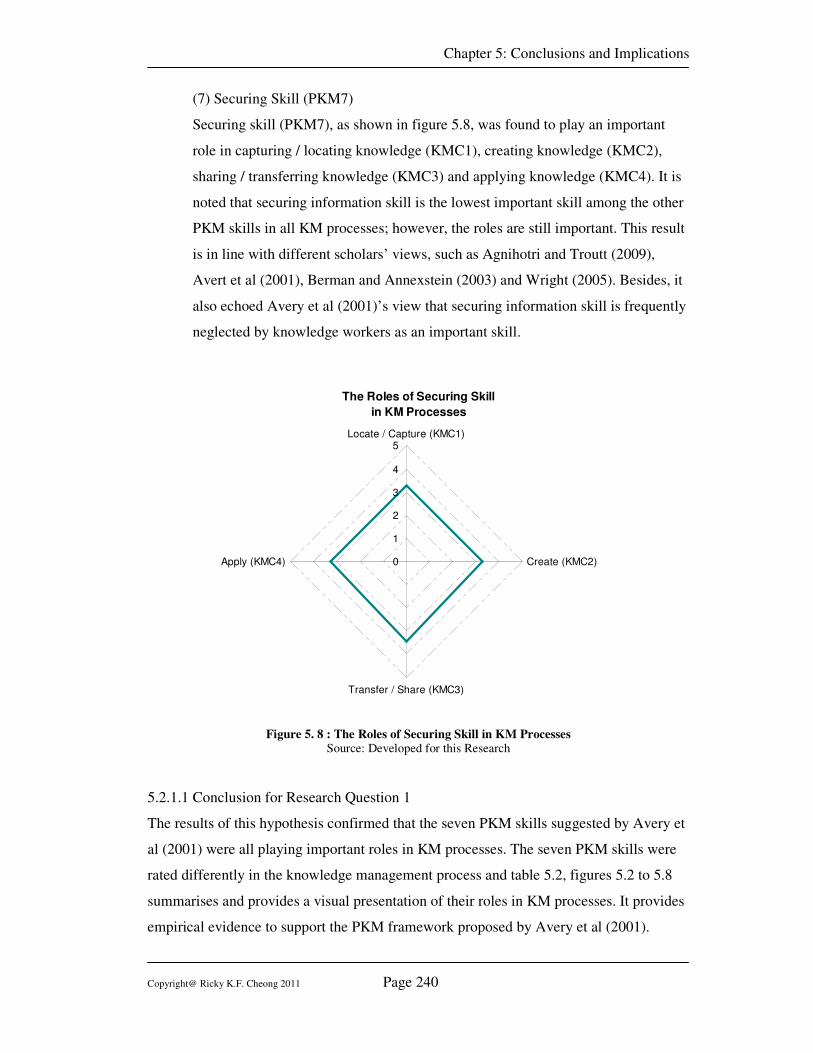
Chapter 5: Conclusions and Implications
Copyright@ Ricky K.F. Cheong 2011 Page 240
(7) Securing Skill (PKM7)
Securing skill (PKM7), as shown in figure 5.8, was found to play an important
role in capturing / locating knowledge (KMC1), creating knowledge (KMC2),
sharing / transferring knowledge (KMC3) and applying knowledge (KMC4). It is
noted that securing information skill is the lowest important skill among the other
PKM skills in all KM processes; however, the roles are still important. This result
is in line with different scholars’ views, such as Agnihotri and Troutt (2009),
Avert et al (2001), Berman and Annexstein (2003) and Wright (2005). Besides, it
also echoed Avery et al (2001)’s view that securing information skill is frequently
neglected by knowledge workers as an important skill.
The Roles of Securing Skill
in KM Processes
0
1
2
3
4
5Locate / Capture (KMC1)
Create (KMC2)
Transfer / Share (KMC3)
Apply (KMC4)
Figure 5. 8 : The Roles of Securing Skill in KM Processes
Source: Developed for this Research
5.2.1.1 Conclusion for Research Question 1
The results of this hypothesis confirmed that the seven PKM skills suggested by Avery et
al (2001) were all playing important roles in KM processes. The seven PKM skills were
rated differently in the knowledge management process and table 5.2, figures 5.2 to 5.8
summarises and provides a visual presentation of their roles in KM processes. It provides
empirical evidence to support the PKM framework proposed by Avery et al (2001).
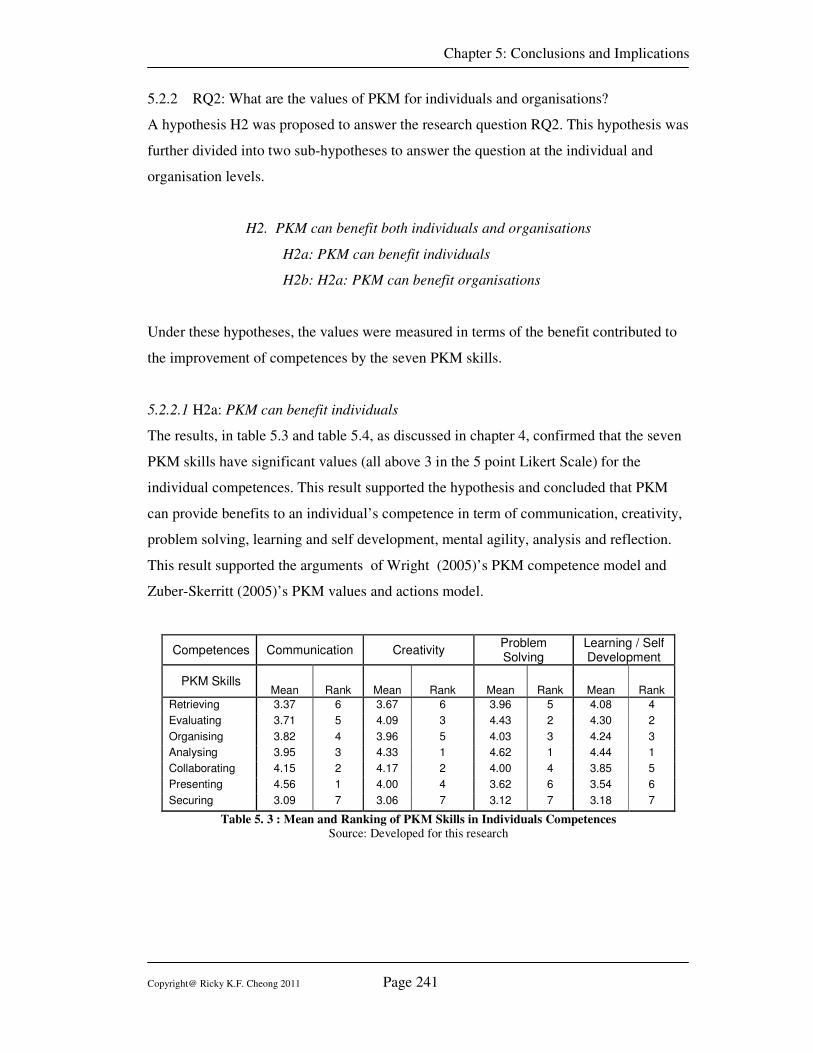
Chapter 5: Conclusions and Implications
Copyright@ Ricky K.F. Cheong 2011 Page 241
5.2.2 RQ2: What are the values of PKM for individuals and organisations?
A hypothesis H2 was proposed to answer the research question RQ2. This hypothesis was
further divided into two sub-hypotheses to answer the question at the individual and
organisation levels.
H2. PKM can benefit both individuals and organisations
H2a: PKM can benefit individuals
H2b: H2a: PKM can benefit organisations
Under these hypotheses, the values were measured in terms of the benefit contributed to
the improvement of competences by the seven PKM skills.
5.2.2.1 H2a: PKM can benefit individuals
The results, in table 5.3 and table 5.4, as discussed in chapter 4, confirmed that the seven
PKM skills have significant values (all above 3 in the 5 point Likert Scale) for the
individual competences. This result supported the hypothesis and concluded that PKM
can provide benefits to an individual’s competence in term of communication, creativity,
problem solving, learning and self development, mental agility, analysis and reflection.
This result supported the arguments of Wright (2005)’s PKM competence model and
Zuber-Skerritt (2005)’s PKM values and actions model.
Competences Communication Creativity Problem Solving
Learning / Self Development
PKM Skills Mean Rank Mean Rank Mean Rank Mean Rank
Retrieving 3.37 6 3.67 6 3.96 5 4.08 4
Evaluating 3.71 5 4.09 3 4.43 2 4.30 2
Organising 3.82 4 3.96 5 4.03 3 4.24 3
Analysing 3.95 3 4.33 1 4.62 1 4.44 1
Collaborating 4.15 2 4.17 2 4.00 4 3.85 5
Presenting 4.56 1 4.00 4 3.62 6 3.54 6
Securing 3.09 7 3.06 7 3.12 7 3.18 7
Table 5. 3 : Mean and Ranking of PKM Skills in Individuals Competences
Source: Developed for this research
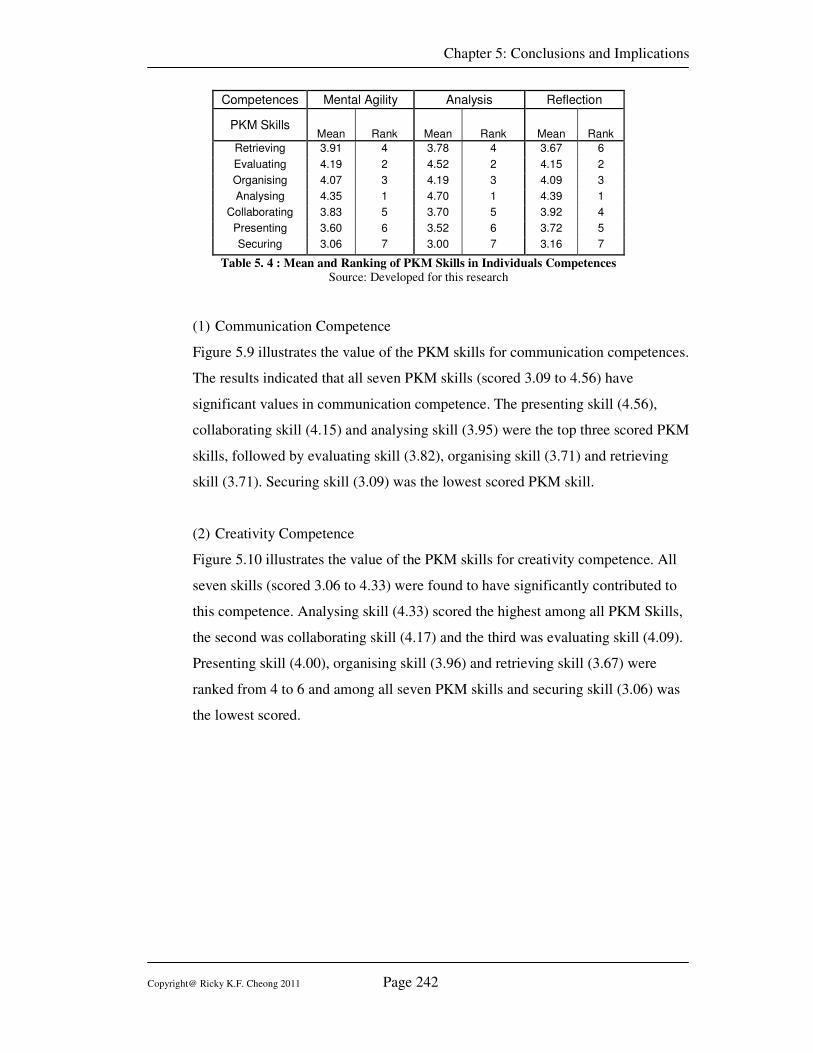
Chapter 5: Conclusions and Implications
Copyright@ Ricky K.F. Cheong 2011 Page 242
Competences Mental Agility Analysis Reflection
PKM Skills Mean Rank Mean Rank Mean Rank
Retrieving 3.91 4 3.78 4 3.67 6
Evaluating 4.19 2 4.52 2 4.15 2
Organising 4.07 3 4.19 3 4.09 3
Analysing 4.35 1 4.70 1 4.39 1
Collaborating 3.83 5 3.70 5 3.92 4
Presenting 3.60 6 3.52 6 3.72 5
Securing 3.06 7 3.00 7 3.16 7
Table 5. 4 : Mean and Ranking of PKM Skills in Individuals Competences
Source: Developed for this research
(1) Communication Competence
Figure 5.9 illustrates the value of the PKM skills for communication competences.
The results indicated that all seven PKM skills (scored 3.09 to 4.56) have
significant values in communication competence. The presenting skill (4.56),
collaborating skill (4.15) and analysing skill (3.95) were the top three scored PKM
skills, followed by evaluating skill (3.82), organising skill (3.71) and retrieving
skill (3.71). Securing skill (3.09) was the lowest scored PKM skill.
(2) Creativity Competence
Figure 5.10 illustrates the value of the PKM skills for creativity competence. All
seven skills (scored 3.06 to 4.33) were found to have significantly contributed to
this competence. Analysing skill (4.33) scored the highest among all PKM Skills,
the second was collaborating skill (4.17) and the third was evaluating skill (4.09).
Presenting skill (4.00), organising skill (3.96) and retrieving skill (3.67) were
ranked from 4 to 6 and among all seven PKM skills and securing skill (3.06) was
the lowest scored.
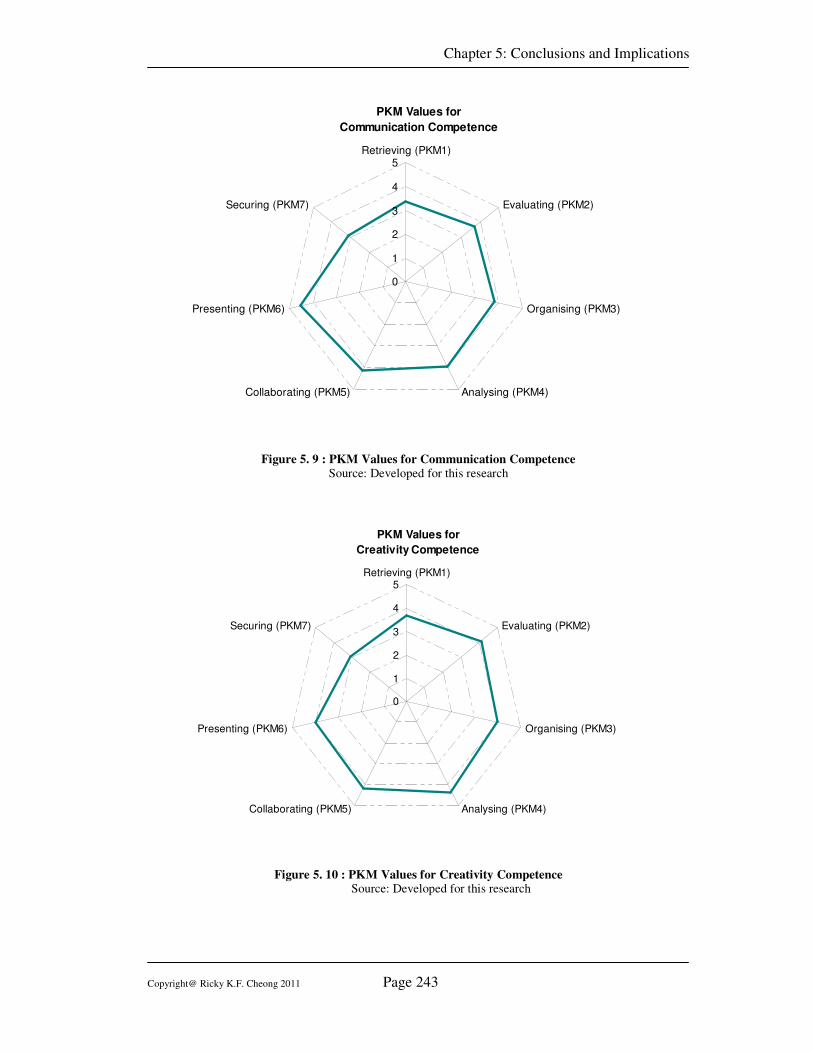
Chapter 5: Conclusions and Implications
Copyright@ Ricky K.F. Cheong 2011 Page 243
PKM Values for
Communication Competence
0
1
2
3
4
5Retrieving (PKM1)
Evaluating (PKM2)
Organising (PKM3)
Analysing (PKM4)Collaborating (PKM5)
Presenting (PKM6)
Securing (PKM7)
Figure 5. 9 : PKM Values for Communication Competence
Source: Developed for this research
PKM Values for
Creativity Competence
0
1
2
3
4
5Retrieving (PKM1)
Evaluating (PKM2)
Organising (PKM3)
Analysing (PKM4)Collaborating (PKM5)
Presenting (PKM6)
Securing (PKM7)
Figure 5. 10 : PKM Values for Creativity Competence Source: Developed for this research
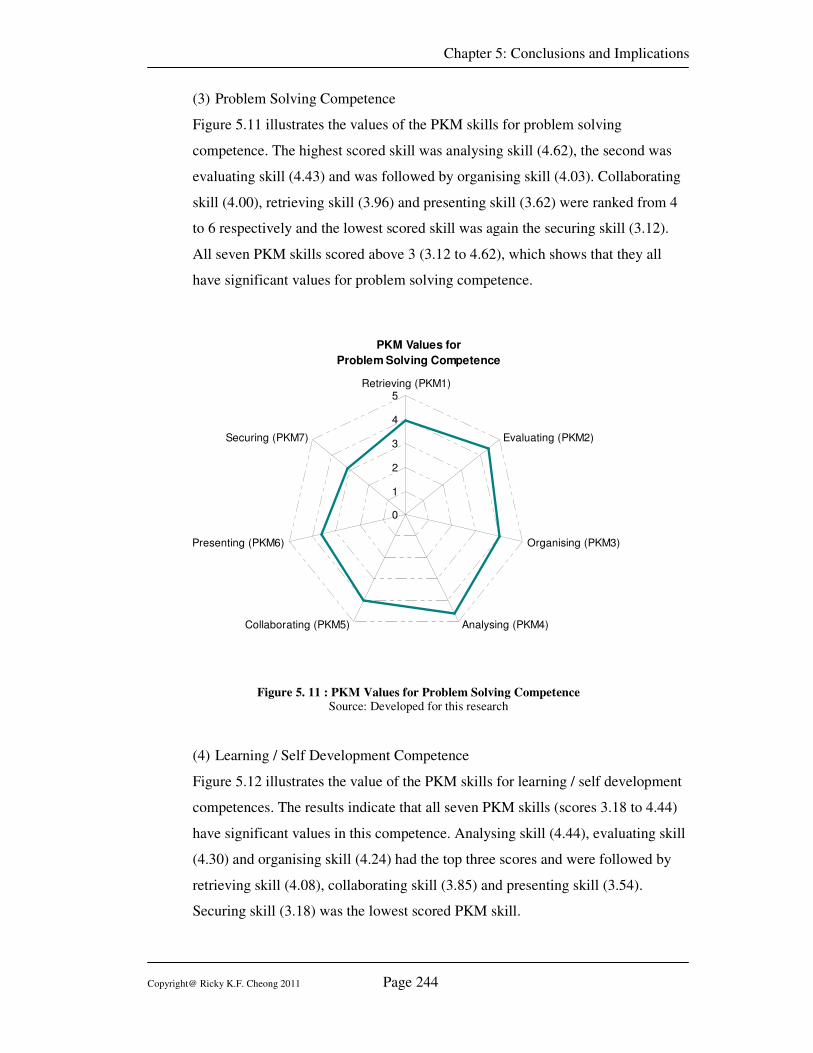
Chapter 5: Conclusions and Implications
Copyright@ Ricky K.F. Cheong 2011 Page 244
(3) Problem Solving Competence
Figure 5.11 illustrates the values of the PKM skills for problem solving
competence. The highest scored skill was analysing skill (4.62), the second was
evaluating skill (4.43) and was followed by organising skill (4.03). Collaborating
skill (4.00), retrieving skill (3.96) and presenting skill (3.62) were ranked from 4
to 6 respectively and the lowest scored skill was again the securing skill (3.12).
All seven PKM skills scored above 3 (3.12 to 4.62), which shows that they all
have significant values for problem solving competence.
PKM Values for
Problem Solving Competence
0
1
2
3
4
5Retrieving (PKM1)
Evaluating (PKM2)
Organising (PKM3)
Analysing (PKM4)Collaborating (PKM5)
Presenting (PKM6)
Securing (PKM7)
Figure 5. 11 : PKM Values for Problem Solving Competence Source: Developed for this research
(4) Learning / Self Development Competence
Figure 5.12 illustrates the value of the PKM skills for learning / self development
competences. The results indicate that all seven PKM skills (scores 3.18 to 4.44)
have significant values in this competence. Analysing skill (4.44), evaluating skill
(4.30) and organising skill (4.24) had the top three scores and were followed by
retrieving skill (4.08), collaborating skill (3.85) and presenting skill (3.54).
Securing skill (3.18) was the lowest scored PKM skill.
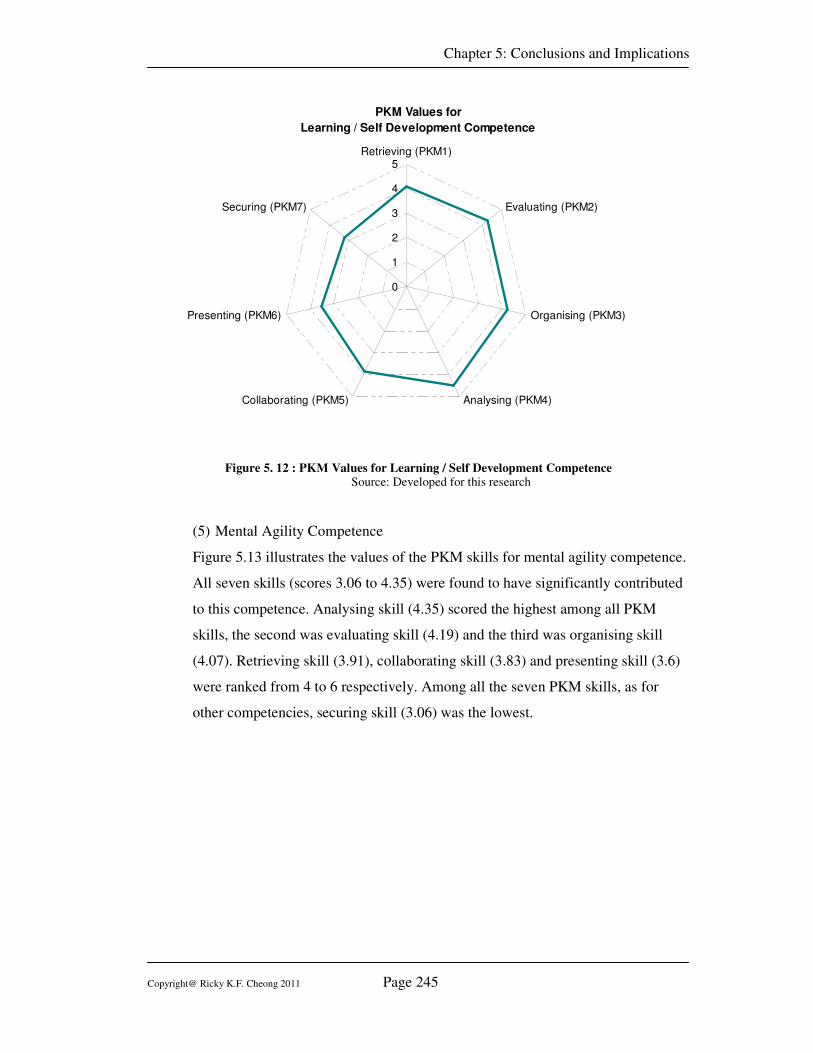
Chapter 5: Conclusions and Implications
Copyright@ Ricky K.F. Cheong 2011 Page 245
PKM Values for
Learning / Self Development Competence
0
1
2
3
4
5Retrieving (PKM1)
Evaluating (PKM2)
Organising (PKM3)
Analysing (PKM4)Collaborating (PKM5)
Presenting (PKM6)
Securing (PKM7)
Figure 5. 12 : PKM Values for Learning / Self Development Competence Source: Developed for this research
(5) Mental Agility Competence
Figure 5.13 illustrates the values of the PKM skills for mental agility competence.
All seven skills (scores 3.06 to 4.35) were found to have significantly contributed
to this competence. Analysing skill (4.35) scored the highest among all PKM
skills, the second was evaluating skill (4.19) and the third was organising skill
(4.07). Retrieving skill (3.91), collaborating skill (3.83) and presenting skill (3.6)
were ranked from 4 to 6 respectively. Among all the seven PKM skills, as for
other competencies, securing skill (3.06) was the lowest.
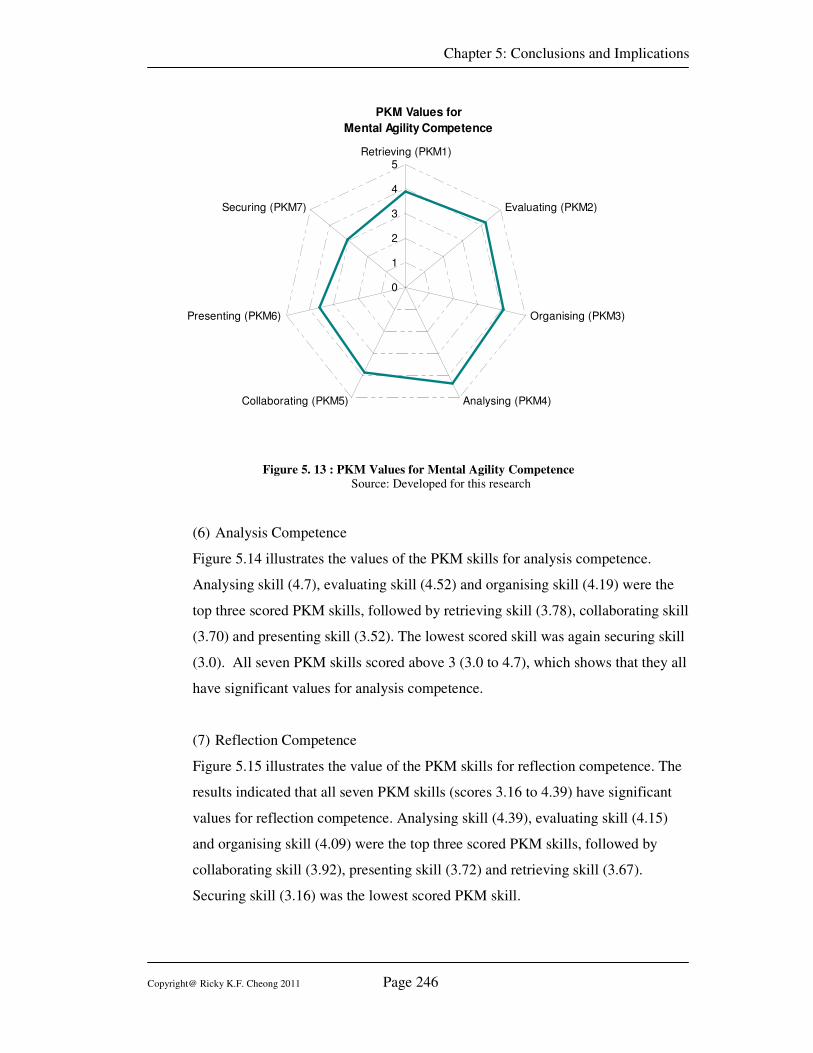
Chapter 5: Conclusions and Implications
Copyright@ Ricky K.F. Cheong 2011 Page 246
PKM Values for
Mental Agility Competence
0
1
2
3
4
5Retrieving (PKM1)
Evaluating (PKM2)
Organising (PKM3)
Analysing (PKM4)Collaborating (PKM5)
Presenting (PKM6)
Securing (PKM7)
Figure 5. 13 : PKM Values for Mental Agility Competence
Source: Developed for this research
(6) Analysis Competence
Figure 5.14 illustrates the values of the PKM skills for analysis competence.
Analysing skill (4.7), evaluating skill (4.52) and organising skill (4.19) were the
top three scored PKM skills, followed by retrieving skill (3.78), collaborating skill
(3.70) and presenting skill (3.52). The lowest scored skill was again securing skill
(3.0). All seven PKM skills scored above 3 (3.0 to 4.7), which shows that they all
have significant values for analysis competence.
(7) Reflection Competence
Figure 5.15 illustrates the value of the PKM skills for reflection competence. The
results indicated that all seven PKM skills (scores 3.16 to 4.39) have significant
values for reflection competence. Analysing skill (4.39), evaluating skill (4.15)
and organising skill (4.09) were the top three scored PKM skills, followed by
collaborating skill (3.92), presenting skill (3.72) and retrieving skill (3.67).
Securing skill (3.16) was the lowest scored PKM skill.
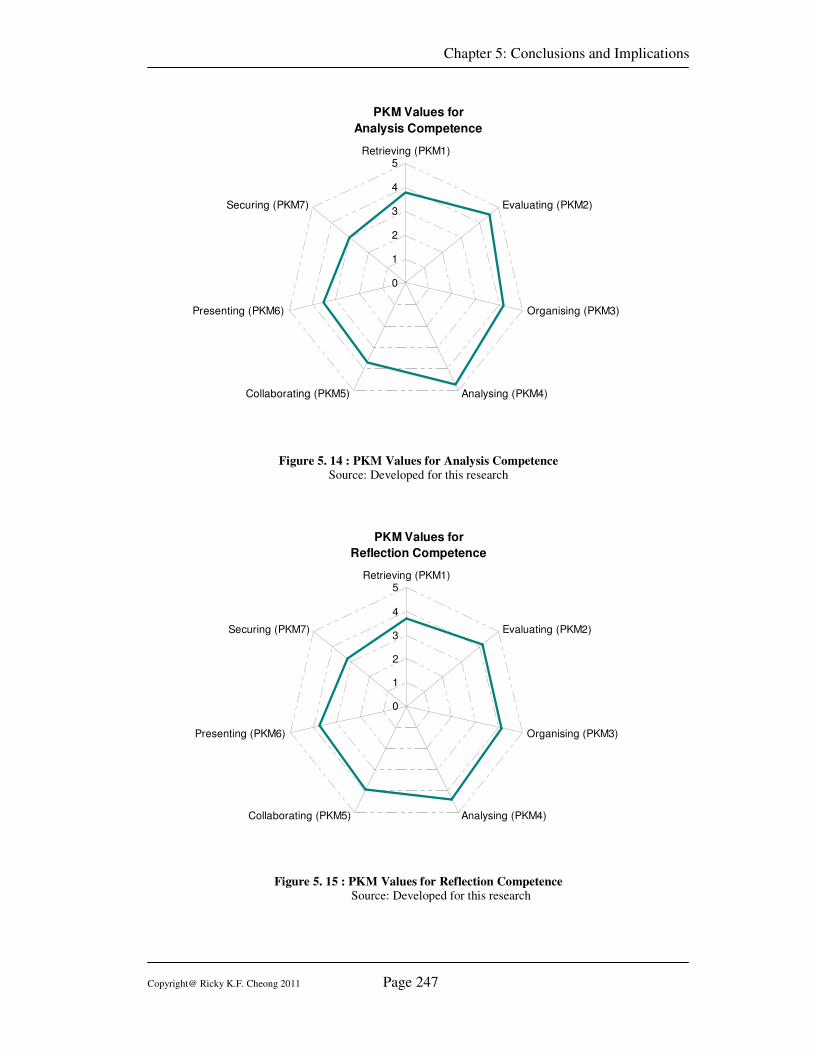
Chapter 5: Conclusions and Implications
Copyright@ Ricky K.F. Cheong 2011 Page 247
PKM Values for
Analysis Competence
0
1
2
3
4
5Retrieving (PKM1)
Evaluating (PKM2)
Organising (PKM3)
Analysing (PKM4)Collaborating (PKM5)
Presenting (PKM6)
Securing (PKM7)
Figure 5. 14 : PKM Values for Analysis Competence
Source: Developed for this research
PKM Values for
Reflection Competence
0
1
2
3
4
5Retrieving (PKM1)
Evaluating (PKM2)
Organising (PKM3)
Analysing (PKM4)Collaborating (PKM5)
Presenting (PKM6)
Securing (PKM7)
Figure 5. 15 : PKM Values for Reflection Competence
Source: Developed for this research
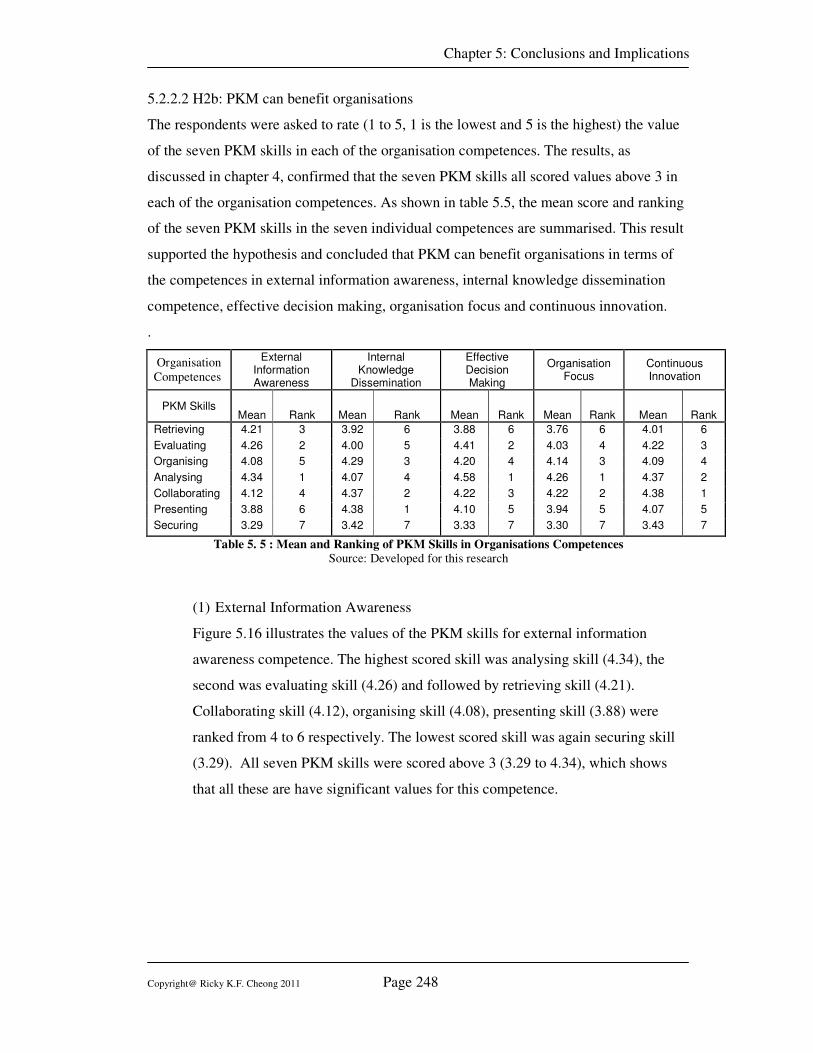
Chapter 5: Conclusions and Implications
Copyright@ Ricky K.F. Cheong 2011 Page 248
5.2.2.2 H2b: PKM can benefit organisations
The respondents were asked to rate (1 to 5, 1 is the lowest and 5 is the highest) the value
of the seven PKM skills in each of the organisation competences. The results, as
discussed in chapter 4, confirmed that the seven PKM skills all scored values above 3 in
each of the organisation competences. As shown in table 5.5, the mean score and ranking
of the seven PKM skills in the seven individual competences are summarised. This result
supported the hypothesis and concluded that PKM can benefit organisations in terms of
the competences in external information awareness, internal knowledge dissemination
competence, effective decision making, organisation focus and continuous innovation.
.
Organisation
Competences
External Information Awareness
Internal Knowledge
Dissemination
Effective Decision Making
Organisation Focus
Continuous Innovation
PKM Skills Mean Rank Mean Rank Mean Rank Mean Rank Mean Rank
Retrieving 4.21 3 3.92 6 3.88 6 3.76 6 4.01 6
Evaluating 4.26 2 4.00 5 4.41 2 4.03 4 4.22 3
Organising 4.08 5 4.29 3 4.20 4 4.14 3 4.09 4
Analysing 4.34 1 4.07 4 4.58 1 4.26 1 4.37 2
Collaborating 4.12 4 4.37 2 4.22 3 4.22 2 4.38 1
Presenting 3.88 6 4.38 1 4.10 5 3.94 5 4.07 5
Securing 3.29 7 3.42 7 3.33 7 3.30 7 3.43 7
Table 5. 5 : Mean and Ranking of PKM Skills in Organisations Competences
Source: Developed for this research
(1) External Information Awareness
Figure 5.16 illustrates the values of the PKM skills for external information
awareness competence. The highest scored skill was analysing skill (4.34), the
second was evaluating skill (4.26) and followed by retrieving skill (4.21).
Collaborating skill (4.12), organising skill (4.08), presenting skill (3.88) were
ranked from 4 to 6 respectively. The lowest scored skill was again securing skill
(3.29). All seven PKM skills were scored above 3 (3.29 to 4.34), which shows
that all these are have significant values for this competence.
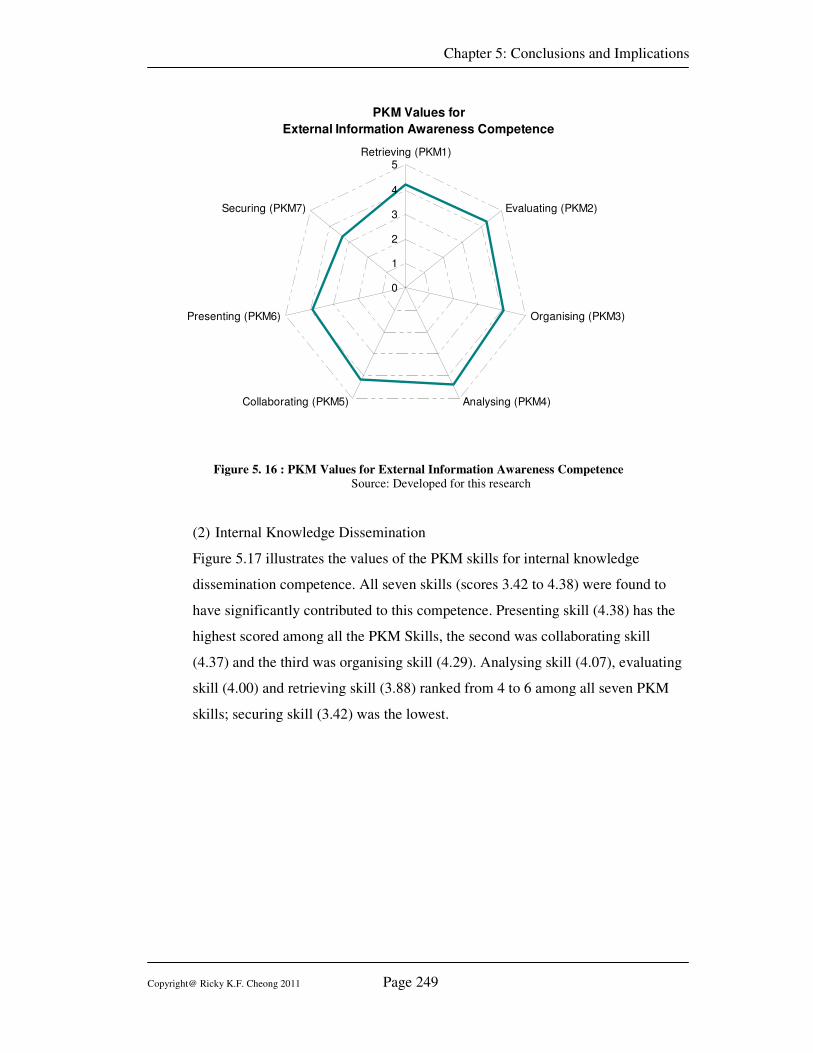
Chapter 5: Conclusions and Implications
Copyright@ Ricky K.F. Cheong 2011 Page 249
PKM Values for
External Information Awareness Competence
0
1
2
3
4
5Retrieving (PKM1)
Evaluating (PKM2)
Organising (PKM3)
Analysing (PKM4)Collaborating (PKM5)
Presenting (PKM6)
Securing (PKM7)
Figure 5. 16 : PKM Values for External Information Awareness Competence
Source: Developed for this research
(2) Internal Knowledge Dissemination
Figure 5.17 illustrates the values of the PKM skills for internal knowledge
dissemination competence. All seven skills (scores 3.42 to 4.38) were found to
have significantly contributed to this competence. Presenting skill (4.38) has the
highest scored among all the PKM Skills, the second was collaborating skill
(4.37) and the third was organising skill (4.29). Analysing skill (4.07), evaluating
skill (4.00) and retrieving skill (3.88) ranked from 4 to 6 among all seven PKM
skills; securing skill (3.42) was the lowest.
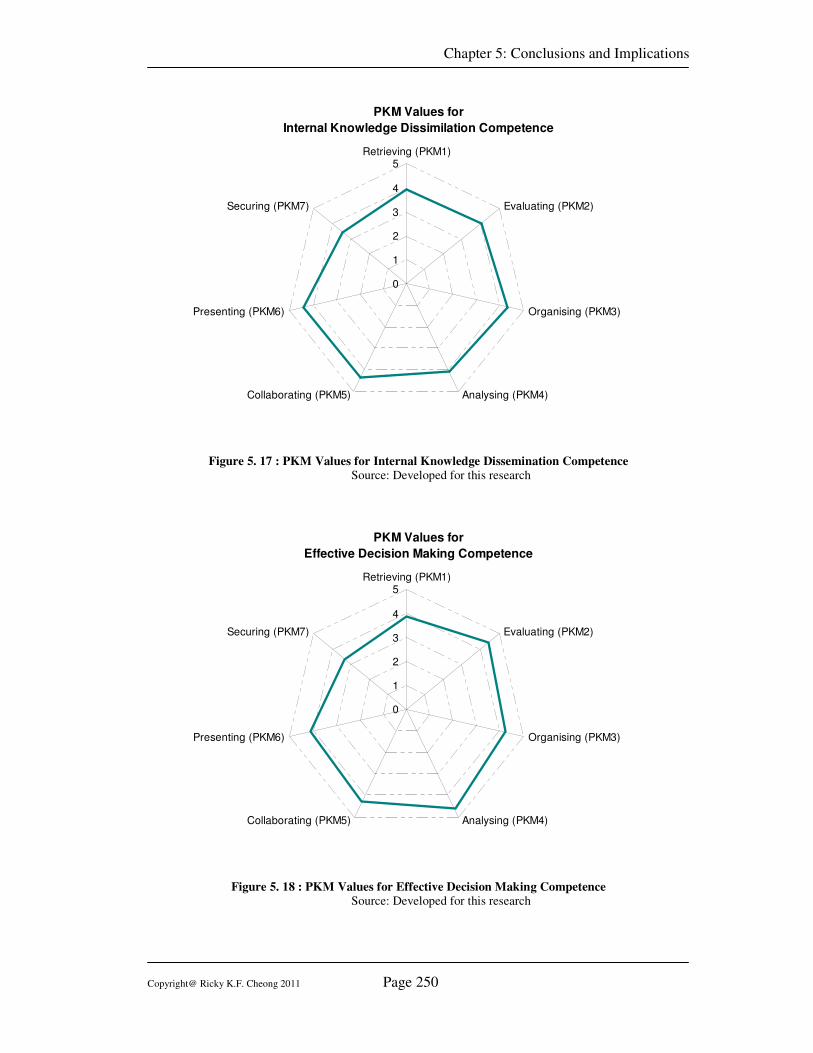
Chapter 5: Conclusions and Implications
Copyright@ Ricky K.F. Cheong 2011 Page 250
PKM Values for
Internal Knowledge Dissimilation Competence
0
1
2
3
4
5Retrieving (PKM1)
Evaluating (PKM2)
Organising (PKM3)
Analysing (PKM4)Collaborating (PKM5)
Presenting (PKM6)
Securing (PKM7)
Figure 5. 17 : PKM Values for Internal Knowledge Dissemination Competence
Source: Developed for this research
PKM Values for
Effective Decision Making Competence
0
1
2
3
4
5Retrieving (PKM1)
Evaluating (PKM2)
Organising (PKM3)
Analysing (PKM4)Collaborating (PKM5)
Presenting (PKM6)
Securing (PKM7)
Figure 5. 18 : PKM Values for Effective Decision Making Competence
Source: Developed for this research
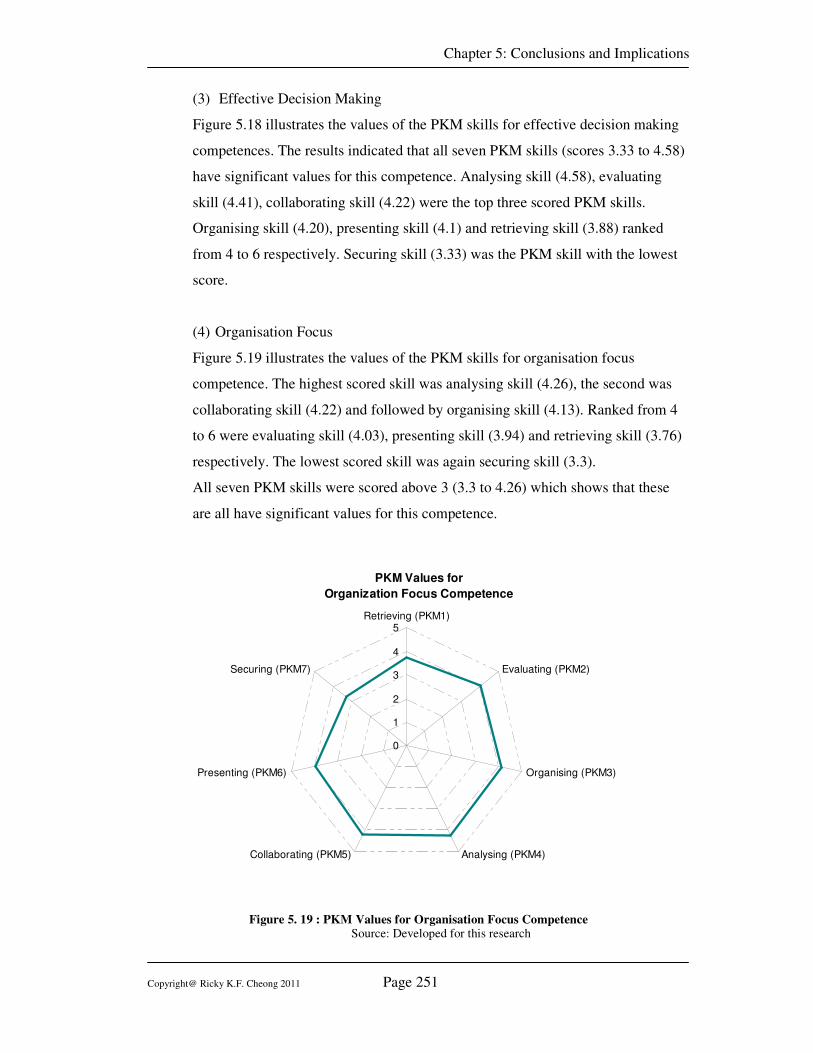
Chapter 5: Conclusions and Implications
Copyright@ Ricky K.F. Cheong 2011 Page 251
(3) Effective Decision Making
Figure 5.18 illustrates the values of the PKM skills for effective decision making
competences. The results indicated that all seven PKM skills (scores 3.33 to 4.58)
have significant values for this competence. Analysing skill (4.58), evaluating
skill (4.41), collaborating skill (4.22) were the top three scored PKM skills.
Organising skill (4.20), presenting skill (4.1) and retrieving skill (3.88) ranked
from 4 to 6 respectively. Securing skill (3.33) was the PKM skill with the lowest
score.
(4) Organisation Focus
Figure 5.19 illustrates the values of the PKM skills for organisation focus
competence. The highest scored skill was analysing skill (4.26), the second was
collaborating skill (4.22) and followed by organising skill (4.13). Ranked from 4
to 6 were evaluating skill (4.03), presenting skill (3.94) and retrieving skill (3.76)
respectively. The lowest scored skill was again securing skill (3.3).
All seven PKM skills were scored above 3 (3.3 to 4.26) which shows that these
are all have significant values for this competence.
PKM Values for
Organization Focus Competence
0
1
2
3
4
5Retrieving (PKM1)
Evaluating (PKM2)
Organising (PKM3)
Analysing (PKM4)Collaborating (PKM5)
Presenting (PKM6)
Securing (PKM7)
Figure 5. 19 : PKM Values for Organisation Focus Competence Source: Developed for this research
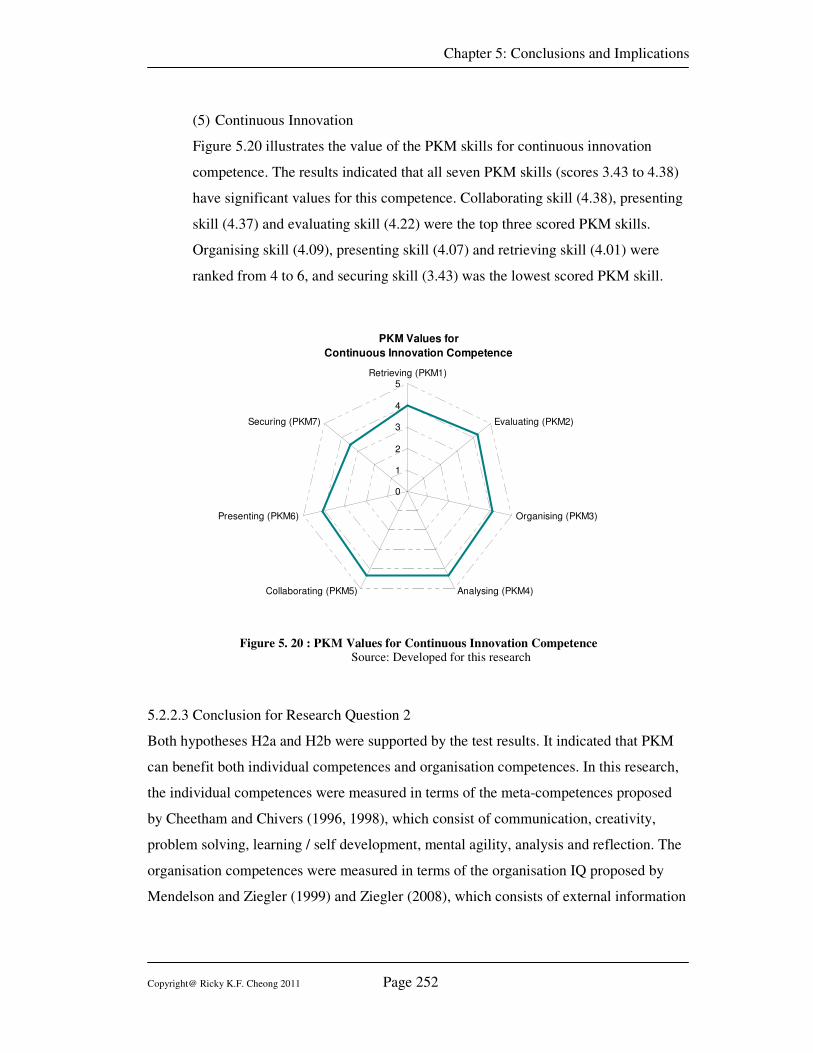
Chapter 5: Conclusions and Implications
Copyright@ Ricky K.F. Cheong 2011 Page 252
(5) Continuous Innovation
Figure 5.20 illustrates the value of the PKM skills for continuous innovation
competence. The results indicated that all seven PKM skills (scores 3.43 to 4.38)
have significant values for this competence. Collaborating skill (4.38), presenting
skill (4.37) and evaluating skill (4.22) were the top three scored PKM skills.
Organising skill (4.09), presenting skill (4.07) and retrieving skill (4.01) were
ranked from 4 to 6, and securing skill (3.43) was the lowest scored PKM skill.
PKM Values for
Continuous Innovation Competence
0
1
2
3
4
5Retrieving (PKM1)
Evaluating (PKM2)
Organising (PKM3)
Analysing (PKM4)Collaborating (PKM5)
Presenting (PKM6)
Securing (PKM7)
Figure 5. 20 : PKM Values for Continuous Innovation Competence
Source: Developed for this research
5.2.2.3 Conclusion for Research Question 2
Both hypotheses H2a and H2b were supported by the test results. It indicated that PKM
can benefit both individual competences and organisation competences. In this research,
the individual competences were measured in terms of the meta-competences proposed
by Cheetham and Chivers (1996, 1998), which consist of communication, creativity,
problem solving, learning / self development, mental agility, analysis and reflection. The
organisation competences were measured in terms of the organisation IQ proposed by
Mendelson and Ziegler (1999) and Ziegler (2008), which consists of external information
Chapter 5: Conclusions and Implications
Copyright@ Ricky K.F. Cheong 2011 Page 253
awareness, internal knowledge dissemination, effective decision making, organisation
focus and continuous innovation.
5.2.3 RQ3: Is there any correlation between the roles of PKM in the KM Process and
the values of PKM for individuals and organisations?
Two hypotheses H3 and H4 were proposed to answer the research question RQ3. These 2
hypotheses were further divided into 14 sub-hypotheses (H3a to H3g and H4a to H4g) to
answer the question at the individual and organisation levels.
H3 - The values of PKM for individuals are positively correlated to the roles of
PKM skills in the KM process.
H4 - The values of PKM for organisations are positively correlated to the roles of
PKM skills in the KM process.
As discussed in chapter 4, these two hypotheses were tested by simple regression analysis
and structural equation modelling analysis. The simple regression was done by ANOVA
test on each of the sub-hypotheses (each PKM skill) and the structural equation modelling
provided a holistic view of the relationship.
5.2.3.1 H3: The values of PKM for individuals are positively correlated to the roles of
PKM skills in the KM process.
There are seven sub-hypotheses for this main hypothesis to test the strength of the
relationships in each PKM skill. The analyses were performed by ANOVA and SEM, as
described in chapter 4. The results supported this hypothesis and indicated that the value
of each PKM skill in individual competences has a significant relationship and was
positively correlated to their roles in the KM processes. This implies that the more
important the role of the PKM skill in a KM process, the higher the values for the
individual competences.
The strength of the correlations tested by ANOVA in terms of R2 are summarised in table
5.6 below and denote the percentage (30% to 57.7%) of the PKM skill’s values in
individuals competence (dependent variables), as explained by the roles played in the KM
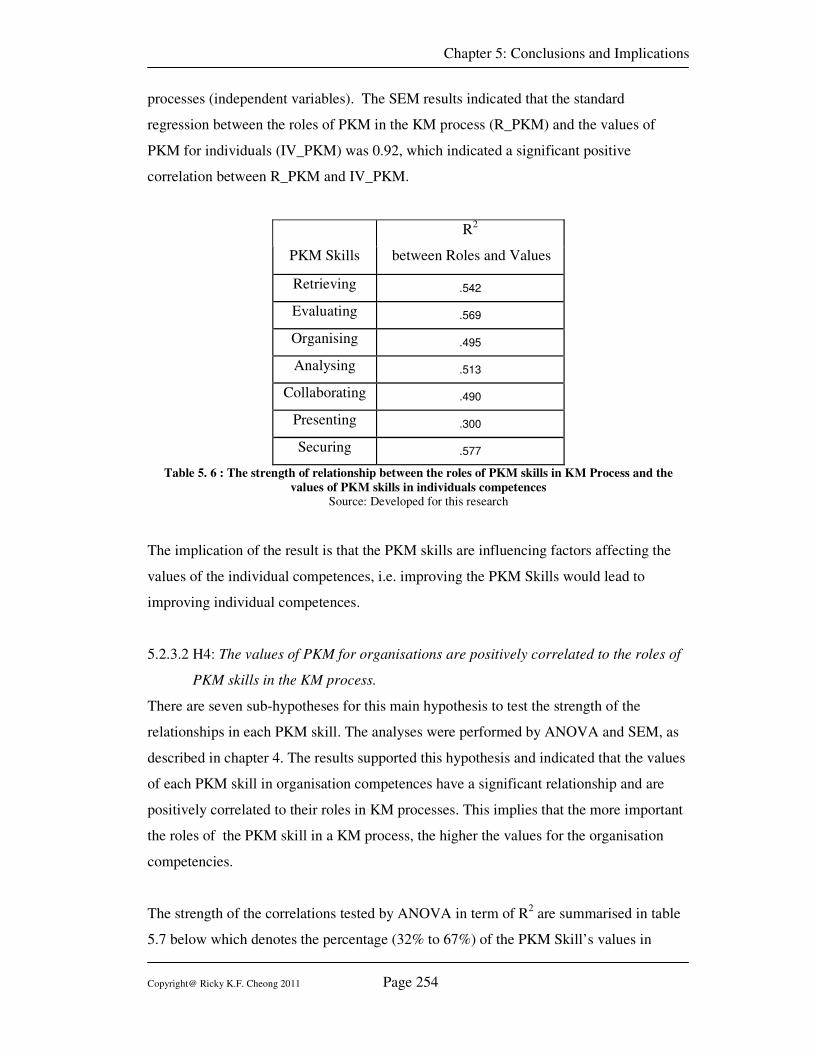
Chapter 5: Conclusions and Implications
Copyright@ Ricky K.F. Cheong 2011 Page 254
processes (independent variables). The SEM results indicated that the standard
regression between the roles of PKM in the KM process (R_PKM) and the values of
PKM for individuals (IV_PKM) was 0.92, which indicated a significant positive
correlation between R_PKM and IV_PKM.
PKM Skills
R2
between Roles and Values
Retrieving .542
Evaluating .569
Organising .495
Analysing .513
Collaborating .490
Presenting .300
Securing .577
Table 5. 6 : The strength of relationship between the roles of PKM skills in KM Process and the
values of PKM skills in individuals competences
Source: Developed for this research
The implication of the result is that the PKM skills are influencing factors affecting the
values of the individual competences, i.e. improving the PKM Skills would lead to
improving individual competences.
5.2.3.2 H4: The values of PKM for organisations are positively correlated to the roles of
PKM skills in the KM process.
There are seven sub-hypotheses for this main hypothesis to test the strength of the
relationships in each PKM skill. The analyses were performed by ANOVA and SEM, as
described in chapter 4. The results supported this hypothesis and indicated that the values
of each PKM skill in organisation competences have a significant relationship and are
positively correlated to their roles in KM processes. This implies that the more important
the roles of the PKM skill in a KM process, the higher the values for the organisation
competencies.
The strength of the correlations tested by ANOVA in term of R2 are summarised in table
5.7 below which denotes the percentage (32% to 67%) of the PKM Skill’s values in
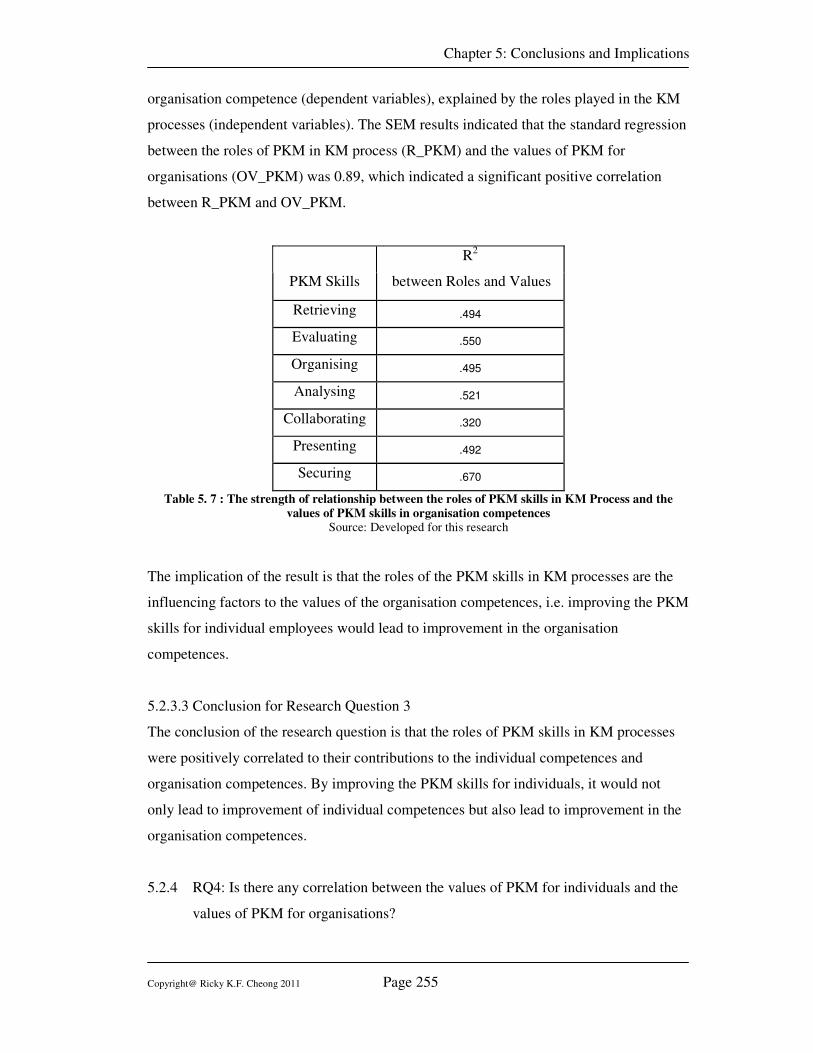
Chapter 5: Conclusions and Implications
Copyright@ Ricky K.F. Cheong 2011 Page 255
organisation competence (dependent variables), explained by the roles played in the KM
processes (independent variables). The SEM results indicated that the standard regression
between the roles of PKM in KM process (R_PKM) and the values of PKM for
organisations (OV_PKM) was 0.89, which indicated a significant positive correlation
between R_PKM and OV_PKM.
PKM Skills
R2
between Roles and Values
Retrieving .494
Evaluating .550
Organising .495
Analysing .521
Collaborating .320
Presenting .492
Securing .670
Table 5. 7 : The strength of relationship between the roles of PKM skills in KM Process and the
values of PKM skills in organisation competences
Source: Developed for this research
The implication of the result is that the roles of the PKM skills in KM processes are the
influencing factors to the values of the organisation competences, i.e. improving the PKM
skills for individual employees would lead to improvement in the organisation
competences.
5.2.3.3 Conclusion for Research Question 3
The conclusion of the research question is that the roles of PKM skills in KM processes
were positively correlated to their contributions to the individual competences and
organisation competences. By improving the PKM skills for individuals, it would not
only lead to improvement of individual competences but also lead to improvement in the
organisation competences.
5.2.4 RQ4: Is there any correlation between the values of PKM for individuals and the
values of PKM for organisations?
Chapter 5: Conclusions and Implications
Copyright@ Ricky K.F. Cheong 2011 Page 256
Hypothesis H5 was proposed to answer the research question RQ4. This hypothesis was
further divided into 7 sub-hypotheses (H5a to H5g) to answer the question at the
individual and organisation levels.
H5 - The values of PKM for individuals are positively correlated to the values of
PKM for the organisation.
As discussed in chapter 4, the hypotheses were tested by simple regression analysis and
structural equation modelling analysis. The simple regression was done by ANOVA
testing on each of the sub-hypotheses (each PKM skill), and the structural equation
modelling provided a holistic view of the relationship.
The results were presented in chapter 4 which supported the proposed hypotheses. It
indicated that the value of each PKM skill for individual competences has a significant
relationship and was positively correlated to their values for organisation competences. It
also implied that the benefits of PKM skills for organisation competences were
contributed by the benefits of PKM skills for individual competences.
The strengths of the correlations in term of R2 are summarised in table 5.8 below which
denotes the percentage (32% 5o 67%) of the PKM skill’s values in organisation
competence (dependent variables) explained by the roles played in the KM processes
(independent variables). The SEM results showed that the standard regression between
the values of PKM for individuals (IV_PKM) and the values of PKM for organisations
(OV_PKM) was 0.64, which indicated a significant positive correlation between
IV_PKM and OV_PKM.
From the SEM analysis, there were two models tested, as shown in figure 5.21. The first
model neglected the relationship between the IV_PKM and OV_PKM and the second
model connected these two latent variables together. By comparing the results between
the first model and second model, it was noticed that the standard regression coefficient
between the R_PKM and OV_PKM changed from 0.89 to 0.28 and to 0.64 between
IV_PKM and OV_PKM. Model 2 also indicated that the standard regression coefficient
of OV_PKM between IV_PKM (0.64) was greater than between R_PKM (0.28). The
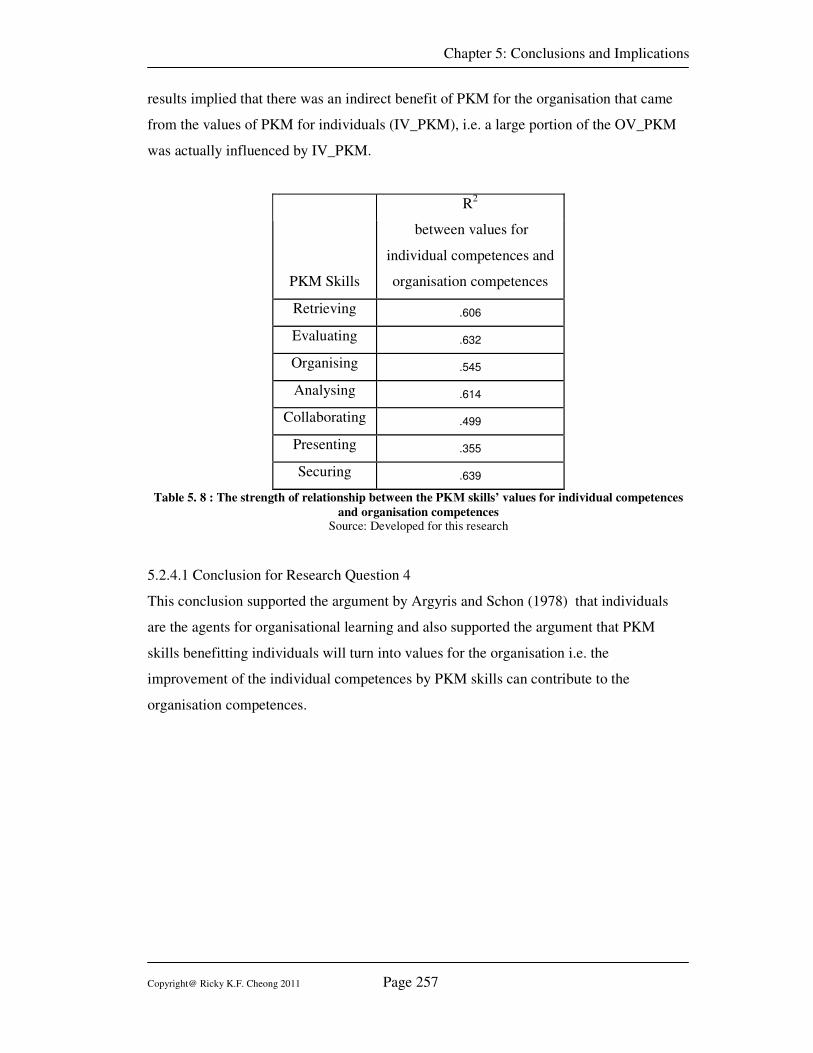
Chapter 5: Conclusions and Implications
Copyright@ Ricky K.F. Cheong 2011 Page 257
results implied that there was an indirect benefit of PKM for the organisation that came
from the values of PKM for individuals (IV_PKM), i.e. a large portion of the OV_PKM
was actually influenced by IV_PKM.
PKM Skills
R2
between values for
individual competences and
organisation competences
Retrieving .606
Evaluating .632
Organising .545
Analysing .614
Collaborating .499
Presenting .355
Securing .639
Table 5. 8 : The strength of relationship between the PKM skills’ values for individual competences
and organisation competences Source: Developed for this research
5.2.4.1 Conclusion for Research Question 4
This conclusion supported the argument by Argyris and Schon (1978) that individuals
are the agents for organisational learning and also supported the argument that PKM
skills benefitting individuals will turn into values for the organisation i.e. the
improvement of the individual competences by PKM skills can contribute to the
organisation competences.
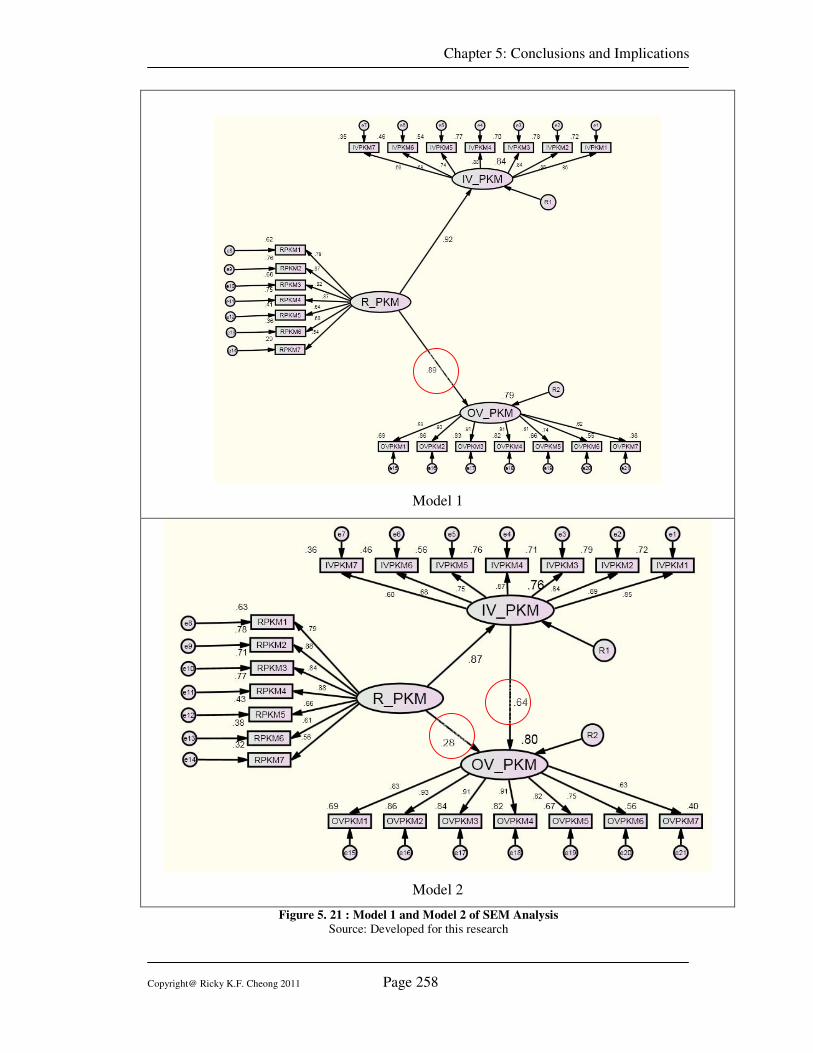
Chapter 5: Conclusions and Implications
Copyright@ Ricky K.F. Cheong 2011 Page 258
Model 1
Model 2
Figure 5. 21 : Model 1 and Model 2 of SEM Analysis
Source: Developed for this research
Chapter 5: Conclusions and Implications
Copyright@ Ricky K.F. Cheong 2011 Page 259
5.2.5 Summary of the Research Questions Conclusion
There were four research questions answered in this thesis. The research questions were
defined to provide in-depth understanding of the roles of PKM and the values of PKM for
both individuals and organisations. In summary, the research findings concluded that
PKM has important roles in KM processes (section 5.2.1). The values of PKM were
found to have significant contribution (section 5.2.2) in both individual competences and
organisational competences. Positive correlations were found between the roles of PKM
and their values in contributing to individual competences and organisation competences
(section 5.2.3), and also between the values of PKM for individual competences and the
values of PKM for organisation competences (section 5.2.4).
These conclusions have impact on the future of PKM research as well as providing a
significant contribution to both theory and practice in the field of PKM.
5.3 Research Implications
This section outlines the implications of the findings from this research for the
development of theory, policy and practice.
5.3.1 Implications to Theory
The literature review, as discussed in chapter 2, provided an overview of the theories in
various disciplines which includes knowledge management, organisational learning,
personal knowledge management and individual learning. The findings from this research
contribute to the development of PKM theories in various disciplines, as discussed below.
(1) Implication for the Roles of PKM
The significant changes to the world economy, e.g. globalisation, the technology
revolution and the transition from the industrial age to the information and
knowledge age, in the past two decades have made many traditional sources of
competitive advantage obsolete (Durgin 2006), and the increasing competitive
pressures requires both organisations and individuals to have greater flexibility
and skills (Pauleen 2009a). The required skills should allow the tackling of the
major challenges e.g. emergence of knowledge work, onset of knowledge based
Chapter 5: Conclusions and Implications
Copyright@ Ricky K.F. Cheong 2011 Page 260
environment, increasing of virtual collaboration and the information
overload…etc. The roles of PKM have become more and more important, and
actually all seven PKM skills were found to play important roles in KM processes.
It implies that the KM processes require individuals to make use of their PKM
skills in locating/capturing, creating, transferring/sharing and applying
knowledge. The retrieving and evaluating skills are the paramount important skills
in locating / capturing knowledge. Organising skill, analysing skill are the highest
important skills in creating knowledge. Collaborating, presenting skill and
securing skill represent the three most important skills for transferring / sharing
knowledge. For applying knowledge, the most important PKM skills are
analysing, evaluating and collaborating.
These findings have the implications that PKM is a valuable area of study in KM
theory development, in particular to the theory related to KM process planning
and execution. PKM would be an enabler for KM process execution and by
providing resources and support to practice PKM would help to achieve the
desired outcome of the KM processes.
(2) Implication for the values of PKM for individuals
The findings for RQ1 confirmed that all seven PKM skills have significant value
in individual competences e.g. communication, creativity, problem solving,
learning / self-development, mental agility, analysis and reflection competence.
This finding has implications that PKM should be an area of study in the field of
individual learning theory. The individual competences would be improved by
practising PKM skills.
(3) Implication for the values of PKM for organisations
The findings for RQ2 confirmed that all seven PKM skills have significant values
in organisation competences e.g. external information awareness, internal
knowledge dissemination, effective decision making, organisation focus and
continuous innovation. This finding has implications that PKM should be an area
of study in the field of organisation learning theory. The organisation competence
would be improved by practising PKM at the individual employee level.
Chapter 5: Conclusions and Implications
Copyright@ Ricky K.F. Cheong 2011 Page 261
(4) Implication for the correlations between the roles of PKM and the values of
PKM
The findings of RQ3 echoed the findings of RQ1 and RQ2 related to the roles and
values of the PKM. It confirmed that the roles are positively correlated to the
values. This finding has implications for our better understanding about the
strength of the relationship between the role of each PKM skill to its value at both
the individual and organisation level. This relationship revealed the degree of
importance of each PKM skill in each KM process, and the benefits to be gained
in each of the competences.
(5) Implication for the correlations between the values of PKM for individuals
and values of PKM for organisations
The findings of RQ4 in this research indicated that there was a significant
relationship between the values of PKM for individual competence and values of
PKM for organisation competence. This finding is in line with the organisational
learning theory, described by Argyris and Schon (1978), that an individual is
acting as an agent in organisational learning. It does imply that PKM provides a
direct linkage between individual learning and organisation learning. By
improving the PKM skills of individual employees, it not only leads to the
improvement of individual competences but also to the improvement of
organisational competences.
The results from this research provide empirical evidence to support the assumption by
previous scholars that PKM is playing an important role in KM and has benefits for both
individuals and organisations. The following three PKM basic theories are summarised
from this research which provides the foundation for PKM development.
(1) The degree of the value contributed from the PKM skills in individual
competences is directly proportional to the degree of the role played in the
KM processes.
Chapter 5: Conclusions and Implications
Copyright@ Ricky K.F. Cheong 2011 Page 262
(2) The degree of the value contributed from the PKM skills in organisation
competences is directly proportional to the degree of the role played in the
KM processes.
(3) The degree of the value contributed from the PKM skills in organisation
competences is directly proportional to the degree of the value contributed by
the PKM skills to individual competences.
5.3.2 Implications to Policy and Practise
The values of the PKM have been examined in this research and the findings support the
proposed theoretical model, as defined in chapter 2. It has been concluded that PKM can
benefit both individual competences and organisation competences. It does imply that
both the individual and the organisation should have a strategy to put PKM into practice
and the following are the general guidelines contributed by this research for the
formulation of the PKM strategies.
5.3.2.1 PKM as a strategy for individuals
An individual PKM strategy provides a framework for individuals to improve their PKM
skills, to acquire their own knowledge and to transfer the knowledge to others. The
following framework provides general guidelines for defining and implementing a PKM
strategy.
(1) Treat PKM skills as a valuable asset for self development
Individuals should develop, practice and demonstrate their PKM skills whenever
possible in their daily personal situation and working environment. Smart use of
PKM skills is the key to success. Retrieving, evaluating, analysing and organising
skills enable an individual to have better personal information management and to
become an effective knowledge worker under the emerging knowledge based
environment and can tackle information overload. Collaborating, presenting and
securing skills enable an individual to have better inter-personal skills to deal with
the knowledge sharing. The PKM skills also improve problem solving and
Chapter 5: Conclusions and Implications
Copyright@ Ricky K.F. Cheong 2011 Page 263
reflection competence which directly benefit individuals to perform better, both in
their working and social environment.
(2) Develop the PKM skills which are required to meet individual learning
objectives and are aligned to organisational learning objectives
Individuals should understand what PKM skills are required in order to meet their
individual needs and align them to their organisational needs. Financial analysts
may focus on developing analytical aspects to get job advancement, while sales
managers may focus on developing presentation skills e.g. learning a new
language to develop a new market.
(3) Establish your own trustable information network through evaluating skill.
Individuals should build their own information network and evaluate its
trustworthiness. This can be achieved by simply developing an information
directory manually or by means of the PKM tools. Individuals should realise that
the information source, especially information available on the Internet, needs to
be evaluated very carefully.
(4) Develop a consistent approach to organising information
A consistent approach to managing information is important (Dorsey 2001). It can
help individuals to retrieve information fast, when needed. The consistent
approach can be achieved by systematically classifying the information by the
source of information, type of information or by the chronological order of the
information. The key is consistency in terms of how to classify the information
and the location of the storage.
(5) Build your own collaboration network
PKM is not an individual task and it should include peer-to-peer knowledge
sharing. Collaboration has been viewed as an important element in PKM (Avery
et al. 2001; Efimova 2005; Jarche 2010a; Wright, K. 2005) and therefore
individuals should develop their own collaboration network by identifying what
and how they can learn from their collaboration group members. It is not
necessary to have a formal collaboration structure but the individual should enjoy
Chapter 5: Conclusions and Implications
Copyright@ Ricky K.F. Cheong 2011 Page 264
and know the benefits of collaboration activities. A PKM 2.0 framework (Cheong
& Tsui 2010) which emphasises inter-personal knowledge transfer is discussed in
section 5.6.
(6) Identify and leverage of PKM Tools
There are many PKM toolkits available e.g. email, instant messaging, web log
(blog), search engine …etc. Agnihotri and Troutt (2009) mention that PKM Skills
and Tools should be matched in order to achieve optimised performance.
Therefore, individuals should be able to choose the appropriate PKM tools to fit
their own learning objectives, whether they are personal-related, social-related or
job-related. Tsui (2002a) classified PKM tools by their function as (1)
Index/Search, (2) Meta-search, (3) Associative links, (4) Information capturing
and Sharing, (5) Email management, analysis and Unified Messaging, (6) Voice
recognition, (7) collaboration and synchronisation and (8) Learning.
5.3.2.2 PKM Strategy for organisation
Organisational learning is not only the effort of individuals, and the organisation should
provide a positive learning environment to yield a positive outcome from individual
learning (Starbuck & Hedberg 2001). Kessels and Poell (2004) stated that knowledge
productivity requires personal involvement and individual learning, in a favourable social
context, and this work environment should be transformed into a conducive learning
environment, which should be able to encourage employees to become self-directed
learners, to pursue their interests, to find personal meaning, and to adapt to and if
necessary, change their life circumstances. Recently, there is increasing focus both in
academia and the business world on the topic of PKM for organisations e.g. a special
issue of a journal on PKM (Pauleen 2009b) published at On-line Information Review in
2009; the second international workshop PKM2010 (2010) was held at Duisburg,
Germany; a PKM seminar (Jarche 2010b) was held at IBM and a one-day PKM course
(2010) was held by The iSchool Institute of the University of Toronto at November 2010.
Therefore, an organisation should have a strategy to facilitate implementation of PKM.
The following is a general framework to guide an organisation in its task of implementing
their organisational PKM strategy.
(1) Treat PKM Skills as an asset for organisation.
Chapter 5: Conclusions and Implications
Copyright@ Ricky K.F. Cheong 2011 Page 265
Intellectual capital is the economic value of the intangible assets of organisational
and human capital and it is embedded in both people and systems (Stiles &
Kulvisaechana 2003). The stock of human capital consists of human (the
knowledge, skills and abilities of people), social (the valuable relationships among
people) and organisation (the processes and routines within the firm) (Wright, P.
M., Dunford & Snell 2001). Stiles and Kulvisaechana (2003) argued that there is a
large and growing body of evidence that demonstrates a positive linkage between
the development of human capital and organisational performance. Therefore, an
organisation should value individual PKM skills as an asset for business
development. Organisations should help individuals to maintain and improve their
PKM skills to meet organisational learning objectives. To manage an individual’s
PKM skills, it is necessary for the organisation itself to develop a battery of skills
and the means for measuring them.
(2) Develop a PKM Skills inventory as part of Human Capital Management.
Human capital is the productive wealth embodied in labour, skills and knowledge
(OECD 2001). The PKM skills inventory should be an element of human capital
management such that an organisation can easily access the learning capability of
each individual, knowing their strengths and weaknesses and matching the PKM
skills to different job profiles. The PKM skills inventory should cover all seven
skills of (1) Retrieving information; (2) Evaluating information; (3) Organising
information; (4) Collaborating around information; (5) Analysing information; (6)
Presenting information and (7) Securing Information.
(3) PKM Skills are part of the performance measurement and reward system.
The PKM skills should be measured regularly as part of performance evaluation
and as a factor when rewarding individuals. It will ensure that individuals are
aware of the importance of maintaining and improving their PKM skills. It is
important that different job profiles have different requirements regarding PKM
skills. The organisation should evaluate the PKM skills of individuals based on
their own job profiles.
Chapter 5: Conclusions and Implications
Copyright@ Ricky K.F. Cheong 2011 Page 266
(4) Develop an individual learning plan to acquire and improve PKM skills.
Having the PKM skills inventory and performance evaluation in place, the
organisation should work with individuals to develop a learning plan to improve
their PKM skills. This will help the individual to achieve the required PKM skills
for the next level of work and also will help the organisation to achieve the
organisational learning objectives via the individual learning agents.
(5) Leverage on IT based PKM tools to embed individual learning processes into
the organisational learning process.
The organisation can make use of IT technology to facilitate the implementation
of the PKM strategy. Tsui (2002a) argued that the PKM technologies should be
bottom-up, easy to install and powerful, search, information extraction and
categorisation tools. It is equally important that these tools are aligned to support
the tasks that are commonly performed by individuals. This means that the PKM
tools should enable the encapsulation of an individual’s learning processes into
the organisational learning process. By using the PKM tools, the individual user is
acting as a Learning Agent to provide input and feedback to the organisational
learning processes, while at the same time they can gain knowledge from it and
can contribute to the knowledge creation processes. Some knowledge can also be
captured by PKM tools and be available for future retrieval. Appropriate IT based
PKM toolkits cannot only motivate individuals to practice PKM but also can
improve their work performance.
5.4 Research Contribution
The research reported in this thesis has provided at least four major contributions which are
explained below. On top of that, three journal papers and two book chapters have been
published.
5.4.1 Avery et al (2001)’s PKM Skills Framework
This research provided empirical evidence to validate Avery et al (2001)’s PKM Skills
Framework. Avery et al (2001) based their work on the idea created by Paul Dorsey and
developed a conceptual framework in PKM Skills. Although this framework has
influenced various scholars in their work in PKM e.g. Berman and Annexstien (2003),
Chapter 5: Conclusions and Implications
Copyright@ Ricky K.F. Cheong 2011 Page 267
Wu (2007), Agnihotri and Troutt (2009) and Cheng (2009), this PKM skills framework
has not been thoroughly tested.
Berman and Annexstien (2003) based their work on Avery et al.’s PKM Skills framework
and developed another conceptual framework named PK-Book Model. It is focused on
personal information management and is mainly for software application design only.
Wu (2007) performed a PKM research based on Avery et al (2001)’s PKM Skills
Framework and the research focused on teachers in Taiwan only. Cheng (2009) also did
PKM research and his research focused on the pre-service teachers in Hong Kong only.
Although the research performed by Wu (2007) and Cheng (2009) have contributed to
the field of PKM, it was limited to teachers and pre-service teachers only and also applied
to a specific geographic location.
This research is the first global survey that focused on the roles and values of PKM, and
has no demographic, e.g. country of abode, industry, work position, education…etc,
limitation. The study included a rigorous testing of Avery et al (2001)’s PKM skills
framework by quantitative analysis. The research findings, as discussed in previous
sections, showed that all seven PKM skills proposed by Avery et al (2001) were playing
important roles in the four generic KM processes (locate / capture, create, transfer / share,
and apply knowledge) proposed by Seufert, Back and Krogh (2003). The values of the
seven PKM skills were examined, and the results indicated that there are significant
contributions to the individual competences in term of the meta-competences
(communication, creativity, problem solving, learning / self development, mental agility,
analysis and reflection) proposed by Cheetham and Chivers (1996, 1998). They also have
significant contributions to organisational competences in term of the organisational IQ
(external information awareness, internal knowledge dissemination, effective decision
making, organisation focus and continuous innovation) proposed by Mendelson and
Ziegler (1999) and Ziegler (2008).
5.4.2 PKM Theory for Roles and Values
This research has shed light onto the theoretical gap between the roles and values of
PKM. The literature indicates a lack of research on the roles and values of PKM and as a
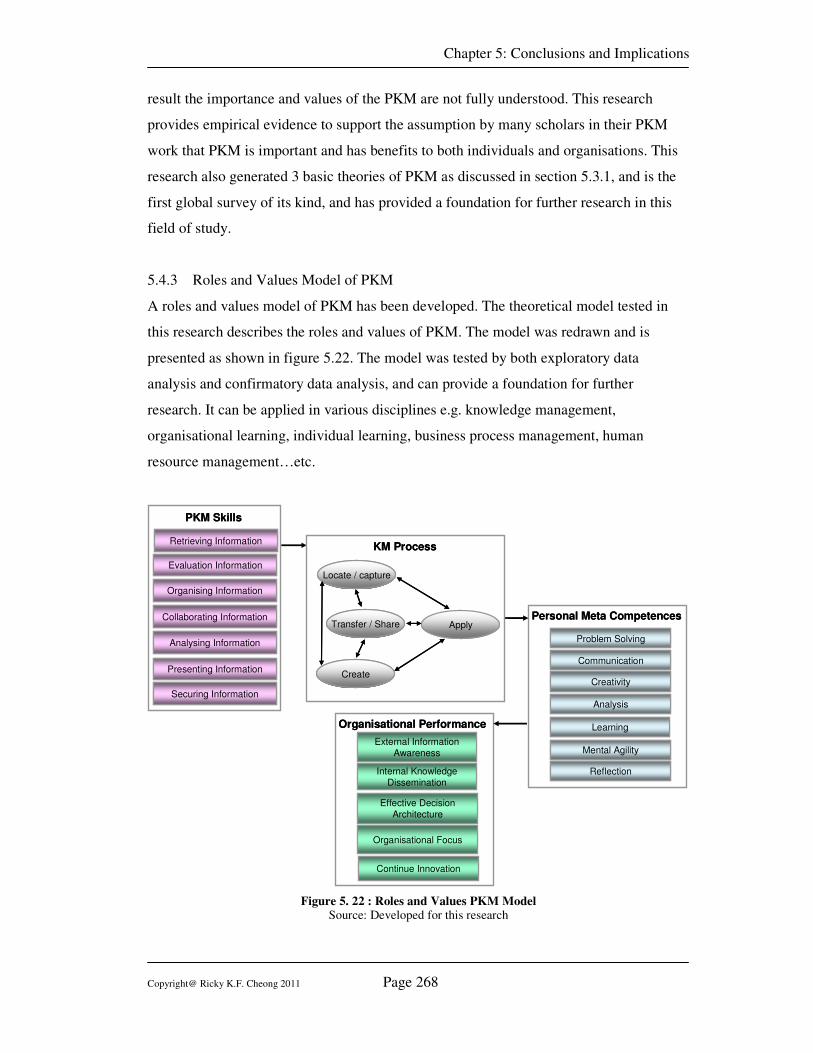
Chapter 5: Conclusions and Implications
Copyright@ Ricky K.F. Cheong 2011 Page 268
result the importance and values of the PKM are not fully understood. This research
provides empirical evidence to support the assumption by many scholars in their PKM
work that PKM is important and has benefits to both individuals and organisations. This
research also generated 3 basic theories of PKM as discussed in section 5.3.1, and is the
first global survey of its kind, and has provided a foundation for further research in this
field of study.
5.4.3 Roles and Values Model of PKM
A roles and values model of PKM has been developed. The theoretical model tested in
this research describes the roles and values of PKM. The model was redrawn and is
presented as shown in figure 5.22. The model was tested by both exploratory data
analysis and confirmatory data analysis, and can provide a foundation for further
research. It can be applied in various disciplines e.g. knowledge management,
organisational learning, individual learning, business process management, human
resource management…etc.
Figure 5. 22 : Roles and Values PKM Model Source: Developed for this research
Problem Solving
Communication
Creativity
Analysis
Learning
Mental Agility
Reflection
Personal Meta Competences
Problem Solving
Communication
Creativity
Analysis
Learning
Mental Agility
Reflection
Problem Solving
Communication
Creativity
Analysis
Learning
Mental Agility
Reflection
Personal Meta Competences
Retrieving Information
Evaluation Information
Organising Information
Collaborating Information
Analysing Information
Presenting Information
Securing Information
PKM Skills
Retrieving Information
Evaluation Information
Organising Information
Collaborating Information
Analysing Information
Presenting Information
Securing Information
Retrieving Information
Evaluation Information
Organising Information
Collaborating Information
Analysing Information
Presenting Information
Securing Information
PKM Skills
External Information Awareness
Internal Knowledge Dissemination
Effective Decision Architecture
Organisational Focus
Continue Innovation
Organisational Performance
External Information Awareness
Internal Knowledge Dissemination
Effective Decision Architecture
Organisational Focus
Continue Innovation
Organisational Performance
Locate / capture
Transfer / Share
Create
Apply
KM Process
Locate / capture
Transfer / Share
Create
Apply
KM Process
Chapter 5: Conclusions and Implications
Copyright@ Ricky K.F. Cheong 2011 Page 269
5.4.4 Individual learning in organisational learning
This research has supplemented previous literature on the importance of individual
learning in organisational learning. As discussed in chapter 2 (section 2.3.1.1), previous
organisational learning theory addressed the importance of individual participation. For
example, Argyris and Schon (1978) argued that the main stream of organisational
learning considers individuals as “agents” for organisations to learn; Nonaka (1991)
argued that new knowledge always begins with the individual, and making personal
knowledge available to others is the central activity of the knowledge creation company.
Scarbrough, Swan and Preston (1998) mentioned that a learning organisation should
primarily focus on valuing, managing and enhancing the individual development of its
employees; Kim (1993) and Matley (2000) argued that the relationship between
individual and organisation learning is an important aspect. This research has confirmed
the previous literature about the argument of the importance of individual learning in
organisation learning and PKM bridging the gap between individual learning and
organisation learning. By practicing PKM, not only the individual competence but also
the organisation competence would be improved.
5.5 Research Limitation
This study has few limitations that need to be acknowledged. Although this research has
provided relevant and interesting insights into the understanding of roles and values of PKM,
it is important to recognise the limitations.
The first limitation is the background of the targeted respondents in that they were all
knowledge management participants, even though the demographic information analysis
showed that the respondents were distributed over wide range of countries, industries, work
positions, age groups, work experience and education. They all had a background in
knowledge management and potentially had bias in valuing the roles and values of the PKM
in this research. However, the author believes that knowledge management participants are
still the preferred targeted respondents as PKM is an under-explored discipline and most
people may not be aware of it, in a systematic manner, even if they are doing the PKM work
in their daily activities. By having a background in knowledge management, they could easily
understand the concepts and answer the survey questions more accurately. Further research is
required to extend the target respondent beyond the knowledge management communities.
Chapter 5: Conclusions and Implications
Copyright@ Ricky K.F. Cheong 2011 Page 270
The second limitation is that the individual competences and organisation competences in this
research were those generic competences which are suitable in most situations; however, it is
acknowledged that certain individuals or organisations may require some specific
competences which were not covered in the theoretical model. Hence, further research is
required by augmenting the existing set of competences to meet different contextual
requirements.
5.6 Chapter Conclusion
This research investigated the roles and values of PKM. A theoretical model was
developed, as described in chapter 3, based on the literature review, as discussed in
chapter 2. There was a gap found in the literature where there was a lack of research
investigating the roles and values of PKM. The research questions and hypotheses were
proposed to address this research problem and aimed to provide better understanding in
this area.
Quantitative research was used based on the evaluation of the various research paradigms
and methodologies discussed in chapter 3. An online questionnaire was used to
administrate the survey. The online survey enabled this study to reach a wide range of
respondents in different countries in a timely and cost effective manner.
The data analysis, as discussed in chapter 4, used a two steps approach to perform
exploratory data analysis and confirmatory data analysis. The exploratory data analysis
was performed by factor analysis, correlation analysis and simple regression using
ANOVA…etc. The confirmatory data analysis was carried out by structural equation
modelling, and the data analysis was performed by the software tools PASW (SPSS) 18
and AMOS 18.
Finally, the conclusions and implications are presented in this chapter. The research
found that PKM was playing an important role in KM processes and had significant value
in both individual competences and organisation competences. In addition, the study
showed that there were positive correlations between the roles of PKM in KM processes
and the values of the PKM for both individuals and organisations. Moreover, it was found
that there were positive correlations between the values of PKM for individuals and the
values of PKM for organisations.
Chapter 6: Future Work
Copyright@ Ricky K.F. Cheong 2011 Page 271
CChhaapptteerr 66 –– FFuuttuurree WWoorrkk
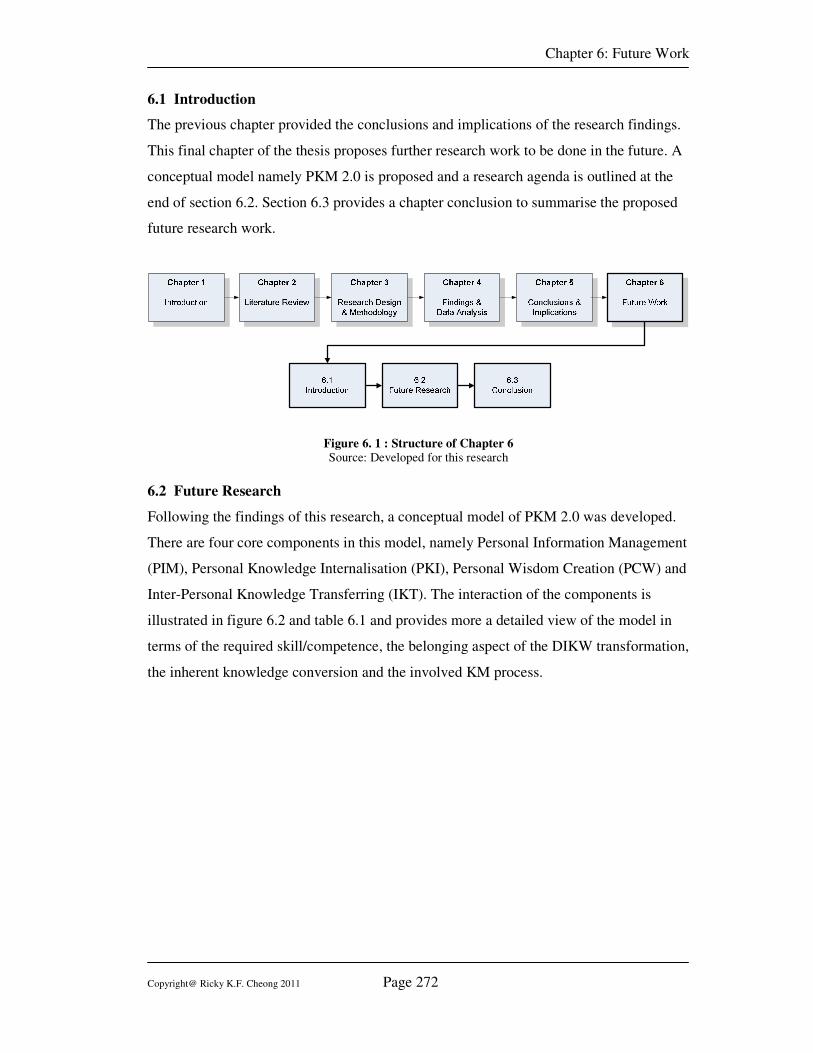
Chapter 6: Future Work
Copyright@ Ricky K.F. Cheong 2011 Page 272
6.1 Introduction
The previous chapter provided the conclusions and implications of the research findings.
This final chapter of the thesis proposes further research work to be done in the future. A
conceptual model namely PKM 2.0 is proposed and a research agenda is outlined at the
end of section 6.2. Section 6.3 provides a chapter conclusion to summarise the proposed
future research work.
Figure 6. 1 : Structure of Chapter 6
Source: Developed for this research
6.2 Future Research
Following the findings of this research, a conceptual model of PKM 2.0 was developed.
There are four core components in this model, namely Personal Information Management
(PIM), Personal Knowledge Internalisation (PKI), Personal Wisdom Creation (PCW) and
Inter-Personal Knowledge Transferring (IKT). The interaction of the components is
illustrated in figure 6.2 and table 6.1 and provides more a detailed view of the model in
terms of the required skill/competence, the belonging aspect of the DIKW transformation,
the inherent knowledge conversion and the involved KM process.
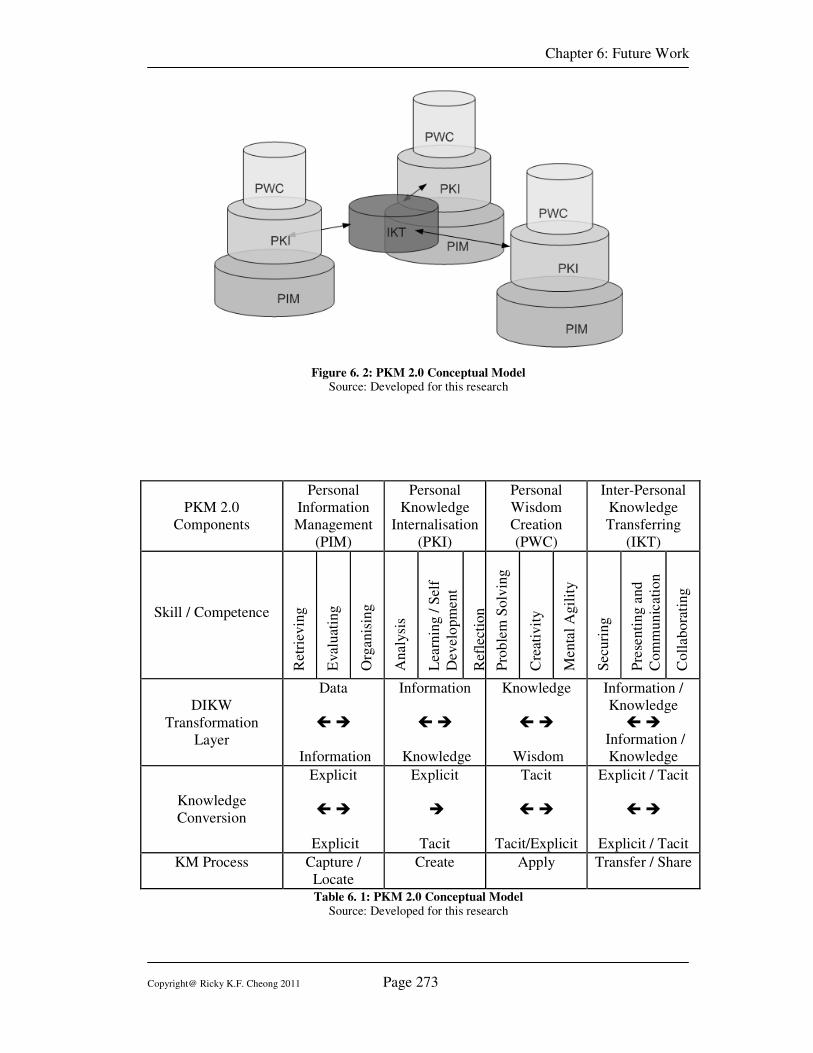
Chapter 6: Future Work
Copyright@ Ricky K.F. Cheong 2011 Page 273
Figure 6. 2: PKM 2.0 Conceptual Model Source: Developed for this research
PKM 2.0
Components
Personal
Information
Management
(PIM)
Personal
Knowledge
Internalisation
(PKI)
Personal
Wisdom
Creation
(PWC)
Inter-Personal
Knowledge
Transferring
(IKT)
Skill / Competence
Ret
riev
ing
Eval
uat
ing
Org
an
isin
g
An
aly
sis
Lea
rnin
g /
Sel
f
Dev
elo
pm
en
t
Ref
lect
ion
Pro
ble
m S
olv
ing
Cre
ativ
ity
Men
tal
Ag
ilit
y
Secu
rin
g
Pre
sen
tin
g a
nd
Co
mm
un
icat
ion
Co
llab
ora
tin
g
DIKW
Transformation
Layer
Data
� �
Information
Information
� �
Knowledge
Knowledge
� �
Wisdom
Information /
Knowledge
� � Information /
Knowledge
Knowledge
Conversion
Explicit
� �
Explicit
Explicit
�
Tacit
Tacit
� �
Tacit/Explicit
Explicit / Tacit
� �
Explicit / Tacit
KM Process Capture /
Locate
Create Apply Transfer / Share
Table 6. 1: PKM 2.0 Conceptual Model
Source: Developed for this research
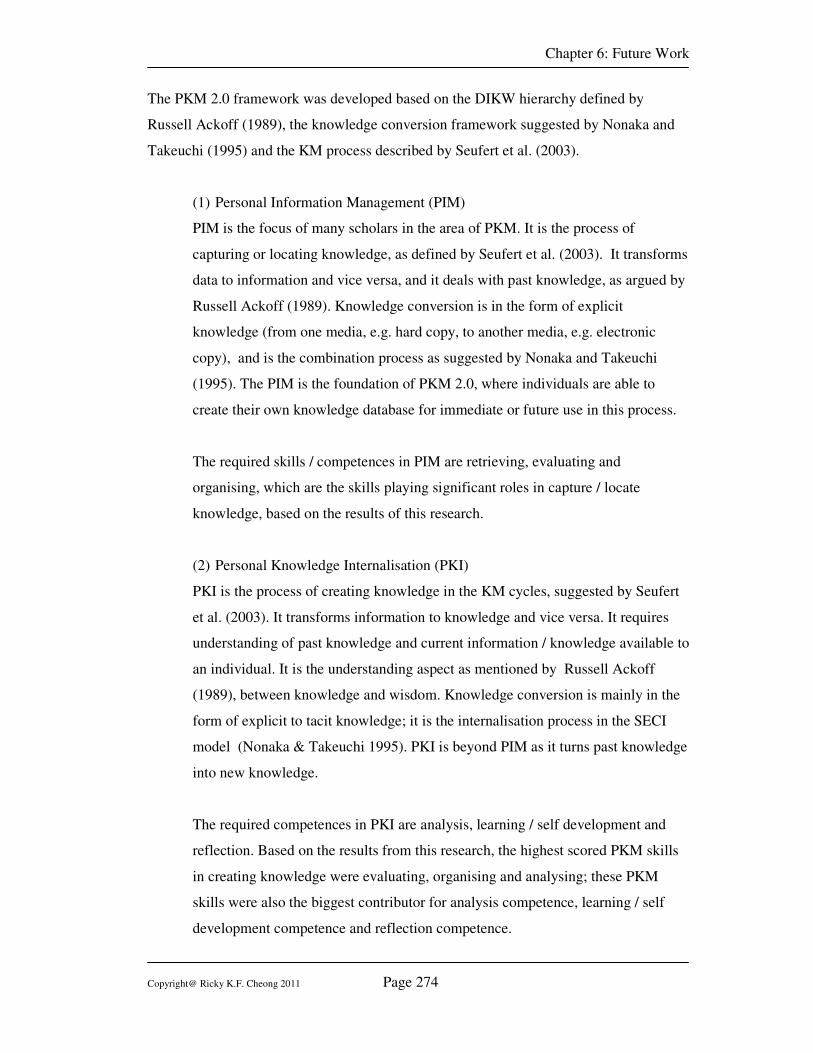
Chapter 6: Future Work
Copyright@ Ricky K.F. Cheong 2011 Page 274
The PKM 2.0 framework was developed based on the DIKW hierarchy defined by
Russell Ackoff (1989), the knowledge conversion framework suggested by Nonaka and
Takeuchi (1995) and the KM process described by Seufert et al. (2003).
(1) Personal Information Management (PIM)
PIM is the focus of many scholars in the area of PKM. It is the process of
capturing or locating knowledge, as defined by Seufert et al. (2003). It transforms
data to information and vice versa, and it deals with past knowledge, as argued by
Russell Ackoff (1989). Knowledge conversion is in the form of explicit
knowledge (from one media, e.g. hard copy, to another media, e.g. electronic
copy), and is the combination process as suggested by Nonaka and Takeuchi
(1995). The PIM is the foundation of PKM 2.0, where individuals are able to
create their own knowledge database for immediate or future use in this process.
The required skills / competences in PIM are retrieving, evaluating and
organising, which are the skills playing significant roles in capture / locate
knowledge, based on the results of this research.
(2) Personal Knowledge Internalisation (PKI)
PKI is the process of creating knowledge in the KM cycles, suggested by Seufert
et al. (2003). It transforms information to knowledge and vice versa. It requires
understanding of past knowledge and current information / knowledge available to
an individual. It is the understanding aspect as mentioned by Russell Ackoff
(1989), between knowledge and wisdom. Knowledge conversion is mainly in the
form of explicit to tacit knowledge; it is the internalisation process in the SECI
model (Nonaka & Takeuchi 1995). PKI is beyond PIM as it turns past knowledge
into new knowledge.
The required competences in PKI are analysis, learning / self development and
reflection. Based on the results from this research, the highest scored PKM skills
in creating knowledge were evaluating, organising and analysing; these PKM
skills were also the biggest contributor for analysis competence, learning / self
development competence and reflection competence.
Chapter 6: Future Work
Copyright@ Ricky K.F. Cheong 2011 Page 275
(3) Personal Wisdom Creation (PWC)
PWC is the process of applying knowledge in the KM cycles, suggested by
Seufert et al. (2003). It transforms knowledge to wisdom, putting the knowledge
in practise to tackle the current challenges and prepare for the future, as argued by
Ackoff (1989), who stated that wisdom is dealing with the future. The knowledge
conversion in this process is between tacit to tacit/explicit; it involves the
socialisation and externalisation process in the SECI model (Nonaka & Takeuchi
1995). PWC is beyond PKI as it puts knowledge in practice in tackling the daily
challenges from personal life, social life and work.
The required skills / competences in PWC are problem solving, creativity and
mental agility. Based on the research results, it was found that organising,
evaluating, analysing and collaborating were the highest scored PKM skills in
applying knowledge. These PKM skills were also the essential skills for problem
solving competence, creativity competence and mental agility competence.
(4) Interpersonal Knowledge Transferring (IKT)
IKT plays an important role in PKM 2.0 which maximises the knowledge work by
others to form a knowledge collaborating environment for individuals. It is the
process to share / transfer knowledge in the KM cycles suggested by Seufert et al.
(2003). It transforms the information and knowledge in both explicit and tacit
forms. It is a bidirectional transfer through different social activities in both face-
to-face and virtual models. IKT is beyond PIM, PKI and PWC as it positions
PKM 2.0 in an interactive and collaborating mode. It links the networked
individuals together and gears the distributed process of socialisation,
externalisation, combination and internalisation (Nonaka & Takeuchi 1995) in a
meshed knowledge network to increase the knowledge flow and knowledge
quality.
The required skills / competence in IKT are securing, presenting and
communication, and collaborating. Based on the findings from this research, it
was found that collaborating and presenting are the essential PKM skills for
Chapter 6: Future Work
Copyright@ Ricky K.F. Cheong 2011 Page 276
sharing / transferring knowledge. They are also the essential skills for
communication competence. Although securing information skills always scored
the lowest among the seven PKM skills in all KM process, it is believed that it is
an essential PKM skill in sharing / transferring knowledge, and actually securing
information skill obtained the highest score in the sharing / transferring
knowledge process.
The concept of PKM 2.0 is a dynamic framework where PIM, PKI, PCW and IKT are
working in an interactive mode. It is leveraging the knowledge and wisdom of the
networked individuals to produce a meshed knowledge network. This PKM 2.0 model
still needs to be validated. It is recommended to undertake future research based on this
conceptual model to investigate the relationship between these 4 interactive components.
The research agenda should also include the following:
(1) Explore and test the interaction and correlations between PIM, PKI, PCW and
IKT.
(2) Validate the skills and competences associated with each concept of the PKM 2.0
model.
(3) Apply the PKM 2.0 model in different individual and organisation contexts.
(4) Explore and test any influencing factors between the individual and the
organisation.
(5) Explore how the recent development of Web 2.0-based PKM tools can enable
PKM 2.0 model to maximise the contribution to competency improvement.
6.3 Chapter Conclusion
At the end of this research, a PKM 2.0 conceptual model was developed which consists
of four key elements, namely personal information management (PIM), personal
knowledge internalisation (PKI), personal knowledge creation (PKC) and inter-personal
knowledge transferring (IKT). Future research is proposed, based on this conceptual
model, which can set the foundations for the future research in the area of personal
knowledge management.
References
Copyright@ Ricky K.F. Cheong 2011 Page 277
References
Ackoff, RL 1989, 'From Data to Wisdom', Journal of Applied Systems Analysis, vol. 16,
pp. 3-9.
Adler, P & Kwon, S 2000, 'Social Capital: The good, the bad and the ugly', in E Lesser
(ed.), Knowledge and Social Capital: Foundations and applications, Butterworth-
Heinemann, Boston.
Agnihotri, R & Troutt, MD 2009, 'The effective use of technology in personal knowledge
management: A framework of skills, tools and user context', Online Information
Review, vol. 33, no. 2, pp. 329-42.
Ahmed, PK, Kok, LK & Loh, AYE 2002, Learning Through Knowledge Management,
Butterworth-Heinemann, Oxford.
Ahsan, S & Shah, A 2006, Data, Information, Knowledge, Wisdom: A doubly Linked
Chain?, UCMSS, Las Vegas, USA, June 26 - 29, 2006,
<http://ww1.ucmss.com/books/LFS/CSREA2006/IKE4628.pdf>.
Ahsan, S & Shan, A 2006, Data, Information, Knowledge, Wisdom: A doubly Linked
Chain?, UCMSS, Las Vegas, USA June 26 - 29, 2006,
<http://ww1.ucmss.com/books/LFS/CSREA2006/IKE4628.pdf>.
Alavi, M & Leidner, DE 2001, 'Review: Knowledge management and knowledge
management systems: Conceptual Foundations and Research Issues', MIS
Quarterly, vol. 25, no. 1, pp. 107-36.
Albino, V, Garavelli, AC & Gorgoglione, M 2004, 'Organization and technology in
knowledge transfer', Benchmarking, vol. 11, no. 6, pp. 584-600.
Alfs, S 2003, 'Accenture's New Operating Model', in AJ Beerli, S Falk & D Diemers
(eds), Knowledge Management and Networked Enviornments, Accrnture LLP,
New York, pp. 181-94.
References
Copyright@ Ricky K.F. Cheong 2011 Page 278
Allee, V 1997, 'The Knowledge Evolution: Expanding Organizational Intelligence', in
Butterworth Heinemann, Burlington, MA.
Argote, L, McEvily, B & Reagans, R 2003, 'Managing knowledge in organizations: An
integrative framework and review of emerging themes', Management Science, vol.
49, no. 4, p. 571.
Argyris, C & Schon, D 1978, Organisational Learning: A Theory of Action Perspective,
Addison-Wesley, New York, NY.
---- 1996, Organisational Learning II: Theory, Method and Practice, Addison-Wesley,
, Reading, MA.
Avery, S, Brooks, R, Brown, J, Dorsey, P & O'Conner, M 2001, 'Personal Knowledge
Management: Framework for Integration and Partnerships', paper presented to
Annual Conference of the Association of Small Computer Users in Education
(ASCUE), Myrtle Beach, South Carolina, 10-14 June 2001.
Barth, S 2004, 'Self-organization taking a personal approach to KM', in M Rao (ed.),
Knowledge Management Tools and Techniques: Practitioners and Experts
Evaluate KM Solutions, Butterworth-Heinemann, Boston, MA.
Bentler, PM & Wu, EJC 1995, EQS for Windows User's Guide, Mulitvariate Software
Inc., Encino, C.A.
Berg, BL 2004, Qualitative Research Method, 5 edn, Allyn & Bacon, Boston.
Bergeron, B 2003, Essentials of Knowledge Management, Wiley, New Jersey.
Berman, KA & Annexstein, FS 2003, Actualizing Context for Personal Knowledge
Management, Department of ECECS, University of Cincinnati, Cincinnati, OH.
References
Copyright@ Ricky K.F. Cheong 2011 Page 279
Best, JB 1989, Cognitive Psychology, West Publishing Company, U.S.A.
Boak, G & Coolican, D 2001, 'Competencies for retail leadership: accurate, acceptance,
affordable', Leadership & Organization Development Journal, vol. 22, no. 5, pp.
212-20.
Bogozzi, RP & Heatherton, TF 1994, 'A general approach to representing multifacted
personality constructs: Application to state self-esteem', Structural Equation
Modeling, vol. 1, no. 1, pp. 35-67.
Boyatzis, RE 1982, The Competent Manager, Wiley, New York.
Brown, JS & Duguid, P 1991, 'Organizational learning and communities of practice:
toward a unified view of working, learning and innovation', Organization Science,
vol. 2, no. 1, pp. 40-57.
Buchel, B & Probst, G 2002, From organizational learning to knowledge management,
viewed Sept 23 2009,
<http://citeseerx.ist.psu.edu/viewdoc/download?doi=10.1.1.132.3507&rep=rep1&
type=pdf>.
Burgoyne, J 1993, 'The competence movement: issues, stakeholders and prospects',
Personel Review, vol. 22, no. 6, pp. 6-13.
Burrell, G & Morgan, G 1979, 'Sociological Paradigms and Organizational Analysis', in
Heinemann, London.
Byrne, BM 2010, Structural Equation Modeling with AMOS: Basic Concepts,
Applications, and Programming, Riytledge, New York.
Cangelosi, VE & Dill, WR 1965, 'Organizational learning: observations towards a
theory', Administrative Science Quarterly, vol. 10, no. 2, pp. 175-203.
References
Copyright@ Ricky K.F. Cheong 2011 Page 280
Cassell, C & Symon, G 1994, Qualitative research in work contexts. In cassell, C. and
Symon, G. (eds). Qualitative method in organisational research, Saga, London.
Cheetham, G & Chivers, G 1996, 'Towards a holistic model of professional competence',
Journal of European Industrial Training, vol. 20, no. 5.
---- 1998, 'The reflective (and competent) practitioner: a model of professional
competence which seeks to harmonise the reflective practitioner and competence-
based approaches', Journal of European Industrial Training, vol. 22, no. 7, pp.
267-76.
---- 2005, Professions, Competence and Informal Learning, Edward Elgar Publishing
Ltd., Cheltenham.
Cheng, CK 2009, 'The Relationship Between Pre-service Teacher PKM Competency and
Knowledge Acquisition', The Hong Kong Polytechnic University.
Cheng, CW 2007, 'A Research Study of Frederick Herzberg's Motivator-Hygiene Theory
on Continuing Education Participants in Taiwan', Journal of American Academy
of Business, vol. 12, no. 1, pp. 186-92.
Cheong, KFR & Tsui, E 2010, 'The Roles and Values of Personal Knowledge
Management: An exploratory study', VINE: The journal of information and
knowledge management systems, vol. 40, no. 2, pp. 204-27.
Chung, MK 2007, 'Understanding the Substainability of Virtual Community: Model
development and Empirical Test', City University of Hong Kong.
Cohen, MD & Sproul, LE 1991, 'Editors introduction', Organization Science, vol. 2, no.
1, pp. 1-3.
Cohen, MD & Sproull, LS 1996, Organizational learning, Sage, Thousand Oaks.
References
Copyright@ Ricky K.F. Cheong 2011 Page 281
Copper, DR & Schindler, PS 2006, Business Research Methods, 9 edn, McGraw-Hill,
London.
Croteau, A-M & Dfouni, M 2008, 'Knowledge Management Leaders' Top Issue', in E-S
Abou-Zeid (ed.), Knowledge Management and Business Strategies: Theoretical
Frameworks and Empirical Research, IGI Global, Hershey, PA.
Davenport, H 1997, 'Ten principles of knowledge management and four case studies',
Knowledge and Process Management, vol. 4, no. 3, pp. 187-208.
Davenport, H & Prusak, L 1998, Working knowledge: How Organizations Manage What
They Know, Harvard Business School Press., Boston.
Davenport, TH & Prusak, L 2000, Working Knowledge: How Organizations Manage
What They Know, HBS Press, Boston.
Davies, J, Duke, A, Kings, N, Mladenic, D, Bontcheva, K, Grcar, M, Benjamins, R,
Contreras, J, Blazquez Civico, M & Glover, T 2005, 'Next generation knowledge
access', Journal of Knowledge Management, vol. 9, no. 5, pp. 64-84.
Davis, D 2000, Business research for decision making, 5 edn, Duxbury, Pacific Grove.
---- 2005, Business Research for Decision making, 6 edn, Thomson, Belmont, CA.
Degler, D & Battle, L 2000, 'Knowledge management in pursuit of performacne: the
challenge of context', Performance Improvement, ISPI, vol. 39, no. 6.
Demarest, M 1997, 'Understanding knowledge management', Long Range Planning, vol.
30, no. 3, pp. 374-84.
Devinney, TM, Midgley, DF & Soo, CW 2004, 'The Process of Knowledge Creation in
Organizations', University of New South Wales.
References
Copyright@ Ricky K.F. Cheong 2011 Page 282
Dewey, J 1938, Expeience and Education, Macmillan, New York.
Diao, L, Zuo, M & Liu, Q 2009, 'The Artificial Intelligence in Personal Knowledge
Management', paper presented to Proceedings of the 2009 Second International
Symposium on Knowledge Acquisition and Modeling - Volume 03.
Dillmam, DA 1978, Mail and Telephone Surveys: The Total Design Method, Wiley, New
York.
Dilnutt, RP 2000, 'Knowledge management as practiced in Australian organisations: A
case study approach', Southern Cross University.
Dodgson, M 1993, 'Organizational learning: a review of some literatures', Organization
Studies, vol. 14, no. 3, pp. 375-94.
Dorsey, PA 2001, Personal Knowledge Management: Educational Framework for
Global Business, Millikin University, Sept 24 2008,
<http://www.millikin.edu/pkm/pkm_istanbul.html>.
Drucker, PF 1959, Landmarks of Tomorrow, Harper & Brothers, New York.
---- 1968, The age of Discontinuity, Harper & Brothers, New York.
---- 1993, Post Capitalist Society, Harper Business, New York.
---- 1999, 'Knowledge-Worker Productivity: The Biggest Challenge', California
Management Review, vol. XLI, no. 2, pp. 79-94.
Duncan, R & Weiss, A 1979, 'Organizational learning: implications for organizational
design', Research in Organization Behavior, vol. 1, pp. 75-123.
Durgin, TV 2006, Using Competency Management to Drive Organizational
Performacne, Human Capital Institute.
References
Copyright@ Ricky K.F. Cheong 2011 Page 283
Earl, M 2001, 'Knowledge Management Strategies: Toward A Taxonomy', Journal of
Management Information Systems, vol. 18, no. 1, pp. 215-33.
Earl, MJ & Scott, IA 1999, 'What is a chief knowledge officer?', Sloan Management
Review, vol. 40, no. 2.
Easterby-Smith, M, Snell, R & Gherardi, S 1998, 'Organizational Learning: Diverging
Communities of Practice?', Management Learning, vol. 29, no. 3, pp. 259-72.
Efimova, L 2005, Understanding Personal knowledge management: A Weblog case,
Enschede: Telematica Instituut, 12 March 2008,
<https://doc.telin.nl/dsweb/Get/Document-44969/pkm_weblogs_final.pdf>.
Emory, CW & Cooper, DR 1991, Business Research Methods, Irwin, Homewood.
Ernst & Young 1999, A blueprint for success: how to put knowledge to work in your
organization, Ernst & Young.
Field, L 1997, 'Impediments to empowerment and learning within organisations', The
Learning Organisation, vol. 4, no. 4, pp. 149-58.
Fiol, CM 1994, 'Consensus, diversity and learning in organizations', Organization
Science, vol. 5, no. 3, pp. 403-20.
Fiol, CM & Lyles, MA 1985, 'Organizational Learning', Academy of Management
Review, vol. 10, no. 4, pp. 803-13.
Firestone, JM & McElroy, MW 2004, 'Organizational learning and knowledge
management: the relationship', The Learning Organisation, vol. 11, no. 2, pp.
177-84.
References
Copyright@ Ricky K.F. Cheong 2011 Page 284
Fleming, D 1991, 'The Concept of Meta-Competence', Competence & Assessment, no. 16,
pp. 9-12.
Foley, M, Frew, M, McGillivray, D, McIntosh, A & McPherson, G 2004, 'Problematising
"education" and "training" in the Scottish sport and fitness, play and outdoor
sectors', Education + Training,, vol. 46, no. 5, pp. 236-45.
Forcheri, P, Molfino, MT & Quarati, A 2000, 'ICT Driven Individual Learning: New
Opportunities and Perspectives', Educational Technology & Society, vol. 3, no. 1.
Frand, J & Hixon, C 1999, Personal Knowledge Management: Who, What, Why, When,
Where, How?, viewed January 18 2008 2008,
<http://www.anderson.ucla.edu/faculty/jason.frand/researcher/speeches/PKM.htm
>.
Frand, J & Lippincott, A 2002, Personal Knowledge Management: A Strategy for
Controlling Information Overload, Anderson UCLA, viewed September 10 2009,
<http://www.anderson.ucla.edu/faculty/jason.frand/researcher/articles/info_overlo
ad.html>.
Fung, A 2008, 'A Study of the Use of Knowledge Management System for Leveraging
Knowledge Processes in the Hong Kong Public Sector', The Hong Kong
Polytechnic University.
Galesic, M 2006, 'Dropouts on the Web: Effects of Interest and Burden Experienced
During an Online Survey', Journal of Official Statistics, vol. 22, no. 2, pp. 313-28.
Goodhue, DL & Thompson, RR 1995, 'Task-technology fit and individual performance',
MIS Quarterly, vol. 19, no. 2, pp. 213-36.
Gottschalk, P 2005, Strategic Knowledge Management Technology, Idea Group
Publishing, Hershey, P.A.
References
Copyright@ Ricky K.F. Cheong 2011 Page 285
Grant, R 1996, 'Prospering in Dynamically-Competitive Environments: Organizational
Capability as Knowledge Integration', Organization Science, vol. 7, no. 4, pp.
375-87.
---- 2000, 'Shifts in the World Economy: The Drivers of Knowledge Management', in C
Despres & D Chauvel (eds), Knowledge Horizons, Butterworth-Heinmann,
Boston, MA.
Griffin, V 1987, 'Naming the Processes', in D Bound & V Griffin (eds), Appreciating
Adults Learning, Kogan Page, London, pp. 209-21.
Guba, EG & Lincoln, YS 1991, 'What is the constructuvist paradigm?', in DS Anderson
& B Liddle (eds), Knowledge for Policy Education through Research, Falmer
Press, London.
---- 1994, 'Competing Paradigms in Qualitiative Research', in Handbook of Qualitative
Research, Sage, California.
Hair, J, Anderson, R, Tatham, R & Black, W 1998, Multivariate Data Analysis, Prentice
Hall,, New Jersey.
Hair, JF, Anderson, RE, Tatharn, RL & Black, WC 1998, Multivariate Data Analysis, 5
edn, Prentice-Hall, New Jersey.
Hashim, J 2008, 'Competencies acquisition through self-directed learning among
Malaysian managers', Journal of Workplace Learning, vol. 20, no. 4, pp. 259-71.
Havens, C & Hass, D 2000, 'How collaboration fuels knowledge', in JW Cortada & JA
Woods (eds), The Knowledge Management Handbook 2000-2001, Butterworth
Heinemann, Boston, pp. 246-1.
References
Copyright@ Ricky K.F. Cheong 2011 Page 286
Healy, M & Perry, C 2000, 'Comprehensive criteria to judge validity and reliability of
qualitative research within the realism paradigm', Qualitative Market Research,
vol. 3, no. 3, p. 118.
Hedberg, B 1981, 'How organisations learn and unlearn’', in P Nystrom & W Starbuck
(eds), Handbook of Organisational Design, Routledge, London, pp. 8-27.
Heidt, Tvd & Scott, DR 2007, Partial aggregation for complex structural equation
modelling (SEM) and small sample sizes: an illustrationusing a multi-stakeholder
model of cooperative interorganisational relationships (IORs) in product
innovation, Southern Cross University, Sydney, Australia.
Heilmann, P 2007, 'High level competence: a tool for coping with organizational change',
Journal of European Industrial Training, vol. 31, no. 9, pp. 727-41.
Heisig, P 2009, 'Harmonisation of knowledge management - comparing 160 KM
frameworks around the globe', Journal of Knowledge Management, vol. 13, no. 4,
pp. 4-31.
Higgison, S 2004, 'Your say: Personal Knowledge Management', InsideKnowledge, vol.
7, no. 7.
Hodgkinson, M 2000, 'Managerial perceptions of barriers to becoming a "learning
organisation"', The Learning Organisation, vol. 7, no. 3, pp. 156-7.
Hoe, SL 2008, 'Issues and Procedures in Adopting Structural Equation Modeling
Technique', Journal of Applied Quantitative Methods, vol. 3, no. 1, pp. 76-83.
Houle, CO 1961, The inquiring mind, University of Wisconsin Press, Madison.
Hu, LT & Bentler, PM 1999, 'Cutoff criteria for fit indices in covariance structure
analaysis: Conventional criteria versus new alternatives', Structural Equation
Modeling, vol. 6, pp. 1-55.
References
Copyright@ Ricky K.F. Cheong 2011 Page 287
Hyams, R 2000, 10 Skills of personal knowledge management, viewed October 10 2008,
<www.cgn.com/html/main.html?ContentFrame=http://www.cgn.com/html/service
s/knowledge/personal.html>.
Hyland, T & Matlay, H 1997, 'Small businesses, training needs and VET provision',
Journal of Education and Work, vol. 10, no. 2, pp. 129-39.
Ikehara, HT 1999, 'Implications of gestalt theory and practice for the learning
organisation', The Learning Organisation, vol. 6, no. 2, pp. 63-9.
iSchool 2010, Personal Knowledge Management, University of Toronto, 2010,
<http://www.institute.ischool.utoronto.ca/coursedescription.asp?courseid=260>.
Jackson, N 1998, 'Academic regulation in UK higher education: Part III - the idea of
"partnership in trust"', Quality Assurance in Education, vol. 6, no. 1, pp. 5-18.
James, P 2005, 'Knowledge Asset Management: The Strategic Management and
Knowledge Mnagament Nexus', DBA Thesis thesis, Southern Cross University.
Jarche, H 2010a, Personal Knowledge Management, Jarche Consulting, viewed March 26
2010 2010, <http://www.jarche.com/2010/01/pkm-in-2010/>.
---- 2010b, Personal Knowledge Management, IBM, 2010,
<https://dl.dropbox.com/u/167520/Webcasts/BlueIQ%20Education%20-
%20Personal%20Knowledge%20Management%20with%20Harold%20Jarche.mo
v>.
Jefferson, TL 2006, 'Taking it personally: personal knowledge management', VINE: The
journal of information and knowledge management systems, vol. 36, no. 1, pp. 35-
7.
References
Copyright@ Ricky K.F. Cheong 2011 Page 288
Kerlinger, FN 1992, Foundations of behavioral research, Harcourt Brace Publishers, Fort
Worth, TX.
Kessels, JW & Poell, RF 2004, 'Andragogy and Social Capital Theory: The implications
for Human Resource Development', Advances in Developing Human Resources,
vol. 6, no. 2, pp. 146-57.
Kim, DH 1993, 'The link between individual and organisational learning', Sloan
Management Review, vol. Fall, pp. 37-50.
Kim, H, Breslin, JG & Decker, S 2009, 'Personal knowledge management for knowledge
workers using social semantic technologies', International Journal Intelligent
Information and Database Systems, vol. 3, no. 1, pp. 28-43.
Kim, S, Suh, E & Hwang, H 2003, 'Building the knowledge map: an industrial case
study', Journal of Knowledge Management, vol. 6, no. 1, pp. 34-45.
King, WR 2008, 'An integrated architecture for an effective knowledge organisation',
Journal of Knowledge Management, vol. 12, no. 2, pp. 29-41.
Kline, RB 2005, Principles and Practice of Structured Equation Modeling, 2 edn,
Guildford Press, New York.
Kolb, DA 1993, 'The process of experiential learning', in M Thorpe, R Edwards & A
Hanson (eds), Culture and process of adult learning: A reader, Routedge,
London.
Krauss, SE 2005, 'Research Paradigms and Meaning Making: A Primer', The Qualitative
Report, vol. 10, no. 4, pp. 758 - 70.
Lahteenmaki, S, Toivonen, J & Mattila, M 2001, 'Critical Aspects of Organizational
Learning Research and Proposals for Its Measurement', British Journal of
Management, vol. 12, pp. 113-29.
References
Copyright@ Ricky K.F. Cheong 2011 Page 289
Laudon, CK & Laudon, PJ 2005, Essentials of management information systems:
managing the digital firm, Prentice Hall, New Jersey.
Lave, J & Wenger, E 1991, Siturated learning: Legitimate peripheral participation,
Cambridge University Press, New York.
Leohlin, JC 1992, Latent Variable Analysis, Lawrence Erlbaum Associates Inc.,
Hillsdale, N.J.
Lethbridge, TC 1994, 'Practical techniques for organizing and measuring knowledge',
University of Ottawa.
Levitt, B & March, G 1988, 'Organisational learning', Annual Review of Sociology, vol.
14, pp. 319-40.
Lewin, K 1942, 'Field Theory and Learning', in D Cartwright (ed.), Field Theory in Social
Science: selected theoretical papers, Social Science Paperbacks, London.
Lieb, S 1999, Principles of Adutl Learning, viewed August 1 2008 2008,
<http://honolulu.hawaii.edu/intranet/committees/FacDevCom/guidebk/teachtip/ad
ults-2.htm>.
Lim, TT 2007, 'Organizational culture and knowledge management', Southern Cross
University.
Lincoln, YS & Guba, EG 1985, Naturalistic Inquiry, Saga, Bavery Hill, CA.
Loshin, P 2001, Knowledge Management, viewed September 10 2009,
<http://www.computerworld.com/s/article/64911/Knowledge_Management>.
Lytras, M & Rouloudi, A 2003, 'Project management as a knowledge management
primer: the learning infrastructure in knowledge-intensive organisations: projects
References
Copyright@ Ricky K.F. Cheong 2011 Page 290
as knowledge transformations and beyond', The Learning Organisation, vol. 10,
no. 4, pp. 237-50.
Malhotra, NK 2004, Marketing research: an applied orientation, 4 edn, Prentice-Hall,
London.
Malhotra, Y 2001, Knowledge Management and Business Model Innovation, Idea Group
Pullishing, London, UK.
Manning, ML & Munro, D 2004, Analysing Survey Questionnaires in SPSS, Unpublished
Book, Southern Cross University, Australia.
March, JG & Simon, HA 1958, Organizations, Wiley, New York.
March, JG & Olsen, JP 1975, 'The Uncertainty of the Past: Organizational Learning
Under Ambiguity', European Journal of Political Research, vol. 3, pp. 147-71.
Martin, J 2008, Personal Knowledge Management: The basis of Corporate and
Institiutional Knowledge Management, Spotted Cow, Alberta, September 18
2008,
<http://www.spottedcowpress.ca/KnowledgeManagement/pdfs/06MartinJ.pdf>.
Matlay, H 2000, 'Organisational learning in small learning organisations', Education +
Training,, vol. 42, no. 4/5, pp. 202-10.
Mendelson, H & Ziegler, J 1999, Survival of the Smartest, John Wiley & Sons, New
York.
Mertins, K, Heisig, P & Vorbeck, J 2003, Knowledge Management: Concepts and Best
Practices, 2 edn, Springer, New York.
Miller, D 1996, 'A preliminary typology of organisational learning: synthesizing the
literature', Journal of management, vol. 22, no. 3, pp. 485-505.
References
Copyright@ Ricky K.F. Cheong 2011 Page 291
Nahapiet, J & Ghoshal, S 1998, 'Social Capital, Intellectual Capital, and The
Organizational Advantage', Academy of Management Review, vol. 23, no. 3, pp.
242-66.
Neuman, WL 2006, Social Research Methods: Qualitative and Quantitative Approaches,
6 edn, Pearson, Boston, USA.
Nonaka, I 1991, 'The Knowledge creating company', Havard Business Review,
November-December, pp. 96-104.
---- 1994, 'A Dynamic Theory of Organizational Knowledge Creation', Organization
Science, vol. 5, no. 1, pp. 14-37.
Nonaka, I & Takeuchi, H 1995, The Knowledge-Creating Company: How Japanese
Companies Create the Dynamics of Innovation, Oxford University Press, Oxford.
Nonaka, I & Teece, DJ 2001, 'Research Directions for Knowledge Management', in
Managing Industrial Knowledge: Creation, Transfer and Utilization, Saga
Publications, London, pp. 330-5.
OECD 2001, Human Capital, OECD, viewed Oct 20 2008
<http://stats.oecd.org/glossary/detail.asp?ID=1264>.
Omegapowers 2008, DIKW Model, Wikipedia, viewed Oct 26 2009 2009,
<http://en.wikipedia.org/wiki/File:DIKW.png>.
Parlby, D & Taylor, R 1999, The power of knowledge : A business guide to knowledge
management, KPMG Management Consulting.
Patrizi, J & Levin, G 2007, A Knowledge Management Maturity Model for a Global Field
Services Organisation, APQC, <http://www.apqc.org/knowledge-
References
Copyright@ Ricky K.F. Cheong 2011 Page 292
base/documents/knowledge-management-maturity-model-patrizi-levin-apqc-km-
conf-2007>.
Patton, M 2002, 'Qualitative Interviewing', in Qualitative Evaluation and Research
Method, 3 edn, Sage, Newbury Park, C.A.
Pauleen, D 2009a, 'Personal knowledge management: Putting the "person" back into the
knowledge equation', Online Information Review, vol. 33, no. 2, pp. 221-4.
---- 2009b, 'Personal Knowledge Management', Online Information Review, vol. 33, no.
2.
Pentland, BT 1995, 'Information Systems and Organizational Learning: The Social
Epistemology of Organizational Knowledge Systems', Accounting Management
and Information Technologies, vol. 5, no. 1, pp. 1-21.
Perry, C 1995, A Structured Approach to Presenting Theses: Notes for Student and Their
Supervisors, Sourthern Cross University, Lismore.
Perry, C, Riege, A & Brown, L 1999, 'Realism's role among scientific paradigms in
marketing research', Irish Marketing Review, vol. 12, no. 2, pp. 16-23.
Pettenati, MC, Cigognini, E, Mangione, J & Guerin, E 2007, 'Using Social Software for
Personal Knowledge Manaegement in Formal Online Learning', Turkish Online
Journal of Distance Education, vol. 8, no. 3, pp. 52 - 65.
Piaget, J 1970, Genetic Epistemology, Columbia University Press, New York.
PKM2010 2010, PKM2010 - Workshop on Personal Knowledge Management, 2010,
<http://2010.personalknowledge.org/>.
Polanyi, M 1958, Personal Knowledge: Towards a Post Critical Philosophy, Routledge
& Kegan Paul Ltd, London.
References
Copyright@ Ricky K.F. Cheong 2011 Page 293
---- 1996, The Tacit Dimension, Doubleday & Co, London, UK.
Pollard, D 2004, Confessions of a CKO: What I should have done,
<http://blogs.salon.com/0002007/categories/businessInnovation/2004/05/31.html>
.
Pounds, W 1965, 'On Problem Finding', Sloan School Working Paper.
Ragin, CC 1994, Constructing social research, Pine Forge Press, Thousand Oaks, CA.
Ramirez, YW & Nemghard, DA 2004, 'Measuring knowledge worker productivity: A
Taxonomy', Journal of Intellectual Capital, vol. 5, no. 4, pp. 602-28.
Rashman, L, Withers, E & Jean, H 2008, Organizational Learning, Knowledge and
Capacity: A systematic literature review for policy-makers, managers and
academics, University of Warwick, London.
Razmerita, L, Kirchner, K & Sudzina, F 2009, 'Personal Knowledge Management: The
role of Web 2.0 tools for managing knowledge at individual and organisational
levels', Online Information Review, vol. 33, no. 6, pp. 1468-4527.
Rogers, EM 1962, Diffusion of Innovation, Free Press, New York.
Rubenstein-Montano, B, Liebowitz, J, Buchwalter, J, McCaw, D, Newman, B & Rebeck,
K 2001, 'A systems thinking framework for knowledge management', Decision
Support Systems, vol. 31, no. 1, pp. 5-16.
Rubin, HJ & Rubin, IS 1995, Qualitiative Interviewing: the art of hearing data, Sage,
Thousand Oaks.
Scarbrough, H, Swan, J & Preston, J 1998, Knowledge Management: A Literature
Review, Institute of Personnel and Development, London.
References
Copyright@ Ricky K.F. Cheong 2011 Page 294
Schotte, T 2003, 'Customer Knowledge Management: How does my customer look and
feel?', in AJ Beerli, S Falk & D Diemers (eds), Knowledge Management and
Networked Enviornments, Accenture LLP., New York, pp. 17-36.
Schroder, HM 1989, Managerial Competence: The Key to Excellence, Kendall Hunt,
Dubuque.
Schroeter, K 2008, Competence Literature Review, Competency & Credentialing
Institute, May 28 2009,
<http://certboard.org/docs_upload/competence_lit_review.pdf>.
Schwarz, S 2006, 'A context model for personal knoweldge management', Modeling and
Retrieval of Context, Lexture Notes in Computer Science, vol. 3946, pp. 18-33.
Sekaran, U 2000, Scientific Investigation, Research Method for Business: A Skill Building
Approach, 3 edn, John Willey & Sons, New York.
---- 2003, Research method for business: A skill building approach, 4 edn, Wiley, New
York.
Senge, P 1990, The Fifth Discipline: The Art and Practice of the Learning Organisation,
Doubleday, New York.
Setrag, K 2010, MyBPM: Social Networking for Business Process Management,
Pegasystems Inc, Feb 5 2010,
<http://pegasystems.com/content/document.asp?ci=427>.
Seufert, A, Back, A & Krogh, GV 2003, 'Unleashing the Power of Networks for
Knowledge Management', in AJ Beerli, S Falk & D Diemers (eds), Knowledge
Management and Networked Enviornments, Accenture LLP, New York, pp. 99-
136.
References
Copyright@ Ricky K.F. Cheong 2011 Page 295
Sharma, N 2008, The Origin of the "Data Information Knowledge Wisdom" Hierarchy,
University of Michigan, <http://www-
personal.si.umich.edu/~nsharma/dikw_origin.htm>.
Simon, HA 1947, Administrative Behaviour, Macmillan, New York.
Smith, R 2009, Adult Learning: Study Guide, 2 edn, Southern Cross University, Lismore,
Australia.
Starbuck, WH & Hedberg, B 2001, 'How Organizations Learn From Success and Failure',
in M Dierkes, AB Antal, J Child & I Nonaka (eds), Handbook of Organisational
Learning and Knowledge, Oxford University Press, New York.
Stewart, A 2000, Where to look for intellectual capital, Intellectual Capital: The Wealth
of Organisations, Nicholas Brealey, London.
Stiles, P & Kulvisaechana, S 2003, Human capital and performance: A literature review,
Judge Institute of Management, University of Cambridge, Cambridge,
<http://www.berr.gov.uk/files/file38844.pdf>.
Streumer, JN & Bjorkquist, DC 1998, 'Moving beyond traditional vocational education
and training: emerging issues', in WJ Nijhof & JN Streumer (eds), Key
Qualifications in Work and Education, Kluwer, Dordrecht, pp. 249-64.
Su, sS 2006, 'Individual learning and ogrnaisational learning in academic libraries', paper
presented to Proceedings of Asia-pacific Conference on Library & Information
Education & Practice 2006 (A-LIEP 2006), Singapore, 3-6 April 2006.
Tabachnick, BG & Fidell, LS 2001, Using Multivariate Statistics, 4 edn, Allyn and
Bacon, Boston, M.A.
Takeuchi, H 1999, 'Beyond Knowledge Management: Lessons from Japan Monash Mt.
Eliza', Business Review, vol. 1, no. 1, pp. 21-9.
References
Copyright@ Ricky K.F. Cheong 2011 Page 296
Tan, SS, Teo, HH, Tan, BC & Wei, KK 1998, 'Developing a Preliminary Framework for
Knowledge Management in Organizations.', paper presented to Proceedings of the
Fourth Americas Conference on Information Systems, Baltimore, Maryland USA,
August 14-16, 1998.
Thomas, BG 2000, A Framework To Measure Knowledge Worker Productivity,
University of Wisconsin - Madison, 2009,
<http://www.drghoreishi.com/doc/KWproductivity.pdf>.
Thomas, DR 2003, A general inductive approach for Qualitative data analysis,
University of Auckland, Auckland.
Ticehurst, G & Veal, A 2000, Business research methods: A managerial approach,
Addison Wesley Longman, South Melbourne.
Tissen, R, Anderiessen, D & Deprez, F 1998, Value-based Knowledge Management:
Creating the 21st Century Company: Knowledge Intensive, People Rich, Addison-
Wesley, Amsterdam.
Trochim, WMK 2006, The Research Methods Knowledge Base
<http://www.socialresearchmethods.net/kb/index.php>.
Tsui, E 2002a, Technologies for Personal and Peer-to-peer (P2P) Knowledge
Management, Melbourne.
---- 2002b, Technologies for Personal and Peer-to-peer (P2P) Knowledge Management,
Computer Sciences Corporation, Melbourne,
<http://www2.csc.com/lef/programs/completed_02.html>.
Van, DSR & Spijkervet, A 1997, 'Knowledge Management: dealing intelligently with
knowledge ', in J Leibowitz & LC Wilcox (eds), Knowledge Management and its
integrative element, CRC Press, Washington pp. 31-59.
References
Copyright@ Ricky K.F. Cheong 2011 Page 297
Veal, A 2006, Business research method: a managerial approach, 2nd edn, Pearson
Addison Wesley, Melbourne.
Volkel, M & Abecker, A 2008, Cost-Benefit Analysis for the design of Personal
Knowledge Management Systems.
Volkel, M & Haller, H 2009, 'Conceptual data structures for personal knowledge
management', Online Information Review, vol. 33, no. 2, pp. 298- 315.
Wallas, G 1926, The Art of Thought, Harcourt Brace, New York.
Wang, CL & Ahmed, PK 2001, 'Creative quality and value innovation: a platform for
competitive
success', paper presented to Integrated Management-Conference Proceedings of the 6th
International Conference of ISO9000 and TQM, Scotland, UK, April.
---- 2003, 'Organisational Learning: A Critical Review', The Learning Organization, vol.
10, no. 1, pp. 8-17.
Watson, S, McCracken, M & Hughes, M 2004, 'Scottish visitor attractions: managerial
competence requirements', Journal of European Industrial Training, vol. 28, no.
1, pp. 39-66.
Wiig, KM 1997, 'Knowledge Management: an introduction and perspective', The Journal
of Knowledge Management, vol. 1, no. 1, pp. 6-14.
---- 2004, People-Focused Knowledge Management, Elsevier Butterworth-Heinemann,
Oxford, UK.
Wright, K 2005, 'Personal knowledge management: supporting individual knowledge
worker performance', Knowledge Management Research & Practice, vol. 3, no. 3,
p. 156.
References
Copyright@ Ricky K.F. Cheong 2011 Page 298
Wright, PM, Dunford, BB & Snell, SA 2001, 'Human resources and the resource-based
view of the firm', Journal of management, vol. 27, pp. 701-21.
Wu, M 2007, 'Working Models For Teacher's Personal Knowledge Management', paper
presented to Proceedings of Society for Information Technology & Teacher
Education International Conference, Chesapeake, VA.
Wynne, R 2008, Motivating Factors in Adult Learning, viewed August 9 2008 2008,
<http://www.assetproject.info/learner_methodologies/before/motivating.htm>.
Zack, M 1999, 'Developing a knowledge strategy', California Management Review, vol.
41, no. 3, pp. 125-44.
Zhang, Z 2009, 'Personalising organisational knowledge and organisationalising personal
knowledge', Online Information Review, vol. 33, no. 2, pp. 237-56.
Ziegler, J 2008, What are the key principles of Organizational IQ?, Synesis, viewed 19
March 2008 2008, <http://www.synesis.com/synesis/OrganizationalIQ.html#IQ>.
Zikmund, WG 2000, Business Research Method, Dryden, Fort Worth.
---- 2003, 'Sample designs and sampling procedures', in Business Research Methods, 7
edn, Thimson, Ohio, pp. 368-400.
Zuber-Skerritt, O 2005, 'A model of values and actions for personal knowledge
management', THe Journal of Workplace Learning, vol. 17, no. 1/2, pp. 49-64.
Appendix
Copyright@ Ricky K.F. Cheong 2011 Page 299
Appendix 1 – Questionnaire
Appendix
Copyright@ Ricky K.F. Cheong 2011 Page 300
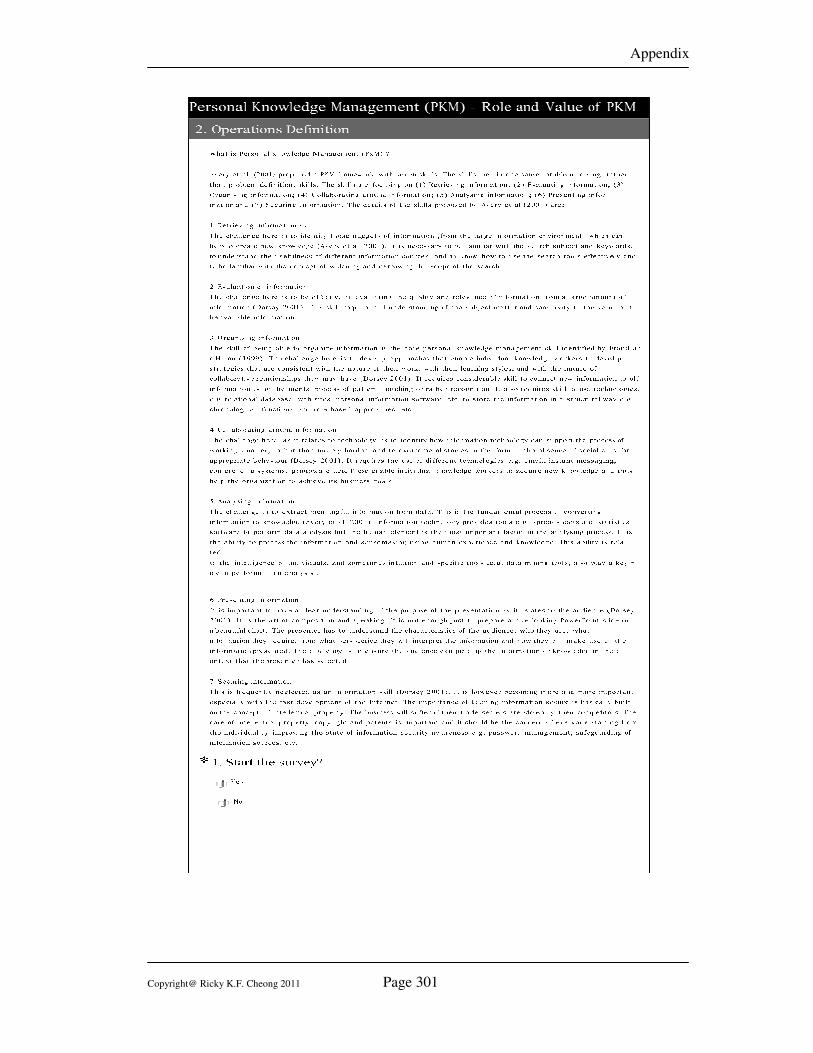
Appendix
Copyright@ Ricky K.F. Cheong 2011 Page 301
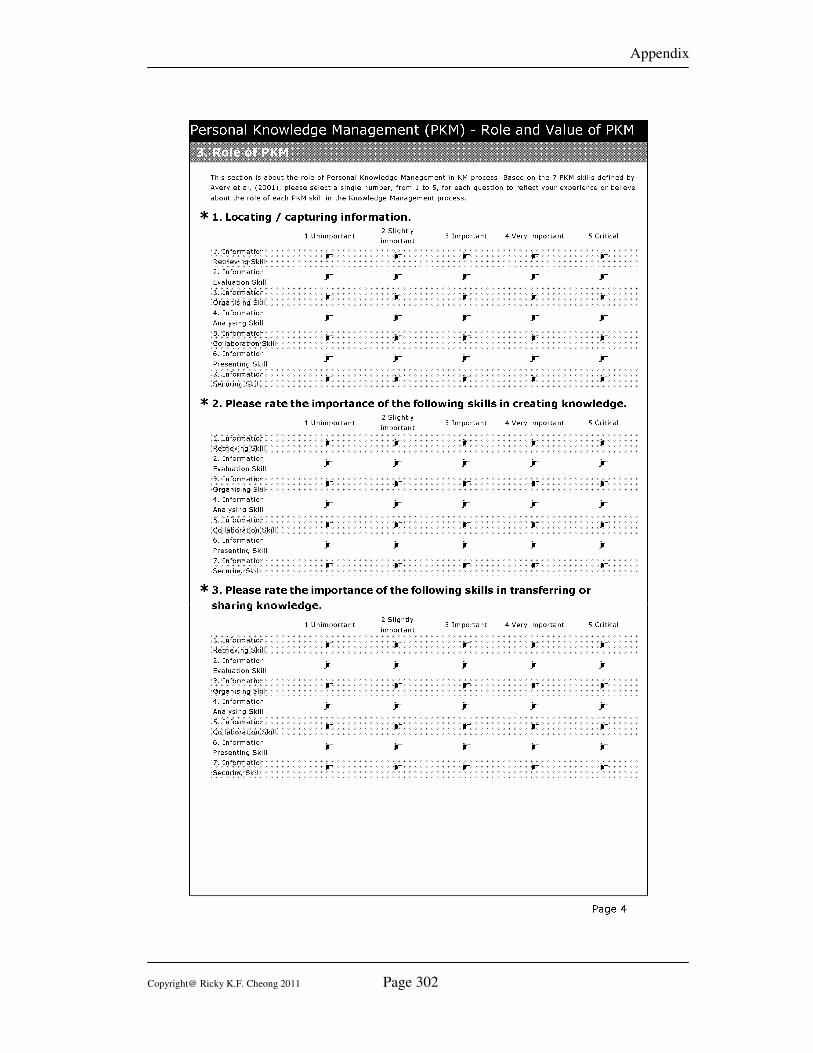
Appendix
Copyright@ Ricky K.F. Cheong 2011 Page 302
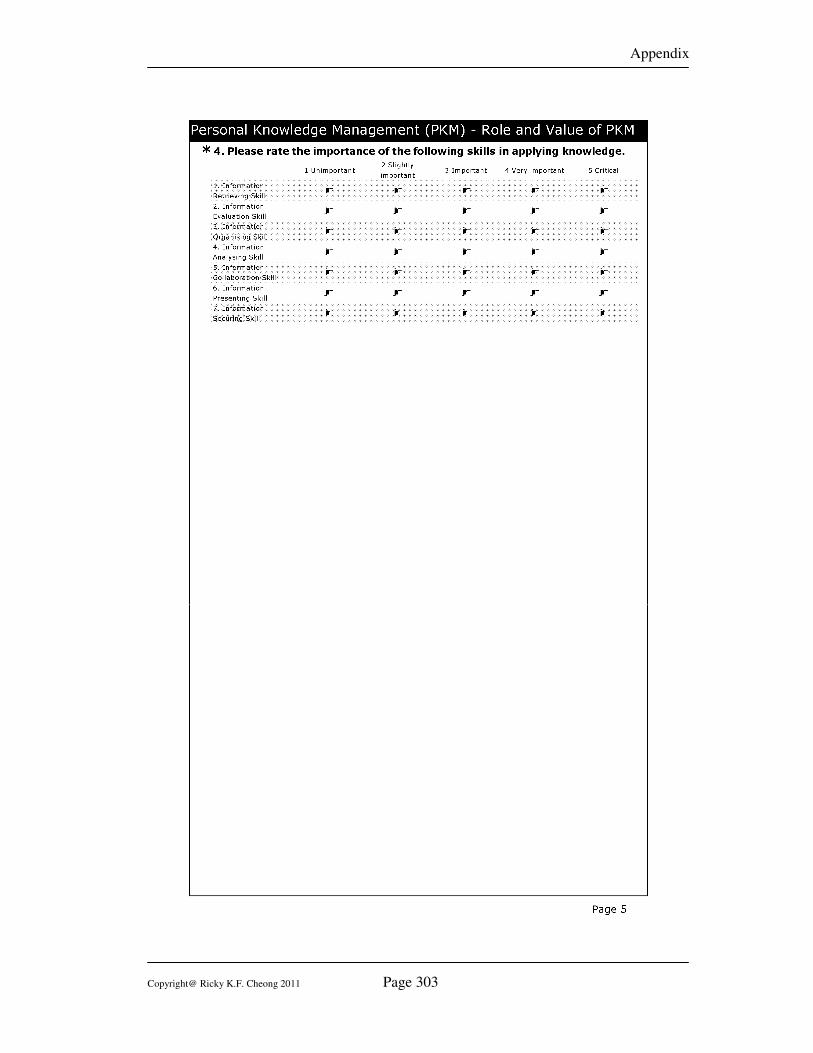
Appendix
Copyright@ Ricky K.F. Cheong 2011 Page 303
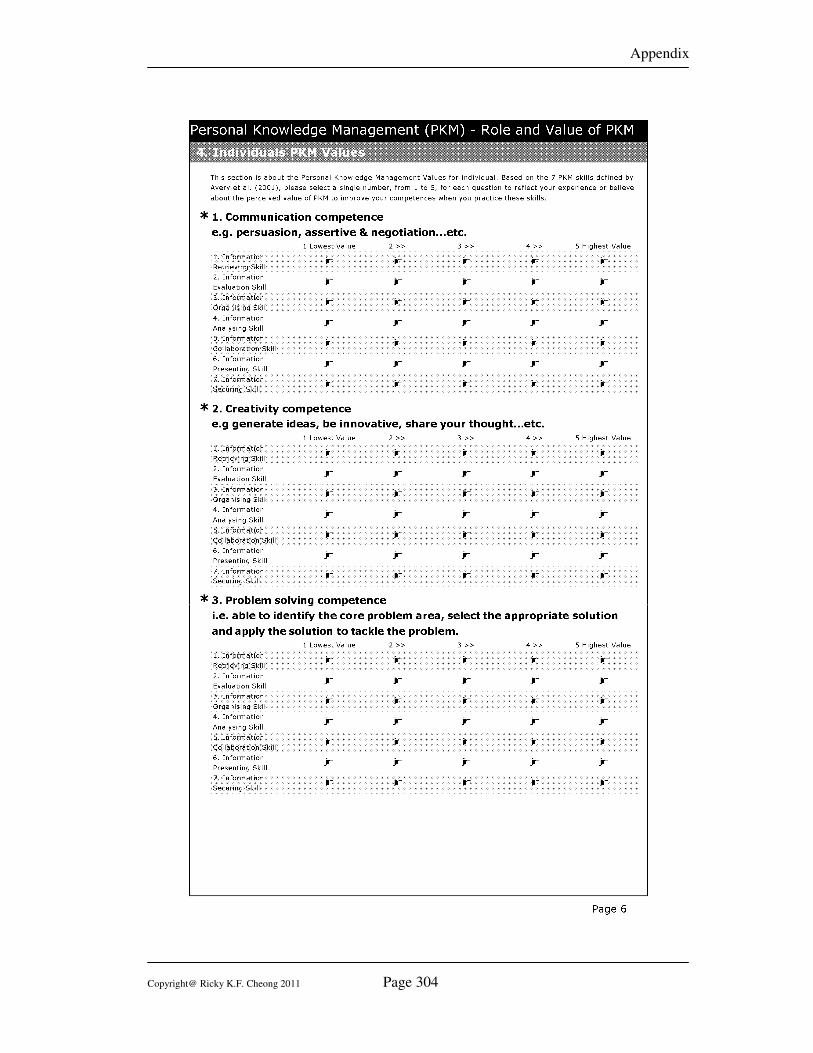
Appendix
Copyright@ Ricky K.F. Cheong 2011 Page 304
Appendix
Copyright@ Ricky K.F. Cheong 2011 Page 305
Appendix
Copyright@ Ricky K.F. Cheong 2011 Page 306
Appendix
Copyright@ Ricky K.F. Cheong 2011 Page 307
Appendix
Copyright@ Ricky K.F. Cheong 2011 Page 308
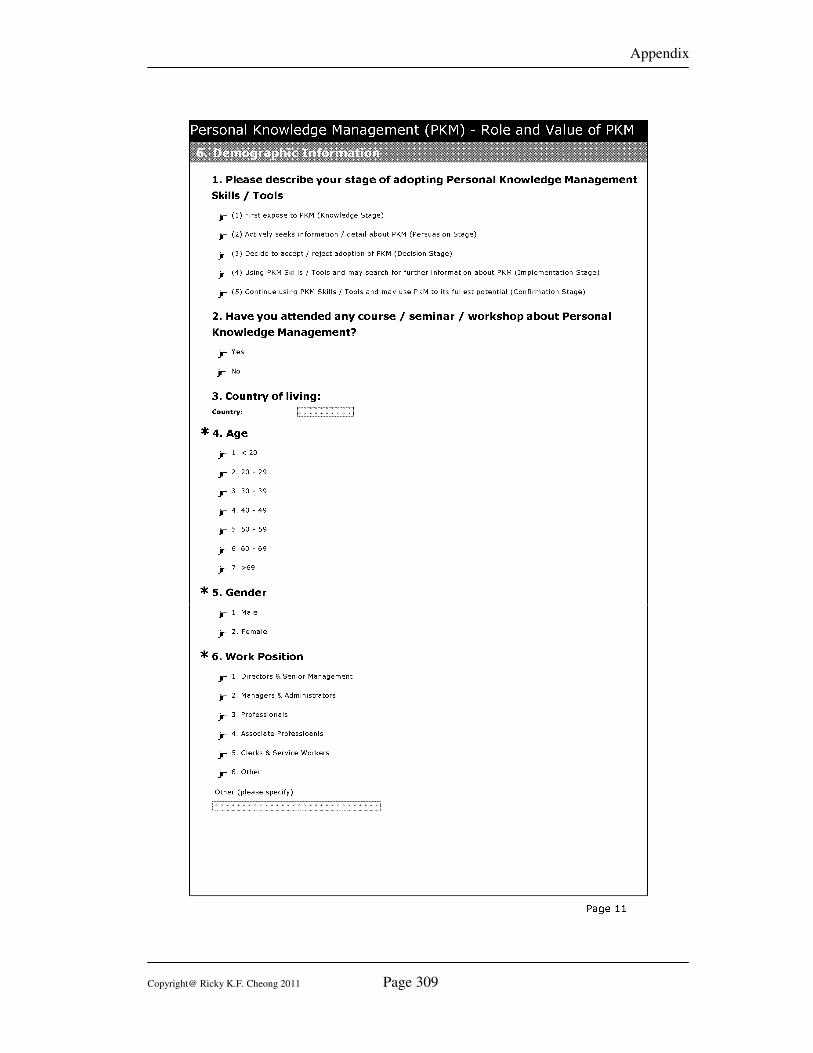
Appendix
Copyright@ Ricky K.F. Cheong 2011 Page 309
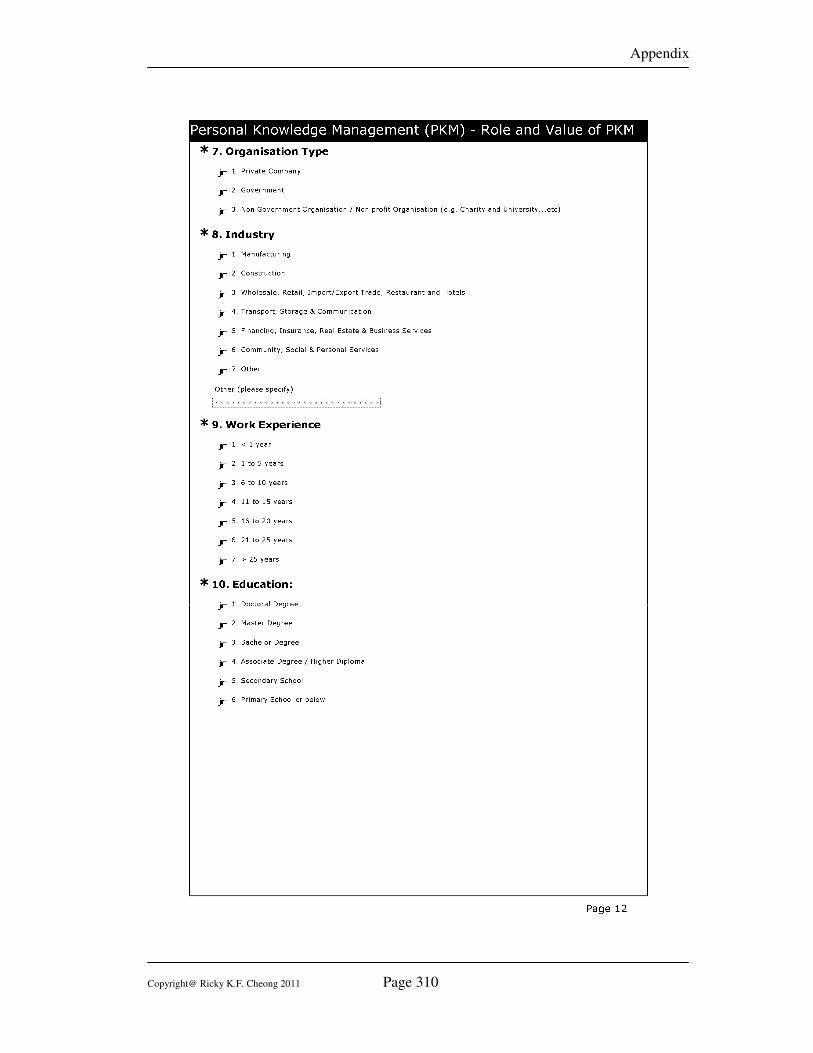
Appendix
Copyright@ Ricky K.F. Cheong 2011 Page 310
Appendix
Copyright@ Ricky K.F. Cheong 2011 Page 311
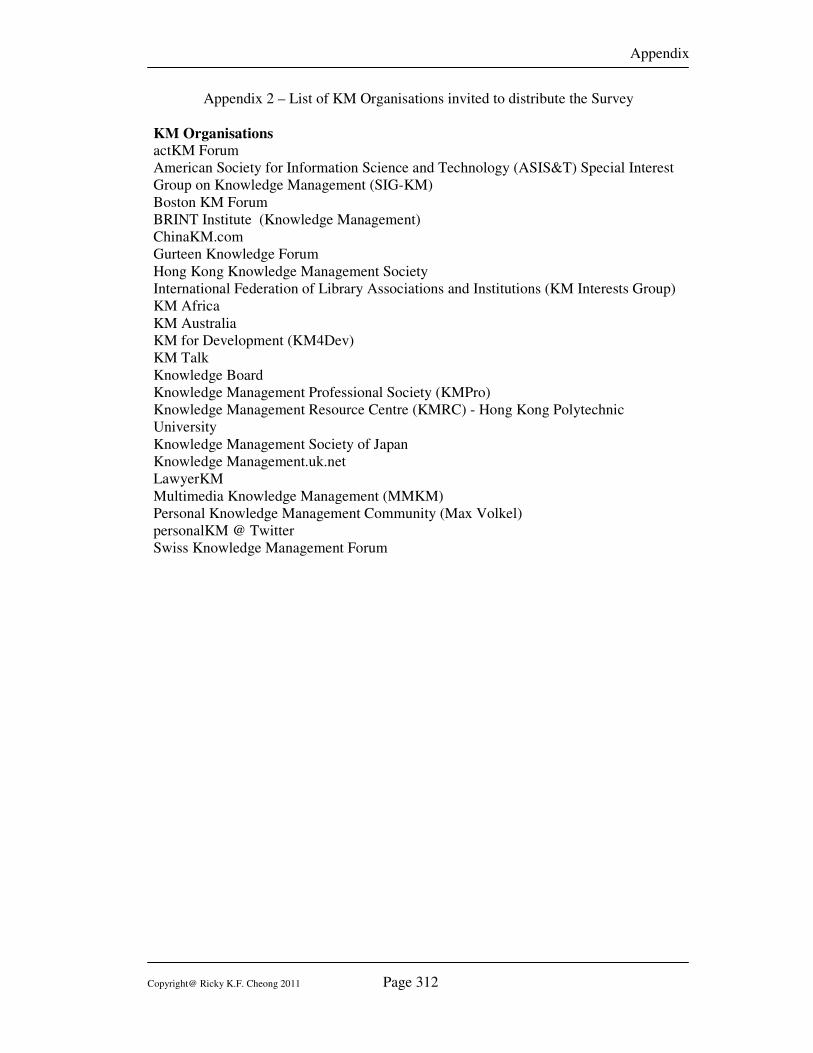
Appendix
Copyright@ Ricky K.F. Cheong 2011 Page 312
Appendix 2 – List of KM Organisations invited to distribute the Survey
KM Organisations
actKM Forum
American Society for Information Science and Technology (ASIS&T) Special Interest
Group on Knowledge Management (SIG-KM)
Boston KM Forum
BRINT Institute (Knowledge Management)
ChinaKM.com
Gurteen Knowledge Forum
Hong Kong Knowledge Management Society
International Federation of Library Associations and Institutions (KM Interests Group)
KM Africa
KM Australia
KM for Development (KM4Dev)
KM Talk
Knowledge Board
Knowledge Management Professional Society (KMPro)
Knowledge Management Resource Centre (KMRC) - Hong Kong Polytechnic
University
Knowledge Management Society of Japan
Knowledge Management.uk.net
LawyerKM
Multimedia Knowledge Management (MMKM)
Personal Knowledge Management Community (Max Volkel)
personalKM @ Twitter
Swiss Knowledge Management Forum
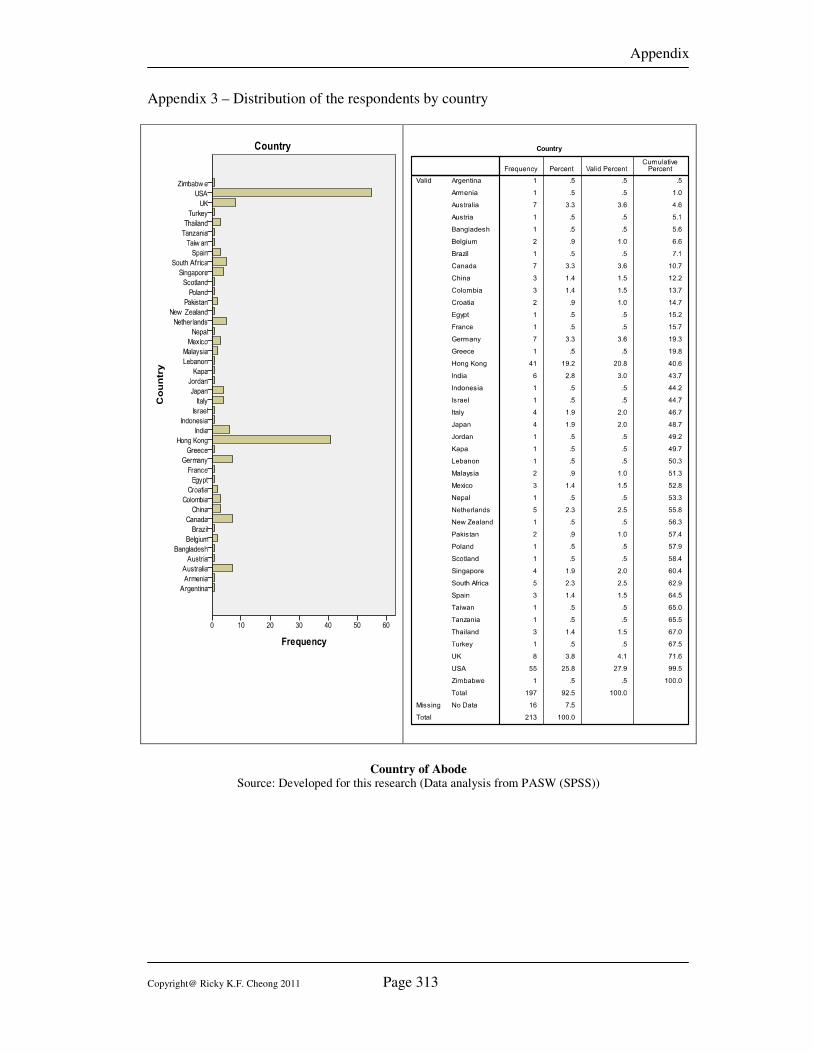
Appendix
Copyright@ Ricky K.F. Cheong 2011 Page 313
Appendix 3 – Distribution of the respondents by country
Country of Abode
Source: Developed for this research (Data analysis from PASW (SPSS))
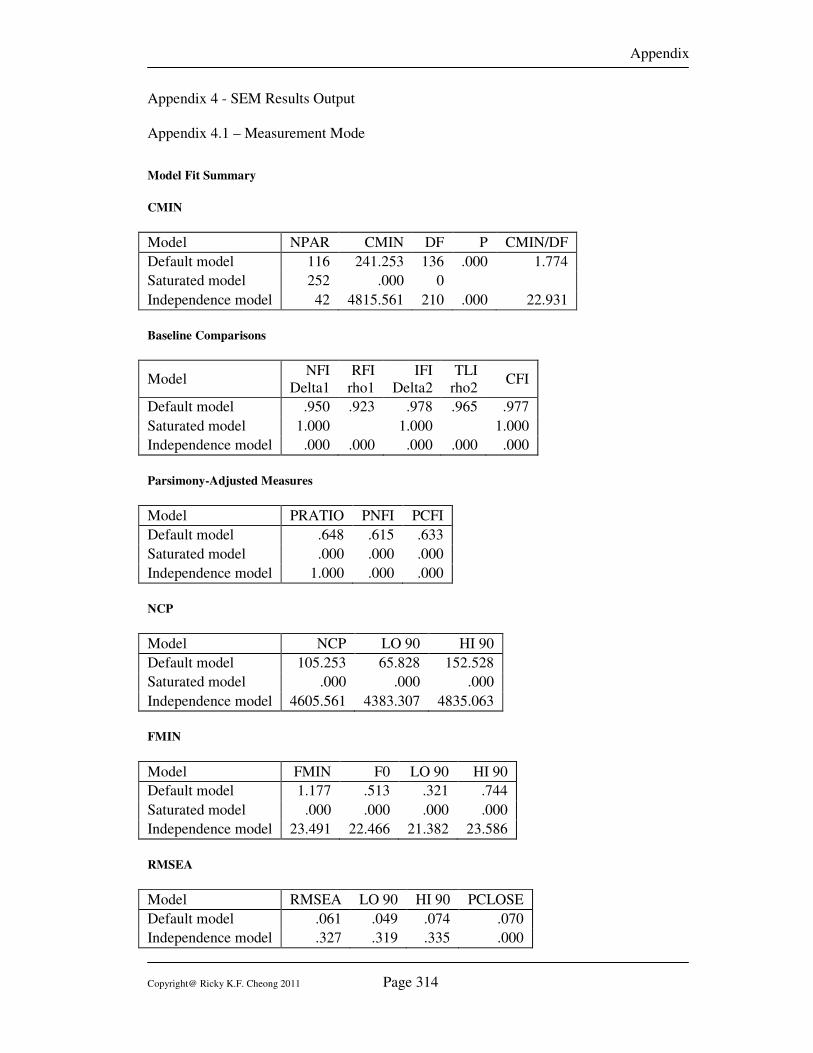
Appendix
Copyright@ Ricky K.F. Cheong 2011 Page 314
Appendix 4 - SEM Results Output
Appendix 4.1 – Measurement Mode
Model Fit Summary
CMIN
Model NPAR CMIN DF P CMIN/DF
Default model 116 241.253 136 .000 1.774
Saturated model 252 .000 0
Independence model 42 4815.561 210 .000 22.931
Baseline Comparisons
Model NFI
Delta1
RFI
rho1
IFI
Delta2
TLI
rho2 CFI
Default model .950 .923 .978 .965 .977
Saturated model 1.000 1.000 1.000
Independence model .000 .000 .000 .000 .000
Parsimony-Adjusted Measures
Model PRATIO PNFI PCFI
Default model .648 .615 .633
Saturated model .000 .000 .000
Independence model 1.000 .000 .000
NCP
Model NCP LO 90 HI 90
Default model 105.253 65.828 152.528
Saturated model .000 .000 .000
Independence model 4605.561 4383.307 4835.063
FMIN
Model FMIN F0 LO 90 HI 90
Default model 1.177 .513 .321 .744
Saturated model .000 .000 .000 .000
Independence model 23.491 22.466 21.382 23.586
RMSEA
Model RMSEA LO 90 HI 90 PCLOSE
Default model .061 .049 .074 .070
Independence model .327 .319 .335 .000
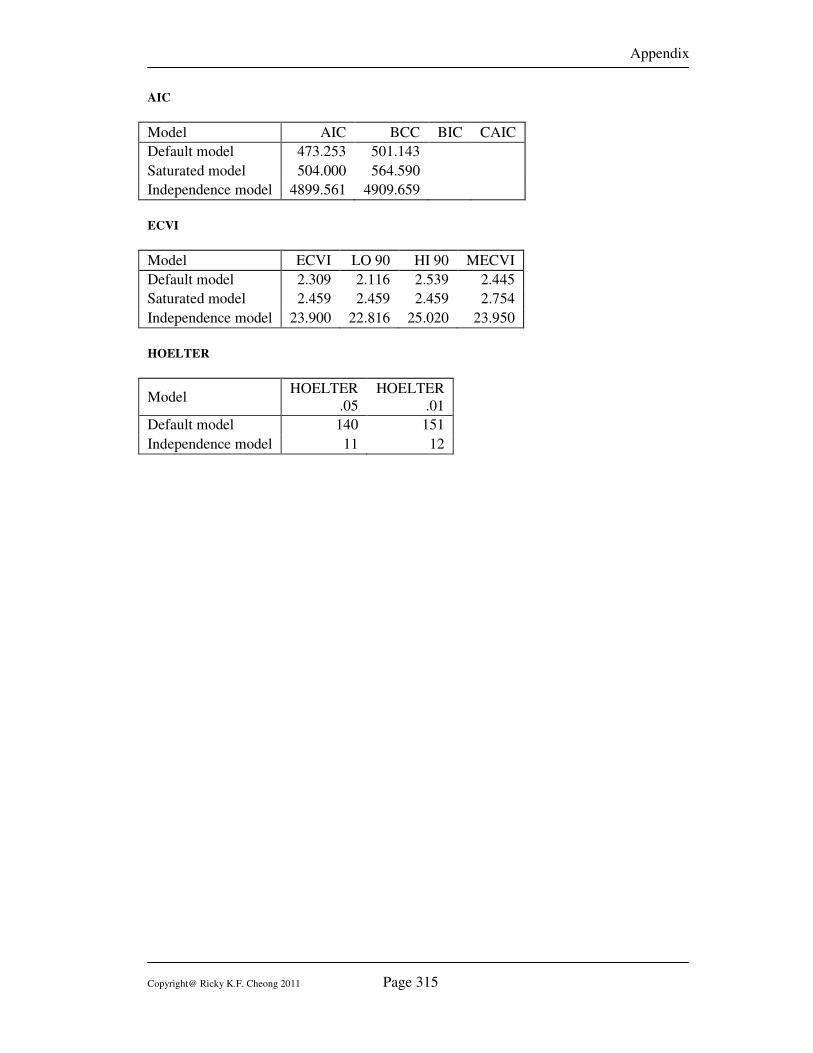
Appendix
Copyright@ Ricky K.F. Cheong 2011 Page 315
AIC
Model AIC BCC BIC CAIC
Default model 473.253 501.143
Saturated model 504.000 564.590
Independence model 4899.561 4909.659
ECVI
Model ECVI LO 90 HI 90 MECVI
Default model 2.309 2.116 2.539 2.445
Saturated model 2.459 2.459 2.459 2.754
Independence model 23.900 22.816 25.020 23.950
HOELTER
Model HOELTER
.05
HOELTER
.01
Default model 140 151
Independence model 11 12

Appendix
Copyright@ Ricky K.F. Cheong 2011 Page 316
Appendix 4.2 – Structural Model 1
Model Fit Summary
CMIN
Model NPAR CMIN DF P CMIN/DF
Default model 116 282.521 136 .000 2.077
Saturated model 252 .000 0
Independence model 42 4815.561 210 .000 22.931
Baseline Comparisons
Model NFI
Delta1
RFI
rho1
IFI
Delta2
TLI
rho2 CFI
Default model .941 .909 .969 .951 .968
Saturated model 1.000 1.000 1.000
Independence model .000 .000 .000 .000 .000
Parsimony-Adjusted Measures
Model PRATIO PNFI PCFI
Default model .648 .610 .627
Saturated model .000 .000 .000
Independence model 1.000 .000 .000
NCP
Model NCP LO 90 HI 90
Default model 146.521 102.174 198.633
Saturated model .000 .000 .000
Independence model 4605.561 4383.307 4835.063
FMIN
Model FMIN F0 LO 90 HI 90
Default model 1.378 .715 .498 .969
Saturated model .000 .000 .000 .000
Independence model 23.491 22.466 21.382 23.586
RMSEA
Model RMSEA LO 90 HI 90 PCLOSE
Default model .072 .061 .084 .001
Independence model .327 .319 .335 .000

Appendix
Copyright@ Ricky K.F. Cheong 2011 Page 317
AIC
Model AIC BCC BIC CAIC
Default model 514.521 542.411
Saturated model 504.000 564.590
Independence model 4899.561 4909.659
ECVI
Model ECVI LO 90 HI 90 MECVI
Default model 2.510 2.294 2.764 2.646
Saturated model 2.459 2.459 2.459 2.754
Independence model 23.900 22.816 25.020 23.950
HOELTER
Model HOELTER
.05
HOELTER
.01
Default model 120 129
Independence model 11 12
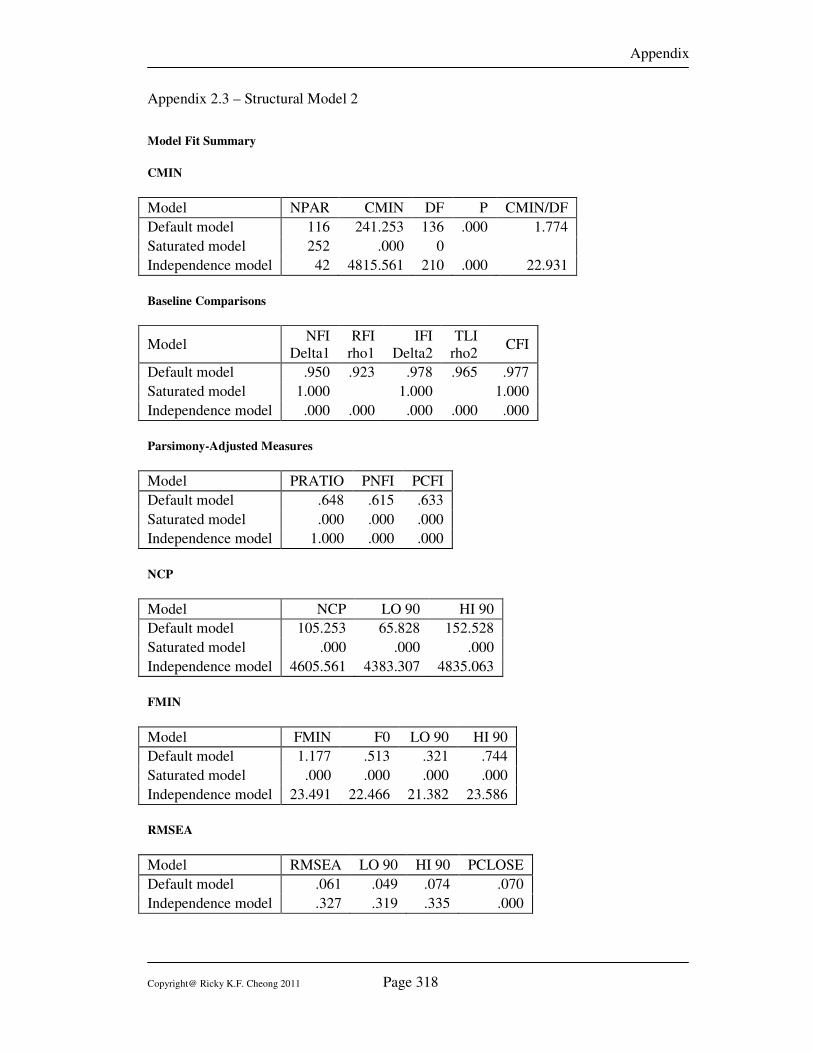
Appendix
Copyright@ Ricky K.F. Cheong 2011 Page 318
Appendix 2.3 – Structural Model 2
Model Fit Summary
CMIN
Model NPAR CMIN DF P CMIN/DF
Default model 116 241.253 136 .000 1.774
Saturated model 252 .000 0
Independence model 42 4815.561 210 .000 22.931
Baseline Comparisons
Model NFI
Delta1
RFI
rho1
IFI
Delta2
TLI
rho2 CFI
Default model .950 .923 .978 .965 .977
Saturated model 1.000 1.000 1.000
Independence model .000 .000 .000 .000 .000
Parsimony-Adjusted Measures
Model PRATIO PNFI PCFI
Default model .648 .615 .633
Saturated model .000 .000 .000
Independence model 1.000 .000 .000
NCP
Model NCP LO 90 HI 90
Default model 105.253 65.828 152.528
Saturated model .000 .000 .000
Independence model 4605.561 4383.307 4835.063
FMIN
Model FMIN F0 LO 90 HI 90
Default model 1.177 .513 .321 .744
Saturated model .000 .000 .000 .000
Independence model 23.491 22.466 21.382 23.586
RMSEA
Model RMSEA LO 90 HI 90 PCLOSE
Default model .061 .049 .074 .070
Independence model .327 .319 .335 .000

Appendix
Copyright@ Ricky K.F. Cheong 2011 Page 319
AIC
Model AIC BCC BIC CAIC
Default model 473.253 501.143
Saturated model 504.000 564.590
Independence model 4899.561 4909.659
ECVI
Model ECVI LO 90 HI 90 MECVI
Default model 2.309 2.116 2.539 2.445
Saturated model 2.459 2.459 2.459 2.754
Independence model 23.900 22.816 25.020 23.950
HOELTER
Model HOELTER
.05
HOELTER
.01
Default model 140 151
Independence model 11 12
Related Documents