The Role of Type 4 Phosphodiesterases in Generating Microdomains of cAMP: Large Scale Stochastic Simulations Rodrigo F. Oliveira 1 , Anna Terrin 2 , Giulietta Di Benedetto 3 , Robert C. Cannon 4 , Wonryull Koh 1 , MyungSook Kim 1 , Manuela Zaccolo 2 , Kim T. Blackwell 1 * 1 The Krasnow Institute for Advanced Study, George Mason University, Fairfax, Virginia, United States of America, 2 Faculty of Biomedical and Life Sciences, University of Glasgow, Glasgow, Scotland, United Kingdom, 3 Venetian Institute of Molecular Medicine, Padova, Veneto, Italy, 4 Textensor Limited, Edinburgh, Scotland, United Kingdom Abstract Cyclic AMP (cAMP) and its main effector Protein Kinase A (PKA) are critical for several aspects of neuronal function including synaptic plasticity. Specificity of synaptic plasticity requires that cAMP activates PKA in a highly localized manner despite the speed with which cAMP diffuses. Two mechanisms have been proposed to produce localized elevations in cAMP, known as microdomains: impeded diffusion, and high phosphodiesterase (PDE) activity. This paper investigates the mechanism of localized cAMP signaling using a computational model of the biochemical network in the HEK293 cell, which is a subset of pathways involved in PKA-dependent synaptic plasticity. This biochemical network includes cAMP production, PKA activation, and cAMP degradation by PDE activity. The model is implemented in NeuroRD: novel, computationally efficient, stochastic reaction-diffusion software, and is constrained by intracellular cAMP dynamics that were determined experimentally by real-time imaging using an Epac-based FRET sensor (H30). The model reproduces the high concentration cAMP microdomain in the submembrane region, distinct from the lower concentration of cAMP in the cytosol. Simulations further demonstrate that generation of the cAMP microdomain requires a pool of PDE4D anchored in the cytosol and also requires PKA-mediated phosphorylation of PDE4D which increases its activity. The microdomain does not require impeded diffusion of cAMP, confirming that barriers are not required for microdomains. The simulations reported here further demonstrate the utility of the new stochastic reaction-diffusion algorithm for exploring signaling pathways in spatially complex structures such as neurons. Citation: Oliveira RF, Terrin A, Di Benedetto G, Cannon RC, Koh W, et al. (2010) The Role of Type 4 Phosphodiesterases in Generating Microdomains of cAMP: Large Scale Stochastic Simulations. PLoS ONE 5(7): e11725. doi:10.1371/journal.pone.0011725 Editor: Vladimir Brezina, Mount Sinai School of Medicine, United States of America Received March 26, 2010; Accepted June 17, 2010; Published July 22, 2010 Copyright: ß 2010 Oliveira et al. This is an open-access article distributed under the terms of the Creative Commons Attribution License, which permits unrestricted use, distribution, and reproduction in any medium, provided the original author and source are credited. Funding: An HFSP program grant (K.B. and M.Z.), the joint NSF-NIH CRCNS program through NIH grant R01 AA16022 (K.B.), Foundation Leducq (O6 CVD 02 to M.Z.) and the British Heart Foundation (PG/07/091/23698 to M.Z.). The funders had no role in study design, data collection and analysis, decision to publish, or preparation of the manuscript. Competing Interests: R. C. Cannon is an employee at Textensor Limited and was funded (with a subcontract) by the HFSP grant which funded the other authors. R. C. Cannon wrote the original version of the software and helped in writing the manuscript. Textensor Limited does not financially benefit from publishing because the software is freely available. * E-mail: [email protected] Introduction cAMP is an important second messenger molecule responsible for the regulation of many aspects of neuronal function. For instance, cAMP signaling plays a critical role in the late phase of LTP through its main effector PKA [1] and in psychiatric diseases such as schizophrenia, in which the disruption of the interaction between DISC-1 (a scaffold protein) and PDE activity [2] produces altered cAMP activity. In cardiac cells cAMP is a key regulator of the excitation-contraction cycle through the control of intracellular calcium concentration mediated by PKA phosphor- ylation of a number of targets including L-type calcium channels [3]. cAMP also regulates gene transcription through cAMP- response element binding protein (CREB), a transcription factor that regulates expression of genes implicated in neuroplasticity and cognition [4,5]. Accomplishment of these various functions in a specific manner requires a highly localized PKA activity (for instance, at the nucleus in gene regulation and at the subplasma membrane in channel phosphorylation). This localized PKA activity seems incompatible with the highly diffusible nature of the cAMP molecule. To achieve selective activation, PKA is localized to defined compartments within the neuron by binding to A- Kinase-Anchoring-Proteins [6] and cAMP is compartmentalized in different cellular microdomains [7–9]. How these microdo- mains are maintained is an open question with important implications for information processing in signalling pathways. The inhomogeneous cAMP concentration in different cellular subregions results from the interplay of three processes: 1) synthesis by adenylate cyclase (AC) that is activated by G protein-coupled receptors (GPCRs) on the plasma membrane, 2) degradation by phosphodiesterases (PDEs) and, 3) diffusion. One potential mechanism for producing cAMP microdomains is a physical barrier impeding diffusion away from its production site [10–13]. Another mechanism is colocalization of cAMP production with its target molecules while simultaneously having high levels of PDEs. The result of this arrangement would be a high local concentration PLoS ONE | www.plosone.org 1 July 2010 | Volume 5 | Issue 7 | e11725

Welcome message from author
This document is posted to help you gain knowledge. Please leave a comment to let me know what you think about it! Share it to your friends and learn new things together.
Transcript
The Role of Type 4 Phosphodiesterases in GeneratingMicrodomains of cAMP: Large Scale StochasticSimulationsRodrigo F. Oliveira1, Anna Terrin2, Giulietta Di Benedetto3, Robert C. Cannon4, Wonryull Koh1,
MyungSook Kim1, Manuela Zaccolo2, Kim T. Blackwell1*
1 The Krasnow Institute for Advanced Study, George Mason University, Fairfax, Virginia, United States of America, 2 Faculty of Biomedical and Life Sciences, University of
Glasgow, Glasgow, Scotland, United Kingdom, 3 Venetian Institute of Molecular Medicine, Padova, Veneto, Italy, 4 Textensor Limited, Edinburgh, Scotland, United
Kingdom
Abstract
Cyclic AMP (cAMP) and its main effector Protein Kinase A (PKA) are critical for several aspects of neuronal function includingsynaptic plasticity. Specificity of synaptic plasticity requires that cAMP activates PKA in a highly localized manner despite thespeed with which cAMP diffuses. Two mechanisms have been proposed to produce localized elevations in cAMP, known asmicrodomains: impeded diffusion, and high phosphodiesterase (PDE) activity. This paper investigates the mechanism oflocalized cAMP signaling using a computational model of the biochemical network in the HEK293 cell, which is a subset ofpathways involved in PKA-dependent synaptic plasticity. This biochemical network includes cAMP production, PKAactivation, and cAMP degradation by PDE activity. The model is implemented in NeuroRD: novel, computationally efficient,stochastic reaction-diffusion software, and is constrained by intracellular cAMP dynamics that were determinedexperimentally by real-time imaging using an Epac-based FRET sensor (H30). The model reproduces the high concentrationcAMP microdomain in the submembrane region, distinct from the lower concentration of cAMP in the cytosol. Simulationsfurther demonstrate that generation of the cAMP microdomain requires a pool of PDE4D anchored in the cytosol and alsorequires PKA-mediated phosphorylation of PDE4D which increases its activity. The microdomain does not require impededdiffusion of cAMP, confirming that barriers are not required for microdomains. The simulations reported here furtherdemonstrate the utility of the new stochastic reaction-diffusion algorithm for exploring signaling pathways in spatiallycomplex structures such as neurons.
Citation: Oliveira RF, Terrin A, Di Benedetto G, Cannon RC, Koh W, et al. (2010) The Role of Type 4 Phosphodiesterases in Generating Microdomains of cAMP:Large Scale Stochastic Simulations. PLoS ONE 5(7): e11725. doi:10.1371/journal.pone.0011725
Editor: Vladimir Brezina, Mount Sinai School of Medicine, United States of America
Received March 26, 2010; Accepted June 17, 2010; Published July 22, 2010
Copyright: � 2010 Oliveira et al. This is an open-access article distributed under the terms of the Creative Commons Attribution License, which permitsunrestricted use, distribution, and reproduction in any medium, provided the original author and source are credited.
Funding: An HFSP program grant (K.B. and M.Z.), the joint NSF-NIH CRCNS program through NIH grant R01 AA16022 (K.B.), Foundation Leducq (O6 CVD 02 toM.Z.) and the British Heart Foundation (PG/07/091/23698 to M.Z.). The funders had no role in study design, data collection and analysis, decision to publish, orpreparation of the manuscript.
Competing Interests: R. C. Cannon is an employee at Textensor Limited and was funded (with a subcontract) by the HFSP grant which funded the otherauthors. R. C. Cannon wrote the original version of the software and helped in writing the manuscript. Textensor Limited does not financially benefit frompublishing because the software is freely available.
* E-mail: [email protected]
Introduction
cAMP is an important second messenger molecule responsible
for the regulation of many aspects of neuronal function. For
instance, cAMP signaling plays a critical role in the late phase of
LTP through its main effector PKA [1] and in psychiatric diseases
such as schizophrenia, in which the disruption of the interaction
between DISC-1 (a scaffold protein) and PDE activity [2]
produces altered cAMP activity. In cardiac cells cAMP is a key
regulator of the excitation-contraction cycle through the control of
intracellular calcium concentration mediated by PKA phosphor-
ylation of a number of targets including L-type calcium channels
[3]. cAMP also regulates gene transcription through cAMP-
response element binding protein (CREB), a transcription factor
that regulates expression of genes implicated in neuroplasticity and
cognition [4,5]. Accomplishment of these various functions in a
specific manner requires a highly localized PKA activity (for
instance, at the nucleus in gene regulation and at the subplasma
membrane in channel phosphorylation). This localized PKA
activity seems incompatible with the highly diffusible nature of the
cAMP molecule. To achieve selective activation, PKA is localized
to defined compartments within the neuron by binding to A-
Kinase-Anchoring-Proteins [6] and cAMP is compartmentalized
in different cellular microdomains [7–9]. How these microdo-
mains are maintained is an open question with important
implications for information processing in signalling pathways.
The inhomogeneous cAMP concentration in different cellular
subregions results from the interplay of three processes: 1) synthesis
by adenylate cyclase (AC) that is activated by G protein-coupled
receptors (GPCRs) on the plasma membrane, 2) degradation by
phosphodiesterases (PDEs) and, 3) diffusion. One potential
mechanism for producing cAMP microdomains is a physical
barrier impeding diffusion away from its production site [10–13].
Another mechanism is colocalization of cAMP production with its
target molecules while simultaneously having high levels of PDEs.
The result of this arrangement would be a high local concentration
PLoS ONE | www.plosone.org 1 July 2010 | Volume 5 | Issue 7 | e11725
of cAMP but a low cytosolic concentration preventing diffuse
activation of cAMP targets. Recent evidence has been accumu-
lating in favor of an active role for phosphodiesterases in
regulating cAMP concentration [3,14–16].
The investigation of cAMP microdomains requires the use of
techniques with high temporal and spatial resolution. Fluorescence
resonance energy transfer (FRET) is an invaluable imaging
technique for investigating the dynamics of molecular interactions
in living cells [17–21]. The principle of FRET is the ability of a
high energy fluorophore (donor) to transfer energy to a lower
energy fluorophore (acceptor) when the two are within 1–10 nm
[21]. Thus, a change in molecule conformation upon cAMP
binding, such as occurs with the Epac-based H30 sensor, produces
a change in fluorescence that is detectable in real-time with high
spatial resolution in living cells [16].
A complementary approach to investigating cAMP microdomains
uses computational modeling techniques (e.g. [22]). Although FRET
imaging provides invaluable evidence on the location and relative
changes in second messenger concentrations in living cells, the
absolute cAMP concentration must be inferred using an additional,
experimental FRET calibration. In addition, cells contain a diverse
and complex signaling network with many molecules that may
influence cAMP microdomains. Computational simulations that are
constrained by experimental data play a distinctive role through
evaluating the robustness of a hypothesis, explicating hidden
assumptions in a conceptual model, or testing causal relationships
and hypotheses. The small size of microdomains implies that there
are only a few molecules reacting and diffusing, and requires
stochastic algorithms for accurate simulation of reactions and
diffusion. Concurrently, the large numbers of molecules in a cell
requires computationally efficient stochastic algorithms.
This paper uses computational modeling to explore the molecular
mechanisms responsible for cAMP microdomains. The model is
implemented using novel, stochastic reaction-diffusion software,
NeuroRD, developed for efficient stochastic modeling of large
biochemical networks in relatively large volumes such as a neuronal
dendrite with multiple spines. This mesoscopic algorithm blends the
stochastic diffusion algorithm of Blackwell [23] with the tau-leap
stochastic reaction algorithm of Gillespie [24]. The validity of the
algorithm is demonstrated by comparison with a previously published
software [25]. The utility of the algorithm is demonstrated by
investigating the role of PDEs and PKA in producing cAMP
microdomains. The model not only simulates cAMP production,
PKA activation and compartmentalized PDE activity in a HEK293
cell, but also includes the unimolecular Epac-based FRET sensor
H30, in order to compare simulated cAMP dynamics to that
measured experimentally using H30 [16].
Materials and Methods
Model DescriptionA computational model of cAMP production and degradation is
employed to explore the generation of cAMP microdomains, which
are important for synaptic specificity. Because this set of cAMP
signaling pathways is widespread, we explore mechanisms underlying
cAMP microdomains in a HEK293 cell (Fig. 1A), for which
experimental measures of these microdomains provide model
constraints. In this model, cAMP is produced from ATP by adenylate
cyclase, which is activated by GaGTP binding. ATP is regenerated by
a first order reaction AMPRATP to prevent depletion. cAMP
activates PKA, a heterotetramer with two regulatory and two
catalytic subunits. After binding 4 molecules of cAMP, the two
catalytic subunits (PKAc) dissociate from the regulatory subunit
dimer (PKAr) and become active [26,27]. As described below, to
compare with FRET imaging data, the model also includes the Epac-
based FRET sensor H30, which binds a single cAMP molecule.
PDEs are responsible for cAMP degradation, converting it into
AMP. The prevalent PDE activity in HEK293 cells is provided by
PDE4 isozymes. In particular, PDE4B is responsible for 30% of the
total PDE4 activity and is located in the submembrane region, and
PDE4D is responsible for 60% of the PDE4 activity and is located in
the cytosol [15,16]. In addition, these PDE4 isoforms are
phosphorylated by PKA with a resulting increase in activity [28,29].
Rate constants for reactions were constrained with published
biochemical rate constants as listed in Table 1. The diffusion
constants (Table 2) were adjusted using the equation suggested by
Young et al. [30]:
D~8:34:10{8(T=(g �M1=3)) ð1Þ
where the diffusion coefficient D was in cm2?s21, T was temperature
in K, the solution viscosity g was in cP, and molecular weight M was
in g?mol21. Making the diffusion constant inversely proportional to
molecular weight was based on the assumption that the Stoke’s radius
of a molecule was approximated by the molecular weight. The
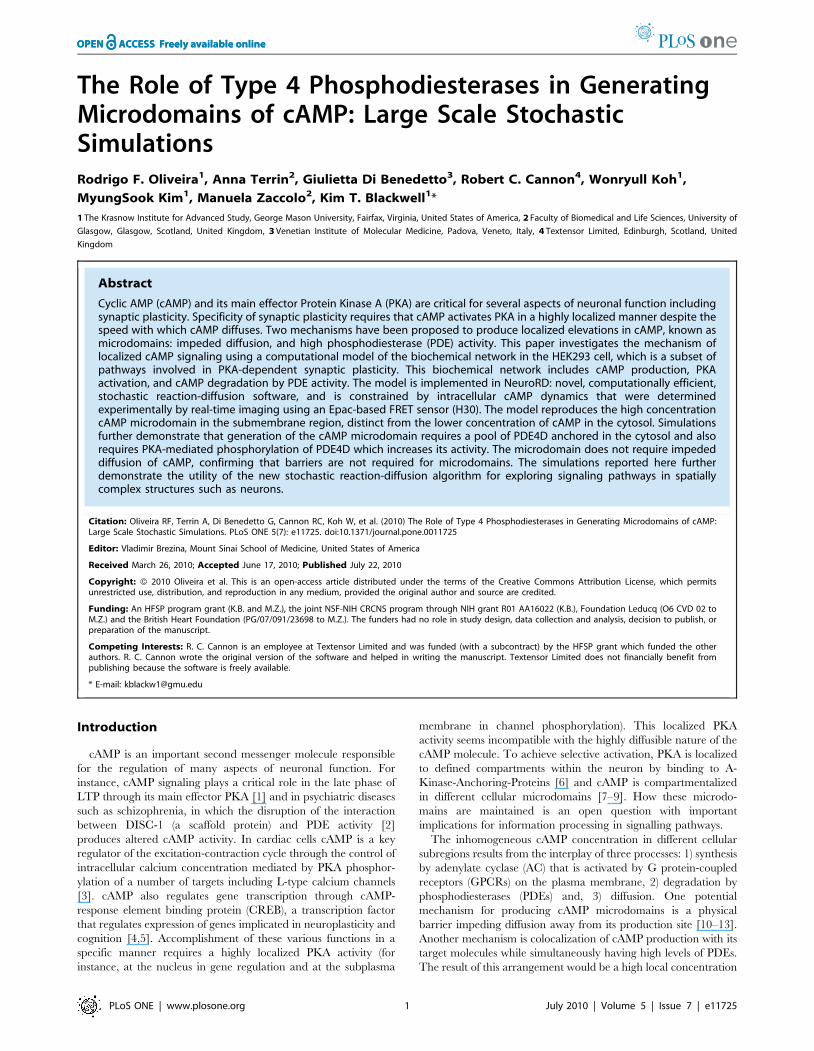
Figure 1. Schematic representation of the biochemical signal-ing pathway modeled. (A) GaGTP binds to and activates adenylatecyclase, which then produces cAMP from ATP. cAMP activates PKA, aheterotetramer with two regulatory and two catalytic subunits. Afterbinding 4 molecules of cAMP, the two catalytic subunits (PKAc)dissociate from the regulatory subunit dimer (PKAr) and become active[26,27]. cAMP is degraded by phosphodiesterase, type 4B (PDE4B) andtype 4D (PDE4D). AC, GaGTP, PKA and PDE4B are anchored at thesubmembrane while PKA and PDE4D are distributed throughout thecytosol. cAMP, ATP, AMP and PKAc freely diffuse. (B) Confocal imageshowing the localization of the membrane-targeted version of theunimolecular Epac-based sensor for cAMP (mpH30) in HEK293 cells.Confocal images were acquired 24 hours after transfection by using thebroadband confocal Leica TCS SP5 system (Leica Microsystems) and aHCX PL APO 63x1.4NA oil-immersion objective (scale bar 10 mm). Therepresentation superimposed on the micrograph corresponds to thegrid in C. (C) Schematic representation of the spatial structure of theHEK293 cell model, light gray compartments correspond to the cytosolwhile dark gray compartments correspond to the submembrane regionin a slice of the 3-dimensional cell.doi:10.1371/journal.pone.0011725.g001
Simulation of Microdomains
PLoS ONE | www.plosone.org 2 July 2010 | Volume 5 | Issue 7 | e11725
diffusion constant was calculated for all diffusible molecules included
in the model (cAMP, ATP, AMP and PKA catalytic subunit) using a
cytosolic viscosity value (1.2 cP) from Fushimi and Verkman [31].
The resulting diffusion constants agreed with available experimen-
tally measured values (Table 2).
Spatial Structure. The spatial structure used to investigate the cAMP
concentration microdomain in the HEK293 cell computational
model included 60 biochemical subvolumes with equal volumes
(0.9360.9360.5 mm) aligned in a 2-dimensional grid (4615
subvolumes, with reflective boundary conditions). This grid was a
2-dimensional slice of the 3-dimensional cell (Fig. 1B), analogous to
the slice of the cell in focus in the imaging experiments.. This
structure allowed for the inclusion of two main subregions with
distinctive cAMP concentrations: the submembrane region (set of
subvolumes located on the margins of the system) and the cytosol
(Fig. 1C, submembrane in dark grey and cytosol in light grey). AC,
GaGTP, PKA and PDE4B were anchored in the submembrane
subvolumes; the cytosolic subvolumes contained anchored PDE4D
and a smaller quantity of PKA. All subvolumes contained the
diffusible species cAMP, ATP, AMP and PKA catalytic subunit
(Fig. 1A). Simulations were repeated using smaller subvolumes (with
no change in total simulated volume) to demonstrate that the
simulation results were not dependent on subvolume size (see details
in Robustness to Parameter Variation and Fig. S5).
Since the submembrane region has a small volume, the
concentration of the submembrane anchored signaling molecules
correspond to a small number of molecules. Therefore reactions
occur stochastically (randomly) and the variability observed with
infrequent reactions cannot always be averaged out. Similarly,
diffusion of molecules to and from small volume regions also occur
probabilistically and an average description is often insufficient.
Furthermore, using a biochemical model of a spine, Bhalla et al.
demonstrate that the computational properties (i.e. bistability,
threshold) of synaptic signaling pathways that are exhibited in
deterministic systems are not necessarily maintained in stochastic
systems [32]. To account for this stochastic behavior of reactions and
diffusion, the model is implemented using the NeuroRD software to
investigate cAMP microdomains in the HEK293 cell model.
Stimulation. To simulate prostaglandin (PGE) receptor stimula-
tion (as performed in [16]) GaGTP was injected into the cell for
2 s, at a constant rate of 50 particles/ms. This simplification
(excluding details of GPCR activation and desensitization) was
used, rather than the dynamic production and degradation of
GaGTP as occurred in experiments, to limit the scope of the
model to mechanisms underlying microdomains. For simulations
with reduced PDE activity, GaGTP injection was reduced to
prevent non-physiological cAMP concentration and to avoid
FRET saturation (again consistent with experiments).
NeuroRD SoftwareNeuroRD is a novel software tool for simulating reaction diffusion
systems taking into account the stochasticity of molecular
interactions and movement. It uses a mesoscopic Monte Carlo
approach to follow populations of molecules in a tesselated space
to avoid the computational burden of simulating molecules
individually. The software merges the tau-leap algorithm of
Gillespise [24], which allows multiple reaction events at each time
step, with the diffusion algorithm of Blackwell [23], which allows
multiple diffusion events at each time step. Further efficiency is
achieved by the use of pre-computed lookup tables that store
cumulative binomial probabilities of the number of molecules
diffusing or reacting. Though approximate, it retains sufficient
accuracy to allow simulation of large and complex spatial
structures containing various interacting diffusible and non-
diffusible molecules. The specific purpose of this algorithm is to
allow simulations that lie between deterministic methods, which
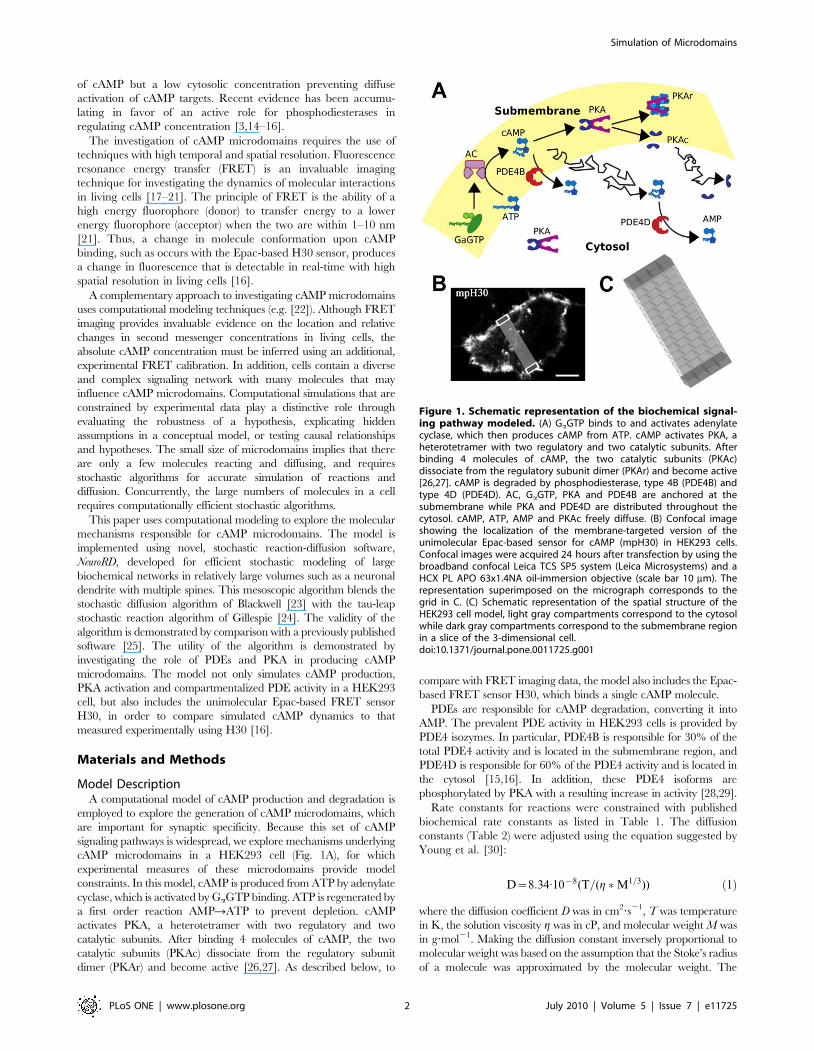
Table 1. Reactions and rate constants of HEK293 cell biochemical network.
Reaction Kf (nM21 sec21) Kb (sec21) Kcat (sec21) Reference
GaGTP+AC«E 3.8561022 10 [57]
E+ATP«EATP 1.2861024 2.6161021 Adapted from [58]
EATP«E+cAMP 28.46 2.5961024
2(cAMP)+PKA«PKAr2c2cAMP2 8.7061025 0.02 [26,27]
2(cAMP)+PKAr2c2cAMP2«PKAr2c2cAMP4 1.1561024 0.2
PKAr2c2cAMP4«PKAr2cAMP4+2(PKAc) 0.016 0.0017
cAMP+PDE4B«PDE4BcAMPRAMP+PDE4B 0.03 77.44 19.36 [59]
PKAc+PDE4B«PKAcPDE4BRpPDE4B+PKAc 3.37561024 4.0861021 4.1761021 Estimated
PKAc+PDE4BcAMP«PKAcPDE4BcAMPRpPDE4BcAMP+PKAc 3.37561024 4.0861021 4.1761021 Estimated
cAMP+pPDE4B«pPDE4BcAMPRAMP+pPDE4B 0.03 77.44 27.10 [29]
pPDE4B«PDE4B 10.8861023 Estimated
cAMP+PDE4D«PDE4DcAMPRAMP+PDE4D 0.012 58.82 14.70 [59]
PKAc+PDE4D«PKAcPDE4DRpPDE4D+PKAc 6.2561024 5.4461023 5.5661023 Estimated
PKAc+PDE4DcAMP«PKAcPDE4DcAMPRpPDE4DcAMP+PKAc 3.37561024 4.0861021 4.1761021 Estimated
cAMP+pPDE4D«pPDE4DcAMPRAMP+pPDE4D 0.024 58.82 92.58 [29,60]
pPDE4D«PDE4D 10.8861023 Estimated
H30+cAMP«H30cAMP 12.2161027 2.1761022 Constrained bydata (seeMethods)
AMPRATP 10.8561022 Estimated
doi:10.1371/journal.pone.0011725.t001
Simulation of Microdomains
PLoS ONE | www.plosone.org 3 July 2010 | Volume 5 | Issue 7 | e11725
have large volume capabilities, and microscopic simulators, such
as MCell [33] and Smoldyn [25], which simulate molecules
diffusing without tessellating space and simulate molecule
reactions based on proximity (approximate collisions). NeuroRD
is currently not able to simulate lateral diffusion in membranes, or
molecular crowding for which the more detailed simulators may
be required. NeuroRD is written in Java, so that it can be run on
most common platforms, and is freely available for download
(http://krasnow.gmu.edu/CENlab/).
The software operates as a linear processing pipeline, taking a
declarative specification of the model and simulation parameters as
the input and generating files of simulation data as the output. There
is no graphical user interface and it does not support a scripting
language. Instead, models are specified using a set of user friendly xml
files, in order to separate description of the model from description of
the simulation itself [34]. The reactions and diffusion constants are
specified in one file. The morphology is specified in a separate file, to
facilitate the investigation of the role of morphology, and to allow
different morphologies to be investigated with different signaling
pathways and vice versa. Initial conditions are specified in a third file,
to facilitate evaluating robustness of the results to molecule quantities.
Stimulation (influx of molecules to initiate reactions) and desired
output are each specified in additional files. All of these xml files are
specified in a top level xml file, which contains additional details
about the simulation itself (i.e. integration time step, random seed).
The results, in the form of the number of particles of each type in each
element at each timestep, are stored to files for processing once the
simulation has completed. Details on how to implement models using
NeuroRD are explained in the HEK293 xml files available for
download from the author’s website, and in the ‘‘readme’’ file
accompanying the software.
The first stage of processing is to tesselate the spatial structure with
cuboid elements. The model specification allows the structure to be
expressed in a manner similar to that used in MorphML [35] or
CVAPP [36] as a set of connected points, each with a 3D position and
radius. This structure is converted to the nearest equivalent set of
cuboids in either 2 or 3 dimensions. Given adjacent elements with a
contact area A between them and center-to-center distance l, the
probability, pm, of a molecule moving between them in time Dt is:
pm~D:A:Dt
V :l, ð2Þ
where D is the diffusion constant for the species in question, V is the
volume of the element from which it is diffusing.
The probability pr of a reaction event taking place between
populations A and B is:
pr~r:NA
:NB:Dt
V, ð3Þ
where NA and NB are the number of molecules of the two reactants
and r is the reaction rate. Note that the right hand side of equation
(2) is dependent only on the geometry of the spatial discretization.
It does not change during the simulation, so these quantities (and
their logarithms, for computational efficiency) can be computed
once at the start of the simulation.
Given the reaction and diffusion probabilities, each step of the
calculation involves generating the numbers of particles diffusing
across each possible boundary, the number of reactions taking
place, and updating the number of particles of each type in each
element accordingly (Fig. S1A). The reaction and diffusion steps
are done successively, so in effect they are offset by half a timestep
as in a leap-frog method, but for each of the two processes all
events are generated before any populations are updated so as to
avoid systematic errors arising from the sequence of operations.
The most time consuming part of the calculation is generating
the number of particles making a particular transition (either
reaction or diffusion), which depends on the size of the source
population, N, and the probability, p, of a single particle making
that transition (Fig. S1B). For large populations, Gaussian
(Np.20) or Poisson distributions (Np,20) are used. For smaller
populations, up to 120 particles, the number of events is generated
from a single random number by interpolation in precomputed
lookup tables [23]. Tables are computed on a logarithmic grid of
probabilities between 1028 and 0.5. For each probability, p, and
population size N, the table contains the cumulative probability, c,
of k or fewer particles making a transition:
c N,p,kð Þ~Xk
i~1
N!
N{ið Þ!i! pi 1{pð Þ N{ið Þ ð4Þ
where p is either pr for reactions or pm for diffusion. For an event for
which the probability is present in the table (which in general will not
be the case, but can be arranged, for example for a small number of
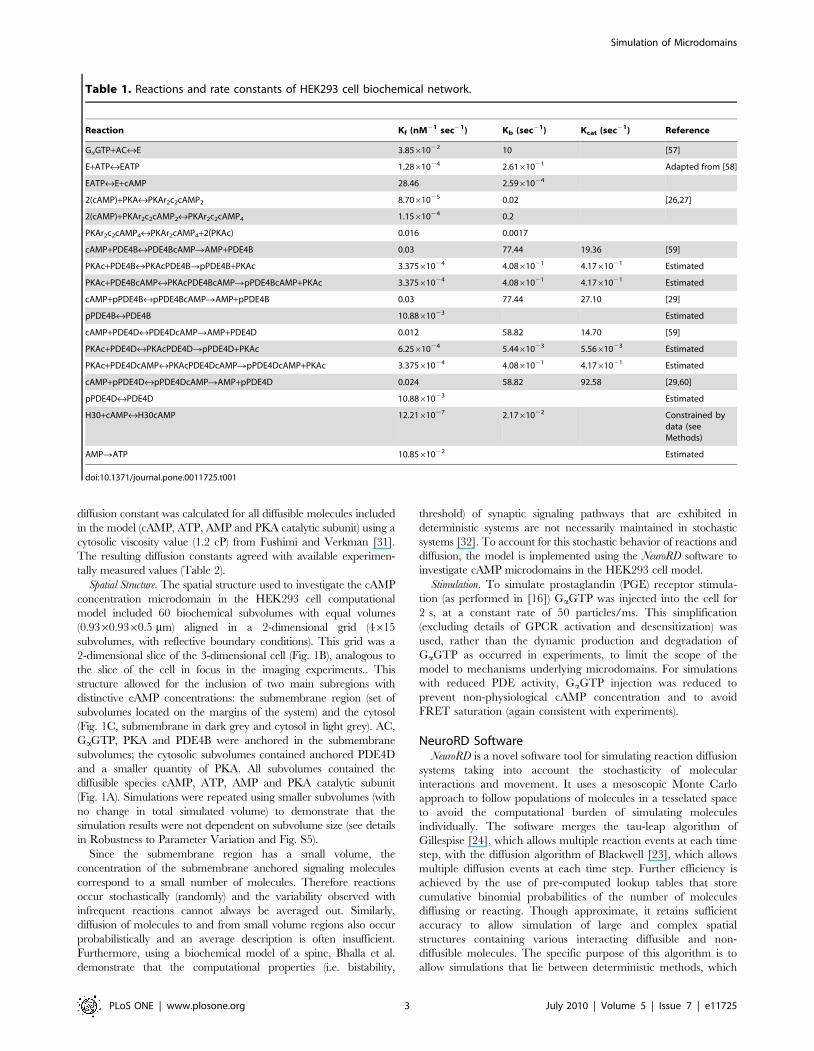
Table 2. Initial concentrations for molecules in the model.
Specie Ic (S) Ic (C) Kdiff
GaGTP 3.059 3.509 NA
AC 2.76104 0 0
E 362.8 0 0
ATP 1.9046106 1.906106 255.34/[61]: 248 mm2/s
EATP 3073 0 0
cAMP 1134 541.8 294.91/[62]: 330 mm2/s, [63]:270 mm2/s, [64]: 700 mm2/s
AMP 1074 1073 289.72
PKA 292.6 173.6 0
PKAr2c2cAMP2 1523 370.5 0
PKAr2c2cAMP4 984.3 115.6 0
PKAc 23.66 23.61 59.54
PKAr 408.6 47.59 0
PDE4B 292.2 0 0
PDE4BcAMP 101.3 0 0
pPDE4B 65.17 0 0
pPDE4BcAMP 183.7 0 0
PKAcPDE4B 4.551 0 0
PKAcPDE4BcAMP 1.691
PDE4D 0 2196 0
PDE4DcAMP 0 191.5 0
pPDE4D 0 1219 0
pPDE4DcAMP 0 108.1 0
PKAcPDE4D 0 43.84 0
PKAcPDE4DcAMP 3.755
Concentrations (in nM) for submembrane (S) and cytosolic (C) compartmentsand diffusion constants (Kdiff in mm2/s) are calculated based on molecularweight of molecular species in the HEK293 cell model (0 denotes non-diffusiblemolecule and NA denotes NOT APLICABLE). Initial concentrations reported inthis table are extracted from output of simulations without expression ofbiosensor. References in Kdiff column allow comparison between experimentallymeasured and calculated (eq. 1) diffusion constants.doi:10.1371/journal.pone.0011725.t002
Simulation of Microdomains
PLoS ONE | www.plosone.org 4 July 2010 | Volume 5 | Issue 7 | e11725
diffusing species on a regular grid where only a few different
probabilities occur), generating a corresponding number of transi-
tions involves generating a uniform random number, u, and walking
through the table to find the corresponding k such that
c N,p,kð Þƒuvc N,p,kz1ð Þ: ð5Þ
For probabilities not directly present in the table, the same
approach is used but a linear interpolation is performed between
the adjacent rows.
Once the number of diffusing particles is calculated, the
destination of the particles is determined (Fig S1C). NeuroRD
supports two strategies for determining the destination when there
are multiple possible destinations, such as different boundaries to
cross, for a given particle. It can generate the numbers of particles
taking each route independently or it can generate the total
number of particles taking any of the routes and then allocate
particles from this total to the different routes according to their
relative probabilities. The latter method is used when the number
of particles taking any route is small (less than 4 times the number
of adjacent subvolumes), to avoid generating negative numbers of
particles when the number of source particles is small.
All simulations described in this paper were performed using a
computer cluster composed of nodes with Intel(R) Xeon(R) 2.66GHz
processors (X5355, 4096 KB cache) and 8 GB (8048408 kB) of
RAM memory. The algorithm was not parallelized and each
simulation was performed on a single node independently. Unless
otherwise noted, a simulation timestep of 0.1 ms was used.
FRET sensor equationThe original experiments [16] utilize a sensor with cyan as the
donor’s wavelength and yellow as the acceptor’s wavelength.
When H30 is free, a fraction, b, of the donor’s emission is
transferred to the acceptor fluorophore, which emission is detected
in the yellow channel; the remaining fraction (12b) of the donor’s
emission is detected in the cyan channel. d and c represent overlap
of emission and excitation spectra, respectively. c represents
overlap at excitation spectra, i.e. the cyan excitation wavelength
(430 nm) partially excites the yellow fluorophore [19] (for a review
see [37]). d represents donor emission into the acceptor channel
(donor signal bleed through). Experiments report the FRET ratio,
which is volume and concentration independent and is the ratio of
cyan (acceptor’s) signal to the yellow (donor’s) signal.
In order to precisely compare simulated results with FRET
imaging data, a theoretical FRET signal was calculated from
simulated concentrations of cAMP-bound-H30 and free H30
sensor, and included a FRET efficiency term and contamination
terms due to overlap of the sensor emission and excitation spectra.
Thus, the simulated FRET ratio, R, was the same as the
experimental FRET ratio:
R~Cyan Signal=Yellow Signal, ð6Þ
with
Cyan Signal (CS)~(1{b)½H30�z½H30-cAMP�, ð7Þ
Yellow Signal (YS)~b½H30�zc(½H30�
z½H30� cAMP�)zd(cyan signal),ð8Þ
and b= 0.35, c= 0.12, d= 0.67. When H30 was bound to cAMP
there was no transfer of energy and all of the donor emission was
detected as the cyan signal. b, c, d and H30 affinity for cAMP
were obtained from experimental measurements and were
adjusted slightly to yield better agreement with experimental
calibration data (Fig. 2). R/R0 was calculated by dividing FRET
ratio, R(t), by the initial FRET ratio, R(0), measured before
stimulation was applied, as in original experiments. Simulation of
cAMP dose-FRET response curves were constructed and
compared to experiments (Fig. 2A). In addition, the time course
of simulated H30 binding to cAMP, as measured by the FRET
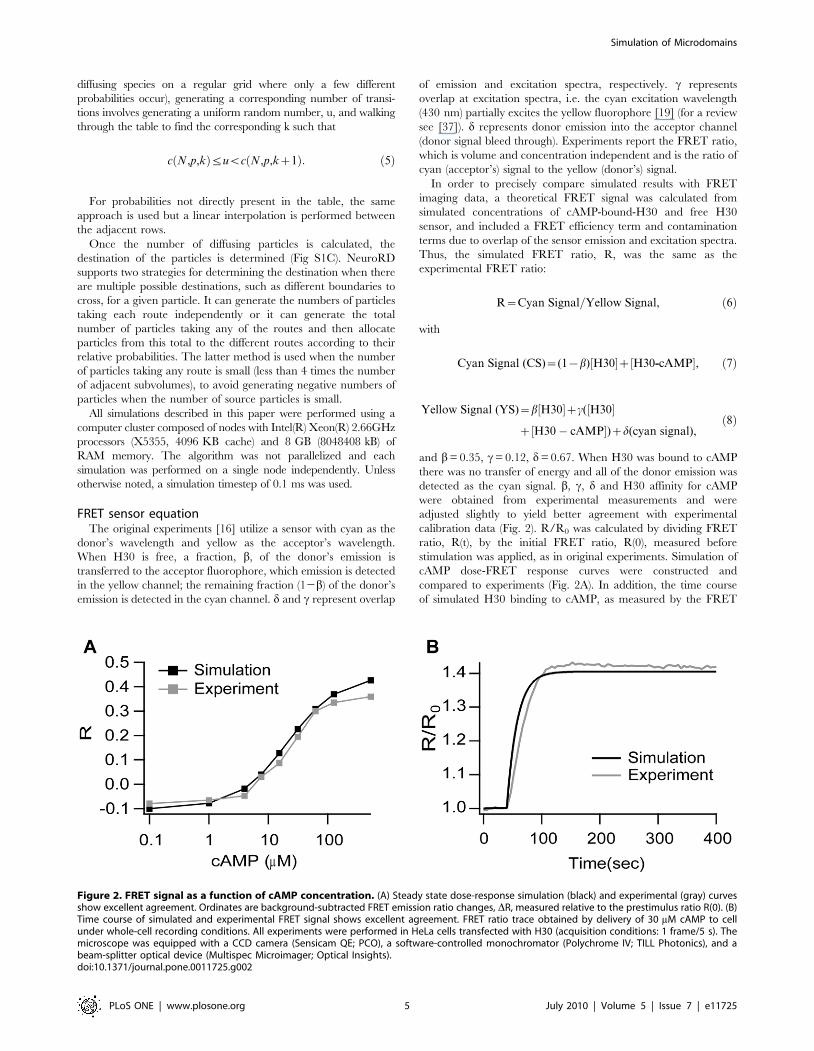
Figure 2. FRET signal as a function of cAMP concentration. (A) Steady state dose-response simulation (black) and experimental (gray) curvesshow excellent agreement. Ordinates are background-subtracted FRET emission ratio changes, DR, measured relative to the prestimulus ratio R(0). (B)Time course of simulated and experimental FRET signal shows excellent agreement. FRET ratio trace obtained by delivery of 30 mM cAMP to cellunder whole-cell recording conditions. All experiments were performed in HeLa cells transfected with H30 (acquisition conditions: 1 frame/5 s). Themicroscope was equipped with a CCD camera (Sensicam QE; PCO), a software-controlled monochromator (Polychrome IV; TILL Photonics), and abeam-splitter optical device (Multispec Microimager; Optical Insights).doi:10.1371/journal.pone.0011725.g002
Simulation of Microdomains
PLoS ONE | www.plosone.org 5 July 2010 | Volume 5 | Issue 7 | e11725
signal, also was compared to experimental results. Both FRET
calibration curves showed good agreement (Fig. 2B), providing
precise quantitative comparison with experimental results.
For each comparison of simulated FRET microdomains with
experimental results, we performed two simulations. In one
simulation H30 was included as a submembrane anchored
protein, and the FRET was calculated from submembrane
concentrations of bound and free H30 only. In the other
simulation, H30 was included as a cytosolic protein, and FRET
calculated from cytosolic concentrations. This approach was
identical to experiments, in which the FRET sensor was
expressed as a submembrane-bound molecule in one set of cell
cultures, and was expressed as a cytosolic molecule in a different
set of cell cultures. All simulations had the same number of H30
molecules: when included as a submembrane anchored protein,
concentration was 1609 nM in a submembrane volume of
3.46 mm3; when included as a cytosolic protein H30 concentra-
tion was 266 nM in a cytosolic volume of 22.48 mm3. The FRET
ratio was robust and largely independent of the concentration of
the sensor.
ExperimentsReagents. DME, Opti-MEM, FBS, L-glutamine, penicillin,
trypsin/EDTA, PBS, and LipofectAMINE 2000 were purchased
from Invitrogen. PGE1 was obtained from Sigma-Aldrich.
FuGENE-6 transfection reagent was obtained from Roche.
Cell culture and transfection. Human embryonic kidney
cells (HEK293) were grown in DME containing 10% FBS
supplemented with 2 mM L-glutamine, 100 U/ml penicillin,
and 100 mg/ml streptomycin in a humidified atmosphere
containing 5% CO2. For transient expression of the Epac-
based FRET sensor [16], cells were seeded onto 24-mm
diameter round glass coverslips, and transfections were
performed at 50–70% confluence with FuGENE-6 transfection
reagent according to the manufacturer’s instructions using 1–
2 mg DNA per coverslip. Imaging experiments were performed
24–48 h after transfection with either H30, or mH30. For
selective knockdown of PDE4B or PDE4D subfamilies, double-
stranded 21-mer RNA duplexes (Dharmacon) targeted at
regions of sequence that are unique to each of these
subfamilies were used, as described previously [15].
Selective knockdown of PDE4 subfamilies. Each siRNA
duplex was delivered into target cells via the reagent Lipofect-
AMINE 2000 (Invitrogen). Specifically, 5 ml LipofectAMINE
2000 (1 mg/ml) was diluted in 100 ml Opti-MEM, and,
separately, 125 pmol of each siRNA sample and 1 mg cAMP
sensor DNA were diluted in 100 ml Opti-MEM. 200 ml siRNA–
DNA transfection complexes were added to each well, and the
plates were incubated for 3–4 h at 37uC (5% CO2). These
complexes were then removed and replaced with DME. Imaging
experiments were performed after 48 h.
FRET imaging. Cells were maintained in Hepes-buffered
Ringer-modified saline containing 125 mM NaCl, 5 mM KCl,
1 mM Na3PO4, 1 mM MgS04, 5.5 mM glucose, 1 mM CaCl2,
and 20 mM Hepes, pH 7.5, at room temperature (20–22uC) and
imaged on an inverted microscope (IX50; Olympus) with a 606NA 1.4 oil immersion objective (Olympus). Images were acquired
using custom-made software and processed using ImageJ (National
Institutes of Health). FRET changes were measured as changes in
the background- subtracted 480/545-nm fluorescence emission
intensities on excitation at 430 nm and expressed as either R/R0,
where R is the ratio at time t and R0 is the ratio at time = 0 s, or
DR/R0, where DR = R2R0.
Results
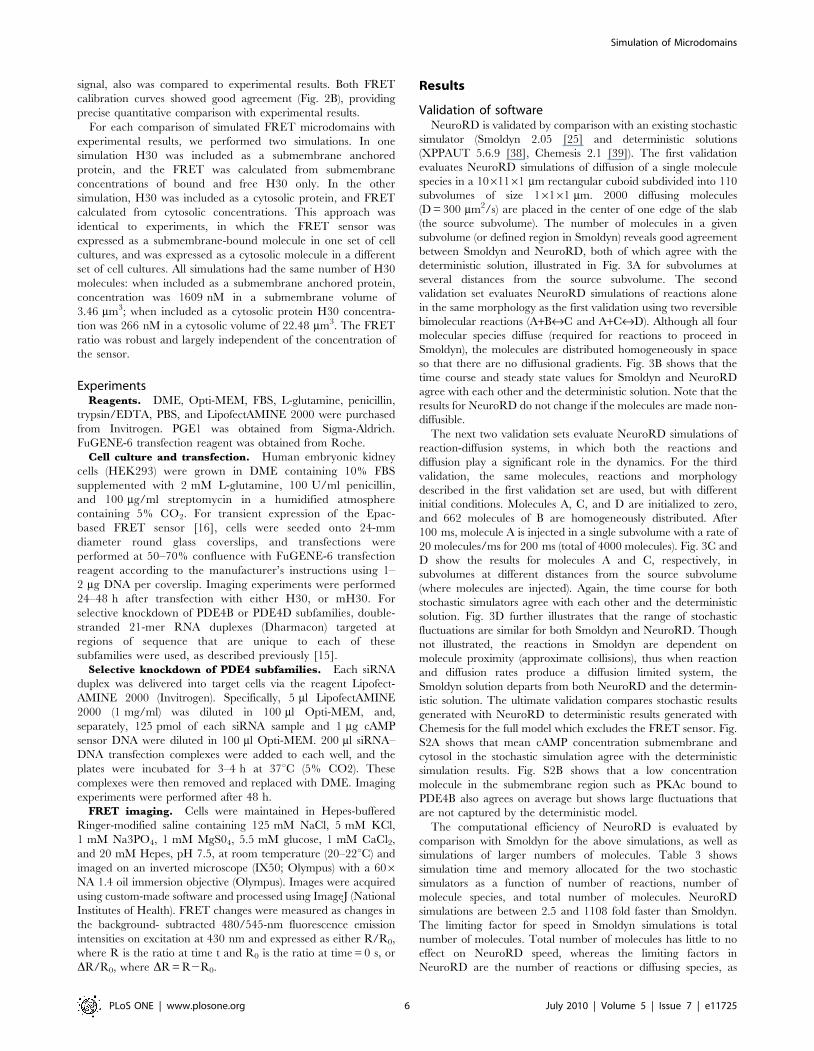
Validation of softwareNeuroRD is validated by comparison with an existing stochastic
simulator (Smoldyn 2.05 [25] and deterministic solutions
(XPPAUT 5.6.9 [38], Chemesis 2.1 [39]). The first validation
evaluates NeuroRD simulations of diffusion of a single molecule
species in a 1061161 mm rectangular cuboid subdivided into 110
subvolumes of size 16161 mm. 2000 diffusing molecules
(D = 300 mm2/s) are placed in the center of one edge of the slab
(the source subvolume). The number of molecules in a given
subvolume (or defined region in Smoldyn) reveals good agreement
between Smoldyn and NeuroRD, both of which agree with the
deterministic solution, illustrated in Fig. 3A for subvolumes at
several distances from the source subvolume. The second
validation set evaluates NeuroRD simulations of reactions alone
in the same morphology as the first validation using two reversible
bimolecular reactions (A+B«C and A+C«D). Although all four
molecular species diffuse (required for reactions to proceed in
Smoldyn), the molecules are distributed homogeneously in space
so that there are no diffusional gradients. Fig. 3B shows that the
time course and steady state values for Smoldyn and NeuroRD
agree with each other and the deterministic solution. Note that the
results for NeuroRD do not change if the molecules are made non-
diffusible.
The next two validation sets evaluate NeuroRD simulations of
reaction-diffusion systems, in which both the reactions and
diffusion play a significant role in the dynamics. For the third
validation, the same molecules, reactions and morphology
described in the first validation set are used, but with different
initial conditions. Molecules A, C, and D are initialized to zero,
and 662 molecules of B are homogeneously distributed. After
100 ms, molecule A is injected in a single subvolume with a rate of
20 molecules/ms for 200 ms (total of 4000 molecules). Fig. 3C and
D show the results for molecules A and C, respectively, in
subvolumes at different distances from the source subvolume
(where molecules are injected). Again, the time course for both
stochastic simulators agree with each other and the deterministic
solution. Fig. 3D further illustrates that the range of stochastic
fluctuations are similar for both Smoldyn and NeuroRD. Though
not illustrated, the reactions in Smoldyn are dependent on
molecule proximity (approximate collisions), thus when reaction
and diffusion rates produce a diffusion limited system, the
Smoldyn solution departs from both NeuroRD and the determin-
istic solution. The ultimate validation compares stochastic results
generated with NeuroRD to deterministic results generated with
Chemesis for the full model which excludes the FRET sensor. Fig.
S2A shows that mean cAMP concentration submembrane and
cytosol in the stochastic simulation agree with the deterministic
simulation results. Fig. S2B shows that a low concentration
molecule in the submembrane region such as PKAc bound to
PDE4B also agrees on average but shows large fluctuations that
are not captured by the deterministic model.
The computational efficiency of NeuroRD is evaluated by
comparison with Smoldyn for the above simulations, as well as
simulations of larger numbers of molecules. Table 3 shows
simulation time and memory allocated for the two stochastic
simulators as a function of number of reactions, number of
molecule species, and total number of molecules. NeuroRD
simulations are between 2.5 and 1108 fold faster than Smoldyn.
The limiting factor for speed in Smoldyn simulations is total
number of molecules. Total number of molecules has little to no
effect on NeuroRD speed, whereas the limiting factors in
NeuroRD are the number of reactions or diffusing species, as
Simulation of Microdomains
PLoS ONE | www.plosone.org 6 July 2010 | Volume 5 | Issue 7 | e11725
well as the number of subvolumes. As described in the robustness
section, simulation time of NeuroRD scales approximately linearly
with number of subvolumes (Table 4).
Simulations demonstrates that cAMP microdomains arenot due to physical barriers
Recent experimental data collected using an Epac-based FRET
sensor (H30) shows a distinctive submembrane cAMP micro-
domain in HEK293 cells due to differential PDE activity and
location [16]; however, others suggest that this microdomain is the
result of impeded cAMP diffusion [10–13]. The two most
prominent PDE4 sub-families found in HEK293 cells are PDE4B,
which is anchored at the submembrane, and PDE4D, which is
found in the cytosol [16]. To test the role of compartmentalized
PDE4s as opposed to impeded cAMP diffusion in producing
microdomains, a computational model of cAMP production, PKA
activation and compartmentalized PDE activity is developed using
the NeuroRD software.
In order to ensure rigorous quantitative comparison between
experimental and modeling results, simulations replicate the
original experimental protocols [16] and include cAMP binding
to the FRET sensor. Thus, the submembrane cAMP microdomain
is calculated from a simulation in which the Epac-based H30
(which binds a single molecule of cAMP) is included as a
submembrane-anchored protein (analogous to measuring sub-
membrane cAMP from cell cultures in which the membrane-
bound H30 is expressed). The cytosolic cAMP concentration is
calculated from a simulation in which H30 is included as a
cytosolic protein (analogous to measuring cytosolic cAMP from
cell cultures in which the cytoplasmic H30 is expressed). The
simulated FRET is calculated from concentrations of free H30 and
cAMP-bound-H30 and includes contamination terms constrained
by experimental measurements (Eq. 7 and 8). Fig. 2 shows good
agreement between simulated and experimental FRET calibration
data, both in dose-response and time course regimes, in this case
where the experimental cAMP concentration is controlled by
loading the HEK cell with a known amount of cAMP from a patch
pipette. This agreement in the simulated and experimental FRET
signal suggests that the model simulations will correctly predict
cAMP spatio-temporal dynamics underlying the experimental
FRET signal under conditions of agonist application.
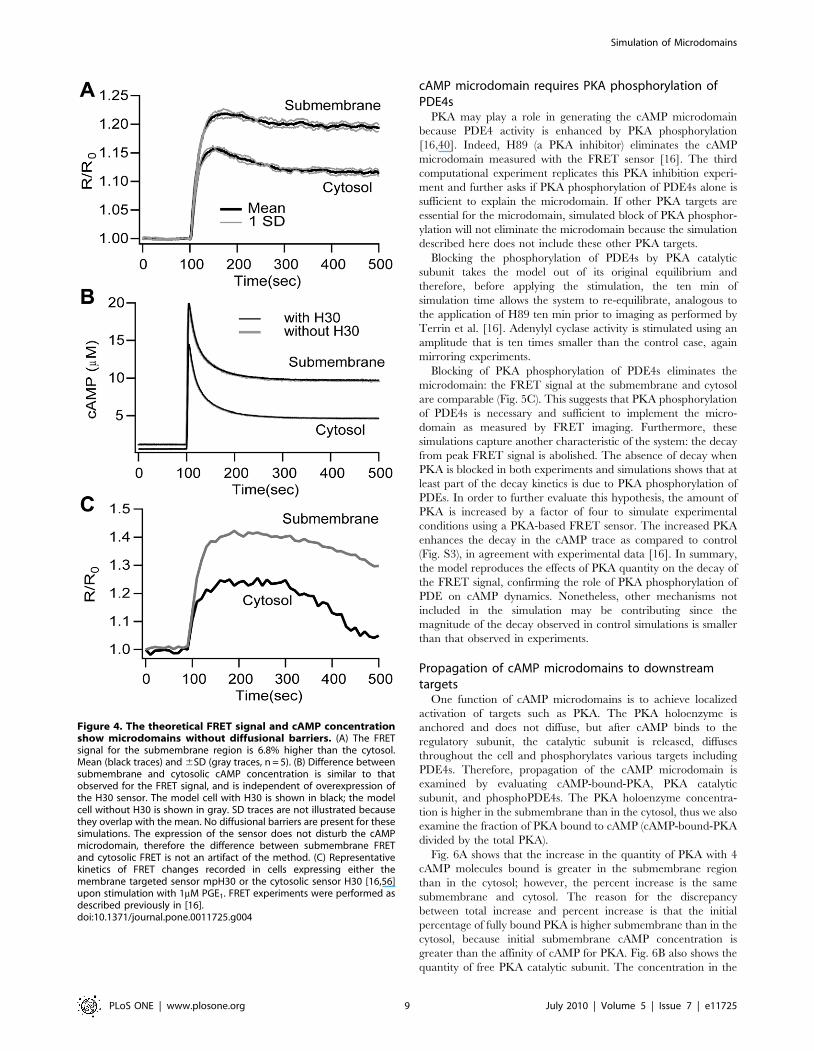
The first set of simulations evaluates whether diffusional barriers
are required for the cAMP microdomain as measured by FRET.
This first step aims at reproducing the results previously reported
[16]. Fig. 4A shows that the model successfully reproduces the
experimental FRET signal, including the difference in cAMP
concentration between submembrane and cytosolic compart-
ments. Comparison between the experimentally calculated FRET
signal (Fig. 4C) and the theoretically derived FRET signal shows
that both traces have a sharp increase (rising phase) right after
stimulation is delivered at 100 s. Likewise, FRET peak value is
reached ,100 s after stimulation has started in both experiment
and simulation. Because this simulation uses experimentally
constrained values for diffusion, this result confirms the experi-
Figure 3. Validation of NeuroRD. Simulations show good agreementbetween NeuroRD, Smoldyn [25] and deterministic solutions (XPPAUT[38] or Chemesis [39]). (A) Validation of diffusion alone. Deterministictrace generated using Chemesis; (B) Validation of reactions alone. The
deterministic trace is generated using XPPAUT; (C and D) Validation ofreaction-diffusion. The deterministic trace is generated using Chemesis.In all panels Distance refers to the Euclidean distance in micronsbetween center of source subvolume and center of other subvolumes.Panel C shows molecule ‘‘A’’ which has a relatively high concentrationand fast dynamics, whereas Panel D shows molecule ‘‘C’’, which has alow concentration and slower dynamics.doi:10.1371/journal.pone.0011725.g003
Simulation of Microdomains
PLoS ONE | www.plosone.org 7 July 2010 | Volume 5 | Issue 7 | e11725
mental result that the cAMP microdomain does not require
diffusional barriers.
The simulated cAMP traces can be regarded as a prediction of
the cAMP values for these experimental protocols because
simulations of both the cAMP and the FRET match the
experimental data for the calibration protocol. Accordingly,
Fig. 4B shows the cAMP signal underlying the FRET signal
shown in Fig. 4A. The cAMP concentration is higher in the
submembrane region compared to the cytosol as expected from
the FRET signal. Nonetheless, the fast cAMP signal dynamics do
not appear in FRET traces because the rate constant for H30
binding to cAMP is not fast enough to capture the fast transient in
the cAMP signal, which is apparent by comparing the time course
of cAMP with that of the FRET signal.
An advantage of simulations is the ability to evaluate the
cAMP microdomain in a single model cell without expression of
the FRET sensor. Thus, the second step repeated the simulation
in a model which lacked H30, to confirm that the observed
microdomain is not a result of disruption of normal cellular
signaling or unbalanced FRET sensor expression. Fig. 4B shows
that the cAMP microdomain occurs in a single cell without H30
expression. The spatio-temporal profile of cAMP concentration
for this case is further illustrated in Fig. S5B and in the Movie
S1. The difference between cAMP submembrane concentration
and cAMP cytosolic concentration is identical to the case with
the sensor. The simulation showing that H30 expression does
not affect the cAMP microdomain further reinforces the
previous results and confirms the experimentalists’ assertion
that the cAMP microdomain is not an artifact of either
H30 expression or unbalanced concentrations of the FRET
sensor.
PDE4s: molecular mechanisms responsible for cAMPmicrodomains
Although these computational experiments show that the cAMP
microdomain can be reproduced without diffusional barriers, the
identification of the exact mechanism responsible for the
compartmentalization requires additional simulations. Experi-
ments by Terrin et al. show that silencing the cytosolic PDE4D
creates a low concentration, submembrane cAMP microdomain
whereas silencing the submembrane PDE4B does not change the
cAMP microdomain [16]. To further evaluate the role of PDE
localization and subtypes, the second set of simulations replicate
the experiments by simulating selective silencing of specific PDE4s.
To approximate experiments where PDE4s were selectively
silenced, the appropriate PDE4 concentration is lowered to 10%
of its control value. In addition, the stimulation is lowered to 1.3%
of its original value for the silencing of PDE4D and to 65% of its
original value for silencing of PDE4B in order to yield comparable
cAMP peak concentrations. These lower stimulation values
approximate a compensatory down-regulation of adenylyl cyclase,
which could explain the weaker FRET signal observed exper-
imentally [16], and also prevent cAMP from reaching unphysi-
ological levels after stimulation. Because lowered PDE produces a
change in cAMP basal concentration, the simulation is re-
equilibrated before applying the stimulation, analogous to the re-
equilibration of culture cells after transfection, while waiting for
expression of siRNA.
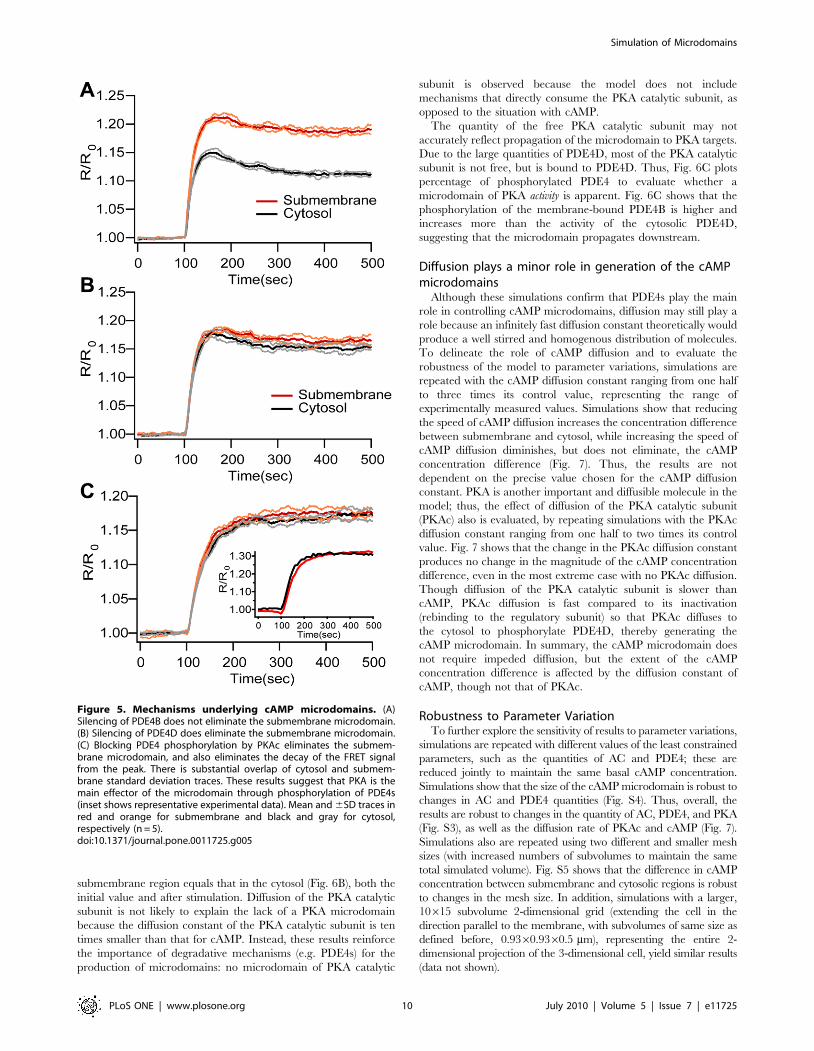
Simulation results agree with experiments in regard to
assigning distinctive roles to specific PDE subfamilies in cAMP
microdomain generation. Simulation of PDE4B silencing does
not eliminate the cAMP microdomain: simulated FRET is
higher in the submembrane region than in the cytosol (Fig. 5A).
In contrast, simulation of PDE4D silencing eliminates the
microdomain: the FRET signals in cytosol and submembrane
regions are comparable (Fig. 5B). Simulated PDE4D silencing
does not produce a low concentration, submembrane cAMP
domain (as observed experimentally), suggesting that other
mechanisms might be responsible for this particular result (see
discussion).
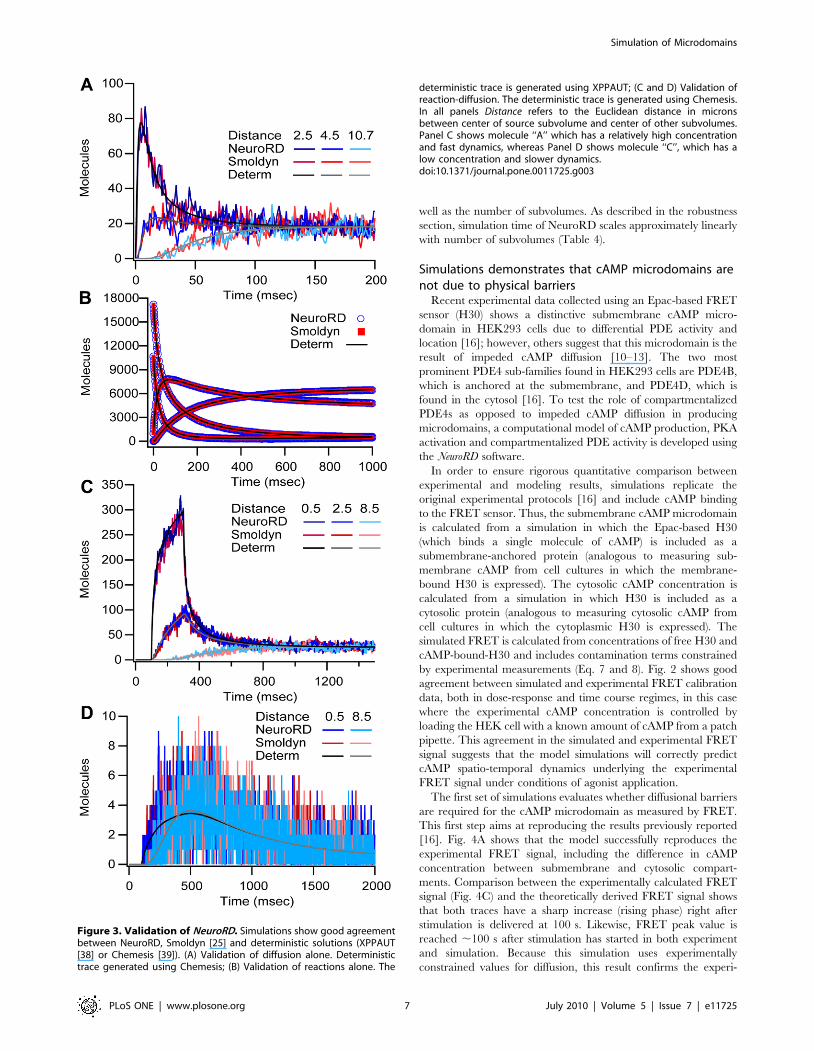
Table 3. Comparison of scalability between NeuroRD and Smoldyn.
NeuroRD Smoldyn
Simulation# initialmolecules # injected Time (h:mm:ss) Memory (kb) Time (h:mm:ss) Memory (kb)
Diffusion 0 2000 0:00:02.86 1608 0:00:07.04 2344
Reaction 28853 0 0:00:05.97 1764 0:08:03.53 26524
Reaction & Diffusion I 662 4000 0:00:04.51 1764 0:02:48.90 22168
Reaction & Diffusion II 6619 40000 0:00:07.58 1772 2:19:58.00 23760
Time and memory allocation were measured for several sets of simulations (see section Validation in the text for details). All simulations were run for 3000 msecs andthe total volume of the system was 110 mm3. The simulation Diffusion includes one molecular species and no reactions while all the remaining simulations have 4molecular species and 2 reversible bimolecular reactions. The simulation labeled Reaction starts out of biochemical equilibrium albeit the distribution of molecules inspace is homogeneous. Reaction & Diffusion (I and II), start in equilibrium but molecules are injected after 100 msecs disturbing both the homogeneous distributions ofmolecules and their biochemical equilibrium. Concentrations in simulation Reaction & Diffusion II are well within the physiological range (highest molecular species (A)concentration: ,400 nM).doi:10.1371/journal.pone.0011725.t003
Table 4. Scalability of NeuroRD as a function of mesh size(space discretization) and time step.
Time(h:mm:ss) Memory (kb)
Dt (msec) Dx (mm) # Subvolumes
0.1 0.9333 60 0:47:10.98 128744
0.05 0.451 248 5:57:06 190704
0.015 0.229 976 63:19:53 311644
The simulation of cAMP microdomains produced by PKA activation of PDE4s(without H30, as plotted in Figure S5) was run with different mesh sizes andtimesteps. The simulation time and amount of memory allocated shows thatNeuroRD scales approximately linearly with number of subvolumes, andnumber of timesteps.doi:10.1371/journal.pone.0011725.t004
Simulation of Microdomains
PLoS ONE | www.plosone.org 8 July 2010 | Volume 5 | Issue 7 | e11725
cAMP microdomain requires PKA phosphorylation ofPDE4s
PKA may play a role in generating the cAMP microdomain
because PDE4 activity is enhanced by PKA phosphorylation
[16,40]. Indeed, H89 (a PKA inhibitor) eliminates the cAMP
microdomain measured with the FRET sensor [16]. The third
computational experiment replicates this PKA inhibition experi-
ment and further asks if PKA phosphorylation of PDE4s alone is
sufficient to explain the microdomain. If other PKA targets are
essential for the microdomain, simulated block of PKA phosphor-
ylation will not eliminate the microdomain because the simulation
described here does not include these other PKA targets.
Blocking the phosphorylation of PDE4s by PKA catalytic
subunit takes the model out of its original equilibrium and
therefore, before applying the stimulation, the ten min of
simulation time allows the system to re-equilibrate, analogous to
the application of H89 ten min prior to imaging as performed by
Terrin et al. [16]. Adenylyl cyclase activity is stimulated using an
amplitude that is ten times smaller than the control case, again
mirroring experiments.
Blocking of PKA phosphorylation of PDE4s eliminates the
microdomain: the FRET signal at the submembrane and cytosol
are comparable (Fig. 5C). This suggests that PKA phosphorylation
of PDE4s is necessary and sufficient to implement the micro-
domain as measured by FRET imaging. Furthermore, these
simulations capture another characteristic of the system: the decay
from peak FRET signal is abolished. The absence of decay when
PKA is blocked in both experiments and simulations shows that at
least part of the decay kinetics is due to PKA phosphorylation of
PDEs. In order to further evaluate this hypothesis, the amount of
PKA is increased by a factor of four to simulate experimental
conditions using a PKA-based FRET sensor. The increased PKA
enhances the decay in the cAMP trace as compared to control
(Fig. S3), in agreement with experimental data [16]. In summary,
the model reproduces the effects of PKA quantity on the decay of
the FRET signal, confirming the role of PKA phosphorylation of
PDE on cAMP dynamics. Nonetheless, other mechanisms not
included in the simulation may be contributing since the
magnitude of the decay observed in control simulations is smaller
than that observed in experiments.
Propagation of cAMP microdomains to downstreamtargets
One function of cAMP microdomains is to achieve localized
activation of targets such as PKA. The PKA holoenzyme is
anchored and does not diffuse, but after cAMP binds to the
regulatory subunit, the catalytic subunit is released, diffuses
throughout the cell and phosphorylates various targets including
PDE4s. Therefore, propagation of the cAMP microdomain is
examined by evaluating cAMP-bound-PKA, PKA catalytic
subunit, and phosphoPDE4s. The PKA holoenzyme concentra-
tion is higher in the submembrane than in the cytosol, thus we also
examine the fraction of PKA bound to cAMP (cAMP-bound-PKA
divided by the total PKA).
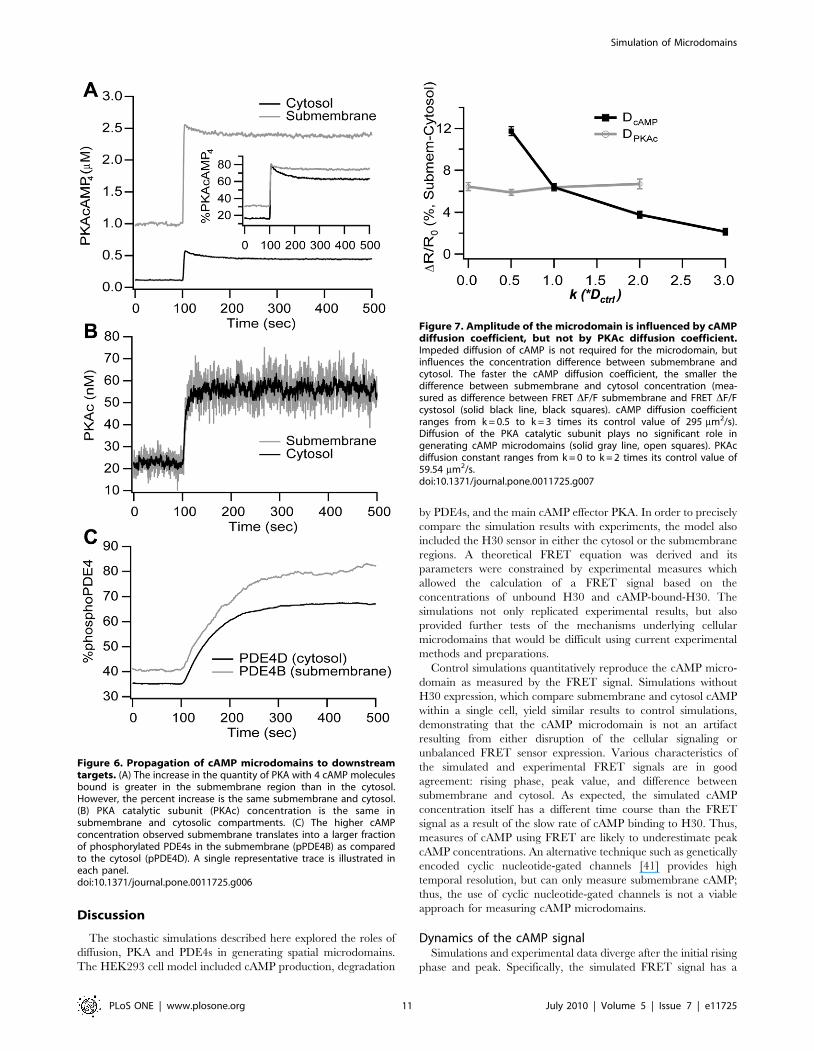
Fig. 6A shows that the increase in the quantity of PKA with 4
cAMP molecules bound is greater in the submembrane region
than in the cytosol; however, the percent increase is the same
submembrane and cytosol. The reason for the discrepancy
between total increase and percent increase is that the initial
percentage of fully bound PKA is higher submembrane than in the
cytosol, because initial submembrane cAMP concentration is
greater than the affinity of cAMP for PKA. Fig. 6B also shows the
quantity of free PKA catalytic subunit. The concentration in the
Figure 4. The theoretical FRET signal and cAMP concentrationshow microdomains without diffusional barriers. (A) The FRETsignal for the submembrane region is 6.8% higher than the cytosol.Mean (black traces) and 6SD (gray traces, n = 5). (B) Difference betweensubmembrane and cytosolic cAMP concentration is similar to thatobserved for the FRET signal, and is independent of overexpression ofthe H30 sensor. The model cell with H30 is shown in black; the modelcell without H30 is shown in gray. SD traces are not illustrated becausethey overlap with the mean. No diffusional barriers are present for thesesimulations. The expression of the sensor does not disturb the cAMPmicrodomain, therefore the difference between submembrane FRETand cytosolic FRET is not an artifact of the method. (C) Representativekinetics of FRET changes recorded in cells expressing either themembrane targeted sensor mpH30 or the cytosolic sensor H30 [16,56]upon stimulation with 1mM PGE1. FRET experiments were performed asdescribed previously in [16].doi:10.1371/journal.pone.0011725.g004
Simulation of Microdomains
PLoS ONE | www.plosone.org 9 July 2010 | Volume 5 | Issue 7 | e11725
submembrane region equals that in the cytosol (Fig. 6B), both the
initial value and after stimulation. Diffusion of the PKA catalytic
subunit is not likely to explain the lack of a PKA microdomain
because the diffusion constant of the PKA catalytic subunit is ten
times smaller than that for cAMP. Instead, these results reinforce
the importance of degradative mechanisms (e.g. PDE4s) for the
production of microdomains: no microdomain of PKA catalytic
subunit is observed because the model does not include
mechanisms that directly consume the PKA catalytic subunit, as
opposed to the situation with cAMP.
The quantity of the free PKA catalytic subunit may not
accurately reflect propagation of the microdomain to PKA targets.
Due to the large quantities of PDE4D, most of the PKA catalytic
subunit is not free, but is bound to PDE4D. Thus, Fig. 6C plots
percentage of phosphorylated PDE4 to evaluate whether a
microdomain of PKA activity is apparent. Fig. 6C shows that the
phosphorylation of the membrane-bound PDE4B is higher and
increases more than the activity of the cytosolic PDE4D,
suggesting that the microdomain propagates downstream.
Diffusion plays a minor role in generation of the cAMPmicrodomains
Although these simulations confirm that PDE4s play the main
role in controlling cAMP microdomains, diffusion may still play a
role because an infinitely fast diffusion constant theoretically would
produce a well stirred and homogenous distribution of molecules.
To delineate the role of cAMP diffusion and to evaluate the
robustness of the model to parameter variations, simulations are
repeated with the cAMP diffusion constant ranging from one half
to three times its control value, representing the range of
experimentally measured values. Simulations show that reducing
the speed of cAMP diffusion increases the concentration difference
between submembrane and cytosol, while increasing the speed of
cAMP diffusion diminishes, but does not eliminate, the cAMP
concentration difference (Fig. 7). Thus, the results are not
dependent on the precise value chosen for the cAMP diffusion
constant. PKA is another important and diffusible molecule in the
model; thus, the effect of diffusion of the PKA catalytic subunit
(PKAc) also is evaluated, by repeating simulations with the PKAc
diffusion constant ranging from one half to two times its control
value. Fig. 7 shows that the change in the PKAc diffusion constant
produces no change in the magnitude of the cAMP concentration
difference, even in the most extreme case with no PKAc diffusion.
Though diffusion of the PKA catalytic subunit is slower than
cAMP, PKAc diffusion is fast compared to its inactivation
(rebinding to the regulatory subunit) so that PKAc diffuses to
the cytosol to phosphorylate PDE4D, thereby generating the
cAMP microdomain. In summary, the cAMP microdomain does
not require impeded diffusion, but the extent of the cAMP
concentration difference is affected by the diffusion constant of
cAMP, though not that of PKAc.
Robustness to Parameter VariationTo further explore the sensitivity of results to parameter variations,
simulations are repeated with different values of the least constrained
parameters, such as the quantities of AC and PDE4; these are
reduced jointly to maintain the same basal cAMP concentration.
Simulations show that the size of the cAMP microdomain is robust to
changes in AC and PDE4 quantities (Fig. S4). Thus, overall, the
results are robust to changes in the quantity of AC, PDE4, and PKA
(Fig. S3), as well as the diffusion rate of PKAc and cAMP (Fig. 7).
Simulations also are repeated using two different and smaller mesh
sizes (with increased numbers of subvolumes to maintain the same
total simulated volume). Fig. S5 shows that the difference in cAMP
concentration between submembrane and cytosolic regions is robust
to changes in the mesh size. In addition, simulations with a larger,
10615 subvolume 2-dimensional grid (extending the cell in the
direction parallel to the membrane, with subvolumes of same size as
defined before, 0.9360.9360.5 mm), representing the entire 2-
dimensional projection of the 3-dimensional cell, yield similar results
(data not shown).
Figure 5. Mechanisms underlying cAMP microdomains. (A)Silencing of PDE4B does not eliminate the submembrane microdomain.(B) Silencing of PDE4D does eliminate the submembrane microdomain.(C) Blocking PDE4 phosphorylation by PKAc eliminates the submem-brane microdomain, and also eliminates the decay of the FRET signalfrom the peak. There is substantial overlap of cytosol and submem-brane standard deviation traces. These results suggest that PKA is themain effector of the microdomain through phosphorylation of PDE4s(inset shows representative experimental data). Mean and 6SD traces inred and orange for submembrane and black and gray for cytosol,respectively (n = 5).doi:10.1371/journal.pone.0011725.g005
Simulation of Microdomains
PLoS ONE | www.plosone.org 10 July 2010 | Volume 5 | Issue 7 | e11725
Discussion
The stochastic simulations described here explored the roles of
diffusion, PKA and PDE4s in generating spatial microdomains.
The HEK293 cell model included cAMP production, degradation
by PDE4s, and the main cAMP effector PKA. In order to precisely
compare the simulation results with experiments, the model also
included the H30 sensor in either the cytosol or the submembrane
regions. A theoretical FRET equation was derived and its
parameters were constrained by experimental measures which
allowed the calculation of a FRET signal based on the
concentrations of unbound H30 and cAMP-bound-H30. The
simulations not only replicated experimental results, but also
provided further tests of the mechanisms underlying cellular
microdomains that would be difficult using current experimental
methods and preparations.
Control simulations quantitatively reproduce the cAMP micro-
domain as measured by the FRET signal. Simulations without
H30 expression, which compare submembrane and cytosol cAMP
within a single cell, yield similar results to control simulations,
demonstrating that the cAMP microdomain is not an artifact
resulting from either disruption of the cellular signaling or
unbalanced FRET sensor expression. Various characteristics of
the simulated and experimental FRET signals are in good
agreement: rising phase, peak value, and difference between
submembrane and cytosol. As expected, the simulated cAMP
concentration itself has a different time course than the FRET
signal as a result of the slow rate of cAMP binding to H30. Thus,
measures of cAMP using FRET are likely to underestimate peak
cAMP concentrations. An alternative technique such as genetically
encoded cyclic nucleotide-gated channels [41] provides high
temporal resolution, but can only measure submembrane cAMP;
thus, the use of cyclic nucleotide-gated channels is not a viable
approach for measuring cAMP microdomains.
Dynamics of the cAMP signalSimulations and experimental data diverge after the initial rising
phase and peak. Specifically, the simulated FRET signal has a
Figure 6. Propagation of cAMP microdomains to downstreamtargets. (A) The increase in the quantity of PKA with 4 cAMP moleculesbound is greater in the submembrane region than in the cytosol.However, the percent increase is the same submembrane and cytosol.(B) PKA catalytic subunit (PKAc) concentration is the same insubmembrane and cytosolic compartments. (C) The higher cAMPconcentration observed submembrane translates into a larger fractionof phosphorylated PDE4s in the submembrane (pPDE4B) as comparedto the cytosol (pPDE4D). A single representative trace is illustrated ineach panel.doi:10.1371/journal.pone.0011725.g006
Figure 7. Amplitude of the microdomain is influenced by cAMPdiffusion coefficient, but not by PKAc diffusion coefficient.Impeded diffusion of cAMP is not required for the microdomain, butinfluences the concentration difference between submembrane andcytosol. The faster the cAMP diffusion coefficient, the smaller thedifference between submembrane and cytosol concentration (mea-sured as difference between FRET DF/F submembrane and FRET DF/Fcystosol (solid black line, black squares). cAMP diffusion coefficientranges from k = 0.5 to k = 3 times its control value of 295 mm2/s).Diffusion of the PKA catalytic subunit plays no significant role ingenerating cAMP microdomains (solid gray line, open squares). PKAcdiffusion constant ranges from k = 0 to k = 2 times its control value of59.54 mm2/s.doi:10.1371/journal.pone.0011725.g007
Simulation of Microdomains
PLoS ONE | www.plosone.org 11 July 2010 | Volume 5 | Issue 7 | e11725
modest decay (Fig. 4A) while the experimental FRET trace has a
pronounced decrease (Fig. 4C). This divergence might be
explained by different mechanisms that are beyond the scope of
this study. First, the model presented here does not explicitly
include the G protein-coupled receptor (GPCR) and its production
of active GaGTP. Rather, it approximates GPCR activation and
desensitization by injecting a quantity of GaGTP over a short
duration. Desensitization of GPCRs through either receptor
inactivation or internalization is a limiting factor in cAMP
production and is mediated by PKA, GRK and b-arrestin
[41,42,40]. Second, the model does not include degradation of
GaGTP which also may contribute to the pronounced decay
observed in the FRET signal. Third, additional PDE-independent
mechanisms related to cAMP removal [42] not included in the
model might be responsible for the temporal signature observed in
FRET experiments. Though none of these mechanisms are
included, control simulations still show moderate decay of the
FRET signal, which is abolished in simulations when PKA activity
is blocked. Thus, one of the mechanisms contributing to the decay
phase is PKA phosphorylation of PDE4s, because inhibition of
PKA activity, both simulated and in experiments, produces a
decrease in the decay of the FRET signal (Fig. 5C). The decay rate
is important because the time course of cAMP, whose decay is
controlled by PDEs, strongly influences the spatial extent of the
cAMP signal by limiting the time available for diffusion [43].
The Role of Phosphodiesterases in Producing cAMPMicrodomains
Several simulations confirm the hypothesis that PDE4D is the
main mechanism responsible for the cAMP microdomain, and
that impeded diffusion or physical barriers are not required. First,
the microdomain does not require a lowered diffusion coefficient,
but is robust to changes in diffusion constants of cAMP and PKA
catalytic subunit (Fig. 7). Second, simulated silencing of PDE4D
disrupts the cAMP microdomain, whereas simulated silencing of
4B does not. Thus, in both the simulations and experiments,
PDE4D acts as a sink, lowering cAMP concentration in the cytosol
more so than in the submembrane compartment [3,15,16].
One specific experimental result could not be replicated: while
experimental silencing of PDE4D results in a microdomain of low
cAMP concentration in the submembrane region, simulated
silencing of PDE4D abolishes the high concentration microdo-
main but does not produce a low concentration microdomain in
the submembrane region. Though the mechanisms responsible for
this particular experimental observation are yet to be fully
explained, additional simulations and theoretical considerations
suggest that the mere absence of the PDE4D degradative
mechanism from the cytosol is not sufficient to move the highest
concentration region away from its source. An active mechanism is
required to move cAMP from its submembrane site of production
to the cytosol. One potential mechanism is similar to the pumps
which maintain the potassium concentration higher inside a cell,
but this is implausible given the absence of a membrane separating
the two compartments. A more likely explanation for the lower
cAMP concentration in the submembrane region as compared to
the cytosol is that the main source of cAMP shifts from the
membrane to the cytosol. Recent experimental results suggest that,
contrary to previous assumptions, GPCRs remain active after
internalization, continuing to stimulate cAMP production in
association with internalized AC [44,45]. A relative increase in
cytosolic cyclase activity has been postulated to occur in response
to PGE1 stimulation of cardiac myocytes [46,47]. An experiment
to test this idea requires selectively blocking cyclases in the cytosol,
but not the submembrane region, combined with silencing of
PDE4D.
The importance of phosphorylation of PDE4 in the HEK293
cell extends the results of Neves et al. [22] to cells with minimal
diffusional barriers. Neves et al. [22] investigate microdomains in
neurons using a deterministic simulation (including regions
representing dendrites and soma), and demonstrate that PDE4s
contribute to cAMP microdomains that develop in dendrites, as
compared to the soma. Two different mechanisms underlie their
cAMP microdomain: (1) the surface to volume ratio, which is
higher in long thin dendrites (100 mm length by 1 mm diameter)
than in the round soma (20 mm diameter), and (2) the diffusional
barrier created by the small diameter of the dendrite. Consistent
with these two mechanisms, increasing dendritic diameter to 3 mm
eliminates the difference between soma and dendrite cAMP
concentration. In both models, an additional contribution to the
magnitude of microdomains is the speed of diffusion, though this is
more important in longer structures such as neuronal dendrites (as
opposed to HEK293 cells). Neves et al. do not explore the role of
different PDE4 subtypes, with their specific subcellular locations,
whereas the present research demonstrates that the location of two
types of PDE4s (and the regulation of their activities by PKA)
produces a gradient of cAMP orthogonal to the membrane. In
neurons, local synaptic activation, together with diffusional
barriers and degradative mechanisms, will enhance the formation
of microdomains, which are important for information processing.
Thus one prediction of this model, not explored by Neves et al., is
that PKA phosphorylation of PDE4s contributes to synaptic
specificity.
Propagation of cAMP microdomains to downstream targets is
observed in these simulations, similar to other experimental results
(e.g. [22,48]). The increase in the quantity of cAMP-bound-PKA is
greater in the submembrane region than in the cytosol. Although
the quantity of free PKA catalytic subunit does not reflect the
cAMP microdomain, the increase in phosphorylation of PDE is
greater in the submembrane region than in the cytosol.
Nonetheless, the downstream submembrane microdomain exhib-
its a smaller difference between submembrane region and cytosol,
due to the morphology of the cell and the basal cAMP
concentration. In the cytosol the basal cAMP concentration is
near the KD for PKA binding to cAMP, but in the submembrane
region the basal cAMP concentration is higher than the KD. This
implies that increments in cAMP are translated into smaller
increments of cAMP-bound-PKA in the submembrane region as
compared to the cytosol. Thus, if the basal cAMP concentration
were lower in both regions, as has been observed in other cell types
[49], the cAMP microdomains would have propagated more
strongly to downstream targets such as PDE4. The morphology of
the cell is relevant because the diffusion constant relative to the cell
size (or dendrite length) contributes to the amplitude of the
microdomain. Neves et al. finds that propagation of the dendritic
cAMP microdomain to downstream PKA and MAPK (Mitogen-
Activated Protein Kinase) is decreased when the radius of the
dendrite was increased [22].
NeuroRD: a new tool for stochastic simulations ofreaction-diffusion systems
One important aspect of our model is its implementation using
NeuroRD, the computationally efficient, stochastic (Monte Carlo)
reaction-diffusion software. The computational efficiency of the
algorithm allows for simulating a relatively large cell, such as the
HEK293 cell, subdivided into small subvolumes, in which the
small numbers of molecules implies that reaction and diffusion will
occur randomly. In the highly non-linear and complex reaction-
Simulation of Microdomains
PLoS ONE | www.plosone.org 12 July 2010 | Volume 5 | Issue 7 | e11725
diffusion systems of cells, accurate diffusion requires either tracking
individual molecules, e.g. MCell [33] or Smoldyn [25], or
subdivision into sufficiently small subvolumes. [50]. The large
numbers of molecules in a large volume makes tracking individual
molecules or exact stochastic simulation (e.g. [32,51,52]) compu-
tationally expensive, and possibly prohibitive, as demonstrated by
the comparison between Smoldyn and NeuroRD (Table 4). As the
numbers of molecules increases (without changing the total volume
and still remaining in the physiological range), the computational
advantage of NeuroRD increases.
NeuroRD has similarities and differences with the MesoRD
software [52], which uses the ‘‘spatial next’’ algorithm. It is similar
in that MesoRD subdivides space into subvolumes to avoid
tracking individual molecules. The spatial next algorithm used by
MesoRD extends the next reaction method [24] by including
diffusion to adjacent subvolume as a possible reaction event.
NeuroRD differs from MesoRD in that NeuroRD is a spatial
extension of Gillespie’s tau-leap algorithm [53], which allows
multiple reaction events at each time step, instead of a single
reaction event. Thus, NeuroRD allows multiple reaction and
diffusion events at each time step. Additional efficiency is achieved
with a table lookup for Binomial random numbers [23].
The ability of NeuroRD to implement a stochastic, large scale
simulation is revealed by the production of cAMP microdomains
in the HEK293 cell. NeuroRD is utilized to account for the
stochastic behavior of the small number of PKA catalytic subunits.
Incorporating spatial aspects of signaling pathways becomes
critical as experiments provide more information on the
importance of subcellular location of molecules. The computa-
tional efficiency of spatial, stochastic simulations with NeuroRD
makes this software ideal for simulation of neurons, which have
numerous small compartments (spines) attached to relatively large
compartments (dendrites). Imaging experiments show that micro-
domains of calcium occur in spines, and this software would be
ideal for exploring mechanisms that produce microdomains in
dendritic spines and neuronal dendrites [54,55].
Supporting Information
Figure S1 Flowchart illustrating the reaction-diffusion algorithm
used by NeuroRD. (A) At each timestep, the number of diffusing
molecules is calculated first, then the number of molecules in each
subvolume is updated, then the number of reaction events is
calculated, and last the number of molecules in each subvolume is
updated again. (B) Algorithm used to choose the number of
molecules either reacting or diffusing: small populations (,120)
use lookup tables while larger population use Poisson tables (if
Np,20) or the Gaussian distribution (if Np.20). (C) Algorithm
used to choose the destination of diffusing molecules among
neighboring subvolumes: If the number of diffusing molecules, k, is
smaller than 4 times the number of neighboring subvolumes, then
the destination subvolume of each particle is determined randomly
(independently). Otherwise, the number of particles, m, diffusing
to a subvolume is calculated from the binomial distribution, where
the probability of diffusing to a particular subvolume, pc, is the
ratio of pm (calculated from Eqn 2) for that subvolume to the total
of pm for all adjacent subvolumes.
Found at: doi:10.1371/journal.pone.0011725.s001 (1.57 MB EPS)
Figure S2 Comparison of HEK293 cell model simulated in
NeuroRD and Chemesis. (A) cAMP traces in cytosol and
submembrane regions in deterministic and stochastic simulations
overlap. (B) The average value of low concentration species, such
as PKAc-PDE4B and PKAc-PDE4B-cAMP located in the
submembrane region, show excellent agreement between deter-
ministic and stochastic simulations, but the large fluctuations in
molecule quantities are not captured by the deterministic model.
Found at: doi:10.1371/journal.pone.0011725.s002 (0.69 MB EPS)
Figure S3 Increased PKA enhances the decay in the cAMP
trace as compared to control. Comparison of cAMP traces
generated in simulations with control parameters and with PKA
quantity increased by a factor of four. Increased PKA makes the
decay steeper. PDE dephosphorylation rate is three times faster in
these simulations in order to maintain similar basal levels to
control simulations.
Found at: doi:10.1371/journal.pone.0011725.s003 (0.35 MB EPS)
Figure S4 Model is robust to decreases in quantities of AC and
PDE4s. Bar plot shows that the difference between submembrane
and cytosol cAMP concentration at basal and peak are similar for
Control and Reduced AC and PDE4s simulations. Basal values
are shown by the bars and axis on the left, and peak values shown
by the bars and axis on the right. AC and both PDE4s are scaled
by the same factor. Stimulation is adjusted in order to produced
similar peak cytosol amplitude.
Found at: doi:10.1371/journal.pone.0011725.s004 (0.10 MB EPS)
Figure S5 Model results are robust to changes in mesh size. (A)
Simulations with Dx = 0.933 mm, 0.456 mm, 0.229 mm result in
virtually equal cAMP microdomain sizes. Therefore the size of the
subvolumes does not affect the size of the cAMP concentration
difference between submembrane and cytosol compartments. (B)
Snapshots show cAMP spatial profile of the modeled system at
different points in time (fl 20 secs, * 110 secs and › 500 secs) for
the simulation with Dx = 0.933 Dmm shown in A.
Found at: doi:10.1371/journal.pone.0011725.s005 (0.35 MB EPS)
Movie S1 cAMP Spatio-temporal profile for the simulation in
Fig. S5. Movie illustrates rapid development of the high cAMP
concentration at the submembrane and the persistence of the low
concentration in the center of the cell slice modeled. There are no
concentration gradients along the membrane; all concentration
gradients are orthogonal to the membrane, justifying averaging
over these subvolumes to produce the submembrane traces.
Found at: doi:10.1371/journal.pone.0011725.s006 (0.57 MB
MPG)
Author Contributions
Conceived and designed the experiments: RFO MZ KTB. Performed the
experiments: AT GDB. Analyzed the data: RFO MK MZ KTB. Wrote the
paper: RFO RCC WK MZ KTB. Software Development: RCC.
References
1. Lee HK, Barbarosie M, Kameyama K, Bear MF, Huganir RL (2000)
Regulation of distinct AMPA receptor phosphorylation sites during bidirectional
synaptic plasticity. Nature 405: 955–959.
2. Murdoch H, Mackie S, Collins DM, Hill EV, Bolger GB, et al. (2007)
Isoform-Selective Susceptibility of DISC1/Phosphodiesterase-4 Complexes to
Dissociation by Elevated Intracellular cAMP Levels. J Neurosci 27:
9513–9524.
3. Zaccolo M (2006) Phosphodiesterases and compartmentalized cAMP signalling
in the heart. Eur J Cell Biol 85: 693–7.
4. Tardito D, Perez J, Tiraboschi E, Musazzi L, Racagni G, et al. (2006) Signaling
pathways regulating gene expression, neuroplasticity, and neurotrophic
mechanisms in the action of antidepressants: a critical overview. Pharmacol
Rev 58: 115–34.
5. Gervasi N, Hepp R, Tricoire L, Zhang J, Lambolez B, et al. (2007) Dynamics of
protein kinase A signaling at the membrane, in the cytosol, and in the nucleus of
neurons in mouse brain slices. J Neurosci 27: 2744–50.
6. Wong W, Scott JD (2004) AKAP signalling complexes: focal points in space and
time. Nat Rev Mol Cell Biol 5: 959–70.
Simulation of Microdomains
PLoS ONE | www.plosone.org 13 July 2010 | Volume 5 | Issue 7 | e11725
7. Steinberg SF, Brunton LL (2001) Compartmentation of G protein-coupled
signaling pathways in cardiac myocytes. Annu Rev Pharmacol Toxicol 41:751–73.
8. Zaccolo M, Pozzan T (2002) Discrete microdomains with high concentration of
cAMP in stimulated rat neonatal cardiac myocytes. Science 295: 1711–1715.9. Di Benedetto G, Zoccarato A, Lissandron V, Terrin A, Li X, et al. (2008)
Protein kinase A type I and type II define distinct intracellular signalingcompartments. Circ Res 103: 836–844.
10. Rich TC, Fagan KA, Tse TE, Schaack J, Cooper DM, et al. (2001) A uniform
extracellular stimulus triggers distinct cAMP signals in different compartments ofa simple cell. Proc Natl Acad Sci U S A 98: 13049–54.
11. Rich TC, Tse TE, Rohan JG, Schaack J, Karpen JW (2001) In vivo assessmentof local phosphodiesterase activity using tailored cyclic nucleotide-gated
channels as cAMP sensors. J Gen Physiol 118: 63–78.12. Martin ACL, Cooper DMF (2006) Layers of organization of cAMP
microdomains in a simple cell. Biochem Soc Trans 34: 480–3.
13. Conti M, Beavo J (2007) Biochemistry and physiology of cyclic nucleotidephosphodiesterases: essential components in cyclic nucleotide signaling. Annu
Rev Biochem 76: 481–511.14. Baillie GS, Scott JD, Houslay MD (2005) Compartmentalisation of phospho-
diesterases and protein kinase A: Opposites attract. FEBS Lett 579: 3264–3270.
15. Lynch MJ, Baillie GS, Mohamed A, Li X, Maisonneuve C, et al. (2005) RNAsilencing identifies PDE4D5 as the functionally relevant cAMP phosphodiester-
ase interacting with beta arrestin to control the protein kinase A/AKAP79-mediated switching of the beta2-adrenergic receptor to activation of ERK in
HEK293B2 cells. J Biol Chem 280: 33178–33189.16. Terrin A, Di Benedetto G, Pertegato V, Cheung Y, Baillie G, et al. (2006)
PGE(1) stimulation of HEK293 cells generates multiple contiguous domains with
different [cAMP]: role of compartmentalized phosphodiesterases. J Cell Biol175: 441–51.
17. Siegel RM, Chan FK, Zacharias DA, Swofford R, Holmes KL, et al. (2000)Measurement of molecular interactions in living cells by fluorescence resonance
energy transfer between variants of the green fluorescent protein. Sci STKE
2000: PL1.18. Lippincott-Schwartz J, Snapp E, Kenworthy A (2001) Studying protein
dynamics in living cells. Nat Rev Mol Cell Biol 2: 444–456.19. Truong K, Ikura M (2001) The use of FRET imaging microscopy to detect
protein-protein interactions and protein conformational changes in vivo. CurrOpin Struct Biol 11: 573–8.
20. Zaccolo M (2004) Use of chimeric fluorescent proteins and fluorescence
resonance energy transfer to monitor cellular responses. Circ Res 94: 866–73.21. Roy R, Hohng S, Ha T (2008) A practical guide to single-molecule FRET. Nat
Meth 5: 507–516.22. Neves SR, Tsokas P, Sarkar A, Grace EA, Rangamani P, et al. (2008) Cell shape
and negative links in regulatory motifs together control spatial information flow
in signaling networks. Cell 133: 666–80.23. Blackwell KT (2006) An efficient stochastic diffusion algorithm for modeling
second messengers in dendrites and spines. J Neurosci Methods 157: 142–53.24. Gillespie DT (2001) Approximate accelerated stochastic simulation of chemically
reacting systems. J Chem Phys 115: 1716–1733.25. Andrews SS, Bray D (2004) Stochastic simulation of chemical reactions with
spatial resolution and single molecule detail. Phys Biol 1: 137–151.
26. Zawadzki KM, Taylor SS (2004) cAMP-dependent protein kinase regulatorysubunit type IIbeta: active site mutations define an isoform-specific network for
allosteric signaling by cAMP. J Biol Chem 279: 7029–36.27. Ogreid D, Døskeland SO (1981) The kinetics of the interaction between cyclic
AMP and the regulatory moiety of protein kinase II. Evidence for interaction
between the binding sites for cyclic AMP. FEBS Lett 129: 282–6.28. Sette C, Conti M (1996) Phosphorylation and activation of a cAMP-specific
phosphodiesterase by the cAMP-dependent protein kinase. Involvement ofserine 54 in the enzyme activation. J Biol Chem 271: 16526–34.
29. MacKenzie SJ, Baillie GS, McPhee I, MacKenzie C, Seamons R, et al. (2002)
Long PDE4 cAMP specific phosphodiesterases are activated by protein kinase A-mediated phosphorylation of a single serine residue in Upstream Conserved
Region 1 (UCR1). Br J Pharmacol 136: 421–33.30. Young ME, Carroad PA, Bell RL (1980) Estimation of diffusion coefficients of
proteins. Biotechnology and Bioengineering 22: 947–955.31. Fushimi K, Verkman AS (1991) Low viscosity in the aqueous domain of cell
cytoplasm measured by picosecond polarization microfluorimetry. J Cell Biol
112: 719–25.32. Bhalla US (2004) Signaling in small subcellular volumes. II. Stochastic and
diffusion effects on synaptic network properties. Biophys J 87: 745–753.33. Kerr RA, Bartol TM, Kaminsky B, Dittrich M, Chang JJ, et al. (2008) Fast
Monte Carlo Simulation Methods for Biological Reaction-Diffusion Systems in
Solution and on Surfaces. SIAM J Sci Comput 30: 3126–3149.34. Cannon RC, Gewaltig M, Gleeson P, Bhalla US, Cornelis H, et al. (2007)
Interoperability of neuroscience modeling software: current status and futuredirections. Neuroinformatics 5: 127–138.
35. Crook S, Gleeson P, Howell F, Svitak J, Silver RA (2007) MorphML: level 1 ofthe NeuroML standards for neuronal morphology data and model specification.
Neuroinformatics 5: 96–104.
36. Cannon RC, Turner DA, Pyapali GK, Wheal HV (1998) An on-line archive of
reconstructed hippocampal neurons. J Neurosci Methods 84: 49–54.
37. Takanishi CL, Bykova EA, Cheng W, Zheng J (2006) GFP-based FRET analysis
in live cells. Brain Res 1091: 132–9.
38. Ermentrout B (2002) Simulating, Analyzing, and Animating Dynamical Systems:
A Guide To Xppaut for Researchers and Students. 1st ed. Philadelphia, PA:
Society for Industrial and Applied Mathematics. 290 p.
39. Blackwell KT (2004) Paired turbulence and light do not produce a supralinear
calcium increase in Hermissenda. J Comput Neurosci 17: 81–99.
40. Rapacciuolo A, Suvarna S, Barki-Harrington L, Luttrell LM, Cong M, et al.
(2003) Protein kinase A and G protein-coupled receptor kinase phosphorylation
mediates beta-1 adrenergic receptor endocytosis through different pathways.
J Biol Chem 278: 35403–35411.
41. Xin W, Tran TM, Richter W, Clark RB, Rich TC (2008) Roles of GRK and
PDE4 Activities in the Regulation of {beta}2 Adrenergic Signaling. J Gen
Physiol 131: 349–364.
42. Violin JD, DiPilato LM, Yildirim N, Elston TC, Zhang J, et al. (2008) Beta2-
adrenergic receptor signaling and desensitization elucidated by quantitative
modeling of real time cAMP dynamics. J Biol Chem 283: 2949–2961.
43. Lee SR, Escobedo-Lozoya Y, Szatmari EM, Yasuda R (2009) Activation of
CaMKII in single dendritic spines during long-term potentiation. Nature 458:
299–304.
44. Calebiro D, Nikolaev VO, Gagliani MC, Filippis TD, Dees C, et al. (2009)
Persistent cAMP-signals triggered by internalized G-protein-coupled receptors.
PLoS Biol 7: e1000172.
45. Ferrandon S, Feinstein TN, Castro M, Wang B, Bouley R, et al. (2009)
Sustained cyclic AMP production by parathyroid hormone receptor endocytosis.
Nat Chem Biol 5: 734–742.
46. Hayes JS, Brunton LL, Mayer SE (1980) Selective activation of particulate
cAMP-dependent protein kinase by isoproterenol and prostaglandin E1. J Biol
Chem 255: 5113–5119.
47. Bode DC, Brunton LL (1988) Post-receptor modulation of the effects of cyclic
AMP in isolated cardiac myocytes. Mol Cell Biochem 82: 13–18.
48. Saucerman JJ, Zhang J, Martin JC, Peng LX, Stenbit AE, et al. (2006) Systems
analysis of PKA-mediated phosphorylation gradients in live cardiac myocytes.
Proc Natl Acad Sci U S A 103: 12923–8.
49. Willoughby D, Cooper DMF (2008) Live-cell imaging of cAMP dynamics. Nat
Methods 5: 29–36.
50. Haberman R (1997) Elementary Applied Partial Differential Equations With
Fourier Series and Boundary Value Problems. 3rd ed. Upper Saddle River, NJ:
Prentice Hall. 736 p.
51. Bhalla US (2004) Signaling in small subcellular volumes. I. Stochastic and
diffusion effects on individual pathways. Biophys J 87: 733–744.
52. Hattne J, Fange D, Elf J (2005) Stochastic reaction-diffusion simulation with
MesoRD. Bioinformatics 21: 2923–2924.
53. Gillespie D (1977) Exact Stochastic Simulation of Coupled Chemical Reactions.
The Journal of Physical Chemistry 81: 2361, 2340.
54. Oliveira RF, Blackwell KT (2009) Role of PKA location in cortical-striatal
plasticity: Stochastic simulations in spiny dendrites. In: Society for Neuroscience,
Program No. 135.20/C30. Neuroscience Meeting Planner. Chicago, IL.
55. Kim M, Blackwell KT (2009) The sensitivity of localized PKA activity in signal
transduction pathways. In: Society for Neuroscience. Program No. 135.21/C31.
Neuroscience Meeting Planner. Chicago, IL.
56. Ponsioen B, Zhao J, Riedl J, Zwartkruis F, van der Krogt G, et al. (2004)
Detecting cAMP-induced Epac activation by fluorescence resonance energy
transfer: Epac as a novel cAMP indicator. EMBO Rep 5: 1176–80.
57. Sunahara RK, Dessauer CW, Whisnant RE, Kleuss C, Gilman AG (1997)
Interaction of Gsalpha with the cytosolic domains of mammalian adenylyl
cyclase. J Biol Chem 272: 22265–22271.
58. Dessauer CW, Gilman AG (1997) The catalytic mechanism of mammalian
adenylyl cyclase. Equilibrium binding and kinetic analysis of P-site inhibition.
J Biol Chem 272: 27787–95.
59. Herman SB, Juilfs DM, Fauman EB, Juneau P, Menetski JP (2000) Analysis of a
Mutation in Phosphodiesterase Type 4 that Alters Both Inhibitor Activity and
Nucleotide Selectivity. Mol Pharmacol 57: 991–999.
60. Conti M, Richter W, Mehats C, Livera G, Park J, et al. (2003) Cyclic AMP-
specific PDE4 phosphodiesterases as critical components of cyclic AMP
signaling. J Biol Chem 278: 5493–5496.
61. Hubley MJ, Rosanske RC, Moerland TS (1995) Diffusion coefficients of ATP
and creatine phosphate in isolated muscle: pulsed gradient 31P NMR of small
biological samples. NMR Biomed 8: 72–8.
62. Huang RC, Gillette R (1991) Kinetic analysis of cAMP-activated Na+ current in
the molluscan neuron. A diffusion-reaction model. J Gen Physiol 98: 835–848.
63. Chen C, Nakamura T, Koutalos Y (1999) Cyclic AMP Diffusion Coefficient in
Frog Olfactory Cilia. Biophys J 76: 2861–2867.
64. Nikolaev VO, Bunemann M, Hein L, Hannawacker A, Lohse MJ (2004) Novel
Single Chain cAMP Sensors for Receptor-induced Signal Propagation. J Biol
Chem 279: 37215–37218.
Simulation of Microdomains
PLoS ONE | www.plosone.org 14 July 2010 | Volume 5 | Issue 7 | e11725
Related Documents


